understanding the molecular mechanisms of aml development
TRANSCRIPT

Understanding the molecular mechanisms
of AML development and treatment using
phosphoproteomics
Denise Annette Heckmann
ORCID ID # 0000-0001-7523-0749
Submitted in total fulfillment of the requirements of the
degree of Doctor of Philosophy
February 2020
Walter and Eliza Hall Institute of Medical Research
Department of Medical Biology
University of Melbourne
i
Abstract
AML (Acute Myeloid Leukemia) is a rapidly progressing cancer of the blood and bone marrow
where the accumulation of abnormal myeloid cells crowds out healthy blood cells. Despite
the improvements in understanding the biology of AML, these advancements are not reflected
in the trajectory of the survival rate. One reason for the poor translation of research results into
novel therapies, is the genetic and epigenetic heterogeneity of the disease, which hampers the
development of reliable AML models. Mouse models of AML are designed to mimic human
disease by expressing known oncogenes in the hematopoietic system of mice. Although the
oncogene-specific disease pathology appears to reflect what is observed in human patients, the
translation of novel treatments into the clinic has often been unsuccessful.
Expression of the hematopoietic transcription factor EVI1 has been identified as a marker for
poor prognosis in human AML patients. In this thesis, I aimed to develop a mouse model, that
recapitulates a particularly aggressive and treatment-resistant form of AML by overexpressing
EVI1 together with the fusion-oncogene MLL-AF9. Although I successfully generated EVI-
expressing AMLs, the presence of the transcription factor did not affect disease features such
as latency, disease pathology, morphology and immunophenotype of leukemic cells. However,
when cultured in vitro, leukemic cells expressing EVI1 were more resistant to Smac mimetic
combination treatments and the chemotherapeutic agent Ara-C, therefore reflecting the
treatment resistance observed in human patients.
Although some targeted treatments are now available, chemotherapy remains the standard of
care therapy for AML. Therefore, to improve disease outcome, novel treatments are
ii
desperately needed. The IAPs (Inhibitor of Apoptosis Proteins) have been identified as an
attractive therapeutic target in a number of cancers including AML. Smac mimetics, a class of
drugs that specifically inhibit IAPs, have been found to selectively induce cell death in leukemic
cells when combined with an inhibitor of the MAP kinase p38 both in vivo and in vitro. To
understand the molecular mechanisms behind this synergistic killing, I studied the
phosphoproteome of treated cells using mass spectrometry and revealed that the
PI3K/Akt/mTOR survival pathway was activated following Smac mimetic treatment. Upon p38
inhibition, this survival signaling did not occur. Furthermore, CSF1R was identified as a
potential regulator of the PI3K/Akt/mTOR pathway. In support of this finding, the
combination of a Smac mimetic and CSF1R inhibitor, resulted in synergistic cell killing in vitro.
To study proteins, gene tagging provides a valuable tool for a range of applications including
real-time monitoring of target protein activities, modifications of proteins and protein-protein
interactions. The CRISPR/Cas9 technology is a powerful tool for modifying any DNA of
interest and enables the tagging of endogenous genes. However, the targeted insertion of
foreign DNA into cell lines is challenging. I aimed to generate endogenously FLAG-tagged
proteins in cell lines by targeting components of the TNF pathway using the CRISPR-Cas9
knock-in technology. Although ssDNA containing the FLAG sequence was inserted into the
genome of mouse dermal fibroblasts (MDFs) at the correct site, next generation sequencing
revealed that this process was both inefficient and error-prone and resulted in the introduction
of mutations. Nonetheless, I was able to enrich for tagged RIPK1 following FLAG pull-down,
which was detectable via both immunohistochemistry and mass spectrometry.

iii
Declaration
This is to certify that,
i. this thesis comprises only my original work toward the degree of PhD except
where indicated in the preface,
ii. due acknowledgment has been made in the text to all other material used,
iii. the thesis is fewer than 100,000 words in length exclusive of tables, maps,
bibliographies and appendices.
Denise A. Heckmann

iv
Preface
The work presented in this thesis involved a number of research collaborations as outlined
below.
Chapter 3
Flow cytometry data required for Figure 3.11 was collected with the help of Elise Clayer
(Walter and Eliza Hall Institute) while qPCR data in Figure 3.13 was obtained by Elise Clayer
(Walter and Eliza Hall Institute). I performed all other experiments and estimate my
contribution to this chapter to be 95%.
Chapter 4
The RIPK1S321A/S336A mutant BMDMs treated in Figure 4.1 were generated by Najoua Lalaoui (Walter
and Eliza Hall Institute). To generate phosphoproteomics data, phosphopeptides of treated
BMDMs were enriched with the help of Sean Humphrey (University of Sydney) following the
EasyPhos protocol, while mass spectrometry data was acquired by Laura Dagley (Walter and
Eliza Hall Institute). Connie Li Wei Suen and Alexandra Garnham (Walter and Eliza Hall
Institute) performed the statistical analysis of phosphoproteomics data. Figures 4.9 & 4.16 were
generated with the help of Narelle Keating. I estimate my contribution to this chapter to be
80%.
Chapter 5
Stephen Wilcox (Walter and Eliza Hall institute) performed the Illumina MiSeq sequencing
of the CRISPR/Cas9 knock-in MDFs. The RIPK1-FLAG pulldown samples were analysed by

v
Jarrod Sandow using MaxQuant software (version 1.5.8.3) (Cox et al., 2008) and in-house
statistic pipelines (Figure 5.5). I estimate my contribution to this chapter to be 90%.

vi
Acknowledgments
Doing a PhD was the hardest journey I have ever undertaken and would not have been possible
without the constant love and support from the people around me.
Thanks, Finn, for being my biggest supporter. Thanks for believing I’m the smartest out there,
for celebrating all the highs and carrying me through all the lows. Thanks for listening to me
practicing my talks and helping me formulating sentences for my thesis without knowing what
I’m talking about. I could write a whole thesis about how much you mean to me and how your
unconditional love and patience were invaluable for me making it to this point.
I would like to thank John Silke for accepting me into his lab and providing me with constant
guidance and advice. I greatly admire your dedication, creativity and your endless wealth of
knowledge although I often didn’t get your jokes.
To my supervisors Nij, Jarrod and Andrew, thank you believing in me even when I didn’t.
Thanks for always teaching and supporting me through the toughest times. What I learned
from you made me more than just a better PhD student but it impacted my life beyond the
lab. Thank you, Jarrod, for introducing me to the best footy club in town. And Nij, thank you
for being an amazing role model et ma superviseuse préférée even when our conversations
sometimes got lost in translation.

vii
Thank you, Sandra, for being more than just the chair of my committee but a mentor and
someone I could always rely on. Your care and constant support greatly contributed to my
persistence to finish my PhD.
The support I received outside my division was also of great importance to my success. Thank
you, Keely, Marnie and Doug for going out of your way to help and support me. You all make
WEHI a great place for students to learn and thrive. Although Doug, your set shot has been a
bit of a let-down for the WEHI Wombats.
Thanks to the WEHI Wombats and the student soccer team for making WEHI the best
institute not only in science but also in sports. Thanks for giving me the opportunity to kick
some goals when I wasn’t reaching them in the lab.
I was so fortunate to work along some great friends. Che and Maria, although it was often hard
to get work done around you, you made life in the office and lab so much fun. Joggo “8 snags”
Bernadini, thank you for being a great friend and for giving me my 5 minutes of complaining
a day. Thank you, V-dawg, for being the German voice of complaint that always made me feel
like home. Thanks Elise aka. Baguette, for always being right and for being an awesome coffee
buddy and a beautiful friend. Thanks Annette, for all the late-night conversations and for never
getting tired of listening to me. Linny, thanks for being hilarious and always surprising me.
Thanks for being so generous and kind. Dan my man, thanks for all the banter and help. I’m
pretty sure I still owe you a soy latte. Cozee, you were such a fun lab and office buddy, although
playing soccer against you was always a bit dangerous. Thanks to the rest of the Silke lab –
you’ve been amazing.

viii
Lastly, I want to thank my best friend Gigi who I was lucky enough to meet during my PhD.
Having you there in the last year gave me so much strength to persist. Thanks for your endless
care, support and love. Thanks for always finding out stuff for me and for reading my thesis.
And thanks for trusting my advice. You’ll be the most amazing PhD student.

ix
Publications
This thesis contains work that has already been published.
During my PhD, I was financially supported by the Melbourne International Research
Scholarship (2015 – 2017), Research Training Program Scholarship (2017-2019) and the Edith
Moffatt Scholarship (2019).
Najoua Lalaoui, Kay Hänggi, Gabriela Brumatti, Diep Chau, Nhu-Y.N. Nguyen, Lazaros
Vasilikos, Lisanne M. Spilgies, Denise A. Heckmann, Chunyan Ma, Margherita Ghisi, Jessica
M. Salmon, Geoffrey M. Matthews, Elisha de Valle, Donia M. Moujalled, Manoj B. Menon,
Sukhdeep Kaur Spall, Stefan P. Glaser, Jennifer Richmond, Richard B. Lock, Stephen M.
Condon, Raffi Gugasyan, Matthias Gaestel, Mark Guthridge, Ricky W. Johnstone, Lenka
Munoz, Andrew Wei, Paul G. Ekert, David L. Vaux, W. Wei-Lynn Wong, John Silke.
Targeting p38 or MK2 Enhances the Anti-Leukemic Activity of Smac-Mimetics. Cancer Cell.
2016 Feb 8;29(2):145-58. doi: 10.1016/j.ccell.2016.01.006.

x
Table of Contents
Abstract………………………………………………………………………………………………………..i
Declaration…………………………………………………………………………………………………..iii
Preface………………………………………………………………………………………………………...iv
Acknowledgments ................................................................................................................................... vi
1 Introduction ...................................................................................................................... 1
Acute Myeloid Leukaemia ...................................................................................................... 1
Mouse models of AML mimic human disease .......................................................................... 4
EVI1 overexpression is a prognostic marker for poor outcome in MLL-AMLs ............................ 6
Inhibitor of apoptosis proteins as targets in the treatment of AML .............................................. 8
Smac-mimetic killing is dependent on the TNF pathway .......................................................... 11
The mitogen-activated protein kinase p38 can prevent SM-induced cell death ............................ 15
TNF Signalling – Some outstanding questions ........................................................................ 19
CRISPR/Cas9 mediated knock-in enables the study of endogenous proteins.............................. 22
Project aims......................................................................................................................... 24
1.9.1 MLL-AF9 EVI1 mouse model ................................................................................................... 25
1.9.2 The role of p38 in inhibiting cell death in IAP-depleted cells .................................................... 25
1.9.3 Tagging endogenous proteins using CRISPR/Cas9-mediated knock-in ...................................... 26
2 Materials and Methods..................................................................................................... 27
2.1 Antibodies .......................................................................................................................... 27
2.2 Reagents ............................................................................................................................. 27
2.3 Vector preparation ............................................................................................................... 29
xi
2.4 Ligation .............................................................................................................................. 29
2.5 Transformation of Stbl4 cells ................................................................................................ 30
2.6 Miniprep of plasmid DNA and sequence confirmation............................................................ 30
2.7 Midiprep of plasmid DNA ................................................................................................... 31
2.8 Cell death assay via flow cytometry......................................................................................... 31
2.9 Cell lines and cell culture ...................................................................................................... 32
2.10 Generation of retrovirus and infection.................................................................................... 32
2.11 Generation of murine AML .................................................................................................. 33
2.12 Generation of EVI1 overexpressing murine AML ................................................................... 33
2.13 SDS PAGE and Western blotting .......................................................................................... 34
2.14 Blood analysis ..................................................................................................................... 35
2.15 Blood smear ........................................................................................................................ 35
2.16 Cytospin ............................................................................................................................. 35
2.17 AML in vitro treatments ....................................................................................................... 35
2.18 Cell surface marker analysis .................................................................................................. 36
2.19 Statistical analysis ................................................................................................................. 36
2.20 BMDM treatment protocol ................................................................................................... 37
2.21 Protein quantification via BCA assay ...................................................................................... 37
2.22 On-bead protein digest using Sera-mag speed beads ................................................................ 38
2.23 EasyPhos - Phospho enrichment using TiO2 beads .................................................................. 39
2.24 Statistics of phosphoproteomics analysis ................................................................................. 40
2.25 CSF1R inhibitor treatment of BMDMs .................................................................................. 41
2.26 Generation of CRISPR/Cas9 guides and cloning into the CRISPR nuclease vector ..................... 42

xii
2.26.1 Guide sequence and annealing .............................................................................................. 42
2.26.2 Digest and purification of lentiCRISPRv2 plasmid ................................................................ 43
2.26.3 Ligation of lentiCRISPRv2 plasmid with sgRNA guide ......................................................... 43
2.27 Generating HDR knock-in template ...................................................................................... 44
2.28 Generation CRISPR/Cas9 knock-out cell lines........................................................................ 44
2.29 CRISPR/Cas9-mediated FLAG knock-in ............................................................................... 45
2.30 Detection of FLAG insert via PCR ........................................................................................ 45
2.31 Sanger Sequencing ............................................................................................................... 47
2.32 Next Generation Sequencing................................................................................................. 47
2.33 FLAG pulldown and mass spectrometry analysis ..................................................................... 48
3 Generating a clinically relevant AML mouse model by expressing EVI1 with MLL/AF9 in vivo
50
3.1 Generation of the MLL-AF9/EVI1 mouse model ................................................................... 50
3.2 Co-expression of MLL-AF9 and EVI1 was detectable in transduced fetal liver cells in
vitro………………………………………………………………………………………………………...53
3.3 EVI1-expressing MLL-AF9 AMLs were successfully generated using multiple
approaches………………………………………………………………………………………………...54
3.4 EVI1-expressing AMLs are fully transformed and can be retransplanted to induce secondary AML
61
3.5 EVI1 overexpression in MLL-AF9 AML does not accelerate disease onset in vivo ..................... 63
3.6 EVI1 expression in MLL-AF9 AML does not aggravate pathological features ............................ 67
3.7 Morphology of AML blasts is not affected by EVI1 expression ................................................. 70
3.8 EVI expression negatively affects proliferation rates of leukemic cells in vitro ............................. 72
3.9 EVI-expressing leukemias demonstrate an unaltered immunophenotype ................................... 74

xiii
3.10 Response of EVI1-expressing AMLs to anti-cancer agent ......................................................... 77
3.11 EVI1 expression levels varied greatly in MLL-AF9/EVI AMLs ................................................. 80
3.12 Discussion........................................................................................................................... 82
4 How does the inhibition of p38 in the absence of IAPs induce cell death? ............................ 87
4.1 p38/MK2 inhibit cell death in Smac mimetic-treated cells by mechanisms other than RIPK1
phosphorylation ................................................................................................................................ 87
4.2 Elucidating the mechanism of the Smac mimetic/p38i-induced killing by studying the phospho-
proteome by mass spectrometry ......................................................................................................... 88
4.3 Phosphorylated peptides were successfully enriched following the EasyPhos protocol ................. 93
4.4 Inhibition of p38 induces phosphoproteomic changes with distinct temporal profile ................... 96
4.5 Detected proteins that were differentially phosphorylated peptides upon treatment with p38i and
Smac mimetics included known targets ............................................................................................... 98
4.6 Targeted analysis of differentially phosphorylated proteins reveals potential novel mediators of
treatment-induced cell death ............................................................................................................. 103
4.6.1 Inhibition of Apoptosis ............................................................................................................. 104
4.6.2 TNF expression pathways......................................................................................................... 108
4.6.3 Cell survival pathways ............................................................................................................... 123
4.7 Discussion.......................................................................................................................... 145
5 Tagging endogenous proteins of the TNF signaling pathway using the CRISPR/Cas9 knock-in
technology 156
5.1 Using the CRISPR/Cas9 gene editing system to endogenously FLAG-tag RIPK1 – Design of the
constructs ........................................................................................................................................ 156
5.2 Transfection of MDFs with Cas9/guide construct and HDR template ...................................... 159
5.3 Knock-in of the FLAG-tag was confirmed via PCR ................................................................. 160

xiv
5.4 RIPK1 was successfully immunoprecipitated via its FLAG-tag ................................................. 163
5.5 Next Generation Sequencing revealed the presence of multiple edited sequences ..................... 167
5.6 Sanger sequencing of clone A revealed a high HDR error rate and the presence of multiple FLAG
sequences ........................................................................................................................................ 170
5.7 Discussion.......................................................................................................................... 174
6 Conclusion and future perspectives .................................................................................. 179
6.1 AML mouse model............................................................................................................. 179
6.2 The role of p38 in inhibiting Smac mimetic-induced cell death ................................................ 182
6.3 CRISPR/Cas9-mediated knock-in to generate tagged proteins ................................................. 185
7 References ..................................................................................................................... 188

xv
Table of Figures
Figure 1.1: Normal Myelopoiesis versus Leukemogenesis in AML ........................................ 3
Figure 1.2: Generating AML in mice by expressing oncogenes in the hematopoietic system.. 6
Figure 1.3: Smac/DIABLO drives apoptosis by antagonizing cIAPs ..................................... 11
Figure 1.4: Cell death regulation by the TNFR1 signalling complex in the presence and absence
of cIAPs ................................................................................................................................ 14
Figure 1.5: The role of p38 in the inhibition of TNF-dependent SM-induced cell death ..... 18
Figure 1.6: RIPK1 is a master regulator of cell death and survival ........................................ 21
Figure 1.7: CRISPR/Cas9-mediated knock-in to generate FLAG-tagged protein .................. 24
Figure 3.1: Schematic of generating AML mouse models MLL-AF9 and MLL-AF9/EVI1 . 52
Figure 3.2: FACS of retrovirally transduced HSCs-containing fetal liver cells ....................... 54
Figure 3.3: EVI1 expression could not be detected in GFP-positive MLL-AF9 AML .......... 56
Figure 4.1: Inhibiting p38 or MK2 further increases cell death in RIPK1 phospho-dead mutant
.............................................................................................................................................. 88
Figure 4.2: Schematic of phospho enrichment and mass spectrometry ................................. 89
Figure 4.3: Treatment-induced cell death and signalling in BMDMs was confirmed ............ 92
Figure 4.4: QC of mass spectrometry data ............................................................................ 95
Figure 4.5: Inhibition of p38 induces phosphoproteomic changes with distinct temporal profile
.............................................................................................................................................. 97
Figure 4.6: Treatment-induced changes in phosphorylation of the known targets p38 and
ERK1 were identified during phosphoproteomics analysis ................................................... 98
Figure 4.7: Phosphoproteomic profiles of SMAC mimetic treatment versus its combination
with the p38 inhibitor LY after 1.5 and 3h treatment in BMDMs ....................................... 100

xvi
Figure 4.8: The pro-apoptotic protein Bim is less phosphorylated in BMDMs treated with SM
+ p38i where intrinsic apoptosis occurs ............................................................................... 107
Figure 4.9: The phosphatase CD45 is a negative regulator of TNF production and is less
phosphorylated in BMDMs treated with SM + p38i ........................................................... 112
Figure 4.10: Fyn-binding protein (FYB) is a known interactor of CD45 and is less
phosphorylated in BMDMs treated with SM + p38i ........................................................... 113
Figure 4.11: En1/VASP-like protein (EVL) is an interactor of FYB and is less phosphorylated
in BMDMs treated with SM + p38i ..................................................................................... 114
Figure 4.12: The receptor CD84 can induce TNF secretion through activating MAP kinases
and is phosphorylated in BMDMs treated with SM + p38i ................................................. 116
Figure 4.13: NFAT activation molecule 1 (NFAM1) becomes phosphorylated within its ITAM
in BMDMs treated with SM ................................................................................................ 120
Figure 4.14: Activating transcription factor 2 (ATF2) is important for TNF- production and
is phosphorylated in BMDMs treated with SM + p38i while total ATF2 levels are consistent
across all treatments ............................................................................................................ 122
Figure 4.15: CSF1R was preferentially phosphorylated upon 3 h treatment with Compound A
and p38i .............................................................................................................................. 125
Figure 4.16: The structure of the CSF1 receptor................................................................. 126
Figure 4.17: The four detected phosphoserines S711, S714, S731 and S734 are conserved
across human, mouse and rat CSF1R ................................................................................. 128
Figure 4.18: Akt is less phosphorylated at S473 in BMDMs treated with the combination of
Compound A and p38i ....................................................................................................... 129
Figure 4.19: Combination of Compound A with CSF1R inhibitor AFS-98 induces cell death
in BMDMs .......................................................................................................................... 131
xvii
Figure 4.20: The PI3K/Akt/mTor pathway can be activated by binding of CSF to its receptor
CSF1 ................................................................................................................................... 133
Figure 4.21: Phosphorylation of PRAS40 at T247 allows activation of mTORC1 .............. 135
Figure 4.22: RpS6, a downstream target of the mTOR pathway, was preferentially
phosphorylated in BMDMs treated with Compound A ...................................................... 139
Figure 4.23: The translation initiation factor eIF4B can be activated by S6K1 via
phosphorylation at Ser422 .................................................................................................. 142
Figure 4.24: Itpkb a PI3K/Akt antagonist ............................................................................ 144
Figure 4.25: Identified ITPKB phospho-peptide contains the ERK consensus motif ......... 144
Figure 4.26: The PI3K/Akt/mTor pathway is inactivated in BMDMs treated with SM + p38i
............................................................................................................................................ 155
Figure 5.1: Schematic of the CRISPR/Cas9 knock-in approach via the HDR pathway using a
ssDNA template .................................................................................................................. 158
Figure 5.2: CRISPR/Cas9 knockout of RPK1 ..................................................................... 159
Figure 5.3: CRISPR/Cas9 mediated knock-in was confirmed with PCR ............................. 161
Figure 5.4: CRISPR/Cas9 mediated knock-in was confirmed in a single cell clone ............ 163
Figure 5.5: FLAG-tagged RIPK1 can be immunoprecipitated using anti-FLAG beads ....... 166
Figure 5.6: Next Generation Sequencing revealed that various knock-in sequences were
generated ............................................................................................................................. 169
Figure 5.7: The FLAG sequence was not inserted correctly into the genome of clone A ... 173
Figure 5.8: Schematic of plasmid-based knock-in approach. ............................................... 178

xviii
List of Tables
Table 2.1 List of reagents ...................................................................................................... 27
Table 2.2: Vector digest reaction ........................................................................................... 29
Table 2.3: Ligation reaction .................................................................................................. 30
Table 2.4: Annealing reaction ............................................................................................... 42
Table 2.5: List of CRISPR/Cas9 guide RNAs used for knock-in FLAG into NTD or CTD of
target genes ............................................................................................................................ 43
Table 2.6: Digest of lentiCRISPRv2 ...................................................................................... 43
Table 2.7: Ligation of lentiCRISPRv2 ................................................................................... 43
Table 2.8: RIPK1 CTD HDR template sequence ................................................................ 44
Table 2.9: Primer sequences to detect FLAG insert ............................................................. 46
Table 2.10: PCR protocol ..................................................................................................... 47
Table 2.11: Next generation sequencing primer with unique overhangs (lowercase) ............ 47
Table 2.12: PCR for next generation sequencing .................................................................. 48
Table 3.1: Different approaches for the generation of MLL-AF9/EVI1 AMLs .................... 61
Table 4.1: Top 20 DP proteins in BMDMs treated with 1.5h SM vs 1.5h SM + p38i ........ 100
Table 4.2: Top 20 DP proteins in BMDMs treated with 3h SM vs 3h SM + p38i .............. 101
Table 4.3: Top 10 biological processes determined via gene ontology enrichment analysis of
DP proteins treatment with 1.5h SM vs 1.5h SM + p38i ..................................................... 102
Table 4.4: Top 10 biological processes determined via gene ontology enrichment analysis of
DP proteins after treatment with 3h SM vs 3h SM + p38i ................................................... 102
Table 4.5: Top 10 pathways determined via KEGG pathway analysis of DP proteins after
treatment with 1.5h SM vs 1.5h SM + p38i ......................................................................... 103

xix
Table 4.6: Top 10 pathways determined via KEGG pathway analysis of DP proteins after
treatment with 3h SM vs 3h SM + p38i ............................................................................... 103
Table 4.7: Phosphorylation status of BimEL after treatment with SM + p38i ..................... 107
Table 4.8: Phosphorylation status of CD45 after treatment with SM + p38i ....................... 111
Table 4.9: Phosphorylation status of FYB after treatment with SM + p38i ......................... 112
Table 4.10: Phosphorylation status of EVL after treatment with SM + p38i ....................... 113
Table 4.11: Phosphorylation status of CD84 after treatment with SM + p38i ..................... 115
Table 4.12: Phosphorylation status of NFAM1 after treatment with SM + p38i ................. 119
Table 4.13: Phosphorylation status of ATF2 after treatment with SM + p38i ..................... 121
Table 4.14: Differentially phosphorylated regulators of TNF production in BMDMs treated
with SM vs SM + p38i ......................................................................................................... 123
Table 4.15: Phosphorylation status of CSF1R after treatment with SM + p38i ................... 125
Table 4.16: Treatment-induced DP Proteins of the PI3K/Akt and mTOR pathways in
BMDMs .............................................................................................................................. 132
Table 4.17: Phosphorylation status of PRAS40 after treatment with SM + p38i ................. 135
Table 4.18: Phosphorylation status of rpS6 after treatment with SM + p38i ....................... 139
Table 4.19: Phosphorylation status of eIF4B after treatment with SM + p38i ..................... 142
Table 4.20: Phosphorylation status of ITPKB after treatment with SM + p38i ................... 144
Table 4.21: Phosphorylation status of regulators of the PI3K/Akt/mTOR pathway after
treatment with SM + p38i .................................................................................................... 154
Table 5.1: Frequencies of FLAG tag-containing sequences detected by NGS .................... 170
xx
Abbreviations
ACN acetonitrile
AML acute myeloid leukemia
ATF2 activating transcription factor 2
bp base pairs
Bcl-2 B cell lymphoma-2
BIR baculovirus inhibitor repeat
BMDM bone marrow derived macrophages
BSA bovine serum albumin
CARD caspase recruitment domain
CD cluster of differentiation
c-FLIP cellular FADD-like IL-1-converting enzyme inhibitory protein
cIAP cellular inhibitor of apoptosis protein
CRISPR clustered regularly interspaced short palindromic repeats
CSF1R colony stimulating factor 1 receptor
DD death domain
DMEM Dulbecco’s modified Eagles media
DMSOdimethyl sulfoxide
DNA deoxyribonucleic acid
DP differentially phosphorylated
ECL enhanced luminol-based chemiluminescent substrate
EDTA ethylenediaminetetraacetic acid
EFS event-free survival
xxi
eIF4B eukaryotic translation initiation factor 4B
ERK extracellular signal-regulated kinase
EVI1 Ecotropic virus integration site-1
FACS fluorescence-activated cell sorting
FADD Fas-associated protein with death domain
FASP filter aided samples preparation
FCS fetal calf serum
g gram
G-CSF granulocyte-macrophage colony stimulating factor
GFP green fluorescent protein
GMP granulocyte-macrophage progenitor
GO gene ontology
HCL hydrochloride
HDR homologous DNA repair
His histidin
HRP horseradish peroxidase
HSC haematopoietic stem cell
IKK inhibitor of nuclear factor-κB kinase
IL interleukin
IMDM Iscove's Modified Dulbecco's Media
ITAM immunoreceptor tyrosine-based activation motif
Itpkb inositol-Trisphosphate 3-Kinase B
ITSM immunoreceptor tyrosine-based switch motif
i.v. intravenous

xxii
JNK janus kinase
KEGG Kyoto Encyclopedia of Genes and Genomes
LPS liposaccharide
LSK lineage negative SCA-1+ cKit+ cells
LUBAC linear ubiquitin chain assembly complex
MAPK mitogen-activated protein kinase
MDF mouse dermal fibroblast
MK2 MAPK-activated protein kinase 2
MLKL mixed lineage kinase-like domain protein
MLL mixed lineage leukemia
Mg milligram
g microgram
M micromolar
mL millilitre
mM millimolar
mRNA messenger ribonucleic acid
mTOR mammalian target of rapamycin
nM nanomolar
NFAM1 NFAT activating protein with ITAM motif 1
NF-kB nuclear factor-κB
Ni-NTA Nickel-charged nitrilotriacetic acid
NK natural killer
PBS phosphate buffered saline
xxiii
PCR polymerase chain reaction
PI propidium iodide
PI3K phosphoinositide 3-kinase
PRAS40 proline-rich Akt1 substrate 1
PTPRC protein tyrosine phosphatase receptor type C
RIPK1 receptor interacting protein kinase-1
rpm revolution per minute
Rps6 ribosomal protein S6
RT room temperature
SCF stem cell factor
SDS-PAGE sodium dodecyl sulphate polyacrylamide gel electrophoresis
SEM standard error of the mean
sgRNA single guide ribonucleic acid
shRNA short hairpin ribonucleic acid
SM second mitochondria-derived activator of caspases mimetic
ssDNA single stranded deoxyribonucleic acid
TAK1 TGF- activated kinase
TCEP tris(2-carboxyethyl)phosphine
TFA trifluoroacetic acid
TNF tumour necrosis factor
TNFR1 TNF receptor 1
TRAF2 TNF receptor-associated protein 2
wt wild-type
1
1 Introduction
Acute Myeloid Leukaemia
Acute myeloid leukaemia (AML) is a cancer of the myeloid line of blood cells and is
characterized by the rapid growth of abnormal hematopoietic progenitor cells in the bone
marrow. Due to the formation of leukemic blasts in the bone marrow, the production of
normal blood cells is disturbed leading to anaemia, neutropenia and thrombocytopenia (De
Kouchkovsky et al., 2016). AML is the most common myeloid leukaemia and the most
common acute leukaemia in adults. Overall, AML accounts for approximately 0.8% of all
cancers (Leukaemia Foundation). With the five-year survival rate only being approximately
24.5% (Cancer Australia), the disease is responsible for about 2% of cancer deaths worldwide
(National Cancer Institute). AML is a clinically, morphologically, immunophenotypically and
genetically heterogeneous cancer and the prognosis for individual patients can range from low
to high risk (Dohner et al., 2008; Estey et al., 2006). The disease outcome is associated with
the nature of its genetic and karyotypic abnormalities as well as gene expression patterns and
DNA methylation signatures (Dohner et al., 2008).
The genetic complexity of AML greatly hampers the successful translation of research into
clinical practice. In AML, more than 100 somatic genetic aberrations that can contribute to
leukemogenesis are known to date, while patients can harbor a number of mutations (Shima
et al., 2011). An individual AML can even be composed of subclones with distinguishable
mutational signatures, making each AML patient genetically unique (David Grimwade et al.,
2016). Genetic translocation that generate in-frame chimeric fusion genes often involving
hematopoietic transcription factors, epigenetic regulators as well as components of the nuclear

2
pore complex, are recurrently associated with the development of AML (Speck et al., 2002;
Suela et al., 2007). Generated chimeric transcription factors alter the expression of genes
critical for hematopoietic development as well as differentiation (Estey et al., 2006). As a
consequence, hematopoietic differentiation can be blocked and cells can acquire self-renewal
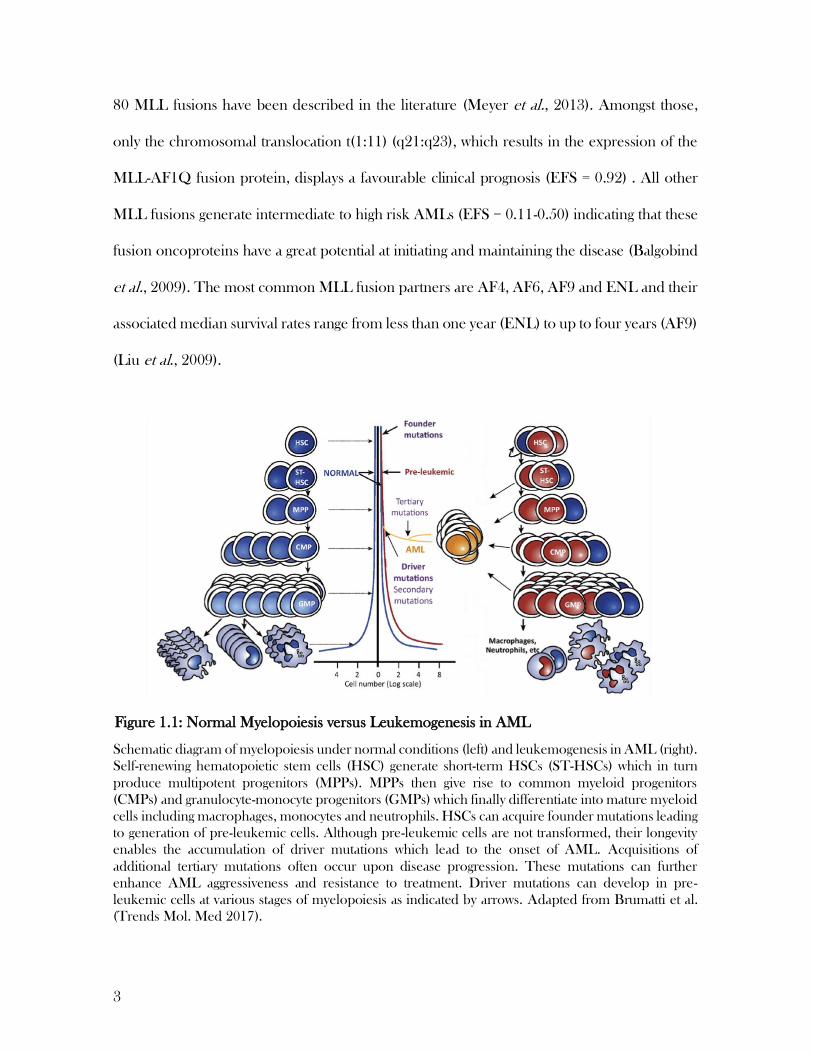
capacities (Suela et al., 2007). One theory about the development of AML that was widely
accepted for many years, is the “two-hit hypothesis” that suggests that malignant transformation
requires the co-occurrence of two mutations – a founder mutation and a driver mutation – in
the same myeloid precursor (Kelly et al., 2002) (Figure 1.1). Preleukemic founder mutations
(e.g. DNMT3, IDH1 and TET2) in hematopoietic stem or progenitor cells confer advantages
in self-renewal and proliferation. Since these mutations persist and lead to clonal expansion,
additional driver mutations in genes involved in cellular differentiation and survival like FLT3,
N-RAS and K-RAS, can accumulate in a pre-leukemic cell (Kelly et al., 2002) leading to the
onset of AML.
A class of fusion oncogenes that constitute a founder mutation and that are often associated
with poor prognosis in AML patients, involve the Mixed-lineage-leukaemia gene (MLL), which
is located on chromosome 11q23. MLL-rearrangements are found in the majority of infant
AMLs and about 10% of adult de novo and 33% of therapy-related AMLs (H. Liu et al., 2009).
The MLL gene encodes a DNA- binding protein that methylates histone H3 lysine 4 (H3K4),
and positively regulates gene expression including multiple homeobox (Hox) genes.
Dysregulation of Hox genes contribute to leukemogenesis by supporting the immortalization
of cells (Alharbi et al., 2013). Leukemogenic MLL translocations encode MLL fusion proteins
that have lost H3K4 methyltransferase activity leading to sustained transcriptional activation of
target genes such as Meis1 and Hoxa9 (Zeisig et al., 2004; Zeisig et al., 2003). To date, about
3
80 MLL fusions have been described in the literature (Meyer et al., 2013). Amongst those,
only the chromosomal translocation t(1:11) (q21:q23), which results in the expression of the
MLL-AF1Q fusion protein, displays a favourable clinical prognosis (EFS = 0.92) . All other
MLL fusions generate intermediate to high risk AMLs (EFS = 0.11-0.50) indicating that these
fusion oncoproteins have a great potential at initiating and maintaining the disease (Balgobind
et al., 2009). The most common MLL fusion partners are AF4, AF6, AF9 and ENL and their
associated median survival rates range from less than one year (ENL) to up to four years (AF9)
(Liu et al., 2009).
Schematic diagram of myelopoiesis under normal conditions (left) and leukemogenesis in AML (right).
Self-renewing hematopoietic stem cells (HSC) generate short-term HSCs (ST-HSCs) which in turn
produce multipotent progenitors (MPPs). MPPs then give rise to common myeloid progenitors
(CMPs) and granulocyte-monocyte progenitors (GMPs) which finally differentiate into mature myeloid
cells including macrophages, monocytes and neutrophils. HSCs can acquire founder mutations leading
to generation of pre-leukemic cells. Although pre-leukemic cells are not transformed, their longevity
enables the accumulation of driver mutations which lead to the onset of AML. Acquisitions of
additional tertiary mutations often occur upon disease progression. These mutations can further
enhance AML aggressiveness and resistance to treatment. Driver mutations can develop in pre-
leukemic cells at various stages of myelopoiesis as indicated by arrows. Adapted from Brumatti et al.
(Trends Mol. Med 2017).
Figure 1.1: Normal Myelopoiesis versus Leukemogenesis in AML
4
Mouse models of AML mimic human disease
In order to study disease biology and to develop novel treatments, researchers heavily rely on
disease models. Since these models often involve the use of animals, one of the major
challenges is to reliably mimic human disease features including disease development,
pathology and response to therapy, in animals. Although AML models developed to date
partially complement each other, none of the currently available approaches faithfully
recapitulate human disease. Consequently, therapeutic progress in AML has been slow, as
advancement in research only poorly translated into the clinics (Estey, 2015). Nevertheless,
technological improvements in the fields of next generation sequencing and bioengineering
continuously promote the development of better disease models.
Genetically altered mouse models enable the study of treatment response in a physiological
environment and thereby provide a means to dissect the relationship between complex disease
genetics and therapy response in a way that is not possible in humans (Zuber et al., 2009).
Mouse models that are currently frequently used, can be placed into one of the following four
categories: (1) Spontaneous AML development induced by exposure to carcinogens including
chemicals (e.g. 3-methylcholantrene), biologicals (e.g. murine leukemia virus) or radiation, (2)
conventional transgenic approach by DNA insertion into the genome via pronuclear
microinjection or electroporation, (3) xenotransplantation of leukemic cells or in vitro
modified HSPCs into immunocompromised mice or (4) adaptive transfer method of in vitro
modified HSPCs using retroviral transduction with an oncogene followed by tail vein injection
into irradiated recipients.
5
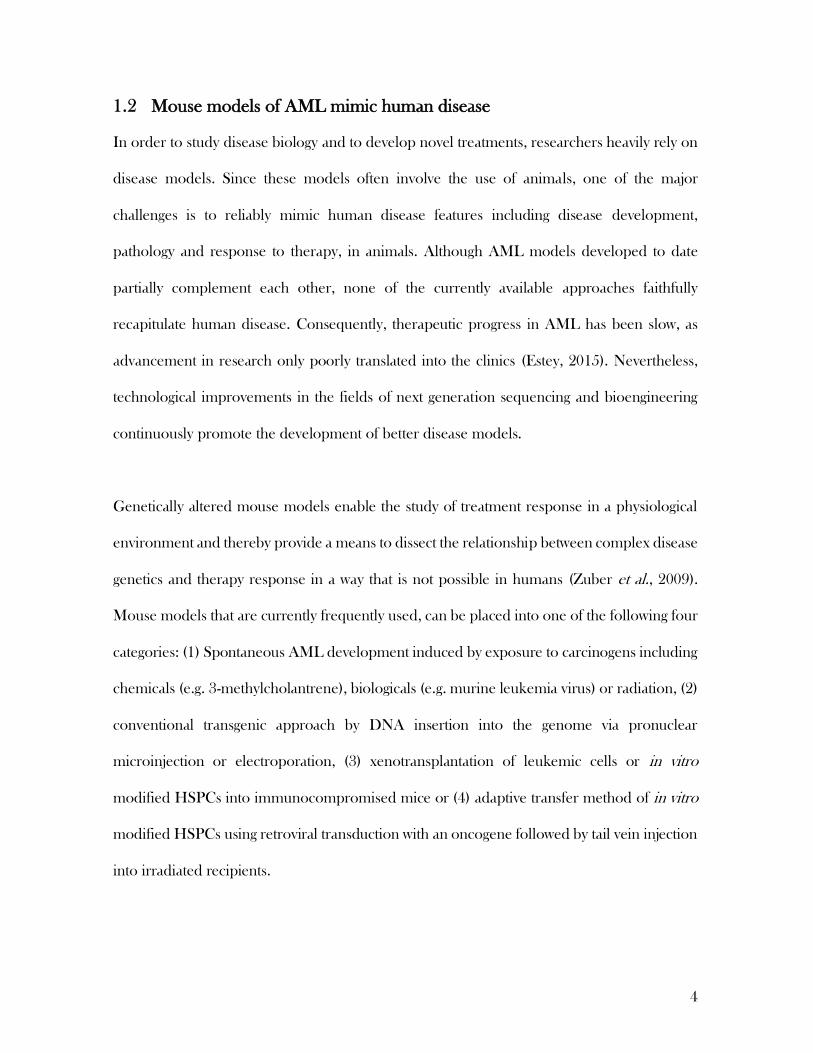
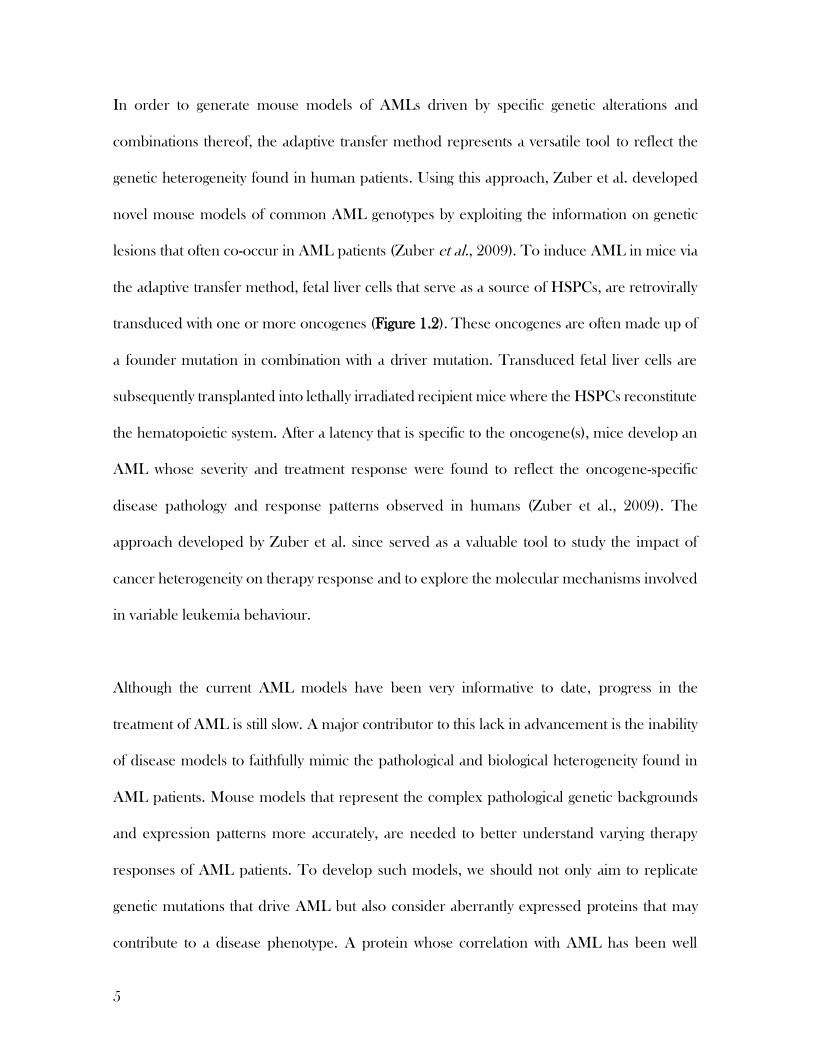
In order to generate mouse models of AMLs driven by specific genetic alterations and
combinations thereof, the adaptive transfer method represents a versatile tool to reflect the
genetic heterogeneity found in human patients. Using this approach, Zuber et al. developed
novel mouse models of common AML genotypes by exploiting the information on genetic
lesions that often co-occur in AML patients (Zuber et al., 2009). To induce AML in mice via
the adaptive transfer method, fetal liver cells that serve as a source of HSPCs, are retrovirally
transduced with one or more oncogenes (Figure 1.2). These oncogenes are often made up of
a founder mutation in combination with a driver mutation. Transduced fetal liver cells are
subsequently transplanted into lethally irradiated recipient mice where the HSPCs reconstitute
the hematopoietic system. After a latency that is specific to the oncogene(s), mice develop an
AML whose severity and treatment response were found to reflect the oncogene-specific
disease pathology and response patterns observed in humans (Zuber et al., 2009). The
approach developed by Zuber et al. since served as a valuable tool to study the impact of
cancer heterogeneity on therapy response and to explore the molecular mechanisms involved
in variable leukemia behaviour.
Although the current AML models have been very informative to date, progress in the
treatment of AML is still slow. A major contributor to this lack in advancement is the inability
of disease models to faithfully mimic the pathological and biological heterogeneity found in
AML patients. Mouse models that represent the complex pathological genetic backgrounds
and expression patterns more accurately, are needed to better understand varying therapy
responses of AML patients. To develop such models, we should not only aim to replicate
genetic mutations that drive AML but also consider aberrantly expressed proteins that may
contribute to a disease phenotype. A protein whose correlation with AML has been well
6
established, is Ecotropic Viral Integration Site 1, or EVI1. The role of EVI1 in disease severity
as well as treatment response will be discussed in the following subchapter.
Fetal livers are harvested at E14.5 and retrovirally transduced with oncogene(s). Infected cells are then
injected into lethally irradiated mice which consequently develop AML after a latency that is specific
for the oncogene(s). Bone marrow of deceased mice can be harvested and contained leukemic cells
cultured in the presence of IL-3. To induce secondary AML, leukemic cells can be injected into
recipient mice.
EVI1 overexpression is a prognostic marker for poor outcome in MLL-
AMLs
The proto-oncogene ecotropic viral integration site 1 (EVI1), located on chromosome 3q26,
is a zinc finger transcription factor for cell cycle genes (Morishita et al., 1988). As a
transcriptional regulator with stem cell-specific expression, EVI1 is essential for cell fate of
HSCs including cell renewal and repopulation capacity. Aberrant expression of EVI1 has been
associated with hematopoietic malignancies such as myelodysplastic syndrome (MDS) and
AML, as well as several solid epithelial cancers including ovarian and bladder cancer (Brooks
et al., 1996; Goyama et al., 2008). When overexpressed, EVI1 can block differentiation and
can confer resistance to apoptosis in leukemic cells (Kurokawa et al., 1998; Liu et al., 2006).
An association between EVI1 expression and AML has been described on various occasions
Figure 1.2: Generating AML in mice by expressing oncogenes in the hematopoietic system

7
(Groschel et al., 2013; Grossmann et al., 2013). In patients bearing 3q26 abnormalities, EVI1
overexpression was detected in virtually all cases of this particularly treatment-resistant AML
karyotype, irretrievably linking aberrant EVI1 expression with this genetic subset (Barjesteh
van Waalwijk van Doorn-Khosrovani et al., 2003; Lugthart et al., 2010; Lugthart et al., 2008).
EVI1 has also been found to be overexpressed in types of adult and paediatric AML that do
not harbour 3q26 abnormalities. Overall, EVI1 was shown to be aberrantly expressed in 6-
11% of adult AML patients, while in patients with MLL-rearranged AML, overexpression of
EVI1 occurred in over 40% of cases (Grossmann et al., 2013; Lugthart et al., 2010). The exact
mechanism that leads to EVI1 overexpression remains unclear. However, the fact that
aberrant EVI1 expression is so prevalent in MLL-rearranged AML, supports the notion that
EVI1 is directly regulated by the fusion oncoprotein (Bindels et al., 2012). The cell type of
origin that acquires the AML-inducing mutations may also be responsible for high EVI1
expression levels, since the MLL-fusion protein MLL-AF9 was not able to induce EVI1
expression upon transformation of GMPs. However, at the same time, transformation of
HSCs lead to EVI1 expression to be sustained (Bindels et al., 2012).
When overexpressed in AML patients that harbour an MLL-translocation, EVI1 was
associated with a particularly poor prognostic outcome (Groschel et al., 2013). In MLL-AF9
AML, which is generally considered an intermediate risk AML, EVI1 expression divides
patients into a favourable and unfavourable subgroup where high EVI1 levels occur in the
latter (D. Grimwade et al., 2009). EVI1 expression in these patients correlated with resistance
to chemotherapy which might be due to the HSC-specific gene expression profile that has
been linked to the overexpression of EVI1 (Valk et al., 2004). In MLL-AF9 AML, high EVI1
levels therefore result in a particularly aggressive subtype of the disease.

8
The ability of EVI1 to induce MDS and its role in leukemogenesis, have also been
demonstrated in mice. In a Hoxa9/Meis1 mouse model, the forced expression of EVI1
accelerated disease onset significantly compared to Hoxa9/Meis1 expression alone, while
EVI1 expressed on its own induced MDS (Jin et al., 2007). In another model using a murine
MLL-AF9 cell line that has inherently high EVI1 levels, AML was induced by injecting these
cells into mice. Upon knock-down of EVI1 by shRNA, disease onset was significantly delayed
or even prevented, revealing EVI1 as a driver of the disease (Bindels et al., 2012).
In summary, EVI1 overexpression is a poor prognostic marker in AML and is strongly
associated with MLL-translocations. Here, high levels of EVI1 is an indicator of disease
severity, treatment resistance and an increased risk of relapse. Since its role in leukemogenesis
could also be demonstrated in mice, overexpressing EVI1 in murine AML could lead to the
development of an AML mouse model that faithfully reflects a particularly aggressive human
disease phenotype.
Inhibitor of apoptosis proteins as targets in the treatment of AML
Although some targeted drugs have been made available for the treatment of AML, disease
management still heavily relies on intensive chemotherapy and allogenic hematopoietic stem
cell transplantation. To improve survival rates and to reduce treatment toxicities, novel AML
therapies are urgently needed. A promising therapeutic target for the treatment of AML that
has been identified are the inhibitor of apoptosis proteins (IAPs), which are recurrently found
to be upregulated in AML (Fulda et al., 2012).

9
The IAPs are characterised by the presence of one or more copies of a domain called
baculoviral IAP repeat (BIR), which is comprised of approximately 70 amino acids (Figure
1.3). The IAP family members whose role in apoptosis have been described extensively, are
XIAP (X-linked inhibitor of apoptosis), cIAP1 and cIAP2 (cellular inhibitor of apoptosis 1
and 2). The three N-terminal BIR domains of XIAP, cIAP1 and cIAP2 have been
demonstrated to be crucial for their interaction with other proteins (Hinds et al., 1999; Silke
et al., 2014). In all three IAP family members, adjacent to BIR3 is a ubiquitin-associated
domain (UBA) which promotes engagement with ubiquitin chains (Gyrd-Hansen et al., 2008).
Unique to the cIAPs is the caspase recruitment domain CARD which is located at the C-
terminal end of the UBA and whose function in these proteins remains unknown (Silke et al.,
2013). The carboxy terminus of XIAP and cIAP1/2 harbour a RING (really interesting new
gene) finger domain, which confers E3-ligase activity to the proteins (Y. Yang et al., 2000).
XIAP and cIAP1/2 inhibit apoptosis through different mechanisms. Through its BIR2 and
BIR3 domains, XIAP is able to bind activated caspases 3 and 9 thereby inhibiting these
caspases and preventing apoptosis (Deveraux et al., 1997; Sun et al., 2000; Takahashi et al.,
1998). In contrast, cIAP1 and cIAP2 are not able to prevent cell death by antagonizing caspase
function, since their inhibitory activity on caspases is 100- to 1000-fold lower (Eckelman et al.,
2006; Roy et al., 1997). In contrast to XIAP, cIAP1 and cIAP2 prevent apoptosis by facilitating
the constitutive ubiquitylation of RIPK1 which leads to the formation of the cell death-inducing
complex II being blocked (Bertrand et al., 2008; Feoktistova et al., 2011).
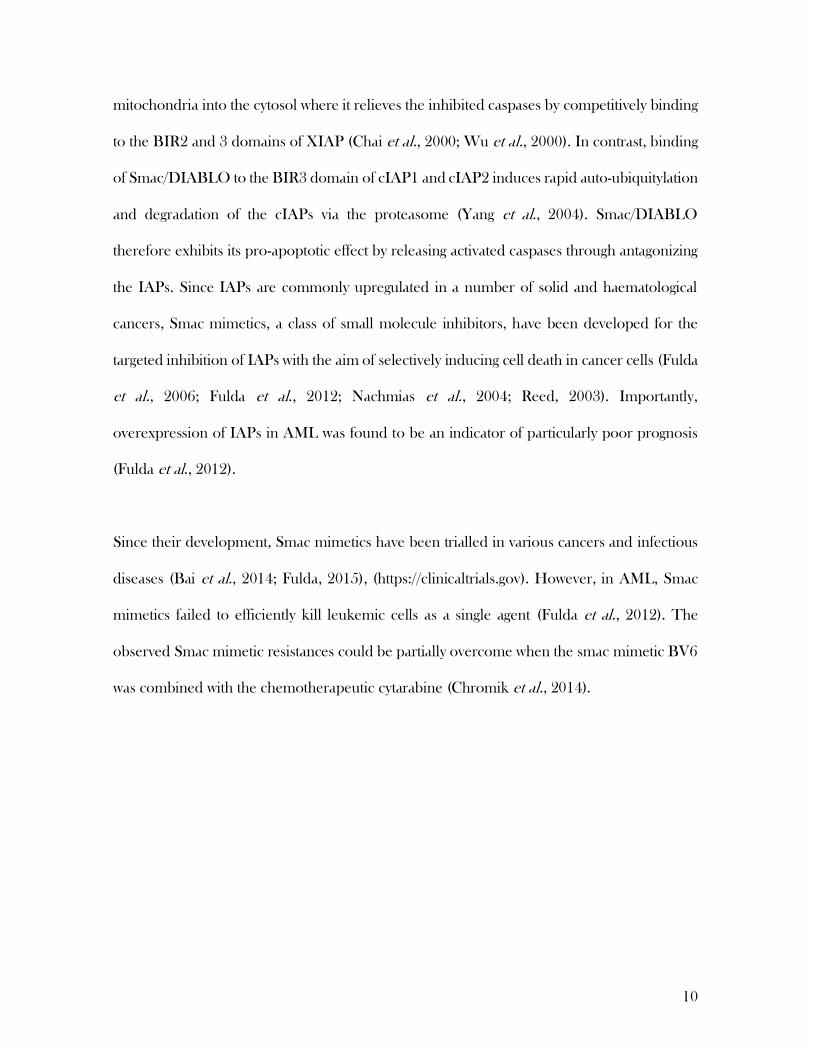
In the presence of an apoptotic stimulus, Smac (second mitochondria-derived activator of
caspases) or DIABLO (direct mitochondria-derived activator of caspases) is released from the
10
mitochondria into the cytosol where it relieves the inhibited caspases by competitively binding
to the BIR2 and 3 domains of XIAP (Chai et al., 2000; Wu et al., 2000). In contrast, binding
of Smac/DIABLO to the BIR3 domain of cIAP1 and cIAP2 induces rapid auto-ubiquitylation
and degradation of the cIAPs via the proteasome (Yang et al., 2004). Smac/DIABLO
therefore exhibits its pro-apoptotic effect by releasing activated caspases through antagonizing
the IAPs. Since IAPs are commonly upregulated in a number of solid and haematological
cancers, Smac mimetics, a class of small molecule inhibitors, have been developed for the
targeted inhibition of IAPs with the aim of selectively inducing cell death in cancer cells (Fulda
et al., 2006; Fulda et al., 2012; Nachmias et al., 2004; Reed, 2003). Importantly,
overexpression of IAPs in AML was found to be an indicator of particularly poor prognosis
(Fulda et al., 2012).
Since their development, Smac mimetics have been trialled in various cancers and infectious
diseases (Bai et al., 2014; Fulda, 2015), (https://clinicaltrials.gov). However, in AML, Smac
mimetics failed to efficiently kill leukemic cells as a single agent (Fulda et al., 2012). The
observed Smac mimetic resistances could be partially overcome when the smac mimetic BV6
was combined with the chemotherapeutic cytarabine (Chromik et al., 2014).

11
Following an apoptotic stimulus, mitochondria release Smac/DIABLO which binds to the BIR3
domain of cIAP1 and cIAP2 inducing auto-ubiquitylation and degradation to drive apoptosis. A UBA
promotes engagement with ubiquitin chains while the function of the CARD domain is unclear. The
carboxy-terminal RING finger domain provides E3-ligase activity.
Smac-mimetic killing is dependent on the TNF pathway
Smac mimetic-induced cell death has been found to be dependent on TNF (tumour necrosis
factor) signalling (Li et al., 2004; Silke et al., 2014) (Figure 1.4). TNF is a master regulator of
inflammation and cell death. As such, signalling downstream of TNFR1 has been extensively
studied. Upon binding of TNF to TNFR1, the receptor trimerizes which activates a
downstream signalling cascade leading to the assemblance of the signalling complex I. This
membrane-bound complex consists of the adapter protein TRADD (TNF receptor 1-
associated death domain protein) and RIPK1 (receptor interacting kinase 1) who associated
via their death domains (DD) and TRAF2 (TNF receptor-associated protein 2) (Inoue et al.,
2000; Meylan et al., 2004). The recruitment of cIAP1/2 via TRAF2 enables the ubiquitylation
of RIPK1 by the cIAPs, which is essential for the rapid activation of downstream NF-κB and
Figure 1.3: Smac/DIABLO drives apoptosis by antagonizing cIAPs
12
MAPK (mitogen-activated protein kinase) pathways (Etemadi et al., 2015; Micheau et al.,
2003; Samuel et al., 2006). As a transcriptional response, the expression of cytokines and
survival proteins such as cIAP1/2 and c-FLIP (cellular FADD-like IL-1β-converting enzyme
inhibitory protein) are upregulated (Micheau et al., 2001; Wang et al., 1998). Apart from
having a scaffolding function that contributes to the activation of NF-κB and MAP kinases,
ubiquitylation of RIPK1 limits the formation of a cytosolic cell death complex II, that has the
capacity to induce cell death via apoptosis or necroptosis (Feoktistova et al., 2011; Feoktistova
et al., 2012; Zhao et al., 2012). The apoptotic death complex, also referred to as the
Ripoptosome, consists of RIPK1, caspase-8 and the adapter proteins FADD and TRADD
(Feoktistova et al., 2011; Tenev et al., 2011). The necroptotic death complex on the other
hand is devoid of caspase-8 but contains the kinase RIPK3.
Therefore, treatment with the IAP inhibitor called Smac-mimetic enables the formation and
activation of complex II. Within this complex, caspase-8 initiates a caspase-dependent
apoptotic cell death (Darding et al., 2011). In conditions of reduced caspase-8 activation,
RIPK1 induces an alternative caspase-independent cell death pathway called necroptosis
(Murphy et al., 2014).
In addition to regulating cell death, cIAP1/2 may limit TNF secretion through the non-
canonical NF-κB pathway. Here, cIAP1/2 inhibit the activation of the non-canonical NF-κB
pathway by forming a complex with TRAF2 and TRAF3, which leads to the consistent
degradation of NIK (NF-κB-inducing kinase) (Vallabhapurapu et al., 2008; Vince et al., 2007).
NIK stabilisation is required for the signal integration from a number of TNF receptor family
13
members and activates the downstream kinase IκB kinase-α (IKKα), which in turn induces
p100 phosphorylation and processing to form the p52/RelB complex (Senftleben et al., 2001;
Xiao et al., 2001). Translocation of p52/RelB to the nucleus finally activates the transcription
of target genes, which include genes involved in cell survival (Roy et al., 2017). Since the basal
levels of NIK are actively limited by the TRAF/cIAP complex, degradation of cIAPs by SM
results in the accumulatio of NIK and activation of the NF- κB pathway. Although it is believed
that TNF production can be regulated through the non-canonical NF- κB pathway, this
connection has not been experimentally proven. The inhibition of cIAP1/2 in MEFs and
BMDMs for example, did not lead to an observable increase in TNF secretion (Lalaoui et al.,
2016). However, when SM was combined with a p38 or MK2 inhibitor in the same cells, TNF
secretion was increased dramatically (Lalaoui et al., 2016). The p38/MK2 pathway is therefore
able to regulate TNF production when cIAPs are absent.
Although some cancer cells can be killed with Smac mimetics alone, treatment resistances to
Smac mimetics as a single agent are commonly observed (Chromik et al., 2014; Fulda et al.,
2012; Lalaoui et al., 2016). Consistent with the observation that cells secreting TNF upon
treatment are often highly responsive, resistance to Smac mimetics can sometimes be
overcome by the addition of exogenous TNF (Lalaoui et al., 2016). This discovery inspired a
quest to identify agents that had the potential to increase TNF production in Smac mimetic-
treated cells, therefore enhancing cell death and overcoming drug resistance.
14
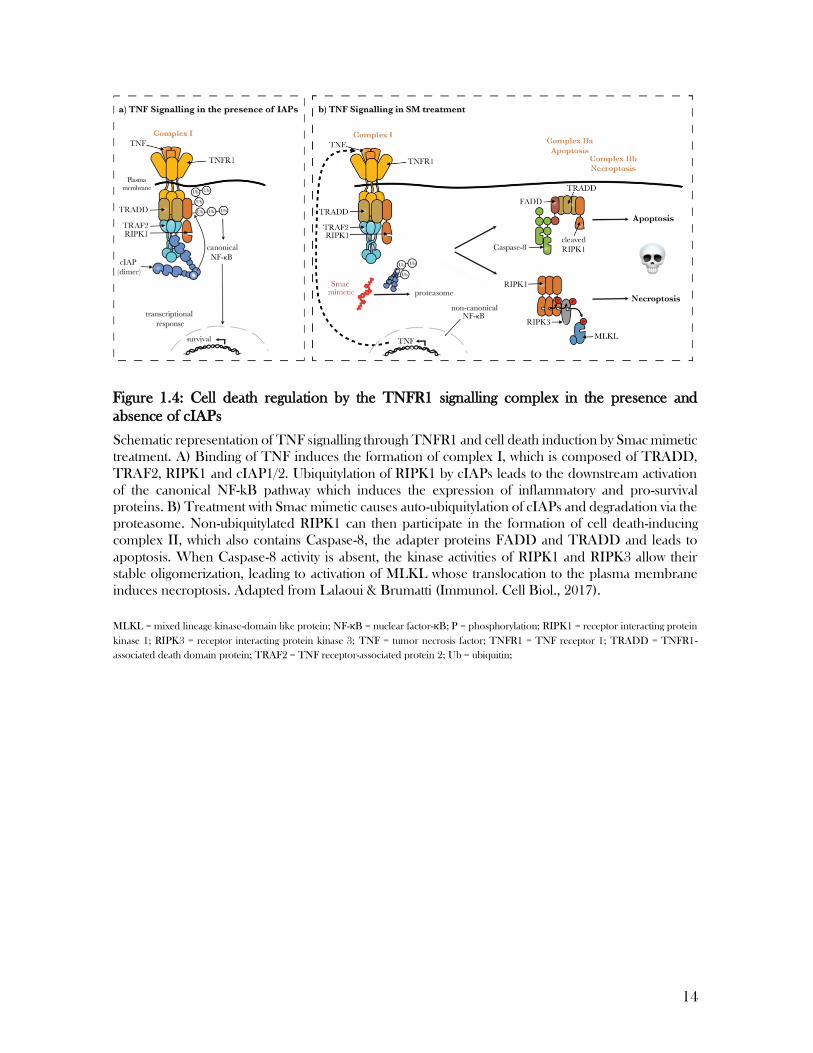
Schematic representation of TNF signalling through TNFR1 and cell death induction by Smac mimetic
treatment. A) Binding of TNF induces the formation of complex I, which is composed of TRADD,
TRAF2, RIPK1 and cIAP1/2. Ubiquitylation of RIPK1 by cIAPs leads to the downstream activation
of the canonical NF-kB pathway which induces the expression of inflammatory and pro-survival
proteins. B) Treatment with Smac mimetic causes auto-ubiquitylation of cIAPs and degradation via the
proteasome. Non-ubiquitylated RIPK1 can then participate in the formation of cell death-inducing
complex II, which also contains Caspase-8, the adapter proteins FADD and TRADD and leads to
apoptosis. When Caspase-8 activity is absent, the kinase activities of RIPK1 and RIPK3 allow their
stable oligomerization, leading to activation of MLKL whose translocation to the plasma membrane
induces necroptosis. Adapted from Lalaoui & Brumatti (Immunol. Cell Biol., 2017).
MLKL = mixed lineage kinase-domain like protein; NF-κB = nuclear factor-κB; P = phosphorylation; RIPK1 = receptor interacting protein
kinase 1; RIPK3 = receptor interacting protein kinase 3; TNF = tumor necrosis factor; TNFR1 = TNF receptor 1; TRADD = TNFR1‐
associated death domain protein; TRAF2 = TNF receptor-associated protein 2; Ub = ubiquitin;
Figure 1.4: Cell death regulation by the TNFR1 signalling complex in the presence and
absence of cIAPs
15
The mitogen-activated protein kinase p38 can prevent SM-induced cell
death
By screening a library of kinase inhibitors for their ability to increase TNF production in Smac
mimetic-treated cells, we previously identified that p38 inhibition greatly enhanced Smac
mimetic killing efficiency by increasing TNF levels (Lalaoui et al., 2016). When applied to
AML mouse models, the combination treatment of the clinical Smac mimetic Birinapant and
the p38 inhibitor LY2228820, proved to be a potent killer of leukemic cells both in vitro and
in vivo (Lalaoui et al., 2016). Likewise, when BMDMs were treated with the combination of
another Smac mimetic agent, Compound A, and the p38 inhibitor, greater rates of apoptosis
were accompanied by increased levels of TNF (Lalaoui et al., 2016). Although the exact
mechanisms behind these observations remained unresolved, it was revealed that the
combined inhibition of p38 and the IAPs prompted the activation of the MAP kinases
ERK1/2 and JNK1/2 (Lalaoui et al., 2016). A possible trigger for the activation of the MAP
kinase ERK1/2 may be the induction of TNF secretion caused by the combination of
SM/p38i.
Given the central role this cytokine plays in innate immunity and inflammation, TNF is tightly
regulated on multiple levels including TNF expression, mRNA transcription, mRNA nuclear
export, mRNA stability, translation of pro-TNF and shedding of mature TNF from the cell
membrane (Gaestel et al., 2009). Key regulators of these processes include NF-κB and the
MAP kinases p38, JNK1/2 and ER1/2 (Das et al., 2009; Gonzalez-Teran et al., 2013; Rutault
et al., 2001; Udalova et al., 1998). It has been demonstrated that JNK1/2 is required for the
expression of TNF in hematopoietic cells including macrophages (Han et al., 2013), while
ERK1/2 regulates the cytokine by both transcriptional and post-transcriptional mechanisms
16
(Deleault et al., 2008; Rutault et al., 2001). Apart from regulating TNF and stimulating the
expression of death receptors, ligands and pro-apoptotic proteins, both JNK1/2 and ERK1/2
can regulate extrinsic apoptosis through additional means. As such, ERK1/2 activity has been
described to induce FADD, an adaptor of caspase-8 to the death inducing complex I, while
JNK1/2 is able to phosphorylate Bid, triggering the release of Smac/DIABLO (Cagnol et al.,
2010; Madesh et al., 2002).
The increased activation of JNK1/2 in cells treated with Smac mimetic and p38 inhibitor, may
be a consequence of a negative feedback loop involving p38, whereby the MAP kinase
suppresses the activation of TAK1 (transforming growth factor beta-activated kinase 1), a JNK
pathway activator, by phosphorylating TAB1 (TAK1-binding protein) (Cheung et al., 2003;
Gaestel et al., 2009). However, the inhibition of MK2 (MAP kinase-activated protein kinase
2), a direct p38 substrate, induces the same increase in JNK1/2 phosphorylation and a direct
effect of MK2 on the p38-TAB1 interaction has not been described. Neither has MK2 been
shown to directly phosphorylate JNK1/2. In support of a feedback effect, inhibition of both
p38 and MK2 induced an increase in TAK1 phosphorylation (Lalaoui et al., 2016). Whether
MK2 itself is able to participate in this feedback loop or other unknown mediators are involved
remains unresolved.
Upon activation by MKK3 and MKK6, p38 activates the kinase MK2 which in turn
phosphorylates and thereby inhibits TTP (tristetraprolin), a destabiliser of TNF mRNA
(Mahtani et al., 2001). Due to its role in promoting TNF production, the p38 pathway was
long considered an attractive target for the therapy of inflammatory diseases leading to the
development of clinical p38 inhibitors (Amir et al., 2013). Unfortunately, clinical trials
17
involving these inhibitors for the treatment of rheumatoid arthritis have failed greatly due to
undesirable side effects and lack of efficiency (Duraisamy et al., 2008; Genovese, 2009). In
light of its described pro-inflammatory role, the observation that TNF levels increased upon
p38 inhibition in the absence of IAPs, was unexpected.
It was not until Jaco et al. discovered that the p38 substrate MK2 can phosphorylate RIPK1,
thereby preventing the formation of the death inducing complex II, that we gained a better
understanding of how p38 can prevent cell death in Smac mimetic-treated cells (Jaco et al.,
2017) (Figure 1.5). This study showed that MK2 phosphorylates cytosolic as well as complex
I-bound RIPK1 on Ser321, which limited RIPK1 recruitment to complex II, consequently
limiting cell death by preventing the formation and activation of complex II. However,
RIPK1S321D phospho-mimetic MEFs and BMDMs were only partially protected from Smac
mimetic-induced cell death and the additional inhibition of MK2 further sensitized RIPK1S321D
mutants (Jaco et al., 2017). Two possibilities can be considered: i) the replacement of the
serine by glutamine did not fully mimic the phosphorylation function or ii) there are additional
mechanisms through which p38/MK2 can limit TNF-induced cell death. The ability of Smac
mimetic to kill cells as a single agent, relies on TNF production and the simultaneous
sensitization of cells to the secreted TNF (Varfolomeev et al., 2007; Vince et al., 2007; Wang
et al., 2008; Wong et al., 2010). The fact that p38/MK2 inhibition positively effects both
aspects of Smac mimetic activity, hints at a close link between TNF production and TNF-
induced cell death. Continued efforts into understanding the mechanisms of the combined
treatment of Smac mimetic with p38/MK2 inhibitors for the treatment of cancers are therefore
justified.

18
Schematic representation of the role of p38 in TNF signalling through and cell death induction by
Smac mimetic and p38i treatment. A) Upon activation by TAK1, p38 phosphorylates MK2 which in
turn phosphorylates RIPK1 to prevent the formation of the cell death-inducing complex II in SM-
treated cells. B) Inhibition of p38 prevents the phosphorylation of RIPK1 which can then participate
in the formation of complex II. Depending on caspase-8 activity, cell can occur via apoptosis or, when
caspase-8 activity is absent, necroptosis. Concurrently, TNF expression is increased amplifying the
death signal. Adapted from Lalaoui & Brumatti (Immunol. Cell Biol., 2017).
P = phosphorylation; RIPK1 = receptor interacting protein kinase 1; TAK1 = TGF- activated kinase 1; TNF = tumor necrosis factor; TNFR1
= TNF receptor 1; TRADD = TNFR1‐associated death domain protein; TRAF2 = TNF receptor-associated protein 2.
Figure 1.5: The role of p38 in the inhibition of TNF-dependent SM-induced cell death
A
(
a) b)
19
TNF Signalling – Some outstanding questions
As discussed previously, TNF is a pleiotropic, inflammatory cytokine that can regulate cell
death and survival in a tightly-orchestrated manner. Deregulation of the TNF pathway is
associated with a number of autoimmune and inflammatory diseases (Apostolaki et al., 2010).
Since the prevalence of such diseases are on the rise, addressing outstanding questions on the
TNF pathway is of paramount importance.
In immune cells, TNF-induced cell death plays a critical role in the removal of autoreactive
cells to limit unwanted inflammatory responses (Satoh et al., 1989). Deregulation of TNF
signalling in these cells leads to autoimmune diseases (McDermott et al., 1999). In fact, TNF
is considered a master mediator of the pathogenesis of many autoimmune diseases and
chronic inflammation (Yan et al., 2018). With high incidence rates and ever-increasing
prevalence, anti-TNF therapies for the treatment of conditions including Crohn’s Disease and
rheumatoid arthritis, have become the most successful drugs in the overall pharmaceutical
industry (marketwatch.com). The involvement of TNF signalling in disease development and
treatment has also been described in many cancers, where TNF can have both pro- and anti-
tumoral effects (Wajant, 2009).
Even though it has been the subject of intense research for years, many outstanding questions
remain, which can be attributed to its extraordinary complexity. A crucial regulator of TNF-
induced cell death that has attracted a lot of attention in the last years is RIPK1. Its ability to
signal towards both cell death and survival is mediated through different functional domains
(Figure 1.6). As part of the membrane-bound complex I, ubiquitylated RIPK1 functions as a
recruitment platform for TAK1 and IκB kinases (IKK) which promotes the activation of NF-
20
κB and MAP kinases. In the absence of IAPs, RIPK1 can induce apoptosis in the presence
of caspase-8 or necroptosis through phosphorylation of RIPK3, both of which require its
kinase activity. At the same time, RIPK1 can also inhibit the formation of the necrosome
through mechanisms that remain unclear (Berghe et al., 2015).
Caspase-8 and cFLIP are two further important regulatory players of the TNF pathway who
attract great focus. Within the death inducing cytosolic complex II, caspase-8 activity controls
apoptotic and necroptotic cell fates. Once activated, caspase-8 inhibits necroptosis by cleaving
RIPK1, RIPK3 and CYLD (Feng et al., 2007). Its pro-apoptotic and anti-necroptotic function
is regulated by interactions with the pseudo-caspase cFLIP. Caspase-8 homodimers induce
apoptosis, however the caspase-8/cFLIPL heterodimer suppresses both apoptosis and
necroptosis (Piao et al., 2012). Binding of cFLIP reduces caspase-8 activity to prevent
apoptosis while low levels of enzymatic activity lead to the cleavage of RIPK1 and RIPK3
(Salvesen et al., 2014). It still remains unclear how the different outcomes for the activities of
the caspase-8 homodimer and the caspase-8/cFLIPL heterodimer are regulated. Other
important questions that still need to be addressed involve trigger mechanisms by which the
receptor-bound complex I is converted to the cytosolic complex II. Is it due to complex
internalization, deubiquitylation or other unidentified mechanisms? IAP depletion can trigger
the formation of the Ripoptosome independently of TNF-signalling in some cell types (Berghe
et al., 2015). It is therefore possible that complex II formation occurs sequentially and not as
a direct maturation of complex I. What are the mechanisms by which phosphorylation and
(de)ubiquitination events regulate RIPK1 signalling?
Given the complexity of the TNF signalling pathway and the vast number of diseases its
dysregulation is associated with, answering these outstanding questions would help us better

21
understand current treatments and could lay the foundation for the development of novel
therapies. Although anti-TNF drugs have been extremely successful in the treatment of
autoimmune and inflammatory diseases and significantly improved the lives of millions,
serious adverse side effects, emerging drug resistances and limited efficiencies are only a few
reasons why continued research into TNF signalling is of paramount importance (Sedger et
al., 2014).
ABIN1 = A20-binding inhibitor of NF-κB; CYLD = cylindromatosis; DAI = DNA‐dependent activator of IRFs; LUBAC = linear ubiquitin
chain assembly complex; MK2 = MAP kinase-activated protein kinase 2; NEMO = NF‐κB essential modulator; OPTN = optineurin;
SPATA2 = spermatogenesis associated 2 ; TAB = TAK1‐binding protein; TAK1 = TGF- activated kinase 1; TRADD = TNFR1‐associated
death domain protein; TRIF = TIR-domain-containing adaptor inducing IFNβ; Ub = ubiquitin.
Schematic of the domains and post-translational modifications (PTMs) of RIPK1. RIPK1 consists of
an N-terminal kinase domain (KD), an intermediate domain (ID) containing a receptor-interacting
protein homotypic interaction motif (RHIM) and a C-terminal death domain (DD). Interacting
partners are indicated underneath each domain. A number of proteins interact with ubiquitylated
Lys377 and possibly other putatively ubiquitylated Lys residues. DD is crucial for the initiation of death
receptor signalling and apoptosis. The ID is associated with NF- κB signalling and necroptosis.
Figure 1.6: RIPK1 is a master regulator of cell death and survival
22
CRISPR/Cas9 mediated knock-in enables the study of endogenous
proteins
In order to study the function of a particular protein on an endogenous level, the insertion of
a small molecular tag to its N- or C-terminus is a well-established tool. When efficient reagents
for the study of a protein of interest are not available, tagging a protein allows one to address
a number of questions. A tag permits to pull down the protein of interest with its interactors,
enables to study its post-translational modifications and aids with visualizing its location using
immunofluorescent imaging techniques. To date, most work involving tagged proteins has
been achieved by generating expression constructs of the tagged versions and stably integrating
them into cell lines via viral transduction. Often, the applied cell line is lacking the protein of
interest either by nature or by genetic deletion. Although widely applied, this technique has
various caveats. The expression of a tagged protein can be difficult to accomplish as the
deletion itself or the re-introduction of the tagged gene can be lethal to a cell with RIPK1 being
a good example for the latter. Physiological expression levels are often difficult to achieve and
with protein functions being dosage-dependent, observations based on over-expression
systems may not be relevant in a physiological context. Considering the importance of protein
levels, we should aim to genetically tag proteins at their endogenous levels. With the
CRISPR/Cas9 technology being able to specifically target genetic regions, it is the ideal tool to
not only delete sequences but also to introduce foreign sequences into a specific region of the
genome of a cell. The CRISPR/Cas9 system relies on RNA-guided sequence-specific
endonucleases to induce DNA double-stranded breaks (DSBs) at specific genomic loci
(Doudna et al., 2014). Those DSBs can be repaired by the cell’s intrinsic DNA repair
mechanisms in one of two ways: In the error-prone non-homologous end joining (NHEJ)
pathway, the break is repaired by the DNA repair machinery where the ends of the DSB are
23
rejoined (Doudna et al., 2014). This can result in the generation of random indel mutations
leading to frameshifts and the creation of premature stop codons, which ultimately result in
genetic knockouts (Ran et al., 2013). Alternatively, when provided with a repair template in
form of a plasmid or single stranded DNA (ssDNA), the cell’s homologous DNA repair
(HDR) pathway can be activated allowing precise editing with high fidelity (Lombardo et al.,
2011). It is this HDR pathway that can be exploited to introduce foreign sequences such as
molecular tags or mutations into the host’s genome.
Nowadays, the application of the CRISPR/Cas9 technology to generate genetic knock-ins in
mice is a well-established tool for the study of proteins where it allows researchers to address
a vast array of questions (Hille et al., 2018). Although this technique has a high success rate
and can be applied to virtually any gene, generating knock-in mice is both cost intensive and
time consuming (Doyle et al., 2012). Due to these restrictions and the inability to study human
proteins, using the CRISPR/Cas9 knock-in technology in animals is not always a viable option.
A more economical and faster approach for the generation of tagged proteins, involves the use
of cell lines. Although a number of protocols for the use of CRISPR/Cas9 knock-in in cell
lines have been published, these techniques often fail to transfer to other cell lines or target
genes (Lino et al., 2018). Reasons for their restricted versatility include our lack of
understanding of the molecular mechanisms involved in homologous DNA repair and the fact
that in different cell lines, enzymes belonging to the HDR and NHEJ pathway vary in their
degree of activity (Liu et al., 2019). The CRISPR/Cas9 technology has revolutionized how we
study protein function. Given its immense potential, there is a great drive to gain more insights
into what the exact molecular mechanisms of CRISPR/Cas9 are and how we can best harness
its ability to precisely edit genes. Ultimately, this will lead to the development of improved,
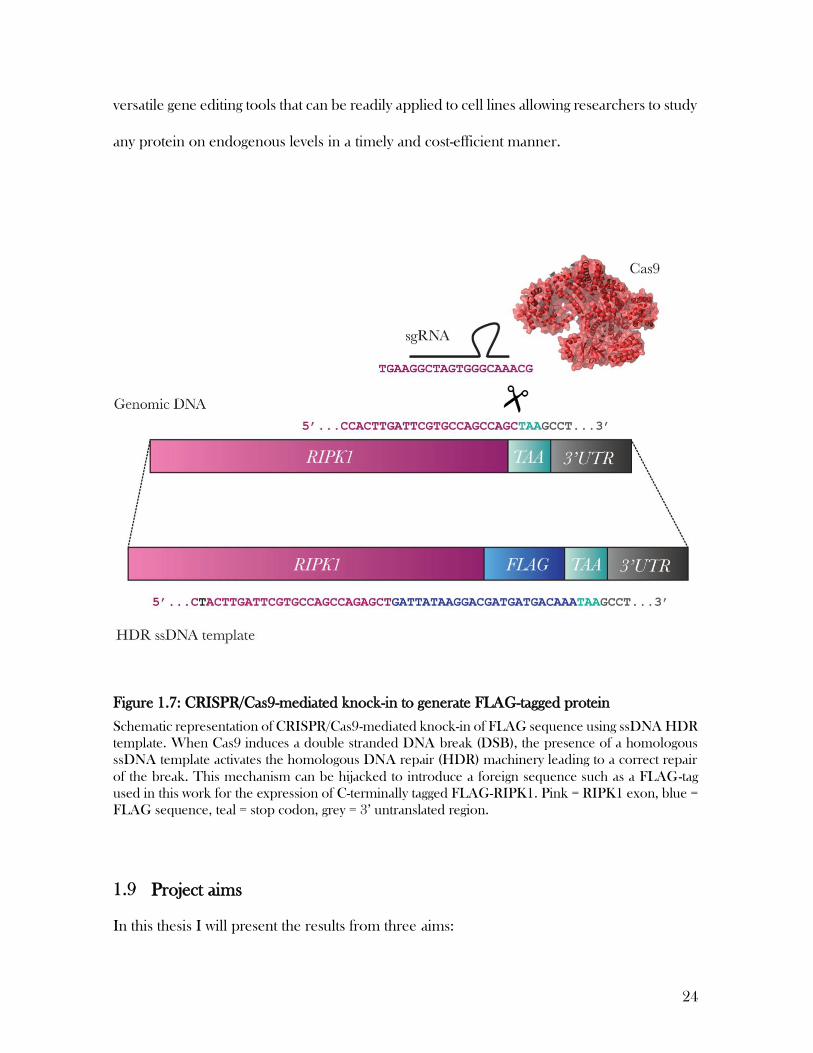
24
versatile gene editing tools that can be readily applied to cell lines allowing researchers to study
any protein on endogenous levels in a timely and cost-efficient manner.
Schematic representation of CRISPR/Cas9-mediated knock-in of FLAG sequence using ssDNA HDR
template. When Cas9 induces a double stranded DNA break (DSB), the presence of a homologous
ssDNA template activates the homologous DNA repair (HDR) machinery leading to a correct repair
of the break. This mechanism can be hijacked to introduce a foreign sequence such as a FLAG-tag
used in this work for the expression of C-terminally tagged FLAG-RIPK1. Pink = RIPK1 exon, blue =
FLAG sequence, teal = stop codon, grey = 3’ untranslated region.
Project aims
In this thesis I will present the results from three aims:
Figure 1.7: CRISPR/Cas9-mediated knock-in to generate FLAG-tagged protein

25
(1) Generating a clinically relevant AML mouse model that recapitulates an aggressive,
treatment-resistant form of AML by expressing EVI1 with the oncogene MLL-AF9 in
vivo.
(2) Understanding the role of the MAP kinase p38 in preventing Smac mimetic-induced
cell death.
(3) Establishing a protocol that allows the tagging of endogenous proteins of the TNF
signalling pathway using the CRISPR/Cas9 knock-in technology.
1.9.1 MLL-AF9 EVI1 mouse model
The translation of novel discoveries into the clinic to treat AML more efficiently, has been
hampered by the lack of suitable disease models. The overexpression of the transcription
factor EVI1 has been identified as a marker of poor prognosis in AML patients (Groschel et
al., 2013). I aimed to generate a mouse model that faithfully reflects a particularly aggressive
form of this disease by overexpressing EVI1 in an MLL-driven AML. I hypothesize that the
expression of EVI1 gives leukemic cells a proliferative advantage, that may lead to: (A) a more
rapid disease onset, (B) a more severe disease phenotype, (C) a more immature immuno-
phenotype and (D) greater resistance of leukemic cells to treatment in vitro. The results of this
work will be presented in Chapter 3 of this thesis.
1.9.2 The role of p38 in inhibiting cell death in IAP-depleted cells
The IAPs have been identified as attractive targets in the treatment of various cancers leading
to the development of Smac mimetics. The MAP kinase p38 can prevent Smac mimetic-
induced cell death which can be overcome by the addition of p38 inhibitors, revealing a novel
role of this protein (Lalaoui et al., 2016). Understanding the mechanisms through which p38

26
exhibits its inhibitory function was the objective this project. To do so, I studied the
phosphoproteome of cells treated with Smac mimetic alone or in combination with a p38
inhibitor to identify pathways that mediate the prevention of cell death. Chapter 4 outlines the
results of this work.
1.9.3 Tagging endogenous proteins using CRISPR/Cas9-mediated knock-in
The CRISPR/Cas9 gene editing tool revolutionized that study of proteins by allowing
researchers to precisely insert foreign sequences (‘knock-in’) into the genome of a cell to
molecularly tag proteins. This ability enables us to study protein features such as their function,
interactors or post-translational modifications on an endogenous level. To date, a number of
techniques have been described to efficiently generate knock-in cell lines. While the published
approaches vary greatly with regards to cost, labor intensity and versatility, my aim was to
establish a protocol that can be applied to a large cohort of cell lines, that is relatively
inexpensive and quick and at the same time suited for any gene of interest. To test my
approach of choice, I aimed to generate C-terminally tagged FLAG- RIPK1 in mouse dermal
fibroblasts (MDFs). The results of this project are discussed in Chapter 5.
27
2 Materials and Methods
2.1 Antibodies
For Western blotting the following antibodies were used: mouse anti-FLAG (F-3165, Sigma),
mouse anti ß-actin (A-1978, Sigma), rabbit anti-phospho JNK (9251, Cell Signaling
Technology), rabbit anti-phospho MK2 (3007P, Cell Signaling Technology), rabbit anti-
phospho ERK (9102, Cell Signaling Technology), rabbit anti-p38 (9212, Cell Signaling
Technology), rabbit anti-phospho p38 (9211, Cell Signaling Technology), rabbit anti-EVI1
(ab28457, Abcam), rabbit anti-GFP (11122, Invitrogen), mouse anti-caspase 8 (sc-789, Santa
Cruz Biotechnology).
For immunohistochemistry antibodies used were rat anti-mouse Ly-6G/6C APC-Cy7 (557661,
BD Pharmingen), rat anti-mouse F4/80 PE (MCA497GA, AbD Serotec), rat anti-mouse
CD11b BV510 (562950, BD Pharmingen), rat anti-mouse CD117 APC (553356, BD
Pharmingen), rat anti-mouse Ly6A/E PE (553108, BD Pharmingen), rat anti-mouse NK1.1
FITC (553164, BD Pharmingen), rat anti-mouse B220 PE (12045282, eBioscience), rat anti-
mouse Ter119 APC-Alexa Fluor 750 (275921, eBioscience).
2.2 Reagents
Table 2.1 List of reagents
Reagent Catalogue number Company
2-Chloroacetamide C0267 Aldrich
2,2,2-Trifluoroethanol 91683 Sigma-Aldrich
10x T4 ligation buffer M1801 Promega
Acetonitrile 900667 Sigma-Aldrich

28
Agarose BIO-41025 Bioline
Ammonium bicarbonate 09830 Sigma-Aldrich
Ampicillin ROAMP Roche
Ara-C C1768 Sigma-Aldrich
Birinapant - TetraLogic
Compound A - TetraLogic
Dimethyl sulfoxid 276855 Sigma-Aldrich
ECL RPN2236 GE Healthcare
EDTA E9884 Sigma-Aldrich
Effectene 28706 Qiagen
Ethidium bromide E1510 Sigma
GoTaq green M712C Promega
HRP substrate WBKLS0500 Millipore
L-Broth P4170 In-house
LY2228820 (p38 inhibitor) Apex Bio A5566
Lys-C 90051 Thermo Scientific
Ni-NTA beads 151010 Qiagen
Plasmid purification kit K20007 Invitrogen
PF-3644022 (MK2 inhibitor) 4279 Tocris Bioscience
Propidium iodide P4170 Sigma
Ralimetinib S1494 Selleckchem
Retronectin - In-house
Restriction enzymes NEB

29
T4 DNA ligase M1801 Promega
TCEP 20490 Thermo Fisher
Trifluoroacetic acid T6508 Sigma Aldrich
Trypsin Xv528x Promega
2.3 Vector preparation
For the generation of recombinant plasmids, vectors and insert were cut with the appropriate
restriction enzyme/s as follows:
Table 2.2: Vector digest reaction
5 g vector/insert
1 L restriction enzyme (NEB)
5 L 10x appropriate enzyme buffer (NEB)
x L ddH2O
50 L
Cut vector/insert was resolved using a 1.2% (w/v) agarose-TAE (40 mM Tris-acetate pH 8.2,
1 mM EDTA) gel. Bands were excised and DNA purified using the Wizard SV Gel and
PCR Clean-Up system (Promega) according to manufacturer’s instructions with 50 μL of
nuclease free H2O as the final elution.
2.4 Ligation
The gene of interest was transferred to the target vector by ligating cut vector and insert as
followed:
30
Table 2.3: Ligation reaction
100 ng cut plasmid
300 ng insert
0.8 L T4 ligase (Promega)
1 L 10x T4 ligation buffer
x L nuclease free water
10 L
Ligation mixture was incubated at RT overnight.
2.5 Transformation of Stbl4 cells
The amplification of newly generated plasmid was achieved by transformation of 50 µL ice-
thawed electrocompetent Escherichia coli Stbl4 (in-house) with 2 µL ligation mix.
Electroporation was performed in 2 mm electroporation cuvettes (Cell Projects) at 2.5 kV for
approximately 5 ms using a MicroPulser electroporator (Bio Rad). Electroporated cells were
transferred to LG agar plates (1.5% (w/v) Difco agar, 1% (w/v) tryptone, 0.5% (w/v) yeast
extract, 0.5% (w/v) NaCl, 0.2% (w/v) glucose, 10 mM Tris-HCl pH 7.4, 1 mM MgCl2) and
were grown in the presence of 100 µL/mL ampicillin for 16 hours at 37 °C.
2.6 Miniprep of plasmid DNA and sequence confirmation
To determine if ampicillin-resistant bacteria have been transformed with the target plasmid,
colonies were screened by inoculation in 1.5 mL LB broth (1% peptone (w/v), 0.5% yeast
extract (w/v), 0.5% NaCl (w/v)) and incubation with of 100 µL/mL ampicillin for 16 hours at
37 °C. Plasmid DNA was subsequently isolated by resuspending bacterial pellets in
resuspension buffer (50 mM Tris-HCl pH 8.0, 10 mM EDTA, 20 mg/mL RNase; Invitrogen)
followed by lysis for 1 minute in 200 mM NaOH, 1% (w/v) SDS (Invitrogen) on ice and

31
precipitation for 5 minutes by the addition of precipitation buffer (Invitrogen). Precipitable
material was pelleted and plasmid DNA was retrieved by adding isopropanol to the
supernatant at a ratio of 0.7:1. Plasmid DNA was pelleted and washed in 70% ethanol before
being dried and resuspended in nuclease free water.
To confirm the sequence of recombinant plasmids, diagnostic digests were performed and
promising constructs were finally sent for Sanger sequencing at the Australian Genome
Research Facility (AGRF, Melbourne).
2.7 Midiprep of plasmid DNA
Upon confirmation of the sequence, appropriate bacterial clones were inoculated in 50 – 100
mL LB broth and plasmid DNA was isolated using Invitrogen’s HiPure plasmid midiprep kit
in accordance with the provided instructions. Plasmid DNA pellets were finally resuspended
in 50 – 100 µL nuclease free water and DNA concentrations were measured using a
spectrophotometer (NanoDrop, Thermo Fisher).
2.8 Cell death assay via flow cytometry
To determine the rate of cell death, the uptake of propidium iodide (PI) was measured via
flow cytometry. Cells were harvested and resuspended in PBS at a cell concentration of
approximately 1 x 10⁵ cells/100 µL. PI solution (10 µg/mL) was added to achieve a final
concentration of 100 ng/mL and after incubation on ice in the dark for one minute, PI uptake
was measured using a FACSCalibur flow cytometer (BD Biosciences) where it was detected at
660 nm.

32
2.9 Cell lines and cell culture
Cell lines used were human embryonic kidney cell line (HEK293T), transformed mouse
dermal fibroblast (MDFs), primary murine bone marrow-derived macrophages (BMDMs),
various AML cell lines (MLL-AF9, MLL-AF9/NrasG12D
, MLL-ENL) and fetal liver cells. Cell
lines were cultured in Dulbecco’s Modified Eagle’s Medium (DME, GIBCO) (HEK293Ts,
MDFs) or Iscove’s Modified Dulbecco’s Medium (IMD, GIBCO) (AML cell lines)
supplemented with 8% fetal calf serum (FCS, GIBCO) (v/v), 1 mM L-glutamine, 100 units/mL
penicillin and 100 µg/mL streptomycin (GIBCO). For the generation of BMDMs, bone
marrow from the femur, tibiae and hip of mice was cultured for six days in DME
supplemented with 10% FCS (v/v), 20% L929 mouse fibroblast media (in-house) and
antibiotics (penicillin and streptomycin). After six days, cells were detached using trypsin-
EDTA and a cell scraper and appropriate cell numbers were re-plated in 10 cm and 24-well
cell culture plates. Progenitor/stem cells were derived from fetal livers which were isolated
from E14 C57BL/6J embryos, resuspended in PBS and cultured in alpha-minimum essential
medium (alpha-MEM, GIBCO) supplemented as above but with the addition of 10 mM
HEPES, 1mM sodium pyruvate, 10% FCS, 50 µM ß-mercaptoethanol, 100 ng/mL murine
stem cell factor (SCF, PeproTech), 10 ng/mL IL-6, 50 ng/mL thrombopoietin and 5 ng/mL
FMS-related tyrosine kinase (Flt) 3. All cells were cultured at 37 °C with 10% CO2 in a
humidified incubator.
2.10 Generation of retrovirus and infection
For retroviral infection virus supernatant was produced by co-transfecting HEK293T cells with
the 1.5 µg plasmid of interest together with 2.5 µg pUMVC expressing gag and pol and 1 µg
pCMV-VSV-G expressing the viral envelope protein in a 10 cm plate using the Effectene

33
transfection kit (Qiagen). Virus-containing supernatant was harvested after 48 hours and
filtered using a 0.45 µm PES filter unit.
2.11 Generation of murine AML
To generate AML in mice, viral supernatants were produced by co-transfecting HEK293T
cells with the oncogenic construct and retroviral packaging plasmids. Hematopoietic
progenitor/stem cells (HSCs) were infected with the viral supernatant on two consecutive days
using the RetroNectin-bound virus method of transduction. Non-tissue culture 24-well plates
were initially pre-coated overnight with 30mg/mL RetroNectin at 4 °C and subsequently
washed with PBS and blocked with 2% (v/v) BSA for 30 minutes at 37 °C. After the addition
of 1mL viral supernatant, plates were spun at 2700rpm for 1 hour at 32 °C and finally seeded
with approximately 1 x 10⁶ hematopoietic progenitor/stem cells in supplemented alpha-MEM.
Before injecting transduced cells into C57BL/6J mice, bone marrow aplasia was induced by
total body gamma-irradiation (7.5 Gy). Number of injected cells ranged from 3 x 10⁵ to 5 x 10⁵
cells per mouse in 200 µL PBS. Injected mice were checked twice daily for signs of leukaemia,
which included enlarged spleen, anaemia, hunched posture and lethargy. Upon diagnosis mice
were culled and heart bleed as well as harvest of sternum, liver, spleen and bones of the legs
were performed. Leukemic cells were then obtained from the bone marrow and were
subsequently cultured at 37 °C in IMDM supplemented with 8% FCS and 5 ng/mL IL-3. In
order to test their ability to induce AML in secondary recipients, primary leukemic cells were
injected into C57BL/6J mice at a cell concentration of 5x10⁵ cells/mouse.
2.12 Generation of EVI1 overexpressing murine AML
MLL/AF9-induced AML with EVI1 overexpression was generated using two different
approaches. For the first approach, fetal liver derived hematopoietic progenitor/stem cells
34
were virally transduced with an EVI1 – IRES – GFP construct. Two days after infection, GFP
expressing cells were isolated using a fluorescence assisted cell sorter (BD FACSAria Fusion
cell sorter) and subsequently infected with the MSCV MLL/AF9 – IRES – mCherry construct.
After culturing for two days in supplemented alpha-MEM as described above, infected cells
were injected into lethally gamma-irradiated C57BL/6J mice at a concentration of 5 x 10⁵
cells/mouse in 200 µL PBS. The second approach made use of a doxycycline (dox)-repressible
two vector system developed by J. Zuber et al. (Zuber et al., 2011) where one retroviral vector
encodes for MLL/AF9 linked to dsRED under the control of a tetracycline response element
(TRE) promoter while a second vector expresses EVI1 linked to the Tet-off transactivator
(tTA) and therefore activates TRE expression in a dox-repressible manner. Cells harboring
both constructs can be identified by the detection of dsRed expression. EVI1-expressing
leukemias were generated by retroviral co-transduction of fetal liver derived HSPCs and
injection into lethally irradiated recipient mice.
2.13 SDS PAGE and Western blotting
Protein lysates were prepared by lysing cell pellets e i the r i n 2 x SDS lysis buffer (126
mM Tris-HCL pH 8, 20% glycerol (v/v), 4% SDS (w/v), 0.02% Bromophenol blue (w/v), 5%
ß-mercaptoethanol (v/v)). Lysates were boiled and sonicated or subjected to repeated
freeze/boil cycles. Denatured proteins were separated on a 4 – 15% Criterion TGX precas t
gel (5671085 , Bio Rad) and transferred to a nitrocellulose membrane at 100V for 1
hour at 4°C. Membranes were subsequent l y b locked in PBST wi th 5% milk
powder (w /v ). Probing of the membrane with primary antibody occurred over night at
4°C in PBST with 2% BSA (w/v) and 0.02% NaN3 (v/v). After washing with PBST,
membranes were incubated for an hour in secondary antibody in the presence of 5% milk

35
and subsequently developed with Millipore ECL (WBKLS0) for a na l y s i s with a
Chemidoc Gel Imaging System (Bio Rad).
2.14 Blood analysis
Hematological analysis including complete blood count and leukocyte differential count of
sick mice was performed on cardiac blood of euthanized mice using an ADVIA Hematology
System (Siemens).
2.15 Blood smear
To evaluate cellularity and morphology of leukemic cells present in the peripheral blood,
blood smears were prepared on microscope slides by pipetting 7 µL cardiac blood on the slide
and spreading the drop using another slide as a spreader. After air-drying blood smears were
fixed by placing the slides in a coplin jar containing methanol for one minute. Once dried
slides were taken to histology where May-Grünwald Giemsa stain was performed.
2.16 Cytospin
To evaluate cellularity and morphology of leukemic cells present in the bone marrow, fresh
bone marrow was diluted to a cell concentration of 1 x 10⁵ cells/mL using FCS containing
media. 200 µL cell suspension were loaded into the cytospin sample chamber and cells were
immobilized onto the attached glass slide by spinning the chamber for 5 minutes at 1000 rpm.
Cell suspensions were then allowed to dry at 37 °C before being fixed for one minute in cold
methanol. May-Grünwald Giemsa stain was finally performed in our histology laboratory.
2.17 AML in vitro treatments
To determine how EVI1 expression affects sensitivity of leukemic cells to treatments in vitro,
cell death was measured as a response to cells being treated with AraC (125 – 1000 nM) or
36
Birinapant (125 – 1000 nM) alone or Birinapant (125 – 1000 nM) in combination with
Ralimetinib (LY2228820, 1 µM), Idun (5 µM) or Tariquidar (1 µM). Death assays were
performed in 96-well plates with cell concentrations of 5 x 10⁴ cells/well in 100 µL media and
drugs were added in 100 µL at two times the required final concentration. The resulting cell
death was determined after 24 hours by the addition of propidium iodine at 1 ug/mL and
measuring its uptake via flow cytometry using a CytoFLEX (Beckman Coulter).
2.18 Cell surface marker analysis
Various cell surface markers of leukemic cells were stained for flow cytometry analysis using
rat anti-mouse antibodies coupled to a fluorophore. Master stocks of antibody cocktails were
prepared in FACS buffer (PBS, 5% (v/v) FCS, 5 mM EDTA) containing rat anti-mouse anti-
2.4G2 mAb to prevent unwanted binding to the Fc-region of antibodies. Staining was
performed in 96 well plated with approximately 5 x 10⁵ per well in 50 µL media. After washing
cells in 100 µL FACS buffer, pellets were resuspended in 50 µL antibody cocktail and
incubated for 30 minutes on ice in the dark. Following another wash step, cells were
resuspended in 150 µL FACS buffer containing propidium iodine and analysed via flow
cytometry using an LSRFortessa-X20 analyser (BD). Single stain controls were prepared by
incubating one drop anti-rat beads with 1 µL neat antibody for 15 minutes in the dark. Washed
beads were resuspended in 150 µL FACS buffer and run on the flow cytometer to determine
the required compensations.
2.19 Statistical analysis
Unless stated otherwise, paired parametric t tests were performed for statistical analysis using
GraphPad Prism version 7.0d for Mac OS X (GraphPad Software, La Jolla California USA).

37
2.20 BMDM treatment protocol
BMDMs were seeded in 10 cm plates at a density of 1 x 10⁷ cells per plate in 7 mL DME one
day prior to treatment. For cell death analysis in a 48 well plate, cells were seeded at 1 x 10 5
cells per well. Per biological sample five different conditions were set up: DMSO control, 1.5
hours Compound A (500 nM), 1.5 hours Compound A (500 nM) and LY2228820 (1 µM), 3
hours Compound A (500 nM) and 3 hours Compound A (500 nM) and LY2228820 (1 µM).
Drugs were prepared at 100 times the required final concentration in DME. To terminate
treatment, plates were put on ice, media was aspirated and cells were immediately washed
three times with ice cold PBS. For enrichment with Fe3+-NTA beads, cell lysis was performed
by adding 700 µL hot lysis buffer (5% SDS (w/v), 5 mM TCEP, 10 mM chloroacetamide, 100
mM Tris-HCl pH 7.5, 40 mM NaCl) after which lysates were transferred to tubes and finally
boiled for 10 minutes at 95 °C. Per sample, an aliquot of lysate containing 1 mg protein was
separated and stored at -80 °C until being processed further. When following the EasyPhos
protocol, cells were washed on ice in cold PBS containing a protease inhibitor cocktail (Roche)
and subsequently lysed in lysis buffer (1% (w/v) SDS, 100 mM Tris-Cl pH 7.5, 40 mM NaCl).
Per sample, an aliquot of lysate equivalent to 0.5 mg protein was separated and stored at -80
°C until being processed further.
2.21 Protein quantification via BCA assay
Protein concentrations were determined using a Pierce BCA protein assay kit (23225, Thermo
Fisher). To be compatible with the BCA reagents, cells were lysed in 1% (w/v) SDS. The assay
was performed in accordance with the provided instructions and the resulting colour change
was measured with a Chameleon V Luminescence Plate Reader (425-159, Hidex).

38
2.22 On-bead protein digest using Sera-mag speed beads
Thawed lysates were boiled again at 95°C before being subjected to acid hydrolysis by adding
4 – 5 µL neat trifluoroacetic acid (TFA) to bring the final TFA concentration to 1% (v/v). The
reaction was quenched with an appropriate volume of 3 M Tris pH 10 to achieve a final
concentration of 160 mM Tris and a neutral pH. Lysates were now transferred to a 96-well
deep well plate (95040452, Thermo Fisher) with conical bottom. For on-bead digestion 10 µL
Sera-mag speed (SP3) beads in water were added to each sample followed by an appropriate
volume of acetonitrile to reach a final concentration of 70% (v/v). For incubation, the plate was
placed in a ThermoMixer (Eppendorf) and mixed at 1000 rpm for 20 minutes at room
temperature. To wash the beads, the plate was placed on a magnetic rack allowing the
supernatant to be aspirated without interfering with the magnetic beads. Beads were washed
twice with 200 µL 70% (v/v) ethanol and once with 200 µL neat ACN before being lyophilized
to remove remaining acetonitrile. In the meantime, the digestion buffer (10% (v/v) 2,2,2-
trifluoroethanol (TFE), 100 mM ammonium bicarbonate) containing trypsin and lys-c at an
enzyme to substrate ratio of 1:25 was prepared, meaning that for the digest of 1 mg protein,
20 µg of trypsin and lys-c respectively were used. Dried beads were resuspended in 100 µL
digestion buffer and sonicated for 2 minutes to ensure substrate accessibility. Digest was
performed in the ThermoMixer at 37 °C and 1000 rpm for 1 – 2 hours. To collect the
supernatant containing the peptides, the deep well plate was again placed on a magnetic rack
and samples were transferred into a 96-well PCR plate. Lastly, 50 µL water were added to each
sample before being processed for phospho enrichment.
39
2.23 EasyPhos - Phospho enrichment using TiO2 beads
Phospho enrichment was performed following the EasyPhos protocol (Humphrey et al.,
2015). In a 2 mL deep well plate, 800 µL acetonitrile were transferred to the digested peptides
and mixed in a ThermoMixer for 30 sec at 2000 rpm. To each sample, 150 µL 3.2 M KCl, 55
µL 150 mM KH2PO4 and 95 µL TFA were added before being mixed again for 30 sec at 2,000
x g. To clear minor precipitates, the plate was centrifuged for 15 min at 20,000 x g and
supernatants were transferred to unused wells on the same plate while carefully avoiding the
pellets. To prepare the beads, TiO2 was resuspended in EP loading buffer (80% (v/v)
acetonitrile, 6% (v/v) TFA) at a concentration of 1 mg beads per µL buffer. The amount of
TiO2 beads applied per samples was equivalent to ten times the initial protein concentration (5
mg TiO2 beads for 0.5 mg protein). Equal amounts of beads were transferred to each sample
and the beads/peptides mixtures were subsequently incubated in a ThermoMixer for 5 min at
40 °C and 2,000 x g. Following incubation, the beads were pelleted by centrifugation for 1 min
at 2,000 x g and the supernatant containing non-phosphopeptides was aspirated. Beads were
resuspended in 500 µL EP wash buffer (60% (v/v) acetonitrile, 1% (v/v) TFA), transferred to
new wells that already contained 500 µL EP wash buffer and washed 4 times in 1 mL EP wash
buffer. After washing, beads were resuspended in 75 µL EP transfer buffer (80% (v/v)
acetonitrile, 0.5% (v/v) acetic acid), mixed in the ThermoMixer for 30 sec at 800 x g and
transferred to the top of C8 stage tips. Any remaining beads were captured by washing the
wells with an additional 75 µL which were then also transferred to the C8 stage tips. To bind
the phosphopeptides, tips were centrifuged to dryness (approximately 5 min) at 1,000 x g and
finally eluted twice with 30 µL EP elution buffer (40% (v/v) acetonitrile, 45% (v/v) MilliQ H2O,
3.75% (v/v) NH4OH) into 1.5 mL tubes for 3 min at 1,000 x g. Eluates were immediately dried
using a vacuum concentrator (SpeedVac, Eppendorf) for 15 min at 45 °C. In the meantime,

40
SDBRPS stage tips were equilibrated by successive washing with (a) 100 µL acetonitrile, (b)
100 µL 30% (v/v) methanol/1% (v/v) TFA and (c) 100 µL 0.2% (v/v) TFA for 1 min at 1,000 x
g. Following vacuum concentration, 10 µL 10% TFA were immediately added to each sample
before being transferred to the equilibrated SDBRPS stage tips in 100 µL SDBRPS wash
buffer (0.2% (v/v) TFA. Tips were washed twice for 5 min at 1,000 x g and phosphopeptides
were finally eluted into clean 1.5 mL tubes using 60 µL SDBRPS elution buffer (80% (v/v)
acetonitrile, 15% (v/v) MilliQ H2O, 1.25% (v/v) NH4OH) by spinning the tips down for 5 min
at 1,000 g. Peptides were dried in the vacuum concentrator for 35 min at 45 °C before being
resuspended in 6 µL MS loading buffer (2% (v/v) acetonitrile, 1% (v/v) formic acid on Milli-Q
water). MS spectra were acquired between a mass range of 200–2000 m/z. Raw files consisting
of high-resolution MS/MS spectra were processed with MaxQuant (version 1.5.8.3) (Cox et
al., 2008) for feature detection and protein identification using the Andromeda search engine
2. Extracted peak lists were searched against the UniProtKB/Swiss-Prot Homo sapiens
(October 2016) and a separate reverse decoy database to empirically assess the false discovery
rate (FDR) using strict trypsin specificity allowing up to 2 missed cleavages. The minimum
required peptide length was set to 7 amino acids. In the main search, precursor mass tolerance
was 0.006 Da and fragment mass tolerance was 40 ppm.
2.24 Statistics of phosphoproteomics analysis
Potential contaminant and reverse entries were removed. The data was reshaped from a long
format to a wide one such that each row corresponds to a unique modified sequence and
charge combination, and each column to a sample. Duplicate instances of any unique
modified sequence and charge combination corresponding to the same sample were
aggregated by summing over the respective intensities. Peptides that were detected in at least

41
6 samples were retained while the rest were filtered out, leaving 5121 peptides for downstream
analysis. Quantile normalization was subsequently applied to the data. A linear model
incorporating sample quality weights was fitted for each peptide using the lmFit and
arrayWeights functions of the limma package (Ritchie, M. E., et al., 2015) in R version 3.6.0
(R Core Team, 2019). Moderated t-statistics were then computed using robust empirical Bayes
moderated t-statistics with a trended prior variance (Phipson, B., et al., 2016) to test for
differential phosphorylation. P-values were adjusted to control for false discovery rate (FDR)
using the Benjamini and Hochberg method. A peptide was classified as differentially
phosphorylated if the adjusted p-value was less than 0.1. Volcano plots, mean-difference plots
and heatmaps were produced using limma’s volcanoplot, plotMD and coolmap functions
respectively. Pathway analyses were carried out on differentially phosphorylated peptides in
order to test for overrepresentation of biological pathways as defined by Gene Ontology
(Ashburner, M., et al., 2000), The Gene Ontology Consortium, 2017), KEGG (Kanehisa, M.
and S. Goto, 2000; Kanehisa, M., et al., 2015; Kanehisa, M., et al., 2016 )and Reactome
(Fabregat, A., et al., 2018) using the goana and kegga functions in limma. Visualizations of
KEGG pathways were produced using the pathview package (Luo, W. and C. Brouwer, 2013).
2.25 CSF1R inhibitor treatment of BMDMs
BMDMs were seeded in a 24well plate at a density of 5 x 10⁴ cells per plate in 1 mL DME +
10% L929 one day prior to treatment. Cells were treated with Compound A (50, 100 or 500
nM) alone or in combination with LY2228820 (p38i, 1 µM) or AFS-98 (CSF1Ri, 33nM) for 6
or 24 hours. Controls were treated with DME 0.2% (v/v) DMSO. Supernatant and cells were
harvested, centrifuged for 5 minutes at 500 g and resuspended in PBS containing PI (100
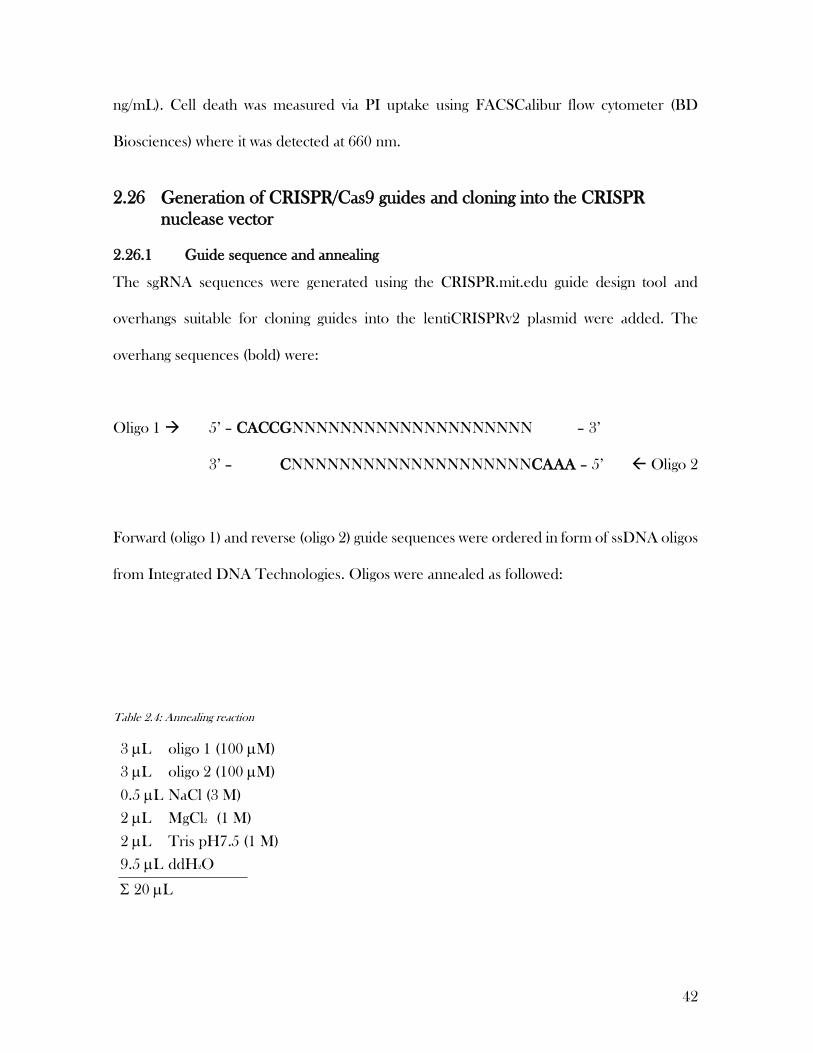
42
ng/mL). Cell death was measured via PI uptake using FACSCalibur flow cytometer (BD
Biosciences) where it was detected at 660 nm.
2.26 Generation of CRISPR/Cas9 guides and cloning into the CRISPR
nuclease vector
2.26.1 Guide sequence and annealing
The sgRNA sequences were generated using the CRISPR.mit.edu guide design tool and
overhangs suitable for cloning guides into the lentiCRISPRv2 plasmid were added. The
overhang sequences (bold) were:
Oligo 1 → 5’ – CACCGNNNNNNNNNNNNNNNNNNNN – 3’
3’ – CNNNNNNNNNNNNNNNNNNNNCAAA – 5’ Oligo 2
Forward (oligo 1) and reverse (oligo 2) guide sequences were ordered in form of ssDNA oligos
from Integrated DNA Technologies. Oligos were annealed as followed:
Table 2.4: Annealing reaction
3 L oligo 1 (100 M)
3 L oligo 2 (100 M)
0.5 L NaCl (3 M)
2 L MgCl2 (1 M)
2 L Tris pH7.5 (1 M)
9.5 L ddH2O
20 L
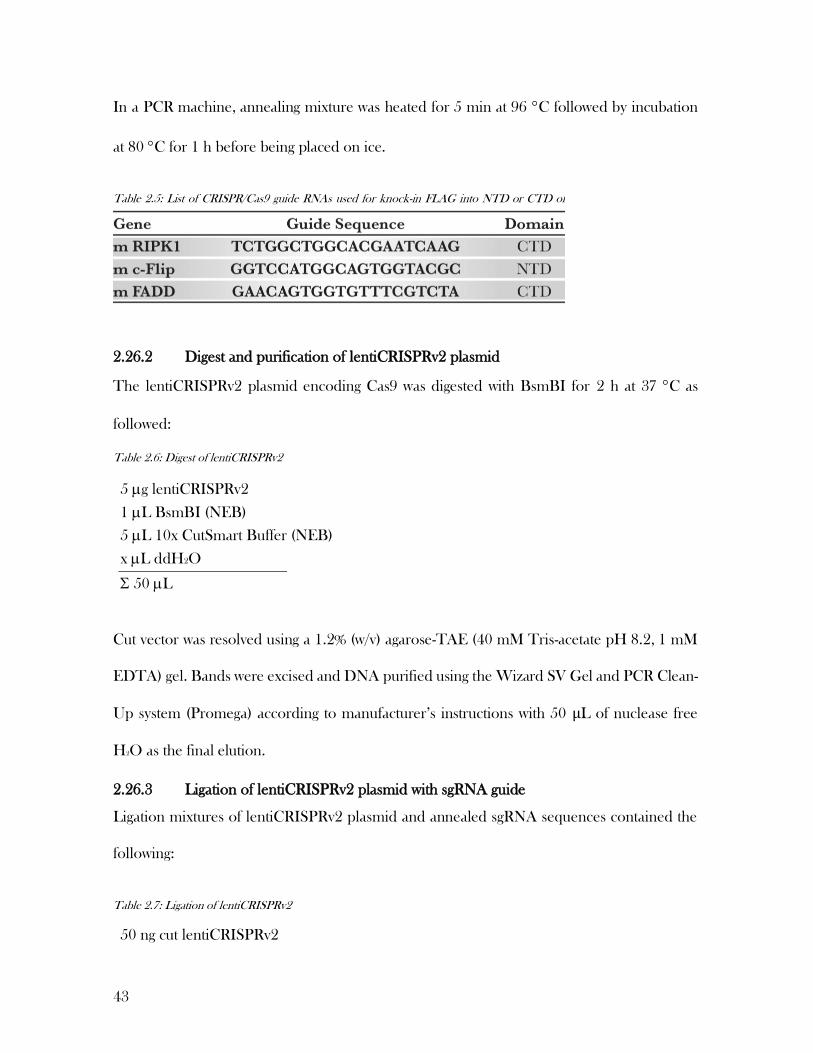
43
In a PCR machine, annealing mixture was heated for 5 min at 96 C followed by incubation
at 80 C for 1 h before being placed on ice.
2.26.2 Digest and purification of lentiCRISPRv2 plasmid
The lentiCRISPRv2 plasmid encoding Cas9 was digested with BsmBI for 2 h at 37 C as
followed:
Table 2.6: Digest of lentiCRISPRv2
5 g lentiCRISPRv2
1 L BsmBI (NEB)
5 L 10x CutSmart Buffer (NEB)
x L ddH2O
50 L
Cut vector was resolved using a 1.2% (w/v) agarose-TAE (40 mM Tris-acetate pH 8.2, 1 mM
EDTA) gel. Bands were excised and DNA purified using the Wizard SV Gel and PCR Clean-
Up system (Promega) according to manufacturer’s instructions with 50 μL of nuclease free
H2O as the final elution.
2.26.3 Ligation of lentiCRISPRv2 plasmid with sgRNA guide
Ligation mixtures of lentiCRISPRv2 plasmid and annealed sgRNA sequences contained the
following:
Table 2.7: Ligation of lentiCRISPRv2
50 ng cut lentiCRISPRv2
Table 2.5: List of CRISPR/Cas9 guide RNAs used for knock-in FLAG into NTD or CTD of target genes

44
3 L annealed, diluted oligos (1/1000)
0.8 L T4 ligase (Promega)
1 L 10x T4 ligation buffer
x L ddH2O
10 L
Ligation mixture was incubated at RT overnight. Generated lentiCRISPRv2 plasmid
containing Cas9 and sgRNA was amplified by bacterial transformation as described in 2.5.
Plasmids were then prepped (2.6) and sequenced (2.7).
2.27 Generating HDR knock-in template
The HDR knock-in templates consisted of ssDNA oligos of approximately 200 bp and were
designed for each individual gene where they targeted either the N- or C-terminus. HDR
templates contained the FLAG sequence (see figure 2.8) which was flanked by gene-specific
homology arms of approximately 80 bp. To prevent Cas9 from cutting the inserted sequence,
the PAM sequences in the templates were silently mutated where possible.
2.28 Generation CRISPR/Cas9 knock-out cell lines
CRISPR/Cas9 guide efficiencies were determined by testing their ability to generate gene
knock-outs in MDFs. To do so, cells were virally transduced with the generated
Table 2.8: RIPK1 CTD HDR template sequence

45
lentiCRISPRv2 plasmids to stably express Cas9 and sgRNA. For lentivirus production,
HEK293T cells were transfected with 1 µg pVSV-G (envelope protein expression1.5 ug
pCMVΔR8.2 (HIV Pol – reverse transcriptase, Tat – amplifies transcription of viral RNA, Rev
– increases transport of viral RNA into cytoplasm, Gag – capsid proteins) and 2.5 g of the
plasmid of interest using an Effectene transfection kit (Qiagen). Media was replaced after 24 h
and virus was harvested two days post transfection. Supernatant was filtered and supplemented
with polybrene (4 µg/ml). For infection, viral media was added to cells and after two days of
incubation, successfully infected cells were selected by addition of puromycin (1 µg/ml).
2.29 CRISPR/Cas9-mediated FLAG knock-in
To generate gene-specific FLAG-knock-in in MDFs, cells were seeded at 2 x 10⁵ cells in a 24-
well plate. The following day, the appropriate mix of lentiCRISPRv2 plasmid and FLAG-
containing ssDNA HDR template were delivered into cells at a ratio of 1:5 via transfection
using Lipofectamine 3000. To increase HDR efficiency, cells were also treated with 0.1 µM
SCR7 for 2 days. 24 h after transfection, successfully transfected MDFs were selected by the
addition of puromycin (1 µg/ml) for 2 days. One-week post transfection, DNA was extracted
from a fraction of the cells using a Qiagen DNA extraction kit to test for the presence of the
FLAG tag via PCR.
2.30 Detection of FLAG insert via PCR
To determine whether the FLAG-tag was knocked-in successfully a PCR reaction was
performed using SYBR Green (ThermoFisher). Genomic DNA was isolated from cells by
pelleting 1 x 10⁵ cells and digesting them in 100 μL DirectPCR Lysis Reagent (Viagen Biotech)
with 0.4 μL Proteinase K (Sigma-Aldrich-Aldrich) at 56°C, with shaking for 3 hours. Proteinase
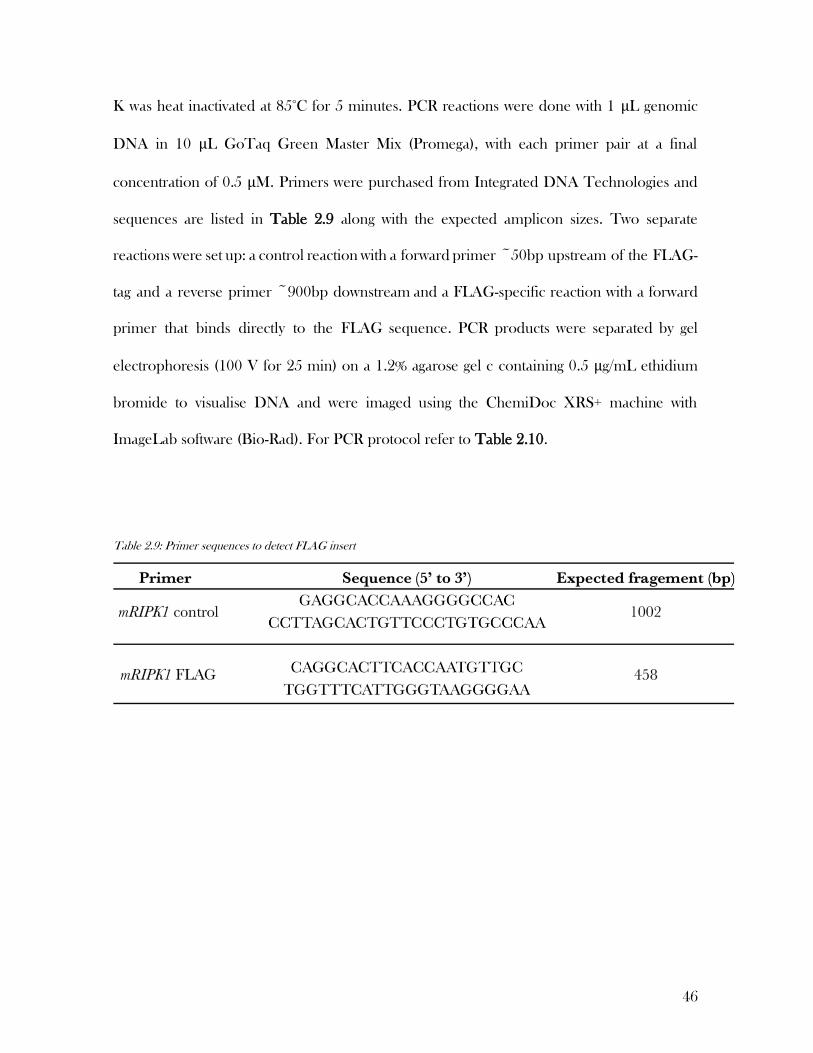
46
K was heat inactivated at 85°C for 5 minutes. PCR reactions were done with 1 μL genomic
DNA in 10 μL GoTaq Green Master Mix (Promega), with each primer pair at a final
concentration of 0.5 μM. Primers were purchased from Integrated DNA Technologies and
sequences are listed in Table 2.9 along with the expected amplicon sizes. Two separate
reactions were set up: a control reaction with a forward primer ~50bp upstream of the FLAG-
tag and a reverse primer ~900bp downstream and a FLAG-specific reaction with a forward
primer that binds directly to the FLAG sequence. PCR products were separated by gel
electrophoresis (100 V for 25 min) on a 1.2% agarose gel c containing 0.5 μg/mL ethidium
bromide to visualise DNA and were imaged using the ChemiDoc XRS+ machine with
ImageLab software (Bio-Rad). For PCR protocol refer to Table 2.10.
Table 2.9: Primer sequences to detect FLAG insert
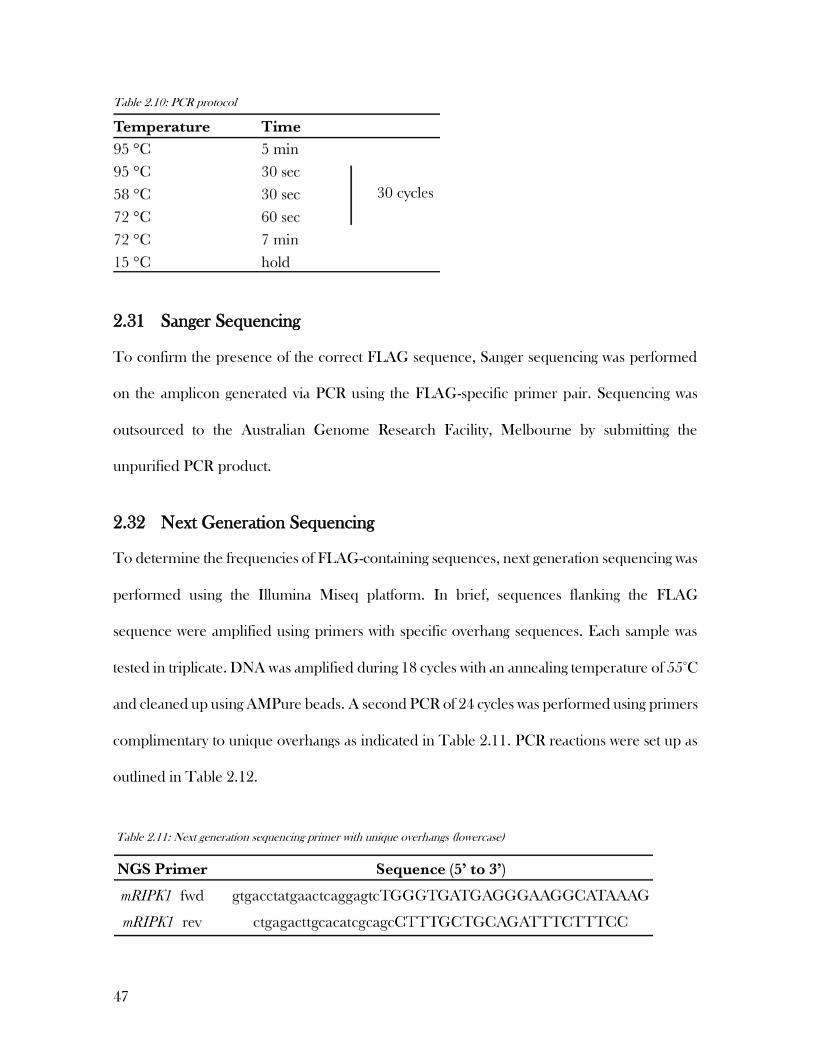
47
2.31 Sanger Sequencing
To confirm the presence of the correct FLAG sequence, Sanger sequencing was performed
on the amplicon generated via PCR using the FLAG-specific primer pair. Sequencing was
outsourced to the Australian Genome Research Facility, Melbourne by submitting the
unpurified PCR product.
2.32 Next Generation Sequencing
To determine the frequencies of FLAG-containing sequences, next generation sequencing was
performed using the Illumina Miseq platform. In brief, sequences flanking the FLAG
sequence were amplified using primers with specific overhang sequences. Each sample was
tested in triplicate. DNA was amplified during 18 cycles with an annealing temperature of 55°C
and cleaned up using AMPure beads. A second PCR of 24 cycles was performed using primers
complimentary to unique overhangs as indicated in Table 2.11. PCR reactions were set up as
outlined in Table 2.12.
Table 2.10: PCR protocol
Table 2.11: Next generation sequencing primer with unique overhangs (lowercase)

48
Table 2.12: PCR for next generation sequencing
1 L DNA (100ng/L)
10 L GoTaq Green
0.5 L fwd primer (10 M)
0.5 L rev primer (10 M)
8 L ddH2O
20 L
2.33 FLAG pulldown and mass spectrometry analysis
To precipitate FLAG-tagged protein, M2 anti-FLAG conjugated sepharose beads (Sigma)
were prepared by washing 30 μL beads per sample (50 % slurry) three times with ddH2O
before being resuspended in DISC DISC (1% TritonX-100, 150 mM NaCl, 20 mM Tris, pH
7.5, 10% glycerol, 2 mM EDTA) lysis buffer to make it 50% slurry. 1 x 10⁷ cells were digested
in 0.5 mL lysis buffer supplemented with Complete Protease Inhibitor Cocktail (Roche),
phosphatase inhibitors and 25 nM NEM for 20 minutes on ice. Lysates were clarified by
centrifugation at 17000 g and 4 ˚C for 15 minutes and subsequently applied to anti-FLAG
conjugated beads. Incubation occurred at 4 ˚C for 2 hours while rotating. Beads were finally
washed 3 times in 1 mL lysis buffer for 15 minutes while rotating with the last wash being
performed in TBS. Proteins were eluted twice in 50 μL 3x FLAG peptide (500 μg/mL) in
TBS pH 7.4 for 5 minutes at RT on a shaker. Eluted proteins were digested with trypsin using
filter aided sample preparation (FASP) (Wiśniewski, J. R., et al., 2009). In brief: samples were
transferred to 8 M urea, 100 mM Tris-HCl pH 7.4 then reduced using 10 mM TCEP for 20
minutes. Cysteine residues were alkylated using 50 mM iodoacetamine in 8 M urea, 100 mM
Tris-HCl pH 7.4 and incubated, protected from light for 20 minutes. Samples were then
digested using 1 μg trypsin in 50 mM ammonium bicarbonate solution and incubated for 16
hours at 37˚C. Peptides were collected into ammonium bicarbonate and acidified using 1%

49
formic acid before lyophilisation. Samples were reconstituted in 2% acetonitrile and 1% formic
acid in Milli-Q water and analysed by nanoflow reverse-phase LC-MS/MS by Jarrod Sandow
at the Walter and Eliza Hall Institute.
50
3 Generating a clinically relevant AML mouse model by
expressing EVI1 with MLL/AF9 in vivo
3.1 Generation of the MLL-AF9/EVI1 mouse model
To induce acute myeloid leukemia (AML) in mice, we retrovirally transduced fetal liver cells
derived from E14 embryos, which at that stage harbor the hematopoietic system, with the
oncogenic fusion protein MLL-AF9. Using the expression system generated by Zuber (Zuber
et al., 2009), we were able to track the expression of the oncoprotein by measuring the
presence of the fluorescent protein mCherry via flow cytometry (Figures 3.1 & 3.2). To
generate the MLL-AF9/EVI1 mouse model, we co-infected fetal liver cells with an EVI1
construct that we acquired from the lab of Takahiro Nakamaru at the Cancer Institute in
Tokyo, who showed that the co-expression of EVI1 together with the fusion-oncoprotein
Hoxa9-Meis1 accelerated the onset of AML from 250 to 150 days (Jin et al., 2007). Using this
expression construct allowed us to detect EVI1 by measuring the expression of the fluorescent
protein GFP via flow cytometry (Figure 3.1 B). Additionally, EVI1 was FLAG-tagged allowing
the detection of the protein by western blot since an anti-EVI antibody that was purchased did
not generate a specific signal (Figures 3.3 – 3.6). Although the presence of a FLAG-tag may
alter protein function, this construct has been successfully applied in previous studies,
indicating that it expresses a functional version of EVI1. Furthermore, the ability of FLAG-
EVI1 to induce MDS-like symptoms was tested during in vivo experiments were fetal liver
cells were transduced with only FLAG-EVI. These experiments will be able to confirm the
proteins functionality.
Transduced fetal liver cells were injected into the tail veins of lethally irradiated C57BL/6 mice
where they repopulated the bone marrow and, after a latency of 40-60 days, caused the
formation of leukemic blasts. When diseased mice exhibited AML-related symptoms such as

51
hind limb paralysis, they were euthanized and the leukemic cells were harvested from the bone
marrow. To determine if EVI1 was expressed in AMLs, GFP expression was determined via
flow cytometry, while MLL-AF9 expression was detectable by measuring mCherry levels
(Figure 3.3 – 3.6). The disease phenotypes were established by analyzing the infiltration of
leukemic cells into the spleen, liver and blood as well as the bone marrow which harbors most
of the leukemic blasts (Figure 3.7). The morphology of leukemic cells was evaluated by staining
blood smears and cytospin slides of the bone marrow with May-Gruenwald Giemsa (Figure
3.8). In addition, leukemic cells were collected from the bone marrow of femur and tibia and
subsequently cultured in the presence of IL-3. Culturing AML cells in vitro allowed us to
further characterize the immuno-phenotype of these cells. To do that, a number of
hematopoietic surface markers were fluorescently stained using antibodies and their
expressions was detected using flow cytometry (Figure 3.10). Furthermore, we were able to
determine the response of AML cells to various anti-leukemic drugs and drug combinations
by measuring via uptake of propidium iodide (Figure 3.11).
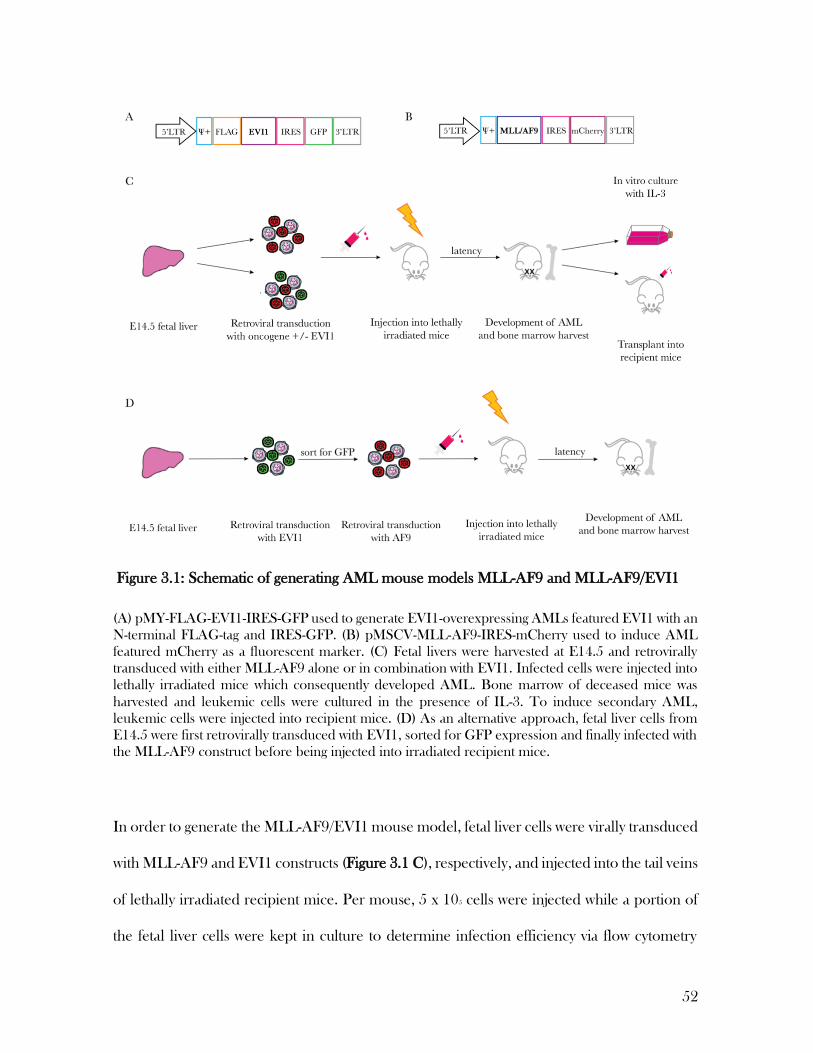
52
(A) pMY-FLAG-EVI1-IRES-GFP used to generate EVI1-overexpressing AMLs featured EVI1 with an
N-terminal FLAG-tag and IRES-GFP. (B) pMSCV-MLL-AF9-IRES-mCherry used to induce AML
featured mCherry as a fluorescent marker. (C) Fetal livers were harvested at E14.5 and retrovirally
transduced with either MLL-AF9 alone or in combination with EVI1. Infected cells were injected into
lethally irradiated mice which consequently developed AML. Bone marrow of deceased mice was
harvested and leukemic cells were cultured in the presence of IL-3. To induce secondary AML,
leukemic cells were injected into recipient mice. (D) As an alternative approach, fetal liver cells from
E14.5 were first retrovirally transduced with EVI1, sorted for GFP expression and finally infected with
the MLL-AF9 construct before being injected into irradiated recipient mice.
In order to generate the MLL-AF9/EVI1 mouse model, fetal liver cells were virally transduced
with MLL-AF9 and EVI1 constructs (Figure 3.1 C), respectively, and injected into the tail veins
of lethally irradiated recipient mice. Per mouse, 5 x 10⁵ cells were injected while a portion of
the fetal liver cells were kept in culture to determine infection efficiency via flow cytometry
Figure 3.1: Schematic of generating AML mouse models MLL-AF9 and MLL-AF9/EVI1
53
(Figure 3.2). For each experiment, three mice were injected with MLL-AF9 infected fetal liver
cells while for the combination of MLL-AF9 and EVI1 this number was increased to six after
the initial in vivo experiment. Furthermore, three mice injected with cells transduced with
EVI1 only served as a positive control for the construct, as high EVI1 expression in the
hematopoietic system has been demonstrated to induce myelodysplastic syndrome (MDS) or
MDS-like symptoms (K. Xu et al., 1999).
3.2 Co-expression of MLL-AF9 and EVI1 was detectable in transduced fetal
liver cells in vitro
After culturing transduced fetal liver cells in cytokine containing media (SCF, IL-6, TPO and
Flt3), an enrichment for mCherry-expressing cells could be observed (Figure 3.2). This was
expected since the expression of MLL-AF9 transforms cells, conferring a proliferative
advantage to those cells. In the first week of culture, GFP (a surrogate for EVI1) expression
was only detected in approximately 4% of cells while about 3.5% of those were mCherry/GFP
double positives (Figure 3.2, bottom panel). While this low number of doubly infected cells
may indicate that cells were preferably infected once, it also suggests that EVI expression did
not provide a proliferative advantage to MLL-AF9-expressing cells. Cells infected with EVI1
(GFP) only, did not grow in culture, while MLL-AF9 (mCherry) positive cells proliferated.
The expansion of a population that expresses very high levels of mCherry, again emphasizes
the proliferative advantage MLL-AF9 expression confers to cells. Moreover, after three weeks
in culture, only a population of double positive cells that expressed high levels of EVI1 was
visible (Figure 3.2, bottom panel). This is evident when comparing the FACS results of week
2 where 16% of the cells were positive for both the oncogene and EVI1 while one week later

54
this population was reduced suggesting that EVI1 did not appear to further increase cell
proliferation in vitro.
Following injection into mice, a proportion of fetal liver cells virally transduced with MLL-AF9 and
EVI1 at a ratio of 1:4 were kept in culture in the presence of TPO, SCF, IL-6 and Flt3 to determine
infection efficiency via flow cytometry over the course of three weeks. mCherry expression indicated
MLL-AF9 levels while GFP reflected EVI1 expression. MLL-AF9 and MLL-AF9/EVI1 leukemic cells
derived from mice were used as negative and positive controls, respectively (top panel).
3.3 EVI1-expressing MLL-AF9 AMLs were successfully generated using
multiple approaches
As stated previously, in human AML patients, EVI1 expression is a marker for poor prognosis.
We therefore hypothesized, that the co-expression of EVI1 together with the oncogene MLL-
Figure 3.2: FACS of retrovirally transduced HSCs-containing fetal liver cells

55
AF9 in mice, may accelerate leukemogenesis leading to a quicker disease onset in mice. Since
EVI1 expression should give MLL-AF9-expressing cells an additional proliferative advantage,
infecting cells with the two constructs at a 1:1 ratio should be sufficient to generate AMLs that
are positive for MLL-AF9 and EVI1. During the initial in vivo experiment, fetal liver cells were
therefore infected with equal volumes of virus expressing MLL-AF9 or EVI1. Out of the three
mice that were injected with cells virally transduced with both constructs, leukemic cells from
two mice expressed only mCherry while leukemic cells from the third mouse were positive for
both mCherry and GFP (Figure 3.3 A). Despite the expression of GFP, EVI1 expression could
not be detected neither by through Western blotting (Figure 3.3 B) nor by PCR (data not
shown). Cells expressing the oncogene MLL-AF9 already have a selection advantage. To
increase the chances of generating EVI1 positive leukemias, fetal liver cells would need to be
infected with larger amounts of the EVI1-encoding virus compared to virus encoding the
oncogene.
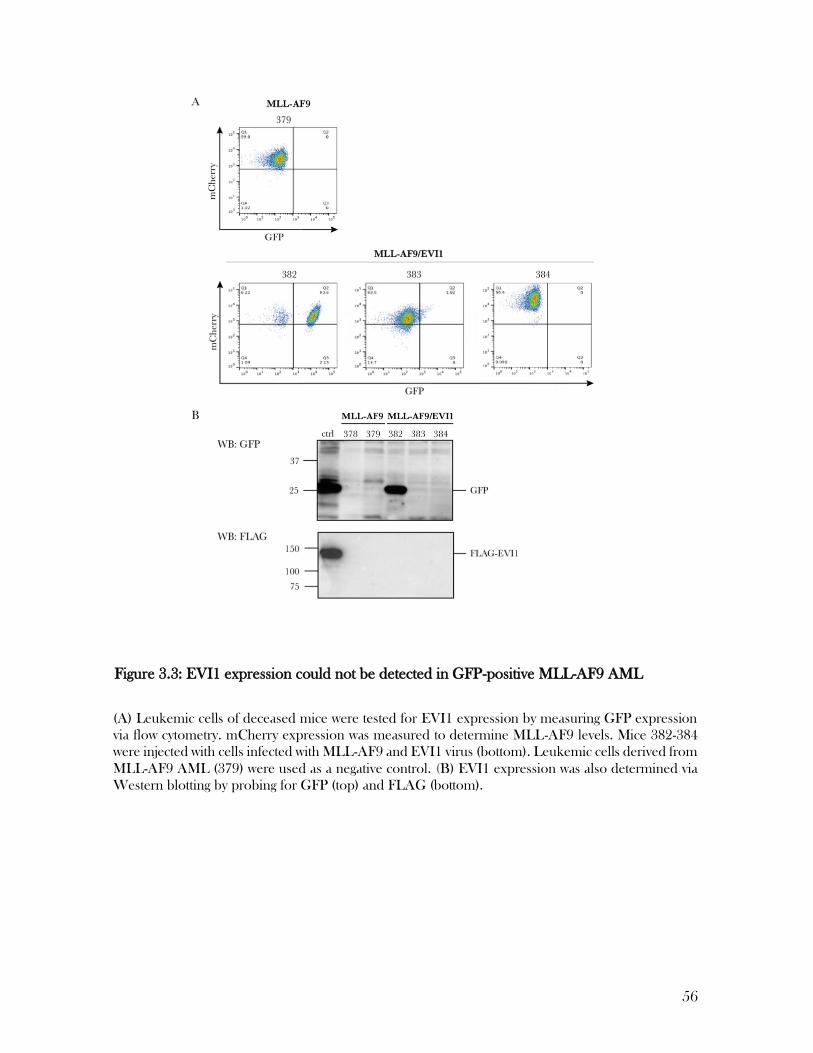
56
(A) Leukemic cells of deceased mice were tested for EVI1 expression by measuring GFP expression
via flow cytometry. mCherry expression was measured to determine MLL-AF9 levels. Mice 382-384
were injected with cells infected with MLL-AF9 and EVI1 virus (bottom). Leukemic cells derived from
MLL-AF9 AML (379) were used as a negative control. (B) EVI1 expression was also determined via
Western blotting by probing for GFP (top) and FLAG (bottom).
Figure 3.3: EVI1 expression could not be detected in GFP-positive MLL-AF9 AML
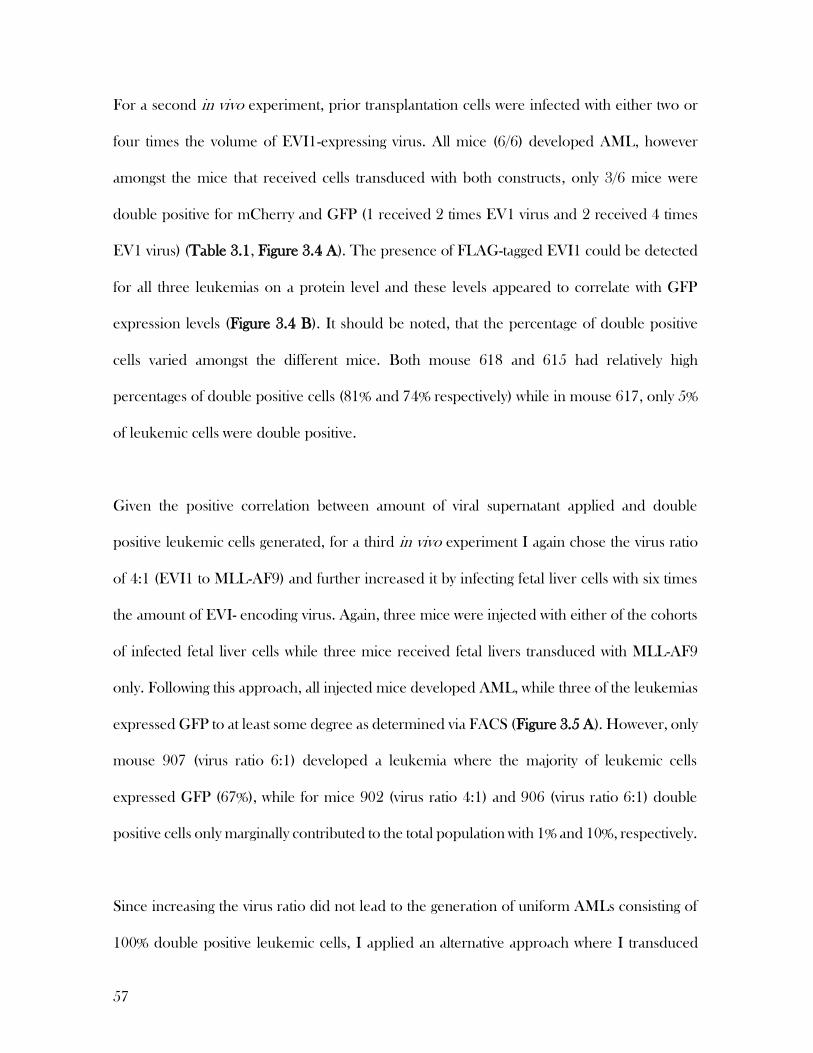
57
For a second in vivo experiment, prior transplantation cells were infected with either two or
four times the volume of EVI1-expressing virus. All mice (6/6) developed AML, however
amongst the mice that received cells transduced with both constructs, only 3/6 mice were
double positive for mCherry and GFP (1 received 2 times EV1 virus and 2 received 4 times
EV1 virus) (Table 3.1, Figure 3.4 A). The presence of FLAG-tagged EVI1 could be detected
for all three leukemias on a protein level and these levels appeared to correlate with GFP
expression levels (Figure 3.4 B). It should be noted, that the percentage of double positive
cells varied amongst the different mice. Both mouse 618 and 615 had relatively high
percentages of double positive cells (81% and 74% respectively) while in mouse 617, only 5%
of leukemic cells were double positive.
Given the positive correlation between amount of viral supernatant applied and double
positive leukemic cells generated, for a third in vivo experiment I again chose the virus ratio
of 4:1 (EVI1 to MLL-AF9) and further increased it by infecting fetal liver cells with six times
the amount of EVI- encoding virus. Again, three mice were injected with either of the cohorts
of infected fetal liver cells while three mice received fetal livers transduced with MLL-AF9
only. Following this approach, all injected mice developed AML, while three of the leukemias
expressed GFP to at least some degree as determined via FACS (Figure 3.5 A). However, only
mouse 907 (virus ratio 6:1) developed a leukemia where the majority of leukemic cells
expressed GFP (67%), while for mice 902 (virus ratio 4:1) and 906 (virus ratio 6:1) double
positive cells only marginally contributed to the total population with 1% and 10%, respectively.
Since increasing the virus ratio did not lead to the generation of uniform AMLs consisting of
100% double positive leukemic cells, I applied an alternative approach where I transduced
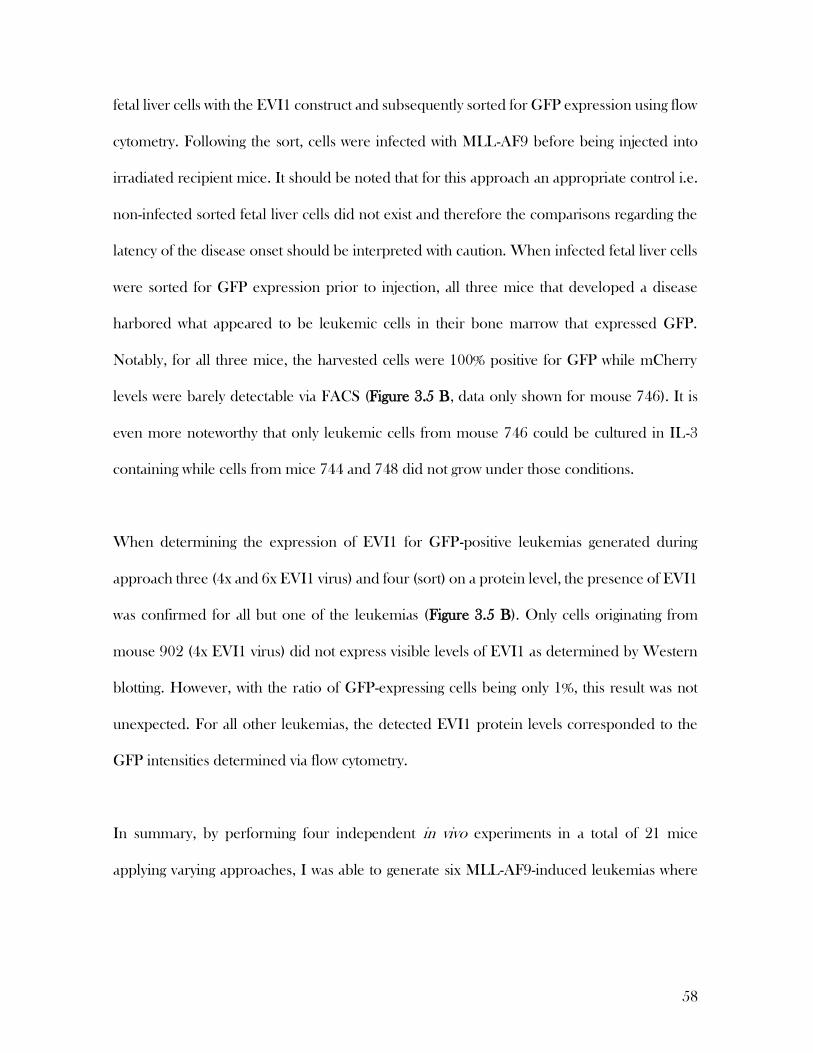
58
fetal liver cells with the EVI1 construct and subsequently sorted for GFP expression using flow
cytometry. Following the sort, cells were infected with MLL-AF9 before being injected into
irradiated recipient mice. It should be noted that for this approach an appropriate control i.e.
non-infected sorted fetal liver cells did not exist and therefore the comparisons regarding the
latency of the disease onset should be interpreted with caution. When infected fetal liver cells
were sorted for GFP expression prior to injection, all three mice that developed a disease
harbored what appeared to be leukemic cells in their bone marrow that expressed GFP.
Notably, for all three mice, the harvested cells were 100% positive for GFP while mCherry
levels were barely detectable via FACS (Figure 3.5 B, data only shown for mouse 746). It is
even more noteworthy that only leukemic cells from mouse 746 could be cultured in IL-3
containing while cells from mice 744 and 748 did not grow under those conditions.
When determining the expression of EVI1 for GFP-positive leukemias generated during
approach three (4x and 6x EVI1 virus) and four (sort) on a protein level, the presence of EVI1
was confirmed for all but one of the leukemias (Figure 3.5 B). Only cells originating from
mouse 902 (4x EVI1 virus) did not express visible levels of EVI1 as determined by Western
blotting. However, with the ratio of GFP-expressing cells being only 1%, this result was not
unexpected. For all other leukemias, the detected EVI1 protein levels corresponded to the
GFP intensities determined via flow cytometry.
In summary, by performing four independent in vivo experiments in a total of 21 mice
applying varying approaches, I was able to generate six MLL-AF9-induced leukemias where
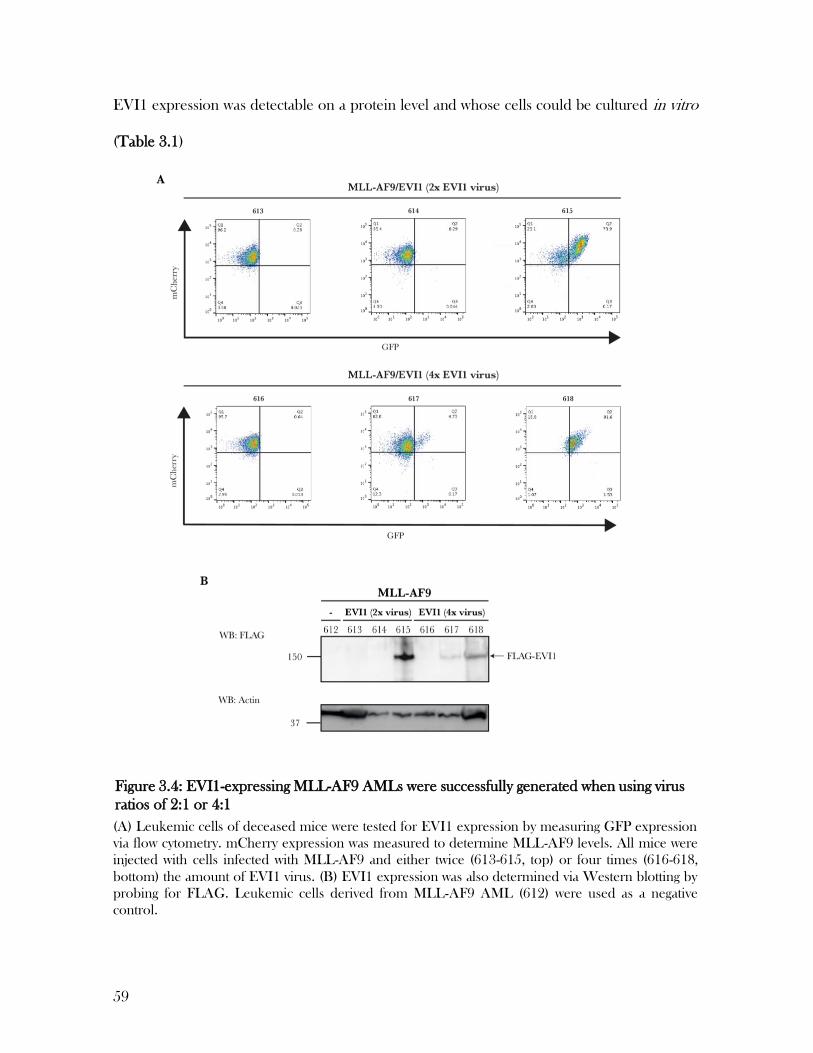
59
EVI1 expression was detectable on a protein level and whose cells could be cultured in vitro
(Table 3.1)
(A) Leukemic cells of deceased mice were tested for EVI1 expression by measuring GFP expression
via flow cytometry. mCherry expression was measured to determine MLL-AF9 levels. All mice were
injected with cells infected with MLL-AF9 and either twice (613-615, top) or four times (616-618,
bottom) the amount of EVI1 virus. (B) EVI1 expression was also determined via Western blotting by
probing for FLAG. Leukemic cells derived from MLL-AF9 AML (612) were used as a negative
control.
Figure 3.4: EVI1-expressing MLL-AF9 AMLs were successfully generated when using virus
ratios of 2:1 or 4:1
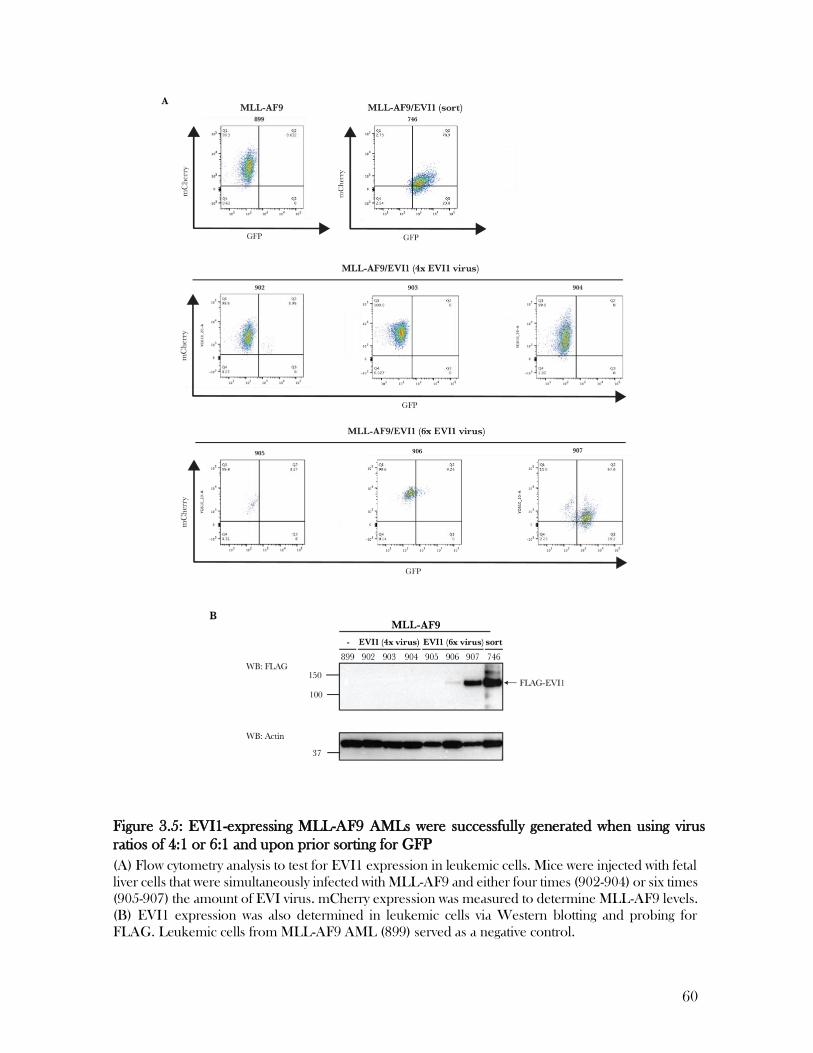
60
(A) Flow cytometry analysis to test for EVI1 expression in leukemic cells. Mice were injected with fetal
liver cells that were simultaneously infected with MLL-AF9 and either four times (902-904) or six times
(905-907) the amount of EVI virus. mCherry expression was measured to determine MLL-AF9 levels.
(B) EVI1 expression was also determined in leukemic cells via Western blotting and probing for
FLAG. Leukemic cells from MLL-AF9 AML (899) served as a negative control.
Figure 3.5: EVI1-expressing MLL-AF9 AMLs were successfully generated when using virus
ratios of 4:1 or 6:1 and upon prior sorting for GFP
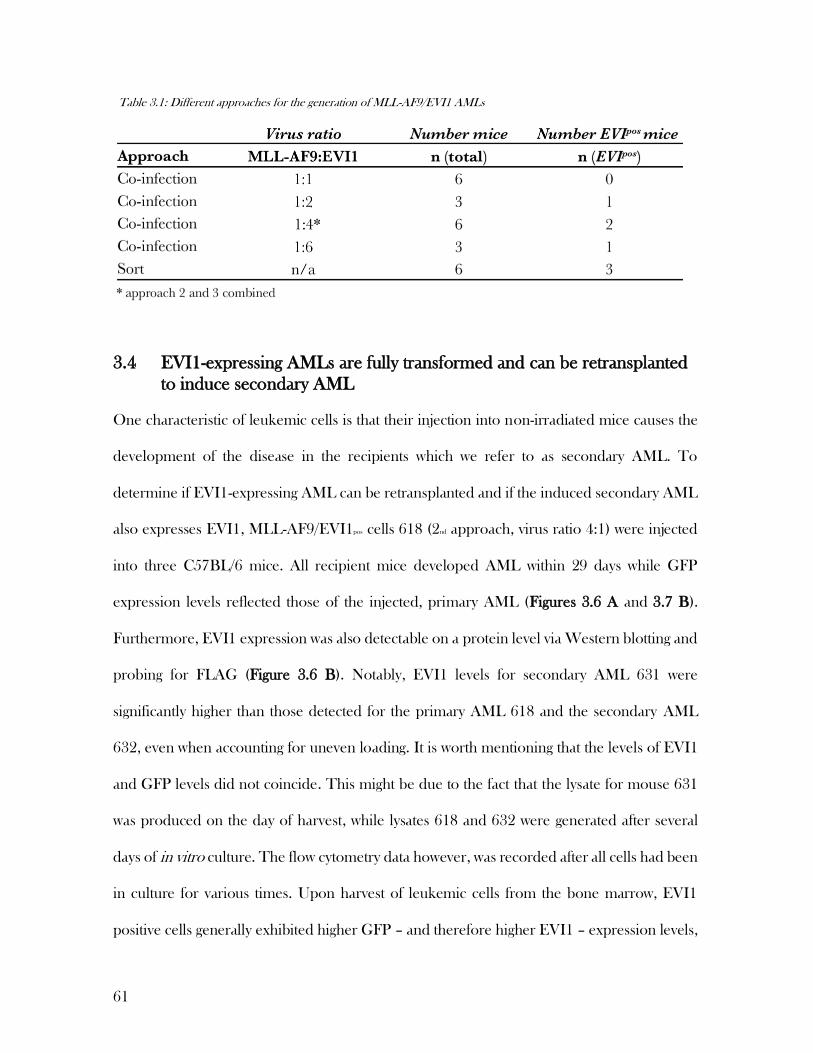
61
3.4 EVI1-expressing AMLs are fully transformed and can be retransplanted
to induce secondary AML
One characteristic of leukemic cells is that their injection into non-irradiated mice causes the
development of the disease in the recipients which we refer to as secondary AML. To
determine if EVI1-expressing AML can be retransplanted and if the induced secondary AML
also expresses EVI1, MLL-AF9/EVI1pos cells 618 (2nd approach, virus ratio 4:1) were injected
into three C57BL/6 mice. All recipient mice developed AML within 29 days while GFP
expression levels reflected those of the injected, primary AML (Figures 3.6 A and 3.7 B).
Furthermore, EVI1 expression was also detectable on a protein level via Western blotting and
probing for FLAG (Figure 3.6 B). Notably, EVI1 levels for secondary AML 631 were
significantly higher than those detected for the primary AML 618 and the secondary AML
632, even when accounting for uneven loading. It is worth mentioning that the levels of EVI1
and GFP levels did not coincide. This might be due to the fact that the lysate for mouse 631
was produced on the day of harvest, while lysates 618 and 632 were generated after several
days of in vitro culture. The flow cytometry data however, was recorded after all cells had been
in culture for various times. Upon harvest of leukemic cells from the bone marrow, EVI1
positive cells generally exhibited higher GFP – and therefore higher EVI1 – expression levels,
Table 3.1: Different approaches for the generation of MLL-AF9/EVI1 AMLs
62
which dropped after cells were exposed to in vitro culturing conditions. One can only speculate
about the reasons behind the sudden reduction in EVI1 expression but it is possible that other
cytokines than IL-3 would be required to maintain expression levels that were achieved under
physiological conditions. Another possible mechanism is that cells may actively repress EVI1
expression which would also offer an explanation for the difficulties I faced when aiming to
generate EVI1-expressing leukemias. Since primary MLL-AF9/EVI1 AML was able to induce
secondary AML upon being retransplanted while EVI1 expression was maintained, I
concluded that the generated MLL-AF9/EVI1 double positive cells were in fact fully
transformed leukemic cells.
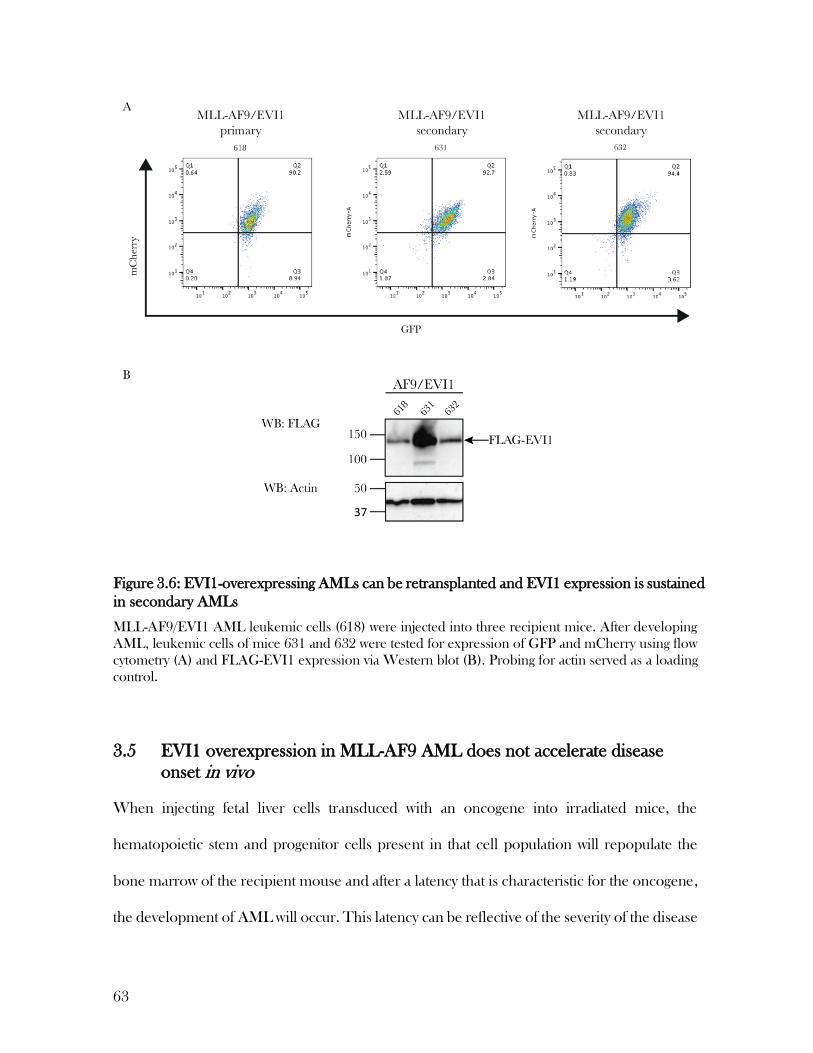
63
MLL-AF9/EVI1 AML leukemic cells (618) were injected into three recipient mice. After developing
AML, leukemic cells of mice 631 and 632 were tested for expression of GFP and mCherry using flow
cytometry (A) and FLAG-EVI1 expression via Western blot (B). Probing for actin served as a loading
control.
3.5 EVI1 overexpression in MLL-AF9 AML does not accelerate disease
onset in vivo
When injecting fetal liver cells transduced with an oncogene into irradiated mice, the
hematopoietic stem and progenitor cells present in that cell population will repopulate the
bone marrow of the recipient mouse and after a latency that is characteristic for the oncogene,
the development of AML will occur. This latency can be reflective of the severity of the disease
Figure 3.6: EVI1-overexpressing AMLs can be retransplanted and EVI1 expression is sustained
in secondary AMLs

64
and we therefore hypothesized that if EVI1 expression induces a more severe disease
phenotype, the AML onset might be faster in mice injected with fetal liver cells hat express
both MLL-AF9 and EVI1. To interpret the data, I adjusted the survival curves for EVI1
expression by separating AMLs where EVI1 infection occurred but was not detected in
leukemic cells (MLL-AF9/EVI1neg) from AMLs where EVI1 was visibly expressed (MLL-
AF9/EVI1pos). When summarizing the survival data of all but the sort experiment, EVI1 did
not appear to accelerate AML onset when compared to the survival of mice injected with cells
that were only infected with MLL-AF9 (Figure 3.7 A). For MLL-AF9 AMLs the disease onset
ranged from 42 to 81 days while mice injected with cells infected with both MLL-AF9 and
EVI1 succumbed to the disease after 43 to 83 days and when adjusting for detected EVI1
expression, AML was developed between 52- and 90-days post injection. This observed
latency is in accordance with what is commonly observed in MLL-AF9-induced leukemias
(Brumatti et al., 2016). Importantly, consistent with previous reports, when fetal liver cells were
infected with EVI1 only, their injection into irradiated recipient mice caused MDS or MDS-
like symptoms such as anemia and thrombocytopenia (Jin et al., 2007). All mice injected with
EVI-expressing fetal liver cells had to be euthanized after 209 to 251 days post infection due
to severe anemia and splenomegaly. This indicated that the construct expressed an EVI1
isoform that was able to conduct a pathophysiological function in vivo.
When cells were sorted for GFP expression prior to injection, disease onset was greatly
delayed with latencies ranging from 119 to 204 days (Figure 3.7 B). Given the lack of an
appropriate control group, it can only be guessed that this delay was caused by the sorting
process itself rather than the expression of EVI1. An alternative explanation could be that the
secondary infection rates with MLL-AF9 were low, which lead to low expression levels of the

65
oncogene ultimately resulting in increased latencies. Evidence for this can be found in the flow
cytometry data, where mCherry levels for AML 746 were low (Figure 3.5 A). When MLL-
AF9 and MLL-AF9/EVI1 AML cells (derived from 4x EVI1 virus) were injected into recipient
mice for the generation of secondary AML, the expression of EVI1 again did not accelerate
disease onset (Figure 3.7 C).
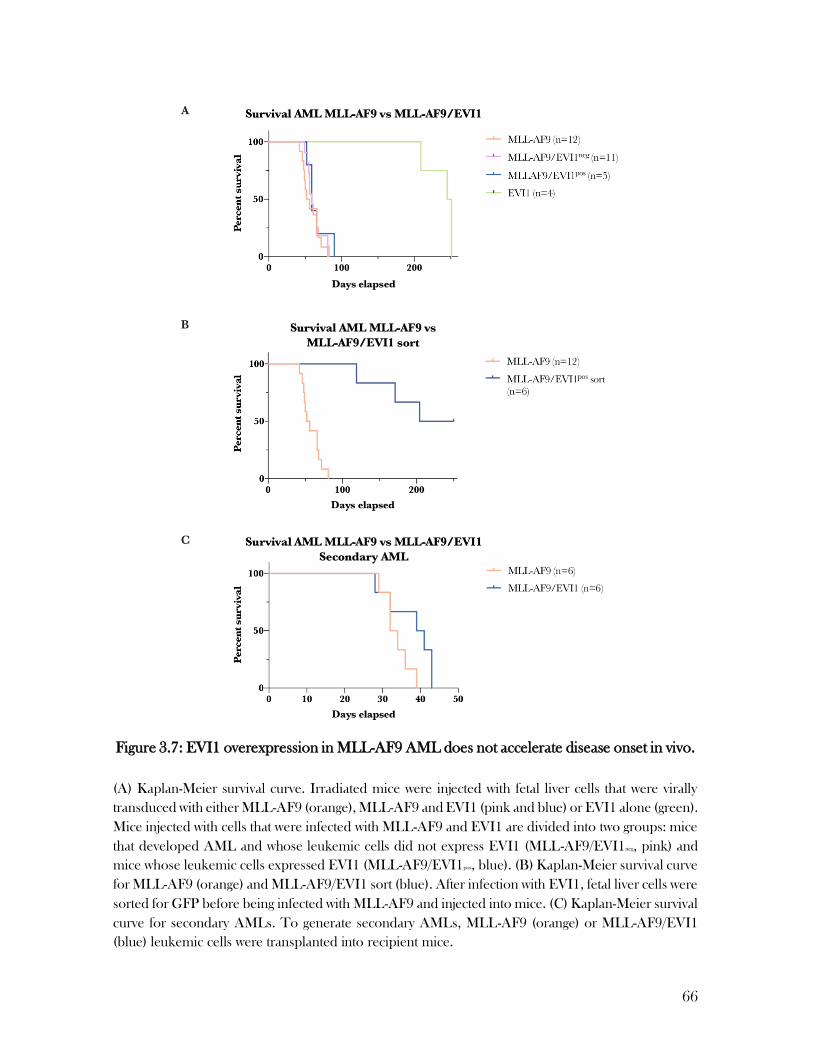
66
(A) Kaplan-Meier survival curve. Irradiated mice were injected with fetal liver cells that were virally
transduced with either MLL-AF9 (orange), MLL-AF9 and EVI1 (pink and blue) or EVI1 alone (green).
Mice injected with cells that were infected with MLL-AF9 and EVI1 are divided into two groups: mice
that developed AML and whose leukemic cells did not express EVI1 (MLL-AF9/EVI1neg, pink) and
mice whose leukemic cells expressed EVI1 (MLL-AF9/EVI1pos, blue). (B) Kaplan-Meier survival curve
for MLL-AF9 (orange) and MLL-AF9/EVI1 sort (blue). After infection with EVI1, fetal liver cells were
sorted for GFP before being infected with MLL-AF9 and injected into mice. (C) Kaplan-Meier survival
curve for secondary AMLs. To generate secondary AMLs, MLL-AF9 (orange) or MLL-AF9/EVI1
(blue) leukemic cells were transplanted into recipient mice.
Figure 3.7: EVI1 overexpression in MLL-AF9 AML does not accelerate disease onset in vivo.

67
3.6 EVI1 expression in MLL-AF9 AML does not aggravate pathological features
To further investigate the impact of EV1 expression in the disease severity of MLL-AF9/EVI1
leukemia, I examined the weight of liver and spleen, organs typically infiltrated by leukemic
blasts, as well as white blood cell and platelet counts. With progression of the disease, leukemic
blasts originating from the bone marrow accumulate in the blood leading to abnormally high
white blood cell (WBC) numbers detected in the peripheral blood. The rapid production of
abnormal white blood cells in the bone marrow can also lead to reduced platelet numbers due
to their impaired production. All mice that developed AML showed signs of splenomegaly
and most mice also suffered from hepatomegaly (Figure 3.8 A, B). When comparing weights
of liver and spleen between the three groups MLL-AF9, MLL-AF9/EVI1neg and MLL-
AF9/EVI1pos, no significant differences were observed. Mice exhibiting MDS-like symptoms
showed no signs of hepatic infiltration while splenomegaly was experienced by three of four
mice which is consistent with existing literature (Putz et al., 2006). Most mice that succumbed
to AML had elevated white blood cell levels measured in the blood with a healthy level being
around 9 x 10³ cells/µL (Figure 3.8 C). Again, no significant differences between the individual
groups were observed. It should be noted, that the great variations between WBC levels may
be explained with the heterogenicity of AML progression. If leukemic blasts accumulate in the
bone marrow rapidly causing the mouse to appear hunched and consequently becomes
identified as sick, it might get euthanized before blasts can infiltrate the blood to a great extent.
Lastly, most mice with AML showed signs of thrombocytopenia of varying degrees (Figure 3.8
D). Mice who developed leukemias positive for EVI1 expression had significantly lower
platelet counts than their counterparts. Within the MLL-AF9 cohort the spread between
platelet numbers was the greatest ranging from 81 – 777 x 109 cells/L while the mean for a
healthy female C57BL/6 is 1350 x 109 cells/L. Notably, higher platelet numbers in those mice
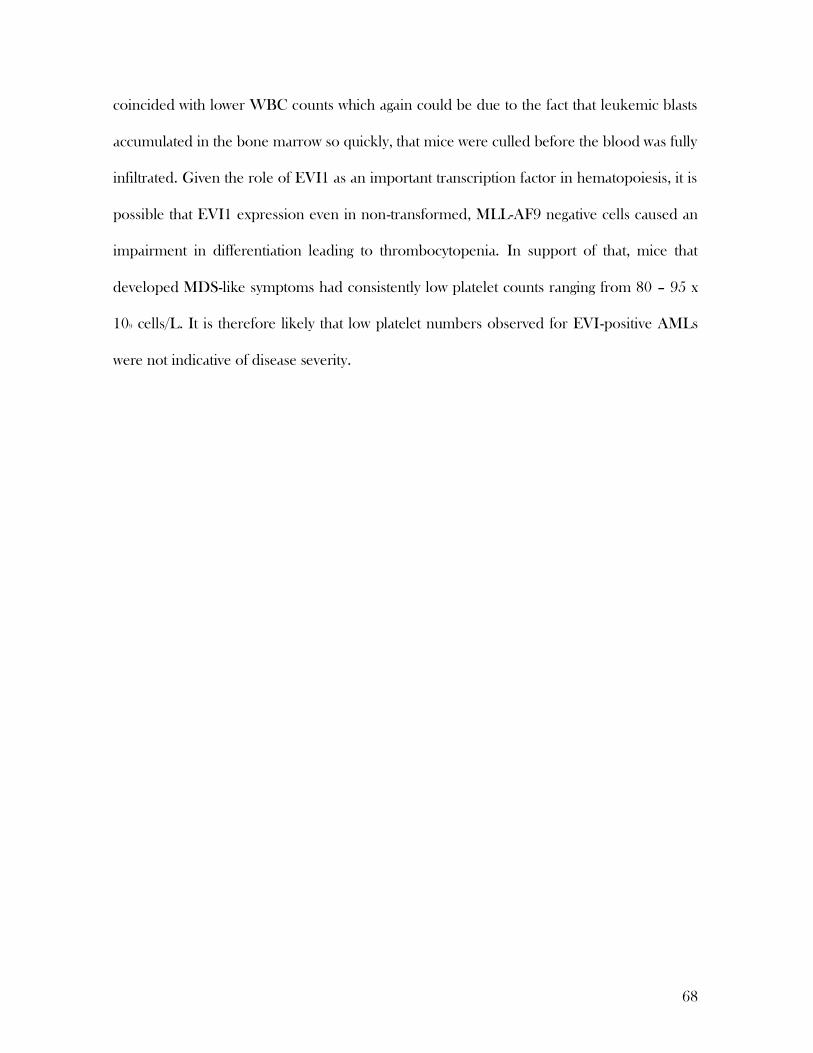
68
coincided with lower WBC counts which again could be due to the fact that leukemic blasts
accumulated in the bone marrow so quickly, that mice were culled before the blood was fully
infiltrated. Given the role of EVI1 as an important transcription factor in hematopoiesis, it is
possible that EVI1 expression even in non-transformed, MLL-AF9 negative cells caused an
impairment in differentiation leading to thrombocytopenia. In support of that, mice that
developed MDS-like symptoms had consistently low platelet counts ranging from 80 – 95 x
109 cells/L. It is therefore likely that low platelet numbers observed for EVI-positive AMLs
were not indicative of disease severity.
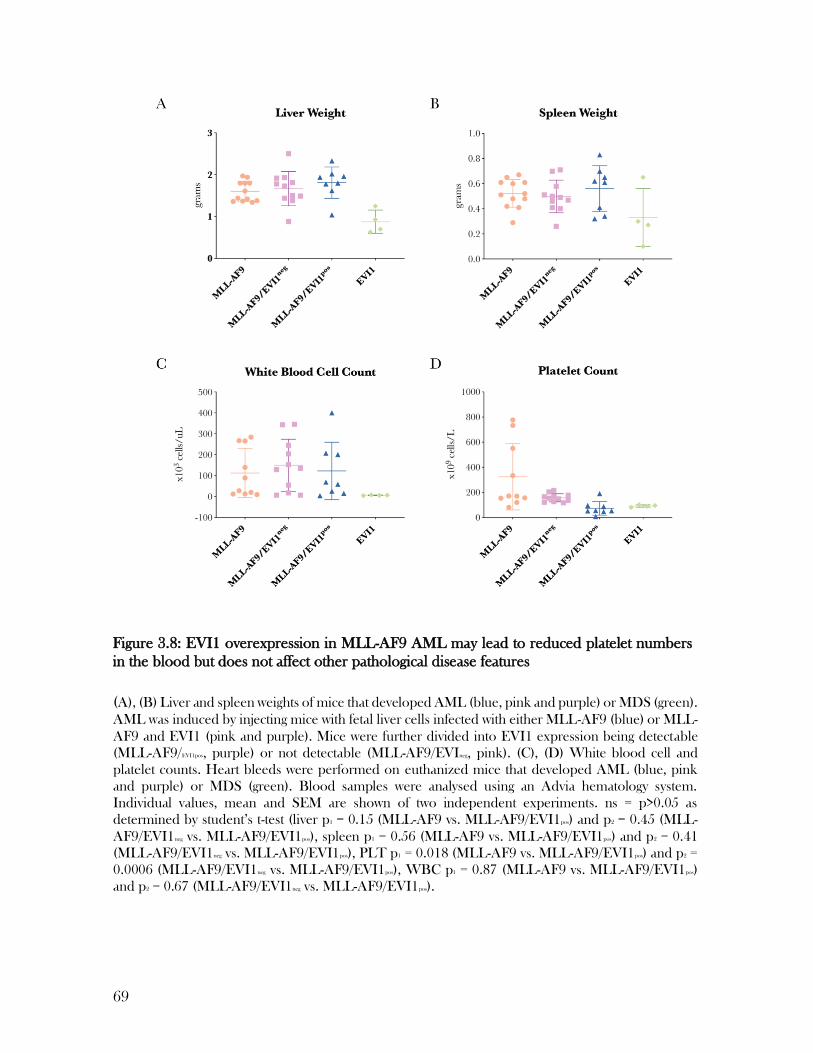
69
(A), (B) Liver and spleen weights of mice that developed AML (blue, pink and purple) or MDS (green).
AML was induced by injecting mice with fetal liver cells infected with either MLL-AF9 (blue) or MLL-
AF9 and EVI1 (pink and purple). Mice were further divided into EVI1 expression being detectable
(MLL-AF9/EVI1pos, purple) or not detectable (MLL-AF9/EVIneg, pink). (C), (D) White blood cell and
platelet counts. Heart bleeds were performed on euthanized mice that developed AML (blue, pink
and purple) or MDS (green). Blood samples were analysed using an Advia hematology system.
Individual values, mean and SEM are shown of two independent experiments. ns = p>0.05 as
determined by student’s t-test (liver p1 = 0.15 (MLL-AF9 vs. MLL-AF9/EVI1pos) and p2 = 0.45 (MLL-
AF9/EVI1neg vs. MLL-AF9/EVI1pos), spleen p1 = 0.56 (MLL-AF9 vs. MLL-AF9/EVI1pos) and p2 = 0.41
(MLL-AF9/EVI1neg vs. MLL-AF9/EVI1pos), PLT p1 = 0.018 (MLL-AF9 vs. MLL-AF9/EVI1pos) and p2 =
0.0006 (MLL-AF9/EVI1neg vs. MLL-AF9/EVI1pos), WBC p1 = 0.87 (MLL-AF9 vs. MLL-AF9/EVI1pos)
and p2 = 0.67 (MLL-AF9/EVI1neg vs. MLL-AF9/EVI1pos).
Figure 3.8: EVI1 overexpression in MLL-AF9 AML may lead to reduced platelet numbers
in the blood but does not affect other pathological disease features
70
3.7 Morphology of AML blasts is not affected by EVI1 expression
After concluding that EVI1 expression did not induce changes in the pathophysiological
features examined, I compared histopathological characteristics by preparing cytological slides
of the bone marrow of deceased mice. To do so, I generated cytospin preparations which were
subsequently stained using May-Gruenwald-Giemsa staining and imaged at 1000x
magnification (Figure 3.9). Bone marrow cytospin preparations from six mice per cohort
(MLL-AF9 and MLL-AF9/EVI1pos) were imaged. At the time of death, the majority of cells
present in the bone marrow of mice suffering from AML were leukemic blasts which are easily
distinguished from healthy white blood cells by their larger size. For both the MLL-AF9 and
MLL-AF9/EVI1-induced AMLs, leukemic blasts exhibited monocytic differentiation which is
characterised by nuclear folding, a moderate nuclear-cytoplasmic ratio and light-blue
cytoplasm. The observed monocytic morphology indicates that the generated AMLs could be
classified as the FAB – M5 subtype which is typically induced by the MLL-AF9 oncogene
(Pession et al., 2003). However, in order to confidently diagnose the subtype of AML, a large
number of blasts (>100) would have to be scored for each mouse. For the interest of this
project however, it was sufficient to compare the morphologies of the leukemic cells and by
doing that, I concluded that EVI1 expression did not induce any changes to the morphologies
of leukemic cells.
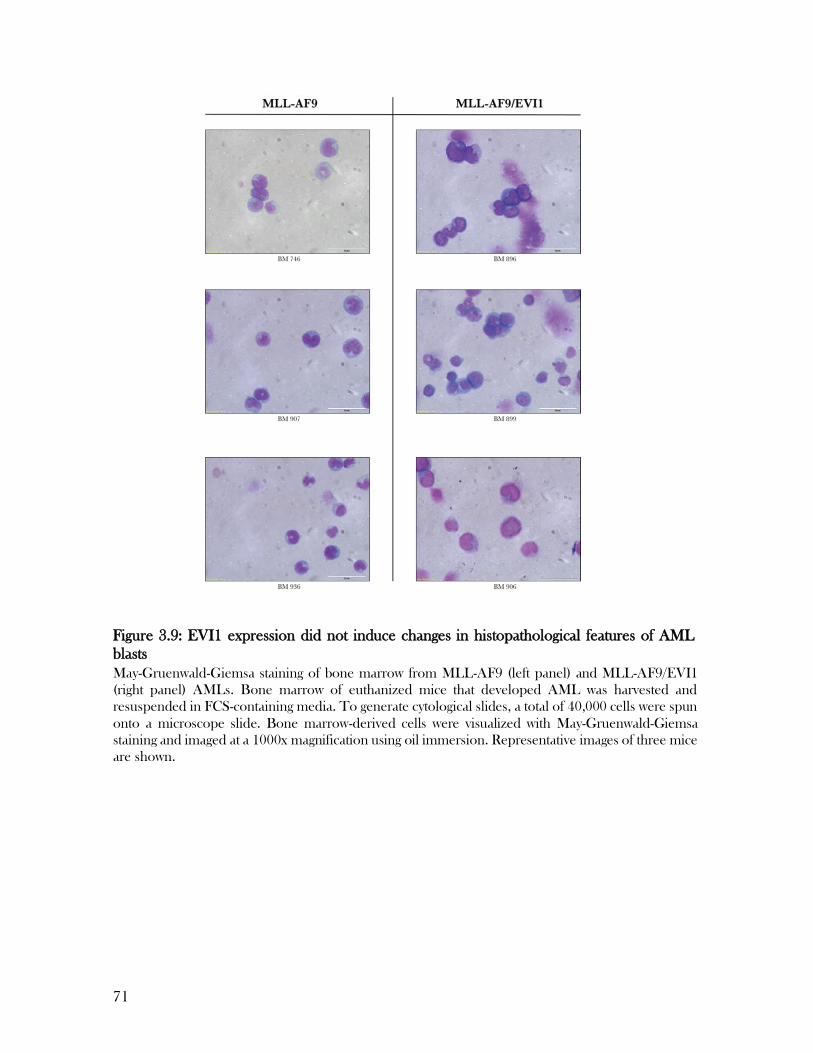
71
May-Gruenwald-Giemsa staining of bone marrow from MLL-AF9 (left panel) and MLL-AF9/EVI1
(right panel) AMLs. Bone marrow of euthanized mice that developed AML was harvested and
resuspended in FCS-containing media. To generate cytological slides, a total of 40,000 cells were spun
onto a microscope slide. Bone marrow-derived cells were visualized with May-Gruenwald-Giemsa
staining and imaged at a 1000x magnification using oil immersion. Representative images of three mice
are shown.
Figure 3.9: EVI1 expression did not induce changes in histopathological features of AML
blasts
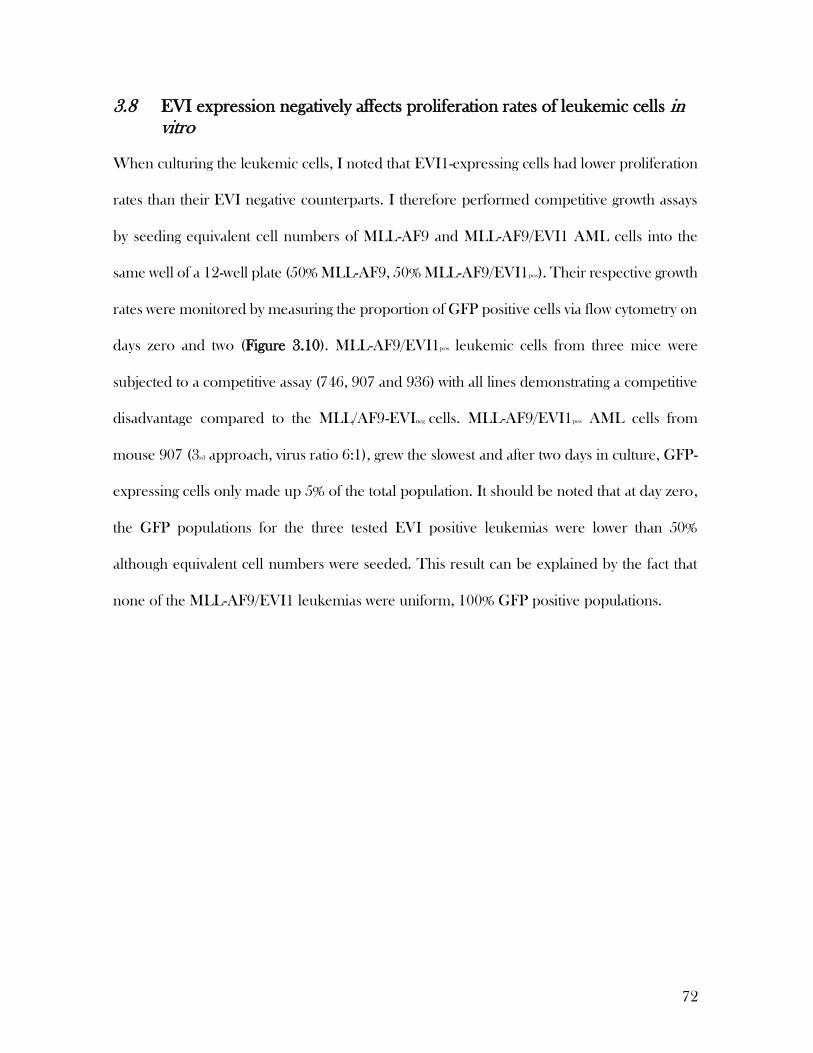
72
3.8 EVI expression negatively affects proliferation rates of leukemic cells in
vitro
When culturing the leukemic cells, I noted that EVI1-expressing cells had lower proliferation
rates than their EVI negative counterparts. I therefore performed competitive growth assays
by seeding equivalent cell numbers of MLL-AF9 and MLL-AF9/EVI1 AML cells into the
same well of a 12-well plate (50% MLL-AF9, 50% MLL-AF9/EVI1pos). Their respective growth
rates were monitored by measuring the proportion of GFP positive cells via flow cytometry on
days zero and two (Figure 3.10). MLL-AF9/EVI1pos leukemic cells from three mice were
subjected to a competitive assay (746, 907 and 936) with all lines demonstrating a competitive
disadvantage compared to the MLL/AF9-EVIneg cells. MLL-AF9/EVI1pos AML cells from
mouse 907 (3rd approach, virus ratio 6:1), grew the slowest and after two days in culture, GFP-
expressing cells only made up 5% of the total population. It should be noted that at day zero,
the GFP populations for the three tested EVI positive leukemias were lower than 50%
although equivalent cell numbers were seeded. This result can be explained by the fact that
none of the MLL-AF9/EVI1 leukemias were uniform, 100% GFP positive populations.
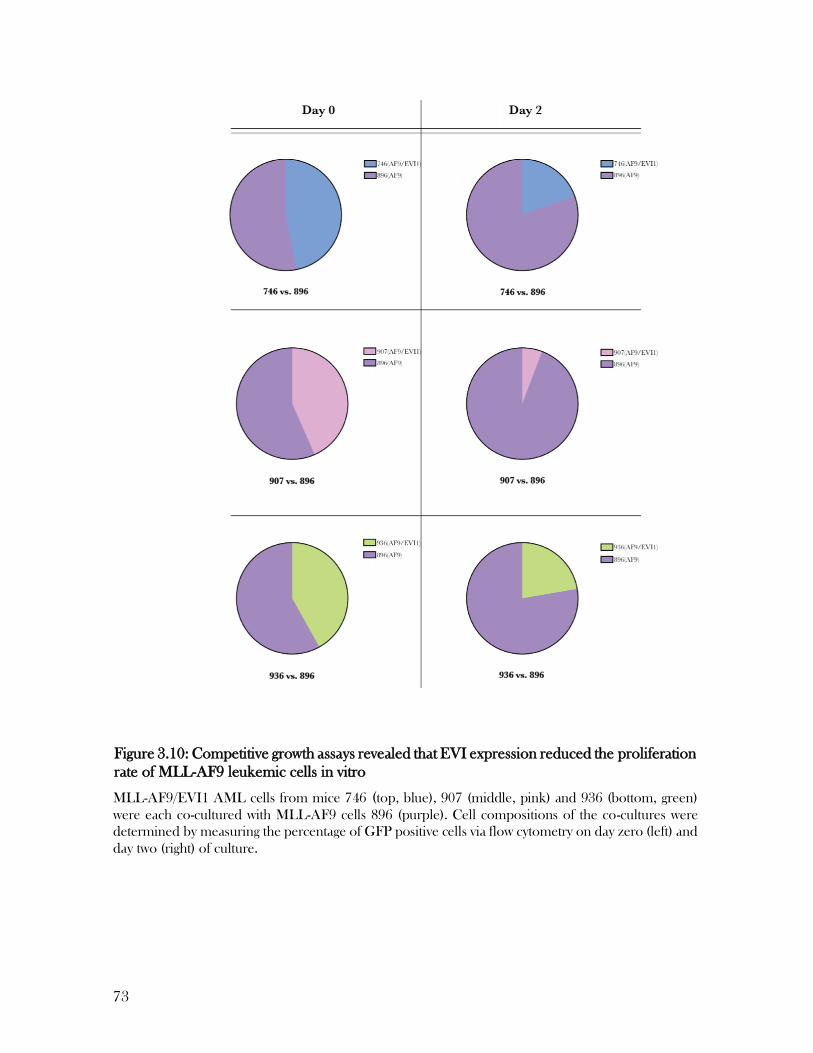
73
MLL-AF9/EVI1 AML cells from mice 746 (top, blue), 907 (middle, pink) and 936 (bottom, green)
were each co-cultured with MLL-AF9 cells 896 (purple). Cell compositions of the co-cultures were
determined by measuring the percentage of GFP positive cells via flow cytometry on day zero (left) and
day two (right) of culture.
Figure 3.10: Competitive growth assays revealed that EVI expression reduced the proliferation
rate of MLL-AF9 leukemic cells in vitro
74
3.9 EVI-expressing leukemias demonstrate an unaltered immunophenotype
In the literature, high EVI1 expression in AML patients has often been associated with a less
mature disease phenotype since EVI1 expression levels are highest in HSCs (Kataoka et al.,
2011; Stavropoulou et al., 2016). Although I was not able to detect obvious differences in
histopathological features, it is possible that EVI1 expression induced distinct
immunophenotypes. In detail that would mean that EVI1 might affect the differentiation stage
of the blasts that make up the majority of leukemic cells. MLL-AF9 has been described to be
able to transform both late hematopoietic stem cells (HSCs) and granulocyte/macrophage
progenitors (GMPs) (Stavropoulou et al., 2016). Depending on the cell type that gives rise to
the leukemia, the severity of the disease can vary considerably (Stavropoulou et al., 2016).
Upon transformation, a late HSC for example induces a more aggressive leukemia than a
transformed GMP (Basilico et al., 2017). A caveat of our approach of infecting fetal liver cells
and relying on hematopoietic stem and/or progenitor cells being infected is that we have no
influence on what type of cell is ultimately transformed. Moreover, when presented with the
leukemic blasts, we have no means to trace back to the cell type of the leukemia initiating cell
(LISC). However, given that the oncogene MLL-AF9 consistently generates AMLs of
comparable latency and severity, this caveat is generally neglected. When determining if the
expression of EVI1 induces any changes to the immunophenotype due to affecting what cell
type is preferentially transformed or by influencing the transformation process itself, analysing
the surface marker signature of the leukemic blasts is a valid tool. Cell surface markers that
AML cells are commonly tested for include cKit (CD117), Mac-1 (CD11b), Gr-1 and F4/80
(Somervaille et al., 2006). Two MLL-AF9 AMLs and three MLL-AF9/EVI1 AMLs were
subjected to surface marker screening using fluorescently labelled antibodies and flow
cytometry (Figure 3.11). When comparing the immunophenotypes of the two groups no

75
significant differences were identified. All AMLs expressed high levels of Mac-1, while Gr-1
expression levels ranged from 27% (735, MLL-AF9) to 55% (907, MLL-AF9/EVI1) (Figure
3.11 A). This variation however could be observed within each of the groups. The same can
be said about F4/80 levels whose expression rates fluctuated between 30% (907, MLL-
AF9/EVI1) and 81% (896, MLL-AF9) (Figure 3.11 B). However, both high and low F4/80
expression were observed within the two groups. Lastly, cKit+ cells were present in all AMLs
while 48% was the largest (907, MLL-AF9/EVI1) and 12% the smallest (735, MLL-AF9)
population of cKit+ cells measured within each AML (Figure 3.11 C). Again, no significant
differences between EVI1 positive and negative AMLs were detectable. This data strongly
suggests that all AMLs have a monocytic immunophenotype which is consistent with the results
obtained via histopathological analysis. AML 907 (MLL-AF9/EVI1) appeared to possess the
least mature immunophenotype exhibiting both the largest population of cKit+ cells and the
lowest expression of F4/80. Overall, EVI1 expression did not appear to impact the
immunophenotype of leukemic cells.
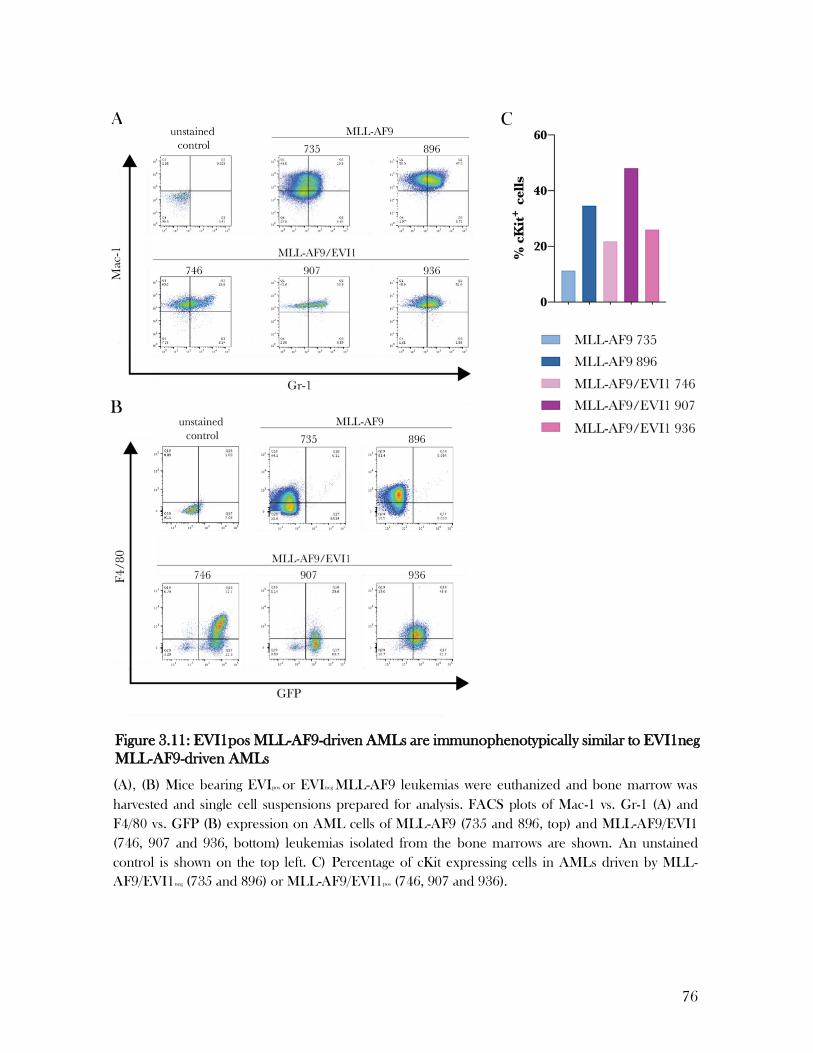
76
(A), (B) Mice bearing EVIpos or EVIneg MLL-AF9 leukemias were euthanized and bone marrow was
harvested and single cell suspensions prepared for analysis. FACS plots of Mac-1 vs. Gr-1 (A) and
F4/80 vs. GFP (B) expression on AML cells of MLL-AF9 (735 and 896, top) and MLL-AF9/EVI1
(746, 907 and 936, bottom) leukemias isolated from the bone marrows are shown. An unstained
control is shown on the top left. C) Percentage of cKit expressing cells in AMLs driven by MLL-
AF9/EVI1neg (735 and 896) or MLL-AF9/EVI1pos (746, 907 and 936).
A
B
Figure 3.11: EVI1pos MLL-AF9-driven AMLs are immunophenotypically similar to EVI1neg
MLL-AF9-driven AMLs
C

77
3.10 Response of EVI1-expressing AMLs to anti-cancer agent
High EVI1 expression is a poor prognostic marker in patients suffering from AML and
correlates with resistance to chemotherapy treatment. To determine if EVI1 expression
resulted in resistance to chemotherapy in vitro, I treated MLL-AF9 and MLL-AF9/EVI1 cells
with cell death inducing drugs and drug combinations. Those treatments included the Smac
mimetic Birinapant (IAP antagonist), the combination of Birinapant with LY2228820 (p38
inhibitor) which our lab identified as an efficient combination treatment for AML in vivo and
in vitro, and AraC (chemotherapeutic agent). To evaluate dosage dependent treatment
responses, Birinapant and AraC concentrations were titrated. To determine cell death rates,
the cells’ uptake of propidium iodide (PI) was measured via flow cytometry (Figure 3.12).
Given the consistent treatment responses, I combined PI uptake values for the two tested
MLL-AF9 AMLs (897/899). As previously shown (Brumatti et al., 2016; N. Lalaoui et al.,
2016), increasing concentrations of Birinapant successfully induced cell death in MLL-AF9
AMLs with the highest observed cell death rate being 80% when treated with 1000 nM of the
drug for 24h. Upon addition of the p38 inhibitor LY, this extent of cell death was already
achieved at Birinapant’s lowest concentration (125 nM) and any increase in Birinapant lead to
the killing of close to 100% of cells. The chemotherapeutic agent AraC was also a potent cell
death inducer in MLL-AF9 AMLs and a dosage dependent response was also observable.
Interestingly, the three MLL-AF9/EVI1pos AMLs did not respond equally to all treatments
which was indicated by large error bars in the cell death bar graph (Figure 3.12 A). I therefore
separated the cell death rates of the three MLL-AF9/EVI1pos to evaluate the individual
treatment responses (Figure 3.12 B). MLL-AF9/EVI1pos 936 was already highly sensitive to
Birinapant alone after 24h and the addition of LY (p38i) was sufficient to induce complete

78
killing even at the lowest concentration of Birinapant. When exposed to AraC, MLL-
AF9/EVI1pos 936 appeared to be just as sensitive as its EVI1 negative counterparts with cell
death rates reaching almost 90% on average for 1000 nM AraC. MLL-AF9/EVI1pos 746 on the
other hand was slightly less sensitive to Birinapant alone when comparing its cell death rates
to the ones observed for the MLL-AF9 AMLs. When combined with LY (p38i), Birinapant
was still efficient at killing leukemic cells derived from MLL-AF9/EVI1pos 746 even at low
concentrations. Its response to AraC was the most interesting since here the observed cell
death rates did not exceed the background cell death making it completely resistant to the
chemotherapeutic. This result is particularly compelling when considering the association of
EVI1 expression in AML patients with resistance to chemotherapy. Lastly, MLL-AF9/EVI1pos
907 was unique in its overall treatment response as it appeared to be resistant to any of the
drugs or drug combinations. Although the measured cell death rates exceeded background
cell death for all treatments, the highest observed rate was below 50% and no significant dosage
dependent responses were recorded.
In summary, two of the three tested MLL/AF9-EVI1 AMLs exhibited resistance to the
chemotherapeutic agent AraC and while MLL-AF9/EVI1pos 746 was also slightly less
responsive to Birinapant, all treatments failed to sufficiently kill MLL-AF9/EVI1 cells derived
from MLL-AF9/EVI1pos 907. These observations correlate somewhat with the known role of
EVI1 as a predictor for poor treatment response in patients.

79
(A) – (B) Analysis of cell death by propidium iodide uptake and flow cytometry. Leukemic cells
expressing MLL-AF9 (897/899, blue) or MLL-AF9/EVI1 (top: dark pink; bottom: 746, orange; 907,
light pink; 936, dark pink) were seeded in 96 well plates at 5 x 10⁴ cells/well and treated with Birinapant
(125-1000 nM), AraC (125-1000 nM) or Birinapant (125-1000 nM) with the p38 inhibitor LY2228820
(LY, 1 µM) for 24 h. Cell death was determined by measuring PI uptake via flow cytometry. DMSO
was added to untreated controls at 0.2% (v/v). Individual values, mean and SEM are shown of two
independent experiments.
Figure 3.12: The response of EVI1pos MLL-AF9-driven AMLs to various treatments ranges
from sensitive to resistant
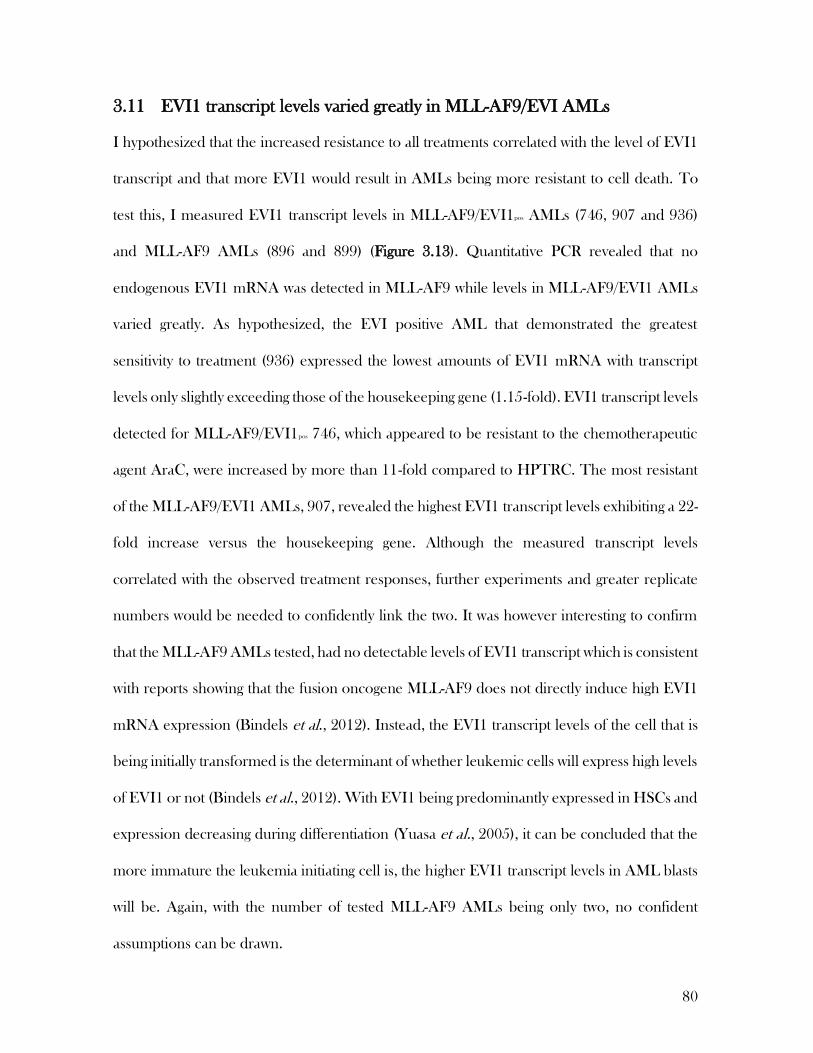
80
3.11 EVI1 transcript levels varied greatly in MLL-AF9/EVI AMLs
I hypothesized that the increased resistance to all treatments correlated with the level of EVI1
transcript and that more EVI1 would result in AMLs being more resistant to cell death. To
test this, I measured EVI1 transcript levels in MLL-AF9/EVI1pos AMLs (746, 907 and 936)
and MLL-AF9 AMLs (896 and 899) (Figure 3.13). Quantitative PCR revealed that no
endogenous EVI1 mRNA was detected in MLL-AF9 while levels in MLL-AF9/EVI1 AMLs
varied greatly. As hypothesized, the EVI positive AML that demonstrated the greatest
sensitivity to treatment (936) expressed the lowest amounts of EVI1 mRNA with transcript
levels only slightly exceeding those of the housekeeping gene (1.15-fold). EVI1 transcript levels
detected for MLL-AF9/EVI1pos 746, which appeared to be resistant to the chemotherapeutic
agent AraC, were increased by more than 11-fold compared to HPTRC. The most resistant
of the MLL-AF9/EVI1 AMLs, 907, revealed the highest EVI1 transcript levels exhibiting a 22-
fold increase versus the housekeeping gene. Although the measured transcript levels
correlated with the observed treatment responses, further experiments and greater replicate
numbers would be needed to confidently link the two. It was however interesting to confirm
that the MLL-AF9 AMLs tested, had no detectable levels of EVI1 transcript which is consistent
with reports showing that the fusion oncogene MLL-AF9 does not directly induce high EVI1
mRNA expression (Bindels et al., 2012). Instead, the EVI1 transcript levels of the cell that is
being initially transformed is the determinant of whether leukemic cells will express high levels
of EVI1 or not (Bindels et al., 2012). With EVI1 being predominantly expressed in HSCs and
expression decreasing during differentiation (Yuasa et al., 2005), it can be concluded that the
more immature the leukemia initiating cell is, the higher EVI1 transcript levels in AML blasts
will be. Again, with the number of tested MLL-AF9 AMLs being only two, no confident
assumptions can be drawn.
81
Quantitative PCR for EVI1 of MLL-AF9 AMLs 896 (blue circle) and 899 (blue square) and MLL-
AF9/EVI1 AMLs 746 (orange), 907 (light pink) and 936 (dark pink). To determine relative transcript
levels, SYBR Green based qPCR was performed using primers against EVI1 and HPTRC
(housekeeping gene). Individual values, mean and SEM are shown of one experiment however results
are representative of two independent experiments.
Figure 3.13: EVI1 expression levels varied greatly in MLL-AF9/EVI AMLs while MLL-AF6
and -AF9 -driven AMLs did not express EVI1
EVI1 transcript levels in AML
Tra
nsc
rip
t le
vels
rel. to
HP
RT
82
3.12 Discussion
The aim of this project was to generate a mouse model for an AML that is associated with
particularly poor patient outcome and treatment resistance. As a suitable model we chose the
co-expression of the chimeric oncogene MLL-AF9 with the hematopoietic transcription factor
EVI1. With MLL-AF9 being the oncogenic protein, all AMLs were positive for its expression.
However, the generation of leukemias that were positive for both MLL-AF9 and EVI1 was
challenging. When applying the same technique of retrovirally transducing fetal liver cells with
two constructs, we routinely accelerate disease onset by co-infecting cells with MLL-AF9 and
a NRAS mutant whose positive correlation with disease severity in AML is well-established
(W. I. Kim et al., 2009). We therefore know that it is possible to infect a fetal liver cell with
two constructs leading to the hypothesis that as opposed to NRAS, EVI1 expression is not
conferring a proliferative advantage to MLL-AF9 expressing cells. Here it is also noteworthy
that a number of AMLs positive for EVI1 only expressed the protein in a subpopulation of its
blasts. Although EVI1 levels dropped initially after culturing those cells for multiple weeks,
the ratio of EVI1 positive to EVI1 negative cells remained stable. When considering AML as
a clonal disease, that is that it originates from one cell being transformed, it appears
contradictive that EVI1 positive and negative populations can co-exist in the same leukemia.
One possible explanation for this could be that the AMLs we are generating are in fact
heterogenous due to the transformation of multiple cells. An alternative theory to this could
be that MLL-AF9 positive cells actively aim to suppress EVI1 expression and succeed to do
so in only a proportion of cells. Given that in the AMLs where mixed populations were
present, ratios between the two populations maintained consistent, we can conclude that EVI1
expression did not impact proliferation rates in those AMLs. It is therefore questionable how
downregulating EVI1 expression would be beneficial to leukemic cells in vitro. An informative
83
experiment would involve the injection of AML cells with EVI1 positive and negative
populations into recipient mice to investigate whether the secondary AML would be
comprised of the same two populations or whether in vivo, one of them would be more potent
in propagating the disease.
It is likely that EVI1 co-expression does not lead to a proliferative advantage in MLL-AF9
positive cells and the issue of failing to consistently generate double positive AMLs is a
technical one. When sorting for EVI1 expression prior to infecting cells with the MLL-AF9
construct, three of six mice did not develop AML at all and the three mice that did get sick
after a lengthy latency gave rise to leukemic cells that were 100% EVI1 positive while MLL-
AF9 levels were low. It is known that previously infected cells are not as readily transduced in
a second round of infection (Walker et al., 1996). This potentially explains why secondary
infection of EVI positive cells that were sorted for high GFP expression was of limited success.
In addition to being infected multiple times, the process of fluorescence-activated cell sorting
itself induced additional stress to the cells which potentially interfered with both the secondary
infection as well as the in vivo engraftment and disease initiation.
To overcome the described obstacles and to generate double positive AMLs more reliably,
fetal liver cells could initially be infected with both constructs at ratios that favor the infection
with EVI1 and subsequently be subjected to cell sorting. As my data shows in Figure 3.2, when
co-infecting fetal liver cells with the MLL-AF9 and EVI1 constructs at a ratio of 4:1, the
population of double infected cells several days after infection was about 3.5%. This is opposed
to approximately 20% of GFP positive cells achieved through infection with EVI1 alone (data
not shown). Therefore, the downside of performing the double infection prior to sorting is the
84
demand for larger cell numbers that need to be infected. Routinely, we use one fetal liver for
the reconstitution of two to three mice depending on the age of the fetal liver cell suspensions
to inject 5 x 10⁵ cells/mouse. When sorting for a population that only makes up about 3.5% of
infected fetal liver cells, the number of fetal livers required would increase almost 30-fold.
Since mice are lethally irradiated prior to reconstitution, when insufficient cell numbers are
injected, mice are likely to succumb to irradiation sickness. Consequently, we are limited with
how much we can reduce the amount of fetal liver cells administered to mice. To overcome
this, it could be applicable to co-inject non-infected fetal liver or bone marrow-derived support
cells to prevent the development of irradiation sickness. However, it is possible that by doing
so we would also introduce additional, unpredictable variables. When considering that EVI1
is highly expressed on HSCs, another approach could entail enriching fetal liver cells using
immunomagnetic beads. By doing so we would reduce the vector requirements and ensure
the expression of pathologically relevant EVI1 isoforms at physiological levels. Furthermore,
I believe this approach would have the greatest potential to induce an AML whose disease
phenotype realistically recapitulates human AML since in patients with EVI1 positive AML,
leukemic blasts exhibit a less mature immunophenotype (Glass et al., 2013). As with the
approach discussed above, this method would require large amounts of stem cell containing
starting material, i.e. fetal livers or bone marrow since HSCs that are contained in the LSK
(lin-Sca+cKit+) population only make up a small percentage of the total cells. Lastly, the
enrichment process for HSCs using immunomagnetic beads is inefficient leading to a further
increase in required starting material. Alternatively, a single vector construct expressing both
MLL-AF9 and EVI1 could be generated. With the size of the MLL-AF9 fusion gene
exceeding 11kb, the integration of EVI1 (3kb) would lead to an expression construct whose
size is unfavourable for a viral vector. By increasing the size of the viral construct, both the
85
infection efficiency and copy numbers integrated per cell would decrease. This could be
particularly problematic when considering that EVI1 expression levels appeared to positively
correlate with treatment resistance of leukemic cells in vitro.
When I successfully generated EVI1 positive AMLs, the expression of the transcription factor
did not appear to impact the morphology of leukemic blasts as determined via
histopathological analysis of bone marrow cytospin preparations. In accordance with that, flow
cytometry analysis of various haematological surface markers failed to reveal significant
differences in immunophenotypic features between EVI1 positive and negative AMLs. In
vitro, EVI1 expression lead to a decrease in proliferation rates. The AML culturing media
only contained the cytokine Il-3, while under physiological conditions cells are exposed to a
variety of cytokines. It is possible that the observed decreased proliferation was related to the
culturing conditions and in fact did not reflect any processes that occurred in vivo. To test this
hypothesis, a range of media compositions consisting of combinations of different cytokines
would need to be tested.
Lastly, I addressed the question whether EVI1 mRNA expression lead to MLL-AF9 AMLs
being more resistant to treatment-induced cell death. Interestingly, resistance to the
chemotherapeutic agent Ara-C was observed in two of three tested MLL-AF9/EVI1 AMLs.
While one of them was still sensitive to Birinapant itself and in combination with LY, the other
AML was resistant to all treatments that were tested. When measuring EVI1 transcript levels
via qPCR, a positive correlation between treatment resistance and EVI1 transcript levels was
observed. Those observations are supported by the role of EVI1 as a predictor for poor
outcome and treatment resistance in AML patients, while larger replicate numbers and more

86
experiments would be required to confidently conclude that EVI1 mRNA expression alone
was driving this phenotype. The large variations in EVI1 transcript levels represent another
obstacle for generating an MLL-AF9/EVI1 mouse model using viral co-infection since it does
not allow for controlling integration site or number of copies integrated into the cells’ genome.
Considering the observed positive correlation between EVI1 transcript levels and treatment
resistance in vitro, standardization of a model applying the described approach presents a
major challenge.
Collectively, the data I have presented delivers a compelling argument for the relevance of a
mouse model that reliably reflects treatment-resistant human AML. The applied methods
failed at reproducibly generating EVI1 expressing AMLs. Although the proposed changes
have the potential to overcome the downfalls of this mouse model, alternative methods that
do not rely on the use of viral integration might lead to more success.
87
4 How does the inhibition of p38 in the absence of IAPs induce cell
death?
4.1 p38/MK2 inhibit cell death in Smac mimetic-treated cells by
mechanisms other than RIPK1 phosphorylation
Smac mimetics are an attractive drug candidate for the treatment of a number of cancers.
However, resistances to treatments with this class of drug have been observed (Brumatti et al.,
2016; Najoua Lalaoui et al., 2016). The MAP kinase p38 has been identified to contribute to
this resistance, which could be overcome by inhibiting p38 (Najoua Lalaoui et al., 2016). The
mechanism through which p38 promotes cell survival upon Smac mimetic treatment involves
the activation of its substrate MK2, which in turn phosphorylates RIPK1 at Ser321 (Jaco et al.,
2017). This phosphorylation prevents the recruitment of RIPK1 to the cell death-inducing
complex II (Jaco et al., 2017). However, phosphorylation of Ser321 is not solely responsible
for resistance to Smac mimetic. My host laboratory showed, that RIPK1S321D phospho-mimetic
MEFs and BMDMs were only partially protected from Smac mimetic-induced cell death and
the additional inhibition of MK2 further sensitized RIPK1S321D mutants (Jaco et al., 2017).
Furthermore, two other groups showed that MK2 can also phosphorylate RIPK1 at serine
Ser336 (Dondelinger et al., 2017; Menon et al., 2017). To determine whether the inhibitory
effect of p38/MK2 on cell death in the absence of the IAPs relies solely on the phosphorylation
of RIPK1 at Ser321/Ser336, we generated a RIPK1S321A/S336A mutant knock-in mouse. Since this
RIPK1 mutant cannot become phosphorylated by MK2, RIPK1S321A/S336A BMDMs should be
sensitized to SM-induced killing. If p38/MK2 are not equipped with an additional function
that enables them to prevent cell death upon SM treatment, the combined inhibition of p38
or MK2 and the IAPs should not lead to a further increase in cell death. When performing

88
this experiment, we observed that RIPK1S321A/S336A BMDMs were in fact sensitized to SM-induced
killing, which was particularly apparent at higher SM concentrations (Figure 4.1). Interestingly,
upon addition of either p38i or MK2i, even at a low concentration of the SM Compound A
(5 nM), cell death was significantly increased. This clearly indicates, that there are further,
unknown mechanisms by which the p38/MK2 axis can prevent SM-induced killing. Synergistic
effects by the addition of p38i or MK2i at larger SM dosages, were probably concealed by the
already high rates of cell death induced by SM as a single agent.
Figure 4.1: Inhibiting p38 or MK2 further increases cell death in RIPK1 phospho-dead mutant
Analysis of cell death by propidium iodide uptake and flow cytometry. Wild-type (blue) and
RIPK1S321A/S336A (pink) BMDMs were seeded in 24-well plates at 5 x 10⁴ cells/well and treated with
Compound A (5, 50, 500 nM) alone or in combination with the p38 inhibitor LY2228820 (1 µM) or
the MK2 inhibitor PF3644022 (2 µM). Cell death was determined after 24 hours by measuring PI
uptake via flow cytometry. DMSO was added to untreated controls at 0.2% (v/v). Individual values,
mean and SEM are shown of two independent experiments.
4.2 Elucidating the mechanism of the Smac mimetic/p38i-induced killing by
studying the phospho-proteome by mass spectrometry
After discovering that the MK2-mediated RIPK1 phosphorylation at S321/S336 is not the only
mechanism through which p38 inhibits Smac mimetic induced cell death, we decided to
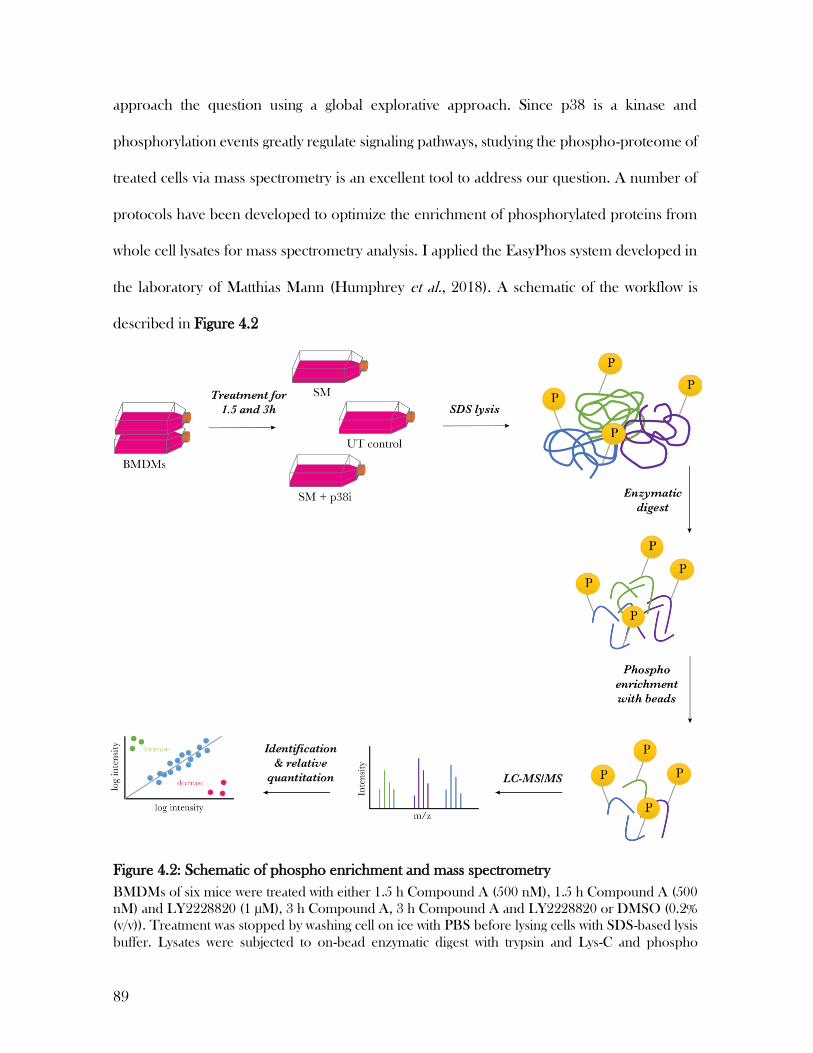
89
approach the question using a global explorative approach. Since p38 is a kinase and
phosphorylation events greatly regulate signaling pathways, studying the phospho-proteome of
treated cells via mass spectrometry is an excellent tool to address our question. A number of
protocols have been developed to optimize the enrichment of phosphorylated proteins from
whole cell lysates for mass spectrometry analysis. I applied the EasyPhos system developed in
the laboratory of Matthias Mann (Humphrey et al., 2018). A schematic of the workflow is
described in Figure 4.2
BMDMs of six mice were treated with either 1.5 h Compound A (500 nM), 1.5 h Compound A (500
nM) and LY2228820 (1 µM), 3 h Compound A, 3 h Compound A and LY2228820 or DMSO (0.2%
(v/v)). Treatment was stopped by washing cell on ice with PBS before lysing cells with SDS-based lysis
buffer. Lysates were subjected to on-bead enzymatic digest with trypsin and Lys-C and phospho
Figure 4.2: Schematic of phospho enrichment and mass spectrometry
90
peptides were enriched using TiO2 beads. Isolated phospho peptides were analysed via LC-MS/MS
using a Q Exactive hybrid quadrupole-orbitrap.
To ensure that the treatment was performed successfully and cells signaled as intended, I
analysed the resulting cell death in BMDMs by measuring the uptake of PI via flow cytometry
(Figure 4.3 A). Furthermore, I performed Western blot analysis with the lysates and probed
for known targets. Apart from replicate 1, the combination treatment induced cell death as
expected. Since cell death within 3 hours is minimal, the variations between cell death
observed for the 1.5h 911 (Compound A) + LY (p38i) as well as the 3h 911 treatments were
not concerning. The 3h combination treatment induced the greatest cell death for all but
sample 1 and ranged from 22% to 28%. This indicated that the treatment was performed
correctly and cells signaled as expected. This was further supported by the Western blot
analysis when I probed for the phosphorylated MAP kinases JNK1/2 and ERK1/2 (Figure 4.3
B). It is known that JNK1/2 and ERK1/2 are activated through phosphorylation in their
activation loop and hence activated upon the combination treatment, particularly after three
hours and that was clearly visible in the Western blot. When inhibited, p38 is not able to
phosphorylate its substrates while it can still be phosphorylated itself. We therefore get an
accumulation of phospho-p38 which could also be detected via Western blot. MK2 is a well-
known p38 target which plays an important role in inhibiting Smac mimetic induced cell death
as I have described before. Figure 4.3 B shows that MK2 did not get phosphorylated when
p38 was inhibited, again indicating that the treatment was successful. Upon the combination

91
treatment the cell death we observe is known to be induced via apoptosis and we therefore
expect to observe cleavage of the caspase 8. These events could also be detected via Western
blot (Figure 4.3 B) and the occurrence of both correlated with the measured cell death via flow
cytometry. Although the cell death detected for replicate 1 did not follow the expected
patterns, the signaling events that we observed via Western blot did match the others. It is
therefore likely that the cell death assay which was set up on a separate plate on a smaller scale
did not induce cell death to the same extent. On the other hand, the lysates used for Western
blot analysis were derived from the samples that were later subjected to further processing for
mass spectrometry. Hence, I was confident to include this replicate in the following workflow.

92
(A) BMDMs from six mice were treated with DMSO (untreated control), Compound A (500 nM)
alone or in the presence of p38 inhibitor LY (1 µM) for 1.5 or 3 hours. Resulting cell death was
measured via PI uptake using flow cytometry. (B) Lysates of treated BMDMs were subjected to
Western blotting and membranes were probed for phospho-p38, phospho-Erk1/2, phospho-JNK1/2
and phospho-MK2 to confirm that the described treatment induced the expected signaling. Probing
for actin served as a loading control.
Figure 4.3: Treatment-induced cell death and signalling in BMDMs was confirmed
93
4.3 Phosphorylated peptides were successfully enriched following the
EasyPhos protocol
Enriched phosphorylated peptides were analysed via mass spectrometry and identified during
a MaxQuant search. Using R to perform the statistical analysis, proteins that were differentially
phosphorylated upon treatment could be ranked according to their significance and fold
change. The parameters that were of initial interest were concerning the quality of the
performed enrichment. When enzymatically digesting proteins using trypsin and Lys-C, the
efficiency of that digest can be measured by determining the proportions of proteins that have
no, one or multiple missed cleavages (Figure 4.4 A). During this experiment approx. 60% of
peptides were completely digested which was reproducible for all replicates. It has been
described in the literature that phosphorylation events in proximity to lysine or arginine
residues may prevent lysine from cleaving at their carboxyl end increasing the number of
missed cleavages (Siepen et al., 2007). Given that the majority of peptides were completely
cleaved and that only minor variations across the replicates occurred I was satisfied that the
quality of the performed digest was sufficient.
Next, I determined how efficiently I enriched for phosphorylated peptides (Figure 4.4 B).
Within all replicates, the proportion of unphosphorylated peptides was only around 5% which
indicates that the phospho-enrichment was successful. When comparing the numbers of
phosphate groups on each peptide, it stood out that dual phosphorylation events were more
commonly detected than single phosphorylations (approximately 50% vs. 35%). Although
MAP kinases are good examples for proteins that are activated by dual phosphorylation, single
phosphorylation is still expected to be the most abundant form observed for this form of post-
translational modification. Nonetheless, the low number of non-phosphorylated peptides and

94
the great reproducibility amongst the replicates we detected proved that the enrichment
process was successful.

95
(A) Missed cleavage comparison between all samples. Graph shows the proportion of missed cleavages
of the peptides detected by LC-MS/MS. Blue indicates the proportion of peptides with no missed
cleavages, green and red represent one and two missed cleavages respectively. (B) Number of
phosphorylation sites per peptide. Shown are the proportions of peptides with no phosphorylation
(blue), single (green), double (red), triple (yellow) or quadruple (purple) serine, threonine or tyrosine
phosphorylation(s) detected across all treated BMDM samples.
Figure 4.4: QC of mass spectrometry data
96
4.4 Inhibition of p38 induces phosphoproteomic changes with distinct
temporal profile
The generated lists of phosphorylated proteins detected for each treatment were now
compared to determine the proteins that were differentially phosphorylated between BMDMs
treated with Compound A only and BMDMs treated with the combination of Compound A
and LY. These comparisons revealed that 178 proteins were significantly differentially
phosphorylated between these two groups after 1.5 h of treatment and 220 proteins after 3 h
of treatment with a false discovery rate of <0.1 (Figure 4.5 A, B; for list of proteins refer to
Appendix). Interestingly, after 1.5 h the majority of differentially phosphorylated (DP) proteins
were less phosphorylated in the combination treatment. However, after 3 h this tendency
vanished and a more evenly balanced relationship between up- and downregulated
phosphorylation events was observed. Considering that in p38 we were inhibiting a kinase, it
is plausible that as a primary response the combination treatment resulted in fewer proteins
being phosphorylated. After 3 h, secondary signaling responses may have led to the initiation
of signaling cascades which involved phosphorylation events therefore achieving a balance
between up- and downregulated DP proteins. To visualize each DP protein and their
phosphorylation patterns across the treatments, heatmaps for both time points were generated
(Figure 4.5 C, D).

97
(A), (B) Mean-difference (MD) plot showing all significantly differentially phosphorylated proteins
upon treatment for 1.5 hours with Compound A and LY vs. Compound A alone. Proteins in red are
more phosphorylated and proteins in blue are less phosphorylated in the combination treatment. Non-
significant phosphorylated proteins are in black. For full list of DP proteins refer to Appendix. (C), (D)
Heatmap and hierarchical clustering of phosphorylated proteins. Changes in phosphorylation induced
by treatment for 1.5 h (C) or 3 h (D) with Compound A (911) in the absence (minLY) and presence
(plusLY) of p38 inhibitor (LY) are indicated by the colours red (upregulated in the combination) or
blue (downregulated in the combination). Grey bars represent missing values. Z-scores for each
replicate in each condition was determined and coloured as shown in the scale bar.
Figure 4.5: Inhibition of p38 induces phosphoproteomic changes with distinct temporal
profile
A
B
C
D
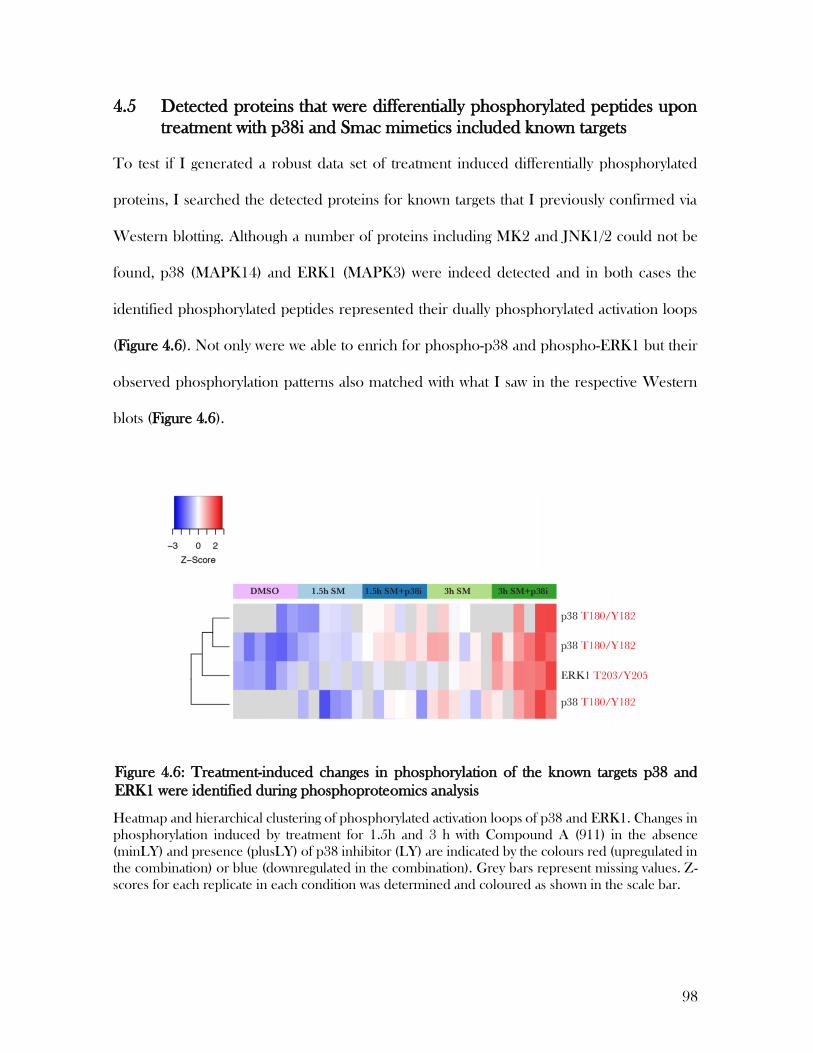
98
4.5 Detected proteins that were differentially phosphorylated peptides upon
treatment with p38i and Smac mimetics included known targets
To test if I generated a robust data set of treatment induced differentially phosphorylated
proteins, I searched the detected proteins for known targets that I previously confirmed via
Western blotting. Although a number of proteins including MK2 and JNK1/2 could not be
found, p38 (MAPK14) and ERK1 (MAPK3) were indeed detected and in both cases the
identified phosphorylated peptides represented their dually phosphorylated activation loops
(Figure 4.6). Not only were we able to enrich for phospho-p38 and phospho-ERK1 but their
observed phosphorylation patterns also matched with what I saw in the respective Western
blots (Figure 4.6).
Heatmap and hierarchical clustering of phosphorylated activation loops of p38 and ERK1. Changes in
phosphorylation induced by treatment for 1.5h and 3 h with Compound A (911) in the absence
(minLY) and presence (plusLY) of p38 inhibitor (LY) are indicated by the colours red (upregulated in
the combination) or blue (downregulated in the combination). Grey bars represent missing values. Z-
scores for each replicate in each condition was determined and coloured as shown in the scale bar.
Figure 4.6: Treatment-induced changes in phosphorylation of the known targets p38 and
ERK1 were identified during phosphoproteomics analysis

99
After confirming that the generated data set of differentially phosphorylated proteins upon
treatment with Smac mimetics and a p38 inhibitor truthfully reflected the behavior of the
known targets p38 and ERK1, it was now appropriate to explore the data set for potentially
novel mediators. A number of approaches can be pursued in order to strategically analyze
such large data sets. One such approach is to rank DP proteins according to their p-value and
further investigate proteins with the highest significance. We therefore generated volcano plots
of DP proteins detected after 1.5 h and 3 h of treatment where proteins were plotted according
to their fold change and p-value and named the 20 proteins with the highest significance (Figure
4.7). As observed previously in the generated heatmaps, after 1.5 h the combination treatment
preferentially induced a reduction in phosphorylation events with 19 of the top 20 DP proteins
being more phosphorylated when treated with Compound A alone. After 3 h however nearly
half the DP proteins that were attributed with the highest significance were more
phosphorylated following the combination treatment. Notably, ERK1 (MAPK3) was amongst
the top hits in the 3 h time point.
To better illustrate the 20 DP proteins whose differences in phosphorylation states were
detected with the highest significance, I generated tables summarizing the gene and protein
names together with their fold change and adjusted p-value while applying the same color
codes as used in the heatmap (Tables 4.1 and 4.2).
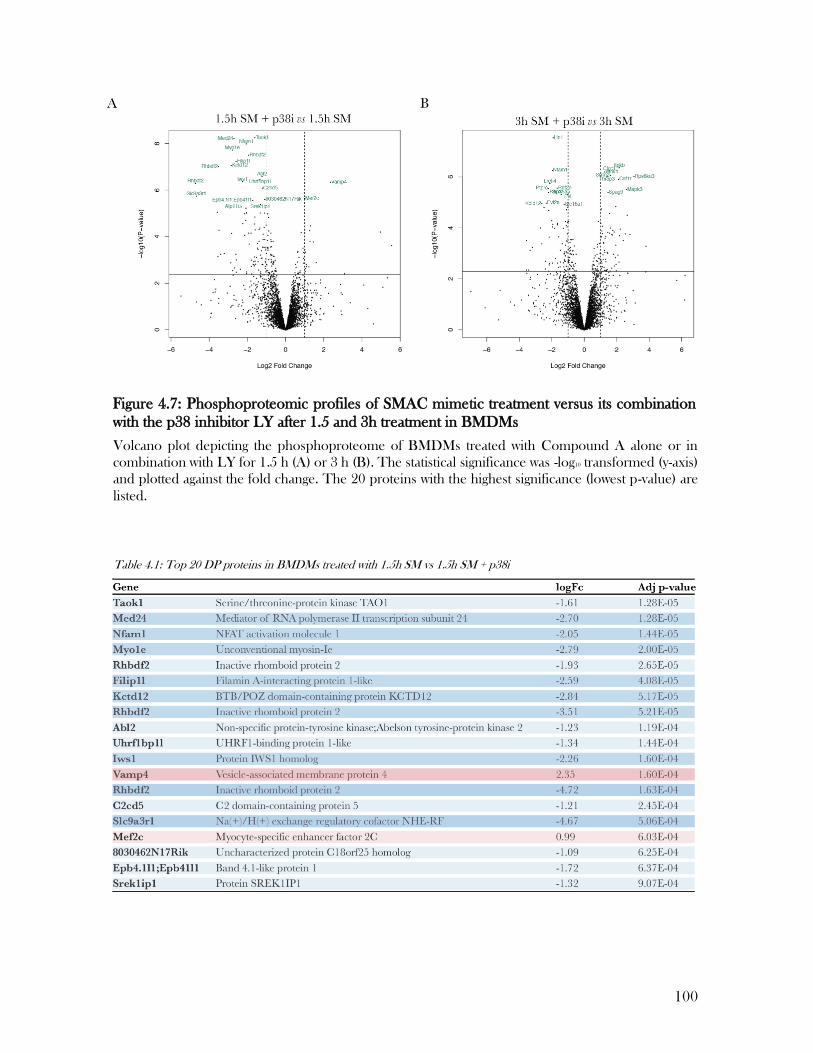
100
Volcano plot depicting the phosphoproteome of BMDMs treated with Compound A alone or in
combination with LY for 1.5 h (A) or 3 h (B). The statistical significance was -log10 transformed (y-axis)
and plotted against the fold change. The 20 proteins with the highest significance (lowest p-value) are
listed.
Figure 4.7: Phosphoproteomic profiles of SMAC mimetic treatment versus its combination
with the p38 inhibitor LY after 1.5 and 3h treatment in BMDMs
Table 4.1: Top 20 DP proteins in BMDMs treated with 1.5h SM vs 1.5h SM + p38i

101
To investigate mediator(s) of signaling transduction and initiation events, we screened for the
enrichment of proteins that represent certain biological processes or signaling pathways using
gene ontology (GO) enrichment analysis and KEGG pathway analysis. We the summarized
the 10 biological processes (GO) and 10 pathways (KEGG) that were detected with the highest
p-values for each time point (Tables 4.3 – 4.6). Notably, “Number of genes/proteins” refers to
the number of proteins that belong to a biological process or pathway while “DP” includes the
proteins whose phosphorylation states changed significantly across the treatments. Finally, I
utilized both the lists of the top 20 DP proteins per timepoint as well as the results generated
during GO and KEGG pathway analysis to identify potential mediators of the killing caused
by the combination treatment of Compound A and LY. Under the following subheadings I
will expand on a number of detected targets and their involvement in pathways that might
contribute to the observed treatment-induced signaling.
Table 4.2: Top 20 DP proteins in BMDMs treated with 3h SM vs 3h SM + p38i
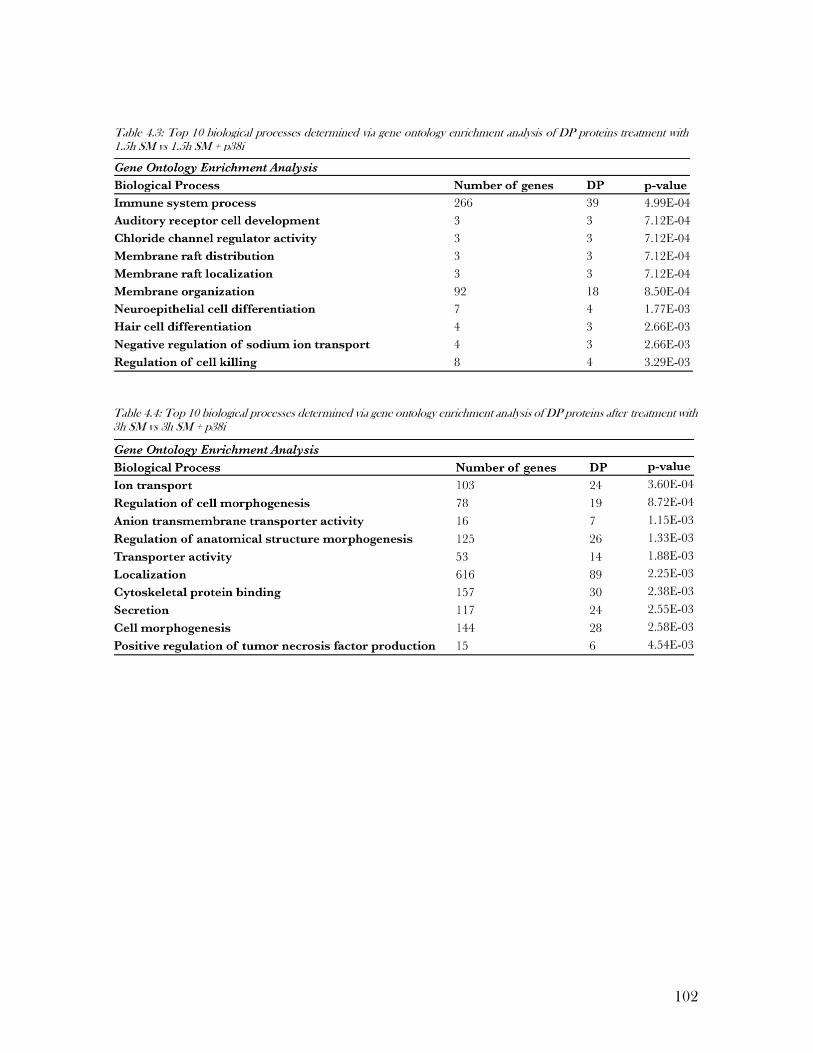
102
Table 4.4: Top 10 biological processes determined via gene ontology enrichment analysis of DP proteins after treatment with 3h SM vs 3h SM + p38i
Table 4.3: Top 10 biological processes determined via gene ontology enrichment analysis of DP proteins treatment with 1.5h SM vs 1.5h SM + p38i

103
Table 4.5: Top 10 pathways determined via KEGG pathway analysis of DP proteins after treatment with 1.5h SM vs 1.5h SM + p38i
Table 4.6: Top 10 pathways determined via KEGG pathway analysis of DP proteins after treatment with 3h SM vs 3h SM +
p38i
4.6 Targeted analysis of differentially phosphorylated proteins reveals
potential novel mediators of treatment-induced cell death
To identify proteins and pathways that may contribute to the treatment responses observed in
BMDMs, that is the prevention (SM) or occurrence of cell death (SM + p38i) and the increase
in TNF production (SM + p38i), I performed a targeted analysis of the biological processes
and KEGG pathways that were found to be enriched in Tables 4.3 - 4.6. During this analysis,
104
I searched for differentially phosphorylated proteins that are associated with (A) the induction
or prevention of cell death, (B) cell survival signaling or (C) the regulation of TNF expression.
Proteins that were identified as potential mediators of the cell death induced by the
combination treatment of SM and p38i are discussed in the following.
4.6.1 Inhibition of Apoptosis
4.6.1.1 The pro-apoptotic protein Bim was preferentially phosphorylated in BMDMs
treated with Compound A
Treatment with Compound A alone fails to induce cell death in BMDMs. I therefore searched
the phosphoproteomic dataset for DP proteins that might have prevented apoptosis when
IAPs were inhibited. By doing so, I identified that Bim, a pro-apoptotic member of the Bcl-2
protein family, was preferentially phosphorylated in BMDMs treated with smac mimetic
alone. The role of Bim in the intrinsic apoptotic pathway has been well described. Bim, a
BH3-only protein, is required for activation of BAX leading to the initiation of mitochondrial
apoptosis (H. Kim et al., 2009). Bim activity itself is regulated via phosphorylation by a number
of kinases. MEK/ERK-mediated phosphorylation affects the binding of Bim to pro-survival
Bcl-2 family members as well as its turnover (R. Ley et al., 2005; Rebecca Ley et al., 2004).
Upon exposure to apoptotic stimuli, BimEL levels, Bim’s most abundant isoform, become
strongly elevated in B and T lymphoid cells while in mitogenically stimulated cells, BimEL is
rapidly phosphorylated leading to its levels to decline (O'Reilly et al., 2009). MEK/ERK
mediated BimEL phosphorylation which inhibits Bim activation by inducing its degradation
via the proteasome, has been identified to target Ser65 (Hübner et al., 2008). Bim activity can
furthermore be regulated by the Src family kinase Lyn which can phosphorylate the Bcl-2
protein family member on tyrosine residues 92 and 161 resulting in the inhibition of its pro-
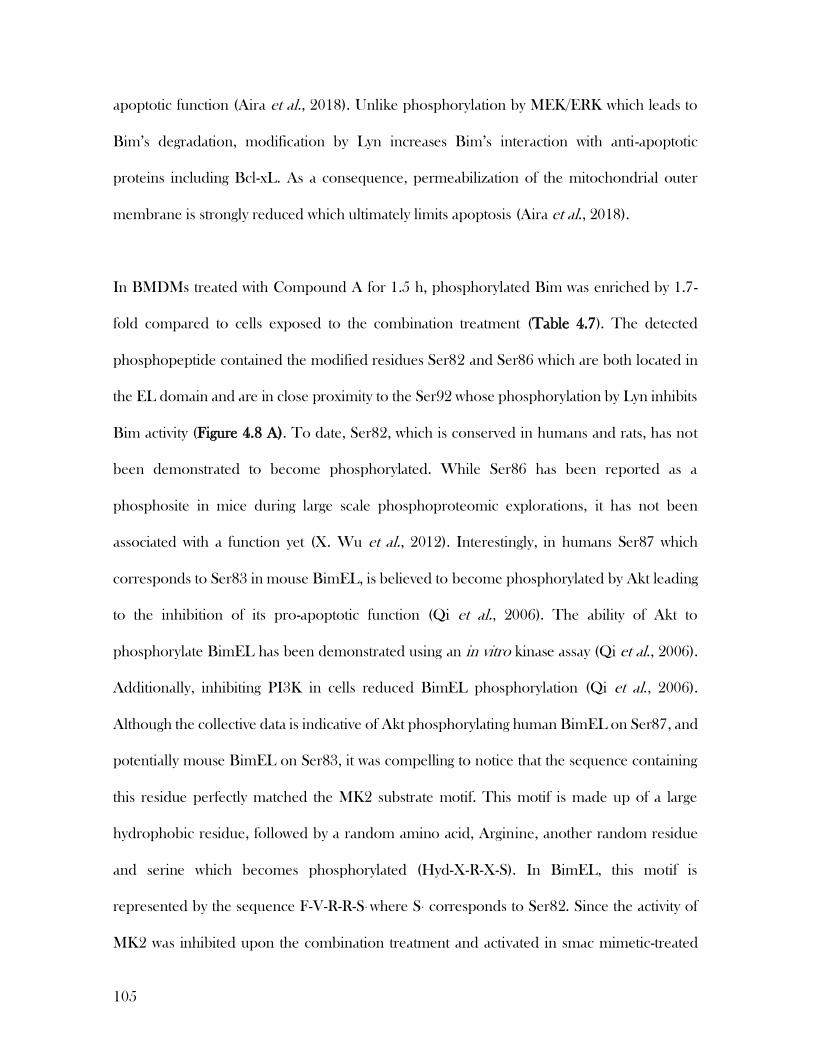
105
apoptotic function (Aira et al., 2018). Unlike phosphorylation by MEK/ERK which leads to
Bim’s degradation, modification by Lyn increases Bim’s interaction with anti-apoptotic
proteins including Bcl-xL. As a consequence, permeabilization of the mitochondrial outer
membrane is strongly reduced which ultimately limits apoptosis (Aira et al., 2018).
In BMDMs treated with Compound A for 1.5 h, phosphorylated Bim was enriched by 1.7-
fold compared to cells exposed to the combination treatment (Table 4.7). The detected
phosphopeptide contained the modified residues Ser82 and Ser86 which are both located in
the EL domain and are in close proximity to the Ser92 whose phosphorylation by Lyn inhibits
Bim activity (Figure 4.8 A). To date, Ser82, which is conserved in humans and rats, has not
been demonstrated to become phosphorylated. While Ser86 has been reported as a
phosphosite in mice during large scale phosphoproteomic explorations, it has not been
associated with a function yet (X. Wu et al., 2012). Interestingly, in humans Ser87 which
corresponds to Ser83 in mouse BimEL, is believed to become phosphorylated by Akt leading
to the inhibition of its pro-apoptotic function (Qi et al., 2006). The ability of Akt to
phosphorylate BimEL has been demonstrated using an in vitro kinase assay (Qi et al., 2006).
Additionally, inhibiting PI3K in cells reduced BimEL phosphorylation (Qi et al., 2006).
Although the collective data is indicative of Akt phosphorylating human BimEL on Ser87, and
potentially mouse BimEL on Ser83, it was compelling to notice that the sequence containing
this residue perfectly matched the MK2 substrate motif. This motif is made up of a large
hydrophobic residue, followed by a random amino acid, Arginine, another random residue
and serine which becomes phosphorylated (Hyd-X-R-X-S). In BimEL, this motif is
represented by the sequence F-V-R-R-S* where S* corresponds to Ser82. Since the activity of
MK2 was inhibited upon the combination treatment and activated in smac mimetic-treated
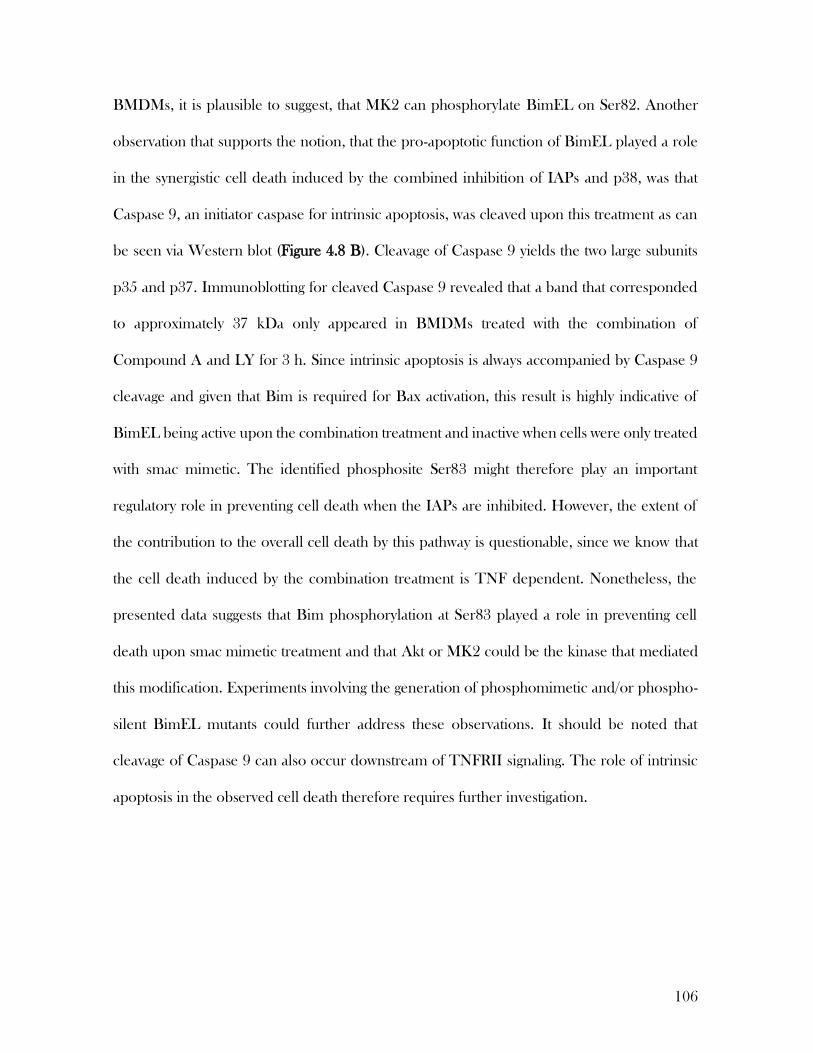
106
BMDMs, it is plausible to suggest, that MK2 can phosphorylate BimEL on Ser82. Another
observation that supports the notion, that the pro-apoptotic function of BimEL played a role
in the synergistic cell death induced by the combined inhibition of IAPs and p38, was that
Caspase 9, an initiator caspase for intrinsic apoptosis, was cleaved upon this treatment as can
be seen via Western blot (Figure 4.8 B). Cleavage of Caspase 9 yields the two large subunits
p35 and p37. Immunoblotting for cleaved Caspase 9 revealed that a band that corresponded
to approximately 37 kDa only appeared in BMDMs treated with the combination of
Compound A and LY for 3 h. Since intrinsic apoptosis is always accompanied by Caspase 9
cleavage and given that Bim is required for Bax activation, this result is highly indicative of
BimEL being active upon the combination treatment and inactive when cells were only treated
with smac mimetic. The identified phosphosite Ser83 might therefore play an important
regulatory role in preventing cell death when the IAPs are inhibited. However, the extent of
the contribution to the overall cell death by this pathway is questionable, since we know that
the cell death induced by the combination treatment is TNF dependent. Nonetheless, the
presented data suggests that Bim phosphorylation at Ser83 played a role in preventing cell
death upon smac mimetic treatment and that Akt or MK2 could be the kinase that mediated
this modification. Experiments involving the generation of phosphomimetic and/or phospho-
silent BimEL mutants could further address these observations. It should be noted that
cleavage of Caspase 9 can also occur downstream of TNFRII signaling. The role of intrinsic
apoptosis in the observed cell death therefore requires further investigation.

107
(A) Schematic representation of BimEL. The numbers refer to amino acids flanking the functional
domains. Residues in pink represent phosphorylated amino acids identified in BMDMs treated with
Compound A, while grey/black residues are known phosphosites that were not detected. Phosphosite
S82 contains the MK2 motif while the corresponding residue in humans has been observed to become
phosphorylated by Akt. BimEL can be phosphorylated at S65 by ERK which causes to its degradation,
or by JNK which activates Bim (O'Reilly et al., 2009; Putcha et al., 2003). Phosphorylation of Y92 by
LYN inhibits the pro-apoptotic function of Bim. EL = domain unique to BimEL isoform; BH3 = Bcl-
2 homology 3 domain. (B) BMDMs from six mice were treated with DMSO (untreated control),
Compound A (SM, 500 nM) alone or in the presence of p38 inhibitor LY (1 µM) for 1.5 h or 3 h.
Lysates of treated BMDMs were subjected to Western blotting and membranes were probed for
cleaved Caspase 9 to test for evidence of Bim activity leading to cell death via intrinsic apoptosis .
Probing for actin served as a loading control. The blot is representative of six biological replicates.
B
Table 4.7: Phosphorylation status of BimEL after treatment with SM + p38i
Figure 4.8: The pro-apoptotic protein Bim is less phosphorylated in BMDMs treated with SM
+ p38i where intrinsic apoptosis occurs
A
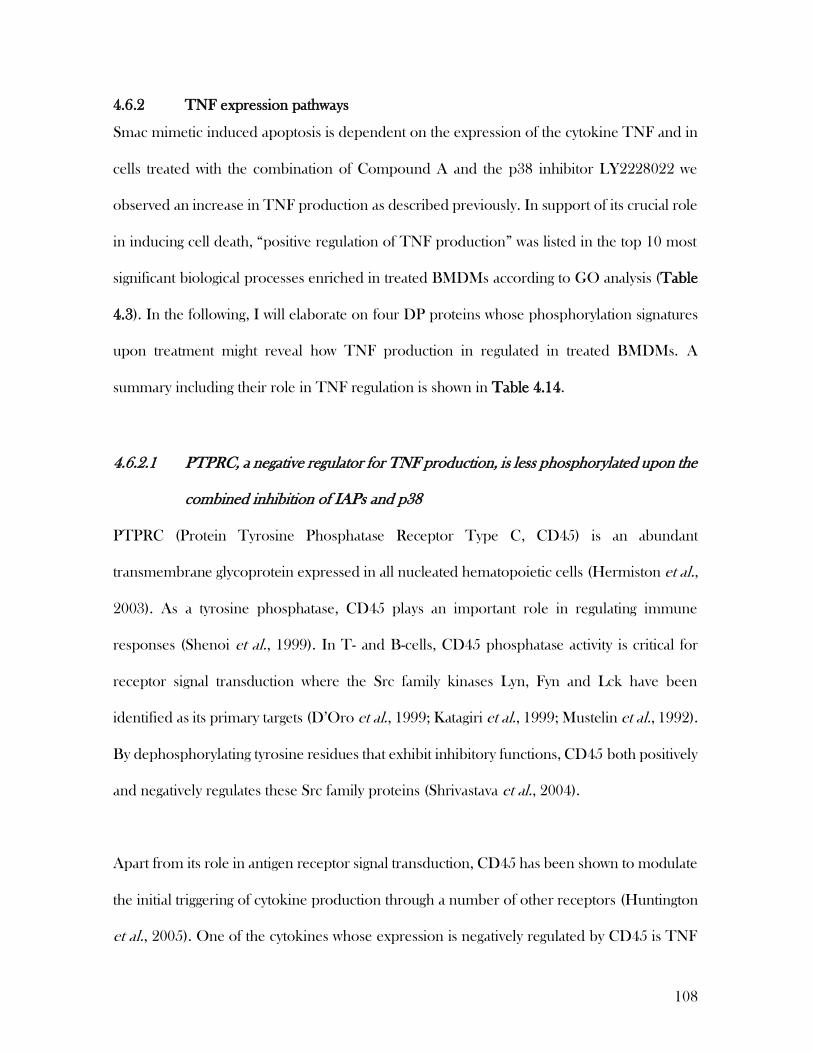
108
4.6.2 TNF expression pathways
Smac mimetic induced apoptosis is dependent on the expression of the cytokine TNF and in
cells treated with the combination of Compound A and the p38 inhibitor LY2228022 we
observed an increase in TNF production as described previously. In support of its crucial role
in inducing cell death, “positive regulation of TNF production” was listed in the top 10 most
significant biological processes enriched in treated BMDMs according to GO analysis (Table
4.3). In the following, I will elaborate on four DP proteins whose phosphorylation signatures
upon treatment might reveal how TNF production in regulated in treated BMDMs. A
summary including their role in TNF regulation is shown in Table 4.14.
4.6.2.1 PTPRC, a negative regulator for TNF production, is less phosphorylated upon the
combined inhibition of IAPs and p38
PTPRC (Protein Tyrosine Phosphatase Receptor Type C, CD45) is an abundant
transmembrane glycoprotein expressed in all nucleated hematopoietic cells (Hermiston et al.,
2003). As a tyrosine phosphatase, CD45 plays an important role in regulating immune
responses (Shenoi et al., 1999). In T- and B-cells, CD45 phosphatase activity is critical for
receptor signal transduction where the Src family kinases Lyn, Fyn and Lck have been
identified as its primary targets (D’Oro et al., 1999; Katagiri et al., 1999; Mustelin et al., 1992).
By dephosphorylating tyrosine residues that exhibit inhibitory functions, CD45 both positively
and negatively regulates these Src family proteins (Shrivastava et al., 2004).
Apart from its role in antigen receptor signal transduction, CD45 has been shown to modulate
the initial triggering of cytokine production through a number of other receptors (Huntington
et al., 2005). One of the cytokines whose expression is negatively regulated by CD45 is TNF

109
(Piercy et al., 2006). In BMDMs and DCs lacking CD45, TLR7 stimulation lead to increased
TNF- α and IL-6 production as well as enhanced NF-κB activity (Piercy et al., 2006).
Furthermore, CD45 was not only shown to negatively regulate TNF- α and IL-6 production
via TLRs, but also reduced the response to cytokines such as IFN- α (Piercy et al., 2006).
Structural analysis of the receptor revealed that upon dimerization, CD45 activity is inhibited
(Hermiston et al., 2003). Dimerization is believed to be regulated via binding of CD45-AP
(CD45 associated protein) as well as modifications of the extracellular domain including
sialylation and O-glycosylation (Z. Xu et al., 2002). Furthermore, CD45 phosphatase activity
is regulated by phosphorylation of its phosphatase II domain at residues Ser990, Ser993,
Ser994 and Ser998 where phosphorylation by CK2 induces enzyme activity (Y. Wang et al.,
1999).
In BMDMs treated with Compound A, phosphorylated CD45 was enriched by 3-fold (1.5 h)
and 4.6-fold (3 h) compared to cells treated with the combination of Compound A and p38i
(Table 4.8). For both timepoints, differentially phosphorylated CD45 was ranked in the top
30 of the most significant DP proteins. The detected phosphopeptide harbored the modified
residues Thr1267 and Ser1286 which both have been described to become phosphorylated
during large scale phosphoproteomic studies (Figure 4.9). However, their functional roles have
not been determined yet. A number of observations support the notion that CD45 is in fact
inhibited in the combination treatment but active when cells are treated with SM alone.
As described above, CD45 positively regulates Src family kinases including Lyn and Fyn.
Although I was not able to detect phosphorylated Lyn and Fyn via mass spectrometry,
phosphorylated Fyb (Fyn binding protein), which has also been indicated to interact with

110
CD45 (Linhua Zhang, 2005 unpublished), was strongly enriched in Compound A treated
BMDMs (Table 4.9). Two phosphosites that were identified following using mass
spectrometry, Tyr559 and Ser561, are located within the C-terminal region of Fyb (Figure
4.10). Both residues are conserved across mouse, rat and human FYB. Phosphorylation by
Fyn of Tyr584 and Tyr687 is required for binding of the SH2 domain-containing leukocyte
phosphoprotein of 76 kDa (SLP-76) (Geng et al., 1999; Veale et al., 1999). Although
phosphorylation of neither of these residues were observed, the close proximity of Tyr559
and Ser561 to the residue Tyr584 is again indicative of the detected phosphorylation being of
functional importance. According to phosphosite.org, phosphorylation of CD45 on Tyr559 is
the most cited modification, although it has predominantly been observed in T cells.
As mentioned above, activation of Fyb via tyrosine phosphorylation can be induced by Fyn
(Veale et al., 1999). Searching the phosphorylated peptide sequence that contained the
modified residue Tyr559 for kinase motifs using the tool PhosphoMotif Finder, revealed that
this phosphorylation could be catalyzed by a Src kinase family member. Although Tyr559 has
not been described as a Fyn target in the literature, it is possible that this Src kinase family
member in fact is responsible for the modification of this residue.
The notion that CD45 activity induced the activation of Src family kinases in BMDMs treated
with Compound A is further supported by the detection of phosphorylated EVL in the same
samples (Table 4.10 & Figure 4.11). EVL (En1/VASP-like protein) is an actin associated,
cytoskeletal effector protein that, upon activation, associates with Fyb and SLP-76 downstream
of Fyn (Krause et al., 2000). Phosphorylated EVL (Ser329) was enriched in Compound A
treated BMDMs by 2-fold in both timepoints while in the 3 h time point it was the 18 th most

111
significant DP protein. Although phosphorylation of Ser329 has been frequently observed, it
has not been assigned with a function yet. However, it is noteworthy that this modification has
been identified in association with Akt and mTOR signaling (Minard et al., 2016; Reinhard et
al., 1997; Y. Yu et al., 2011). When searching the sequence of the phosphorylated peptide for
a kinase motif, it was revealed that the phosphosite matches the motif of PKA. Interestingly,
PKA is known for its ability to phosphorylate EVL leading to its activation and complex
formation (Lambrechts et al., 2000) further indicating that modification of Ser329 is activating
the protein.
In summary, the presented evidence suggests that the treatment induced phosphorylation
signature of CD45 reflects its activation status with the phosphatase being active when cells
were treated with Smac mimetic alone. In these BMDMs, CD45 activity might suppress TNF-
α production which is required for the induction of apoptosis in the absence of IAPs.
However, more evidence is required to confidently attribute a role in the prevention of cell
death in Smac mimetic-treated BMDMs to the receptor CD45. Experiments, where CD45
and IAPs are simultaneously inhibited would provide a powerful insight into the receptor’s
role in TNF- α production in those cells.
Table 4.8: Phosphorylation status of CD45 after treatment with SM + p38i

112
Structural representation of CD45. The extracellular region contains a serine-threonine-rich domain
followed by fibronectin type III-like repeats. The first membrane proximal domain has PTPase activity,
while the second domain (D2) is lacking PTPase activity. However, the D2-domain is critical for proper
folding and substrate recruitment. Residues shown in pink represent amino acids that have been
identified to be phosphorylated in BMDMs treated with Compound A.
Figure 4.9: The phosphatase CD45 is a negative regulator of TNF production and is less
phosphorylated in BMDMs treated with SM + p38i
Table 4.9: Phosphorylation status of FYB after treatment with SM + p38i
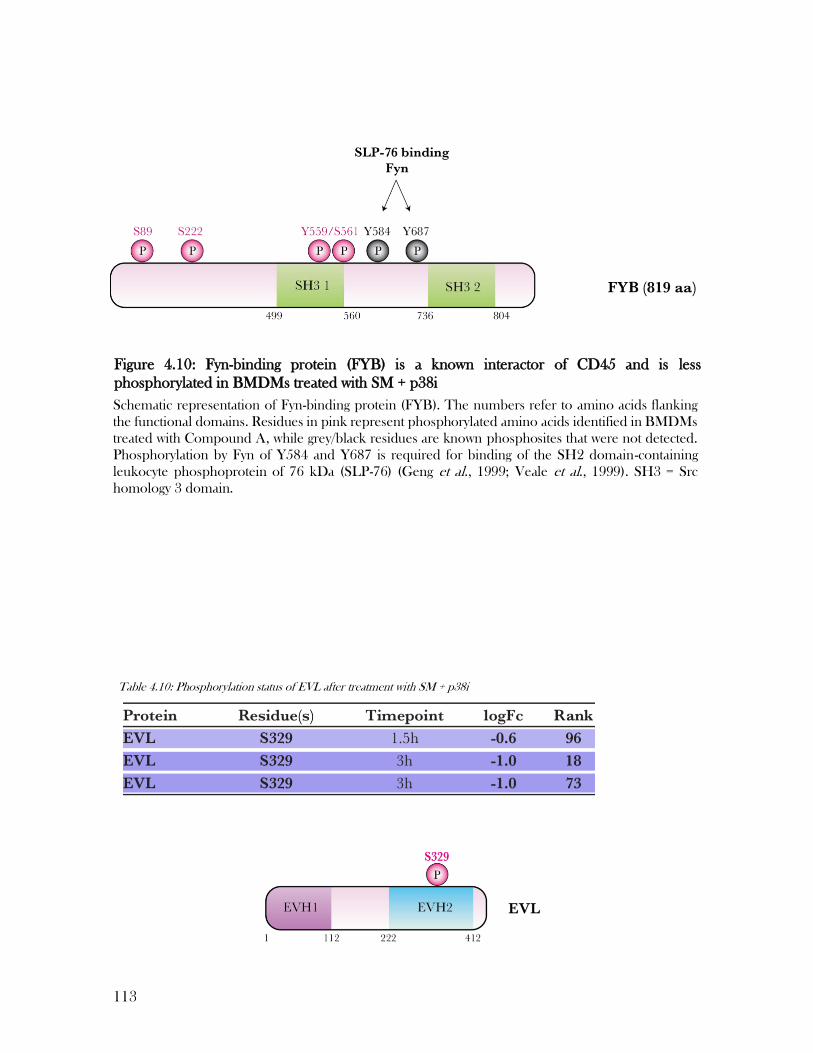
113
Schematic representation of Fyn-binding protein (FYB). The numbers refer to amino acids flanking
the functional domains. Residues in pink represent phosphorylated amino acids identified in BMDMs
treated with Compound A, while grey/black residues are known phosphosites that were not detected.
Phosphorylation by Fyn of Y584 and Y687 is required for binding of the SH2 domain-containing
leukocyte phosphoprotein of 76 kDa (SLP-76) (Geng et al., 1999; Veale et al., 1999). SH3 = Src
homology 3 domain.
Figure 4.10: Fyn-binding protein (FYB) is a known interactor of CD45 and is less
phosphorylated in BMDMs treated with SM + p38i
Table 4.10: Phosphorylation status of EVL after treatment with SM + p38i
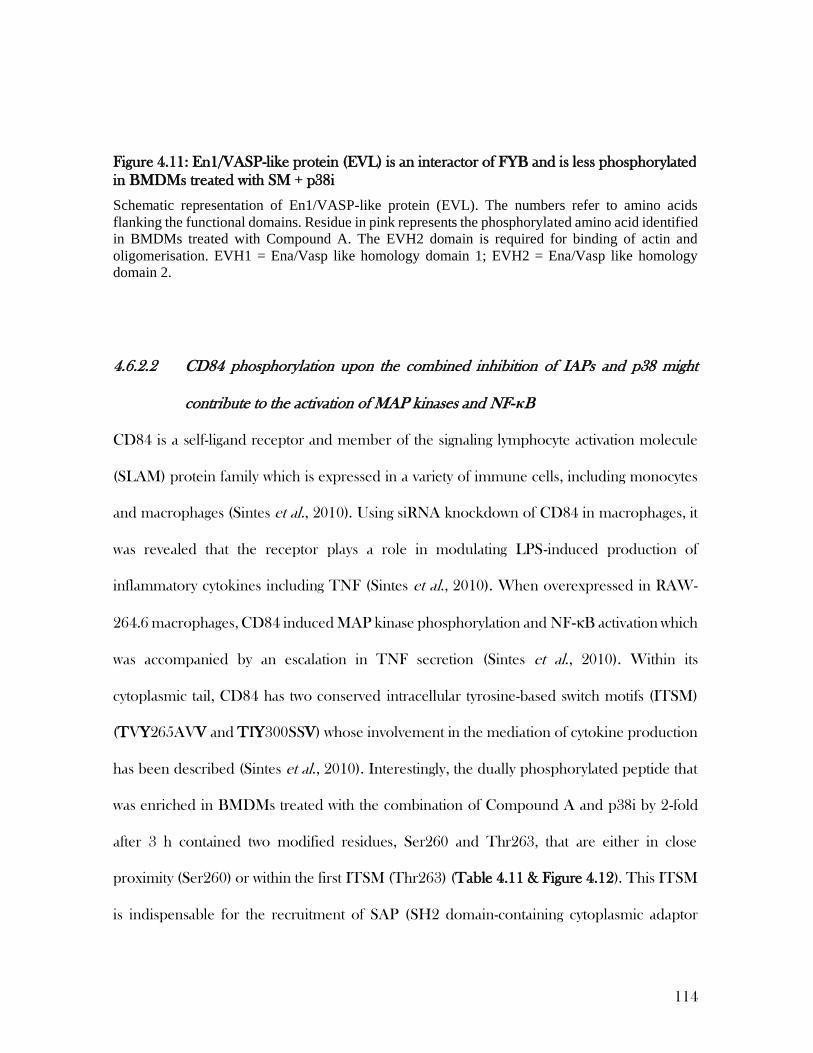
114
Schematic representation of En1/VASP-like protein (EVL). The numbers refer to amino acids
flanking the functional domains. Residue in pink represents the phosphorylated amino acid identified
in BMDMs treated with Compound A. The EVH2 domain is required for binding of actin and
oligomerisation. EVH1 = Ena/Vasp like homology domain 1; EVH2 = Ena/Vasp like homology
domain 2.
4.6.2.2 CD84 phosphorylation upon the combined inhibition of IAPs and p38 might
contribute to the activation of MAP kinases and NF‐κB
CD84 is a self-ligand receptor and member of the signaling lymphocyte activation molecule
(SLAM) protein family which is expressed in a variety of immune cells, including monocytes
and macrophages (Sintes et al., 2010). Using siRNA knockdown of CD84 in macrophages, it
was revealed that the receptor plays a role in modulating LPS-induced production of
inflammatory cytokines including TNF (Sintes et al., 2010). When overexpressed in RAW-
264.6 macrophages, CD84 induced MAP kinase phosphorylation and NF‐κB activation which
was accompanied by an escalation in TNF secretion (Sintes et al., 2010). Within its
cytoplasmic tail, CD84 has two conserved intracellular tyrosine-based switch motifs (ITSM)
(TVY265AVV and TIY300SSV) whose involvement in the mediation of cytokine production
has been described (Sintes et al., 2010). Interestingly, the dually phosphorylated peptide that
was enriched in BMDMs treated with the combination of Compound A and p38i by 2-fold
after 3 h contained two modified residues, Ser260 and Thr263, that are either in close
proximity (Ser260) or within the first ITSM (Thr263) (Table 4.11 & Figure 4.12). This ITSM
is indispensable for the recruitment of SAP (SH2 domain-containing cytoplasmic adaptor
Figure 4.11: En1/VASP-like protein (EVL) is an interactor of FYB and is less phosphorylated
in BMDMs treated with SM + p38i

115
protein SLAM-associated protein) which occurs upon TLR signaling and is followed by
MAPK phosphorylation and NF- κB activation. Although SAP binding can be initiated by
tyrosine phosphorylation of Tyr265, modification of this residue is not required for their
association (Tangye et al., 2003). As described previously, in BMDMs treated with Smac
mimetic and a p38 inhibitor, we observe strong activation of the MAP kinases ERK1/2 and
JNK1/2 which is accompanied by an increase in TNF secretion. We can therefore speculate
that ITSM phosphorylation of CD84 may lead to the recruitment of SAP and the activation
of the MAP kinase pathways ERK1/2 and JNK1/2, contributing to the increased
phosphorylation of these kinases and the subsequent rise in TNF secretion. How the self-
ligand receptor CD84 became phosphorylated and potentially activated, remains unclear. To
confirm, that CD84 phosphorylation plays a significant role in the activation of the MAP
kinases ERK1/2 and JNK1/2 and the subsequent induction of TNF secretion, further
experiments involving the inhibition of CD84 and the generation of CD84 phospho mutants
are required.
Table 4.11: Phosphorylation status of CD84 after treatment with SM + p38i

116
Schematic representation of CD84. The numbers refer to amino acids flanking the functional domains.
Residues in pink represent phosphorylated amino acids identified in BMDMs treated with Compound
A, while black residues are known phosphosites that were not detected. ITSM is indispensable for
CD84 activity and subsequent MAPK phosphorylation and NF-κB activation which also requires
phosphorylation of Y300 (Sintes et al., 2010). ITSM = immunoreceptor tyrosine-based switch motifs.
4.6.2.3 NFAM1 was preferentially phosphorylated in BMDMs treated with Compound
A, potentially leading to its inactivation and the suppression of TNF-α promoter
transcription
NFAM1 (NFAT1 activation molecule 1) is an immunoreceptor tyrosine-based activation motif
(ITAM)-bearing cell surface molecule belonging to the Ig superfamily which is predominantly
expressed in B- and T-cells as well as macrophages and neutrophils (Ohtsuka et al., 2004).
Upon phosphorylation of two tyrosine residues within the ITAM by Src family kinases, ZAP-
70/Syk is recruited to phospho-ITAM (Ohtsuka et al., 2004). Binding and subsequent
activation of ZAP-70/Syk in turn transduces a downstream signaling cascade by
phosphorylating a number of effector molecules leading to Ca2+-influx and the activation of the
Figure 4.12: The receptor CD84 can induce TNF secretion through activating MAP kinases
and is phosphorylated in BMDMs treated with SM + p38i

117
calcium-dependent phosphatase calcineurin (Sambandam et al., 2017). Upon activation,
calcineurin dephosphorylates NFAT (nuclear factor of activated T cells) causing it to
translocate to the nucleus where NFAT shows increased transcriptional function (Kiani et al.,
2000; Macian et al., 2001).
When first identified, NFAM1 was characterized as a protein whose expression activated the
transcription of TNF-α promoters, which was mediated through the calcineurin/NFAT-
signaling pathway (J. Yang et al., 2003). As described above, to activate NFAM1,
phosphorylation of two tyrosine residues within the ITAM, Tyr215 and Tyr226, is required
to initiate its activation and to subsequently induce the expression of TNF-α promoters.
Phosphorylated NFAM1 appeared in the top 4 most significant DP proteins for both time
points upon treatment and was found to be enriched 4-fold in BMDMs treated with
Compound A (Table 4.12). The modified residues were identified as Ser235 and Ser241
which, interestingly, are located in close proximity to the ITAM (Figure 4.13). Although both
phosphosites have been previously reported, no functional association has been made to date.
If phosphorylation of Ser235 and Ser241 lead to NFAM1 activation, we would expect to detect
activated calcineurin/NFAT-signaling characterized by Ca2+ influx and increased TNF-α
expression. However, indications for the occurrence of these events were found in BMDMs
treated with the combination of Compound A and p38i, where phospho-NFAM1 was detected
at lower rates. Suggestive of increased Ca2+ influx in cells exposed to the combination treatment
was the observation of phosphorylated CLCC1 (Chloride channel CLIC-like protein 1) which
was significantly enriched by 4.6-fold in these samples. Although CLCC1 is a chloride channel,
it has also been suggested to be calcium sensitive and interactions with calreticulin, a major
calcium binding protein, have been recently reported (Li et al., 2018). The detected

118
cytoplasmic phosphosites Ser429-p and Ser433-p are both conserved across mice, humans
and rats and although their functions remain unknown, the modified residues are the two most
commonly reported CLCC1phosphosites (Phosphosite.org)
Another indicator for enhanced Ca2+ influx in BMDMs treated with Compound A and p38i
was the detection of CaMKK2 (Calcium/calmodulin-dependent protein kinase 2) being
preferentially phosphorylated in these cells. Here, phospho-CaMKK2 was enriched by 2-fold.
The identified phosphosite Ser495-p is located within CaMKK2’s calmodulin binding site,
while the amino acid sequence surrounding this residue matches the calmodulin-dependent
protein kinase II substrate motif (Figure 4.13). CaMKK2 activity is stimulated in response to
Ca2+ signals and isoforms lacking the calmodulin-binding domain are inactive (L. S. Hsu et al.,
2001). In light of this information, it is possible that phosphorylation of the calmodulin binding
motif at Ser495 reflected activated CaMKK2 which in turn would be indicative of increased
Ca2+ influx in BMDMs treated with the Compound A/p38i combination.
If Ca2+ influx was in fact increased upon combination treatment, it would be plausible that
phosphorylated NFAM1 detected in BMDMs treated with only Compound A represented
the inactive form of this ITAM-bearing receptor. Given the close proximity of the modified
residues Ser235-p and Ser241-p to the ITAM, whose phosphorylation leads to NFAM1
activation, it appears reasonable to suggest that the identified phosphosites contribute to the
inhibition of the protein. Consequently, if NFAM1 activation was prevented in smac mimetic
treated cells, NFAT-induced transcription of TNF-α promoters would also fail to occur.
Although the correlations I have presented here are highly speculative and require further
research, the fact that phospho-NFAM1 was ranked in the top 4 most significant DP proteins

119
for both timepoints, strongly suggests a role for this receptor in the treatment responses
observed for BMDMs.
Table 4.12: Phosphorylation status of NFAM1 after treatment with SM + p38i
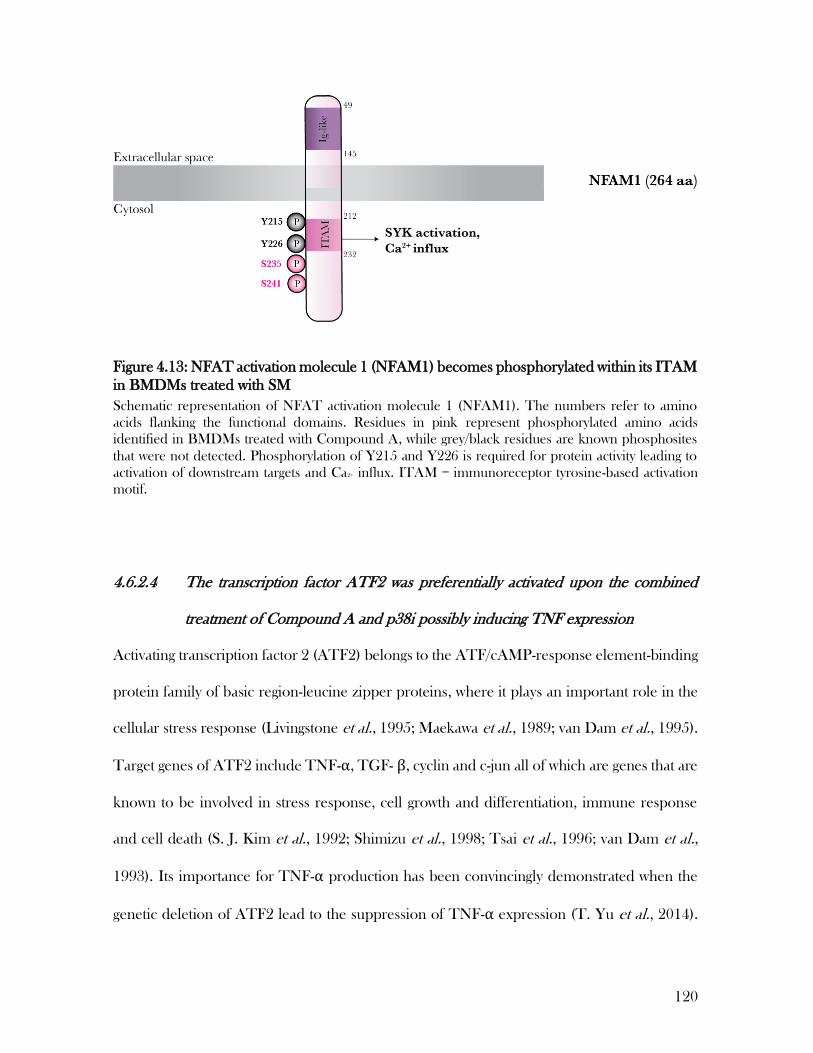
120
Schematic representation of NFAT activation molecule 1 (NFAM1). The numbers refer to amino
acids flanking the functional domains. Residues in pink represent phosphorylated amino acids
identified in BMDMs treated with Compound A, while grey/black residues are known phosphosites
that were not detected. Phosphorylation of Y215 and Y226 is required for protein activity leading to
activation of downstream targets and Ca2+ influx. ITAM = immunoreceptor tyrosine-based activation
motif.
4.6.2.4 The transcription factor ATF2 was preferentially activated upon the combined
treatment of Compound A and p38i possibly inducing TNF expression
Activating transcription factor 2 (ATF2) belongs to the ATF/cAMP-response element-binding
protein family of basic region-leucine zipper proteins, where it plays an important role in the
cellular stress response (Livingstone et al., 1995; Maekawa et al., 1989; van Dam et al., 1995).
Target genes of ATF2 include TNF-α, TGF- β, cyclin and c-jun all of which are genes that are
known to be involved in stress response, cell growth and differentiation, immune response
and cell death (S. J. Kim et al., 1992; Shimizu et al., 1998; Tsai et al., 1996; van Dam et al.,
1993). Its importance for TNF-α production has been convincingly demonstrated when the
genetic deletion of ATF2 lead to the suppression of TNF-α expression (T. Yu et al., 2014).
Figure 4.13: NFAT activation molecule 1 (NFAM1) becomes phosphorylated within its ITAM
in BMDMs treated with SM

121
ATF2 transcriptional activity is induced by the dual phosphorylation of Thr51 and Thr53 by
MAP kinases. Here, JNK1/2 and p38 have been described to phosphorylate Thr51, while
phosphorylation of Thr53 is predominantly mediated by ERK1/2 (Ouwens et al., 2002).
In BMDMs treated with Compound A and p38i, phospho-ATF2 was enriched by 2-fold in
both timepoints while total ATF2 levels were consistent across all samples (Table 4.13; Figure
4.14 B). Interestingly, the detected phosphopeptide harbored the described modified residues
Thr51 and Thr53 indicating that the transcription factor was activated upon the combination
treatment (Figure 4.14 A). Since both ERK1/2 and JNK1/2 are also strongly activated under
these conditions, this observation was in line with our current knowledge of treatment induced
signaling. Activated ATF2 could therefore have contributed to the increased expression of
TNF in these BMDMs.
Table 4.13: Phosphorylation status of ATF2 after treatment with SM + p38i

122
(A) Schematic representation of activating transcription factor 2 (ATF2). The numbers refer to amino
acids flanking the functional domains. Residues in pink represent phosphorylated amino acids
identified in BMDMs treated with Compound A and p38i. ATF2 transcriptional activity is induced by
the dual phosphorylation of Thr51 (JNK1/2, p38) and Thr53 (predominantly ERK1/2, less: JNK1/2
and p38). SH2/SH3 = Src homology 2/3 domain; KD = kinase domain. (B) BMDMs from six mice
were treated with DMSO (untreated control), Compound A (SM, 500 nM) alone or in the presence
of p38 inhibitor LY (1 µM) for 1.5 h or 3 h. Lysates of treated BMDMs were subjected to Western
blotting and membranes were probed for ATF2 to determine if differential phosphorylation was
caused by varying ATF2 expression levels. Probing for actin served as a loading control. The blot is
representative of six biological replicates.
Figure 4.14: Activating transcription factor 2 (ATF2) is important for TNF- production and
is phosphorylated in BMDMs treated with SM + p38i while total ATF2 levels are consistent
across all treatments
B
A

123
4.6.3 Cell survival pathways
4.6.3.1 Novel phosphorylation sites in CSF1R might facilitate treatment-induced cell death
by inhibiting the activation of PI3K/Akt
One of the most compelling hits identified during the phosphoproteomics screen was the
macrophage colony-stimulating factor 1 receptor (CSF1R) since it is involved in a number of
pathways that were strongly enriched upon KEGG pathway analysis (MAPK, Rap1, PI3K-Akt
and Ras signalling pathways). Of the four detected phosphoserines on CSF1R, two have never
been reported before (S731, S734) while the two that have been described in the literature
(S711, S714) have no known function. The four serines appeared to be preferentially
phosphorylated upon treatment with the combination of Compound A and p38i for 3 h
(Figure 4.15 & Figure 4.16; Table 4.14) with the median increase in phosphorylation
compared to the single agent treatment being approximately 4-fold (logFc = 2.1).
CSF1R is a tyrosine-protein kinase which acts as a cell surface receptor for the cytokines CSF1
and IL-34 is primarily expressed on monocytes and macrophages (Nakamichi et al., 2013;
Table 4.14: Differentially phosphorylated regulators of TNF production in BMDMs treated with SM vs SM + p38i
124
Sasmono et al., 2003). In those cell types, CSF1R-mediated signalling plays an essential role
in survival, proliferation and differentiation (Chang et al., 2009; Kelley et al., 1999; Murray et
al., 2000; Tushinski et al., 1983). A number of phosphorylation sites and their contribution to
signalling through this receptor have been well described in the literature (Figure 4.16). When
projecting the detected phosphoserines onto the sequence of activated CSF1R, their proximity
to Tyr721, a tyrosine residue that can be phosphorylated via autophosphorylation and that is
essential for the interaction with PI3K, was striking (Stanley et al., 2014). The four serine
residues flank Tyr721 in pairs with the maximal distance between a phosphoserine and Tyr721
being only 13 amino acids (Ser734). I hypothesised that the simultaneous phosphorylation of
Ser711, Ser714, Ser731 and Ser734 could negatively impact the phosphorylation of Tyr721
by inhibiting autophosphorylation of that residue, preventing the interaction of CSF1R with
PI3K. Since this interaction is required for the phosphorylation and activation of Akt, I further
hypothesized that phosphorylation of the four serines could negatively regulate Akt activation.

125
Heatmap and hierarchical clustering of phosphorylated CSF1R. Changes in phosphorylation induced
by treatment for 1.5 h and 3 h with Compound A (911) in the absence (minLY) and presence (plusLY)
of p38 inhibitor (LY) are indicated by the colours red (upregulated in the combination) or blue
(downregulated in the combination). Grey bars represent missing values. Z-scores for each replicate in
each condition was determined and coloured as shown in the scale bar.
Figure 4.15: CSF1R was preferentially phosphorylated upon 3 h treatment with Compound
A and p38i
Table 4.15: Phosphorylation status of CSF1R after treatment with SM + p38i

126
Schematic representation of the receptor for macrophage colony-stimulating factor (M-CSF) showing
subunits, structural elements and phospho-sites of known function (black) as well as treatment-induced
phosphorylated residues identified during phosphoproteomics analysis. CSF1R is a homodimeric type
III receptor tyrosine kinase (Hamilton, 2008). Phospho-Y721 is required for the phosphorylation and
activation of phosphoinositide-3-kinase (PI3K) which in turn phosphorylates phosphatidylinositol
(4,5)-bisphosphate (PIP2) leading to the activation of Akt. Residues S711, S714, S731 and S734 (pink)
flank Y721 and are preferentially phosphorylated when BMDMs are treated with Compound A and
p38i which might prevent the phosphorylation of Y721 reducing CSF1R activity.
To investigate the role of the four CSF1R serine residues that are preferentially
phosphorylated upon combination treatment after 3 h, I first sought to verify if all serines are
conserved across various species. An alignment of mouse, rat and human CSF1R sequences
of the region containing these residues, revealed that in fact mouse Ser711, Ser714, Ser731
Figure 4.16: The structure of the CSF1 receptor
127
and Ser734 are conserved in human and rat CSF1R (Figure 4.17). This finding supported the
hypothesis, that phosphorylation of the four serines might be functionally relevant for CSF1R
signal transduction.
To identify the role these phosphorylation sites could play in the interaction of CSF1R and
PI3K and the subsequent activation of Akt, I next determined the levels of phospho-Akt
(Ser473) in the lysates of treated BMDMs (Figure 4.18). When analysing the Western blots
for phospho- and total Akt, it became apparent that while Akt levels remained unchanged
across all samples, the combined inhibition of IAPs and p38 lead to a decrease in Akt
phosphorylation at Ser473 after 1.5 h and 3h of treatment. Notably, Akt appeared to be
phosphorylated and therefore activated in untreated BMDMs and its activation did not
increase upon addition of Compound A. A time dependent activation of Akt however could
be observed with phosphorylation levels being increased in both treatments after 3 h. Since
phospho-Akt levels were decreased in the combination treatment compared to the untreated
samples, it is likely that the addition of p38i lead to the active suppression of Akt activation.
This conclusion supports the hypothesis that the phosphorylation sites in CSF1R enriched in
the combination treatment, have an inhibitory function. It should be stated, however, that the
signalling kinetics observed for Akt phosphorylation via Western blotting and CSF1R
modification by mass spectrometry did not support the assumption that CSF1R acted as an
upstream mediator of Akt. According to the phosphoproteomics data, CSF1R
phosphorylation was significantly increased in the combination treatment after 3h while a
reduction of Akt phosphorylation as observed via Western blotting was most prominent in
BMDMs treated with Compound A and p38i for 1.5 h. It is possible that CSF1R is in fact not
a primary mediator of Akt activity and its phosphorylation is rather a secondary event induced

128
by the increased activity of another kinase that is also regulating PI3K signalling. Another
explanation for the observed discrepancies in signalling kinetics could be that CSF1R is already
being phosphorylated at an earlier time point but variations in levels of total CSF1R masked
these events. If CSF1R was more abundant in the 3 h samples compared to the 1.5 h,
phosphorylated peptides could have been detected at higher intensities as a consequence. It is
noteworthy that in BMDMs treated with Compound A for 1.5 h, we observed the most missing
values for phosphorylated CSF1R-derived peptides as can be seen in the heatmap in Figure
4.15. Missing values indicate that a peptide was not detectable in the respective sample, likely
caused by a low abundancy of the peptide. When performing statistical analysis however, these
missing values can lead to a decrease in significance of observed differences or they can even
prevent the evaluation of such when no peptide is detected for any of the six replicates. To
investigate whether the increase in CSF1R phosphorylation after 3 h compared to the 1.5 h
timepoint was caused by an increase of CSF1R expression, total CSF1R levels needed to be
determined either via Western blotting or by analysing the total proteome using mass
spectrometry. Time constraints and the lack of an antibody suitable for the
immunohistochemical detection of CSF1R prevented me from doing either. I was therefore
unable to address the observed discrepancies in signalling kinetics.
Sequence alignment of human, mouse and rat CSF1R using Clustal Omega (Phosphosite.org).
Phosphorylated residues are boxed in dark red. Treatment-induced differentially phosphorylated
Figure 4.17: The four detected phosphoserines S711, S714, S731 and S734 are conserved
across human, mouse and rat CSF1R

129
residues are boxed in light red. All four detected residues are conserved across the three analysed
species. S711 and S714 are known phosphosites while phosphorylation of S731 and S734 is a novel
observation. Conservation and consensus were calculated using von Neumann entropy from PFAAT.
BMDMs from six mice were treated with DMSO (untreated control), Compound A (SM, 500 nM)
alone or in the presence of p38 inhibitor LY (1 µM) for 1.5 h or 3 h. Lysates of treated BMDMs were
subjected to Western blotting and membranes were probed for phospho-Akt (p-Ser473) and Akt to
determine if the combination treatment of SM and p38i prevents the activation/phosphorylation of
Akt. Probing for actin served as a loading control. The blot is representative of two independent
experiments.
Nonetheless, I further investigated the role of CSF1R in the synergistic killing of SM and p38
inhibition. To do so, I treated BMDMs with a combination of Compound A and AFS-98, a
monoclonal antibody commonly applied to inhibit CSF1R in vivo and in vitro (Sudo et al.,
1995), for 6 and 24 h and subsequently measured occurring cell death via PI uptake and flow
cytometry (Figure 4.19). Firstly, at a concentration of 33 nM AFS-98 did not kill on its own.
However, when combined with Compound A, CSF1R inhibition induced synergistic cell death
which was most apparent after 24h. After 6h, when the combination of 500 nM Compound
Figure 4.18: Akt is less phosphorylated at S473 in BMDMs treated with the combination of
Compound A and p38i
AKT pS473
AKT
Actin
130
A and LY causes a cell death rate of almost 70%, cell death induced by the same concentration
of the smac mimetic and the addition of AFS-98 was determined to be only approximately
45%. A stronger synergistic effect occurred after 24 h treatment when the simultaneous
inhibition of CSF1R and the IAPs with 500 nM Compound A resulted in the killing of over
90% of cells, the same as for the combination of Compound A and p38i. At lower
concentrations however, the combination of Compound A and AFS-98 was less effective than
Compound A with p38i. Nonetheless, the measured cell death for the AFS-98/Compound A
combination was consistently higher than for the treatment with Compound A as a single agent.
With AFS-98 failing to induce killing on its own, it can be concluded that the inhibition of
CSF1R and the IAPs results in synergistic cell death in BMDMs. This data strongly suggests a
role for CSF1R in preventing smac mimetic-induced killing and supports the hypothesis, that
the identified phosphorylation sites have an inhibitory effect on CSF1R signalling.
To investigate if activation of the cell survival pathway PI3K/Akt is responsible for the
prevention of cell death in smac mimetic-treated cells, I screened the phosphoproteomics data
for further evidence such as activated downstream targets.
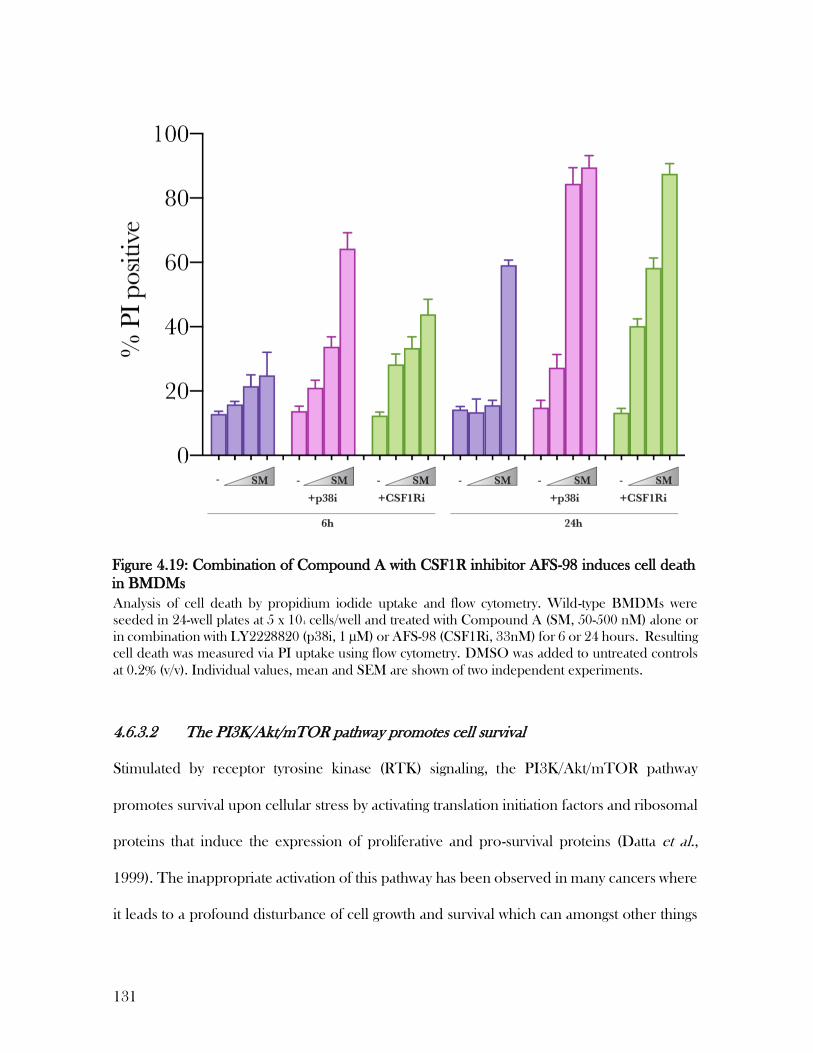
131
Analysis of cell death by propidium iodide uptake and flow cytometry. Wild-type BMDMs were
seeded in 24-well plates at 5 x 10⁴ cells/well and treated with Compound A (SM, 50-500 nM) alone or
in combination with LY2228820 (p38i, 1 µM) or AFS-98 (CSF1Ri, 33nM) for 6 or 24 hours. Resulting
cell death was measured via PI uptake using flow cytometry. DMSO was added to untreated controls
at 0.2% (v/v). Individual values, mean and SEM are shown of two independent experiments.
4.6.3.2 The PI3K/Akt/mTOR pathway promotes cell survival
Stimulated by receptor tyrosine kinase (RTK) signaling, the PI3K/Akt/mTOR pathway
promotes survival upon cellular stress by activating translation initiation factors and ribosomal
proteins that induce the expression of proliferative and pro-survival proteins (Datta et al.,
1999). The inappropriate activation of this pathway has been observed in many cancers where
it leads to a profound disturbance of cell growth and survival which can amongst other things
Figure 4.19: Combination of Compound A with CSF1R inhibitor AFS-98 induces cell death
in BMDMs
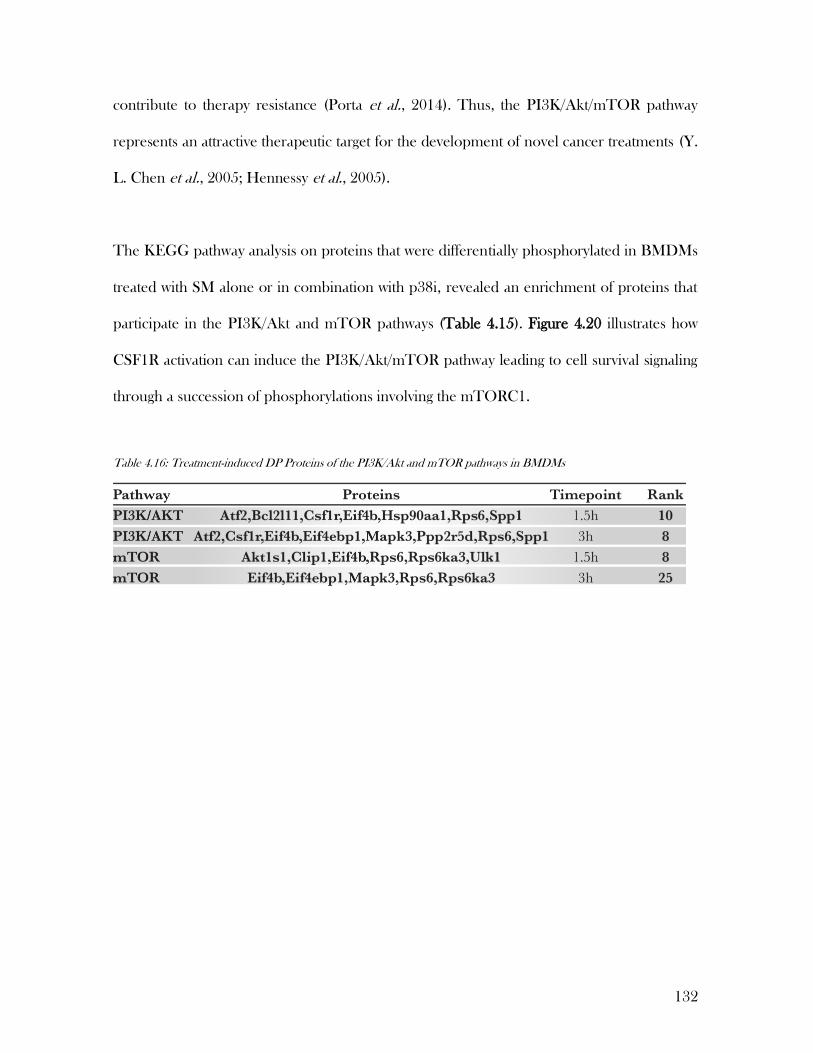
132
contribute to therapy resistance (Porta et al., 2014). Thus, the PI3K/Akt/mTOR pathway
represents an attractive therapeutic target for the development of novel cancer treatments (Y.
L. Chen et al., 2005; Hennessy et al., 2005).
The KEGG pathway analysis on proteins that were differentially phosphorylated in BMDMs
treated with SM alone or in combination with p38i, revealed an enrichment of proteins that
participate in the PI3K/Akt and mTOR pathways (Table 4.15). Figure 4.20 illustrates how
CSF1R activation can induce the PI3K/Akt/mTOR pathway leading to cell survival signaling
through a succession of phosphorylations involving the mTORC1.
Table 4.16: Treatment-induced DP Proteins of the PI3K/Akt and mTOR pathways in BMDMs
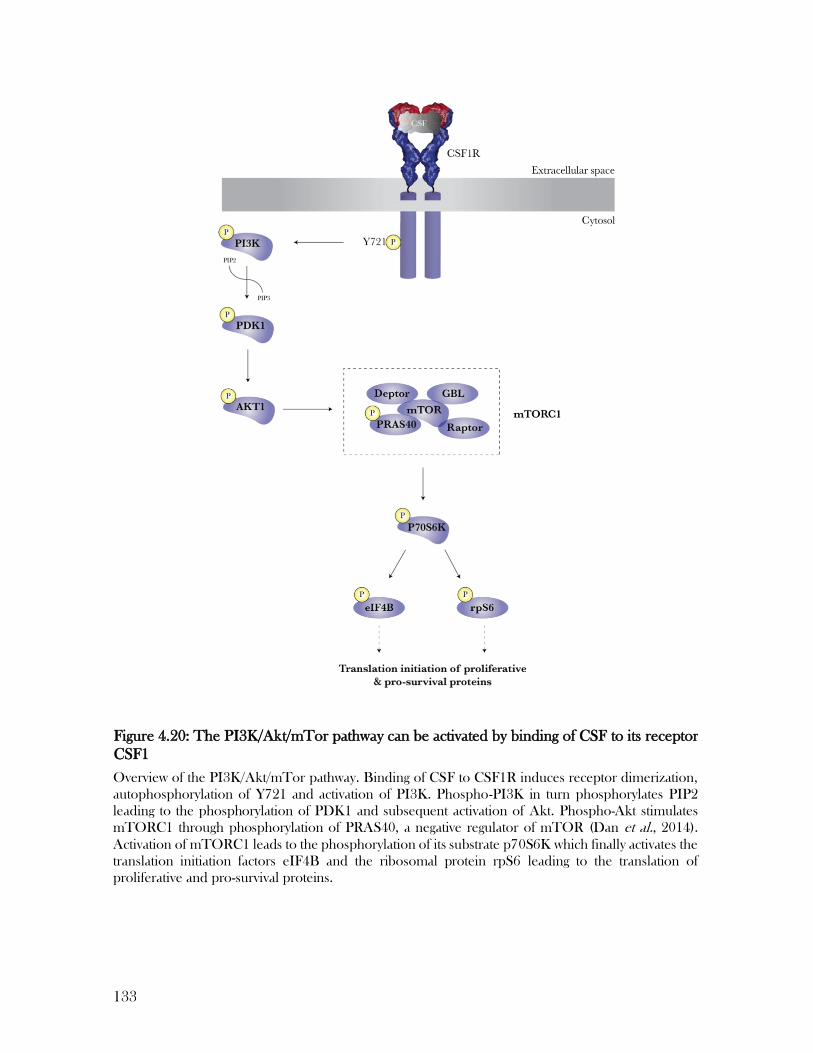
133
Overview of the PI3K/Akt/mTor pathway. Binding of CSF to CSF1R induces receptor dimerization,
autophosphorylation of Y721 and activation of PI3K. Phospho-PI3K in turn phosphorylates PIP2
leading to the phosphorylation of PDK1 and subsequent activation of Akt. Phospho-Akt stimulates
mTORC1 through phosphorylation of PRAS40, a negative regulator of mTOR (Dan et al., 2014).
Activation of mTORC1 leads to the phosphorylation of its substrate p70S6K which finally activates the
translation initiation factors eIF4B and the ribosomal protein rpS6 leading to the translation of
proliferative and pro-survival proteins.
Figure 4.20: The PI3K/Akt/mTor pathway can be activated by binding of CSF to its receptor
CSF1
134
4.6.3.3 PI3K/Akt/mTOR targets are preferentially phosphorylated in Smac mimetic
treated BMDMs
When screening the phosphoproteomics data for downstream targets of PI3K/Akt/mTOR
signaling, a number of hits including direct Akt substrates were found to be predominantly
enriched in BMDMs treated with Compound A for both time points. This further supported
the hypothesis that these pathways may play a critical role in cell survival in BMDMs treated
with Smac mimetics. In the following I will discuss the most significant DP proteins that have
been associated with PI3K/Akt/mTOR signaling.
4.6.3.4 Phosphorylation of PRAS40, an Akt substrate, leads to activation of mTORC1
Proline-rich Akt1 substrate 1 (PRAS40) is a subunit of mTORC1 which amongst other things
regulates cell survival in response to hormonal and nutrient signals (L. Wang et al., 2007).
Within mTORC1, PRAS40 plays an inhibitory role by binding to regulatory-associated
protein of mTOR (raptor) (L. Wang et al., 2007). Phosphorylation at T247 by Akt releases
PRAS40 from raptor and facilitates its binding to 14-3-3, allowing mTORC1 signaling to be
activated (Nascimento et al., 2010). When exploring the phosphoproteome of treated
BMDMs, I discovered phospho-PRAS40 to be significantly enriched 2-fold in cells treated
with Compound A for 1.5 h (Table 4.14; Figure 4.21). The detected phosphosite is T247
making Akt the likely kinase that generated this modification. Consequently, the enrichment
of this PRAS40 phosphopeptide following treatment with Compound A further supports that
PI3K/Akt/mTOR signaling promotes cell survival in these cells.

135
Schematic representation of PRAS40, a negative regulator of mTOR. Phosphorylation of PRAS40 by
Akt within its PRAS domain at T247 is known to relieve the inhibitory function of PRAS40 on mTOR
enabling mTORC1 to become active. Phospho-PRAS40 (p-T247) was observed in BMDMs treated
with Compound A.
4.6.3.5 RpS6, a downstream target of mTOR, is phosphorylated in BMDMs upon
treatment with Smac mimetics
The 40 S ribosomal protein S6 (RpS6) is a component of the 40S subunit and is the major
substrate of protein kinases in the ribosome (Nygard et al., 1990). As a downstream target of
mTOR, rpS6 is phosphorylated upon a vast number of stimuli which include mitogens, growth
factors and tumor-promoting agents (Meyuhas, 2008; Roux et al., 2007; Volarevic et al., 2000).
Regulated through phosphorylation, rpS6 impacts cell size, survival and migration by
controlling the translation of 5’TOP (5′ terminal oligopyrimidine tract) mRNAs (Pende et al.,
2004). The translation of these mRNAs is selectively activated when resting cells are induced
to grow or to proliferate (Tang et al., 2001). Since rpS6 is regulated through phosphorylation,
Figure 4.21: Phosphorylation of PRAS40 at T247 allows activation of mTORC1
Table 4.17: Phosphorylation status of PRAS40 after treatment with SM + p38i

136
selective inhibition of its phosphorylation has been shown to correlate with inhibition of cell
proliferation (Lu et al., 2019). Two families of kinases are known to phosphorylate and hence
activate rpS6: p70 S6 kinases (RPS6Kbeta) and p90 ribosomal S6 kinases (RPS6Kalpha).
Within these families, the kinases I will be referring to in the following are RPS6Kb1 (S6K1)
which is a downstream target of mTORC1 and RPS6Ka3 (RSK2) which is activated as a result
of ERK signaling. There are five clustered rpS6 phosphorylation sites that have been mapped
to the residues Ser235, Ser236, Ser240, Ser244 and Ser247 and all of them are conserved
from Drosophila to mammals (Ruvinsky et al., 2006).
Upon treatment of BMDMs with Compound A, the five phosphorylated serines were
identified to be enriched by 4.5-fold (1.5 h) or 6.5-fold (3 h) when compared to the
combination treatment (Table 4.15). According to the literature, phosphorylation of Ser240
and Ser244 requires S6k1/2 activity while persistent phosphorylation of Ser235 and Ser236 is
still observed upon genetic deletion of these kinases (Hutchinson et al., 2011).
Phosphorylation of Ser235 and Ser236 was found to be ERK-dependent with the kinases
RSK1/2 being responsible for this type of rpS6 modification. In line with the described
activation pathways of S6K1 and RSK2 through mTOR and ERK signaling respectively,
phospho-S6K1 was enriched in BMDMs treated with Compound A alone for 1.5 h, while
phospho-RSK2 was preferentially phosphorylated in the combination treatment in both
timepoints (Figure 4.22). The detected S6K1-derived phosphopeptides revealed three
phosphosites which consisted of Ser441, Thr444 and Ser447. All three phosphorylated
residues are located within the autoinhibitory domain of S6K1 and have been described in the
literature (Weng et al., 1998). When generating phosphomimetic mutants by simultaneously
replacing those serine and threonine residues with glutamic acid (S240E/T244E/S247E),
137
phosphorylation of Thr252 by PDK1 was facilitated leading to activation of the kinase
(Keshwani et al., 2011). Based on these observations and given that the detected
Ser240/Ser244 rpS6 phosphorylation sites are known substrates of this kinase, the S6K1
phosphorylation events that preferentially occurred upon Smac mimetic treatment likely
reflected its activated state. The RSK2 phosphopeptide harboring the phosphorylated residues
Thr365/Ser369/Ser375 was strongly enriched in both timepoints of the combination
treatment, where its detection was 3-fold (1.5 h) or 8-fold (3 h) increased compared to the
single agent treatment (Table 4.15). Interestingly, these residues are located within the RSK2
AGC kinase domain (Figure 4.22). As mentioned above, RSK2 activation requires ERK
signaling which is strongly enhanced upon combination treatment. Even more strikingly, the
detected phosphorylations of T365 and S369 are known to be catalyzed by ERK1/2 leading
to RSK2 activation (Vaidyanathan et al., 2007). In contrast, phosphorylation of Ser715 was
significantly enriched in BMDMs treated with Compound A alone after 1.5 h. Although its
function is unknown, phosphorylated Ser715 has been described to occur upon Akt signaling
which again correlates with it being preferentially detected in the Smac mimetic treated
BMDMs (Humphrey et al., 2013).
As described above, phosphorylation of rpS6 at residues whose modifications are dependent
on either S6K1 (Ser240/Ser244) or RSK2 (Ser235/Ser236) were strongly enriched when cells
were treated with Compound A alone. This observation however contradicts the
phosphorylation patterns exhibited by its activating kinase RSK2, which is activated upon ERK
signaling and hence preferentially phosphorylated in the combination treatment. Notably,
phosphorylations of Ser235/Ser236 and Ser240/Ser244 were never detected in isolation but
phosphopeptides always contained at least one of the serines known to be modified by the two
138
kinases. It is possible that this observation occurred due to the enrichment process where
peptides with multiple phospho groups were preferentially enriched over those that undergone
only a single phosphorylation. Furthermore, the close proximity of the residues prevented the
generation of peptides that only covered Ser235/Ser236 or Ser240/Ser244 respectively.
Although an arginine residue in position 238 could have led to the generation of peptides
containing only one of the two kinase motifs, the presence of the phosphate group(s) may have
interfered with the tryptic digest. Another technical explanation for this could be that peptides
phosphorylated at residues Ser235/Ser236 only appeared in the combination treatment while
being undetectable in BMDMs treated with Smac mimetic alone. The resulting missing values
in the single agent treatment would then in turn cause the dismissal of these peptides during
the statistical analysis. The contradiction about the co-occurrence of phosphorylations
catalyzed by the kinases S6K1 and RSK2 upon treatment with Compound A could be
addressed by screening lysates for the phosphorylated residues Ser235/Ser236 and
Ser240/Ser244 via Western blotting since commercial antibodies against those sites are
available. For the question at hand however, answering this question was not of importance.
The relevant findings here were that downstream targets of the mTOR pathway, which signals
for cell survival, were found to be activated in BMDMs treated with Smac mimetic while
signaling through this pathway was not observed upon the combination treatment.
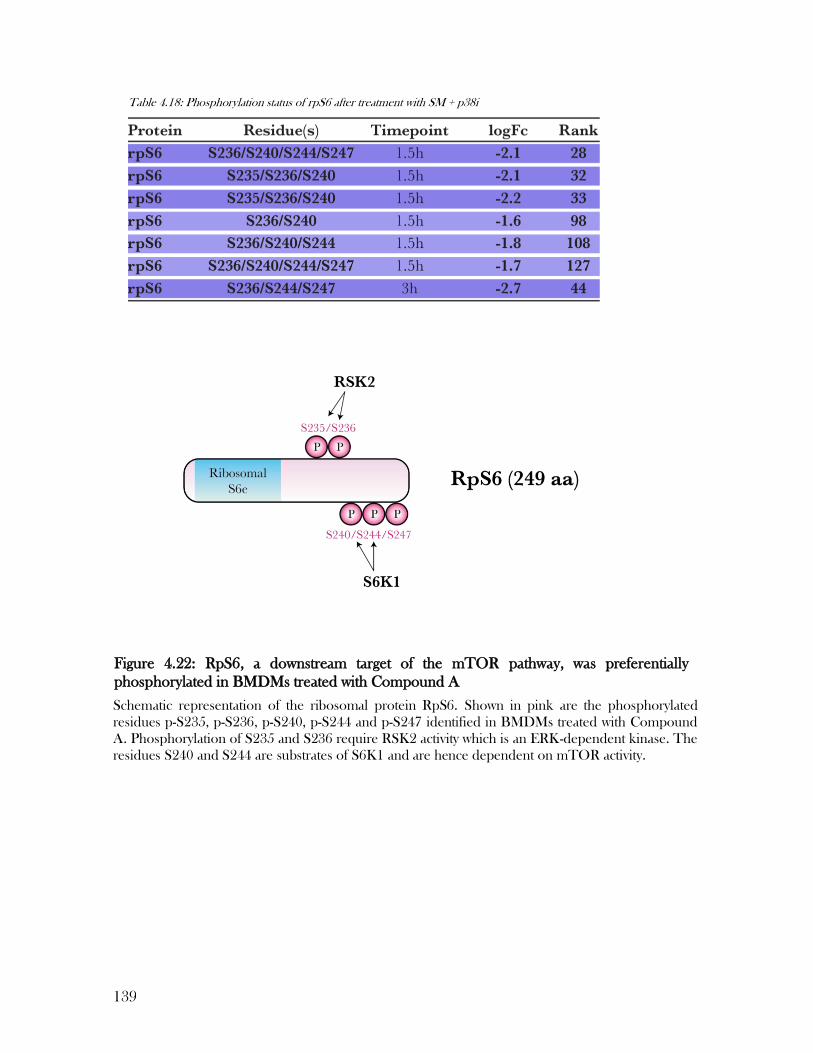
139
Schematic representation of the ribosomal protein RpS6. Shown in pink are the phosphorylated
residues p-S235, p-S236, p-S240, p-S244 and p-S247 identified in BMDMs treated with Compound
A. Phosphorylation of S235 and S236 require RSK2 activity which is an ERK-dependent kinase. The
residues S240 and S244 are substrates of S6K1 and are hence dependent on mTOR activity.
Figure 4.22: RpS6, a downstream target of the mTOR pathway, was preferentially
phosphorylated in BMDMs treated with Compound A
Table 4.18: Phosphorylation status of rpS6 after treatment with SM + p38i
140
4.6.3.6 The translation initiation factor eIF4B is activated in BMDMs treated with Smac
mimetics
As an RNA binding protein, eIF4B is involved in the regulation of the initiation stage of protein
synthesis where is it crucial for the recruitment of mRNA to the ribosome. Here, eIF4B
supports the unwinding of mRNA secondary structures allowing ribosome scanning by
enhancing ATPase and helicase activities of eIF4A. Although a number of eIF4B
phosphorylation sites have been identified, only Ser406 and Ser422 have been functionally
characterized for their role in proliferating cells (K. Chen et al., 2016; Shahbazian et al., 2010).
Activated upon PI3K/Akt/mTOR or MAPK signaling, Ser422 is targeted by both S6K1
(mTOR) and RSK1 (ERK). Phosphorylation of eIF4B at this residue enhances its affinity for
the eIF3 complex and hence accelerates translation (Shahbazian et al., 2006). Apart from being
regulated via phosphorylation, eIF4B is also a substrate of caspase 3 when activated via the
TNF pathway (J.-T. Kim et al., 2013). With its cleavage occurring upon extrinsic apoptosis,
eIF4B is believed to play a role in inhibiting cell death (Jeffrey et al., 2002). Deregulated
phosphorylation of eIF4B at Ser422 has been observed in many cancers, where it drives not
only global translation leading to faster proliferation but also induces the overexpression of
oncoproteins such as myc and Bcl2 (J. Yang et al., 2013). Its antiapoptotic function was again
confirmed when the introduction of a Ser422E phosphomimetic mutation rendered Abl
transformed leukemic cells resistant to the combination of JAK/STAT/Pim and
PI3K/Akt/mTOR inhibition while eIF4B wild-type cells were sensitive to this treatment (K.
Chen et al., 2016).
Upon treatment with Compound A, phosphorylated eIF4B has been found to be enriched in
BMDMs in both timepoints with phospho-Ser422 being one of three detected modified
141
residues (Table 4.16). Since phosphorylation of this site can be catalyzed by the kinase S6K1,
which, as described above, was activated in BMDMs treated with Compound A, it is likely that
eIF4B phosphorylation occurred as a result of mTOR signaling. The peptide containing the
phosphorylation sites S354/S355 were enriched by 2.8-fold (1.5 h) and 4-fold (3 h) in BMDMs
treated with Compound A (Table 4.16). Although the occurrence of phosphorylation of these
residues have been reported in the literature, a functional role has not been ascribed to them.
Given their close proximity to the arginine rich motif, it is possible that phosphorylation of
Ser354/Ser355 plays a role in eIF4B’s RNA binding (Figure 4.23). To further investigate their
function, eIF4B mutants would have to be generated where the residues Ser354 and Ser355
are replaced by either a small amino acid that cannot get phosphorylated (e.g. alanine), or a
phosphomimetic residue (e.g. aspartic acid). Although the role of phosphorylated
Ser354/Ser355 remains unknown, the enrichment of phospho-eIF4B Ser422 again supports
the notion that in Smac mimetic treated cells, survival is regulated through PI3K/Akt/mTOR
signaling.

142
Schematic representation of eukaryotic translation initiation factor 4B (eIF4B). The numbers refer to
amino acids flanking the functional domains. Residues in pink represent phosphorylated amino acids
identified in BMDMs treated with Compound A, while grey/black residues are known phosphosites
that were not detected. S422 can be phosphorylated by S6K1 in response to mTOR signaling (Holz et al., 2005). Phosphorylation at S406 is catalyzed by PIM (Cen et al., 2014). Cleavage of eIF4B by
caspase-3 after Asp45 occurs during apoptosis (Jeffrey et al., 2002). RRM = RNA recognition motif.
4.6.3.7 Phosphorylation of the kinase Itpkb might lead to its activation and inhibition of
the PI3K/Akt/mTOR pathway
Inositol-trisphosphate 3-kinase B (Itpkb) was significantly differentially phosphorylated upon
treatment and was identified as the DP protein with the third highest significance in the 3 h
timepoint (Table 4.17). Its dually phosphorylated form was enriched in the combination
Figure 4.23: The translation initiation factor eIF4B can be activated by S6K1 via
phosphorylation at Ser422
Table 4.19: Phosphorylation status of eIF4B after treatment with SM + p38i
143
treatment where it was found to be increased by 4-fold compared to the single agent treatment.
Interestingly, Itpkb functions as a PI3K/Akt antagonist by phosphorylating IP3 (inositol-
trisphosphate) to produce IP4 which in turn competes with PIP3 leading to the inhibition of
Akt activation (Siegemund et al., 2015) (Figure 4.24). The detected phosphoserines Ser42 and
Ser48 have been previously reported in the literature, where they have been identified during
large scale phosphoproteomic profiling of mTOR (Humphrey et al., 2013), RIPK3 (X. Wu
et al., 2012) and TLR signaling (Weintz et al., 2010) to name a few. However, the function of
these phospho sites have not been determined. Both residues are conserved in mouse, human
and rat Itpkb indicating that they might be of functional importance. Itpkb has previously been
reported to be a substrate of ERK (Hatano et al., 2016). When screening the detected
phosphopeptide for potential kinase motifs, it was revealed that the Itpkb peptide sequence
contained at least the partial consensus motif of ERK for both phosphoserines (Figure 4.25).
The minimal ERK phosphorylation consensus motif is SP/TP while the motif LSPG has been
found to be enriched in known ERK substrates (Hatano et al., 2016). The preposition that
ERK is the kinase responsible for phosphorylating Itpkb at Ser42 and Ser48 is further
supported by ERK’s treatment induced activation profile. The MAP kinase is strongly
activated in BMDMs treated with Compound A and p38i for 3 h which correlates with the
enrichment of phosphorylated Itpkb. To confirm a functional role of phospho-Ser42 and -
Ser48 in Itpkb activation, mutant Itpkb will need to be generated where the serines are mutated
to either a small amino acid that cannot be phosphorylated (e.g. alanine) reflecting non-
phosphorylated Itpkb, or to a phosphomimetic (e.g. aspartic acid) to replicate the
phosphorylated protein. Furthermore, to establish the role of ERK in Itpkb phosphorylation,
and potentially activation, an in vitro kinase assay where recombinant ERK and Itpkb are
incubated in the presence of ATP could be performed. Using mass spectrometry to sequence

144
the substrate following the kinase assay would reveal the modified residues. Although it is
intriguing to speculate that Itpkb phosphorylation plays a role in the cell death induced by the
combination treatment by inhibiting Akt which, when activated, promotes cell survival, testing
this hypothesis requires further research. Due to time constraints I was not able to follow up
on this observation but I believe the data I have presented justifies future investigations into
the role of Itpkb phosphorylation during the combined inhibition of IAPs and p38.
PI3K phosphorylates PIP2 to generate PIP3 which in turn can phosphorylate and activate Akt. Upon
phosphorylation by Itpkb, IP3 is converted into IP4 which prevents Akt phosphorylation by competing
with PIP3 for binding to Akt therefore inhibiting its activation.
Sequence alignment of ERK consensus motifs, L[pS/pT]PG (shown in boldface), detected in Itpkb.
Phosphorylation sites are highlights in red.
Figure 4.24: Itpkb a PI3K/Akt antagonist
Figure 4.25: Identified ITPKB phospho-peptide contains the ERK consensus motif
Table 4.20: Phosphorylation status of ITPKB after treatment with SM + p38i
145
4.7 Discussion
We previously showed, that the combination of a smac mimetic and a p38 inhibitor is an
effective treatment for AML in vivo (Najoua Lalaoui et al., 2016). Since cell death in BMDMs
does not occur upon treatment with SM but is induced when p38 is also inhibited, the MAP
kinase prevents cell death in the absence of IAPs. Lalaoui et al. previously discovered, that
one mechanism by which p38 inhibits cell death is via the activation of its substrate MK2 which
in turn phosphorylates RIPK1 at Ser321 and Ser336 (Jaco et al., 2017, Dondelinger et al.,
2017). Phosphorylated RIPK1 is prevented from associating with the death-inducing complex
II, subsequently inhibiting cell death (Jaco et al., 2017). To establish whether p38 regulates
cell death through additional mechanisms, we generated a RIPK1S321/S336A mutant knock-in
mouse which cannot be phosphorylated by MK2. If phosphorylation of RIPK1 by MK2 is the
only process by which p38 inhibits cell death, treating RIPK1S321/S336A mutant BMDMs with SM
should be sufficient to induce cell death equivalent to that caused by the combination
treatment. RIPK1S321/S336A mutant BMDMs were in fact sensitised to SM treatment as shown in
Figure 4.1. However, when either p38 or MK2 were also inhibited, cell death was further
increased, indicating that p38 prevents cell death in the absence of IAPs through additional
mechanisms.
To facilitate the identification of proteins and pathways that mediate the treatment-induced
cell death and to understand the role of p38 in inhibiting cell death in SM-treated cells, Gene
Ontology (GO) and KEGG pathway analyses were performed on treatment-dependent DP
proteins. Within these results, I focused on processes and pathways that are likely to be
contributing to our observations: cell death and cell survival pathways and regulators of TNF
expression.

146
When searching for mediators of apoptosis, I noticed that Bim, a pro-apoptotic protein
required for intrinsic apoptosis, was the sole hit that was significantly differentially
phosphorylated upon treatment and was found to be preferentially modified in BMDMs
treated with SM (Table 4.7; Figure 4.8 A). With cell death being inhibited in these cells, I
hypothesized that phosphorylation of Bim at Ser82/Ser86 inhibited its activity. This notion
was supported by the close proximity of the modified residues to Tyr92, a substrate of LYN
whose phosphorylation also prevents Bim activity, and the observation that intrinsic apoptosis
occurred in BMDMs when p38 was also inhibited. The latter was demonstrated by the
presence of cleaved Caspase 9 in lysates of BMDMs subjected to the combination treatment
(Figure 4.8 B). Interestingly, phosphorylation of Ser82 has not been reported yet and when
searching for kinase motifs, this residue was identified as a potential substrate of MK2 (Hyd-
X-R-X-pS). Since this phosphorylation was abolished when p38, and hence MK2, were
inhibited, it is possible that Bim is in fact a substrate of MK2 and that by phosphorylating Bim,
MK2 negatively regulates its pro-apoptotic activity. This would be in contrast to the role of p38
in inducing apoptosis by directly phosphorylating and activating Bim at Ser65 upon oxidative
stress in PC12 cells (Cai et al., 2006). Further experiments including in vitro kinase assays to
determine if Bim is a substrate of MK2 would be required to confirm our hypothesis. Although
these findings were intriguing, the cell death induced by the combination of SM and p38i is
Caspase 8-dependent and therefore driven by extrinsic apoptosis (Najoua Lalaoui et al., 2016).
Understanding the role of MK2 in regulating intrinsic apoptosis therefore would not address
our research question.
As we showed previously, p38 inhibition lead to an increase in TNF production induced by
SM which greatly contributed to the increase in cell death (Najoua Lalaoui et al., 2016). This

147
observation was unexpected since p38 is required for the induction of TNF through Toll-like
receptors (Foey et al., 1998). In fact, when p38 was inhibited in BMDMs treated with LPS, we
observed a decrease in TNF production (Najoua Lalaoui et al., 2016). Since cell death induced
by the combination treatment of SM and p38i is dependent on TNF, identifying regulators of
TNF production that contribute to the increased expression of this cytokine, is of great interest.
Phosphoproteomic analysis revealed that four potential regulators of TNF production were
differentially phosphorylated in treated BMDMs (Table 4.18).
CD45, a protein tyrosine phosphatase receptor that is activated by self-dimerization, was found
to be dually phosphorylated at its C-terminal domain in BMDMs treated with SM indicating
that these modifications were dependent on p38 (Table 4.8). CD45 is critical in T- and B-cell
signaling, where it associates and regulates intracellular tyrosine kinases of the Src family
including LCK, LYN and FYN (Altin et al., 1997). In macrophages and dendritic cells, CD45
has been described to be a negative regulator of TNF expression induced by TLR signaling
although the underlying mechanisms are unclear (Piercy et al., 2006). The phosphosites
detected in treated BMDMs have been previously reported but their functions remain
unknown. With Ser1286 being a conserved residue however, associating it with a functional
role is plausible. If CD45 as a negative regulator of TNF expression can in fact be regulated
by the detected phosphorylations, it stands to reason that this modified version represented
the activate receptor since TNF levels in SM-treated BMDMs were low. Evidence for CD45
activity in these cells were found in the presence of phosphorylated FYB and EVL (Table 4.9-
10; Figure 4.10-11). Both proteins are well-described interactors of FYN, a Src family kinase
regulated by CD45.
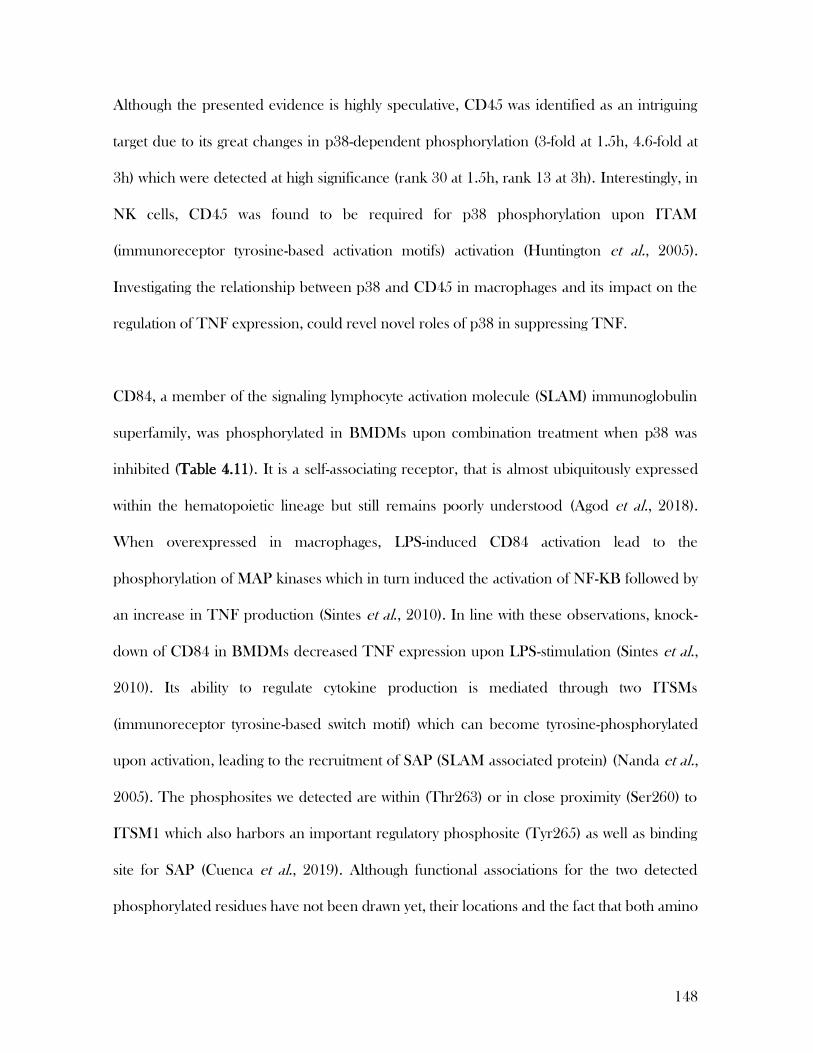
148
Although the presented evidence is highly speculative, CD45 was identified as an intriguing
target due to its great changes in p38-dependent phosphorylation (3-fold at 1.5h, 4.6-fold at
3h) which were detected at high significance (rank 30 at 1.5h, rank 13 at 3h). Interestingly, in
NK cells, CD45 was found to be required for p38 phosphorylation upon ITAM
(immunoreceptor tyrosine-based activation motifs) activation (Huntington et al., 2005).
Investigating the relationship between p38 and CD45 in macrophages and its impact on the
regulation of TNF expression, could revel novel roles of p38 in suppressing TNF.
CD84, a member of the signaling lymphocyte activation molecule (SLAM) immunoglobulin
superfamily, was phosphorylated in BMDMs upon combination treatment when p38 was
inhibited (Table 4.11). It is a self-associating receptor, that is almost ubiquitously expressed
within the hematopoietic lineage but still remains poorly understood (Agod et al., 2018).
When overexpressed in macrophages, LPS-induced CD84 activation lead to the
phosphorylation of MAP kinases which in turn induced the activation of NF-KB followed by
an increase in TNF production (Sintes et al., 2010). In line with these observations, knock-
down of CD84 in BMDMs decreased TNF expression upon LPS-stimulation (Sintes et al.,
2010). Its ability to regulate cytokine production is mediated through two ITSMs
(immunoreceptor tyrosine-based switch motif) which can become tyrosine-phosphorylated
upon activation, leading to the recruitment of SAP (SLAM associated protein) (Nanda et al.,
2005). The phosphosites we detected are within (Thr263) or in close proximity (Ser260) to
ITSM1 which also harbors an important regulatory phosphosite (Tyr265) as well as binding
site for SAP (Cuenca et al., 2019). Although functional associations for the two detected
phosphorylated residues have not been drawn yet, their locations and the fact that both amino

149
acids are preserved in humans and rats, support that these sites might be involved in regulating
receptor activity.
Given that the residues were phosphorylated when p38 was inhibited and where we observe
MAP kinase phosphorylation and an increase in TNF production, we can further hypothesize
that the observed modifications had a positive regulatory effect. If that relationship was to be
confirmed, understanding the role of the simultaneous inhibition of IAPs and p38 on CD84
activation would be of great interest.
CD84 has recently been identified as a potential biomarker and target in the treatment of
cancer and autoimmune diseases (Binsky-Ehrenreich et al., 2014; Cui et al., 2013; van den
Reek et al., 2017). In chronic lymphocytic leukemia (CLL), significantly elevated CD84 was
shown to enhance CLL cell survival by NF-κB activation which results in the upregulation of
the pro-survival proteins Bcl-2 and Mcl-1 (Cohen et al., 2012). Due to these observations,
CD84 was termed a pro-survival protein (Binsky-Ehrenreich et al., 2014). However, with its
potential to increase TNF expression, which, in the absence of IAPs, can induce apoptosis,
CD84 upregulation could be a biomarker for treatment response to smac mimetics.
In NFAM1, another receptor belonging to the Ig superfamily was preferentially
phosphorylated in BMDMs treated with SM (Table 4.12). NFAM1 is activated by dual
tyrosine phosphorylation of Tyr215 and Tyr226 within its ITAM (an immunoreceptor
tyrosine-based activation motif) which leads to increased transcription of TNF- α promoters
mediate through the calcineurin/NFAT-signaling pathway (J. Yang et al., 2003). The
phosphosites detected in treated BMDMs, p-Ser235 and p-Ser241, are conserved residues in
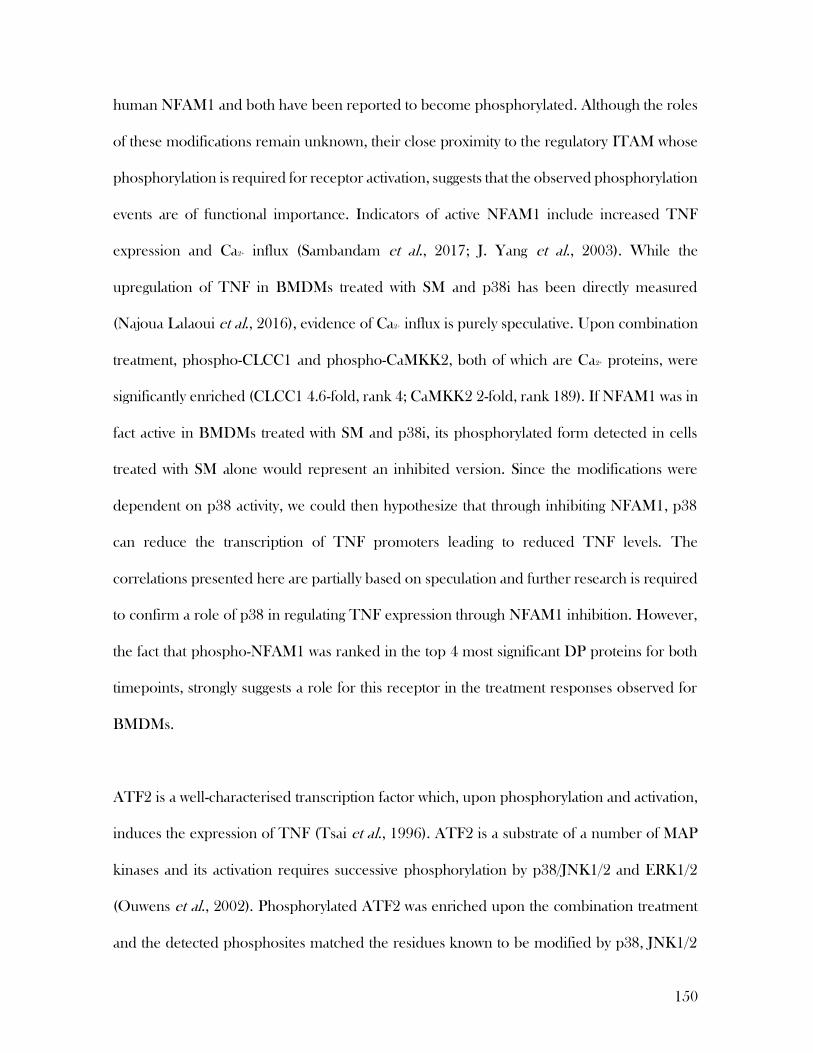
150
human NFAM1 and both have been reported to become phosphorylated. Although the roles
of these modifications remain unknown, their close proximity to the regulatory ITAM whose
phosphorylation is required for receptor activation, suggests that the observed phosphorylation
events are of functional importance. Indicators of active NFAM1 include increased TNF
expression and Ca2+ influx (Sambandam et al., 2017; J. Yang et al., 2003). While the
upregulation of TNF in BMDMs treated with SM and p38i has been directly measured
(Najoua Lalaoui et al., 2016), evidence of Ca2+ influx is purely speculative. Upon combination
treatment, phospho-CLCC1 and phospho-CaMKK2, both of which are Ca2+ proteins, were
significantly enriched (CLCC1 4.6-fold, rank 4; CaMKK2 2-fold, rank 189). If NFAM1 was in
fact active in BMDMs treated with SM and p38i, its phosphorylated form detected in cells
treated with SM alone would represent an inhibited version. Since the modifications were
dependent on p38 activity, we could then hypothesize that through inhibiting NFAM1, p38
can reduce the transcription of TNF promoters leading to reduced TNF levels. The
correlations presented here are partially based on speculation and further research is required
to confirm a role of p38 in regulating TNF expression through NFAM1 inhibition. However,
the fact that phospho-NFAM1 was ranked in the top 4 most significant DP proteins for both
timepoints, strongly suggests a role for this receptor in the treatment responses observed for
BMDMs.
ATF2 is a well-characterised transcription factor which, upon phosphorylation and activation,
induces the expression of TNF (Tsai et al., 1996). ATF2 is a substrate of a number of MAP
kinases and its activation requires successive phosphorylation by p38/JNK1/2 and ERK1/2
(Ouwens et al., 2002). Phosphorylated ATF2 was enriched upon the combination treatment
and the detected phosphosites matched the residues known to be modified by p38, JNK1/2
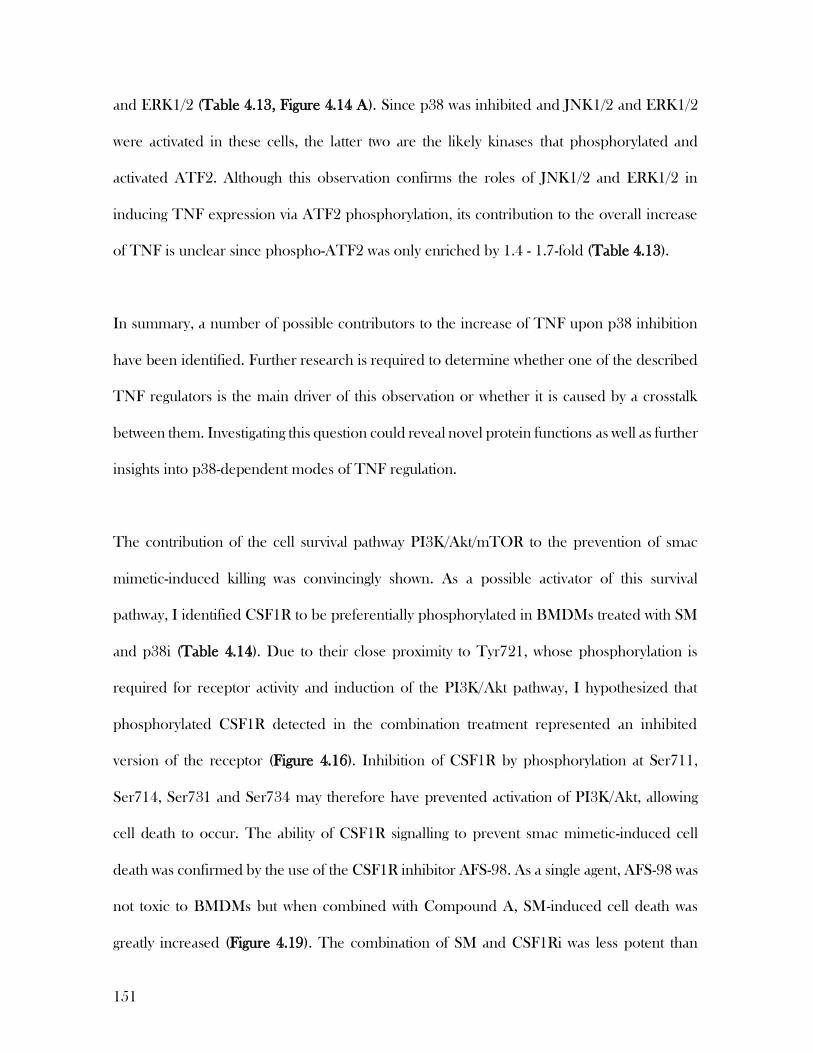
151
and ERK1/2 (Table 4.13, Figure 4.14 A). Since p38 was inhibited and JNK1/2 and ERK1/2
were activated in these cells, the latter two are the likely kinases that phosphorylated and
activated ATF2. Although this observation confirms the roles of JNK1/2 and ERK1/2 in
inducing TNF expression via ATF2 phosphorylation, its contribution to the overall increase
of TNF is unclear since phospho-ATF2 was only enriched by 1.4 - 1.7-fold (Table 4.13).
In summary, a number of possible contributors to the increase of TNF upon p38 inhibition
have been identified. Further research is required to determine whether one of the described
TNF regulators is the main driver of this observation or whether it is caused by a crosstalk
between them. Investigating this question could reveal novel protein functions as well as further
insights into p38-dependent modes of TNF regulation.
The contribution of the cell survival pathway PI3K/Akt/mTOR to the prevention of smac
mimetic-induced killing was convincingly shown. As a possible activator of this survival
pathway, I identified CSF1R to be preferentially phosphorylated in BMDMs treated with SM
and p38i (Table 4.14). Due to their close proximity to Tyr721, whose phosphorylation is
required for receptor activity and induction of the PI3K/Akt pathway, I hypothesized that
phosphorylated CSF1R detected in the combination treatment represented an inhibited
version of the receptor (Figure 4.16). Inhibition of CSF1R by phosphorylation at Ser711,
Ser714, Ser731 and Ser734 may therefore have prevented activation of PI3K/Akt, allowing
cell death to occur. The ability of CSF1R signalling to prevent smac mimetic-induced cell
death was confirmed by the use of the CSF1R inhibitor AFS-98. As a single agent, AFS-98 was
not toxic to BMDMs but when combined with Compound A, SM-induced cell death was
greatly increased (Figure 4.19). The combination of SM and CSF1Ri was less potent than

152
combining SM and p38i and killed cells at a slower rate. This observation however is not
surprising when we consider, that p38 prevents cell death in the absence of IAPs through
multiple mechanisms, one of which is the phosphorylation of RIPK1 by its substrate MK2.
This RIPK1 modification is unlikely to be affected by CSF1R inhibition, although this was not
experimentally addressed. It is therefore possible, that the observed discrepancy in cell death
caused by the two combinations can be accounted for by the ability of p38/MK2 to regulate
RIPK1.
When investigating if the PI3K/Akt pathway is contributing to the observed treatment
response, it was revealed via Western blot, that Akt phosphorylation was reduced in BMDMs
treated with SM and p38i (Figure 4.18). The reduction in phospho-Akt therefore correlated
with the detection of phosphorylated CSF1R, supporting the hypothesis that CSF1R upon p38
inhibition failed to activate the PI3K/Akt pathway, consequently enabling cell death. For the
treatment with smac mimetic-only, that would mean that cell death might have been prevented
by cell survival signalling through PI3K/Akt. A number of targets of the PI3K/Akt/mTOR
pathway were also differentially phosphorylated in treated BMDMs in a way that supported
our theory (Table 4.21, Figure 4.26). At the same time, Itpkb, a PI3K/Akt antagonist, was
phosphorylated and potentially activated in the combination treatment. Reduced
phosphorylation of Akt could have therefore been facilitated not only by CSF1R inhibition
but also Itpkb activation.
In Summary, there is great evidence, that smac mimetic as a single agent failed to induce cell
death in BMDMs due to the activity of the cell survival pathway PI3K/Akt/mTOR. This
activation was dependent on p38 and may have been induced by CSF1R-mediated signalling

153
upon binding of CSF1 present in the media. When p38 was inhibited, CSF1R became
phosphorylated and inhibited, preventing the activation of the PI3K/Akt/mTOR pathway and
enhancing cell death. The mechanism through which p38 might regulate cell survival signalling
in smac mimetic-treated cells remains unclear. Since phospho-CSF1R was detected when p38
was inhibited, it is likely that p38 did not directly interact with the receptor but rather negatively
regulated an effector upstream of CSF1R. The discussed data suggests a mechanism for
resistance to smac mimetic as a single agent, paving the path for the development of novel
biomarkers for treatment response.
With this work, I demonstrated that phosphoproteomics is a powerful tool for studying
complex signalling events. By applying this technique, we gained a more comprehensive
overview of signalling pathways involved in smac mimetic resistance. Additionally, I was able
to identify a number of novel phosphorylation sites. A challenge that arises when interpreting
phosphoproteomics data, is the lack of information on the function of specific
phosphorylation sites. Phosphorylations can impact proteins in various ways. Currently the
tools available to determine the function of a phosphorylation site on a protein, either involve
overexpression of mutated proteins in knock-out cell lines or the generation of CRISPR/Cas9
knock-in mice which allows studying mutated protein on an endogenous level. Since the large
datasets generated during phosphoproteomics often reveal a number of interesting hits with
modifications of unknown function, generating knock-in mice is not always an economic
option. An attractive tool to study phosphorylation functions on an endogenous level in a quick
and economic manner is CRISPR/Cas9 knock-in in cell lines. Developing such a tool was the
objective of my next chapter.
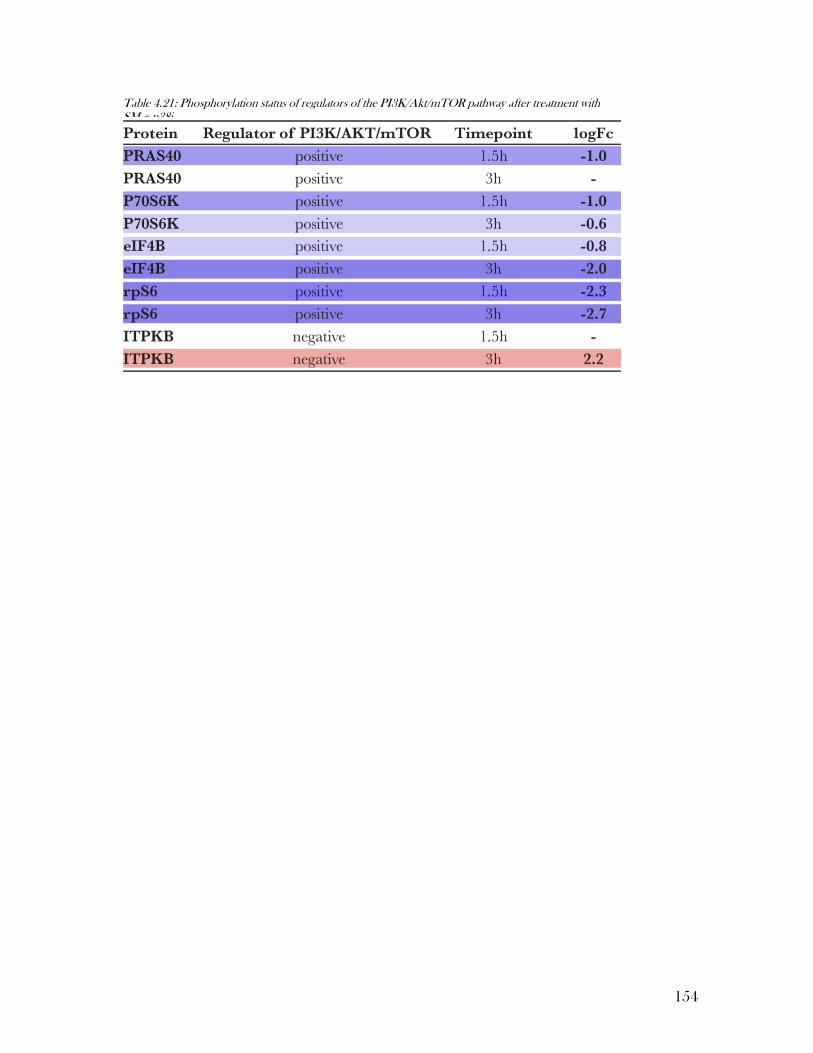
154
Table 4.21: Phosphorylation status of regulators of the PI3K/Akt/mTOR pathway after treatment with SM + p38i

155
Overview of the Akt/PI3K/mTOR pathway and its activation status in BMDMs treated with SM + p38i.
Phosphorylation sites in yellow are required for pathway activation. Phosphorylation sites in pink were
identified in BMDMs upon combination treatment. Phosphorylation of CSF1R at S711, S714, S731
and S734 might inhibit PI3K activation. Phosphorylated ITPKB inhibits Akt activation by generating
IP4 which in turn competes with PIP3. Pink crosses indicate phosphorylation events that are observed
in BMDMs treated with SM but prevented upon the addition of p38i. By inhibiting the activation of
downstream targets eIF4B and rpS6, cell survival signaling is prevented and cell death can occur.
Figure 4.26: The PI3K/Akt/mTor pathway is inactivated in BMDMs treated with SM + p38i

156
5 Tagging endogenous proteins of the TNF signaling pathway using
the CRISPR/Cas9 knock-in technology
5.1 Using the CRISPR/Cas9 gene editing system to endogenously FLAG-tag
RIPK1 – Design of the constructs
Initially developed to purify recombinant proteins, the FLAG-tag is now one of the most
commonly used protein tags (Hopp et al., 1988). The FLAG-tag is a hydrophilic polypeptide
consisting of eight amino acids (DYKDDDDK). Due to its small size and hydrophilic nature,
the function of tagged proteins most often remains unaffected (Hopp et al., 1988). Furthermore,
the existence of a high affinity monoclonal anti-FLAG antibody allows us to perform assays that
require the recognition by an antibody such as immunofluorescence, immunoprecipitation and
Western blotting (Gerace et al., 2015). The potential of a FLAG-tag for immunoprecipitation
becomes even more impressive when considering that immunoprecipitated proteins can be
eluted competitively by the addition of free FLAG peptide, keeping the antibody intact and
reducing the contamination of specifically bound protein with the antibody’s chains or non-
specifically bound proteins (Gerace et al., 2015). This in turn allows us to use mass spectrometry
as a tool to identify novel interacting partners, post-translational modifications or to study
signaling dynamics since sample quality is crucial for this versatile high throughput technology.
Therefore, development of a robust protocol that enables us to tag proteins endogenously with
a FLAG-tag using the CRISPR/Cas9 system would deliver a powerful tool to target any protein
in our pathways of interest and address questions regarding protein complex compositions,
dynamics and stoichiometries as well as signaling- or treatment- dependent protein
modifications.

157
A number of approaches to endogenously tag proteins using the CRISPR/Cas9 system have
been described in the literature (Patrick D. Hsu et al., 2014; Sander et al., 2014). A schematic
of the method I have developed is summarized in Figure 5.1. Firstly, I chose to use the
lentiCRISPR v2 one vector system where Cas9 and sgRNA are expressed by the same vector
(Sanjana et al., 2014). This increased the transfection efficiency since only one vector has to be
transfected into each cell. It also allowed for the expression of Cas9 to be transient which can
reduce off target effects and the risk of the inserted sequence to be cleaved again. Furthermore,
in most expression systems Cas9 has a triple FLAG-tag which, if it was stably expressed, would
interfere with the detection of the inserted FLAG-tag. The sgRNA targeted the 3’ of mouse
RIPK1 and the chosen PAM sequence was less than 10 bp upstream of the stop codon where
the 3’ FLAG-tag was to be inserted. The donor template containing the FLAG sequence was
delivered in the form of a single stranded DNA oligo (ssDNA) of approximately 150 bp (Figure
5.1). The FLAG sequence itself was followed by a stop codon and was flanked by two homology
arms upstream and downstream of the sgRNA targeted region which were approximately 60 bp
each. To prevent Cas9 from cleaving the integrated template, the PAM sequence recognized by
the RIPK1 sgRNA was silently mutated.
First, I tested the efficiency of the CRISPR guides in genetically knocking out RIPK1 in MDFs.
Three different guides were designed to increase the chances of finding a suitable guide. In
many cell lines the HDR machinery is less active than the NHEJ pathway making a genetic
knock-in harder to achieve than its counterpart – the knock-out (Zaboikin et al., 2017). Using a
guide that is extremely efficient is therefore important. To test the guides’ ability to knock out
RIPK1, I used an inducible two vector system where the Cas9-expressing construct is stably
integrated into the cell’s genome and the guide-containing plasmid is delivered into the cells
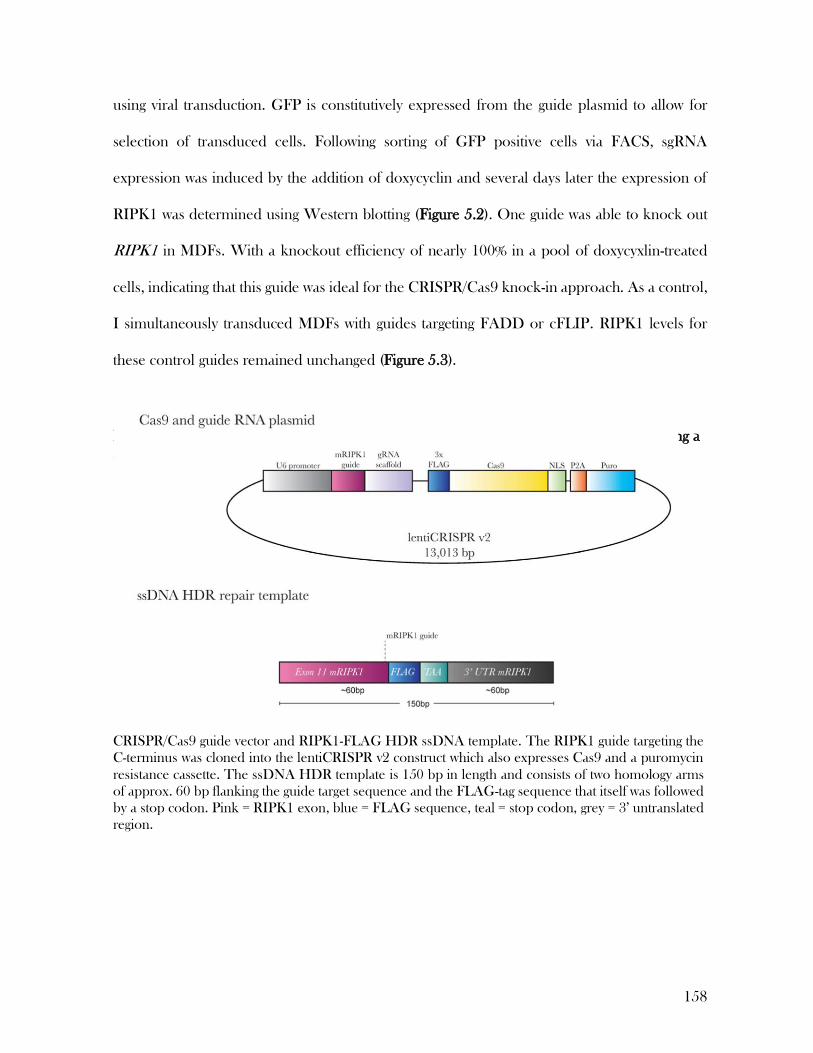
158
using viral transduction. GFP is constitutively expressed from the guide plasmid to allow for
selection of transduced cells. Following sorting of GFP positive cells via FACS, sgRNA
expression was induced by the addition of doxycyclin and several days later the expression of
RIPK1 was determined using Western blotting (Figure 5.2). One guide was able to knock out
RIPK1 in MDFs. With a knockout efficiency of nearly 100% in a pool of doxycyxlin-treated
cells, indicating that this guide was ideal for the CRISPR/Cas9 knock-in approach. As a control,
I simultaneously transduced MDFs with guides targeting FADD or cFLIP. RIPK1 levels for
these control guides remained unchanged (Figure 5.3).
CRISPR/Cas9 guide vector and RIPK1-FLAG HDR ssDNA template. The RIPK1 guide targeting the
C-terminus was cloned into the lentiCRISPR v2 construct which also expresses Cas9 and a puromycin
resistance cassette. The ssDNA HDR template is 150 bp in length and consists of two homology arms
of approx. 60 bp flanking the guide target sequence and the FLAG-tag sequence that itself was followed
by a stop codon. Pink = RIPK1 exon, blue = FLAG sequence, teal = stop codon, grey = 3’ untranslated
region.
Figure 5.1: Schematic of the CRISPR/Cas9 knock-in approach via the HDR pathway using a
ssDNA template
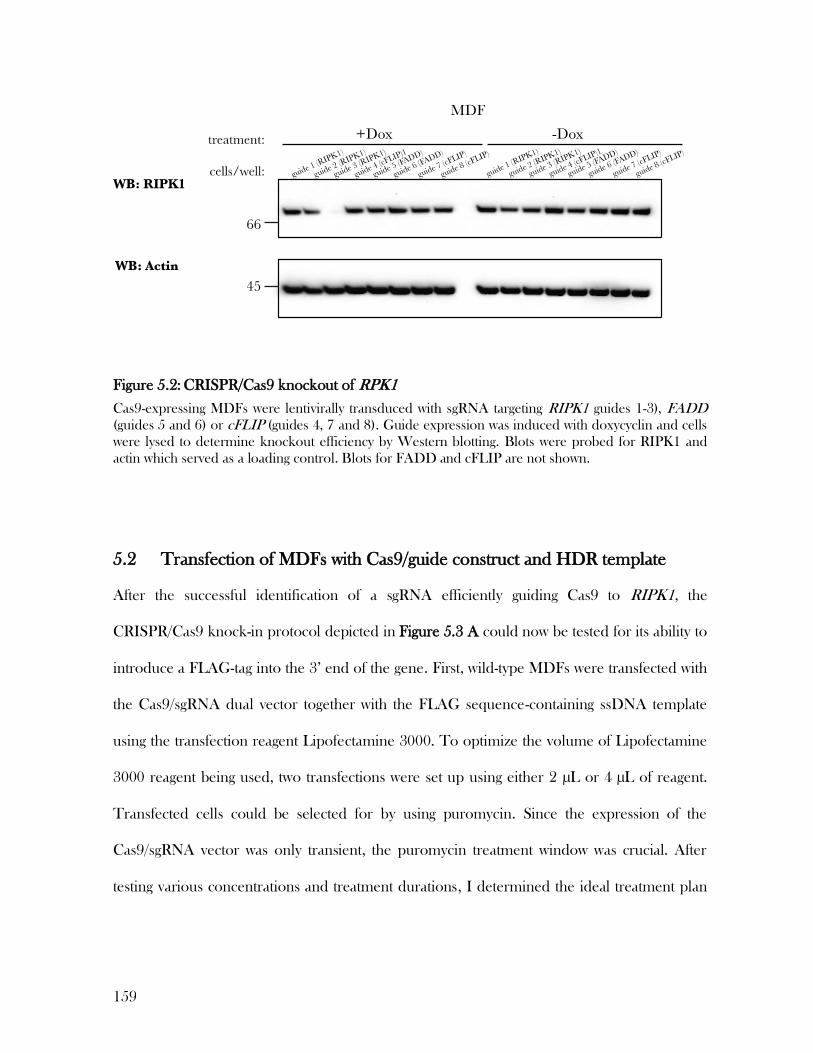
159
Cas9-expressing MDFs were lentivirally transduced with sgRNA targeting RIPK1 guides 1-3), FADD
(guides 5 and 6) or cFLIP (guides 4, 7 and 8). Guide expression was induced with doxycyclin and cells
were lysed to determine knockout efficiency by Western blotting. Blots were probed for RIPK1 and
actin which served as a loading control. Blots for FADD and cFLIP are not shown.
5.2 Transfection of MDFs with Cas9/guide construct and HDR template
After the successful identification of a sgRNA efficiently guiding Cas9 to RIPK1, the
CRISPR/Cas9 knock-in protocol depicted in Figure 5.3 A could now be tested for its ability to
introduce a FLAG-tag into the 3’ end of the gene. First, wild-type MDFs were transfected with
the Cas9/sgRNA dual vector together with the FLAG sequence-containing ssDNA template
using the transfection reagent Lipofectamine 3000. To optimize the volume of Lipofectamine
3000 reagent being used, two transfections were set up using either 2 µL or 4 µL of reagent.
Transfected cells could be selected for by using puromycin. Since the expression of the
Cas9/sgRNA vector was only transient, the puromycin treatment window was crucial. After
testing various concentrations and treatment durations, I determined the ideal treatment plan
Figure 5.2: CRISPR/Cas9 knockout of RPK1

160
to be treating transfected cells with 1mg/mL puromycin one day after transfection for two days.
The transfection rate was approximately 10-20%.
5.3 Knock-in of the FLAG-tag was confirmed via PCR
To confirm the FLAG-sequence containing the HDR template was successfully knocked-in,
PCR reactions were set up for wild-type MDFs transfected with the ssDNA template alone and
MDFs transfected with both the RIPK1 sgRNA and the ssDNA template using either 2 µL or 4
µL Lipofectamine 3000 reagent. Two primer pairs were used. For a control PCR, the forward
primer targeted a region of the RIPK1 exon 11 while the reverse primer recognized a sequence
in the 3’UTR. The presence of the FLAG-tag was confirmed by designing a forward primer
whose sequence is complementary to the FLAG sequence while the same reverse primer was
used. For both reactions, the size of the resulting amplicon was expected to be approximately
1000 bp. The FLAG-sequence containing HDR template was successfully knocked into the
genome of transfected MDFs (Figure 5.3 B). Control PCR reactions generated amplicons of the
anticipated size for all samples, while the FLAG-specific primer pair was only able to amplify its
target sequence in MDFs transfected with the RIPK1 sgRNA and the ssDNA HDR template.
This result indicates that the integration of the HDR donor template occurred in the intended
region and was guided by the RIPK1 sgRNA.

161
(A) CRISPR/Cas9 knock-in of the FLAG-tag into the RIPK1 locus was performed by transfecting MDFs
with the Cas9/sgRNA construct and the ssDNA HDR template containing the FLAG-tag. Cells were
transfected using Lipofectamine 3000. To enrich for positively transfected cells, MDFs were treated with
1ug/mL puromycin 24 h after transfection for two days. One week after treatment, cells were lysed and
DNA was extracted. To determine if a knock-in of the HDR template occurred, PCR was performed
using either a control forward primer (binds to endogenous RIPK1 sequence) or a FLAG sequence-
specific forward primer and a reverse primer that binds to the 3’UTR of RIPK1. (B) PCR of knock-in
cell pool. DNA was extracted from wild-type MDFs (wt MDF) and MDFs transfected with RIPK1
sgRNA and ssDNA template containing the FLAG-tag sequence (sgRIPK1 + FLAG). The numbers (2)
and (4) indicate the volume of lipofectamine 3000 reagent used for transfection, 2 ul or 4 ul, respectively.
Both the control and FLAG-specific PCR reactions generated amplicons of approx. 1kb.
Figure 5.3: CRISPR/Cas9 mediated knock-in was confirmed with PCR
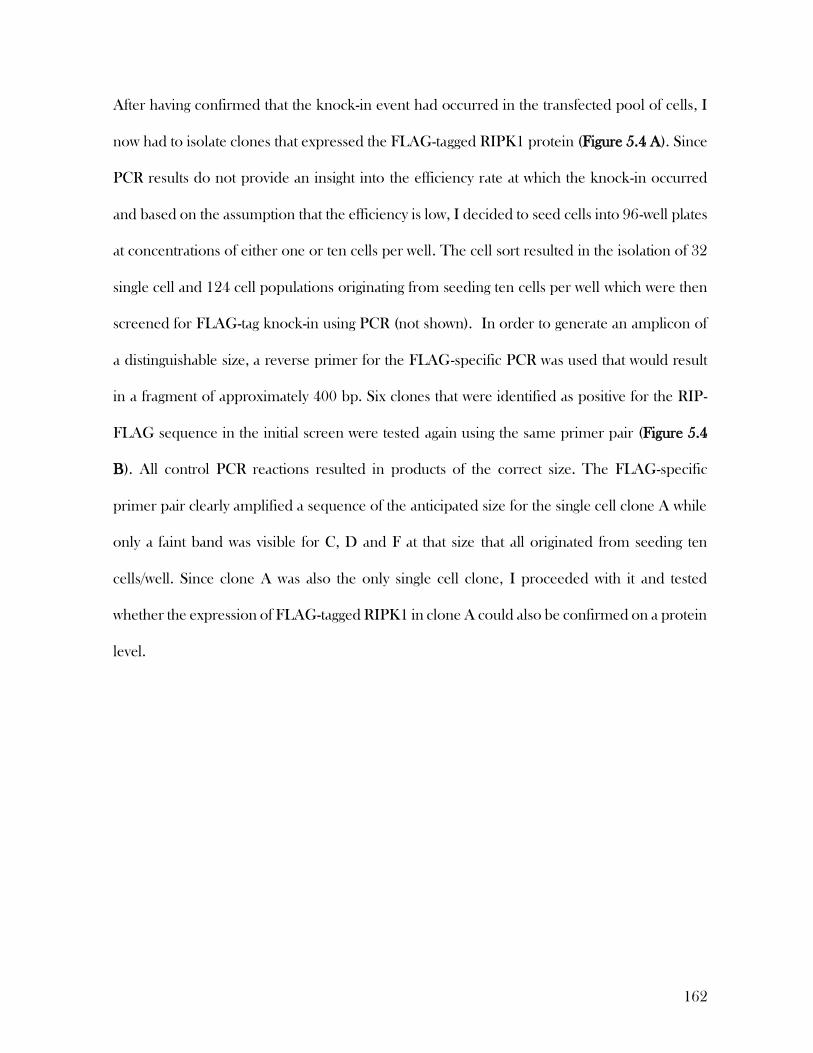
162
After having confirmed that the knock-in event had occurred in the transfected pool of cells, I
now had to isolate clones that expressed the FLAG-tagged RIPK1 protein (Figure 5.4 A). Since
PCR results do not provide an insight into the efficiency rate at which the knock-in occurred
and based on the assumption that the efficiency is low, I decided to seed cells into 96-well plates
at concentrations of either one or ten cells per well. The cell sort resulted in the isolation of 32
single cell and 124 cell populations originating from seeding ten cells per well which were then
screened for FLAG-tag knock-in using PCR (not shown). In order to generate an amplicon of
a distinguishable size, a reverse primer for the FLAG-specific PCR was used that would result
in a fragment of approximately 400 bp. Six clones that were identified as positive for the RIP-
FLAG sequence in the initial screen were tested again using the same primer pair (Figure 5.4
B). All control PCR reactions resulted in products of the correct size. The FLAG-specific
primer pair clearly amplified a sequence of the anticipated size for the single cell clone A while
only a faint band was visible for C, D and F at that size that all originated from seeding ten
cells/well. Since clone A was also the only single cell clone, I proceeded with it and tested
whether the expression of FLAG-tagged RIPK1 in clone A could also be confirmed on a protein
level.
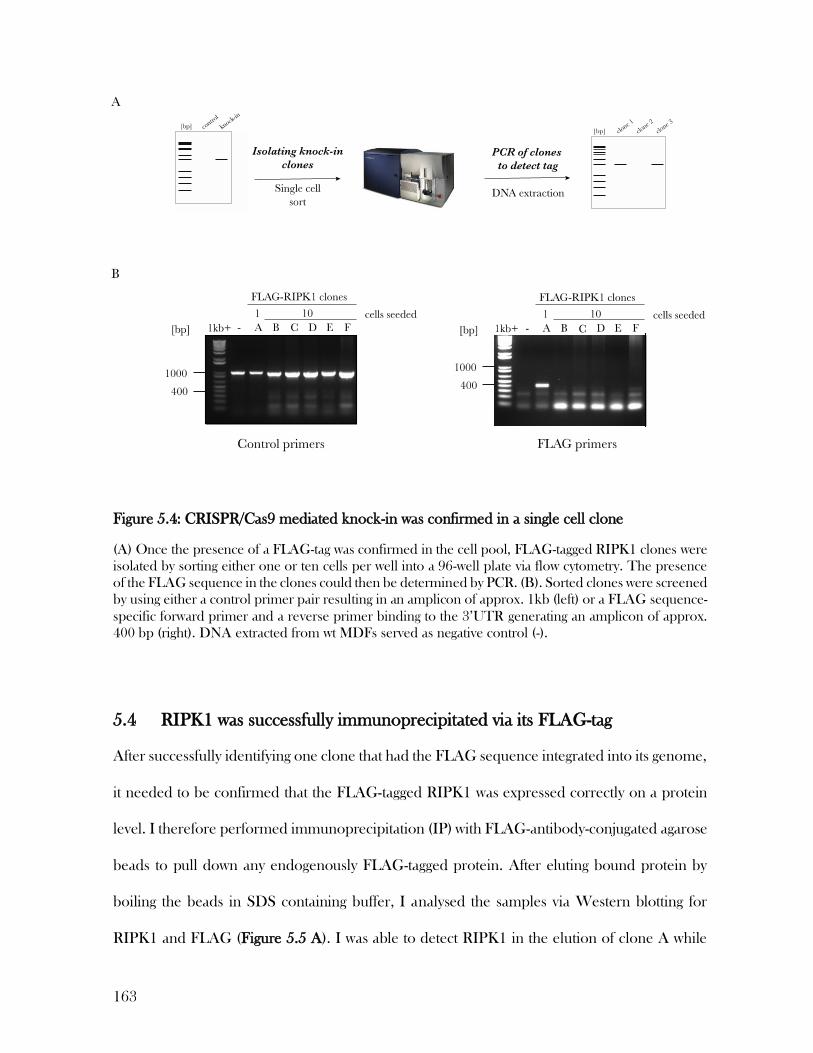
163
Figure 5.4: CRISPR/Cas9 mediated knock-in was confirmed in a single cell clone
(A) Once the presence of a FLAG-tag was confirmed in the cell pool, FLAG-tagged RIPK1 clones were
isolated by sorting either one or ten cells per well into a 96-well plate via flow cytometry. The presence
of the FLAG sequence in the clones could then be determined by PCR. (B). Sorted clones were screened
by using either a control primer pair resulting in an amplicon of approx. 1kb (left) or a FLAG sequence-
specific forward primer and a reverse primer binding to the 3’UTR generating an amplicon of approx.
400 bp (right). DNA extracted from wt MDFs served as negative control (-).
5.4 RIPK1 was successfully immunoprecipitated via its FLAG-tag
After successfully identifying one clone that had the FLAG sequence integrated into its genome,
it needed to be confirmed that the FLAG-tagged RIPK1 was expressed correctly on a protein
level. I therefore performed immunoprecipitation (IP) with FLAG-antibody-conjugated agarose
beads to pull down any endogenously FLAG-tagged protein. After eluting bound protein by
boiling the beads in SDS containing buffer, I analysed the samples via Western blotting for
RIPK1 and FLAG (Figure 5.5 A). I was able to detect RIPK1 in the elution of clone A while

164
for both the wild-type MDFs and clone B (identified as a negative clone via PCR, Figure 5.4 B)
RIPK1 did not appear to be pulled down. It should be noted that the size at which RIPK1 (74.8
kDa) appeared, was slightly higher than expected. When probing for FLAG, I was able to
observe a band for clone A whose size matched the size at which RIPK1 appeared in the
previous blot, while this band was absent in both negative controls. To further increase the
certainty that RIPK1 could be pulled down via FLAG IP, I repeated the FLAG enrichment and
processed the samples for analysis by mass spectrometry. To induce an increase in RIPK1
expression, cells were treated with TNF (L. Wang et al., 2008). Although TNF treatment did
not result in more RIPK1 peptides being detected or the protein coverage being increased,
RIPK1 was identified in FLAG IP samples derived from clone A but not in wild-type MDFs
(Figure 5.5 B). The protein coverage achieved by mass spectrometry was only between 23-26%
which were represented by 12-15 unique peptides (Figure 5.5 C), none of which contained the
FLAG sequence. These peptides were distributed across the RIPK1 protein sequence indicating
that the full-length RIPK1 protein was being enriched (Figure 5.5 D). When comparing the lists
of other proteins being pulled down in the knock-in MDFs with the wild-type sample Tab2, a
known RIPK1-interacting protein, stood out as only being detectable in both knock-in samples
but not the wild-type (Figure 5.5 E) (Yu Wang et al., 2018). Since the IP was only performed
with one technical and one biological replicate per sample, statistical analysis could not be
applied and the results have therefore to be interpreted with caution. However, given that the
wild type control sample was completely devoid of any RIPK1-derived peptides, I was confident
that I had successfully generated a clone (clone A) stably expressing a FLAG-tagged version of
RIPK1.
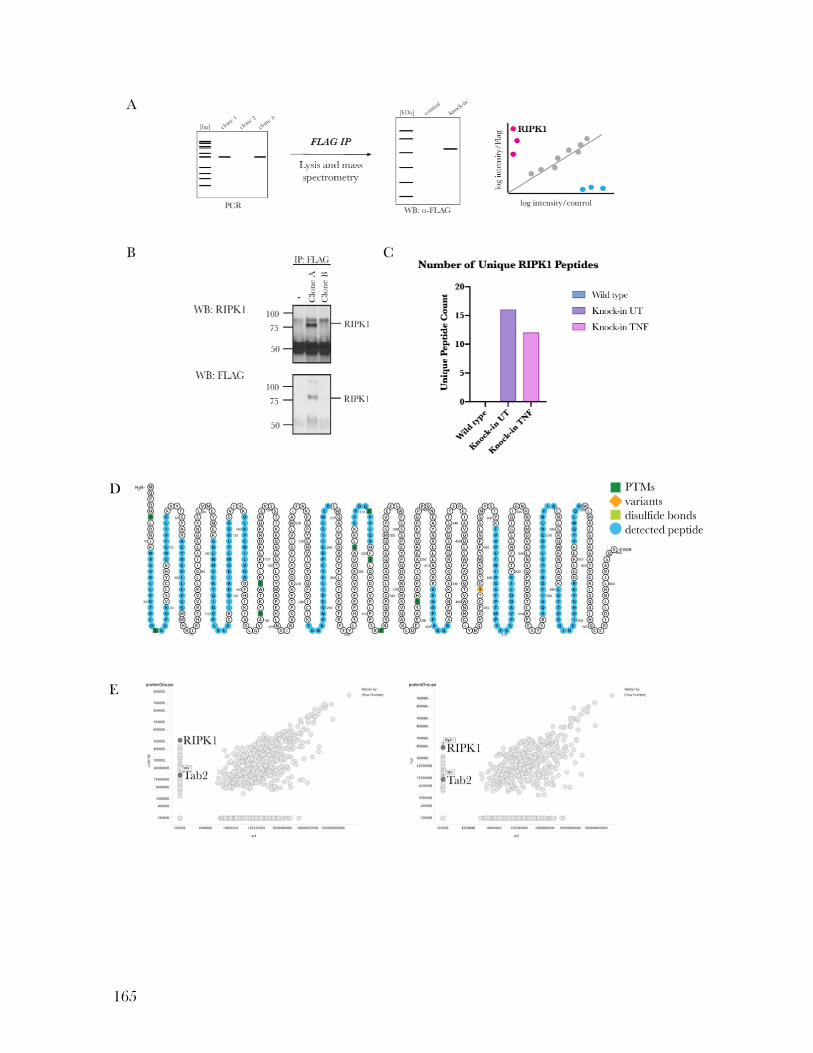
165
D
E

166
(A) Workflow schematic. Clones harbouring the FLAG sequence as determined by PCR were subjected
to FLAG immunoprecipitation and tagged RIPK1 was identified via Western blot and mass
spectrometry. (B) To immunoprecipitate FLAG-tagged RIPK1, lysates of RIPK1 knock-in MDFs and
wild-type MDFs (negative control) were incubated with anti-FLAG agarose beads and bound proteins
were eluted by boiling the beads in SDS lysis buffer. Eluted proteins were detected via Western blotting
and probing for RIPK1 and FLAG. (C) To confirm that RIPK1 could be immunoprecipitated in clone
A via its FLAG-tag, wild-type MDFs, untreated knock-in MDFs and knock-in MDFs treated with TNF
were lysed and incubated with anti-FLAG-coupled agarose beads overnight. Bound proteins were eluted
by the addition of free FLAG peptide and following a tryptic digest, peptides were analysed via mass
spectrometry. Numbers of unique RIPK1 peptides achieved for all samples were determined and
plotted. (D) The RIPK1-derived peptides detected via mass spectrometry were plotted onto the RIPK1
sequence using the web application Protter (http://wlab.ethz.ch/protter). Detected peptides are
highlighted in blue. (E) Spotfire intensity comparison plot showing proteins detected in unstimulated
(left) and TNF-treated (right) knock-in samples compared to wild-type. Each protein is represented by a
grey sphere. Proteins located along the y-axis were only detected in knock-in samples while proteins
along the x-axis could only be found in the wild-type sample. Highlighted are RIPK1 and Tab2, a RIPK1-
interacting protein. Data is representative of one experiment.
Figure 5.5: FLAG-tagged RIPK1 can be immunoprecipitated using anti-FLAG beads
167
5.5 Next Generation Sequencing revealed the presence of multiple edited
sequences
The fact that only one positive knock-in clone could be identified among the 150 screened
clones reflects the low frequency of knock-in events via the HDR pathway compared to NHEJ-
induced genetic knockouts. To achieve a quantifiable readout for the knock-in efficiency, I next
performed next generation sequencing (NGS) of genomic DNA obtained from the knock-in
cell pool. NGS data will not only be an indicator for knock-in efficiency but will also provide a
great insight into the sequences generated by the integration of the ssDNA HDR template. NGS
primers were designed in a way that wild-type and knock-out sequences could both be amplified
by choosing a forward primer approximately 100 bp upstream of the guide’s PAM site. When
analyzing the NGS data, ten different FLAG sequence-containing sequences were identified,
none of which represented the correct knock-in version. Since searching the NGS data set for
the FLAG sequence itself, all ten identified sequences contained the correct FLAG insert. It
can be assumed, however, that more knock-in sequences existed which harbored errors in the
FLAG sequence itself. Within the ten selected sequences a number of deviations from the
original template were observed (Figure 5.6). Sequence 1 displayed the fewest errors but
contained a deletion of 20 nucleotides approximately 20 base pairs upstream of the guide
sequence induced a frameshift which resulted in both translation of the FLAG tag and
termination of protein translation being incorrect. Sequences 2 - 4 and 6 - 8 were all missing 20
(sequence 7) or 21 nucleotides which partially included the guide sequence. Although a deletion
of 21 nucleotides would not induce a frameshift, it cannot be excluded that this mutation altered
protein expression or function. Sequence 9 did not have any deletions but insertions of 13
nucleotides within the PAM sequence and four nucleotides right after the FLAG sequence and
before the stop codon. Again, those mutations induced frameshifts that were likely to interfere
168
with protein translation. Given the close proximity of the deletions and insertions to the Cas9
cleavage site, a possible explanation for those mutations is that after the ssDNA HDR template
was integrated, the guide was still able to recognize the altered PAM site allowing Cas9 to induce
DSBs within the template. It is also likely that DNA repair was not only driven by HDR but
also the error-prone NHEJ pathway, leading to non-homologous repair by joining DSB-
generated ends. Given that I have been able to isolate a clone where RIPK1 could be pulled
down via its FLAG tag, at least one of those sequences is likely to have led to the successful
expression of the FLAG-tagged protein. Sequencing of clone A will reveal which of those knock-
in sequences, if any, was responsible for that.
By calculating the ratios of reads per sequence and total reads, I determined the highest
frequency any FLAG-containing sequence was detected at to be only 0.05% (Table 5.1). In other
words, I would have to screen 2000 single cell-derived clones to find one clone containing the
sequence that occurred at the highest frequency. Taking both the high error rate and the low
frequencies of integrations into account, this approach did not seem feasible to be applied as a
standard technique for tagging any protein of interest. Nevertheless, in the case of RIPK1 it was
still possible that clone A exhibited a useful phenotype. I next aimed to determine the sequence
of this clone via Sanger sequencing since in theory only one (homozygous knock-in) or two
(heterozygous knock-in) sequences could exist.

169
Multiple sequence alignment of FLAG-tag-containing knock-in sequences with the RIPK1-FLAG HDR
template. Next Generation Sequencing of the MDF knock-in pool was performed using Illumina HiSeq.
All sequences that contained the correct FLAG-tag sequence were aligned with the RIPK1-FLAG HDR
template sequence (top sequence). Mutated PAM site (blue), guide sequence (red) and FLAG sequence
(yellow) are highlighted. Gaps and mismatches in the aligned sequences are also marked in red.
Figure 5.6: Next Generation Sequencing revealed that various knock-in sequences were
generated
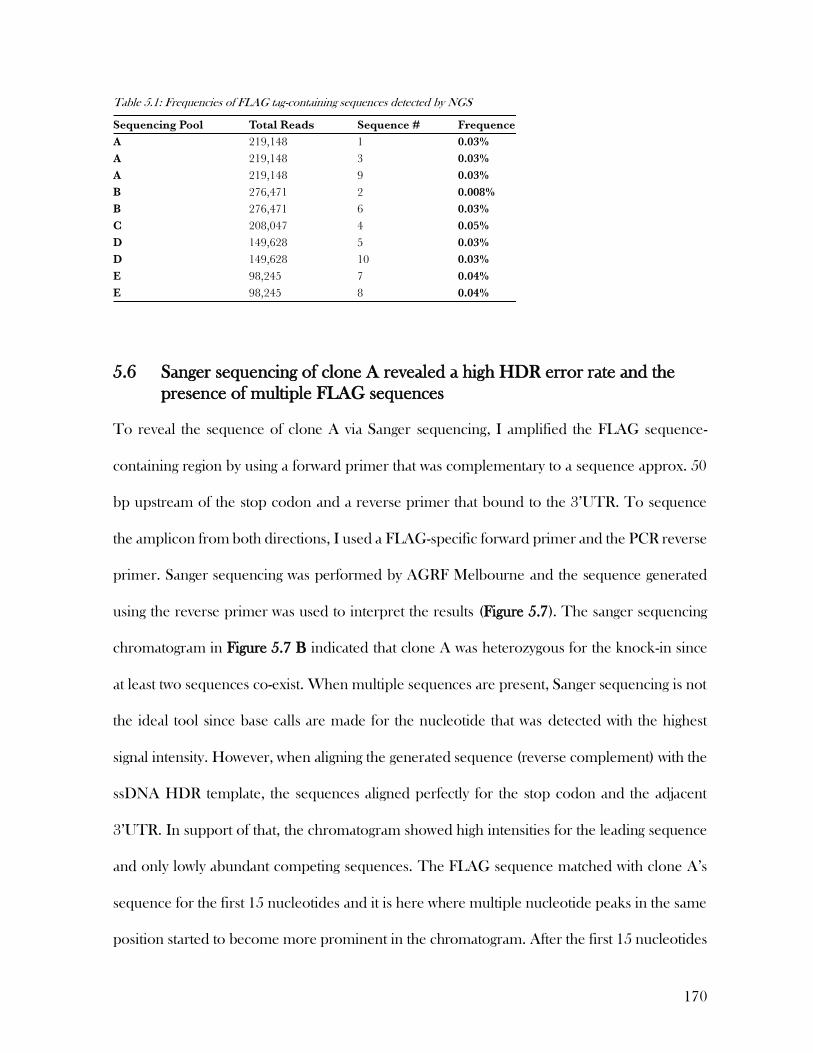
170
Table 5.1: Frequencies of FLAG tag-containing sequences detected by NGS
5.6 Sanger sequencing of clone A revealed a high HDR error rate and the
presence of multiple FLAG sequences
To reveal the sequence of clone A via Sanger sequencing, I amplified the FLAG sequence-
containing region by using a forward primer that was complementary to a sequence approx. 50
bp upstream of the stop codon and a reverse primer that bound to the 3’UTR. To sequence
the amplicon from both directions, I used a FLAG-specific forward primer and the PCR reverse
primer. Sanger sequencing was performed by AGRF Melbourne and the sequence generated
using the reverse primer was used to interpret the results (Figure 5.7). The sanger sequencing
chromatogram in Figure 5.7 B indicated that clone A was heterozygous for the knock-in since
at least two sequences co-exist. When multiple sequences are present, Sanger sequencing is not
the ideal tool since base calls are made for the nucleotide that was detected with the highest
signal intensity. However, when aligning the generated sequence (reverse complement) with the
ssDNA HDR template, the sequences aligned perfectly for the stop codon and the adjacent
3’UTR. In support of that, the chromatogram showed high intensities for the leading sequence
and only lowly abundant competing sequences. The FLAG sequence matched with clone A’s
sequence for the first 15 nucleotides and it is here where multiple nucleotide peaks in the same
position started to become more prominent in the chromatogram. After the first 15 nucleotides
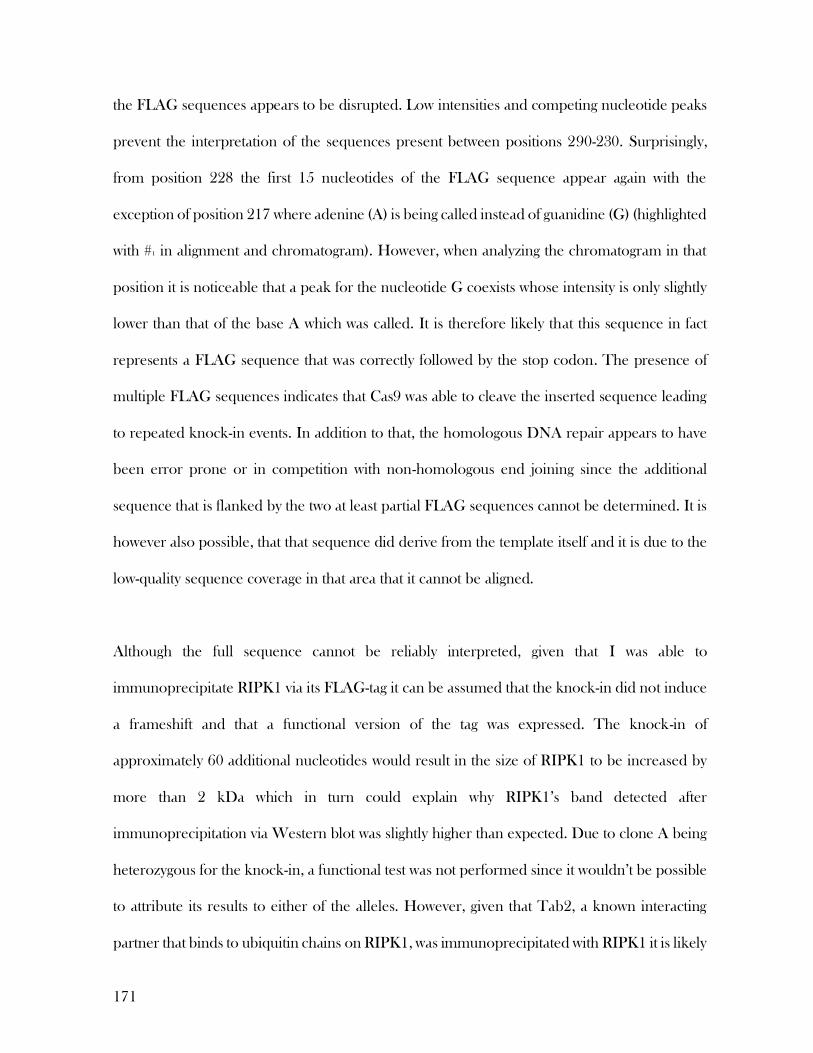
171
the FLAG sequences appears to be disrupted. Low intensities and competing nucleotide peaks
prevent the interpretation of the sequences present between positions 290-230. Surprisingly,
from position 228 the first 15 nucleotides of the FLAG sequence appear again with the
exception of position 217 where adenine (A) is being called instead of guanidine (G) (highlighted
with #1 in alignment and chromatogram). However, when analyzing the chromatogram in that
position it is noticeable that a peak for the nucleotide G coexists whose intensity is only slightly
lower than that of the base A which was called. It is therefore likely that this sequence in fact
represents a FLAG sequence that was correctly followed by the stop codon. The presence of
multiple FLAG sequences indicates that Cas9 was able to cleave the inserted sequence leading
to repeated knock-in events. In addition to that, the homologous DNA repair appears to have
been error prone or in competition with non-homologous end joining since the additional
sequence that is flanked by the two at least partial FLAG sequences cannot be determined. It is
however also possible, that that sequence did derive from the template itself and it is due to the
low-quality sequence coverage in that area that it cannot be aligned.
Although the full sequence cannot be reliably interpreted, given that I was able to
immunoprecipitate RIPK1 via its FLAG-tag it can be assumed that the knock-in did not induce
a frameshift and that a functional version of the tag was expressed. The knock-in of
approximately 60 additional nucleotides would result in the size of RIPK1 to be increased by
more than 2 kDa which in turn could explain why RIPK1’s band detected after
immunoprecipitation via Western blot was slightly higher than expected. Due to clone A being
heterozygous for the knock-in, a functional test was not performed since it wouldn’t be possible
to attribute its results to either of the alleles. However, given that Tab2, a known interacting
partner that binds to ubiquitin chains on RIPK1, was immunoprecipitated with RIPK1 it is likely

172
that the introduction of the FLAG-tag and the additional sequence did not interfere with at least
some of its functions. Since my aim was to develop a CRISPR/Cas9 knock-in protocol that
could be used to efficiently generate endogenously tagged proteins in various cell lines in a high
throughput manner, I could conclude that the tested approach did not fulfill these criteria.
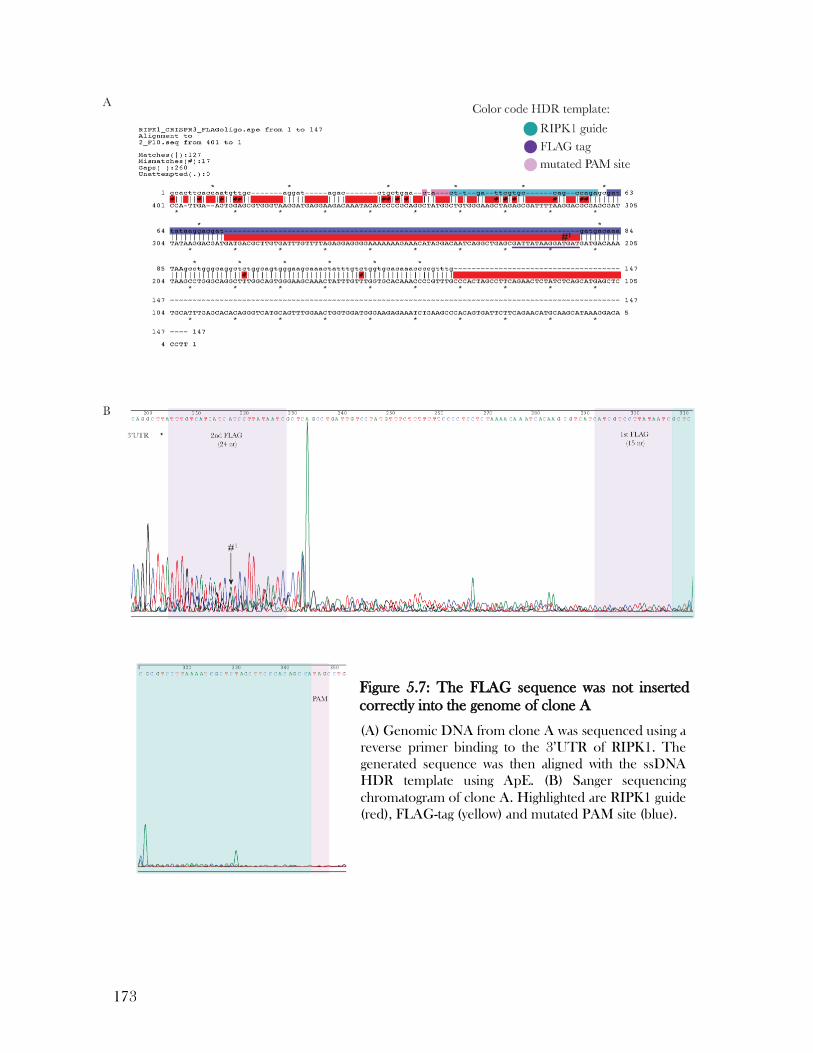
173
Figure 5.7: The FLAG sequence was not inserted
correctly into the genome of clone A
(A) Genomic DNA from clone A was sequenced using a
reverse primer binding to the 3’UTR of RIPK1. The
generated sequence was then aligned with the ssDNA
HDR template using ApE. (B) Sanger sequencing
chromatogram of clone A. Highlighted are RIPK1 guide
(red), FLAG-tag (yellow) and mutated PAM site (blue).
174
5.7 Discussion
As mentioned previously, a number of methods have been described that use the CRISPR/Cas9
system to introduce foreign sequences into the host’s genome for the generation of tagged
proteins. In the approach I applied, the FLAG tag sequence was delivered into the cells via
lipofection and in the form of a ssDNA oligomer of only approximately 200 bp. The correct
integration of the HDR template relies on ectopically expressed Cas9/sgRNA and the cells’
HDR machinery. A high knock-in efficiency is essential to obtain cells harboring the desired
foreign sequence. However, with the efficiency for detecting an integrated FLAG sequence
being less than 0.1%, large numbers of clones would have to be screened, making the
identification of a positive clone a very laborious and time-consuming task. Sequencing of the
transfected cell pool also revealed that when a knock-in event occurs, many errors are
introduced during the repair process. In fact, I was unable to obtain a sequence where the
template was correctly inserted and repaired through the HDR pathway. To improve the
applied approach, two factors needed to be considered: the new method would have to lead to
a higher knock-in efficiency and the HDR pathway activation would have to be increased to
reduce errors during the repair process. The former can be achieved by altering the way of how
the guide as well the Cas9 protein are delivered into cell. Rather than transfecting cells with
plasmid-borne Cas9 and sgRNA constructs which first have to be transcribed and, in the case
of Cas9, translated, both could be delivered in form of Cas9/gRNA ribonucleoproteins (RNPs)
(Lin et al., 2014). Rather than relying on the cell to generate functional Cas9-gRNA complexes,
Cas9 RNPs are provided to the cell as intact complexes. By skipping the
transcription/translation and assembling processes, Cas9 RNPs can increase the efficiency of
gene editing by increasing the rate at which it occurs. Since the HDR template does not have to
be processed, the induction of DSBs by Cas9 and the activation of the HDR pathway by the
175
presence of homologous DNA occur as close to the time of transfection as possible. Another
advantage the Cas9 RNP has over the plasmid-based method is that the protein complex is
getting cleared by the cell rapidly, reducing the amount of time that Cas9 is able to cleave
undesired targets or the introduced sequence itself. The downside of this method is that it
requires the use of recombinant Cas9 which is costly. Guides have to be either purchased in
form of RNA which again is expensive or generated in-house by transcription. Delivering Cas9
RNPs into cells can be achieved by either lipofection or nucleofection with the latter being
another costly technique. Another disadvantage of this method is that positively transfected cells
cannot be selected for. In MDFs, using lipofection to deliver DNA, only about 10-20% were
successfully transfected. Not being able to select for those already increases the screening efforts
by a factor of 5 - 10.
Alternatively, instead of increasing the knock-in efficiency, being able to select for positive clones
using a selection marker would facilitate the screening process immensely. To accomplish this,
an antibiotic resistance or fluorescence marker could be inserted into the genome together with
the FLAG tag allowing the selection of positive knock-in clones by treatment with antibiotics or
sorting via FACS. In that case, the HDR template would have to be a much larger, plasmid-
based construct, decreasing the transfection efficiency. However, since the selection process
does not rely on high transfection or gene editing efficiencies, this downside would be
neglectable. On the upside, a plasmid-based construct also reduces size restrictions that apply
for ssDNA oligomers which limit the length of homology arms. It is possible that homology
arms of only approx. 60 bp were insufficient to fully activate the HDR pathway, leading to an
error-prone repair. An HDR template plasmid containing the FLAG sequence as well as a
selection marker could have much longer homology arms which might increase the accuracy at

176
which the DNA repair process occurs. The choice of cell type is another factor that needs to be
considered when trying to improve gene editing accuracies. A cell’s ability to repair Cas9-
induced DSBs via the HDR pathway varies greatly (Nambiar et al., 2019). With the
CRISPR/Cas9 technology still being in its infancies, particularly when it comes to targeted gene
editing, few cell lines have been described with regards to their HDR machineries. One cell line
whose application for CRISPR/Cas9 knock-in had been demonstrated and that is frequently
used in our lab is the human cell line HeLa (Koch et al., 2018). HeLa cells can be easily
cultured, have a high proliferation rate and can be transfected via lipofection at a high efficiency.
Taking all the acquired knowledge together, the subsequent knock-in protocol should include
a template in form of a plasmid containing the FLAG sequence followed by a puromycin
resistance gene to select for cells where the template has been inserted into the genome correctly
with no introduced frameshifts. A schematic of such a plasmid is described in Figure 5.8. The
depicted plasmid represents an example of how a C-terminal FLAG tag knock-in in human
RIPK1 could be generated. However, strategically placed restriction sites would allow the
plasmid to be used to target any given gene with a tag of choice. Additionally, the selection
marker could also be replaced by an alternative marker such as a fluorescent protein in case
antibiotic resistance is not desirable. Since the HDR plasmid is designed specifically for a C-
terminal tag where the template is inserted upstream of the stop codon, the tag sequence needs
to be followed by a stop codon. In this case, the selection marker would not be transcribed,
requiring the presence of an IRES (internal ribosome entry site). If expression of the selection
marker was unwanted, loxP sites could flank its sequence so that treatment with Cre
recombinase would lead to the deletion of the selection marker. As described earlier, the length
of the homology arms is less restricted in a plasmid. The required length for the homology arms
177
varies depending on the size of the fragment that is to be inserted and generally the longer the
insert, the longer the homology arms should be. However, there is no formula to determine the
ideal length of the homology arms since that depends on various factors such as the applied cell
line and the Cas9 and sgRNA delivery method (Aird et al., 2018). In HeLa cells when using a
plasmid-based system for the delivery of both Cas9/sgRNA and the HDR template, homology
arms of approx. 800-1000 bp have been shown to be effective at activating the cells’ HDR
pathway (N. Yan et al., 2020).
Lastly, after more efforts are being applied towards generating endogenously tagged proteins,
especially with the generation of knock-in mice being a widely available technique these days, it
has been identified that the single FLAG tag can have limitations in its detectability. This is
particularly true for immunofluorescent staining or when working with proteins whose
expression levels are low. To circumvent this issue, a triple FLAG tag, which consists of 22
amino acids (DYKDHD-G-DYKDHD-I-DYKDDDDK) could replace the single FLAG
sequence.
In summary, to improve the tested strategy for performing a CRISPR/Cas9-mediated knock-in
of a protein tag, changing to a cell line that is more established for this particular technique might
increase chances of success. Additionally, knocking in a selection marker together with the
desired tag would allow for bypassing the issues around low efficiency knock-in events. Lastly,
delivering the HDR template in form of a plasmid with longer homology arms might activate
the HDR pathway more efficiently as well as decrease the error rate during DNA repair. In
order to generate a method that would allow us to tag any protein of interest in any desired cell
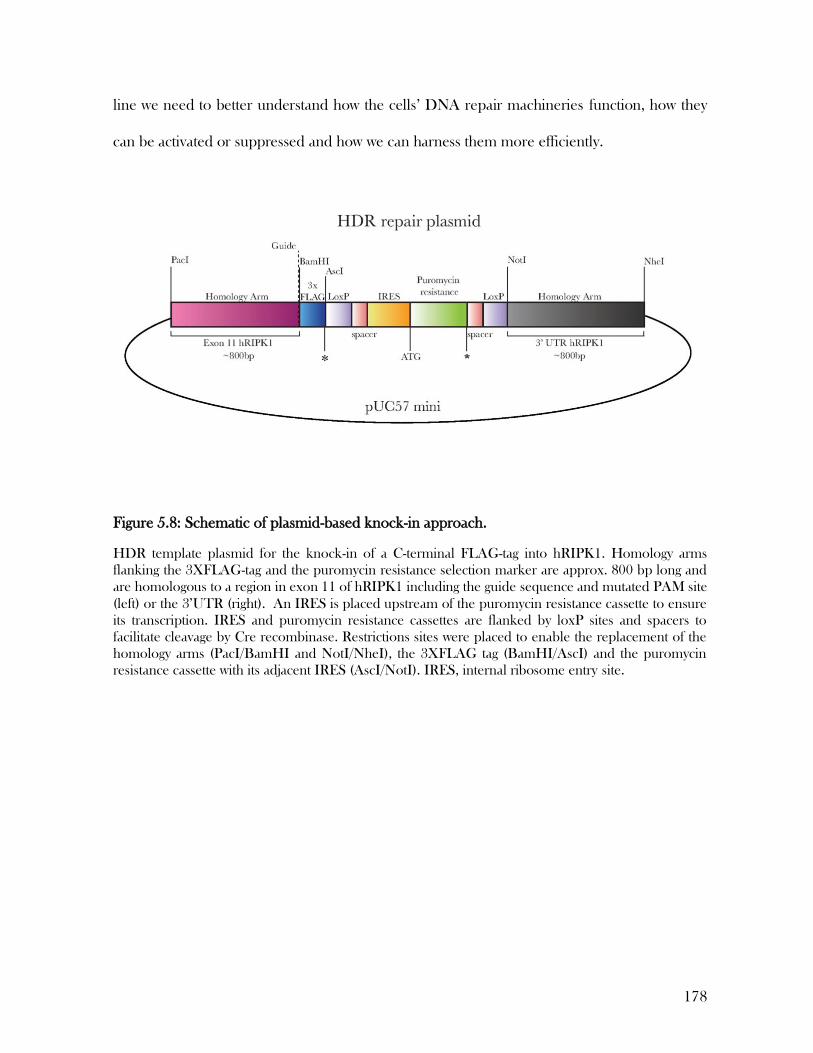
178
line we need to better understand how the cells’ DNA repair machineries function, how they
can be activated or suppressed and how we can harness them more efficiently.
Figure 5.8: Schematic of plasmid-based knock-in approach.
HDR template plasmid for the knock-in of a C-terminal FLAG-tag into hRIPK1. Homology arms
flanking the 3XFLAG-tag and the puromycin resistance selection marker are approx. 800 bp long and
are homologous to a region in exon 11 of hRIPK1 including the guide sequence and mutated PAM site
(left) or the 3’UTR (right). An IRES is placed upstream of the puromycin resistance cassette to ensure
its transcription. IRES and puromycin resistance cassettes are flanked by loxP sites and spacers to
facilitate cleavage by Cre recombinase. Restrictions sites were placed to enable the replacement of the
homology arms (PacI/BamHI and NotI/NheI), the 3XFLAG tag (BamHI/AscI) and the puromycin
resistance cassette with its adjacent IRES (AscI/NotI). IRES, internal ribosome entry site.
179
6 Conclusion and future perspectives
6.1 AML mouse model
In Chapter 3 of this thesis I presented data on the effect of EVI1 overexpression in MLL-AF9
driven AML in vivo and in vitro. In my study, I aimed to develop a disease model, that faithfully
mimics a particular aggressive form of human AML in mice as commonly used AML mouse
model currently fail to reflect the molecular complexities observed in patients. Generating
EVI1-expressing leukemias consistently was challenging with the majority of mice developing
EVI1neg AML. When EVI1 was expressed in leukemic cells, the expression levels varied greatly.
Although EVI1 expression did not affect latency, disease pathology or phenotypical features of
AML, in vitro, EVI1pos AML showed increased resistance to cell death-inducing treatment,
where the degree of resistance correlated with EVI1 expression levels. These findings indicate
that in MLL-AF9 AML, high levels of EVI1 can reduce the sensitivity of leukemic cells to
chemotherapy, at least in vitro, which is consistent with what is observed in human patients. This
work therefore justifies efforts towards developing a technique that allows the reliable and
consistent generation of an MLL-AF9/EVI1 mouse model.
To date, many AML patients are still burdened with a poor prognosis and progression towards
improved treatments has been slow. A major barrier for the translation of novel therapies from
research into the clinic is the lack of appropriate disease models. AML models often rely on
the expression of one oncogene while additional mutations may occur at random during latency.
However, AML is a genetically heterogenous disease rather than a homologous collection of
malignant cells (Saygin et al., 2019). It exhibits a phenotypic and functional diversity which
greatly contributes to treatment resistance and relapse and which is difficult to mimic in AML
180
models (Meacham et al., 2013). There is strong evidence that within a subclone, the ability of a
cell to survive anti-cancer treatment is not determined by genetics but can rather be contributed
to epigenetic modifications which lead to the activation of developmental pathways (Visvader et
al., 2012). The transcription factor and proto-oncogene EVI1 is commonly over-expressed in
AMLs with MLL-translocation, where it is associated with poor prognosis. Evidence suggests,
that the transcriptional upregulation of EVI1 in AML is caused by aberrant epigenetic patterns
(Vazquez et al., 2011). As discussed earlier (Section 1.3), the role of EVI1 in leukemogenesis
in mice has been confirmed and its ability to accelerate disease onset in animal models was in
line with observations in human patients, where high EVI1 levels were linked to more aggressive
forms of the disease (Gomez-Benito et al., 2010). Generating an MLL-AF9/EVI1 mouse model
as a tool to develop novel therapies therefore represents a progression from commonly used
models that only rely on the expression of AML-inducing oncogenes. When aiming to develop
such a model by injecting fetal liver cells that were retrovirally transduced with constructs
encoding for MLL-AF9 and EVI1 into irradiated mice, I faced great challenges that I described
in detail in Chapter 3. I hypothesized, that EVI1 expression will provide leukemic cells with an
additional proliferative advantage leading to an enrichment of EVIpos cells and hence the
development of MLL-AF9/EVI AML. I further hypothesized that the onset of EVI1-expressing
AML will be accelerated and exhibit a more severe disease phenotype as well as an increased
resistance to treatment. Since the majority of generated leukemias did not express EVI1 and
with most EVIpos AMLs only expressing the transcription factor in a population of cells, EVI1
did not appear to provide transformed cells with an additional proliferative advantage. When
MLL-AF9/EVI1 AML was successfully generated, latency and severity were unaffected by the
expression of EVI1. A role of EVI1 in leukemogenesis was however supported, when EVIpos
AMLs demonstrated increased resistance to in vitro treatment with a chemotherapeutic agent
181
or a Smac mimetic combination treatment that otherwise efficiently kills MLL-AF9 cells in vivo
and in vitro. Intriguingly, this resistance positively correlated with EVI1 expression levels.
In summary, I believe that this work delivers a compelling argument for continued efforts into
developing an MLL-driven EVI1high AML mouse model. Such a model could faithfully reflect a
particularly aggressive and treatment-resistant AML which is of great relevance for the
development of novel therapies. Since patients that present at clinical trials have previously
undergone unsuccessful conventional therapy, the efficiencies of novel treatments are generally
tested in patients that suffer from more aggressive and treatment-resistant forms of AML.
The lack of appropriate mouse models for the overexpression of EVI1 has been discussed in
the literature in great detail (Glass et al., 2014). Recently, an EVI1-inducible system was
developed by inserting seven Tet operons into the first exon, allowing for the over-expression
of all three isoforms of endogenous EVI1 (Ayoub et al., 2018). EVI1 expression was induced
by crossing EviTO/TO (harbors tet-inducible Evi1 allele) to RosarTA/rTA (harbors reverse-tet
transactivator). Although this model was used to study the molecular mechanisms of EVI1 in
leukemogenesis, it could also be a powerful tool for the efficient generation of EVI1-expressing
AML or cancers in general. To do so, fetal livers from EviTO/TO/RosarTA/rTA embryos could be
transduced with MLL-AF9 and injected into irradiated mice. Upon administration of Dox,
EVI1 expression would be induced in all hematopoietic cells including all leukemic cells that
will develop. Therefore, high EVI1 levels would be guaranteed to occur in all AMLs, leading to
reduced variability and increased reproducibility. Using this approach could enable us to
develop an AML model that can be standardized and that faithfully reflects a particularly

182
aggressive and treatment-resistant form of AML. Such a model would be a powerful tool for the
development of novel therapies.
6.2 The role of p38 in inhibiting Smac mimetic-induced cell death
In Chapter 4 of this thesis I investigated the role of the MAP kinase p38 in inhibiting TNF-
dependent death in cells treated with Smac mimetic. To uncover novel functions of p38 in
regulating apoptosis in the absence of IAPs, I studied the phosphoproteome of BMDMs treated
with Smac mimetic alone or in combination with a p38 inhibitor and identified proteins that
were differentially phosphorylated in the two treatments. This work revealed that the cell
survival pathway PI3K/Akt/mTOR was activated in Smac mimetic-treated cells and that this
activation appeared to be dependent on p38. Additionally, the production of TNF appeared to
be negatively regulated by p38, although further research is required to confirm the roles of
detected phosphorylation sites on a number of TNF mediators. These findings clearly increase
our understanding of treatment resistance to Smac mimetic which greatly limits its application
as a single agent. Furthermore, my work presented strong evidence that p38 can inhibit cell
death through additional mechanisms to phosphorylation of RIPK1 by MK2 and that these
mechanisms involve the activation of cell survival pathways and the suppression of TNF.
However, the exact mechanisms by which p38 regulates these processes remain mostly
unresolved.
The upregulation of IAPs are commonly detected in different cancers where they can contribute
to treatment resistance (Owens et al., 2013). For that reason, the IAPs were identified as an
attractive target for anti-cancer therapy which lead to the development of IAP antagonists called
183
Smac mimetics. Disappointingly, the ability of Smac mimetics to induce cell death in cancer
cells as a single agent was limited. However, resistances to Smac mimetic could often be
overcome by the addition of exogenous TNF. Today, a number of highly effective combination
treatments involving Smac mimetics have been described to selectively and efficiently induce
cell death in cancer cells in vivo and in vitro. One of those treatments that evolved from my lab
is the combination of the Smac mimetic Birinapant and a p38 inhibitor (Najoua Lalaoui et al.,
2016). Smac mimetics induce cell death that is dependent on TNF and the additional inhibition
of p38 has been found to dramatically increase TNF production in treated cells. One
mechanism through which p38 inhibits cell death in the absence of IAPs is through the
activation of its substrate MK2 which in turn phosphorylates RIPK1 (Jaco et al., 2017).
Phosphorylated RIPK1 is unable to participate in the formation of the cell death-inducing
complex II, hence inhibiting apoptosis. We have identified that the phosphorylation of RIPK1
is not the only mechanism through which p38 and inhibit cell death, since RIPK1S321A/S226A
BMDMs could be further sensitized to Smac mimetic-induced cell death when p38 or MK2
were inhibited (Figure 4.1). By studying the phosphoproteome of treated cells, I identified that
the cell survival pathway PI3K/Akt/mTOR was activated upon Smac mimetic treatment
potentially preventing cell death to occur. As a possible activator of this pathway, I detected
novel phosphorylation sites on the receptor tyrosine kinase CSF1R when p38 was additionally
inhibited. I hypothesized that four phosphorylated residues detected in the combination
treatment, flanked Tyr721, whose phosphorylation is required for CSF1R activity, prevented
the activation of the PI3K/Akt/mTOR pathway. As a consequence, inhibition of this cell survival
pathway allows cell death to occur. This hypothesis was confirmed, when the inhibition of
CSF1R in Smac mimetic-treated cells also induced cell death. Furthermore, I confirmed by
Western blot that downstream of PI3K, activation of Akt was reduced in the combination
184
treatment of Smac mimetic and p38 inhibitor. Whether the ability of p38 to inhibit cell death
by activating the cell survival pathway PI3K/Akt/mTOR is independent of MK2-mediated
RIPK1 phosphorylation will need to be confirmed. This could be done by assessing the cell
death in RIPK1S321A/S226A induced by the combination of Smac mimetic and CSF1Ri. If the
inhibition of CSF1R further sensitizes cells to Smac mimetic-induced cell death, it can be
assumed that p38 can activate the PI3K/Akt/mTOR pathway independently of RIPK1.
Since the PI3K/Akt/mTOR pathway is commonly upregulated in cancers, my work revealed
not only an important resistance mechanism to Smac mimetic treatment but also uncovered a
novel role of p38 in the activation of this pathway (Jing Yang et al., 2019). At the same time, the
inhibition of p38 effectively prevented PI3K/Akt/mTOR signaling which was potentially
mediated by a kinase that is able to inhibit CSF1R activity by phosphorylation. It would be of
great interest to identify this kinase which appears to be activated only upon p38 inhibition. Its
identification would therefore give us an even greater insight into the complex roles of p38 and
its involvement in cell survival and cell death.
Phosphoproteomics represents a powerful tool for studying complex signaling events. During
this project, I identified a large number of novel phosphorylation sites and I was able to associate
known phosphosites with potential regulatory functions. Although more work is needed to
confirm these functions, the amount of information gained from just one experiment is
astounding. In order to validate functions of phosphosites in a fast, reliable and economic
manner, techniques that allow for the generation of phospho mutants in cell lines need to be
improved. One technique that enables us to precisely modify proteins and study their function
185
in their endogenous environment is CRISPR/Cas9-mediated knock-in. However, the
application of this approach in cell lines, remains challenging.
6.3 CRISPR/Cas9-mediated knock-in to generate tagged proteins
In Chapter 6 of this thesis I documented my approach of generating a protocol that allows for
the precise insertion of a molecular FLAG-tag into the genome of cells using CRISPR/Cas9-
mediated knock-in. By applying this technique, I aimed to tag proteins of the TNF pathway
enabling us to address outstanding questions by studying its components on an endogenous
level. The use of molecular tags to immunoprecipitate proteins with their interactors or to
visualize protein localization in a cell via immunofluorescence, is a well-established tool (Gerace
et al., 2015). Traditionally, this involves the generation of a transgenic expression construct
which encodes for the gene of interest fused to the FLAG sequence and the stable, random
integration of this plasmid into the genome of cell lines via viral transduction (Izmiryan et al.,
2011). Often the target cell lines are void of this gene either due to genetic deletion or by nature.
This approach however can be flawed since protein expression levels do not replicate
endogenous concentrations which can lead to altered protein functions (Moriya, 2015). In some
cases, once a gene was deleted in a cell, it cannot be reintroduced as it is the case with mRIPK1.
Therefore, the ability to precisely introduce foreign sequences into a cells’ genome is a powerful
tool that allows researchers to explore proteins in their endogenous environment. Given the
complexity of the TNF pathway and the limitations we are facing when using traditional
molecular tools, tagging its components using CRISPR/Cas9-mediated knock-in would present
us with the opportunity to address questions that we were not able to explore previously.
Although a number of protocols that describe methods for applying CRISPR/Cas9-mediated
knock-in in cell lines, transferring the approaches to different cell lines and genes often fails.
186
Generally, the methods differ in the way of how foreign content (DNA, RNA, protein) is
delivered into the cell with the two main methods being nucleofection and lipofection. Other
deviations involve the format of Cas9 used (recombinant protein vs. DNA expression construct),
the format of the guide (RNA vs. DNA expression construct) and the nature of the tag-
containing knock-in template (ssDNA vs. plasmid). To develop a protocol that can be routinely
used, I chose an approach that is cost-effective and involved the use of a dual expression
construct encoding for Cas9 and the sgRNA and an ssDNA HDR knock-in template of maximal
200 bp. All constructs were simultaneously delivered into the cells via lipofection. To test the
efficiency of this approach, I aimed to introduce a FLAG-tag into the C-terminus of RIPK1 in
MDFs. Although I was able to select for successfully transfected cells due to the presence of a
puromycin resistance gene within the Cas9/sgRNA plasmid, extremely low knock-in efficiency
required for the screening of hundreds of single cell clones. Unexpectedly, next generation
sequencing revealed a high error rate during the homologues DNA repair indicating that the
HDR mechanism in MDFs has inferior efficiency and is dwarfed by that of the NHEJ
machinery. It is therefore possible, that MDFs are inherently less hospitable to CRISPR/Cas9-
mediated knock-in compared to cell types that have been described to exhibit high HDR
efficiencies such HEK293T cells (X. Xu et al., 2018).
In summary, two issues needed to be addressed in order to develop a protocol that can be
routinely used for tagging any gene of the TNF pathway in cell lines: Firstly, knock-ins needed
to occur at higher frequencies to reduce the time required to screen for clones positive for a
knock-in and secondly, error rates had to be reduced to generate knock-ins that contained the
correct sequences. Since knock-in efficiencies in MDFs were extremely low and errors occurred
at a rate that did not even allow for the detection of a correct knock-in sequence even when the

187
NHEJ inhibitor SCR7 was applied, an alternative cell line needs to be used. A cell line in which
CRISPR/Cas9-mediated knock-in has been successfully used in and that is appropriate for the
study of the TNF pathway is the human cell line HeLa (Koch et al., 2018). To overcome the
necessity of screening a large number of clones, we could simultaneously knock-in a selection
marker like an antibiotic resistance gene or a florescent protein. This would allow for the
selection of positive clones where the template was inserted into the genome in frame. As
described in Chapter 5.7, Figure 5.8, I outlined a design of a knock-in construct that would
enable the selection of positive clones using puromycin treatment. By applying this approach,
we could generate tagged proteins in an efficient, cost-effective and timely manner while
overcoming the need of laborious screening processes. The work I have presented here,
underlines the challenges we are still facing when trying to harness the ability of the
CRISPR/Cas9 technology to precisely insert foreign sequences into the genomes of cell lines. I
demonstrated that even when a knock-in occurs, deficiencies in the HDR machinery can lead
to a high error rate in the homologous repair of DNA. I believe that by implementing the
proposed strategies of choosing a cell line that is equipped with efficient HDR mechanisms and
the co-insertion of a resistance marker, tagged proteins could be successfully generated in a
timely and cost-effective fashion.

188
References
Agod, Z., Pazmandi, K., et al. (2018). Signaling Lymphocyte Activation Molecule Family 5
Enhances Autophagy and Fine-Tunes Cytokine Response in Monocyte-Derived
Dendritic Cells via Stabilization of Interferon Regulatory Factor 8. Front Immunol, 9,
62. doi:10.3389/fimmu.2018.00062
Aira, L. E., Villa, E., et al. (2018). The oncogenic tyrosine kinase Lyn impairs the pro-apoptotic
function of Bim. Oncogene, 37(16), 2122-2136. doi:10.1038/s41388-017-0112-0
Aird, E. J., Lovendahl, K. N., et al. (2018). Increasing Cas9-mediated homology-directed repair
efficiency through covalent tethering of DNA repair template. Communications Biology, 1(1), 54. doi:10.1038/s42003-018-0054-2
Alharbi, R. A., Pettengell, R., et al. (2013). The role of HOX genes in normal hematopoiesis
and acute leukemia. Leukemia, 27(5), 1000-1008. doi:10.1038/leu.2012.356
Altin, J. G., & Sloan, E. K. (1997). The role of CD45 and CD45-associated molecules in T cell
activation. Immunol Cell Biol, 75(5), 430-445. doi:10.1038/icb.1997.68
Amir, M., Somakala, K., et al. (2013). p38 MAP kinase inhibitors as anti inflammatory agents.
Mini Rev Med Chem, 13(14), 2082-2096. doi:10.2174/13895575113136660098
Apostolaki, M., Armaka, M., et al. (2010). Cellular mechanisms of TNF function in models of
inflammation and autoimmunity. Curr Dir Autoimmun, 11, 1-26.
doi:10.1159/000289195
Ayoub, E., Wilson, M. P., et al. (2018). EVI1 overexpression reprograms hematopoiesis via
upregulation of Spi1 transcription. Nature Communications, 9(1), 4239.
doi:10.1038/s41467-018-06208-y
Bai, L., Smith, D. C., et al. (2014). Small-molecule SMAC mimetics as new cancer therapeutics.
Pharmacol Ther, 144(1), 82-95. doi:10.1016/j.pharmthera.2014.05.007
Balgobind, B. V., Raimondi, S. C., et al. (2009). Novel prognostic subgroups in childhood
11q23/MLL-rearranged acute myeloid leukemia: results of an international
retrospective study. Blood, 114(12), 2489-2496. doi:10.1182/blood-2009-04-215152
Barjesteh van Waalwijk van Doorn-Khosrovani, S., Erpelinck, C., et al. (2003). High EVI1
expression predicts poor survival in acute myeloid leukemia: a study of 319 de novo
AML patients. Blood, 101(3), 837-845. doi:10.1182/blood-2002-05-1459
Basilico, S., & Göttgens, B. (2017). Dysregulation of haematopoietic stem cell regulatory
programs in acute myeloid leukaemia. Journal of molecular medicine (Berlin,
Germany), 95(7), 719-727. doi:10.1007/s00109-017-1535-3
Bertrand, M. J., Milutinovic, S., et al. (2008). cIAP1 and cIAP2 facilitate cancer cell survival by
functioning as E3 ligases that promote RIP1 ubiquitination. Mol Cell, 30(6), 689-700.
doi:10.1016/j.molcel.2008.05.014
Bindels, E. M., Havermans, M., et al. (2012). EVI1 is critical for the pathogenesis of a subset of
MLL-AF9-rearranged AMLs. Blood, 119(24), 5838-5849. doi:10.1182/blood-2011-11-
393827
Binsky-Ehrenreich, I., Marom, A., et al. (2014). CD84 is a survival receptor for CLL cells.
Oncogene, 33(8), 1006-1016. doi:10.1038/onc.2013.31
Brooks, D. J., Woodward, S., et al. (1996). Expression of the zinc finger gene EVI-1 in ovarian
and other cancers. Br J Cancer, 74(10), 1518-1525. doi:10.1038/bjc.1996.583
189
Brumatti, G., Ma, C., et al. (2016). The caspase-8 inhibitor emricasan combines with the SMAC
mimetic birinapant to induce necroptosis and treat acute myeloid leukemia. Sci Transl Med, 8(339), 339ra369. doi:10.1126/scitranslmed.aad3099
Cagnol, S., & Chambard, J.-C. (2010). ERK and cell death: Mechanisms of ERK-induced cell
death – apoptosis, autophagy and senescence. The FEBS Journal, 277(1), 2-21.
doi:10.1111/j.1742-4658.2009.07366.x
Cai, B., Chang, S. H., et al. (2006). p38 MAP kinase mediates apoptosis through
phosphorylation of BimEL at Ser-65. J Biol Chem, 281(35), 25215-25222.
doi:10.1074/jbc.M512627200
Cen, B., Xiong, Y., et al. (2014). The Pim-1 protein kinase is an important regulator of MET
receptor tyrosine kinase levels and signaling. Molecular and cellular biology, 34(13),
2517-2532. doi:10.1128/MCB.00147-14
Chai, J., Du, C., et al. (2000). Structural and biochemical basis of apoptotic activation by
Smac/DIABLO. Nature, 406(6798), 855-862. doi:10.1038/35022514
Chang, M., Hamilton, J. A., et al. (2009). Phosphatidylinostitol-3 kinase and phospholipase C
enhance CSF-1-dependent macrophage survival by controlling glucose uptake. Cell
Signal, 21(9), 1361-1369. doi:10.1016/j.cellsig.2009.04.003
Chen, K., Yang, J., et al. (2016). eIF4B is a convergent target and critical effector of oncogenic
Pim and PI3K/Akt/mTOR signaling pathways in Abl transformants. Oncotarget, 7(9),
10073-10089. doi:10.18632/oncotarget.7164
Chen, Y. L., Law, P. Y., et al. (2005). Inhibition of PI3K/Akt signaling: an emerging paradigm
for targeted cancer therapy. Curr Med Chem Anticancer Agents, 5(6), 575-589.
doi:10.2174/156801105774574649
Cheung, P. C., Campbell, D. G., et al. (2003). Feedback control of the protein kinase TAK1 by
SAPK2a/p38alpha. Embo j, 22(21), 5793-5805. doi:10.1093/emboj/cdg552
Chromik, J., Safferthal, C., et al. (2014). Smac mimetic primes apoptosis-resistant acute myeloid
leukaemia cells for cytarabine-induced cell death by triggering necroptosis. Cancer Lett,
344(1), 101-109. doi:10.1016/j.canlet.2013.10.018
Cohen, S., Shoshana, O.-y., et al. (2012). The Cytokine Midkine and Its Receptor RPTPζ Regulate B Cell Survival in a Pathway Induced by CD74. The Journal of Immunology,
188(1), 259. doi:10.4049/jimmunol.1101468
Cuenca, M., Sintes, J., et al. (2019). CD84 cell surface signaling molecule: An emerging
biomarker and target for cancer and autoimmune disorders. Clin Immunol, 204, 43-49.
doi:10.1016/j.clim.2018.10.017
Cui, J., Stahl, E. A., et al. (2013). Genome-wide association study and gene expression analysis
identifies CD84 as a predictor of response to etanercept therapy in rheumatoid arthritis.
PLoS Genet, 9(3), e1003394. doi:10.1371/journal.pgen.1003394
D’Oro, U., & Ashwell, J. D. (1999). Cutting Edge: The CD45 Tyrosine Phosphatase Is an
Inhibitor of Lck Activity in Thymocytes. The Journal of Immunology, 162(4), 1879-
1883. doi:doi: 10.4049/jimmunol.178.4.2056
Dan, H. C., Ebbs, A., et al. (2014). Akt-dependent activation of mTORC1 complex involves
phosphorylation of mTOR (mammalian target of rapamycin) by IkappaB kinase alpha
(IKKalpha). J Biol Chem, 289(36), 25227-25240. doi:10.1074/jbc.M114.554881
Darding, M., Feltham, R., et al. (2011). Molecular determinants of Smac mimetic induced
degradation of cIAP1 and cIAP2. Cell Death Differ, 18(8), 1376-1386.
doi:10.1038/cdd.2011.10
190
Das, M., Sabio, G., et al. (2009). Induction of hepatitis by JNK-mediated expression of TNF-
alpha. Cell, 136(2), 249-260. doi:10.1016/j.cell.2008.11.017
Datta, S. R., Brunet, A., et al. (1999). Cellular survival: a play in three Akts. Genes Dev, 13(22),
2905-2927. doi:10.1101/gad.13.22.2905
De Kouchkovsky, I., & Abdul-Hay, M. (2016). 'Acute myeloid leukemia: a comprehensive
review and 2016 update'. Blood cancer journal, 6(7), e441-e441.
doi:10.1038/bcj.2016.50
Deleault, K. M., Skinner, S. J., et al. (2008). Tristetraprolin regulates TNF TNF-alpha mRNA
stability via a proteasome dependent mechanism involving the combined action of the
ERK and p38 pathways. Mol Immunol, 45(1), 13-24.
doi:10.1016/j.molimm.2007.05.017
Deveraux, Q. L., Takahashi, R., et al. (1997). X-linked IAP is a direct inhibitor of cell-death
proteases. Nature, 388(6639), 300-304. doi:10.1038/40901
Dohner, K., & Dohner, H. (2008). Molecular characterization of acute myeloid leukemia.
Haematologica, 93(7), 976-982. doi:10.3324/haematol.13345
Dondelinger, Y., Delanghe, T., et al. (2017). MK2 phosphorylation of RIPK1 regulates TNF-
mediated cell death. Nat Cell Biol, 19(10), 1237-1247. doi:10.1038/ncb3608
Doudna, J. A., & Charpentier, E. (2014). The new frontier of genome engineering with
CRISPR-Cas9. Science, 346(6213), 1258096. doi:10.1126/science.1258096
Doyle, A., McGarry, M. P., et al. (2012). The construction of transgenic and gene
knockout/knockin mouse models of human disease. Transgenic research, 21(2), 327-
349. doi:10.1007/s11248-011-9537-3
Duraisamy, S., Bajpai, M., et al. (2008). MK2: a novel molecular target for anti-inflammatory
therapy. Expert Opinion on Therapeutic Targets, 12(8), 921-936.
doi:10.1517/14728222.12.8.921
Eckelman, B. P., & Salvesen, G. S. (2006). The human anti-apoptotic proteins cIAP1 and
cIAP2 bind but do not inhibit caspases. J Biol Chem, 281(6), 3254-3260.
doi:10.1074/jbc.M510863200
Estey, E. (2015). Why Is Progress in Acute Myeloid Leukemia So Slow? Semin Hematol, 52(3),
243-248. doi:10.1053/j.seminhematol.2015.03.007
Estey, E., & Dohner, H. (2006). Acute myeloid leukaemia. Lancet, 368(9550), 1894-1907.
doi:10.1016/s0140-6736(06)69780-8
Etemadi, N., Chopin, M., et al. (2015). TRAF2 regulates TNF and NF-κB signalling to suppress
apoptosis and skin inflammation independently of Sphingosine kinase 1. eLife, 4,
e10592. doi:10.7554/eLife.10592
Feng, S., Yang, Y., et al. (2007). Cleavage of RIP3 inactivates its caspase-independent apoptosis
pathway by removal of kinase domain. Cell Signal, 19(10), 2056-2067.
doi:10.1016/j.cellsig.2007.05.016
Feoktistova, M., Geserick, P., et al. (2011). cIAPs Block Ripoptosome Formation, a
RIP1/Caspase-8 Containing Intracellular Cell Death Complex Differentially Regulated
by cFLIP Isoforms. Molecular Cell, 43(3), 449-463. doi:10.1016/j.molcel.2011.06.011
Feoktistova, M., Geserick, P., et al. (2012). Pick your poison: the Ripoptosome, a cell death
platform regulating apoptosis and necroptosis. Cell Cycle, 11(3), 460-467.
doi:10.4161/cc.11.3.19060
Foey, A. D., Parry, S. L., et al. (1998). Regulation of Monocyte IL-10 Synthesis by Endogenous
IL-1 and TNF-α: Role of the p38 and p42/44 Mitogen-Activated Protein Kinases. The
Journal of Immunology, 160(2), 920.
191
Fulda, S. (2015). Promises and Challenges of Smac Mimetics as Cancer Therapeutics. Clin
Cancer Res, 21(22), 5030-5036. doi:10.1158/1078-0432.Ccr-15-0365
Fulda, S., & Debatin, K. M. (2006). Targeting inhibitor of apoptosis proteins (IAPs) for
diagnosis and treatment of human diseases. Recent Pat Anticancer Drug Discov, 1(1),
81-89.
Fulda, S., & Vucic, D. (2012). Targeting IAP proteins for therapeutic intervention in cancer.
Nat Rev Drug Discov, 11(2), 109-124. doi:10.1038/nrd3627
Gaestel, M., Kotlyarov, A., et al. (2009). Targeting innate immunity protein kinase signalling in
inflammation. Nat Rev Drug Discov, 8(6), 480-499. doi:10.1038/nrd2829
Geng, L., Raab, M., et al. (1999). Cutting edge: SLP-76 cooperativity with FYB/FYN-T in the
Up-regulation of TCR-driven IL-2 transcription requires SLP-76 binding to FYB at
Tyr595 and Tyr651. J Immunol, 163(11), 5753-5757.
Genovese, M. C. (2009). Inhibition of p38: Has the fat lady sung? Arthritis & Rheumatism,
60(2), 317-320. doi:10.1002/art.24264
Gerace, E., & Moazed, D. (2015). Affinity Pull-Down of Proteins Using Anti-FLAG M2
Agarose Beads. Methods in enzymology, 559, 99-110. doi:10.1016/bs.mie.2014.11.010
Glass, C., Wilson, M., et al. (2014). The role of EVI1 in myeloid malignancies. Blood Cells,
Molecules, and Diseases, 53(1), 67-76. doi:10.1016/j.bcmd.2014.01.002
Glass, C., Wuertzer, C., et al. (2013). Global Identification of EVI1 Target Genes in Acute
Myeloid Leukemia. PloS one, 8(6), e67134-e67134. doi:10.1371/journal.pone.0067134
Gomez-Benito, M., Conchillo, A., et al. (2010). EVI1 controls proliferation in acute myeloid
leukaemia through modulation of miR-1-2. Br J Cancer, 103(8), 1292-1296.
doi:10.1038/sj.bjc.6605874
Gonzalez-Teran, B., Cortes, J. R., et al. (2013). Eukaryotic elongation factor 2 controls TNF-
alpha translation in LPS-induced hepatitis. J Clin Invest, 123(1), 164-178.
doi:10.1172/jci65124
Goyama, S., Yamamoto, G., et al. (2008). Evi-1 is a critical regulator for hematopoietic stem
cells and transformed leukemic cells. Cell Stem Cell, 3(2), 207-220.
doi:10.1016/j.stem.2008.06.002
Grimwade, D., & Hills, R. K. (2009). Independent prognostic factors for AML outcome.
Hematology Am Soc Hematol Educ Program, 385-395. doi:10.1182/asheducation-
2009.1.385
Grimwade, D., Ivey, A., et al. (2016). Molecular landscape of acute myeloid leukemia in
younger adults and its clinical relevance. Blood, 127(1), 29-41. doi:10.1182/blood-2015-
07-604496
Groschel, S., Schlenk, R. F., et al. (2013). Deregulated expression of EVI1 defines a poor
prognostic subset of MLL-rearranged acute myeloid leukemias: a study of the German-
Austrian Acute Myeloid Leukemia Study Group and the Dutch-Belgian-Swiss
HOVON/SAKK Cooperative Group. J Clin Oncol, 31(1), 95-103.
doi:10.1200/jco.2011.41.5505
Grossmann, V., Schnittger, S., et al. (2013). High incidence of RAS signalling pathway mutations
in MLL-rearranged acute myeloid leukemia. Leukemia, 27(9), 1933-1936.
doi:10.1038/leu.2013.90
Gyrd-Hansen, M., Darding, M., et al. (2008). IAPs contain an evolutionarily conserved
ubiquitin-binding domain that regulates NF-kappaB as well as cell survival and
oncogenesis. Nat Cell Biol, 10(11), 1309-1317. doi:10.1038/ncb1789
192
Hamilton, J. A. (2008). Colony-stimulating factors in inflammation and autoimmunity. Nat Rev
Immunol, 8(7), 533-544. doi:10.1038/nri2356
Han, M. S., Jung, D. Y., et al. (2013). JNK expression by macrophages promotes obesity-
induced insulin resistance and inflammation. Science (New York, N.Y.), 339(6116),
218-222. doi:10.1126/science.1227568
Hatano, A., Matsumoto, M., et al. (2016). Phosphoproteomics analyses show subnetwork
systems in T-cell receptor signaling. Genes to Cells, 21(10), 1095-1112.
doi:10.1111/gtc.12406
Hennessy, B. T., Smith, D. L., et al. (2005). Exploiting the PI3K/AKT pathway for cancer drug
discovery. Nat Rev Drug Discov, 4(12), 988-1004. doi:10.1038/nrd1902
Hermiston, M. L., Xu, Z., et al. (2003). CD45: a critical regulator of signaling thresholds in
immune cells. Annu Rev Immunol, 21, 107-137.
doi:10.1146/annurev.immunol.21.120601.140946
Hille, F., Richter, H., et al. (2018). The Biology of CRISPR-Cas: Backward and Forward. Cell, 172(6), 1239-1259. doi:10.1016/j.cell.2017.11.032
Hinds, M. G., Norton, R. S., et al. (1999). Solution structure of a baculoviral inhibitor of
apoptosis (IAP) repeat. Nat Struct Biol, 6(7), 648-651. doi:10.1038/10701
Holz, M. K., Ballif, B. A., et al. (2005). mTOR and S6K1 Mediate Assembly of the Translation
Preinitiation Complex through Dynamic Protein Interchange and Ordered
Phosphorylation Events. Cell, 123(4), 569-580. doi:10.1016/j.cell.2005.10.024
Hopp, T. P., Prickett, K. S., et al. (1988). A Short Polypeptide Marker Sequence Useful for
Recombinant Protein Identification and Purification. Bio/Technology, 6(10), 1204-
1210. doi:10.1038/nbt1088-1204
Hsu, L. S., Chen, G. D., et al. (2001). Human Ca2+/calmodulin-dependent protein kinase
kinase beta gene encodes multiple isoforms that display distinct kinase activity. J Biol
Chem, 276(33), 31113-31123. doi:10.1074/jbc.M011720200
Hsu, Patrick D., Lander, Eric S., et al. (2014). Development and Applications of CRISPR-Cas9
for Genome Engineering. Cell, 157(6), 1262-1278. doi:10.1016/j.cell.2014.05.010
Hübner, A., Barrett, T., et al. (2008). Multisite phosphorylation regulates Bim stability and
apoptotic activity. Molecular Cell, 30(4), 415-425. doi:10.1016/j.molcel.2008.03.025
Humphrey, S. J., Karayel, O., et al. (2018). High-throughput and high-sensitivity
phosphoproteomics with the EasyPhos platform. Nat Protoc, 13(9), 1897-1916.
doi:10.1038/s41596-018-0014-9
Humphrey, S. J., Yang, G., et al. (2013). Dynamic adipocyte phosphoproteome reveals that Akt
directly regulates mTORC2. Cell Metab, 17(6), 1009-1020.
doi:10.1016/j.cmet.2013.04.010
Huntington, N. D., Xu, Y., et al. (2005). A requirement for CD45 distinguishes Ly49D-
mediated cytokine and chemokine production from killing in primary natural killer
cells. The Journal of experimental medicine, 201(9), 1421-1433.
doi:10.1084/jem.20042294
Hutchinson, J. A., Shanware, N. P., et al. (2011). Regulation of ribosomal protein S6
phosphorylation by casein kinase 1 and protein phosphatase 1. The Journal of biological chemistry, 286(10), 8688-8696. doi:10.1074/jbc.M110.141754
Inoue, J., Ishida, T., et al. (2000). Tumor necrosis factor receptor-associated factor (TRAF)
family: adapter proteins that mediate cytokine signaling. Exp Cell Res, 254(1), 14-24.
doi:10.1006/excr.1999.4733
193
Izmiryan, A., Basmaciogullari, S., et al. (2011). Efficient gene targeting mediated by a lentiviral
vector-associated meganuclease. Nucleic Acids Res, 39(17), 7610-7619.
doi:10.1093/nar/gkr524
Jaco, I., Annibaldi, A., et al. (2017). MK2 Phosphorylates RIPK1 to Prevent TNF-Induced Cell
Death. Mol Cell, 66(5), 698-710.e695. doi:10.1016/j.molcel.2017.05.003
Jeffrey, I. W., Bushell, M., et al. (2002). Inhibition of protein synthesis in apoptosis: differential
requirements by the tumor necrosis factor alpha family and a DNA-damaging agent for
caspases and the double-stranded RNA-dependent protein kinase. Cancer Res, 62(8),
2272-2280.
Jin, G., Yamazaki, Y., et al. (2007). Trib1 and Evi1 cooperate with Hoxa and Meis1 in myeloid
leukemogenesis. Blood, 109(9), 3998-4005. doi:10.1182/blood-2006-08-041202
Katagiri, T., Ogimoto, M., et al. (1999). CD45 Negatively Regulates Lyn Activity by
Dephosphorylating Both Positive and Negative Regulatory Tyrosine Residues in
Immature B Cells. The Journal of Immunology, 163(3), 1321-1326.
Kataoka, K., Sato, T., et al. (2011). Evi1 is essential for hematopoietic stem cell self-renewal,
and its expression marks hematopoietic cells with long-term multilineage repopulating
activity. J Exp Med, 208(12), 2403-2416. doi:10.1084/jem.20110447
Kelley, T. W., Graham, M. M., et al. (1999). Macrophage colony-stimulating factor promotes
cell survival through Akt/protein kinase B. J Biol Chem, 274(37), 26393-26398.
doi:10.1074/jbc.274.37.26393
Kelly, L. M., & Gilliland, D. G. (2002). GENETICS OF MYELOID LEUKEMIAS. Annual
Review of Genomics and Human Genetics, 3(1), 179-198.
doi:10.1146/annurev.genom.3.032802.115046
Keshwani, M. M., von Daake, S., et al. (2011). Hydrophobic motif phosphorylation is not
required for activation loop phosphorylation of p70 ribosomal protein S6 kinase 1
(S6K1). J Biol Chem, 286(26), 23552-23558. doi:10.1074/jbc.M111.258004
Kiani, A., Rao, A., et al. (2000). Manipulating immune responses with immunosuppressive
agents that target NFAT. Immunity, 12(4), 359-372. doi:10.1016/s1074-7613(00)80188-
0
Kim, H., Tu, H.-C., et al. (2009). Stepwise Activation of BAX and BAK by tBID, BIM, and
PUMA Initiates Mitochondrial Apoptosis. Molecular Cell, 36(3), 487-499.
doi:10.1016/j.molcel.2009.09.030
Kim, J.-T., Lee, S.-J., et al. (2013). Caspase-mediated cleavage and DNase activity of the
translation initiation factor 3, subunit G (eIF3g). FEBS Letters, 587(22), 3668-3674.
doi:10.1016/j.febslet.2013.09.027
Kim, S. J., Wagner, S., et al. (1992). Retinoblastoma gene product activates expression of the
human TGF-beta 2 gene through transcription factor ATF-2. Nature, 358(6384), 331-
334. doi:10.1038/358331a0
Kim, W. I., Matise, I., et al. (2009). RAS oncogene suppression induces apoptosis followed by
more differentiated and less myelosuppressive disease upon relapse of acute myeloid
leukemia. Blood, 113(5), 1086-1096. doi:10.1182/blood-2008-01-132316
Koch, B., Nijmeijer, B., et al. (2018). Generation and validation of homozygous fluorescent
knock-in cells using CRISPR-Cas9 genome editing. Nat Protoc, 13(6), 1465-1487.
doi:10.1038/nprot.2018.042
Krause, M., Sechi, A. S., et al. (2000). Fyn-binding protein (Fyb)/SLP-76-associated protein
(SLAP), Ena/vasodilator-stimulated phosphoprotein (VASP) proteins and the Arp2/3
194
complex link T cell receptor (TCR) signaling to the actin cytoskeleton. J Cell Biol,
149(1), 181-194. doi:10.1083/jcb.149.1.181
Kurokawa, M., Mitani, K., et al. (1998). The oncoprotein Evi-1 represses TGF-beta signalling
by inhibiting Smad3. Nature, 394(6688), 92-96. doi:10.1038/27945
Lalaoui, N., Hänggi, K., et al. (2016). Targeting p38 or MK2 Enhances the Anti-Leukemic
Activity of Smac-Mimetics. Cancer Cell, 29(2), 145-158. doi:10.1016/j.ccell.2016.01.006 Lalaoui, N. and Brumatti, G. (2017). Relevance of necroptosis in cancer. Immunology and cell biology,
95 (2), 137-145. doi: 10.1038/icb.2016.120
Lambrechts, A., Kwiatkowski, A. V., et al. (2000). cAMP-dependent protein kinase
phosphorylation of EVL, a Mena/VASP relative, regulates its interaction with actin and
SH3 domains. J Biol Chem, 275(46), 36143-36151. doi:10.1074/jbc.M006274200
Ley, R., Ewings, K. E., et al. (2005). Regulatory phosphorylation of Bim: sorting out the ERK
from the JNK. Cell Death Differ, 12(8), 1008-1014. doi:10.1038/sj.cdd.4401688
Ley, R., Ewings, K. E., et al. (2004). Extracellular Signal-regulated Kinases 1/2 Are Serum-
stimulated “BimEL Kinases” That Bind to the BH3-only Protein BimEL Causing Its
Phosphorylation and Turnover. Journal of Biological Chemistry, 279(10), 8837-8847.
doi:10.1074/jbc.M311578200
Li, L., Jiao, X., et al. (2018). Mutation in the intracellular chloride channel CLCC1 associated
with autosomal recessive retinitis pigmentosa. PLoS Genet, 14(8), e1007504.
doi:10.1371/journal.pgen.1007504
Li, L., Thomas, R. M., et al. (2004). A small molecule Smac mimic potentiates TRAIL- and
TNFalpha-mediated cell death. Science, 305(5689), 1471-1474.
doi:10.1126/science.1098231
Lin, S., Staahl, B. T., et al. (2014). Enhanced homology-directed human genome engineering
by controlled timing of CRISPR/Cas9 delivery. eLife, 3, e04766.
doi:10.7554/eLife.04766
Lino, C. A., Harper, J. C., et al. (2018). Delivering CRISPR: a review of the challenges and
approaches. Drug Deliv, 25(1), 1234-1257. doi:10.1080/10717544.2018.1474964
Liu, H., Cheng, E. H., et al. (2009). MLL fusions: pathways to leukemia. Cancer Biol Ther, 8(13), 1204-1211. doi:10.4161/cbt.8.13.8924
Liu, M., Rehman, S., et al. (2019). Methodologies for Improving HDR Efficiency. Frontiers in
genetics, 9, 691-691. doi:10.3389/fgene.2018.00691
Liu, Y., Chen, L., et al. (2006). Evi1 is a survival factor which conveys resistance to both TGFβ-
and taxol-mediated cell death via PI3K/AKT. Oncogene, 25(25), 3565-3575.
doi:10.1038/sj.onc.1209403
Livingstone, C., Patel, G., et al. (1995). ATF-2 contains a phosphorylation-dependent
transcriptional activation domain. Embo j, 14(8), 1785-1797.
Lombardo, A., Cesana, D., et al. (2011). Site-specific integration and tailoring of cassette design
for sustainable gene transfer. Nat Methods, 8(10), 861-869. doi:10.1038/nmeth.1674
Lu, T., Zhu, Z., et al. (2019). DRAM1 regulates autophagy and cell proliferation via inhibition
of the phosphoinositide 3-kinase-Akt-mTOR-ribosomal protein S6 pathway. Cell
communication and signaling : CCS, 17(1), 28-28. doi:10.1186/s12964-019-0341-7
Lugthart, S., Groschel, S., et al. (2010). Clinical, molecular, and prognostic significance of
WHO type inv(3)(q21q26.2)/t(3;3)(q21;q26.2) and various other 3q abnormalities in
acute myeloid leukemia. J Clin Oncol, 28(24), 3890-3898.
doi:10.1200/jco.2010.29.2771

195
Lugthart, S., van Drunen, E., et al. (2008). High EVI1 levels predict adverse outcome in acute
myeloid leukemia: prevalence of EVI1 overexpression and chromosome 3q26
abnormalities underestimated. Blood, 111(8), 4329-4337. doi:10.1182/blood-2007-10-
119230
Macian, F., Lopez-Rodriguez, C., et al. (2001). Partners in transcription: NFAT and AP-1.
Oncogene, 20(19), 2476-2489. doi:10.1038/sj.onc.1204386
Madesh, M., Antonsson, B., et al. (2002). Rapid kinetics of tBid-induced cytochrome c and
Smac/DIABLO release and mitochondrial depolarization. J Biol Chem, 277(7), 5651-
5659. doi:10.1074/jbc.M108171200
Maekawa, T., Sakura, H., et al. (1989). Leucine zipper structure of the protein CRE-BP1
binding to the cyclic AMP response element in brain. The EMBO Journal, 8(7), 2023-
2028. doi:10.1002/j.1460-2075.1989.tb03610.x
Mahtani, K. R., Brook, M., et al. (2001). Mitogen-activated protein kinase p38 controls the
expression and posttranslational modification of tristetraprolin, a regulator of tumor
necrosis factor alpha mRNA stability. Mol Cell Biol, 21(19), 6461-6469.
doi:10.1128/mcb.21.9.6461-6469.2001
McDermott, M. F., Aksentijevich, I., et al. (1999). Germline mutations in the extracellular
domains of the 55 kDa TNF receptor, TNFR1, define a family of dominantly inherited
autoinflammatory syndromes. Cell, 97(1), 133-144. doi:10.1016/s0092-8674(00)80721-
7
Meacham, C. E., & Morrison, S. J. (2013). Tumour heterogeneity and cancer cell plasticity.
Nature, 501(7467), 328-337. doi:10.1038/nature12624
Menon, M. B., Gropengiesser, J., et al. (2017). p38(MAPK)/MK2-dependent phosphorylation
controls cytotoxic RIPK1 signalling in inflammation and infection. Nat Cell Biol, 19(10),
1248-1259. doi:10.1038/ncb3614
Meyer, C., Hofmann, J., et al. (2013). The MLL recombinome of acute leukemias in 2013.
Leukemia, 27(11), 2165-2176. doi:10.1038/leu.2013.135
Meylan, E., Burns, K., et al. (2004). RIP1 is an essential mediator of Toll-like receptor 3-
induced NF-kappa B activation. Nat Immunol, 5(5), 503-507. doi:10.1038/ni1061
Meyuhas, O. (2008). Chapter 1 Physiological Roles of Ribosomal Protein S6: One of Its Kind.
In International Review of Cell and Molecular Biology (Vol. 268, pp. 1-37): Academic
Press.
Micheau, O., Lens, S., et al. (2001). NF-kappaB signals induce the expression of c-FLIP.
Molecular and cellular biology, 21(16), 5299-5305. doi:10.1128/MCB.21.16.5299-
5305.2001
Micheau, O., & Tschopp, J. (2003). Induction of TNF receptor I-mediated apoptosis via two
sequential signaling complexes. Cell, 114(2), 181-190. doi:10.1016/s0092-
8674(03)00521-x
Minard, A. Y., Tan, S. X., et al. (2016). mTORC1 Is a Major Regulatory Node in the FGF21
Signaling Network in Adipocytes. Cell Rep, 17(1), 29-36.
doi:10.1016/j.celrep.2016.08.086
Morishita, K., Parker, D. S., et al. (1988). Retroviral activation of a novel gene encoding a zinc
finger protein in IL-3-dependent myeloid leukemia cell lines. Cell, 54(6), 831-840.
doi:10.1016/s0092-8674(88)91175-0
Moriya, H. (2015). Quantitative nature of overexpression experiments. Molecular biology of
the cell, 26(22), 3932-3939. doi:10.1091/mbc.E15-07-0512
196
Murphy, J. M., & Silke, J. (2014). Ars Moriendi; the art of dying well – new insights into the
molecular pathways of necroptotic cell death. EMBO reports, 15(2), 155-164.
doi:10.1002/embr.201337970
Murray, J. T., Craggs, G., et al. (2000). Mechanism of phosphatidylinositol 3-kinase-dependent
increases in BAC1.2F5 macrophage-like cell density in response to M-CSF:
phosphatidylinositol 3-kinase inhibitors increase the rate of apoptosis rather than inhibit
DNA synthesis. Inflamm Res, 49(11), 610-618. doi:10.1007/s000110050638
Mustelin, T., Pessa-Morikawa, T., et al. (1992). Regulation of the p59fyn protein tyrosine kinase
by the CD45 phosphotyrosine phosphatase. Eur J Immunol, 22(5), 1173-1178.
doi:10.1002/eji.1830220510
Nachmias, B., Ashhab, Y., et al. (2004). The inhibitor of apoptosis protein family (IAPs): an
emerging therapeutic target in cancer. Semin Cancer Biol, 14(4), 231-243.
doi:10.1016/j.semcancer.2004.04.002
Nakamichi, Y., Udagawa, N., et al. (2013). IL-34 and CSF-1: similarities and differences. J Bone Miner Metab, 31(5), 486-495. doi:10.1007/s00774-013-0476-3
Nambiar, T. S., Billon, P., et al. (2019). Stimulation of CRISPR-mediated homology-directed
repair by an engineered RAD18 variant. Nature Communications, 10(1), 3395.
doi:10.1038/s41467-019-11105-z
Nanda, N., Andre, P., et al. (2005). Platelet aggregation induces platelet aggregate stability via
SLAM family receptor signaling. Blood, 106(9), 3028-3034. doi:10.1182/blood-2005-
01-0333
Nascimento, E. B. M., Snel, M., et al. (2010). Phosphorylation of PRAS40 on Thr246 by
PKB/AKT facilitates efficient phosphorylation of Ser183 by mTORC1. Cellular
Signalling, 22(6), 961-967. doi:10.1016/j.cellsig.2010.02.002
Nygard, O., & Nilsson, L. (1990). Translational dynamics. Interactions between the translational
factors, tRNA and ribosomes during eukaryotic protein synthesis. Eur J Biochem, 191(1), 1-17. doi:10.1111/j.1432-1033.1990.tb19087
O'Reilly, L. A., Kruse, E. A., et al. (2009). MEK/ERK-mediated phosphorylation of Bim is
required to ensure survival of T and B lymphocytes during mitogenic stimulation.
Journal of immunology (Baltimore, Md. : 1950), 183(1), 261-269.
doi:10.4049/jimmunol.0803853
Ohtsuka, M., Arase, H., et al. (2004). NFAM1, an immunoreceptor tyrosine-based activation
motif-bearing molecule that regulates B cell development and signaling. Proceedings of
the National Academy of Sciences of the United States of America, 101(21), 8126-8131.
doi:10.1073/pnas.0401119101
Ouwens, D. M., de Ruiter, N. D., et al. (2002). Growth factors can activate ATF2 via a two-step
mechanism: phosphorylation of Thr71 through the Ras-MEK-ERK pathway and of
Thr69 through RalGDS-Src-p38. Embo j, 21(14), 3782-3793.
doi:10.1093/emboj/cdf361
Owens, T. W., Gilmore, A. P., et al. (2013). Inhibitor of Apoptosis Proteins: Promising Targets
for Cancer Therapy. Journal of carcinogenesis & mutagenesis, Suppl 14, S14-004.
doi:10.4172/2157-2518.S14-004
Pende, M., Um, S. H., et al. (2004). S6K1(-/-)/S6K2(-/-) mice exhibit perinatal lethality and
rapamycin-sensitive 5'-terminal oligopyrimidine mRNA translation and reveal a
mitogen-activated protein kinase-dependent S6 kinase pathway. Molecular and cellular
biology, 24(8), 3112-3124. doi:10.1128/mcb.24.8.3112-3124.2004
197
Pession, A., Martino, V., et al. (2003). MLL-AF9 oncogene expression affects cell growth but
not terminal differentiation and is downregulated during monocyte-macrophage
maturation in AML-M5 THP-1 cells. Oncogene, 22(54), 8671-8676.
doi:10.1038/sj.onc.1207125
Piao, X., Komazawa-Sakon, S., et al. (2012). c-FLIP maintains tissue homeostasis by preventing
apoptosis and programmed necrosis. Sci Signal, 5(255), ra93.
doi:10.1126/scisignal.2003558
Piercy, J., Petrova, S., et al. (2006). CD45 negatively regulates tumour necrosis factor and
interleukin-6 production in dendritic cells. Immunology, 118(2), 250-256.
doi:10.1111/j.1365-2567.2006.02363.x
Porta, C., Paglino, C., et al. (2014). Targeting PI3K/Akt/mTOR Signaling in Cancer. Frontiers
in Oncology, 4(64). doi:10.3389/fonc.2014.00064
Putcha, G. V., Le, S., et al. (2003). JNK-Mediated BIM Phosphorylation Potentiates BAX-
Dependent Apoptosis. Neuron, 38(6), 899-914. doi:10.1016/S0896-6273(03)00355-6
Putz, G., Rosner, A., et al. (2006). AML1 deletion in adult mice causes splenomegaly and
lymphomas. Oncogene, 25(6), 929-939. doi:10.1038/sj.onc.1209136
Qi, X. J., Wildey, G. M., et al. (2006). Evidence that Ser87 of BimEL is phosphorylated by Akt
and regulates BimEL apoptotic function. J Biol Chem, 281(2), 813-823.
doi:10.1074/jbc.M505546200
Ran, F. A., Hsu, P. D., et al. (2013). Genome engineering using the CRISPR-Cas9 system. Nat
Protoc, 8(11), 2281-2308. doi:10.1038/nprot.2013.143
Reed, J. C. (2003). Apoptosis-targeted therapies for cancer. Cancer Cell, 3(1), 17-22.
doi:10.1016/s1535-6108(02)00241-6
Reinhard, C., Shamoon, B., et al. (1997). Tumor necrosis factor alpha-induced activation of c-
jun N-terminal kinase is mediated by TRAF2. The EMBO Journal, 16(5), 1080-1092.
doi:10.1093/emboj/16.5.1080
Roux, P. P., Shahbazian, D., et al. (2007). RAS/ERK signaling promotes site-specific ribosomal
protein S6 phosphorylation via RSK and stimulates cap-dependent translation. J Biol
Chem, 282(19), 14056-14064. doi:10.1074/jbc.M700906200
Roy, N., Deveraux, Q. L., et al. (1997). The c-IAP-1 and c-IAP-2 proteins are direct inhibitors
of specific caspases. Embo j, 16(23), 6914-6925. doi:10.1093/emboj/16.23.6914
Roy, P., Mukherjee, T., et al. (2017). Non-canonical NFκB mutations reinforce pro-survival
TNF response in multiple myeloma through an autoregulatory RelB:p50 NFκB
pathway. Oncogene, 36(10), 1417-1429. doi:10.1038/onc.2016.309
Rutault, K., Hazzalin, C. A., et al. (2001). Combinations of ERK and p38 MAPK inhibitors
ablate tumor necrosis factor-alpha (TNF-alpha ) mRNA induction. Evidence for
selective destabilization of TNF-alpha transcripts. J Biol Chem, 276(9), 6666-6674.
doi:10.1074/jbc.M005486200
Ruvinsky, I., & Meyuhas, O. (2006). Ribosomal protein S6 phosphorylation: from protein
synthesis to cell size. Trends Biochem Sci, 31(6), 342-348.
doi:10.1016/j.tibs.2006.04.003
Salvesen, G. S., & Walsh, C. M. (2014). Functions of caspase 8: the identified and the
mysterious. Seminars in immunology, 26(3), 246-252. doi:10.1016/j.smim.2014.03.005
Sambandam, Y., Sundaram, K., et al. (2017). NFAM1 signaling enhances osteoclast formation
and bone resorption activity in Paget's disease of bone. Bone, 101, 236-244.
doi:10.1016/j.bone.2017.05.013
198
Samuel, T., Welsh, K., et al. (2006). Distinct BIR domains of cIAP1 mediate binding to and
ubiquitination of tumor necrosis factor receptor-associated factor 2 and second
mitochondrial activator of caspases. J Biol Chem, 281(2), 1080-1090.
doi:10.1074/jbc.M509381200
Sander, J. D., & Joung, J. K. (2014). CRISPR-Cas systems for editing, regulating and targeting
genomes. Nature Biotechnology, 32(4), 347-355. doi:10.1038/nbt.2842
Sanjana, N. E., Shalem, O., et al. (2014). Improved vectors and genome-wide libraries for
CRISPR screening. Nat Methods, 11(8), 783-784. doi:10.1038/nmeth.3047
Sasmono, R. T., Oceandy, D., et al. (2003). A macrophage colony-stimulating factor receptor-
green fluorescent protein transgene is expressed throughout the mononuclear phagocyte
system of the mouse. Blood, 101(3), 1155-1163. doi:10.1182/blood-2002-02-0569
Satoh, J., & et al. (1989). Recombinant human tumor necrosis factor alpha suppresses
autoimmune diabetes in nonobese diabetic mice. J Clin Invest, 84(4), 1345-1348.
doi:10.1172/jci114304
Saygin, C., Matei, D., et al. (2019). Targeting Cancer Stemness in the Clinic: From Hype to
Hope. Cell Stem Cell, 24(1), 25-40. doi:10.1016/j.stem.2018.11.017
Sedger, L. M., & McDermott, M. F. (2014). TNF and TNF-receptors: From mediators of cell
death and inflammation to therapeutic giants - past, present and future. Cytokine Growth Factor Rev, 25(4), 453-472. doi:10.1016/j.cytogfr.2014.07.016
Senftleben, U., Cao, Y., et al. (2001). Activation by IKKalpha of a second, evolutionary
conserved, NF-kappa B signaling pathway. Science, 293(5534), 1495-1499.
doi:10.1126/science.1062677
Shahbazian, D., Parsyan, A., et al. (2010). eIF4B controls survival and proliferation and is
regulated by proto-oncogenic signaling pathways. Cell cycle (Georgetown, Tex.), 9(20),
4106-4109. doi:10.4161/cc.9.20.13630
Shahbazian, D., Roux, P. P., et al. (2006). The mTOR/PI3K and MAPK pathways converge
on eIF4B to control its phosphorylation and activity. The EMBO Journal, 25(12), 2781-
2791. doi:10.1038/sj.emboj.7601166
Shenoi, H., Seavitt, J., et al. (1999). Regulation of Integrin-Mediated T Cell Adhesion by the
Transmembrane Protein Tyrosine Phosphatase CD45. The Journal of Immunology, 162(12), 7120-7127.
Shima, Y., & Kitabayashi, I. (2011). Deregulated transcription factors in leukemia. Int J
Hematol, 94(2), 134-141. doi:10.1007/s12185-011-0905-9
Shimizu, M., Nomura, Y., et al. (1998). Activation of the rat cyclin A promoter by ATF2 and
Jun family members and its suppression by ATF4. Exp Cell Res, 239(1), 93-103.
doi:10.1006/excr.1997.3884
Shrivastava, P., Katagiri, T., et al. (2004). Dynamic regulation of Src-family kinases by CD45 in
B cells. Blood, 103(4), 1425-1432. doi:10.1182/blood-2003-03-0716
Siegemund, S., Rigaud, S., et al. (2015). IP3 3-kinase B controls hematopoietic stem cell
homeostasis and prevents lethal hematopoietic failure in mice. Blood, 125(18), 2786-
2797. doi:10.1182/blood-2014-06-583187
Siepen, J. A., Keevil, E.-J., et al. (2007). Prediction of missed cleavage sites in tryptic peptides
aids protein identification in proteomics. Journal of proteome research, 6(1), 399-408.
doi:10.1021/pr060507u
Silke, J., & Meier, P. (2013). Inhibitor of apoptosis (IAP) proteins-modulators of cell death and
inflammation. Cold Spring Harbor perspectives in biology, 5(2), a008730.
doi:10.1101/cshperspect.a008730

199
Silke, J., & Vucic, D. (2014). IAP family of cell death and signaling regulators. Methods
Enzymol, 545, 35-65. doi:10.1016/b978-0-12-801430-1.00002-0
Sintes, J., Romero, X., et al. (2010). Mouse CD84 is a pan-leukocyte cell-surface molecule that
modulates LPS-induced cytokine secretion by macrophages. J Leukoc Biol, 88(4), 687-
697. doi:10.1189/jlb.1109756
Somervaille, T. C. P., & Cleary, M. L. (2006). Identification and characterization of leukemia
stem cells in murine MLL-AF9 acute myeloid leukemia. Cancer Cell, 10(4), 257-268.
doi:10.1016/j.ccr.2006.08.020
Speck, N. A., & Gilliland, D. G. (2002). Core-binding factors in haematopoiesis and leukaemia.
Nat Rev Cancer, 2(7), 502-513. doi:10.1038/nrc840
Stanley, E. R., & Chitu, V. (2014). CSF-1 receptor signaling in myeloid cells. Cold Spring Harb
Perspect Biol, 6(6). doi:10.1101/cshperspect.a021857
Stavropoulou, V., Kaspar, S., et al. (2016). MLL-AF9 Expression in Hematopoietic Stem Cells
Drives a Highly Invasive AML Expressing EMT-Related Genes Linked to Poor
Outcome. Cancer Cell, 30(1), 43-58. doi:10.1016/j.ccell.2016.05.011
Sudo, T., Nishikawa, S., et al. (1995). Functional hierarchy of c-kit and c-fms in intramarrow
production of CFU-M. Oncogene, 11(12), 2469-2476.
Suela, J., Alvarez, S., et al. (2007). DNA profiling by arrayCGH in acute myeloid leukemia and
myelodysplastic syndromes. Cytogenet Genome Res, 118(2-4), 304-309.
doi:10.1159/000108314
Sun, C., Cai, M., et al. (2000). NMR structure and mutagenesis of the third Bir domain of the
inhibitor of apoptosis protein XIAP. J Biol Chem, 275(43), 33777-33781.
doi:10.1074/jbc.M006226200
Takahashi, R., Deveraux, Q., et al. (1998). A single BIR domain of XIAP sufficient for
inhibiting caspases. J Biol Chem, 273(14), 7787-7790. doi:10.1074/jbc.273.14.7787
Tang, H., Hornstein, E., et al. (2001). Amino acid-induced translation of TOP mRNAs is fully
dependent on phosphatidylinositol 3-kinase-mediated signaling, is partially inhibited by
rapamycin, and is independent of S6K1 and rpS6 phosphorylation. Mol Cell Biol,
21(24), 8671-8683. doi:10.1128/mcb.21.24.8671-8683.2001
Tangye, S. G., Nichols, K. E., et al. (2003). Functional requirements for interactions between
CD84 and Src homology 2 domain-containing proteins and their contribution to human
T cell activation. J Immunol, 171(5), 2485-2495. doi:10.4049/jimmunol.171.5.2485
Tenev, T., Bianchi, K., et al. (2011). The Ripoptosome, a Signaling Platform that Assembles in
Response to Genotoxic Stress and Loss of IAPs. Molecular Cell, 43(3), 432-448.
doi:10.1016/j.molcel.2011.06.006
Tsai, E. Y., Jain, J., et al. (1996). Tumor necrosis factor alpha gene regulation in activated T
cells involves ATF-2/Jun and NFATp. Mol Cell Biol, 16(2), 459-467.
doi:10.1128/mcb.16.2.459
Tushinski, R. J., & Stanley, E. R. (1983). The regulation of macrophage protein turnover by a
colony stimulating factor (CSF-1). J Cell Physiol, 116(1), 67-75.
doi:10.1002/jcp.1041160111
Udalova, I. A., Knight, J. C., et al. (1998). Complex NF-kappaB interactions at the distal tumor
necrosis factor promoter region in human monocytes. J Biol Chem, 273(33), 21178-
21186. doi:10.1074/jbc.273.33.21178
Vaidyanathan, H., Opoku-Ansah, J., et al. (2007). ERK MAP kinase is targeted to RSK2 by the
phosphoprotein PEA-15. Proceedings of the National Academy of Sciences of the United States of America, 104(50), 19837-19842. doi:10.1073/pnas.0704514104
200
Valk, P. J., Verhaak, R. G., et al. (2004). Prognostically useful gene-expression profiles in acute
myeloid leukemia. N Engl J Med, 350(16), 1617-1628. doi:10.1056/NEJMoa040465
Vallabhapurapu, S., Matsuzawa, A., et al. (2008). Nonredundant and complementary functions
of TRAF2 and TRAF3 in a ubiquitination cascade that activates NIK-dependent
alternative NF-kappaB signaling. Nat Immunol, 9(12), 1364-1370. doi:10.1038/ni.1678
van Dam, H., Duyndam, M., et al. (1993). Heterodimer formation of cJun and ATF-2 is
responsible for induction of c-jun by the 243 amino acid adenovirus E1A protein. The
EMBO Journal, 12(2), 479-487. doi:10.1002/j.1460-2075.1993.tb05680.x
van Dam, H., Wilhelm, D., et al. (1995). ATF-2 is preferentially activated by stress-activated
protein kinases to mediate c-jun induction in response to genotoxic agents. The EMBO Journal, 14(8), 1798-1811.
van den Reek, J., Coenen, M. J. H., et al. (2017). Polymorphisms in CD84, IL12B and
TNFAIP3 are associated with response to biologics in patients with psoriasis. Br J
Dermatol, 176(5), 1288-1296. doi:10.1111/bjd.15005
Vanden Berghe, T., Kaiser, W. J., et al. (2015). Molecular crosstalk between apoptosis,
necroptosis, and survival signaling. Molecular & cellular oncology, 2(4), e975093-
e975093. doi:10.4161/23723556.2014.975093
Varfolomeev, E., Blankenship, J. W., et al. (2007). IAP antagonists induce autoubiquitination
of c-IAPs, NF-kappaB activation, and TNFalpha-dependent apoptosis. Cell, 131(4),
669-681. doi:10.1016/j.cell.2007.10.030
Vazquez, I., Maicas, M., et al. (2011). Down-regulation of EVI1 is associated with epigenetic
alterations and good prognosis in patients with acute myeloid leukemia. Haematologica, 96(10), 1448-1456. doi:10.3324/haematol.2011.040535
Veale, M., Raab, M., et al. (1999). Novel isoform of lymphoid adaptor FYN-T-binding protein
(FYB-130) interacts with SLP-76 and up-regulates interleukin 2 production. J Biol
Chem, 274(40), 28427-28435. doi:10.1074/jbc.274.40.28427
Vince, J. E., Wong, W. W., et al. (2007). IAP antagonists target cIAP1 to induce TNFalpha-
dependent apoptosis. Cell, 131(4), 682-693. doi:10.1016/j.cell.2007.10.037
Visvader, J. E., & Lindeman, G. J. (2012). Cancer Stem Cells: Current Status and Evolving
Complexities. Cell Stem Cell, 10(6), 717-728. doi:10.1016/j.stem.2012.05.007
Volarevic, S., Stewart, M. J., et al. (2000). Proliferation, but not growth, blocked by conditional
deletion of 40S ribosomal protein S6. Science, 288(5473), 2045-2047.
doi:10.1126/science.288.5473.2045
Wajant, H. (2009). The role of TNF in cancer. Results Probl Cell Differ, 49, 1-15.
doi:10.1007/400_2008_26
Walker, P. S., Hengge, U. R., et al. (1996). Viral interference during simultaneous transduction
with two independent helper-free retroviral vectors. Hum Gene Ther, 7(9), 1131-1138.
doi:10.1089/hum.1996.7.9-1131
Wang, C. Y., Mayo, M. W., et al. (1998). NF-kappaB antiapoptosis: induction of TRAF1 and
TRAF2 and c-IAP1 and c-IAP2 to suppress caspase-8 activation. Science, 281(5383),
1680-1683. doi:10.1126/science.281.5383.1680
Wang, L., Du, F., et al. (2008). TNF-alpha induces two distinct caspase-8 activation pathways.
Cell, 133(4), 693-703. doi:10.1016/j.cell.2008.03.036
Wang, L., Du, F., et al. (2008). TNF-α Induces Two Distinct Caspase-8 Activation Pathways.
Cell, 133(4), 693-703. doi:10.1016/j.cell.2008.03.036
201
Wang, L., Harris, T. E., et al. (2007). PRAS40 regulates mTORC1 kinase activity by functioning
as a direct inhibitor of substrate binding. J Biol Chem, 282(27), 20036-20044.
doi:10.1074/jbc.M702376200
Wang, Y., Guo, W., et al. (1999). Phosphorylation of CD45 by casein kinase 2. Modulation of
activity and mutational analysis. J Biol Chem, 274(11), 7454-7461.
doi:10.1074/jbc.274.11.7454
Wang, Y., Shan, B., et al. (2018). Parkin regulates NF-κB by mediating site-specific
ubiquitination of RIPK1. Cell death & disease, 9(7), 732-732. doi:10.1038/s41419-018-
0770-z
Weintz, G., Olsen, J. V., et al. (2010). The phosphoproteome of toll-like receptor-activated
macrophages. Mol Syst Biol, 6, 371. doi:10.1038/msb.2010.29
Weng, Q. P., Kozlowski, M., et al. (1998). Regulation of the p70 S6 kinase by phosphorylation
in vivo. Analysis using site-specific anti-phosphopeptide antibodies. J Biol Chem,
273(26), 16621-16629. doi:10.1074/jbc.273.26.16621
Wong, W. W., Gentle, I. E., et al. (2010). RIPK1 is not essential for TNFR1-induced activation
of NF-kappaB. Cell Death Differ, 17(3), 482-487. doi:10.1038/cdd.2009.178
Wu, G., Chai, J., et al. (2000). Structural basis of IAP recognition by Smac/DIABLO. Nature,
408(6815), 1008-1012. doi:10.1038/35050012
Wu, X., Tian, L., et al. (2012). Investigation of receptor interacting protein (RIP3)-dependent
protein phosphorylation by quantitative phosphoproteomics. Mol Cell Proteomics,
11(12), 1640-1651. doi:10.1074/mcp.M112.019091
Xiao, G., Harhaj, E. W., et al. (2001). NF-kappaB-inducing kinase regulates the processing of
NF-kappaB2 p100. Mol Cell, 7(2), 401-409. doi:10.1016/s1097-2765(01)00187-3
Xu, K., Wang, L., et al. (1999). Evi-1 and MDS1-Evi-1 genes in pathogenesis of myelodysplastic
syndromes and post-MDS acute myeloid leukemia. Chin Med J (Engl), 112(12), 1112-
1118.
Xu, X., Gao, D., et al. (2018). Efficient homology-directed gene editing by CRISPR/Cas9 in
human stem and primary cells using tube electroporation. Scientific reports, 8(1), 11649-
11649. doi:10.1038/s41598-018-30227-w
Xu, Z., & Weiss, A. (2002). Negative regulation of CD45 by differential homodimerization of
the alternatively spliced isoforms. Nat Immunol, 3(8), 764-771. doi:10.1038/ni822
Yan, L., Zheng, D., et al. (2018). Critical Role of Tumor Necrosis Factor Signaling in
Mesenchymal Stem Cell-Based Therapy for Autoimmune and Inflammatory Diseases.
Frontiers in Immunology, 9(1658). doi:10.3389/fimmu.2018.01658
Yan, N., Sun, Y., et al. (2020). A Universal Surrogate Reporter for Efficient Enrichment of
CRISPR/Cas9-Mediated Homology-Directed Repair in Mammalian Cells. Molecular
Therapy - Nucleic Acids, 19, 775-789. doi:10.1016/j.omtn.2019.12.021
Yang, J., Hu, G., et al. (2003). Calcineurin/nuclear factors of activated T cells (NFAT)-activating
and immunoreceptor tyrosine-based activation motif (ITAM)-containing protein
(CNAIP), a novel ITAM-containing protein that activates the calcineurin/NFAT-
signaling pathway. J Biol Chem, 278(19), 16797-16801. doi:10.1074/jbc.M211060200
Yang, J., Nie, J., et al. (2019). Targeting PI3K in cancer: mechanisms and advances in clinical
trials. Molecular Cancer, 18(1), 26. doi:10.1186/s12943-019-0954-x
Yang, J., Wang, J., et al. (2013). eIF4B phosphorylation by pim kinases plays a critical role in
cellular transformation by Abl oncogenes. Cancer Res, 73(15), 4898-4908.
doi:10.1158/0008-5472.Can-12-4277

202
Yang, Q. H., & Du, C. (2004). Smac/DIABLO selectively reduces the levels of c-IAP1 and c-
IAP2 but not that of XIAP and livin in HeLa cells. J Biol Chem, 279(17), 16963-16970.
doi:10.1074/jbc.M401253200
Yang, Y., Fang, S., et al. (2000). Ubiquitin protein ligase activity of IAPs and their degradation
in proteasomes in response to apoptotic stimuli. Science, 288(5467), 874-877.
doi:10.1126/science.288.5467.874
Yu, T., Li, Y. J., et al. (2014). The regulatory role of activating transcription factor 2 in
inflammation. Mediators of inflammation, 2014, 950472-950472.
doi:10.1155/2014/950472
Yu, Y., Yoon, S. O., et al. (2011). Phosphoproteomic analysis identifies Grb10 as an mTORC1
substrate that negatively regulates insulin signaling. Science, 332(6035), 1322-1326.
doi:10.1126/science.1199484
Yuasa, H., Oike, Y., et al. (2005). Oncogenic transcription factor Evi1 regulates hematopoietic
stem cell proliferation through GATA-2 expression. The EMBO Journal, 24(11), 1976-
1987. doi:10.1038/sj.emboj.7600679
Zaboikin, M., Zaboikina, T., et al. (2017). Non-Homologous End Joining and Homology
Directed DNA Repair Frequency of Double-Stranded Breaks Introduced by Genome
Editing Reagents. PloS one, 12(1), e0169931. doi:10.1371/journal.pone.0169931
Zeisig, B. B., Milne, T., et al. (2004). Hoxa9 and Meis1 are key targets for MLL-ENL-mediated
cellular immortalization. Mol Cell Biol, 24(2), 617-628. doi:10.1128/mcb.24.2.617-
628.2004
Zeisig, B. B., Schreiner, S., et al. (2003). Transcriptional activation is a key function encoded
by MLL fusion partners. Leukemia, 17(2), 359-365. doi:10.1038/sj.leu.2402804
Zhao, J., Jitkaew, S., et al. (2012). Mixed lineage kinase domain-like is a key receptor interacting
protein 3 downstream component of TNF-induced necrosis. Proceedings of the
National Academy of Sciences of the United States of America, 109(14), 5322-5327.
doi:10.1073/pnas.1200012109
Zuber, J., Radtke, I., et al. (2009). Mouse models of human AML accurately predict
chemotherapy response. Genes & development, 23(7), 877-889.
doi:10.1101/gad.1771409
Zuber, J., Rappaport, A. R., et al. (2011). An integrated approach to dissecting oncogene
addiction implicates a Myb-coordinated self-renewal program as essential for leukemia
maintenance. Genes & development, 25(15), 1628-1640. doi:10.1101/gad.17269211

Minerva Access is the Institutional Repository of The University of Melbourne
Author/s:
Heckmann, Denise Annette
Title:
Understanding the molecular mechanisms of AML development and treatment using
phosphoproteomics
Date:
2020
Persistent Link:
http://hdl.handle.net/11343/241732
File Description:
Final thesis file
Terms and Conditions:
Terms and Conditions: Copyright in works deposited in Minerva Access is retained by the
copyright owner. The work may not be altered without permission from the copyright owner.
Readers may only download, print and save electronic copies of whole works for their own
personal non-commercial use. Any use that exceeds these limits requires permission from
the copyright owner. Attribution is essential when quoting or paraphrasing from these works.