molecular mechanisms involving free radical
TRANSCRIPT


Molecular mechanisms involving free radical ….
Founder’s Day Special Issue, 2005
1
Molecular Mechanisms Involving Free Radical Reactions of Antioxidants and Radioprotectors
K. Indira Priyadarsini Radiation Chemistry & Chemical Dynamics Division Bhabha Atomic Research Centre
erobic organisms produce a number of reactive free radicals (molecules or atoms having unpaired electrons) continuously
in cells during respiration, metabolism and phagocytosis. Out of these, the most important source of free radicals being the respiratory chain where ~ 1 to 2% oxygen is converted into superoxide radicals (O2
•−). While superoxide radical is not so reactive and may not be able to cause any direct damage to cells, its reaction product hydrogen peroxide in presence of trace metal ions, is converted to more powerful hydroxyl radicals (•OH), which can oxidize most of the biomolecules. Organic substrates (RH) or lipids (LH) on reaction with hydroxyl radicals in presence of oxygen are converted in to peroxyl radicals (ROO•)/(LOO), which are known to undergo chain reactions, and thereby multiplying the damage. Thus, free radicals formed within the cells can induce multiple chemical changes in cellular organelles like membrane lipids, DNA and proteins, which can eventually lead to cell death. The collective terms “reactive oxygen species (ROS) and reactive nitrogen species (RNS)” have been applied for a variety of free radicals such as superoxide, hydroxyl, peroxyl,
nitric oxide, nitrogen dioxide radicals as well as for non-radical reactive intermediates like hydrogen peroxide (H2O2) and peroxynitrite (ONOO-) etc. and their excessive production, termed as “oxidative stress” has been implicated in many pathological disorders like heart disease, cancer and ageing 1-3. Antioxidants are substances, when present in small quantities prevent the oxidation of cellular organelles by minimizing the damaging effects of ROS and RNS or oxidative stress. Under normal healthy conditions, a balance is maintained between oxidative stress and antioxidant requirements. The endogenous antioxidant defense comes mainly from three different types of systems, viz., antioxidant enzymes e.g. catalase, superoxide dismutase (SOD), metal sequestering proteins e.g. ferritin and low molecular weight molecules like vitamin C, vitamin E etc. However under pathological conditions or during radiation injury, stress, and pollution etc. the balance is lost and excessive supplementation of antioxidants is necessary. It has been found that fruits and vegetables, rich in antioxidants, decrease the risk of oxidative
stress. In this context, the search for new, effective and appropriate antioxidants aimed at minimizing the oxidative stress and providing defense against free radical induced stress in diverse clinical and pathological conditions has gained significant importance. A number of herbal formulations used in traditional Indian medicine are also some of the potent antioxidants which need to be explored.
A
2O
2O
-e
2O.-
2O.-
.NO
-ONOO
SODH2O2
HO C l
MPO
H2O2 H2O
2O1 + C l.
+3FeFe2 +
OH. LH (l ipid)L 2O
.
2O
lipidsDNA
Biomole cule
Cell death
Scheme 1: Formation of ROS & RNS

Molecular mechanisms involving free radical ….
Founder’s Day Special Issue, 2005
2
Exposure of ionizing radiation to cells also causes similar effect as oxidative stress. Interaction of ionizing radiation is non-selective and in cells, water being the major constituent undergoes radiolysis producing hydroxyl radicals, which can react with cellular organelles, similar to those produced by oxidative stress. Due to this similarity between oxidative stress and radiation injury, an antioxidant can also act as a radioprotector in principle. Antioxidants, depending on the chemical structures, have diverse mechanism of action. Preventive antioxidants, like deferrioximine or desferal, are compounds which form chelates with metals, thereby help in preventing the free radical production The second type of antioxidants known as, chain-breaking antioxidants are the most important class of antioxidants, which can scavenge chain propagating free radicals like peroxyl radicals and converting the reactive free radicals to inactive products, e.g. vitamin-E or α-tocopherol, curcumin. Antioxidants like ascorbic acid are water soluble and help in recycling chain breaking antioxidants. The phenoxyl radicals of vitamin E and curcumin have been found to be regenerated inside the cell membrane by ascorbic acid. Chemical structures of some of the antioxidants are given in scheme.2.
The approach to the development of antioxidants has in general been based on macroscopic biochemical changes by both in vitro and in vivo studies and from such studies several phytochemicals have been reported as potent antioxidants. However, in order to manipulate the phytochemicals for therapeutic gains, it is necessary to understand the antioxidant action on molecular level. Therefore it is important to understand the molecular mechanisms responsible for the antioxidant action of phytochemicals. Estimation of physico-chemical properties, chemical kinetic and thermodynamic parameters are helpful in understanding the competing and probable reactions of free radicals. Direct monitoring of free radical reactions of antioxidants is necessary for the knowledge of such processes. As most of the free radicals are highly reactive, they are short-lived, with lifetimes ranging from microseconds to seconds. Therefore, it is not easy to directly monitor free radical reactions and powerful tools based on fast reaction techniques are required to follow such processes. Pulse radiolysis, a technique using short pulses of high energy electrons (Figure.1), has been proved to be extremely versatile in studying several of these free radical reactions 3,4.
It is possible to generate selectively and quantitatively, most of the reactive oxygen and nitrogen species employing methods available from the radiation chemistry of aqueous solutions (Scheme.3). By following the time dependent changes in the concentration of radical during the course of their reaction, it is possible to quantify reaction kinetics, radical lifetimes, diffusion length and one-electron redox potentials reliably. These parameters can be used to establish the likely and unlikely reactions and competitive reactions of antioxidant substances under suitable biological conditions.
Scheme 2: Chemical structures of important antioxidants

Molecular mechanisms involving free radical ….
Founder’s Day Special Issue, 2005
3
Fig. 1: Schematic diagram of the pulse radiolysis facility using 7 MeV linac with optical
detection
Reducing radical
OH2
Oxidising radicale-
aq H,
Radiolysis of water
N2OOH
N3
N3-
.
t. Butanol
CCl4
CCl3.
CCl3OO.
O2
O2.-
NO2-
NO.
+ ONOO-
NO2-
NO2
LH = lipid
L.
O2
.
H2O2
O2
LOO.
Scheme 3: Selective and quantitative generation of Free Radicals by radiation chemical methods

Molecular mechanisms involving free radical ….
Founder’s Day Special Issue, 2005
4
Alternatively, it is possible to exploit known chemical methods to produce some of the non-radical species like peroxynitrite. Stopped-flow kinetic methods are useful to follow the kinetics of reactions of non-radical species and long lived (lifetimes of few seconds or more) radical species. ESR monitoring of the free radicals at low temperatures, is complementary in predicting the structure of the intermediate antioxidant radical, which in turn can be used to understand the most probable site of free radical attack. Finally theoretical studies based on DFT calculations can give supportive evidence as to the most probable bond that can be ruptured on free radical attack. Based on all these studies it has been possible to evaluate the molecular mechanisms involved in free radical reactions of antioxidants belonging to the classes of curcuminoids from turmeric, flavonoids from natural herbs, methoxy phenols from spices, selenium compounds, carotenoids from carrots. Having understood the mechanism of action at molecular level it is necessary to correlate these results with antioxidant potency in cellular systems. For this, in vitro biochemical experiments on inhibition of free radical induced damage to cellular organelles like inhibition of lipid peroxidation in membrane lipids, inhibition of strand breaks in DNA and enzyme inhibitory studies have been performed to estimate in vitro antioxidant status of the compound. In almost all the cases very good correlation between the physico-chemical properties and the in vitro antioxidant ability has been achieved. The studies on curcumin, selenium compounds and herbal extracts are discussed below. Curcumin, a pigment from turmeric, shows remarkable antioxidant activity and has been
found to be an excellent free radical scavenger5. It is lipid soluble and is a chain breaking antioxidant. Its in vitro antioxidant ability has been found to be as high as that of vitamin E. It has two sites for free radical attack, o-methoxy-phenolic moiety (PR1) and the methylenic moiety (CR1) (Scheme.4). Based on pulse radiolysis studies, DFT calculations and in vitro biochemical studies of curcumin and its dimethoxy derivative, it has been concluded that the methoxy phenolic OH group is essential for the antioxidant activity. Such studies helped in derivatising curcumin to new synthetic models through the methylenic moiety with desired therapeutic potential, without disturbing its original antioxidant potential. Thus, a copper complex of curcumin has been found to show promising superoxide dismutase (SOD) activity, with comparable free radical scavenging ability and an improved antioxidant efficacy 6.
Selenium is an essential trace element for animals and humans, being a constituent of redox active enzymes like glutathione peroxidase. Selenium compounds exhibit
Scheme 4 : Curcumin and possible sites for free radical attack. PR1 is phenoxyl radical and CR1 is methylenic radical

Molecular mechanisms involving free radical ….
Founder’s Day Special Issue, 2005
5
antioxidant and radio-protecting activity. A number of organoselenium compounds have been tested in our group for their free radical reactions using pulse radiolysis and other techniques7. In case of selenourea, formation of elemental selenium was observed on reaction with ROS and RNS (scheme.5). This elemental selenium could be stabilized to nanometer size in presence of proteins. The stabilized nanoselenium was found to participate in redox reactions. Such reactions in biological systems can be helpful in understanding the cyctotoxicity/ cytoprotectivity of selenium compounds 9. In another example, studies were carried out on some plant extracts and herbal formulations. There are several Indian herbs and plants having good medicinal properties and are commonly used in Ayurvedic medicine. In almost all the cases tested for this, it has been found that a plant extract having high ability to scavenge free radicals also showed high in vitro antioxidant activity 9-11. Further it was necessary to know which dietary factor is responsible for the beneficial effects. Plants contain several of phyto-chemicals, therefore it is difficult to predict which phytochemical is responsible for the activity.
SeNano particle
+
O2
OH._H2O
SeU
K
+
Se C
NH2
NH2
. ..+ C SeNH2
NH2
Se C
NH2
NH2
+.
C
NH2
NH2
Se C
NH2
NH2
OO.Se
Se C
NH2
NH2
Se C
NH2
NH2
OO.
+
C
NH2
NH2
Se
O.+
C
NH2
NH2
Se + SeC
NH2
NH2
OO C
NH2
SeHN
H + SeC
NH2
H2N .
HSeOH
NH2CN
+ H2O
H2O2
ONOO- e- oxidation2
( Oxygen atom transfer )1O2
1e- oxidation
SeU
SeU
Se lenourea( )
Scheme 5 : Formation of elemental selenium by reaction of various
oxidants with selenourea
Fig. 2: HPLC chromatograms of (a) Amla and (b) gallic acid obtained by using C18 PCX 500 analytical column, 0.1M KCl, 0.05 M HCl, 10% acetonitrile as the mobile phase and UV detector set at 260 nm. Inset shows the calibration curve for gallic acid

Molecular mechanisms involving free radical ….
Founder’s Day Special Issue, 2005
6
For example, it is commonly believed that the beneficial effects of phyllanthus emblica (Amla) are due to ascorbic acid. Correlating the physico-chemical properties with in vitro antioxidant studies and HPLC analysis, it has been confirmed conclusively that ascorbic acid alone cannot account for its activity and polyphenols such as ellagic acid, gallic acid etc contribute significantly. The plant extracts and formulations with good antioxidant efficacy can be promising radioprotectors of the future. Development of such class of radioprotectors is benificial, as they are potential alternatives to expensive and toxic drugs. Also, they are commercially viable and marketed as nutritional supplements 12. Thus estimation of antioxidant properties at the molecular level is essential for quantitative structure-activity understanding of antioxidants. Such studies form the basis for the in vivo testing of antioxidant drugs and also for the overall development of antioxidants with desired therapeutic potential. References 1. Finkel T, Holbrook N. J. Nature 408, 2000,
239-247. 2. Halliwell, B. and Gutteridge, J. M. C. Free
radicals in biology and medicine. Clarendon Press Oxford, 1993. 22-81.
3. R. H. Bisby, and A. W. Parker, in Free radicals : from basic science to medicine,
Eds G. Poli, E. Albano and M. U. Dianzani, Birkhauser Verlag, Berlin, 1993, 31-37.
4. C. von Sonntag, The chemical basis of radiation biology. Taylor and Francis, London. 1987, 65-84.
5. K. I. Priyadarsini, D. K. Maity, G. H. Naik, M. Sudheer, M. K. Unnikrishnan, J. G. Satav and Hari Mohan, Free Radic. Biol. Med. 35, 2003, 475-484
6. A. Barik, B. Mishra, Liang Shen, H. Mohan, R. M. Kadam, S. Dutta Hong-Yu Zhang and K. I. Priyadarsini, Free Radic. Biol. Med. 2005 (In print)
7. B. R. Mishra, D.K. Maity, K.I. Priyadarsini, H.Mohan and J.P. Mittal, J. Phys. Chem., 108, 2004, 1552-1559
8. B. R. Mishra, K. I. Priyadarsini, P. A. Hassan and Harimohan, J. Phys. Chem. B (in print 2005)
9. G. H. Naik, K. I. Priyadarsini., J. G. Satav, M. M. Banavalikar, D. P. Sohani, M. K. Biyani and H. Mohan, Phytochemistry, 63, 2003, 97-104.
10. S. M. Khopde, K. I. Priyadarsini, H. Mohan, V. B. Gawandi, J. G. Satav, J. V. Yakhmi, M. M. Banavaliker, M. K. Biyani and J. P. Mittal Current Science, 81, 2001,185-190.
11. G. H. Naik, K. I. Priyadarsini, D. B. Naik, R. Gangabhagirathi, and Hari Mohan, Phytomedicine, 11, 2004, 530-538.
12. J.F. Weiss, M.R. Landauer. Toxicology 189, 2003, 1-20
About the author …
Dr K. Indira Priyadarsini is currently working on the elucidation of mechanisms of antioxidant action involving natural products and herbal extracts with the potential application as radioprotectors, employing nanosecond electron pulse radiolysis and in vitro biochemical studies. Dr Priyadarsini has co-authored more than 95 papers in peer reviewed international journals on antioxidants, free radical reactions, radiation chemistry, photochemistry and radiation biology. She has been elected as the Fellow of the National Academy of Sciences, India, 2003.
The author is the recipient of the Homi Bhabha Science and Technology Award for the year 2003
In-situ and non-intrusive measurement technique ….
Founder’s Day Special Issue, 2005
7
In-Situ and Non-Intrusive Measurement Technique for Detection of Turbine Blade Vibrations A. Rama Rao Reactor Engineering Division Bhabha Atomic Research Centre
A b s t r a c t
This paper is on a feasibility study carried out on a steam turbine for developing an online technique for detecting turbine blade vibration. The long low-pressure turbine blades that contribute approximately 10% of the overall output power in a modern power plant are surrounded by hostile environment. They are susceptible to flow induced vibrations especially during its off design operation. Using the conventional vibration instrumentation, it has been shown that the blade vibration can be detected in an operating steam turbine. The subject is one of the active areas of research world wide.
Introduction
xtensive demand for electricity in the present age has brought in many new and large power stations into operation
whose efficiency and availability are expected to be high. The availability of steam turbine in a power station is directly related to its performance under all the operating conditions. This in turn depends on the reliability of turbine blades. In large turbo machinery, blade vibration is one of the most important design factors. Typically, blade vibrations are caused due to unsteady flow phenomena and complex interactions within a high velocity steam medium. Long blades, especially the last stage blades of a low-pressure (LP) turbine are susceptible to such vibrations. Its performance under variable load conditions restricts the operational flexibility, which is important for the availability of a power station. The operational capability under off design operating condition such as off frequency operation, low load and high exhaust pressure operation and operation under corrosive environment are of major concern. Under off-design conditions, LP blades do vibrate, which largely goes unnoticed in the plant. The conventional bearing and shaft vibration monitoring system do not sense blade vibration unless they reach to a level of high damage potential.
In the recent times, even though considerable efforts are being made to improve the design of LP blade that can withstand harsh steam environment and enable operational flexibility, the need for online monitoring of its health has been strongly felt by vibration monitoring community. Techniques devoted for blade vibration measurement are few and very expensive. This paper addresses the feasibility of developing an in-situ and non-intrusive blade vibration measuring/monitoring technique. The major purpose of such a measurement system is to provide a technically feasible and cost effective means to isolate the incidence of potential turbine blade failure before they occur. This helps to minimize costly machinery failure and fulfill the need for online monitoring of blade vibration. Typical Design Features of Low Pressure Turbine Blade With the growth of turbine rating, there has been constant search for better design of last stage blades to efficiently handle the increased quantities of steam flow within a reasonable number of casings. The last stage blades, that contribute approximately 10% of the overall output of a modern power plant are surrounded
E

In-situ and non-intrusive measurement technique ….
Founder’s Day Special Issue, 2005
8
by hostile aerodynamic environment in the whole of machine due to the transonic and often droplet laden flow field. The longest blades of the last rows in a LP turbine are always tapered and twisted to accommodate the demands of mechanical integrity and aerodynamic performance. Use of freestanding blades in the last row is a very popular choice because of clean aerodynamic shape; fewer locations of stress concentration, and, in comparison to grouped blades, the vibratory modes are fewer. However, the disadvantages of freestanding blade include requirement of high strength in bending. Furthermore, since the tip is more flexible, it is difficult to control tip vibration and its susceptibility to flutter. A typical LP turbine rotor is shown in figure 1.
Advantages claimed for the continuously connected blade row include greater stiffness that helps to resist vibration and bending forces.
The disadvantages are the difficulty in tuning the blades and the problems related to thermal stresses. Sources of Excitation and Vibration Phenomena of LP Blades In a steam turbine there are many sources of excitation yet to be measured or estimated. Much is relied on extrapolation from accumulated experience. From the experience gained so far, the sources of blade excitation are broadly classified as 1. Harmonic excitation 2. Random or broadband excitation 3. Self excitation Harmonic excitation seen by the moving blades
is a time dependent periodic fluctuating flow field at the rotational speed and higher harmonics. By design practice all the long blades are tuned so as to avoid resonance due to harmonic excitation. However the turbine blades normally experience random excitation. Such excitation is primarily due to temporal unsteadiness of the flow over the stationary blade. The third type is self-excitation, which primarily includes stall flutter that can occur in any of the lower modes of the blade. Under conducive conditions, the blades “organize themselves” into a systematic self-excited vibration. A self-excited vibration does not need external excitation; instead, the excitation frequency is internally generated. For example, a blade, which is perturbed from equilibrium, will vibrate back to equilibrium at its natural frequency. If this
vibration modulates the flow such that the resulting dynamic forces act to sustain the vibration, then the blade vibrate in a self-excited
Fig. 1: A typical Low Pressure Turbine Rotor and different stages

In-situ and non-intrusive measurement technique ….
Founder’s Day Special Issue, 2005
9
manner. The vibration is maintained right at the natural frequency. Such a vibration associated with turbine blade is called flutter and is a well-recognized source of fatigue in the blade. Some blades would have the tendency to flutter more than the other and the process is not linearly related to the load. Sudden changes in the flow path and steam extraction have been observed to initiate flutter in the blade. Another well recognized last blade vibration is the stall flutter. During operation at very low load and high exhaust pressure, stall flutter occurs in the last stage blades of a low-pressure turbine, which result in severe vibratory stresses. Blade Vibration Measurement on 220 MWe LP Turbines Vibration measurements were carried out on Low Pressure turbine casing of Madras Atomic Power Station (MAPS) in1997. The plant is a 220 MWe generating unit having one high-pressure turbine (HP) coupled to a double flow low-pressure turbine (LP), which in turn is coupled to generator rotor. The complete turbo generator (TG) shaft is supported on 6 bearings. Due to the altered moderator flow configuration in the reactor, the unit was limited to operate at 80% of full power of 220 MWe. The LP has 5 stages of blades. The fifth (last) stage consists of 78 blades each measuring nearly a meter long and weighing about 19 Kgs. The operating speed of the turbine is 3000 rpm. Typical cross section of the LP turbine is shown in figure 2. Operation of a steam turbine wholly depends on the dynamic action of the steam. The steam looses its pressure in the stationary blade due to which certain amount of heat energy is converted into kinetic energy and the steam is set to move with a high velocity. The rapidly moving particles of steam enter the moving part of the turbine and suffer a change in direction of motion giving rise to change of momentum, which gives rise to the driving force. The steam issuing out from the blades impinge on the casing with a regularity (cyclic) corresponding to the product of number of rotating blades and
rotational speed. This excitation due to the blade passing close to the casing is called blade passing frequency (BPF) excitation. As the steam issues out from the blades at very high velocity, it also carries the information about the condition of the blades. This is the very basis on which the blade vibration detection technique is built on. LP Casing Vibration Measurement Figure 1 shows the position of vibration measurement on the LP casing. Sensitive accelerometers are used for recording the vibration signals. During the recording, the TG process parameters were also acquired to study the co-relation between the process and TG blade vibrations. As brought out earlier, MAPS unit was operating at 80% of full power, which happens to be off design condition. Trend Plots of LP Casing Vibration Figure 3 shows the variation of TG power and speed for one hour duration as recorded on 15th
Fig. 2: Cross section of LP Turbine & Casing and
Mounted Vibration Sensors

In-situ and non-intrusive measurement technique ….
Founder’s Day Special Issue, 2005
10
Dec. 1997. As can be seen in the figure, the generated power (MWe) undergoes drastic changes from normal at around 12:35 hours thus pushing the system further down into low load and high exhaust pressure operation. The low condenser vacuum during the period is shown in
Figure 4. Figure 5 shows amplitude variations of BPF component at 3.9KHz for the 5-stage blades. From 12.35 hours onwards, BPF amplitude shows large variations, which closely match with the variations of power.
Fig 3: Trend of generated power and turbine speed
Fig 4: Variation of condenser vacuum in low pressure turbine

In-situ and non-intrusive measurement technique ….
Founder’s Day Special Issue, 2005
11
Normally, the amplitude of BPF is expected to have a steady level with a small fluctuation due to noise, error, etc. However, large variation indicates the possibility of blade vibrations.
Blades under off normal operating condition such as in MAPS unit are prone to vibration in its lower mode and could sustain until the operating condition returns to normal. As explained earlier,
Fig.5: Amplitude trend of blade passing frequeny of 5th stage of LP turbine
Fig.6 : Amplitude trend of the blade natural frequency at 107 Hz

In-situ and non-intrusive measurement technique ….
Founder’s Day Special Issue, 2005
12
such vibration is self excited in nature and are called stall flutter. The blades vibrate in its lower natural frequency while under rotation with the shaft. Such blade vibrations cause variation in the amplitudes of BPF component. Blade vibration The LP casing vibration below 200 Hz mainly consists of frequency peaks corresponding to the rotor speed (IX) and its higher harmonics up to (4X). Other frequency peaks in the spectrum are of low amplitude. One such minor peak at 107 Hz was found to be highly coherent between the two locations of measurements after 12:35 hours i.e. during load variation. Figure 6 shows amplitude variation of frequency peak at 107 Hz, which is the first mode natural frequency of the 5th stage blades. A close examination between amplitude variation of B.P.F (figure 5) and blade natural frequency at 107 Hz (figure 6) reveal that the variations are in phase opposition i.e. when amplitude of 107 Hz increases, amplitude of B.P.F decreases. As was stated earlier amplitude variation of B.P.F is caused by blade vibration as confirmed from the above observation. Steam Flow During Low Load and High Exhaust Pressure Operation During the low load and high exhaust pressure, random vibration or stall flutter occurs in last stage blades of LP turbine. In such condition the steam inlet flow angle is larger than normal resulting in negative angle of attack. As a result of large negative angle at the inlet to the blade, steam flow separation causes the blades to vibrate in stall flutter. In MAPS, the 5th stage blade of LP turbine vibrates due to stall flutter at 107 Hz, which is the natural frequency of the blades in the stage. This can be seen in the Campbell diagram provided by the turbine manufacturer for the 5th stage as shown in figure 7. At 3000 rpm the first bending mode frequency is at 107 Hz.
Conclusions Through the above campaign of vibration measurement on an operating steam turbine, feasibility of detecting turbine blade vibration has been demonstrated. The detection method is simple, economical and easy to implement. Comparison of results of turbine casing vibration analysis with power variation establishes a close relationship between blade vibration and the process. In this case the generated power. It is felt that with a sound front end sensors on the LP casing which can be linked to a compact data acquisition and analysis system, it should be possible develop and integrate a system to detect turbine blade vibration during TG operation.
Fig. 7 : Campbell diagram of 5th stage blades

In-situ and non-intrusive measurement technique ….
Founder’s Day Special Issue, 2005
13
About the author ….
Mr A Rama Rao did his graduation in Mechanical Engineering from Karnataka University, Dharwad. He belongs to 25th Batch of BARC training school. He joined Reactor Engineering Division and has been working on study of vibration in machinery, structures, reactor components, and critical equipments in all the units of DAE. He has worked to analyze, detect and solve a large number of vibration related problems faced during testing & commissioning. He has worked on the development of vibration diagnostic techniques, unique for applications on in-core components like shut-off rod, coolant channels, sparger tubes, and fuel
elements. He has offered consultancy services to organizations like German Railways, Konkan Railways, DRDL, Tata Power, NTPC, AIR INDIA and RCF. Currently, he is heading the Vibration Laboratory Section of RED. In 2004, he was awarded the DAE’s Technical Excellence Award for his outstanding contribution in the field of vibration diagnostics.
.
Mr A. Rama Rao is the recipient of the DAE Technical Excellence award for the year 2003

Development of a 3-Axes Robotic System …
Founder’s Day Special Issue, 2005
14
Development of a 3-Axes Robotic System for Making DNA Microarrays Ratnesh Singh Sengar, Ketan D. Lagoo, R.K. Puri and Manjit Singh Division of Remote Handling and Robotics, Bhabha Atomic Research Centre
and A.V.S.S. Narayana Rao Molecular Biology Division, Bhabha Atomic Research Centre
A b s t r a c t
DNA Microarray technology is an experimental approach to study all or a large number of genes in a given organism simultaneously. The mechanical properties of the microarrayer play an important role in obtaining good quality arrays. A 3-axes robotic system consisting of specialized axes has been designed and developed at BARC for making DNA microarrays. In addition to controlled three-dimensional motion, the system consists of a sonication chamber and a vacuum dryer for cleaning and drying the spotting pins. The minimum diameter of spot is 150 - 200 microns making it possible to print thousands of probes on a standard glass microscope slide ( 1" X 3"). This system is housed in a temperature and humidity controlled enclosure and is controlled through a personal computer that provides a custom developed graphic user interface. The accuracy and repeatability of the system is evaluated by printing test patterns and quantifying various spot parameters using suitable statistical methods.
Introduction
raditional methods in molecular biology generally work on a "one gene in one experiment" basis, which result in a very
limited throughput making it hard to obtain a “complete picture" of the gene function. The emerging field of genomics promises make mutation detection and gene expression analysis less time consuming and more efficient, thus revolutionizing areas of health and medicine. Microarray technology is an experimental approach to study all or a large number of genes in a given organism simultaneously. The basic idea is to print the DNA templates (also called target or probe spots) for all possible ORFs that can be expressed in a given organism in a two-dimensional array at a high-density on a solid surface. The number of probes can be as many as a few thousands. These targets are then hybridised with fluorescently labelled
complimentary sequences in a test sample (DNA or RNA). The fluorescence intensity in each spot of the array is measured through a suitable scanner. The data thus generated includes the location and intensity of the fluorescent signal. The location of the signal identifies the probe/gene being examined while the intensity gives an estimate of the quantity of that particular DNA fragment in the sample. A good quality microarrayer becomes an essential tool for most genomics laboratories. The accuracy demands are high because of the microscopic size of the spots. Various design considerations and the quality parameters to be assessed while making microarrays are also discussed. Design Features The important considerations while designing a precise 3-axis robot are higher speed, micron level accuracy (at a scale of 30-50cm) and
T

Development of a 3-Axes Robotic System …
Founder’s Day Special Issue, 2005
15
minimum vibration. We achieved this by using a well-damped table; precision mechanical slides with screw drives, robust stepper motors (micro stepping drive) with high-resolution encoders. The robot is designed to automatically collect samples from the wells of either a 96 or a 384 well microtitre plate with up to 32 specially made pins and deposits approximately 1 nanoliter on
each slide. The system can hold two microtitre plates (of either 96 or 384 wells) and generate a maximum of 24 standard microscope slides per batch. However, the software can be configured to print a different number of slides. The whole system rests on an anti-vibration table and is housed inside a transparent, dust free enclosure.
The system consists of the following individual components:
Source plate : Two standard microtiter plates of 96, 384 wells. Slide holder : 4 blocks, holding 6 slides each (total 24 standard microscope slides). Vacuum Gripping : The slides and the print-well are held by means of vacuum. Print head : A head unit that can hold a maximum of 32 printing pin (compatible for a
384 well plate or 8 pins in case of a 96 well plate). Printing pins : Quill type pins that work on capillary action. The Axes : The X and Y-axes are based ball screws. The Z-axis uses a lead screw to
prevent the axis from crashing in case of power failure. Motors : All the 3 axes are driven by stepper motors. Controllers : Controller of the motor supplies the direction and digital pulses to motors
in micro-step mode for all motors (X, Y, Z) to accelerate and decelerate X, Y and Z simultaneously. All the 3 axes have limit-switches at both ends and optical encoders for position feedback.
Cleaning / Drying : An ultrasonic chamber (33Khz) and a vacuum pump based drying chamber for removing the moisture from the pin slot.
Dehumidifier : A dehumidifier attached to the enclosure controls its humidity and temperature.
Taking all the above considerations into account, the specifications achieved for a prototype arraying system (Fig. 1) are listed in Table 1.
Table 1. Specifications of each axis of the arrayer
Parameter X Y Z
Maximum stroke (mm) 360 385 135
Maximum speed (mm/sec) 110 110 70
Minimum Step size (microns) 10 10 10
Backlash error (microns) 4 3.2 3.8
Accuracy (microns) 3.0 3.0 1.7
Development of a 3-Axes Robotic System …
Founder’s Day Special Issue, 2005
16
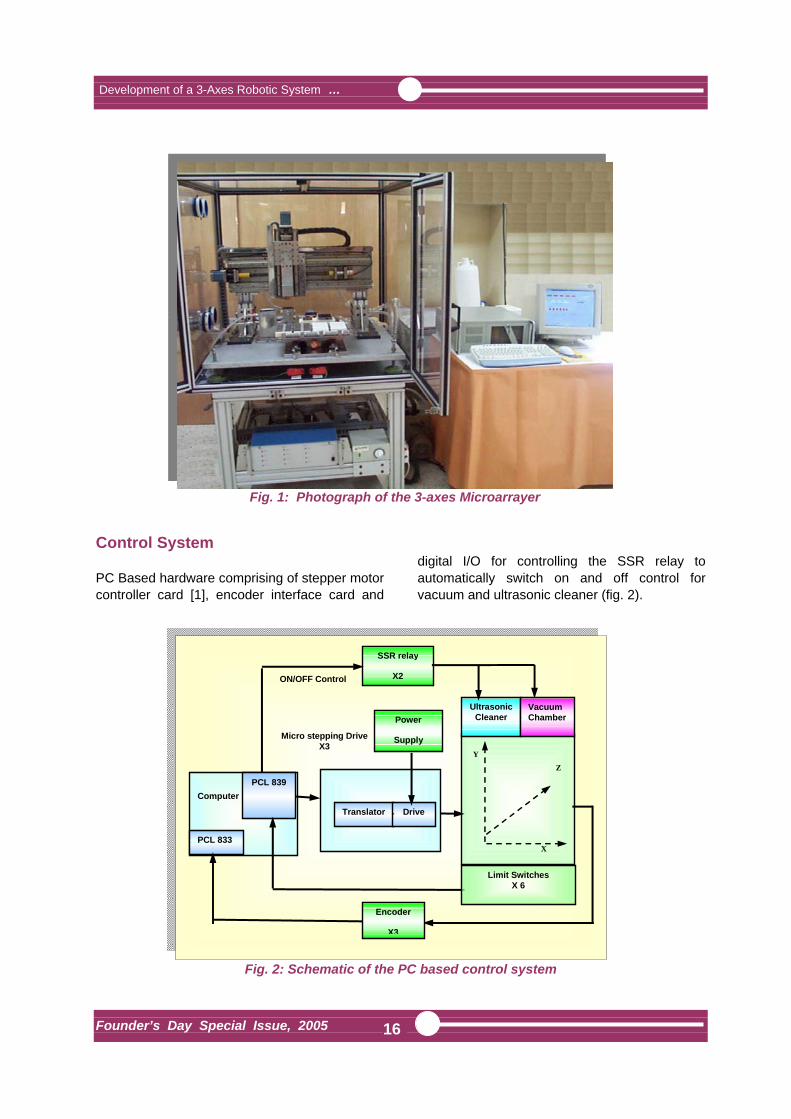
Control System
PC Based hardware comprising of stepper motor controller card [1], encoder interface card and
digital I/O for controlling the SSR relay to automatically switch on and off control for vacuum and ultrasonic cleaner (fig. 2).
Fig. 2: Schematic of the PC based control system
Fig. 1: Photograph of the 3-axes Microarrayer
Computer
PCL 839
Translator
Encoder
X3
Ultrasonic Cleaner
Vacuum Chamber
SSR relay
X2
Drive
PCL 833
Micro stepping Drive X3
X
Z
Y
ON/OFF Control
Limit SwitchesX 6
Power
Supply

Development of a 3-Axes Robotic System …
Founder’s Day Special Issue, 2005
17
Software All the operations of the Microarrayer are controlled through a PC based graphical user interface (GUI) running under Microsoft Windows® and has been developed in VC++ platform [2]. The GUI provides different options like pin, print well and slide configuration, manual operation of each axis independently, software and hardware hot key to stop the operation at any moment of time and also to resume from the same place. The software also aborts the printing operation automatically in case of malfunction of any of the axis. The progress of printing is updated and displayed during each iteration. Two levels of password protected security features are provided in the software, user level with separate configuration file for each user and administrator level to add/remove users and to change certain system parameters like the axis speed etc. It also generates an output file, which contains the identity of the solutions (print well location) and the printed spots (location details on the glass slide). A log file records the user name, date, time, number of well plates, number of slides, pin configuration, the total number of dots/slide and the status of printing. Operation A typical printing cycle is as follows:
a. The print head is positioned in the ultrasonic cleaner in such a way that the pins dip into water. Then the software switches on the ultrasonic cleaner for a user-determined period of time to clean the pins.
b. Then the print head is taken to the drying chamber after which the vacuum pump is activated for the required period to remove the water accumulated in the pin slots.
c. Then the head is moved to the required wells in the source plate to dip the pins into samples and pick up the solutions by capillary action.
d. Then the head is taken to all the glass slides to the desired locations to print the spots.
e. The same cycle repeats till all the samples are printed on all the glass slides.
Need for Error Analysis In a microarrayer experiment various factors like the physico-chemical conditions of the solutions being spotted, the properties of the printing surface and the inherent properties of the spotting robot affect the quality of the final arrays. Collectively these variations result in a spot whose size, shape as well as its locations is not within an acceptable tolerance or in rare cases leading to the absence of a spot. Detection of these failures at the analysis stage allows for a corrective action at a later stage of the experiment [3]. The possible types of error in the process of spotting which are treated as random variables are – spot size, amount of probe pipetted by the robot, location of the spot on the slide and the presence or absence of the spot (a discrete variable). Statistical Methods Used for Error Estimation Normal Distribution We assume the diameter of the spot and the amount of solution (probe) pipetted, like many types of physical measurements, to follow a normal distribution. Moreover this distribution is more appropriate for large sample sizes, as in case of microarrays. x is normally distributed with mean µ and variance σ2, if it has the probability density F(x) = (2πσ2 )-1/2 exp-(x-µ)2 /( 2 σ2) , - ∝ < x < + ∝
(1)
In case of size of spot, x is the deviation from the mean size. For volume spotted, x is the deviation from the standard amount. For location of the spot, x is the distance from the centre of desired location to the centre of actual location. Binomial distribution The event of the spot being present follows a Binomial Distribution. Let p be the probability of the spot being presented so 1-p is the probability that the spot is not present.

Development of a 3-Axes Robotic System …
Founder’s Day Special Issue, 2005
18
The probability that out of the N spots, k are present is
NCk pk(1-p)N-k, k=0, 1, 2…………N
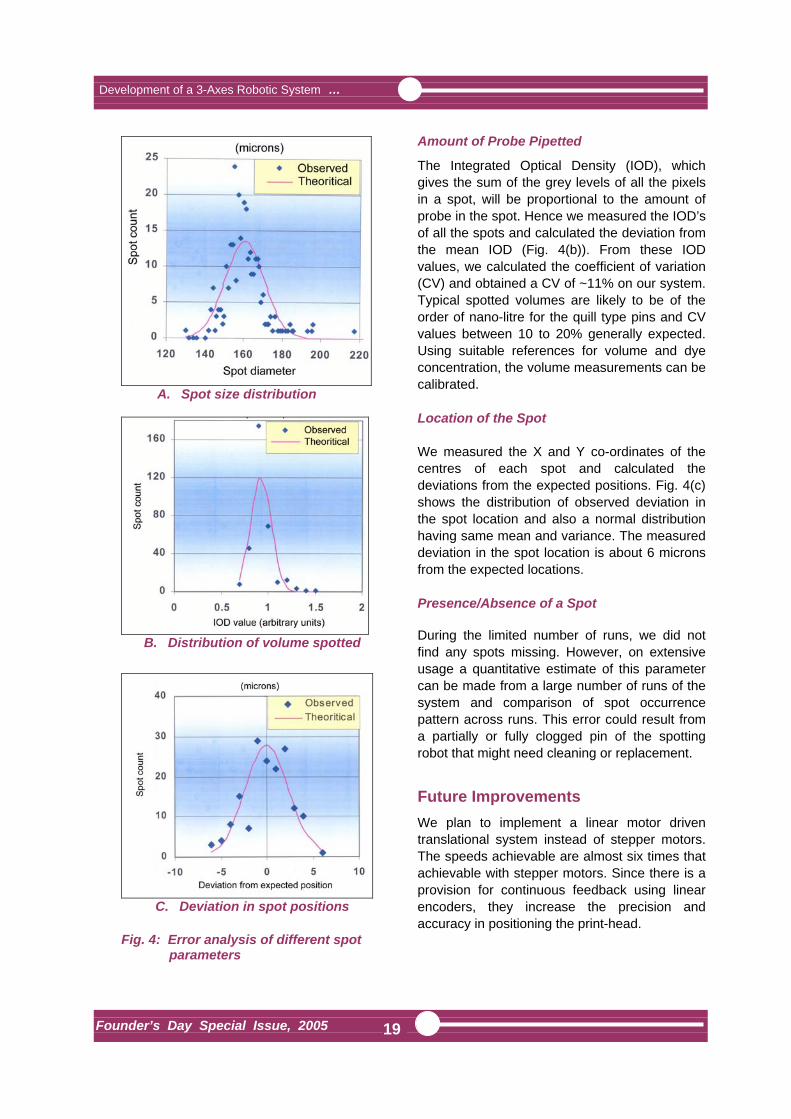
(2) Error analysis Solutions of acridine orange and xylene cyanol dyes (two commonly used dyes for staining DNA) were prepared in 3X SSC buffer and were spotted on clean glass slides as well as on photo quality paper. The slides were imaged under a normal/fluorescence microscope that has a CCD camera attached. Alternately, the photo-paper was scanned on a flatbed scanner at 1200 dpi resolution to obtain a bit map image of the spot pattern. Image analysis of the spots was done using the image processing software Image Pro Plus version 4.1. Various parameters such as area, perimeter, mean diameter, coordinates of the centre, etc. of each spot were measured using this software. The data from a large number of spots was exported Excel® and was analysed further using suitable statistical methods. A typical spot pattern generated with two pins is shown in Fig. 3. The spot pitch has been kept at 500 microns in all these cases. Fig 3(a) shows the pattern produced by the imported spotting pins while Fig. 3(b) shows the pins designed and fabricated by us and the resulting spot pattern Fig. 3(c). All the following parameters were estimated for our system and will be used for defining the confidence limits while interpreting the results from the Microarray experiments. Spot Size The imported spotting pins resulted in a spot diameter of 160 ± 10 microns while pins designed and fabricated by us produced spots having a diameter of 263 ± 25 microns. The observed distribution of the spot diameter as compared to a theoretical distribution having same mean and variance is shown in Fig. 4(a).
(a)
(b)
(c)
Fig. 3: Spot pattern obtained by using imported and BARC-made pins
Development of a 3-Axes Robotic System …
Founder’s Day Special Issue, 2005
19
Amount of Probe Pipetted The Integrated Optical Density (IOD), which gives the sum of the grey levels of all the pixels in a spot, will be proportional to the amount of probe in the spot. Hence we measured the IOD’s of all the spots and calculated the deviation from the mean IOD (Fig. 4(b)). From these IOD values, we calculated the coefficient of variation (CV) and obtained a CV of ~11% on our system. Typical spotted volumes are likely to be of the order of nano-litre for the quill type pins and CV values between 10 to 20% generally expected. Using suitable references for volume and dye concentration, the volume measurements can be calibrated. Location of the Spot We measured the X and Y co-ordinates of the centres of each spot and calculated the deviations from the expected positions. Fig. 4(c) shows the distribution of observed deviation in the spot location and also a normal distribution having same mean and variance. The measured deviation in the spot location is about 6 microns from the expected locations. Presence/Absence of a Spot During the limited number of runs, we did not find any spots missing. However, on extensive usage a quantitative estimate of this parameter can be made from a large number of runs of the system and comparison of spot occurrence pattern across runs. This error could result from a partially or fully clogged pin of the spotting robot that might need cleaning or replacement.
Future Improvements We plan to implement a linear motor driven translational system instead of stepper motors. The speeds achievable are almost six times that achievable with stepper motors. Since there is a provision for continuous feedback using linear encoders, they increase the precision and accuracy in positioning the print-head.
A. Spot size distribution
B. Distribution of volume spotted
C. Deviation in spot positions
Fig. 4: Error analysis of different spot
parameters

Development of a 3-Axes Robotic System …
Founder’s Day Special Issue, 2005
20
Conclusion The Microarrayer developed at Bhabha Atomic Research Centre, Mumbai is an attempt to indigenously develop high-throughput systems required for research in the area of genomics. It is the first of its kind to be developed in India. The 3-axes motion in this microarrayer is highly precise and has a positioning accuracy of the order of microns as measured from the axis movement as well as from the spot locations. We also fabricated pins that produce ~ 250-micron diameter spots. Error analysis of the spotting process is very critical for producing consistent and good quality microarrays and will help in minimizing erroneous results in further processes like hybridisation and scanning.
Various spot parameters that reflect the accuracy of spotting were analysed. Efforts are on to improve the speed and space utilization of the arraying system besides producing better quality spotting pins. References [1] Takashi and Kenjo, Electric motors and their
controls, An Introduction, Oxford science publications, New York, 1990.
[2] David J. Kruglinski, Inside Visual C++ Fourth Edition. Microsoft Press, 1997.
[3] N. Ramakrishnan et al. NGS: A Microarray experiment management system. Project report, EIA-0103660, 2001-2004.
About the authors …
Mr Ratnesh Singh Sengar did his graduation in Electrical Engineering with Honours from Hartcourt Butler Technological Institute, Kanpur, India in 1997. He joined Division of Remote Handling & Robotics, BARC, in 2000. He is associated with the design and development of hardware & software for communication of PC with multiple embedded systems and implementation of digital part of gap card circuit in VHDL. He is involved in the design and development of hardware as well as software for controlling the Microarrayer System. Mr K.D. Lagoo did his B.E. (Mech.) from Sangli and M.E. (Prod.) from VJTI, Mumbai. He joined BARC in 1993 and is presently working at Division of Remote Handling and Robotics. He has been involved in the design, manufacturing and operation of drive mechanisms of In-Service Inspection Systems for nuclear reactor coolant channels. He has also designed the drive mechanism for Microarrayer system. Mr R.K. Puri graduated in Electrical Engineering in 1975 from MS University of Baroda. He joined BARC training school in 1975. He has worked on the development of reactivity control mechanisms, pressure tube gauging equipment and magnet for MHD (Magneto Hydro Dynamics) Project. From 1990 to 1992, he was deputed to Superconducting Super Collider Laboratory, Dallas, Texas, USA and worked on the development of superconducting magnets. Presently, he is heading In-Service Inspection Section at Division of Remote Handling and Robotics and looking after development of Advanced BARCIS (coolant channel inspection system) for 500 MWe
This paper won the Best paper award in 4th International Conference on “Trends in Industrial Measurement & Automation (TIMA-2004)” held during December 16 -18, 2004 at Chennai.

Development of a 3-Axes Robotic System …
Founder’s Day Special Issue, 2005
21
pressurized heavy water reactors and also working on the development of NDT techniques for reactor applications, radiation resistant CCTV camera system for hot cells, micro-arrayer for making DNA chips and X-ray diffractometers.
Mr Manjit Singh is an Outstanding Scientist (OS) in BARC. He is heading the Division of Remote Handling and Robotics of this Centre. He did his graduation in Electrical Engineering with Honours from Punjab University in May 1972. The same year he joined BARC Training School. He is the recipient of Dr. Homi Bhabha award for securing 1st rank in BARC training school. Subsequently he also went on to receive the BARC Technical Excellence award in 1997.He pioneered the development of cable winch type control mechanisms for use in research and power reactors in India. He also developed remotised tools for inspection of coolant channels of 220 MW PHWRs in India. Under his leadership, the Division of Remote Handling & Robotics
completed and delivered a number of items like Robot based liquid scintillation counting system for BARC, Automated eddy current inspection for NPCIL, Delay mechanism assembly automation system for AFK Pune, Automated system for package inspection, storage, retrieval and dispatch for BRIT, Rugged duty manipulators for BARC and Source and product handling systems for KRUSHAK. He took extraordinary initiative to get the first indigenous Teletherapy machine designed and built with help from Panacea Medical Technologies Pvt Ltd, Bangalore. The machine has been installed at the advanced centre for Training, Research & Education in Cancer (ACTREC), Kharghar, Navi Mumbai. He has more than 30 publications of national and international level to his credit.
Mr A.V.S.S. Narayana Rao has done his M.Sc. in Physics from Sri Venkateswara University during 1985-1987 and has been working at the Molecular Biology Division, BARC, since 1989. His doctoral thesis (submitted to the University of Mumbai, 2004) involves the computational analysis of bacterial genome sequences with a view to obtaining evolutionary insights. He is also involved in studies related to the physiology of bacterial growth, particularly at low temperature. He has been associated with the development of microarray related technologies at BARC.

177Lu-DOTMP, 153Sm-DOTMP, 175Yb-EDTMP …..
Founder’s Day Special Issue, 2005
22
177Lu-DOTMP, 153Sm-DOTMP, 175Yb-EDTMP and 186/188Re-CTMP: Novel Agents for Bone Pain Palliation and Their Comparison with 153Sm-EDTMP Sharmila Banerjee, Sudipta Chakraborty, Tapas Das, Kanchan Kothari, Grace Samuel, Meera Venkatesh and M.R.A. Pillai Radiopharmaceuticals Division Bhabha Atomic Research Centre Boby Mathew Radiation Safety Systems Division Bhabha Atomic Research Centre Haladhar D. Sarma Radiation Biology and Health Sciences Division Bhabha Atomic Research Centre and Pradip R. Chaudhari Laboratory Nuclear Medicine Section Bhabha Atomic Research Centre
A b s t r a c t Designing ideal radiopharmaceuticals for use as bone pain palliatives require the use of a moderate energy β- emitter with a stable carrier molecule. Cyclic polyaminophosphonate ligands are known to form complexes with higher thermodynamic stability and kinetic inertness. The present study therefore envisages the use of a few moderate energy β- emitters, viz. 177Lu (T1/2 = 6.71 d, Eβmax= 497 keV), 153Sm (T1/2 = 46.27 h, Eβmax= 810 keV), 175Yb (T1/2 = 4.2 d, Eβmax= 480 keV) and 186Re (T1/2 = 90 h, Eβmax= 1.07 MeV) as the radioisotopes and cyclic polyazamacrocyclic tetramethyl phosphonates namely, 1,4,7,10-tetraazacyclododecane-1,4,7,10-tetramethylene phosphonic acid (DOTMP) and 1,4,8,11-tetraazacyclotetradecane-1,4,8,11-tetramethylene phosphonic acid (CTMP), apart from the widely used ethylenediaminetetramethylene phosphonic acid (EDTMP) for the development of potential bone pain palliation agents. All the radionuclides under investigation can be produced with adequate specific activity using moderate flux reactors. The comparatively longer half-lives of 177Lu, 175Yb and 186Re will provide much needed logistic advantages in countries with limited reactor facilities. In the present study, 177Lu-DOTMP, 153Sm-DOTMP, 175Yb-EDTMP and 186/188Re-CTMP complexes were prepared with high radiochemical purities (>98%) under optimized reaction conditions. All the radiolabeled complexes exhibited excellent stability at room temperature. Their potential for bone pain palliation could be seen from the biodistribution studies carried out in Wistar rats, wherein selective skeletal uptake (1.82-5.23% of injected activity per gram in tibia at 3 h post-injection) with rapid blood clearance and minimal uptake in any of the major organs was observed. Scintigraphic studies carried out in rabbits also demonstrated significant accumulation of activity in skeleton and insignificant retention of activity in other vital organs. A comparison of the biological behaviour exhibited by the radiolabeled phosphonates under investigation with that of 153Sm-EDTMP has also been made in order to find out the efficacy of the developed agents.

177Lu-DOTMP, 153Sm-DOTMP, 175Yb-EDTMP …..
Founder’s Day Special Issue, 2005
23
Introduction
ncidences of bone metastases arising in a large number of patients suffering from breast, lung and prostate carcinoma are on
an increase [1,2]. Intravenous administration of bone seeking radiopharmaceuticals wherein β-
/conversion electron is incorporated constitutes the most suitable modality for palliation of severe pain in patients suffering from bone metastases [1,3-5]. 32P [Eβ(max) = 1.71 MeV, T1/2 = 14.3 d] in the form of sodium orthophosphate [6] was the first radionuclide to be used in bone pain palliation followed by 89Sr [Eβ(max) = 1.40 MeV, T1/2 = 50.5 d] in the form of strontium chloride [7,8]. The major factor in designing effective radiopharmaceuticals for palliative treatment of bone pain is maximizing radiation dose to the bone lesion and minimizing radiation induced bone marrow suppression [9]. Considerable bone marrow suppression due to the presence of higher energy β- particle is the major constraint towards the widespread use of 32P and 89Sr [1,4,10]. The lack of imagable γ photons and long half-life (especially in case of 89Sr) are often sited as drawbacks towards the use of these isotope for bone-pain palliation. 153Sm with its ideally suited decay characteristics, such as, T1/2 = 46.27 h, Eβmax = 0.81 MeV and 103 keV (28%) γ photon [1,10-12] has emerged as an efficient and popular candidate. Additionally, the ease of production of 153Sm in large quantities with adequate radionuclidic purity by neutron activation of even natural samarium is an added advantage [13]. However, in the Indian context, due to logistic reasons, 153Sm with 46.27 h half life needs to be produced in adequately high specific activity for administration of required dose to patients, which in turn necessitates handling of high amount of activity during processing. In this context, 177Lu could be regarded as an attractive alternative radioisotope for bone pain palliation. 177Lu decays with a half life of 6.71 d by emission of β- particles with Emax of 497 keV (78.6%), 384 keV (9.1%) and 176 keV (12.2%) to stable 177Hf [14]. It also emits γ photons of 113 keV (6.4%) and 208 keV (11%) [14], which is ideally suited for imaging the in vivo localization. Although the physical half life of 177Lu is relatively longer (compared to 153Sm or
186Re), it is within reasonable limits for therapeutic purpose and will in addition provide logistic advantages for facilitating supply to places far away from the reactors. 177Lu can be produced in adequate specific activity by irradiation of natural Lu target (176Lu, 2.6%) in moderate neutron flux (~1013 n/cm2/s) owing to the very high reaction cross section (σ = 2100 barns) [14]. In the present work, while various isotopes are being evaluated, we have explored the possibility of the use of 175Yb also as a radionuclide for evaluation of radiopharmaceuticals for bone pain palliation. 175Yb has excellent radionuclidic properties suitable for developing various radiotherapeutic agents [15], and decays by emission of β- particles with Emax of 480 keV to stable 175Lu with a half-life of 4.2 days. 175Yb also emits γ photons of 113 keV (1.9%), 282 keV (3.1%), 396 keV (6.5%) which are suitable for carrying simultaneous scintigraphic studies [14]. Owing to significantly large 174Yb thermal neutron cross section of 69 b [14], it is possible to produce 175Yb adequate specific activity for preparing agents for bone pain palliation using medium flux reactors. The lesser decay loss owing to the comparatively longer half-lives during the preparation and transportation of agents prepared using 177Lu and 175Yb, confers a definite advantage. 186Re, a medium energy β- emitter (Eβmax = 1.07 MeV, Eγ = 155 KeV, [15%]) [14], could be envisaged as an isotope of choice for treatment of skeletal metastases. With the existing facilities at our end it is possible to produce 186/188Re with moderately high specific activity (~7 TBq/g ) without the use of enriched 185Re target. Multidentate aminomethylenephosphonic acids form well-characterized stable complexes with different β- emitting radionuclides and have already proven to be very effective for palliation of bone pain [10,16-21]. Localization of those radiolabeled polyphosphonates in bone is attributed to the affinity of phosphonate group for calcium present in actively growing bones [21-24]. Ethylenediaminetetramethylene phosphonic acid (EDTMP) is one of the most widely used ligands which forms stable complexes with various radionuclides all of which have shown
I

177Lu-DOTMP, 153Sm-DOTMP, 175Yb-EDTMP …..
Founder’s Day Special Issue, 2005
24
high bone affinity and other favorable pharmacological characteristics in biodistribution studies [1,10,12,16,18-21,24]. 153Sm-EDTMP (Quadramet) is now considered to be the most promising radiopharmaceutical for pain palliation due to skeletal metastases. This agent shows excellent pharmacokinetics in both animals and humans, such as preferential localization in bone cancer lesion and rapid excretion of the residual activity via the kidneys [9,25]. Since 177Lu-EDTMP is well documented [18,19,24], we have explored the possibility of complexation of 175Yb with EDTMP. The choice of cyclic polyamino phosphonic acid for the development of potential agents for bone pain palliation is based on the more pronounced thermodynamic stability and kinetic inertness of their lanthanide complexes compared to that of their acyclic analogues [26,27]. Thermodynamic stability of the metalloradiopharmaceutical is a very important aspect as the dissociation of the radiometal from the chelate in blood circulation is a possible eventuality in presence of a variety of competing chelators and metal ions in plasma [9,27]. This may result in the accumulation of radioactivity in non-target organs. Similarly, kinetic inertness also plays a significant role for the in-vivo stability of a metal chelate. While fast dissociation kinetics are characteristics of lanthanide metal complexes of acyclic chelators, an accumulated body of literature has shown that corresponding complexes containing macrocyclic chelators are much more kinetically inert [27]. In this direction we have explored the possibility of labeling macrocyclic α-aminomethylphosphonates viz. DOTMP for labeling with trivalent lanthanides such as 153Sm and 177Lu. However, it has been observed that DOTMP does not complex 186Re as it does 153Sm and 177Lu. This observation could be attributed to the fact that matching of cavity size of the macrocyclic ligand with the ionic radius of the metal ion is essential for complexation [28] as has been demonstrated earlier on the suitability of TETA (1,4,8,11-tetraazacyclotetradecane tetracetic acid) for complexation with Cu(II) ion (ionic radius = 0.72 Aº) and not with Y(III) (ionic radius = 0.93Aº). Therefore, we have synthesised another cyclic tetraphosphonate, 1,4,8,11-tetraazacyclo-
1,4,8,11-tetraaminomethylenephosphonate (CTMP) which is a 14 membered analogue of DOTMP for complexation with 186/188Re. Biodistribution studies of a number of lanthanide phosphonate complexes revealed that poor in-vivo stability leads to accumulation of uncomplexed activity in liver due to the formation of colloidal hydroxides in the physiological pH. It is noteworthy that preparation of 153Sm-EDTMP for routine clinical applications requires a high ligand-to-metal ratio of ~(250-300):1. The large ligand excess is employed to prevent uptake of 153Sm in liver. The presence of excess EDTMP in blood prevents the dissociated 153Sm(III) in the plasma from forming colloidal hydroxide [9,29]. It could be presumed that macrocyclic polyamino phosphonic acids would form highly stable and kinetically inert complex with 153Sm at a considerably lower ligand-to-metal ratio and demonstrate ideal pharmacological characteristics as an agent for bone pain palliation. Materials and Methods Natural lutetium oxide, samarium oxide and ytterbium oxide (spectroscopic grade >99.99% pure) were obtained from American Potash Inc., USA. Natural rhenium metal (spectroscopic grade >99.995% pure) was obtained from Johnson Matthey Company, UK. Ethylene diamine, 1,4,7,10-tetraazacyclododecane (cyclen), 1,4,8,11-tetraazacyclotetradecane (cyclam), orthophosphorus acid, formaldehyde and stannous chloride dihydrate were obtained from Aldrich Chemical Company, USA. All other chemicals were of AR grade and supplied by reputed chemical manufacturers. Whatman 3 MM chromatography paper was used for paper chromatography and paper electrophoresis studies. All the radionuclides were produced by neutron irradiation at the Dhruva research reactor at our Institute. All radioactivity measurements were made using NaI(Tl) scintillation counter. The radionuclidic purity of the isotopes after chemical processing was ascertained by high-resolution γ ray

177Lu-DOTMP, 153Sm-DOTMP, 175Yb-EDTMP …..
Founder’s Day Special Issue, 2005
25
spectrometry using a HPGe detector coupled to a 4 K Multi Channel Analyzer (MCA) system. Energy vs. efficiency calibration of the HPGe detector was carried out using standard 152Eu source obtained from Amersham Inc., USA. A pre-calibrated well type ion chamber was used to measure the activity of the radioisotopes produced on irradiation. FT-IR spectra of the synthesized ligands were recorded in a JASCO FT/IR-420 spectrometer and proton spectra were recorded in a 300 MHz Varian VXR 300S NMR spectrometer using D2O as solvent.
Scintigraphic images were obtained using a single head digital SPECT gamma camera (MPS GE, USA).
Experimental Syntheses of ligands Ethylene diamine tetramethylene phosphonate (EDTMP) was synthesized in our laboratory following a reported procedure [30]. The direct syntheses of cyclic α-aminomethylphosphonic acids, DOTMP and CTMP, were carried out using Mannich type reacti The scheme for the synthesis of DOTMP and CTMP are shown in Figure 1.
Fig. 1. Schemes for synthesis of DOTMP and CTMP

177Lu-DOTMP, 153Sm-DOTMP, 175Yb-EDTMP …..
Founder’s Day Special Issue, 2005
26
For the synthesis of DOTMP, 2.6 g of cyclen (15 mM) and 4.9 g of anhydrous orthophosphorous acid (60 mM) were dissolved in 10 mL of 37% hydrochloric acid and the resulting solution was refluxed. 1.4 mL of 36% formaldehyde was added drop wise to the refluxing solution and the refluxing was continued for another one hour. The reaction mixture was cooled to room temperature and poured in absolute ethanol with vigorous stirring. The crude product (5.95 g, 80%) was recrystallized from aqueous ethanol whereby pure DOTMP was obtained [m. p. 260°C, dec.]. CTMP was synthesized by drop wise addition of 3.4 mL of 36% formaldehyde to a refluxing solution of 2 g of cyclam (10 mM) and 3.2 g of orthophosphorous acid (40 mM) in 10 mL of 37% hydrochloric acid. The refluxing was continued for another 3 h and the reaction mixture was cooled subsequently whereby precipitate formation was observed. The precipitate was filtered, washed with ice cold water and dried. The crude product (4.7 g, 82%) was recrystallized from aqueous methanol to give a crystalline solid [m. p. 220°C, dec.]. Production of radioisotopes 177Lu, 153Sm and 175Yb were produced by thermal neutron bombardment of natural Lu2O3, Sm2O3 and Yb2O3 target, respectively in Dhruva reactor at a flux of 3×10¹³ n/cm2/s for about 7 days. A weighed amount (typically 6 mg) of the metal oxide powder was irradiated. Following irradiation the powder was dissolved in 5 mL of 0.1 M HCl by gentle warming. The resultant solution was evaporated to near dryness and reconstituted in 5 mL of double distilled water. For production of 186/188Re, 5 mg of natural rhenium metal was irradiated in the Dhruva reactor for 7 days at a thermal neutron flux of 3×10¹³ n/cm2/s. The sample was dissolved in 5 mL of 2 M HNO3. 3 mL (1 mg/mL) of this solution was evaporated by heating to dryness in a beaker. 2 mL of 25% ammonia solution was added to the dry residue. Excess ammonia was removed by heating and the ammonium perrhenate residue was dissolved in 5 mL of 5 M NaOH solution. Rhenium activity was extracted into 5 mL of methyl ethyl ketone (MEK) and the
extraction efficiency was estimated by determining the radioactivity in equal aliquots of MEK and aqueous phase. Extraction was repeated with an equal volume of MEK and both the extracts were pooled together. MEK was removed by gentle heating and the residue was dissolved in 5 mL of normal saline. Radionuclidic purity of all the radionuclides produced was ascertained from the γ ray spectrum of an appropriately diluted sample using a HPGe detector coupled to a 4 K MCA system. Radioactive concentration was also measured using the same system following efficiency calibration with a standard 152Eu source. Radioactivity assay of high activity samples was carried out by measuring the ionization current obtained when an aliquot of the batch was placed inside a pre-calibrated well-type ion chamber. Preparation of radiolabeled complexes 177Lu-DOTMP : The 177Lu-DOTMP complex was prepared by dissolving the 2 mg of the ligand in 0.2 mL NaHCO3 buffer (0.5 M, pH 9). To the resulting solutions, 0.1 mL of 177LuCl3 solution (150-250 MBq, ~100 µg of Lu) was added after the addition of 0.7 mL normal saline. The reaction mixture was incubated at room temperature for 15 minutes after adjusting the pH of the resulting mixtures to 7. 153Sm-DOTMP : The 153Sm-DOTMP complex was prepared by dissolving the 1 mg of the ligand in 0.2 mL of 0.5 M of NaHCO3 buffer (pH 9). To the resulting solutions, 0.1 mL of 153SmCl3 solution (150-200 MBq, ~100 µg of Sm) was added after the addition of 0.7 mL normal saline. The reaction mixture was incubated at room temperature for 15 minutes after adjusting the pH to 7. 175Yb-EDTMP : 175Yb-EDTMP complex was prepared by dissolving 10 mg of the ligand in 0.4 mL of 0.5 M of NaHCO3 buffer (pH 9). To the resulting solutions, 0.1 mL of 175YbCl3 solution (80-100 MBq, ~100 µg of Yb) was added after the addition of 0.5 mL normal saline. The pH of the resulting mixture was adjusted to 7 and it was incubated at room temperature for 15 minutes.

177Lu-DOTMP, 153Sm-DOTMP, 175Yb-EDTMP …..
Founder’s Day Special Issue, 2005
27
186/188Re-CTMP: For preparation of 186/188Re-CTMP complex 50 mg of CTMP was dissolved in 0.5 mL of NaHCO3 buffer (0.5 M, pH 9) followed by the addition of 0.3 mL of saline. To the resulting solution 20 µL SnCl2.2H2O solution (in concentrated HCl, 100 mg/mL) and 0.2 mL 186/188ReO4
- (50-350 MBq, ~100 µg Re) were added. The pH of the reaction mixture was adjusted to 2 using 1 M HCl. Finally the reaction mixture was purged with nitrogen for 2 minutes and heated in a boiling water bath for 30 min. Quality control techniques The radiolabeling yields were determined by employing paper chromatography and paper electrophoresis techniques. Paper Chromatography : 5 µL of the test solutions were applied at 1.5 cm from one end of Whatman 3 MM chromatography paper strips (12×2 cm). The strips were developed in suitable solvents, dried, cut into 1 cm segments and activity was measured. Paper Electrophoresis: 5 µL of the complex solutions prepared were applied on pre-equilibrated Whatman 3 MM (35×2 cm) chromatography paper at 15 cm from the cathode. Paper electrophoresis was carried out for 1 h under a voltage gradient of ~10 V/cm using 0.025 M phosphate buffer of pH 7.5. The strips were dried, cut into 1 cm segments and activity was counted. Stability studies The stability of all the complexes was studied at room temperature by determining the radiochemical purities of the complexes at regular time intervals after their preparation by employing standard quality control techniques mentioned above. Biodistribution studies Biodistribution studies of the complexes were performed in Wistar rats weighing 200-300 g. 0.15-0.2 mL (3-4 MBq) of the complex solutions were injected through tail veins and the animals were sacrificed by anesthetizing (using
chloroform) followed by cardiac puncture, at different time intervals post-injection. Three rats were used for each time point. The tissues and the organs were excised and activity associated with organs/tissues was measured in a flat type NaI(Tl) scintillation counter. Distribution of the activity in different organs was calculated as percentage of injected activity per gram of organ. All the biodistribution studies were carried out in strict compliance with the national laws related to the conduct of animal experiments. Imaging studies 150-200 MBq of 177Lu-DOTMP, 153Sm-DOTMP and 186Re-CTMP preparations were injected intravenously into healthy adult New-Zealand white rabbits weighing 3-4 kg through ear vein. Serial scintigrams were taken in a single head digital SPECT gamma camera (MPS GE, USA) using a low energy high-resolution (LEHR) collimator. Sequential images were recorded at 30 min, 1 h, 3 h, 24 h and 48 h post injection. All the images were acquired using a 256×256 matrix with 500 kilocounts with appropriate window settings for the respective radioisotopes. Results and Discussions Characterization of ligands The synthesized ligands were characterized by FT-IR and 1H-NMR spectroscopy. The FT-IR and 1H-NMR spectral data of synthesized ligands are given below. The peak integrations in the 1H-NMR spectrum correspond to the expected number of protons. EDTMP IR (KBr, ν cm-1): 3308, 2633, 2311, 1668, 1436, 1356. 1H-NMR (D2O, δ ppm): 3.55 (d, J = 12.3 Hz, 8H, -N-[CH2-P(O)(OH)2]2), 3.86 (s, 4H, >N-CH2-CH2-N<)]. DOTMP IR (KBr, ν cm-1): 3224, 2853, 1666, 1455, 1216. 1H-NMR (D2O, δ ppm): 3.24-3.32 (s, 8H, -N-[CH2-P(O)(OH)2]2), 3.32-3.44 (s, 16H, >N-CH2-CH2-N<)].

177Lu-DOTMP, 153Sm-DOTMP, 175Yb-EDTMP …..
Founder’s Day Special Issue, 2005
28
CTMP IR (KBr, ν cm-1): 3400, 2984, 2826, 1630, 1487. 1H-NMR (D2O, δ ppm): 2.05-2.07 (m, 4H, >N-CH2-CH2-CH2-N<), 2.91-3.57 (m, 24H, >N-CH2-CH2-CH2-N<, >N-CH2-CH2-N<, -N-[CH2-P(O)(OH)2]2)]). Production of radioisotopes 177Lu : 15–20 GBq (405-540 mCi) of 177Lu activity was obtained at 6 h post EOB from 6 mg of natural Lu2O3 powder irradiated for 7 days at a thermal neutron flux of 3×10¹³ n/cm2/s, corresponding to a specific activity of 3-4 TBq/g (81-108 Ci/g). The radionuclidic purity of 177Lu was ~100% as obtained by analyzing the γ ray spectrum. The major γ peaks observed were at 72, 113, 208, 250 and 321 keV, all of which correspond to the photopeaks of 177Lu [14]. It is worthwhile to note there is a possibility of the formation of 177mLu (T1/2 = 160.5 d) [14] on thermal neutron bombardment of natural Lu2O3 target. However, the γ ray spectrum did not show any significant peak corresponding to 177mLu (at 128, 153, 228, 378, 414 and 418 keV). This is expected as the radioactivity due to 177mLu produced will be too insignificant on 7 d irradiation owing to its long half life and comparatively low cross section (σ=7 barns) for its formation [14]. 153Sm : The yield of 153Sm was around 9.2-10 TBq/g (250-270 Ci/g) at 6 h EOB when natural Sm2O3 was irradiated at a thermal neutron flux of 3×10¹³ n/cm2/s for a period of 7 d. This value is in excess of the theoretically calculated yield of 153Sm (6 TBq/g, 160 Ci/g) under identical irradiation conditions. This could perhaps be attributed to the contribution from epithermal neutrons, which is not accounted in the theoretical calculations [13]. The use of commercially available enriched Sm target (99.2% 152Sm) could yield around 4 fold higher specific activity of 153Sm. However, the specific activity obtained by using natural Sm target is adequate for preparation of agents for bone pain palliation and hence the use of costly enriched target is not essential. The analysis of γ ray spectrum of the processed 153Sm samples
revealed the presence of 154Eu [T1/2 = 8.5 y, Eγ = 123.1 keV (40.5%)], 155Eu [T1/2 = 4.68 y, Eγ = 86.5 keV (32.7%)] and 156Eu [T1/2 = 15.2 d, Eγ = 811.8 keV (10.3%)] [14] as radionuclidic impurities. For the determination of activities of the long-lived impurities such as 154Eu and 155Eu, samples assayed initially for 153Sm were preserved for complete decay of 153Sm (20 T1/2, i.e. around 40 days) and re-assayed for 154Eu and 155Eu. The average radionuclidic impurity burden was found to be 185 Bq (5 nCi) of 154Eu, 3 kBq (81 nCi) of 155Eu and 24 kBq (650 nCi) of 156Eu per 37 MBq (1 mCi) of 153Sm at 6 h post EOB. This implies that the radionuclidic purity of 153Sm at 6 h post EOB is ~99.93%. 175Yb : 1.3-1.5 TBq/g (35-40 Ci/g) of 175Yb activity was obtained at 6 h post EOB after 7 d irradiation at a flux of 3×10¹³ n/cm2/s using natural Yb2O3 target. Irradiation of natural Yb also results in the formation of 169Yb and 177Lu as radionuclidic impurities. The γ photopeaks observed in the γ-ray spectrum of irradiated ytterbium after chemical processing correspond to the γ photopeaks of 175Yb (113, 144, 286 and 396 keV), 169Yb (63, 110, 130, 177, 198, 261 and 307 KeV) and 177Lu (208 and 250 keV) [14]. By analyzing the γ-ray spectra the radionuclidic purity of 175Yb was found to be 96.2% with the presence of 2.1% 169Yb and 1.7% 177Lu as radionuclidic impurities. However, radionuclidically pure 175Yb can be obtained by using enriched target available at reasonable cost. At the same time, the use of enriched target will provide ~3 fold higher specific activity (~ 4.5 TBq/g).] 186/188Re : 6.7-7.4 TBq/g (180-200 Ci/g) of 186/188Re activity was obtained when the radiochemical processing was carried out immediately after end of bombardment (EOB) and it was observed from the radionuclidic purity determination that ~60% of the total activity was in the from of 188Re. On the other hand, it was observed that when the radiochemical processing was done after 3 d of cooling, 1.5-1.85 TBq/g (40-50 Ci/g)) of the 186/188Re activity was obtained out of which only ~13% of the total activity was contributed by 188Re.

177Lu-DOTMP, 153Sm-DOTMP, 175Yb-EDTMP …..
Founder’s Day Special Issue, 2005
29
Characterization of the radiolabeled ligands 177Lu-DOTMP, 153Sm-DOTMP and 175Yb-EDTMP complexes were characterized by employing paper chromatography technique using normal saline as the eluting solvent. It was observed that all the complexes moved towards the solvent front (Rf = 1.0) while uncomplexed radiometals under identical conditions remained at the point of spotting (Rf = 0). The paper electrophoresis patterns in phosphate buffer showed the movement of all the complexes towards anode indicating that they are negatively charged. On the other hand, uncomplexed radiometals did not show any movement from the point of application under identical conditions. On the other hand, characterization of 186/188Re-CTMP complex was carried out by paper chromatography studies in saline as well as acetone. In paper chromatography using acetone as the solvent, the major activity remained at the point of spotting (Rf = 0). An estimation of the unreacted 186/188ReO4
- could be made since, under identical conditions 186/188ReO4
- was found to move towards the solvent front (Rf = 0.9). In paper chromatography using saline as the solvent, the major activity was observed at the solvent front. Since no significant activity at the point of spotting was observed, the absence of hydrolized Re could be inferred. In paper electrophoresis carried out under identical conditions as mentioned above, the 186/188Re-CTMP complex showed a migration towards anode indicating the complex is anionic in nature. The results of paper chromatography and paper electrophoresis were used to ascertain both the yield and radiochemical purity of all the complexes. Optimization studies In order to maximize the complexation yields, several experiments were carried out by varying reaction parameters, such as, ligand concentration, pH of the reaction mixture, reaction time and temperature. The effect of ligand concentration on complexation yield was determined by carrying
out complexation studies at various ligand concentrations. It was observed that >99% complexation yield was obtained by using 2 mg/mL and 1 mg/mL of DOTMP concentrations in case of 177Lu-DOTMP and 153Sm-DOTMP complexes, respectively. In case of 175Yb-EDTMP, the optimum ligand concentration yielding a maximum complexation yield (~98%) was found to be 10 mg/mL. On the other hand, the optimum ligand concentration for 186Re-CTMP complexation was found to be 50 mg/mL. The effect of variation of pH on complexation yields was studied by varying the pH of the reaction mixtures from 2 to 10 using either 0.1 M HCl or 0.1 M NaOH solution. Complexation yields were comparatively lower at the acidic pH and became maximum at pH ~7 for all the lanthanide phosphonate complexes viz. 177Lu-DOTMP, 153Sm-DOTMP and 175Yb-EDTMP. In case of 186Re-CTMP, however, maximum complexation yield (>98%) was obtained at pH 2 and it decreased sharply with increase of pH of the reaction mixture. SnCl2.2H2O was used as the reducing agent for the preparation of 186/188Re-CTMP complex and its concentration was optimized by carrying out complexation using different concentrations of reducing agent keeping other parameters of radiolabeling at the optimized value. The use of 2 mg SnCl2.2H2O was found to be necessary for achieving ~98% complexation. In order to optimize the reaction time and reaction temperature, the reaction mixtures were incubated at various temperatures for different time periods and the complexation yields were determined. It was observed that all the radiolanthanide complexes were formed in excellent yields within 15 min incubation at room temperature. The effect of higher reaction temperature on the complexation yields was not studied as sufficiently high yields were achieved at room temperature. On the other hand, for 186/188Re-CTMP complex, the complexation must be carried out at higher temperature in order to achieve high complexation yield within a reasonable time limit. It was observed that, heating the reaction mixture for 30 min in a boiling water bath yielded >98% complexation.

177Lu-DOTMP, 153Sm-DOTMP, 175Yb-EDTMP …..
Founder’s Day Special Issue, 2005
30
Stability studies The stability of all the radiolabeled phosphonates were studied upto 3 half-lives of the respective radionuclides used for its preparation and it was observed that all the complexes were highly stable at room temperature as no appreciable degradation was observed for any of them within the above said time limit. Biodistribution studies The uptake in the different organs expressed as %ID/g of the organs for all the radiolabeled phosphonate complexes are shown in Table 1-4. The results of the biodistribution studies revealed significant bone uptake within 3 h post-injection. Tibia was taken as a representative of the skeleton and observed uptake in tibia were 4.23%/g, 3.94%/g, 4.37%/g and 1.80%/g for 177Lu-DOTMP, 153Sm-DOTMP, 175Yb-EDTMP
and 186/188Re-CTMP, respectively at 3 h post-injection. Almost all the activity from the blood was cleared at this time point for all the complexes and no significant accumulation of activity was observed in any of the major organs except in kidneys and liver. However, the uptake observed in kidneys and liver were found to reduce with time. ~30-50% of the injected activity was cleared via urinary excretion within 3 h post-injection for all the complexes. No leaching of the activity from bone was observed as there was no increment of the uptake in any of the organs and tissues. It may be possible that the retention of activity could be even higher in metastatic lesion site as compared to normal cells owing to the hypoxic nature of the cells [31]. Thus it is pertinent to evaluate the potential of these radiolabeled phosphonates in metastatic lesion sites.
Table 1: Biodistribution pattern of 177Lu-DOTMP complex in Wistar rats
Organ % ID/g
3 h 1 d 2 d 7 d
Blood 0.01 (0.00) 0.00 (0.00) 0.00 (0.00) 0.00 (0.00)
Liver 0.13 (0.02) 0.07 (0.01) 0.08(0.00) 0.05 (0.02)
Intestine 0.43 (0.19) 0.15 (0.02) 0.13 (0.01) 0.07 (0.02)
Kidneys 0.35 (0.08) 0.26 (0.03) 0.27 (0.03) 0.20 (0.04)
Stomach 0.05 (0.06) 0.00 (0.00) 0.03 (0.02) 0.00 (0.00)
Heart 0.00 (0.00) 0.00 (0.00) 0.00 (0.00) 0.00 (0.00)
Lungs 0.00 (0.00) 0.01 (0.00) 0.00 (0.00) 0.00 (0.00)
Tibia 5.23 (0.77) 5.50 (0.59) 6.54 (0.12) 5.10 (0.05)
Muscles 0.01 (0.00) 0.00 (0.00) 0.00 (0.00) 0.00 (0.00)
Spleen 0.06 (0.02) 0.05 (0.02) 0.00 (0.00) 0.00 (0.00)
Excretion# 47.79 (1.30) 55.99 (1.51) 55.99 (0.95) 59.29 (2.84)
Figures in the parenthesis represents standard deviations At every time point 3 animals had been used #Excretion has been calculated by subtracting the activity accounted in all the organs from the total activity injected

177Lu-DOTMP, 153Sm-DOTMP, 175Yb-EDTMP …..
Founder’s Day Special Issue, 2005
31
Table 2 : Biodistribution pattern of 153Sm-DOTMP complex in Wistar rats
Organ %ID/g
3 h 24 h 48 h
Blood 0.00 (0.00) 0.00 (0.00) 0.00 (0.00)
Liver 0.09 (0.05) 0.08 (0.01) 0.01 (0.00)
Intestine 0.08 (0.05) 0.05 (0.03) 0.08 (0.06)
Kidney 0.27 (0.05) 0.10 (0.02) 0.10 (0.05)
Stomach 0.04 (0.03) 0.02 (0.02) 0.02 (0.02)
Heart 0.00 (0.00) 0.00 (0.00) 0.00 (0.00)
Lungs 0.00 (0.00) 0.00 (0.00) 0.00 (0.00)
Tibia 3.94 (0.50) 3.72 (0.10) 3.72 (0.27)
Muscle 0.00 (0.00) 0.00 (0.00) 0.00 (0.00)
Spleen 0.02 (0.01) 0.00 (0.00) 0.00 (0.00)
Excretion# 40.13 (5.92) 43.46 (4.46) 48.77 (7.28)
Figures in the parenthesis represents standard deviations At every time point 3 animals had been used #Excretion has been calculated by subtracting the activity accounted in all the organs from the total activity injected
Table 3: Biodistribution pattern of 175Yb-EDTMP complex in Wistar rats
Organ %ID/g
3 h 24 h 48 h
Blood 0.03 (0.01) 0.00 (0.00) 0.00 (0.00)
Liver 0.05 (0.02) 0.05 (0.01) 0.05 (0.02)
Intestine 0.01 (0.01) 0.01 (0.01) 0.01 (0.00)
Kidney 0.28 (0.04) 0.19 (0.03) 0.11 (0.01)
Stomach 0.11 (0.01) 0.07 (0.02) 0.05 (0.02)
Heart 0.02 (0.00) 0.00 (0.00) 0.00 (0.00)
Lungs 0.06 (0.02) 0.04 (0.01) 0.03 (0.00)
Tibia 4.37 (0.60) 4.71 (0.21) 4.69 (0.19)
Muscle 0.03 (0.02) 0.01 (0.00) 0.00 (0.00)
Spleen 0.15 (0.07) 0.12 (0.05) 0.09 (0.03)
Excretion# 30.20 (1.58) 28.46 (9.02) 29.13 (5.09)
Figures in the parenthesis represents standard deviations At every time point 3 animals had been used #Excretion has been calculated by subtracting the activity accounted in all the organs from the total activity injected

177Lu-DOTMP, 153Sm-DOTMP, 175Yb-EDTMP …..
Founder’s Day Special Issue, 2005
32
Table 4: Biodistribution pattern of 186/188Re-CTMP complex in Wistar rats Organ %ID/g 3 h 24 h 48 h
Blood 0.05 (0.01) 0.03 (0.02) 0.03 (0.02) Liver 0.04 (0.01) 0.02 (0.01) 0.07 (0.02) Intestine 0.50 (0.22) 0.07 (0.03) 0.10 (0.03) Kidney 0.91 (0.22) 0.30 (0.09) 0.20 (0.03) Stomach 0.20 (0.07) 0.10 (0.03) 0.01 (0.00) Heart 0.00 (0.00) 0.00 (0.00) 0.00 (0.00) Lungs 0.02 (0.01) 0.01 (0.00) 0.00 (0.00) Tibia 1.82 (0.48) 1.31 (0.20) 1.42 (0.22) Muscle 0.03 (0.00) 0.01 (0.01) 0.00 (0.00) Spleen 0.02 (0.01) 0.00 (0.00) 0.00 (0.00) Excretion# 65.84 (6.28) 77.50 (5.69) 73.94 (7.55)
Figures in the parenthesis represents standard deviations At every time point 3 animals had been used #Excretion has been calculated by subtracting the activity accounted in all the organs from the total activity injected
Table 5: Comparison of uptakes of the radiolabeled phosphonates with 153Sm-EDTMP in bone and other major organs in rats
Complex 153Sm-EDTMP
177Lu-DOTMP
153Sm-DOTMP
175Yb-EDTMP
186/188Re-CTMP
Blood 0.002 (0.002) 0.007
(0.002)
0.003 (0.000) 0.027 (0.009) 0.050 (0.008)
Liver 0.027 (0.005) 0.131
(0.022)
0.090 (0.052) 0.052 (0.024) 0.042 (0.005)
Kidney 0.147
(0.022)
0.352
(0.078)
0.269 (0.047) 0.283 (0.041) 0.908 (0.222)
Muscles 0.003 (0.001) 0.008
(0.002)
0.002 (0.001) 0.026 (0.014) 0.028 (0.007)
Bone 3.720 (0.259) 5.230
(0.768)
3.942 (0.480) 4.373 (0.602) 1.823 (0.481)
Bone/Blood 1860.00 747.14 1314.00 161.96 36.46
Bone/Muscles 1240.00 653.75 1971.00 168.19 65.11
Time p.i. 2 h 3 h 3 h 3 h 3 h
Animal strain Sprague-
Dawley
Wistar Wistar Wistar Wistar
Reference 1 Present
study
Present study Present study Present study
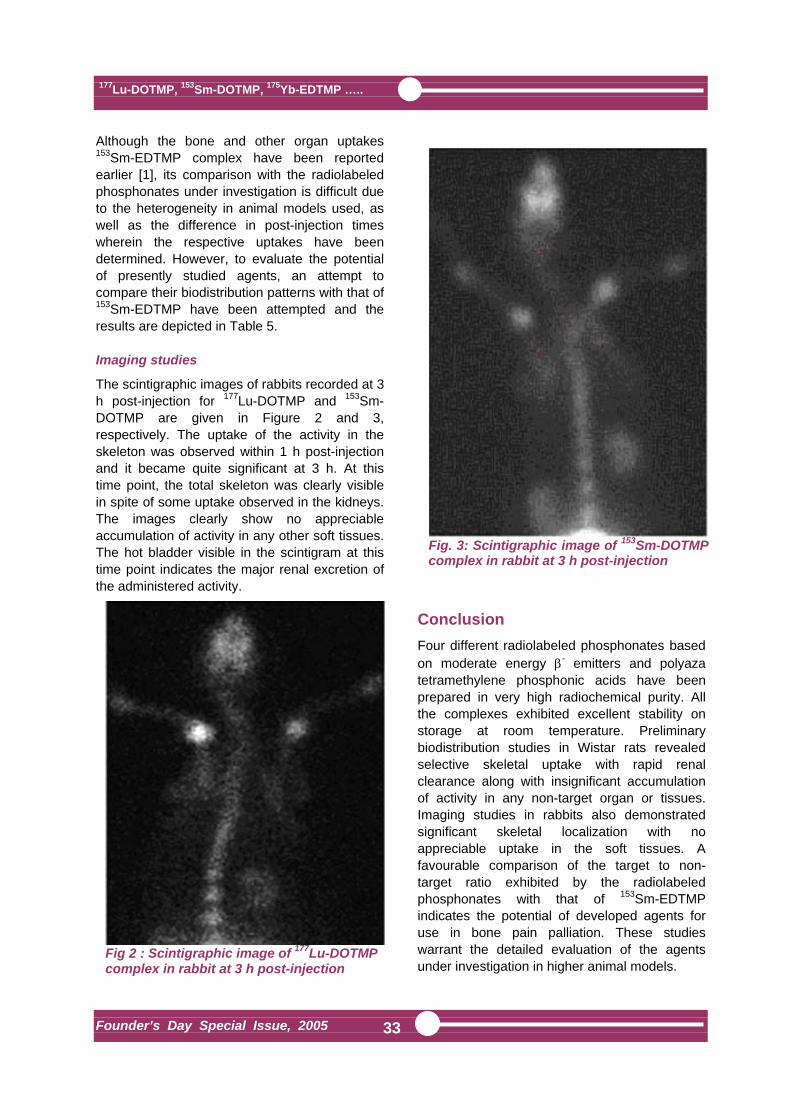
177Lu-DOTMP, 153Sm-DOTMP, 175Yb-EDTMP …..
Founder’s Day Special Issue, 2005
33
Although the bone and other organ uptakes 153Sm-EDTMP complex have been reported earlier [1], its comparison with the radiolabeled phosphonates under investigation is difficult due to the heterogeneity in animal models used, as well as the difference in post-injection times wherein the respective uptakes have been determined. However, to evaluate the potential of presently studied agents, an attempt to compare their biodistribution patterns with that of 153Sm-EDTMP have been attempted and the results are depicted in Table 5. Imaging studies The scintigraphic images of rabbits recorded at 3 h post-injection for 177Lu-DOTMP and 153Sm-DOTMP are given in Figure 2 and 3, respectively. The uptake of the activity in the skeleton was observed within 1 h post-injection and it became quite significant at 3 h. At this time point, the total skeleton was clearly visible in spite of some uptake observed in the kidneys. The images clearly show no appreciable accumulation of activity in any other soft tissues. The hot bladder visible in the scintigram at this time point indicates the major renal excretion of the administered activity.
Conclusion Four different radiolabeled phosphonates based on moderate energy β- emitters and polyaza tetramethylene phosphonic acids have been prepared in very high radiochemical purity. All the complexes exhibited excellent stability on storage at room temperature. Preliminary biodistribution studies in Wistar rats revealed selective skeletal uptake with rapid renal clearance along with insignificant accumulation of activity in any non-target organ or tissues. Imaging studies in rabbits also demonstrated significant skeletal localization with no appreciable uptake in the soft tissues. A favourable comparison of the target to non-target ratio exhibited by the radiolabeled phosphonates with that of 153Sm-EDTMP indicates the potential of developed agents for use in bone pain palliation. These studies warrant the detailed evaluation of the agents under investigation in higher animal models.
Fig 2 : Scintigraphic image of 177Lu-DOTMP complex in rabbit at 3 h post-injection
Fig. 3: Scintigraphic image of 153Sm-DOTMP complex in rabbit at 3 h post-injection
177Lu-DOTMP, 153Sm-DOTMP, 175Yb-EDTMP …..
Founder’s Day Special Issue, 2005
34
Acknowledgements The authors wish to thank Mr. S.V. Thakare and Mr. K.C. Jagadeesan for their valuable help in carrying out the irradiations and Mr. T.P. Unnikrishnan, Radiation Medicine Centre for his helpful support in recording the images of 186/188Re-CTMP complex. The authors also want to record their sincere thanks to the staff members of Veterinary Nuclear Medicine Facility of Bombay Veterinary College and Animal House Facility of Bhabha Atomic Research Center for the imaging studies. 1H-NMR spectral facilities rendered by Regional Sophisticated Instrumentation Centre, Indian Institute of Technology, Mumbai are gratefully acknowledged. References 1. Goeckeler WF, Edwards B, Volkert WA,
Simon J, Winston D. Skeletal localization of samarium-153 chelates: Potential therapeutic bone agents. J Nucl Med 1987;28:495-504.
2. McEwan AJ. Pain from metastatic bone tumors. In: Aktolun C, Tauxe WN, eds. Nuclear Oncology. Berlin-Hiedelberg: Springer-Verlag; 1999: 245-260.
3. Lewington VJ. Cancer therapy using bone seeking radioisotopes. Phys Med Biol 1996;41:2027-2042.
4. Hosain F, Spencer RP. Radiopharmaceuticals for palliation of metastatic osseous lesions: Biologic and physical background. Semin Nucl Med 1992;22:11-16.
5. Deligny CL, Gelsema WJ, Tji TG, Huigen YM, Vink HA. Bone seeking radiopharmaceuticals. Nucl Med Biol 1990;17:161-179.
6. Friedell HL, Storaasli JP. The use of radioactive phosphorus in the treatment of carcinoma of breast with widespread metastases to bone. Am J Roentgenol Radium Ther Nucl Med 1950;64:559-575.
7. Robinson RG, Spicer JA, Preston DF, Wegst AV, Martin NL. Treatment of metastatic bone pain with stroncium-89. Nucl Med Biol 1987;14:219-222.
8. Ackery D, Yardely J. Radionuclide-targeted therapy for the management of metastatic bone pain. Semin Oncl 1993;20:27-31.
9. Volkert WA, Hoffman TJ. Therapeutic radiopharmaceuticals. Chem Rev 1999;99:2269-2292.
10. Ketring AR. 153Sm-EDTMP and 186Re-HEDP as bone therapeutic radiopharmaceuticals. Nucl Med Biol 1987;14:223-232.
11. Lewington VJ. Targeted nuclear therapy of bone metastases. Eur J Nucl Med 1993;20,66-74.
12. Goeckeler WF, Troutner DE, Volkert WA, Edwards B, Simon J, Wilson D. Sm-153: Radiotherapeutic bone agents. Nucl Med Biol 1986;13,479-482.
13. Ramamoorthy N, Saraswathy P, Das MK, Mehra KS, Ananthakrishnan M. Production logistics and radionuclidic purity aspects of 153Sm for radionuclide therapy. Nucl Med Commun 2002;23:83-89.
14. Firestone R. Table of isotopes (Shirley VS eds). 8th ed. New York: John Wiely and Sons; 1996.
15. Chakraborty S, Unni PR, Venkatesh M, Pillai MRA. Feasibility study for production of 175Yb: A potential radionuclide for therapeutic applications. Appl Radiat Isot 2002;57:295-301.
16. Laznicek M, Lazincova A, Budsky F, Prokop J, Kopika K. Comparison of biological characteristics of EDTMP complexes with 99mTc, 111In and 153Sm in rats. Appl Radiat Isot 1994;45:949-953.
17. Hasimoto K. Labelling of aminomethylenephosphonate derivatives with generator- produced 188Re and a study of their stability. Appl Radiat Isot 1999;51:307-313.
18. Ando A, Ando I, Tonami N, et. al. 177Lu-EDTMP: A potential therapeutic bone agent. Nucl Med Commun 1998;19:587-591.
19. Sola GAR, Arguelles MG, Bottazzini DL, et. al. Lutetium-177-EDTMP for bone pain palliation. Preparation, biodistribution and preclinical studies. Radiochim Acta 2000;88:157-161.

177Lu-DOTMP, 153Sm-DOTMP, 175Yb-EDTMP …..
Founder’s Day Special Issue, 2005
35
20. Ando A, Ando I, Tonami N, et. al. Production of 105Rh – EDTMP and its bone accumulation. Appl Radiat Isot 2000;52:211-215.
21. Banerjee S, Samuel G, Kothari K, Unni PR, Sarma HD, Pillai MRA. 99mTc and 186Re complexes of tetraphosphonate ligands and their pharmacological behaviour in animals models. Nucl Med Biol 2001;28:205-213.
22. Jurisson S, Berning D, Jia W, Ma D. Coordination compounds in nuclear medicine. Chem Rev 1993;93:1137-1156.
23. O’Mara RE, Subramanian G. Experimental agents for skeletal imaging. Semin Nucl Med 1972;2:38.
24. Chakraborty S, Das T, Unni PR, et. al. 177Lu labelled polyaminophosphonates as potential agents for bone pain palliation. Nucl Med Commun 2002;23:67-74.
25. Lattimer JC, Corwin LA, Srapleton J, et. al. Clinical and clinicopathologic effects of samarium-153-EDTMP administered intravenously to normal beagle dogs. J Nucl Med 1990;31:586-593.
26. Das T, Chakraborty S, Unni PR, et. al. 177Lu-labeled cyclic polyaminophosphonates as
potential agents for bone pain palliation. Appl Radiat Isot 2002;57:177-184.
27. Liu S, Edwards DS. Bifunctional chelators for therapeutic lanthanide radiopharmaceuticals. Bioconj Chem 2001;12:7-34.
28. Hancock RD, Martell AE. Ligand design for selective complexation of metal ions in aqueous solutions. Chem Rev 1989;89:1875-1914.
29. Louw WK, Dormehl IC, van Rensberg AJ, et. al. Evaluation of samarium-153 and holmium-166-EDTMP in the normal baboon model. Nucl Med Biol 1996;23:935-940.
30. Moedritzer K, Irani RR. Direct synthesis of α-aminomethyl phosphonic acid : mannich type reactions with o- phosphorus acid. J Org Chem 1996;31:1603-1607.
31. Deutsch E, Libson K, Vanderheyden JL. The inorganic chemistry of technetium and rhenium as relevant to nuclear medicine. In: Nicolini M, Bandoli G, Mazzi U, eds. Technetium and Rhenium in Chemistry and Nuclear Medicine. New York: Raven Press; 1989:13-22.
About the authors …
Dr (Ms) Sharmila Banerjee joined the Radiopharmaceuticals Division, BARC, in 1996. Prior to that, she obtained her M.Sc. in Organic Chemistry from the University of Calcutta and Ph.D. degree from Indian Institute of Technology, Mumbai, in 1992. Her current areas of interest include research in the field of radiopharmaceuticals chemistry aiming at the development of new diagnostic and therapeutic radiopharmaceuticals. She is a recognized guide for M.Sc. and Ph.D. degree under the University of Mumbai. She has about 90 publications in international journals including review articles.
This paper was selected for the Best Oral Presentation Award at the International Symposium on Nuclear Oncology held at Porto Alegre, Brazil, January 2004

177Lu-DOTMP, 153Sm-DOTMP, 175Yb-EDTMP …..
Founder’s Day Special Issue, 2005
36
Mr Sudipta Chakraborty is a gold medalist of Jadavpur University (West Bengal) and obtained M.Sc. (Chemistry) in 1997. He graduated from BARC Training School in 1999 (42nd Batch, Chemistry discipline) and joined Radiopharmaceuticals Division, BARC. Since then he has been actively involved in the research and development work on therapeutic radiopharmaceuticals. He has to his credit about 35 publications in various national and international journals. Dr Tapas Das obtained M.Sc. (Chemistry) from Kalyani University (West Bengal) in 1997. After graduating from BARC Training School in 1998 (41st Batch, Chemistry discipline), he joined Radiopharmaceuticals Division, BARC. Since then he has been actively involved in the research and development work on diagnostic and therapeutic radiopharmaceuticals. He has obtained Ph.D. degree in Chemistry from University of Mumbai in 2004. He has published about 40 papers in various national and international journals. Dr (Ms) Kanchan Kothari joined the Radiopharmaceuticals Division (earlier Isotope Division) in 1974 after obtaining her B.Sc. (Chemistry) from Mumbai University. She has been associated with R & D activities in the field of radiopharmaceutical chemistry for the last 30 years. She was awarded the Ph.D. degree (Chemistry) in 1990 for work carried out on immunoassay development. She has worked as a Post Doctoral Research Fellow at the University of Missouri, Columbia (USA) in 1999-2000. She has 70 publications in national and international journals. Dr (Ms) Grace Samuel obtained M.Sc. and Ph.D. in Chemistry from Mumbai University. She joined the Radiopharmaceuticals Division in 1976. She is actively involved in the radiolabeling of various molecules with different diagnostic and therapeutic radioisotopes for use in radiopharmaceuticals. She has been instrumental in the development of radioimmunoassay procedures for several hormones and drugs. She has served as an IAEA expert in thefield of radioimmunoassay. She has published more than 90 papers in several national and international journals. Dr (Ms) Meera Venkatesh joined the Training School of BARC in the year 1976 after completing Bachelor’s Degree in Chemistry from Bombay University. She joined the Radiopharmaceuticals Division in 1977 and has been engaged in the research and development of Radiopharmaceuticals and radiometric assays since then. Dr. Meera obtained her doctorate degree from the Bombay University in 1986 for her work in the field of Radioimmunoassays. She did her post-doctoral fellowship at the University of Missouri, USA, during 1992-94 in the field of therapeutic radiopharmaceuticals and later in 1999 served as a visiting professor at the same university. Currently, Dr.
Meera is heading the Radiopharmaceuticals Division, BARC, and concurrently serves in the capacity of General Manager of Quality Control at the Board of Radiation and Isotope Technology. She has published over 150 papers in the international journals, international and national symposia/conferences and has authored a few invited articles. She has served as an expert in the field of Radiopharmaceuticals and Radiometric assays for the International Atomic Energy Agency.
Dr M.R.A. Pillai is the former Head, Radiopharmaceuticals Division, BARC. He is currently working in the International Atomic Energy Agency (IAEA), Vienna. After graduating from the BARC Training School in 1976 (19th Batch, Chemistry discipline), he obtained his M.Sc. and Ph.D. degree from University of Mumbai. He did his post doctoral research and later worked as a visiting professor at the University of Missouri-Columbia, USA. He has co-authored a book, chapters in several books and has more than 100 publications in international journals.

177Lu-DOTMP, 153Sm-DOTMP, 175Yb-EDTMP …..
Founder’s Day Special Issue, 2005
37
Dr Boby Mathew joined the Radiation Safety Systems Division in 1991 after successful completion of the Health Physicist’s Stipendiary Training Course. He completed his doctorate degree in the field of radiopharmaceuticals in 2003 and is currently working as a post-doctoral fellow at the Thomas Jefferson University, USA.
Dr Haladhar D. Sarma is Head of Laboratory Animal Facility and Radioisotope Laboratory in Radiation Biology and Health Sciences Division, BARC. He obtained M.V.Sc. with distinction from Assam Agricultural University, Guwahati, in 1989. His major research interest concerns radiation carcinogenesis and application of nuclear technology in human and animal health. Prior to joining BARC in 1994, Dr. Sarma was Assistant Professor in the faculty of Veterinary Sciences, Assam Agricultural University. He has published more than 50 publications in various national and international journals.
Dr Pradip R. Chaudhari obtained M.V.Sc. from Bombay Veterinary College, Mumbai, in 1994 and joined Radiation Medicine Centre (RMC), BARC, in 1994. Currently, he is working in Laboratory Nuclear Medicine Section (LNMS) and is actively involved in the bio-evaluation of newer radiopharmaceuticals. He is the receipient of many awards-Young Scientist Award of Indian Society for Nuclear Technology in Animal Sciences, Young Surgeon Award of Indian Society for Veterinary Surgery and BOYSCAST fellowship of Department of Science and Technology, Government of India, to name a few. He has published about 35 papers in various journals.

Novelties of heat shock response in the nitrogen …
Founder’s Day Special Issue, 2005
38
Novelties of Heat Shock Response in the Nitrogen-Fixing Cyanobacterium Anabaena Sp. Strain L-31 Hema Rajaram and Shree Kumar Apte Molecular Biology Division Bhabha Atomic Research Centre
A b s t r a c t Studies on heat shock response in the nitrogen-fixing cyanobacterium, Anabaena sp. strain L-31 revealed the synthesis of several Hsps, many of which were similar to those observed in Escherichia coli in terms of molecular mass. Of the several Hsps synthesised, the 59 and 61 kDa GroEL proteins, which act as molecular chaperones, were found to be the most abundant Hsps. Two-dimensional PAGE analysis indicated the presence of different molecular forms of the GroEL protein, differing not only in their molecular mass but also their isoelectric pH. The GroEL proteins are General stress proteins (Gsps), synthesised under different stress conditions tested. The heat-inducible groEL gene (part of the groESL) operon and cpn60 gene probably codes for the two distinct GroEL proteins, of molecular mass 59 and 61 kDa respectively. These genes have been cloned and characterised from Anabaena L-31. The Hsps of Anabaena, particularly the GroEL proteins, were synthesised throughout the stress period (up to 5 days), were much more stable and accumulated during heat stress. In contrast, the Hsps of E. coli were transiently synthesised, quickly turned over and did not accumulate. This could be responsible for the superior thermotolerance of Anabaena L-31.
Introduction
ransient induction of heat shock proteins (Hsps) in response to temperature upshift is observed in several organisms. Most of
these Hsps are synthesised even under normal growth conditions, albeit at lower rates and play a fundamental role in cell physiology (21, 31). Most prominent among the Hsps are molecular chaperones (such as DnaK, GroEL) and ATP-dependent proteases (such as Lon, ClpB) which help restore homeostasis by either refolding or degradation of denatured proteins (9, 31). In Escherichia coli, the DnaK protein has been implicated in stationary phase induced thermotolerance (24). The clpB mutants of both E. coli and yeast have been shown to be susceptible to extreme temperatures (21, 26). In the unicellular cyanobacterium, Synechococcus sp. strain PCC7942, ClpB and HtpG participate in thermal stress management (12, 27). In contrast, in yeast, induction of high levels of
Hsps did not correlate with thermotolerance (25). Similarly in E. coli, it has been shown that exposure to other stresses such as ethanol and heavy metal resulted in the complete induction of the heat shock regulon without concomitant development of thermotolerance (29). Studies on the heat shock response and thermotolerance of soil bacteria, such as tropical cyanobacteria are important, since they frequently experience long exposures to higher temperatures. In nature, drought and high temperature conditions coexist and their interaction could influence the nature of response of these bacteria to the individual stresses. Cyanobacterial heat shock response has been studied in the strains of Synechococcus (8), Plectonema boryanum and Anabaena sp. strain PCC7120 (7) and Anabaena sp. strain L-31 (6). The GroEL protein (Hsp60) is the most abundantly synthesised cyanobacterial Hsp (3, 6, 7). The GroEL protein occurs in multiple molecular species and is
T

Novelties of heat shock response in the nitrogen …
Founder’s Day Special Issue, 2005
39
induced under different stress conditions (3). In cyanobacteria, two groEL-like genes have been identified (11, 17, 23, 30 and http://www.kazusa.or.jp) which have been shown to be differentially regulated (16, 23). In this study, we have characteised the heat shock response of Anabaena L-31 and identified the basis of its superior thermotolerance. Materials and Methods Organisms and growth conditions. The filamentous, heterocystous, nitrogen-fixing cyanobacterium Anabaena sp. strain L-31 isolated in this laboratory (28) was used in axenic condition. The cells were grown in combined nitrogen-free BG-11 liquid medium [BG-11(N-)], pH 7.0 (10) under continuous illumination (30 µE/m2/s) and aeration (3l/min) at 27°C. Cells were inoculated at a chlorophyll a density of 1µg/ml for all experiments. Heat-shock/stress treatment involved exposure of cells to 42°C under continuous illumination and shaking. Growth was measured in terms of either (i) turbidity (OD750), or (ii) content of chlorophyll a in methanolic extracts as described earlier (20), or (iii) total cellular protein content (19). Wild-type E. coli strain MC4100 was grown in M63 minimal medium at 30°C in an incubator shaker at 100 rpm, prior to heat-stress at 42°C. Cells were inoculated at OD600 of 0.05/ml for all experiments and growth was assessed either as (a) turbidity (OD600) or (b) cfu/ml on solid media (M63 + 1.5% Bactoagar) after overnight growth at 37°C or as total cellular protein content. Thermotolerance and recovery from heat stress. Cells of Anabaena sp. strain L-31 exposed to heat stress for different duration were washed, inoculated in fresh BG-11 (N-) medium at 1 µg chlorophyll a/ml and incubated under control growth conditions for 7 days. Viability of the stressed cells was assessed in terms of increase in turbidity and chlorophyll a, up to 7 days after their return to normal growth conditions. The ability of the heat-stressed cells to recover from heat stress was measured in terms of reappearance of dinitrogenase activity estimated by the acetylene reduction method as
described earlier (5), after 1, 3 and 7 days of incubation under normal growth conditions. Viability of E. coli cells exposed to heat-stress for different duration was measured as cfu/ml after overnight (~20h) growth on solid media under normal growth conditions. Recovery of heat-stressed E. coli cells was estimated in terms of increase in turbidity after 4.5h of growth under normal conditions. The viability and recovery of Anabaena L-31 cells and E. coli cells were compared after 1 and 3 division cycles. In vivo radiolabeling, electrophoresis and autoradiography of proteins. Anabaena sp. strain L-31 cultures were pulse-radiolabeled in vivo with [35S]methionine (48 µCi/ml, specific activity 1000µCi/mmol) during the last 5 min of stress or control growth condition. Proteins were extracted in Laemmli’s buffer, equal amounts of TCA-precipitable radioactivity was added per lane and proteins were resolved by 5-14% polyacrylamide gradient SDS-PAGE, as described earlier (2). The gels were dried at 80°C in a gel drier under vacuum and autoradiographed to visualise the synthesised Hsps. Stability of Hsps. The stability of Hsps was evaluated by a pulse-chase experiment. Cells heat stressed for 1h were radio-labeled for 5 min and samples withdrawn for visualisation of Hsps. Cultures were then supplemented by the addition of 1000-fold excess (17 mM)of non-radioactive methionine and allowed to grow either at 27°C or at 42°C for 24h to detect persistence/disappearance of pre-synthesised Hsps. Western blotting and immunodetection. Proteins were extracted from Anabaena sp. strain L-31 and E. coli cells, resolved by 10% polyacrylamide linear SDS-PAGE and electroblotted on to positively charged nylon membranes (Roche Diagnostics, Germany), as described previously (1). Immunodetection was carried out using anti-GroEL antiserum raised in rabbit against the purified GroEL protein of E. coli. Anti-rabbit IgG conjugated to alkaline phosphatase (Roche Diagnostics, Germany) was used as the secondary antibody and detected using 5-bromo, 4-chloro, 3-indolyl

Novelties of heat shock response in the nitrogen …
Founder’s Day Special Issue, 2005
40
phosphate (X-phos) and Nitro blue tetrazolium chloride (NBT) as chromogenic substrates, as per the manufacturer's protocol. Northern Blotting and hybridisation. RNA was prepared from Anabaena as described earlier (4). Total RNA (7µg per lane) was electrophoretically resolved on 1.2 % agarose gels prepared in 0.2M MOPS (3-[N-Morpholino]-2-hydroxypropanesulphonic acid) buffer at pH 7.0 and containing 50 mM sodium acetate, 10 mM EDTA and 3.1% formaldehyde, for 4h at 30 V with recirculation of buffer and capillary blotted on to nylon membranes. Hybridisation was carried out at 50°C with digoxigenin-labelled Anabaena L-31 groEL DNA probe in High-SDS Buffer (Roche Diagnostics, GmBH). Results Exposure of Anabaena sp. strain L-31 to heat stress (42°C) for 7 days resulted in complete cessation of growth. No measurable growth was detected as compared to the control cultures (27°C). Complete loss of nitrogenase activity was also observed within 6h of heat stress.
Growth of E. coli strain MC4100, measured in terms of turbidity in M63 minimal medium, was inhibited after 2-3 doublings at 42°C compared to control (30°C) and came to a complete halt after 6h (data not shown). Anabaena cells heat-stressed for 1,3 and 7 days were washed, inoculated in fresh medium at 1µg chlorophyll a/ml and returned to normal growth conditions. No significant loss of viability was seen in cells heat-stressed for 3 days (Table 1). In cells heat-stressed for 7 days about 45% loss in viability was seen on day 1. However, they recovered well to attain up to 83% growth after 7 days of recovery at 27°C (Table 1). This shows that effects of heat stress are bacteriostatic and reversible. In comparison, heat stressed E. coli strain MC4100 cells showed a major loss of viability. Cells heat shocked for 3h exhibited 30% while those exposed for 4.5h or more showed complete loss of viability (Table 1). This clearly indicated that Anabaena L-31 cells exhibit superior thermotolerance than E. coli in terms of recovery from heat stress. Further, thermotolerance of Anabaena was impaired by pre-treatment with osmotic stress.
Table 1: Viability of heat-stressed Anabaena and E. coli cells. Anabaena and E. coli cells were incubated either at control growth temperatures (27°C and 30°C respectively) or heat-stressed at 42°C as indicated. Heat-stressed Anabaena and E. coli cells were inoculated in fresh growth media and incubated under normal growth conditions. Viability was assessed in terms of turbidity (OD750) for Anabaena after 7d at 27°C and as cfu/ml for E. coli at 37°C overnight or till the colonies were detected on agar plates. The values are mean of three replicates; variation from the mean was less than 10%. The results are representative of three similar independent experiments.
* The 100% values correspond to OD750 of 0.393 for Anabaena and 1 X10⁸ cfu/ml for E. coli.
Duration of heat stress applied
_________________ E. coli Anabaena
Number of cell divisions (control cells)
Anabaena cells (% viability)
E. coli cells (% viability)
0h 0d 0 100.00* 100.00*
1h 1d 0 100.56 90.00
3h 3d 1.5 99.52 70.10
4.5h 7d 3 83.07 5.05

Novelties of heat shock response in the nitrogen …
Founder’s Day Special Issue, 2005
41
The recovery of diazotrophic growth from heat stress was always preceded by restoration of nitrogen fixation. Cells heat stressed for 1 day were able to recover their dinitrogenase activity to that of control levels within 1 day. However, cells heat stressed for 7 days recovered only 59% dinitrogenase activity by day 3 and reached
a maximum recovery of 78% after 7 days of growth at 27°C (Fig. 1b). The heat-stressed cultures showed a lag in growth (Fig. 1a) proportionate to the recovery of the dinitrogenase activity in the corresponding culture (Fig. 1b).
Recovery time at 37°C (h)
Recovery time at 27°C (days)
Chl
orop
hyll
a co
nten
t (µg
/ml)
D
initr
ogen
ase
activ
ity
(nm
ol C
2H2 r
educ
ed (µ
g ch
la)-1
min
-1
Turb
idity
(OD
600)
Fig. 1 : Recovery of heat stressed Anabaena and E. coli cells. (a and b) Anabaena cells heat
stressed for 0 ( ), 1 ( ), 3 ( ) and 7 ( ) days were inoculated in fresh BG-11, N- medium at 1µg chlorophyll a/ml and incubated at 27°C for 7 days. Recovery was measured in terms of (a) chlorophyll a content and (b) dinitrogenase activity. (c) E. coli strain MC4100 cells exposed to heat-stress (42°C) for 0 ( ), 1 ( ), 3 ( ) and 4.5h ( ) were inoculated in fresh M63 minimal medium and incubated at 37°C for 6h ( ). Recovery was measured in terms of turbidity at 600 nm (OD600). The values are mean of three replicates; variation from the mean was less than 10%. The results are representative of three similar independent experiments.
Recovery time at 27°C (days)

Novelties of heat shock response in the nitrogen …
Founder’s Day Special Issue, 2005
42
Heat-shock resulted in the synthesis of at least 14 Hsps in Anabaena L-31 over a 5h period (Fig. 2). These could be classified into 3 classes based on their kinetics of synthesis: (i) Early Hsps which were induced within 5-15 min of heat shock and declined thereafter (23, 34, 40, 70, 96 and 100 kDa). (ii) Late Hsps which were induced maximally at 1h of stress and declined after 3h (16, 21 and 38 kDa). (iii) Long term Hsps induced within 5-15 min of heat shock and
continued to be synthesised throughout the stress period (10, 24, 59, 61 and 98 kDa). We have earlier identified two of these Hsps (59 and 61 kDa) as GroEL proteins by immunodetection (3, 22). In Anabaena synthesis of several Hsps, especially the GroEL proteins, was sustained at higher rates than control even after 5 days of heat stress (Fig. 3), in contrast to most bacteria the Hsps are only transiently synthesised (18).
Fig. 2 Modification of protein synthesis during heat-shock in Anabaena. Three day-old mid-logarithmic phase culture of Anabaena was exposed to 42°C for different durations as indicated. Cells were radiolabeled in vivo with [35S]methionine during the last 5 min of heat stress or control growth condition. Protein extracts containing equal TCA-precipitable radioactivity were subjected to 5-14% poly acrylamide SDS-PAGE followed by autoradiography of the dried gel. Molecular mass of some of the Hsps have been indicated on the right hand side. Prominent repressed proteins are shown with arrow heads on the left hand side of lane 1. The results are representative of three similar independent experiments.
Fig.3 Protein synthesis during
prolonged heat-stress in Anabaena. Three day-old mid-exponential phase culture of Anabaena was exposed to 42°C for 5 days and aliquots removed at required time points. Cells were radiolabeled in vivo with [35S]methionine during the last 5 min of heat stress or control growth condition. Other details were as described in Fig. 2.

Novelties of heat shock response in the nitrogen …
Founder’s Day Special Issue, 2005
43
The stability of Hsps in Anabaena L-31 was investigated by conducting pulse-chase experiment. Of the several Hsps detected after 1h of heat-shock, five Hsps (10, 59, 61, 70 and 98 kDa) were found to be stable even after 24h of continued incubation at 42°C (Fig. 4, lane 3) or control conditions (data not shown).
Of the two GroEL proteins (59 and 61 kDa) synthesised during heat-shock, the 59 kDa GroEL protein was found to accumulate to significant levels in Anabaena L-31 under prolonged and continuous heat stress (Fig. 5a). The 61 kDa GroEL also accumulated during this period, but at much lower levels (Fig. 5a). On the other hand, the 58 kDa GroEL protein of E. coli was significantly enhanced within 5 min of heat-shock, but its content rapidly decreased thereafter (Fig. 5b).
Fig. 4 Stability of heat shock proteins
in Anabaena. Three-day-old Anabaena culture was exposed to heat-shock for 1h at 42°C. Control, 27°C (lane 1) and heat-shocked, 42°C (lane 2) cells were radiolabeled in vivo with [35S]methionine for 5 min at the end of 1h stress. Subsequently 1000-fold excess (17 mM) methionine was added and cultures were continued to be incubated for the next 24h at 27°C (control) or at 42°C (heat-stressed). Proteins were extracted prior to and 24 h after the cold-chase at 42°C (lane 3) or at 27°C (lane 4). The six most stable proteins (10, 38, 59, 61, 70 and 98 kDa) have been marked on the right hand side. Other details were as described in Fig. 2.
Fig. 5 Synthesis and accumulation of GroEL in Anabaena and E. coli. (a) Three-day-old Anabaena sp. strain L-31 cells were inoculated into fresh BG-11(N-) medium and incubated either at 27°C (control) or at 42°C (heat stress) for 5 days. Proteins extracted from these cultures at the end of day 1, day 3 and day 5 were subjected to 8% polyacrylamide SDS-PAGE followed by Western blotting and immunodetection with anti-GroEL antibody. The two cross-reacting polypeptides and their molecular mass have been marked on the right hand side. The various lanes contained protein extracts (200 µg) from different samples as shown. (b) E. coli strain MC4100 cells were inoculated in M63 minimal medium and incubated at either 30°C or at 42°C. Proteins were extracted after appropriate duration of exposure to heat stress and subjected to electrophoresis on a 10% SDS-polyacrylamide gel. The various lanes contained protein extracts (10 µg) from different samples as shown. Other details were as described in Fig. 2.

Novelties of heat shock response in the nitrogen …
Founder’s Day Special Issue, 2005
44
The two groEL-like genes encoding the 59 and 61 kDa GroEL proteins have been cloned from Anabaena L-31. They correspond to the groESL operon (17, Gen Bank Acc. No. AF 324500) and cpn60 gene (Gen Bank Acc. No. AY328922). The GroEL protein of Anabaena L-31 showed 60% homology to the Cpn-60 protein, the N-terminal region showing greater homology than the C-terminal region (Fig. 6). Homology of the
GroEL and Cpn-60 proteins of Anabaena L-31 with cynaobacterial GroEL and Cpn-60 proteins is given in Table 2. Alignment of the promoter regions of the two groEL-like genes of Anabaena L-31 showed that both had CIRCE element (Fig. 7). However, two basic differences were observed (i) absence of a putative sigma-70-like promoter and (ii) indirect and direct repeats preceding the groEL promoter upstream of the cpn-60 gene.
1 MAKRIIYNENARRALERGIDILAEAVAVTLGPKGRNVVLEKKYGAPQIVNDGVTIAKEIE *** * * ******* ** ** ********* ****** ******* * ***** 1 MAKIISFDEESRRALERGVNALADAVKITLGPKGRNVLLEKKYGTPQIVNDGITVAKEIE 61 LEDHIENTGVALIRQAASKTNDVAGDGTTTATVLAHAIVKEGLRNVAAGANAILLKRGID *** **** ** **** ************* * **** ***** * ****** 61 LEDPLENTGARLIQEVASKTKDVAGDGTTTATVLVQALIKEGLKNVAAGINPVSLKRGID 121 KATNFLVDRIREHARSVEDSKAIAQVGAISAGNDDEVRQMIAEALDKVGKEAVISLEEGK * * ** * * ** * ***** ***** ** ***** * * ** ** * 121 KTTEALVEEIAKVAKPVEGS.AIAQVATVSAGNDEEVGGMIAEAVERVTKDGVITVEESK 181 SVTTELEVTEGMRFDKGYISPYFATDPERMEAIFDEPFLAVDDKQIALVQDLVPVLEPVA * **** * *** * ******* * ** ** * * ***** ** 180 SLTTELDVVEGMHIDRGYISPYFITNNERQTVELENARILITDKKINSIQELVPVLKKVA 241 RAGRPLVIIAEDIEKEALATLVVNRLRGVLNVAAVKAPGFGDRRKAMLEDIAILTGGQLI * * ** * *** * ******** **** *** ****** **** * ****** **** 240 RLGQPLLIVAEDVEGDALATLVVNKARGVLSVAAIKAPGFGERRKALLQDIAILTDGQLI 301 TEDAGLKLDNTKLDSLGKARRITITKDSTTIVAEGNDVAVKARVE.QIRRQMEETESSYD * ** ** * * ** *** * ***** *** * *** * ** 300 SEEIGLSLDTASIDALCTARTITIDKENTTIVAGTTTKPEIQKRIGQIRKQLEETDSEYD 360 KGKLQERLAKLSGGVAVVKVGAATETEMKDKKLRLEDAINATKAAVEEGIVPGGGTTLAH * ***** *** ** ** **** *** ** *** * * ******* * * **** ** 360 KEKLQERIAKLAGGIAVIKVGAVPETELKDRKLRIENALNATKAAVAESIGPGGGKTLIY 420 LTPELEAWANSTLKDEELTGALIVARALPAPLKRIAENAGQNGAVIAERVKEKEFNVDFN * ** ** ** *** *** ** *** * ** *** *** * 420 LASKVDPIKAYFEE.EEKIGADIVKRALEAPLRQIADNAGEEGSVIVSRVKDSDFNVGYN 480 AATNEFVDMFSAGIVDPAKVTRSALQNALSYACMVLTTGTVVDKPEPKDAAPAGVGGGGG *** ** * *** ***** ******* * * **** * * * * ** 479 AATGEFEDLIAAGIIDPAKVVRSALQNAASIAGLVLTTEAIVVEKPEKKPAVPADPGMGG 540 DFDY 539 MGMGGMGGMGGMGGMGMF
Fig. 6. Comparison of GroEL and Cpn-60 proteins of Anabaena L-31. The upper line
corresponds to groEL and the lower line to Cpn-60. The * mark indicates similar aminoacids.
Table 2 : Comparison of the homology of the GroEL and Cpn-60 proteins of Anabaena L-31 with GroEL and Cpn-60 proteins of other cyanobacteria Anabaena
L-31 GroEL
Anabaena L-31 Cpn-60
Anabaena 7120 GroEL
Anabaena 7120 Cpn-60
Synechocystis 6803 GroEL
Synechocystis 6803 Cpn-60
Anabaena L-31 GroEL
100%
60%
93%
63%
82%
63%
Anabaena L-31 Cpn-60
60%
100%
63%
92%
65%
72%

Novelties of heat shock response in the nitrogen …
Founder’s Day Special Issue, 2005
45
Northern blotting and hybridisation analysis using Anabaena groEL probe revealed a single transcript of 2.3 kb (Fig. 8). The 2.3 kb transcript could barely be detected after 5-15 min of heat-shock, increased thereafter to reach a maximal level between 30-60 min and declined thereafter. No transcript could be detected either at 27°C or after 24h at 42°C. Identical results were obtained when the groES gene was used as a probe. This clearly established that the groES and the groEL genes of Anabaena L-31 are part of a bicistronic operon and are induced upon heat-shock. Discussion Cyanobacteria are exposed to long duration of high temperatures in tropical conditions and their survival in such environments depends not only on their ability to endure such high temperatures but also to recover after return to normal growth conditions. This requires the synthesis of Hsps, many of which function either as molecular chaperones or as proteases (31). Some of the
Fig. 7. Comparison of the promoter region of (a) groEL and (b) cpn60 gene. The
CIRCE element has been indicated in a box. The putative –10 and –35 region of groEL promoter has been indicated. The several direct and indirect repeats present upstream of the groEL promoter have been indicated by arrows.
Fig 8. Northern blot and hybridisation of
Anabaena RNA with a groEL-specific gene probe. RNA samples (7µg per lane) from different time points were electrophoretically resolved on 1.2 % agarose gel prepared in MOPS buffer containing 3.1% formaldehyde. Electrophoresis was carried out at 30 V for 4 hrs with recirculated MOPS buffer. The different lanes contained RNA from: Control (27°C) 0 min (lane 1) and 24h (lane 9); and cultures heat shocked at 42°C for 5 min (lane 2), 15 min (lane 3), 30 min (lane 4), 1h (lane 5), 3h (lane 6), 6h (lane 7), and 24h (lane 8). The arrow on the right hand side indicates the transcript size.

Novelties of heat shock response in the nitrogen …
Founder’s Day Special Issue, 2005
46
Hsps, such as DnaK, ClpB and HtpG have been attributed a role in thermotolerance (12, 21, 24, 26, 27). However, there are also contradicting reports, which suggest that synthesis of Hsps may not be concomitant with the development of thermotolerance (8, 9). The GroEL protein has been found to be essential for bacterial growth even at 20°C (28). GroEL proteins have been shown to play a role in the expression and assembly of the nitrogenase proteins in Klebsiella pneumoniae by stabilising the Nif A protein, the thermolabile transcriptional activator of nif operons (15) and in Bradyrhizobium japonicum by post translational processing of nitrogenase proteins (14). Of the two groEL-like genes (groEL and cpn60), the heat-inducible groEL allows growth at higher temperature and is involved in the formation of active Rubisco complexes (16) in cyanobacteria. The present work demonstrates that the nitrogen-fixing Anabaena L-31 shows superior thermotolerance compared to that of E. coli. This appears to be due to (i) continuous synthesis of Hsps through prolonged heat stress, (ii) high stability of Hsps during heat stress, (iii) accumulation of GroEL proteins during prolonged heat stress and (iv) presence of more than one molecular form of GroEL (GroEL and Cpn-60). They are also able to recover their ability to fix nitrogen within 1 day after prolonged exposure to high temperature. Anabaena L-31 responded to temperature upshift by synthesising several Hsps, two of which were identified as GroEL proteins. The corresponding genes were cloned and characterised. The groEL gene coding for the 59 kDa GroEL protein was found to be heat-inducible by Northern blot analysis which agreed with Western blotting immunodetection data. The 61 kDa GroEL is possibly coded by the cpn60 gene and may be preferentially expressed under other stress conditions. The 61 kDa protein has been shown to accumulated during osmotic stress (data not shown). Thus, the two groEL genes of Anabaena L-31 are differentially regulated and may play the role of general stress protein in cyanobacterial cell physiology.
Acknowledgements We wish to thank Prof. Koreaki Ito, Institute for Virus Research, Kyoto University, Kyoto, Japan for kindly providing the antiserum against purified GroEL from E. coli. References 1. Alahari A., and Apte. S.K. 1998. Pleiotropic
effects of potassium deficiency in a heterocystous, nitrogen-fixing cyanobacterium, Anabaena torulosa. Microbiol 144: 1557-1563.
2. Apte S.K. and. Bhagwat. A.A 1989. Salinity stress-induced proteins in two nitrogen-fixing Anabaena strains differentially tolerant to salt. J Bacteriol 171: 909-915.
3. Apte S.K., Fernandes T. Badran H., and. Ballal. A 1998. Expression and possible role of stress-responsive proteins in Anabaena. J Biosci 23: 399-406.
4. Apte S. K. and Haselkorn. R. 1990. Cloning of salinity stress-induced genes from the salt tolerant nitrogen-fixing cyanobacterium Anabaena torulosa. Plant Mol. Biol. 15: 723-733.
5. Apte S.K., Reddy B.R., and Thomas J. (1987) Relationship between sodium influx and salt tolerance of nitrogen-fixing cyanobacteria. Appl. Environ. Microbiol. 53: 1934-1939.
6. Bhagwat AA, and Apte S.K. (1989) Comparative analysis of proteins induced by heat-shock, salinity and osmotic stress in the nitrogen-fixing cyanobacterium Anabaena sp. strain L-31. J Bacteriol 171: 5187-5189.
7. Blondin P.A., Kirby R.J., Barnum S.R. (1993) The heat shock response and acquired thermotolerance in three strains of cyanobacteria. Current Microbiol 26: 79-84.
8. Borbely G, Suranyi G, Korcz A and Palfi Z. (1985) Effect of heat shock on protein synthesis in the cyanobacterium Synechococcus sp. strain PCC6301. J Bacteriol 161: 1125-1130.
9. Bukau B and Horwich (1998) The Hsp70 and Hsp60 chaperones machines. Cell 92: 351-366.

Novelties of heat shock response in the nitrogen …
Founder’s Day Special Issue, 2005
47
10. Castenholz R.W. (1988) Culturing of cyanobacteria. Methods Enzymol 167: 68-93.
11. Chitnis P.R and Nelson N. (1991) Molecular cloning of the genes encoding two chaperone proteins of the cyanobacterium Synechocystis sp. PCC6803. J. Biol. Chem. 266: 58-65.
12. Eriksson M.J., Clarke A.K. (1996) The heat shock protein ClpB mediates the development of thermotolerance in cyanobacterium Synechococcus sp. strain PCC 7942. J Bacteriol 178: 4839-4846.
13. Fayet O, Zeigelhoffer T., Georgopoulos C. (1989) The groES and groEL heat shock gene products of Escherichia coli are essential for bacterial growth at all temperatures. J Bacteriol 171: 1379-1385.
14. Fischer HM, Schneider K, Babst M and Hennecke H. (1999) GroEL chaperonins are required for the formation of a functional nitrogenase in Bradyrhizobium japonicum. Arch Microbiol 171: 279-289.
15. Govezensky D, Greener T, Segal G and Zamir A. (1991) Involvement of GroEL in nif gene regulation and nitrogenase assembly. J Bacteriol 173: 6339-6346.
16. Kovacs E, van der Vies SM, Glatz A, Torok Z, Varvasovszki V, Horvath I, Vigh L (2001) The chaperonins of Synechocystis PCC 6803 differ in heat inducibility and chaperone activity. Biochem Biophys Res Commun 289:908-915.
17. Lehel C., Los D., Wada H., Gyorgei J., Horvath I., Kovacs E., Murata N and Vigh L. (1993) A second groEL-like gene, organised in a groESL operon is present in the genome of Synechocystis sp. PCC6803. J Biol Chem 268: 1799-1804.
18. Lemaux P.G, Herendeen S.L, Bloch P.L, and Neidhardt F.C. (1978) Transient rates of synthesis of individual polypeptides in Escherichia coli following temperature shifts. Cell 13: 427-434.
19. Lowry O.H., Rosebrough N.J., Farr A.L and Randall R.J. (1951) Protein Measurement with the folin phenol reagent. J Biol Chem 192: 265-275.
20. Mackinney G. (1941) Absorption of light by chlorophyll solutions. J Biol Chem 140: 315-322.
21. Parsell D.A. and Lindquist S. (1994) Heat shock proteins and stress tolerance. In: Morimoto RI, Tessiers A, Georgopoulos C (eds) The Biology of heat shock proteins and molecular chaperones. Cold Spring Harbor Laboratory press. pp 457-494.
22. Rajaram H and Apte S.K. (2003) Heat-shock response and its contribution to thermotolerance of the nitrogen-fixing cyanobacterium Anabaena sp. strain L-31. Arch. Microbiol. 179: 423-429.
23. Rajaram H, Ballal A.D., Apte S.K., Wiegert T and Schumann W. (2001) Cloning and characterization of the major groESL operon from a nitrogen-fixing cyanobacterium Anabaena sp. strain L-31. BBA-Gene Structure and Function 1519: 143-146
24. Rockabrand D, Levers K, Austin T, Kaiser R, Jensen D, Burgess R and Blum P (1998) Role of DnaK and RpoS in starvation induced thermotolerance of Escherichia coli. J Bacteriol 180: 846-854.
25. Smith B.J., and Yaffe M.P. (1991) Uncoupling thermotolerance from the induction of heat shock proteins. Proc Natl Acad Sci, USA 88: 11091-11094.
26. Squires C.L., Pedersen S., Ross B.M. and Squires C (1991) ClpB is the Escherichia coli heat shock protein F84.1. J Bacteriol 173: 4254-4262.
27. Takara N and Nakamoto H (1999) HtpG is essential for the thermal stress management in cyanobacteria. FEBS Letters. 458: 117-123.
28. Thomas J (1970) Absence of the pigments of photosystem II of photosynthesis in heterocysts of a blue-green alga. Nature (London) 228: 181-183.
29. VanBogelen R.A., Acton M.A. and Neidhardt F.C. (1987) Induction of heat shock regulon does not produce thermotolerance in Escherichia coli. Genes & Dev 1: 525-531.
30. Webb R, Reddy KJ and Sherman L.A. (1990) Regulation and sequence of the Synechococcus sp. strain PCC7942 groESL operon, encoding a cyanobacterial chaperonin. J Bacteriol 172: 5079-5088.
Novelties of heat shock response in the nitrogen …
Founder’s Day Special Issue, 2005
48
31. Yura T, Kanemori M and and Morita MT (2000) The heat shock response: Regulation and function. In Storz G, Hengge-Aronis R (eds) Bacterial stress responses. pp 3-18.
GenBank Accession Nos. 1. Rajaram, H., Apte, S.K., Wiegert, T. and W.
Schumann (2000) Anabaena sp. strain L-31
groESL operon, complete sequence. Submitted to GENBANK, Accession No. AF324500.
2. Rajaram, H. and S.K. Apte (2003) Anabaena sp. L-31 cpn60 gene, complete sequence. Submitted to GENBANK, Accession No. AY328922.
About the authors …
Ms Hema Rajaram obtained her Master’s Degree in Biotechnology from Jawaharlal Nehru University, Delhi, in 1993. She joined BARC through 38th batch of Training School and was a Homi Bhabha Awardee. Her research interests relate to characterisation of the response of nitrogen fixing cyanobacteria to heat and ionising radiation stresses. She is a recipient of Prof. V.C. Shah Award for best platform presentation in XIX All India Cell Biology Conference, held during Feb. 23-25, 1996 at IICB, Calcutta, India. Dr Shree Kumar Apte obtained his Master’s degree in Botany with a Gold Medal from the Jiwaji University, Gwalior, in 1972 and his Ph.D. from the Gujarat University, Ahmedabad in 1985. He joined BARC through the 16th batch of Training School. His research interest relates to molecular and cellular mechanisms underlying the responses of life-forms to ionizing radiations and other environmental stresses. He has worked in international laboratories in the U.K., U.S.A. and Germany and has authored over 100 research papers with his colleagues. He is a recipient of Prof. J.V. Bhat Eureka-Forbes Award for Excellence in Microbiology (1990) and the Cyanobacterial Biotechnology Young Scientist Award (1996). Currently he is the Head of Molecular Biology Division, BARC.
This paper received the First prize for research paper presentation in the Ph.D. category in Dr Dhala’s felicitation and Twelfth Research Paper and Poster Presentation held on March 20, 2004 at the Department of Microbiology, Bhavan’s College, Mumbai

Solid State Sensors for Toxic Gases …..
Founder’s Day Special Issue, 2005
49
Solid State Sensors for Toxic Gases S.C. Gadkari, Manmeet Kaur, V.R. Katti, V.B. Bhandarkar, K.P. Muthe and S.K. Gupta
Technical Physics & Prototype Engineering Division Bhabha Atomic Research Centre Introduction
rowing industrialization and ever-increasing pollutants from vehicular exhaust have resulted into increased air
pollution. Further, use of cooking gas through pipe lines in modern houses, may become a severe fire hazard due to lack of proper gas-leak alarms. The problems related to air quality monitoring are important issues of the current research activity. In fact, a key component in many process controls, product development, environmental monitoring etc. is the measurement of concentration of one or the other gaseous component of the ambient. In such situations suitable sensors can provide the necessary interface between the ambient and the back up electronic instrumentation to detect the target gas. Solid-state sensors have dominated this field for over the past three decades [1, 2]. Suitable application of micro-fabrication technology would lead to the realization of solid-state sensors, which are robust, inexpensive, reliable and durable. The systems based on array of chemical sensors and connected to an electronic microprocessor will also find applications in medical diagnostics, food industry, pharmaceuticals, and for detection of explosives. Present paper describes preparation, characterization and use of thin film sensors for H2, H2S and NH3. Hydrogen Sensors Hydrogen is a highly combustible gas as 4% V/V concentration in air forms an explosive mixture. Its detection in the ambient becomes important to prevent fire hazard in many areas where this gas is involved. In addition, measurement of H2
concentration is required in applications where this is used as a process gas. Several types of metal-oxide semiconductor thin/thick film based sensors have been reported in the literature [3,4]. Nano-crystalline SnO2 films with grain sizes in the range 6-8 nm are shown to detect H2 at room temperature. Films of WO3:Pt prepared using sol-gel method were found to show very high sensitivity to H2, however, the films exhibited humidity dependence. Good long-term stability has been achieved in the (Sn,Ti)O2 thin film sensors operated at 400°C. High temperature operating (450-600°C) sensors based on stabilized zirconia and ZnO films have been reported to detect H2 in the range 50-500 ppm. Schottky diode based on SiC, WO3 with Pt electrode was reported to detect H2 from room temperature to about 300°C. A new type of thermoelectric sensor has been fabricated using Pt-thin film as catalyst and NiO thick film. This device was operated at 100°C and shown to detect 500 ppm H2 with fast response/recovery times. Thermoelectric sensors based on carbon nanotubes were also reported for H2 sensing applications. Many groups have reported catalytic combustible type sensors (commercial name ‘Pellistors’), useful for detection of hydrogen up to 100% LEL [1]. The exothermic reaction of hydrogen with ambient oxygen on the sensing element (containing Pt/Pd catalyst) causes a rise in its temperature as described earlier. The temperature of sensing element is generally compared with that of a compensating element without the catalytic material. These sensors are invariably made in small sizes and are operated
G

Solid State Sensors for Toxic Gases …..
Founder’s Day Special Issue, 2005
50
at higher temperature of about 500°C to achieve higher sensitivity [1]. Due to higher operating temperatures, these sensors are not suitable in applications where hydrogen concentrations near or above LEL need to be monitored. In the present paper we describe construction and working of a Pd-thin film based catalytic sensor, operating at a lower temperature of about 120°C [4]. The sensor could be used to measure H2 concentrations up to 250% LEL with a linear response. In addition, a thin film coating of Teflon (poly-tetrafluoro-ethelene) has been developed to protect the catalyst of the sensing element from environmental poisoning. This resulted in increased working life of the sensor. Pellistor type sensors are generally operated using fixed bias voltage applied to both the sensor and the compensating elements forming the two arms of a Wheatstone bridge. In this case, any change in the ambient temperature, would lead to a change in the initial temperature of the sensor, which in turn would affect the rate of hydrogen recombination. The error in measurement caused by ambient temperature changes becomes more significant for sensors operating at lower temperatures. Therefore, in the present case, the sensor is operated keeping the temperature of the compensating element constant. The difference of sensor and compensating element temperatures is monitored and it is directly proportional to the hydrogen concentration. A simple electronic circuit is used to maintain the temperature of control element constant and to measure the temperature difference between the sensor and the compensating elements. The circuit enables stable and reproducible sensor response characteristics over prolonged periods of continuous operation. The low temperature (120°C) of operation also ensures that the drift in sensitivity of the sensor due to diffusion or structural changes in the catalyst is minimal. The basic sensor consists of two heater elements fabricated using Pt-100 RTD of 2 mm x 5 mm dimensions. A thin film of about 2000Å was sputter deposited on reverse side of one of the Pt-100, called active element [5]. In order to improve poison resistance of sensors, PTFE films were deposited on the active element of some sensors and the performance of sensors
with (type-B) and without PTFE films (type-A) was studied. PTFE films were deposited by RF sputtering technique using 40 mm diameter and 3 mm thick Teflon sheet as a sputtering target. Deposition was carried out at room temperature for 1 hr at ∼130 Watts /13.6 MHz under argon partial pressure of 0.08 mbar yielding PTFE films of nearly 100 nm thickness. Fig. 1 shows a schematic diagram of the sensor and compensating elements. The sensor unit is constructed by soldering both, the active and the compensating elements on a multiple pin connector. The compensating Pt-heater element (C) forms one arm of a Whetstone bridge. The sensor element (S) is connected in series with the bridge, such that nearly same current flows through C and S. The ratio of the resistors in other side of the bridge is adjusted such that C attains an operating temperature of about
120°C. To control the temperature the voltage across C is compared with that across a standard resistor using an Operational Amplifier (OP-27). If temperature of compensating element is slightly less than set value, the second Operational Amplifier (OP27) switches a Darlington pair to pass a fixed current through sensor and the bridge. In the OFF condition a
PTFE Pd-FILM
Pt-LEADS
Pt-HEATER
SOLDER GLASS
ALUMINA SUBSTRATE
S
CFig.1: Schematic diagram of the active and the compensating elements of a hydrogen sensor

Solid State Sensors for Toxic Gases …..
Founder’s Day Special Issue, 2005
51
small current flows through a resistor placed across the Darlington pair. This helps to compare voltages across C and R in the OFF state. Thus the circuit works in a time proportional ON/OFF mode to maintain the temperature of the compensator throughout the operation and effectively cancels the effects of room temperature variations and any other fluctuations common to both elements. When the sensor is exposed to air containing H2, the catalytic combustion of the latter occurs with the help of the active layer (Pd). The heat of combustion results in an increase in the temperature of the active element and results into a differential voltage between sensor element S and C. The differential voltage is proportional to the H2 concentration, as described earlier.
For evaluation of sensor performance, hydrogen gas and air were mixed in the desired ratio and allowed to flow through the sensor housing. A mass flow controller (MFC) was used to set the H2 flow rate in 0-30 standard cc/min range, while air flow was controlled in 0-400 standard cc/min range employing a pressure regulating valve, needle valve and a rotameter. Appropriate values of the two flow rates were selected to get desired H2 concentration [6]. Measurements were carried out at an ambient temperature of 25-30°C. Dry H2 and air were used in most of the experiments. In some of the experiments room air (relative humidity: 70-80%) was used via an oil-free compressor. No detectable effect of the source of air on sensor output was observed. Response of a typical sensor as a function of H2 concentration at different flow rates is shown in Fig. 2. At a flow rate of 40 standard cc/min, the output is linear in H2 concentration right up to about 250 % LEL. At higher flow rates, the sensor shows saturation effects at high H2 concentration and the output is found to deviate from linearity. For example at 300 standard cc/min the sensor is found to exhibit linear response only up to 4 % v/v, as shown in Fig. 2. The response of Type-B sensors was found to be similar. The typical value for response time (T90) for many sensors was found to be about 30 s and the sensors recover within 10% of their
initial state (T10) in about 50 s when placed in clean air. It observed that the ambient temperature variations have a negligible effect on the out put. Effect of various poisons, such as H2S, iodine and HMDS (hexamethyldisilazane) was studied on the performance of sensors with and without PTFE coating. A 30 min. exposure to 100 ppm H2S was found to have no effect on the performance of the sensors. Similarly, the effect of low concentration HMDS exposure was negligible for both types of sensors. The negligible degradation of sensor performance on exposure to HMDS is in agreement with earlier studies on pellistor sensors where, it has been reported that while HMDS has strong poisoning effect on catalytic oxidation of methane and some effect on oxidation of propane, it has negligible effect on oxidation of hydrogen. To explain the different effect of HMDS on oxidation of hydrogen, methane and propane, it has been proposed that there are three different catalytic sites in Pt/Pd, that are distinguished by their ability to catalyze different oxidation reactions and interaction with HMDS. The results indicate
0 2 4 6 8 100
4
8
12 (e)
(d)
(c)
(b)
(a)
OU
T P
UT
(V)
H2 CONC. (%)
Fig.2: Response of sensor as a function of H2concentration at different flow rates, (a) 40, (b) 100, (c) 200, (d) 300 and (e) 400 standard cc/min

Solid State Sensors for Toxic Gases …..
Founder’s Day Special Issue, 2005
52
that while PTFE films permit fast diffusion of hydrogen and oxygen, they provide a diffusion barrier to iodine. The long-term stability of sensors with PTFE coating has also been investigated. Our sensors have been continuously operating for over one year for this experiment. Time dependence of average response at different H2 concentration for type-B sensors is depicted in Fig. 3. The stable performance of the sensors is evident from this figure.
We have developed monitors to detect and measure H2 concentration in the range 0-100% LEL present in the ambient (see Fig.4). The monitor has provision for sensor calibration and provides audio alarm when H2 concentration around the sensor exceeds a preset limit. The sensor could be installed up to 100 m away from the monitor. Hydrogen Sulphide Sensors Hydrogen sulphide (H2S) is a toxic gas with a peculiar foul smell. It is corrosive and is naturally occurring due to decomposition of some organic matter in wastewater. It is also used in large quantities to extract heavy water. Monitoring and control of H2S in ambient is therefore important in laboratories and industrial areas where it is used as a process gas, generated as a
byproduct or produced naturally in wastewater swamps. A large number of workers have used mixed metal oxides and pseudo-binary oxides as sensing materials including SnSb2O6, NiFe2O4, SnxWO3+x, Cr2-xTixO3, Cd2-xGeO4-x-3yN2y etc. However, doped tin oxide (SnO2) based gas sensors are predominantly reported in the literature [2, 7, 8]. These sensors work on the principle of change in electrical conductance on exposure to H2S. Sensors based on pure SnO2 show good sensitivity but the selectivity has been reported to be poor as the sensors respond to all reducing gases in similar manner. To obtain selectivity and improve sensitivity, SnO2 has been doped with different elements like Pt, Pd, Ag, Cu etc.
The CuO-loaded SnO2 thick films were found to exhibit extraordinary sensing characteristics for H2S. For these sensors, sensitivity of 3.5x10⁴ at 50 ppm H2S at 200ºC has been reported [8]. However, the response time is found to be in the range of 5-15 min [8], which appears to be large from applications point of view. Microstructure of the thick films consists of fine CuO particles dispersed on the surface of SnO2 particles [7, 8]. This microstructure is confirmed by reported decrease in the binding energy of Sn-3d electrons due to the presence of CuO surface layer [8]. Since CuO and SnO2 are p- and n- type semiconductors, respectively, a p-n junction forms at each interface between CuO and SnO2 grains, which induces an electron depleted
0 100 200 300 4000
2
4
6
8
10
1 % H2
2 % H2
4 % H2
6 % H2
OU
TPU
T (V
)
TIME (DAY)
Fig.3: Long-term stability of pellistor sensors at different H2 concentration
Fig.4: Instrument to detect H2 in ambient that provides audio alarm when the gas exceeds a pre-set limit

Solid State Sensors for Toxic Gases …..
Founder’s Day Special Issue, 2005
53
space charge layer at the surface of SnO2. This leads to high resistance of the film in air. On exposure to H2S, the CuO is converted into CuS via CuO + H2S → CuS + H2O [7, 8]. CuS, being metallic in character, destroys the p-n junctions and brings about a large drop in resistance. When H2S is turned off, CuS gets quickly oxidized to CuO via 2CuS + 3O2 → 2CuO + 2SO2, and the p-n junctions are restored [7, 8]. As mentioned above, thick film sensors prepared by impregnation technique have large response times. Since the response time depends on diffusion of gas into the sensor film, one would expect thin film based sensors to have better response times. In the present paper, we describe the results of XPS, XRD, Raman, IR and SEM measurements to, (a) determine microstructure of thin films and (b) investigate effect of long-term environmental exposure on sensor response [3]. XRD, IR and Raman studies showed that the SnO2 and CuO grain do not react while SEM showed granular nature of the films. The XPS results (binding energy of Sn-3d electrons) showed that the microstructure of these thin films differs significantly from the thick films. Effect of long-term exposure to atmosphere has been studied and it is found that degradation in sensor response results from interaction of CuO with moisture to form Cu(OH)2. Methods to recover the sensor properties are also described. Sensor Preparation Thermal evaporation technique was used to deposit SnO2:CuO thin films of various thickness ranging between 200 and 800 nm. For this purpose, trilayers in the sequence Sn-Cu-Sn (with thickness ratio of layers 10:1:10) were deposited on polycrystalline recrystallized alumina substrates (size 4 mm x 8 mm and 0.5 mm thick). The Sn and Cu were deposited using molybdenum boats and the film thickness was controlled using quartz crystal thickness monitor. The depositions were carried out at 10-2 Pa oxygen pressure and a substrate temperature of 250ºC. The metallic trilayers were later oxidized to obtain SnO2:CuO composite films. Oxidation was carried out at 250ºC for 30 min and at 800ºC for 60 min under oxygen atmosphere followed by cooling to room temperature at a
rate of 200ºC/hr. A trilayers consisting of 250 nm Sn, 25 nm Cu and 250 nm Sn yielded an oxidized films of ~650 nm in thickness. Fig. 5 shows a photograph of a typical sensor, which is subsequently enclosed in a stainless steel housing.
Response of sensors to H2S was studied by mounting them in a housing having a volume of 2.5X10⁻⁴ m3. A glass ampoule with known amount of H2S (with ±5% accuracy) was broken inside the housing so as to yield the desired concentration of H2S in air and conductance of the sensor as a function of time was measured. After steady state was achieved, recovery in response was studied by removing the sensor from housing and exposing it to air. Results and Discussion on SnO2:CuO Based H2S Sensors SEM micrographs of SnO2:CuO composite thin film taken at different magnifications showed the polycrystalline nature of the film with an average grain size of <1 m. XRD pattern recorded for a film showed all the diffraction peaks corresponding to pure SnO2 and Al2O3 (from substrate). Diffraction peaks due to CuO were not observed due to its small (~5%) fraction in the films. No shift in the SnO2 peak positions was observed, which indicated that neither CuO nor Al2O3 reacts with SnO2.
Fig.5: Photograph of SnO2:CuO thin film based H2S sensor showing heater and temperature sensor

Solid State Sensors for Toxic Gases …..
Founder’s Day Special Issue, 2005
54
Response of a 650 nm film was measured at different temperatures to determine the optimum operating temperature of sensor films. The response curves were plotted as normalized conductance (maximum value of steady state conductance obtained on H2S exposure) versus time. The films have maximum sensitivity in the temperature range of 180-220ºC and minimum response time for operation at 180-200ºC. An optimum operating temperature of 200ºC was used for different studies. Response time of the sensors was seen to increase with film thickness. Sensitivity for a 650 nm film was found to be about 2.5 x10⁴ for 50 ppm H2S. The response times for 350 nm and 650 nm thick films were found to be 80 and 340s, respectively. However, the recovery times were observed to be nearly same for both films i.e. 100 and 90s respectively. The sensors were exposed to other gases like H2, SO2, CO and NH3 and response was recorded as a function of time to check the selectivity towards H2S. Fig. 6 shows the response of a typical sensor operating at 200°C, to 50 ppm H2S, 1000 ppm H2 and 100 ppm SO2. High selectivity of SnO2:CuO thin film sensors to H2S is clearly seen from this figure. The sensors did not show any significant response to CO and NH3 either (response curves not shown in Fig. 6). Sensor response was also measured for different H2S concentrations in 5-50 ppm range. The steady-state conductance plotted as a function of concentration for a 350 nm thick SnO2:CuO film has been found to have a nonlinear dependence on H2S concentration, which was seen to saturate at concentrations higher than 50 ppm. Response of our sensors showed drift in the sensing properties when operated for a few months under field conditions (normal ambient containing < 1ppm H2S). The film resistance and the response time were found to increase with aging, particularly when the sensor is not exposed to H2S for a long period. The drift in response was thought to be due to interaction of the sensor film with the ambient moisture as the relative humidity levels in the field were higher than 70-80 %. To confirm this conjecture, a series of controlled experiments were carried out
in the laboratory. Sensors were exposed to water vapors i.e., ambient with 100% relative humidity, for different time periods and the response curves were recorded. Attempts were made to regenerate the moisture-degraded sensors by dosing them with high concentration of the H2S. It was found that, sensors could be fully recovered by 10 min. exposure (to 500 ppm H2S). Raman and IR absorption measurements were carried out to independently confirm that CuO and SnO2 do not have any reaction products. The presence of pure CuO and pure SnO2 peaks, without any shift, indicate that no chemical reaction occurs between CuO and SnO2. Similar inference was arrived at from IR absorption spectra measured on polycrystalline samples. The IR spectrum of polycrystalline SnO2:CuO (5wt%) is seen to consist of peaks corresponding to those of pure CuO and pure SnO2 powders. High sensitivity of SnO2:CuO thin film based sensors and microstructure as discussed above, suggests that the H2S sensing mechanism is similar to that reported earlier for thin/thick films.
0 2 4 6 8 10
AIR GAS AIR
SO2H2
H2S
RE
SP
ON
SE
(A.U
.)TIME (min.)
Fig.6: Response of a typical 350 nm thick SnO2:CuO sensor to 50 ppm H2S - -, 10000 ppm H2 -∆-, and 100 ppm SO2 -Ο-.

Solid State Sensors for Toxic Gases …..
Founder’s Day Special Issue, 2005
55
This mechanism involves destruction of p-n junctions due to conversion of CuO into CuS on H2S exposures. The drift in sensor response, as discussed earlier, arises due to moisture-induced chemical changes in the film. The regeneration of sensors has been achieved by heavy dosing of H2S followed by air exposure. The mechanisms of drift and recovery can be understood by investigating the chemical changes occurring in these processes. XPS measurements were carried out on sensor films to find out the chemical changes taking place on H2S exposure, moisture exposure and regeneration processes. XPS spectra of S-2p, Sn-3d and Cu-2p region were recorded for the following samples: (i) as-prepared film, (ii) film exposed to 50 ppm of H2S gas and quenched, (iii) moisture exposed film, (iv) H2S regenerated film and (v) film heated to 500°C after exposure to moisture. For comparison, spectra of a pure SnO2 film exposed to H2S and a standard CuS sample were also recorded. Cu-2p and Sn-3d spectra of as prepared films show peak positions at binding energies of 933.5 eV and 486.5 eV that correspond to pure CuO and SnO2 respectively. This result has been found to be different compared to the data reported earlier [8] on SnO2:CuO thick films, where a shift of 0.7-0.9 to lower BE was found for Sn-3d. The difference in BE of Sn-3d for thin and thick films may be explained on the basis of different microstructures. The photoelectrons detected in XPS studies originate within ~5 nm of top surface. Consequently, photoelectrons from SnO2 in the case of thick films originate predominantly from depletion region (that completely covers all SnO2 grains). As described in [8], bands of SnO2 are bent upwards in the depletion region, whereby the observed BE is reduced. In the case of our thin films, photoelectrons predominantly originate from bulk SnO2, whereby no shift in BE was expected as experimentally observed. XPS spectra of films exposed to H2S shows the formation of CuS. This is indicated by S-2p spectrum for H2S exposed film which shows a peak with BE of 163.0 eV (which corresponds to CuS). Formation of CuS is confirmed from Cu-2p
spectra where 2p3/2 peak shifts to 933.0 eV, width of peak reduces and there are no satellites (plot b, Fig. 7) as observed for pure CuS sample (plot f, Fig. 7). Absence of S-2p peak in H2S exposed pure SnO2 film also suggests that H2S does not react with SnO2, which is confirmed by absence of any shift in Sn-3d peak (a shift of ~1 eV would be expected if SnS was formed). These results show that H2S reacts with CuO to yield CuS in the sensor films, confirming the p-n junction based sensing mechanism [7, 8].
Moisture exposed films exhibited no changes in the Sn-3d5/2 peak, whereas Cu-2p3/2 peak shifted to 934.9 eV as shown by plot (c) in Fig. 7, which indicated formation of Cu(OH)2. Thus, the CuO present in thin films, on exposure to moisture, is converted to Cu(OH)2 via, CuO + H2O → Cu(OH)2. The larger response time observed for moisture treated sensor is attributed to slow reaction rate between H2S and Cu(OH)2, which proceeds via Cu(OH)2 + H2S → CuS + 2 H2O. Cu-2p spectrum of H2S regenerated film i.e. films exposed to large concentration of H2S and then to air, indicates conversion of Cu(OH)2 into
925 950 975
933.5 Cu-2p3/2
(a)
(b)
(c)IN
TEN
SITY
(A.U
.)
(f)
(d)
(e)
Fig.7: Cu-2p XPS spectra (a) as-prepared film, (b) H2S exposed film, (c) moisture exposed film, (d) H2S regenerated film, (e) film heated at 500°C after exposure to H2O and (f) standard CuS sample

Solid State Sensors for Toxic Gases …..
Founder’s Day Special Issue, 2005
56
CuO which also explains the recovery in sensor response. The formation of CuO occurs via slow reaction between H2S and Cu(OH)2 (thereby need for exposure to high concentration of H2S) to yield CuS, which in turn yields CuO on exposure to normal atmosphere. Cu-2p spectrum for films heated to 500°C suggests that treatment at high temperatures also decomposes Cu(OH)2 into CuO and may be used for regeneration of sensor films (plot e, Fig. 7). We have developed monitors to detect and measure H2S concentration in the range 0-50 ppm present in the ambient (see Fig.8). The monitor has provision for sensor calibration and provides audio alarm when H2S concentration around the sensor exceeds any preset limit in the measurement range of 0-50 ppm. The sensor could be installed up to 100 m away from the monitor.
Ammonia Sensors Naturally available ammonia plays a major role in controlling acidic effects, caused by emission of SO2 and NO2 in an open space. However, the presence of fertilizer plants, or livestock’s or any ammonia using chemical plant near an urban area, causes great concern not only as health hazards, but also ecological destruction, due to unbalance nutrients in soil. The metal oxide semiconductors based sensors have an edge
over the other sensors because of their simplicity and long life. The conductivity of the sensing film increases when surface chemisorbed oxygen reacts with reducing gases, like NH3, at elevated temperatures, as described earlier. However, oxidation of NH3 on the sensor surface also involves formation of NO and NO2 which result in decreasing the conductance of the film. Therefore, the sensitivity of these type of sensors to NH3 is rather low compared to other gases like H2 or H2S. In the past, several workers have reported WO3 films doped with Au and/or Mo to selectively detect NH3 in the presence of NO. But this system has been found to have cross sensitivities to H2S and H2. Doping of WO3 thick films with Cu has been shown to enhance NH3 sensitivity. Recently, we have reported room temperature operation of Te thin films for NH3 detection [9]. In several applications NH3 is accompanied by large quantities of H2 and under such situations, detection of trace amounts of NH3 selectively in the presence of H2 is very difficult. Recently, SnO2:CuO films have been shown to respond to NH3 above 400°C [10]. However, NH3 detection mechanism of the sensor has not been described. In this paper, we report on the development of SnO2:CuO and WO3:CuO thin films based sensors for NH3. We also describe results of our X-ray photoelectron spectroscopy and laser Raman spectroscopy studies to understand NH3 detection mechanism in SnO2:CuO system. Sno2:Cuo Thin Film Based NH3 Sensors Thin films of pure SnO2 and SnO2:CuO (5wt.%) were prepared on alumina substrates by thermal evaporation of tin and copper metals (99.99 % pure) as described in the preceding section. Fig. 9 shows SEM photograph of a typical SnO2:CuO film. The sensitivity, defined as the ratio of film resistance in air to that in air containing known quantity of target gas (S=RAIR/RGAS) was determined at different operating temperatures for SnO2 and SnO2:CuO thin film based sensors. In order to understand the mechanism of NH3 sensing, we have carried out XPS and Raman spectroscosic
Fig.8: H2S sensor connected to a monitorthat has facility for calibration and providesalarms when the gas in the ambient exceedspre-set limits

Solid State Sensors for Toxic Gases …..
Founder’s Day Special Issue, 2005
57
measurements on ‘as-prepared’ and NH3 exposed sensor films.
Fig. 10 shows the temperature dependence of sensitivity of SnO2:CuO sensors for NH3, H2S and H2. It may be seen that at 450°C, the sensor shows good selectivity to NH3 over H2 and H2S. At lower temperatures (below 250°C), this sensor is insensitive to both NH3 and H2 and shows high specificity to H2S, as described in previous section.
XPS spectra of Cu-2p in SnO2:CuO films before and after NH3 exposure have been recorded and
depicted in Fig. 11. Presence of satellite peaks in the ‘as-prepared’ film suggests that Cu is in CuO state. After the NH3 exposure, the satellite peaks were seen to reduce in size, indicating a possible partial reduction of CuO to Cu2O. The Auger parameter confirmed the formation of Cu2O. There is no change in Sn-3d peak in both ‘as-prepared’ and exposed samples. It may be mentioned that nitrogen compounds were not detected in the XPS measurements.
Raman spectroscopic measurements on ‘as-prepared’ SnO2:CuO exhibited basic characteristic frequencies at 298 cm-1 (Ag), 345, 632 cm-1 (Bg) and a spread around 1100 cm-1 of CuO, and 632.3 (Ag) and 779 cm-1 (Bg) that of SnO2, indicating the presence of the two oxides separately in the films, as discussed earlier. NH3-exposed sample at 400°C shows extra features at 149.5 and 220 cm-1 in addition to already listed frequencies of ‘as-prepared’ sample. These extra features seem to be originated due to Cu2O. The NH3-exposed sample seems to be a mixture of both CuO and Cu2O. However, partial reduction of SnO2 has not been observed after NH3 exposure. The results of experimental findings thus suggest that up to 300°C, there is no interaction of ammonia with the sensing film. But beyond this temperature, onset of dissociation of NH3 into atomic hydrogen, NO and water takes place via, NH3 + O2 → NO + H2O + H+. Both NO and water
Fig.9: SEM photograph of an SnO2:CuO thin film
150 200 250 300 350 400 4500.1
1
10
100
1000
H2
NH3
H2S
SEN
SITI
VITY
TEMPERATURE (OC)
Fig.10: Temperature dependence of sensitivity of SnO2:CuO thin film based sensor to NH3, H2S and H2.
900 950 1000
(b)
(a)
925.1
925,2
953.4
933.4
CO
UN
TS (A
.U.)
B.E. (eV)
Fig.11: XPS spectra of Cu-2p in SnO2:CuO thin films for (a) ‘as-prepared’ and (b) after NH3 exposure

Solid State Sensors for Toxic Gases …..
Founder’s Day Special Issue, 2005
58
vapor get evaporated and atomic hydrogen interacts with CuO in SnO2 matrix to reduces it to Cu2O. In SnO2:CuO films, p-n junctions are formed, as SnO2 is n-type and CuO is p-type semiconductor. This results into large depletion region, leading to high electrical resistance (>108Ω) of the film in air. When CuO partially converts into Cu2O in presence of NH3, there is a reduction in the depletion region as the energy band gap of Cu2O is smaller (2.0 eV) compared to CuO (2.3 eV). This results in increased conductance of the film in presence of NH3. WO3 Thin Film Based NH3 Sensors Like SnO2, the thin films of WO3 are n-type semiconductor and doping with Cu has been shown to enhance sensitivity to NH3. We have investigated NH3 sensing properties of WO3:CuO thin films prepared using two different techniques, viz. RF sputtering and reactive evaporation employing tungsten filament. In RF sputtering technique, we used a WO3 sintered pellet of 40 mm diameter as a target. Films were deposited on recrystallized alumina substrate at room temperature in argon ambient at a pressure of 0.08 mbar. In case of thermal evaporation, a tungsten filament was electrically heated in a vacuum chamber in an O2 partial pressure of 0.1 mbar. Surface of the filament evaporates after oxidizing, as the vapor pressure of WO3 is sufficiently high at the filament temperatures of ∼2000°C. Films prepared on alumina substrates were subsequently annealed in flowing O2 at an elevated temperature in the range 350°C–600°C. In addition to pure WO3, some of the films were doped with Cu. For this purpose, a thin film (10-15 nm) of Cu was deposited on WO3 films. Both, pure and Cu doped WO3 films were also deposited on polished Si-substrate for microstructure studies using Atomic Force Microscope (AFM). Pt-100 heaters (2mm x 5mm) were attached to the sensor films on alumina substrates using alumina-based cement and connected to temperature controller circuits. The sensor film temperatures were set in the range 150°C-400°C and the response characteristics were recorded by exposing the sensor to various NH3
concentrations, as described earlier for H2S sensors. Results on WO3 Based NH3 Sensors and Discussion WO3 Films prepared by both, RF-sputtering and evaporation techniques, exhibit sub-micron size grain structure, as shown in Fig. 12. The granular films show higher surface area, which is conducive for film-gas interaction and results in higher sensitivity. The XRD of ‘As-prepared’ films and films annealed up to 350°C show no diffraction peaks, suggesting small grain size. of Films annealed above 500°C show distinct peaks corresponding to WO3 phase.
Fig. 13 shows variations of sensitivity as a function of operating temperature. The optimum temperature was found to be in the range 250-350°C, which is smaller compared to SnO2:CuO based NH3 sensors. Fig. 14 shows the sensitivity as a function of NH3 concentration. It may be noted that in the range of our interest (10-100 ppm), the sensitivity varies linearly with concentration, enabling us to use a simple electronic circuit in the gas-monitor instrumentation.
Fig.12: AFM photograph of a WO3 thin film deposited using RF-sputtering technique

Solid State Sensors for Toxic Gases …..
Founder’s Day Special Issue, 2005
59
References 1. P.T. Moseley and B.C. Tofield, Solid State
Gas Sensors, IOP Publishing Ltd, Adam Hilger, (1987) Bristol UK.
2. K. Ihokura and J. Watson, The Stannic Oxide Gas Sensors: Principles and Applications, CRC Press, (1994) London.
3. V. R. Katti, A. K. Debnath, K. P. Muthe, Manmeet Kaur, A. K. Dua, S. C. Gadkari, S. K. Gupta and V. C. Sahni, Sensors and Actuators B 96 (2003) 245.
4. V.R. Katti, A.K. Debnath, S.C. Gadkari, S.K. Gupta and V.C. Sahni, Sensors and Actuators B 84 (2002) 219.
5. S.C. Gadkari, V.R. Katti, A.K. Debnath, S.C. Gupta and V.C. Sahni, Proc.SPIE’99 Conference on ‘Smart Materials, Structures and Systems’, Bangalore, India (1999) p.259.
6. V.R. Katti, A.K. Debnath S.C. Gadkari, S.K. Gupta and V.C. Sahni, Proc. DAE Solid State Physics Symposium 41 (1998) 221.
7. P. Siciliano, Sensors and Actuators B 70 (2000) 153.
8. N. Yamazoe, J. Tamaki and N. Miura, Mat. Sci. and Engg. B41 (1996) 178.
9. Shashwati Sen, K.P. Muthe, N. Joshi, S.C. Gadkari, S.K. Gupta, Jagannath, M. Roy, S.K. Deshpande and J.V. Yakhmi, Sensors and Actuators B 98 (2004) 154.
10. K. Reimann and K. Syassen, Phys. Rev. B39 (1989) 11113.
About the authors….
Dr Sanjay C. Gadkari joined BARC through 24th batch of training school. At present, he is Head of Synchrotron & Surface Analytical Instrumentation Section in TP&PED, BARC. He has been working on the development of technology for material synthesis, single crystals; thin/thick films based gas sensors and electronic instruments. Areas of his current interest include development of beamlines on synchrotron radiation sources INDUS-I and INDUS-II at CAT, Indore, and development of ultra high vacuum
100 200 300 400
1.0
1.2
1.4
1.6
(b)(a)
SEN
SITI
VITY
(RA
IR/R
GA
S)
TEMP. (oC)
Fig.13: Temperature dependence of sensitivity to 100 ppm NH3 for WO3 films deposited using (a) thermal evaporation and (b) RF- sputtering
0 20 40 60 80 100 1200.9
1.0
1.1
1.2
1.3
1.4
SEN
SITI
VITY
(RA
IR/R
GA
S)
NH3 CONC. (ppm)
Fig.14: Sensitivity as a function of NH3 concentration for a WO3 film
This paper received the Best Paper Presentation Award at the National Conference on “Sensors Technology (NCST-2004)” held at Gwalior during December 27-28, 2004.

Solid State Sensors for Toxic Gases …..
Founder’s Day Special Issue, 2005
60
based analytical instruments. He is editor of ‘Asian Journal of Physics’ and ‘Bulletin of Indian Vacuum Society’. He is member of ‘The National Academy of Sciences’, ‘Institute of Smart Structures & Systems’ and ‘Indian Vacuum Society’.
Dr (Ms) Manmeet Kaur received her PhD from Devi Ahilya Vishwavidyalaya, Indore in 1998. Her thesis work involved effect of heavy ion irradiation on high temperature superconductors. She joined BARC in 1999 as Dr. K.S. Krishnan Research associate and is presently working as Scientific Officer. Her present interests include development of thin film and gas sensors to detect toxic gases.
Mr V.R. Katti received his M.Sc.(Physics) by research from Mumbai University while in service at BARC. Initially he worked for the development of night vision devices like image converter tubes and image intensifiers for military applications. He also worked on development of space quality silicon solar cells. Presently, he is working on the development of gas sensing devices for H2S, ammonia and hydrogen.
Mr V.B. Bhandarkar received his M.Sc. degree in Physics from the University of Mumbai in the year 2000. Currently, he is pursuing his Ph.D. at BARC. As a part of his thesis, he has been working on the design and instrumentation of an XPS beamline for the synchrotron radiation source INDUS-2 at the Centre for Advanced Technology, Indore. He is also involved in the preparation and the study of gas sensors. In particular, he has prepared, studied and optimized the H2S and NO2 gas-sensing properties of tellurium thin films. He is also working towards fabricating an NH3 sensor
based on tungsten oxide thin films.
Mr K.P. Muthe is working in the field of thin film growth and characterization. He has studied the growth behavior of HTSC films using MBE. The reference value of this work has fetched him a place in Marquis Who’s Who of the world (1997) and Dictionary of International Biography (1999). He has extensively used X-Ray photoelectron spectroscopy to solve several material related problems like corrosion and mechanisms of gas detection and contributed to around 50 publications. His interests also include toxic gas detection and synthesis of Alumina based radiation
sensors for Personal Dosimetry. He belongs to the 30th batch of BARC Training School.
Mr S.K. Gupta joined BARC as Scientific Officer in the year 1975 after completing one year orientation course in Physics. Presently, he is Head of Thin Film Devices Section in Technical Physics & Prototype Engineering Division of BARC. Over the years, he has been involved in the development of Space quality silicon solar cells, preparation of epitaxial thin films of high Tc superconductors, studies on vortex dynamics in superconductors and development of semiconductor thin film based H2S and H2 gas sensors etc. Presently, he is involved in investigations of mechanism of peak effect in
weakly pinned superconductors, colossal magnetoresistance (CMR) thin films, CMR/superconductor junctions and development of semiconductor and polymer based gas sensors. He shared “Shri Hari Om Ashram Prerit SS Bhatnagar Award” for solar energy in the year 1980 and was awarded “Indo-US fellowship in Science and Technology” during the year 1992-93. He has published 70 papers in international journals and is a Member of the National Academy of Sciences, India.

Development of a new high resolution reflectron …..
Founder’s Day Special Issue, 2005
61
Development of a New High Resolution Reflectron Time-of-Flight Mass Spectrometer A. Bhowmick, S.C. Gadkari, J.V. Yakhmi and V.C. Sahni Technical Physics & Prototype Engineering Division Bhabha Atomic Research Centre Introduction
ime-of-flight (TOF) mass spectrometer is being developed since Wiley & McLaren has presented this experimental technique
of measuring the mass of low energy ions and devised the first spectrometer back in 1955 [1]. However, the instrumentation of time-of-fight mass spectrometry has been under continuous progress by adapting with the technological advancements in the other fields of science, e.g. in vacuum science, fast switching of DC high voltage, lasers, high speed data acquisition electronics, high gain sophisticated ion detectors etc. In fact, advances in the instrumentation of time-of-flight mass spectrometry has recently taken a leap forward in view of its new found applications in the mass sampling of large molecular and ionic species e.g. proteins, peptides, polymers and atomic clusters etc [2-6]. The accuracy of mass determination and the capacity of handling a wide variety of unknown masses together from a complex sample like atomic clusters, bio-molecules, polymers etc. require improved machine that has high resolution and dynamic range which are in fact the functions of specific design parameters. Nevertheless, the development of a state-of-the-art machine still remains a challenge specially, for devising a high mass range spectrometer with large dynamic capacity. At TP-PED, we have developed a new TOF mass spectrometer that at present is being used for research studies of bio-organics and is being interfaced with a molecular/cluster beam setup to pursue the investigations that will essentially address the issue of growth and formation vis-à-
vis structure determination of atomic clusters. The salient features of this machine can be outlined as follows: • The instrument has an ionization zone within
a defined ion optics that has a transverse field gradient for perpendicular injection of ions,
• This in effect acts as a proxy ion source to the TOF and hence this design essentially makes the TOF independent of any particular ionization technique,
• It has an inhomogeneous reflectron for energy compensation of iso-mass ions,
• Can be coupled at the source end to an ion trap which assists the TOF with its confinement capabilities that effects to enhance the resolution. This hybrid technique enables the low repetition rate operation suitable for the studies of slow events,
• The Ion Trap can also be operated as a stand alone equipment,
• The machine can be operated both as a linear TOF and as a reflectron TOF as well,
• The instrument works at UHV enabling a high dynamic range > 30,
• Typical mass resolution obtained from spectra > 20000 amu,
• Sensitivity : picomole The new invention in the development is the concept and design of the ion-optics at the source end. A specific ionization volume is well defined within this ion-optics which in principal follows the design aspects of an ion trap and at the same time assists the injection of ions
T
Development of a new high resolution reflectron …..
Founder’s Day Special Issue, 2005
62
perpendicularly into the drift space through time-lag focusing. Attaining high resolution in time-of-flight mass spectrometer depends upon the capacity to control the initial spatial and energy distributions of ions from the source (or off any particular ionization process). Restricting the ionization volume in order to reduce the spatial distribution of ions, however, impairs the sensitivity of the spectrometer since it is directly proportional to the ionization volume [7-9]. Nevertheless, the energy spread along the direction of motion can be avoided by employing the technique of perpendicular ionization [10] and using an ion reflector device at the later course of ions flight in order to compensate for the remaining energy differences between the iso-mass ions. Longer drift-space may be used to increase the ions total flight time in order to improve the resolution, but that happens at the cost of a percentage loss of ions due to the dynamic attributes. There are three attributes to judge the quality of a TOF mass spectrometer, viz. (i) mass resolving capacity or resolution, (ii) sensitivity, and (iii) the dynamic range. Sensitivity and the dynamic range are issues those relate directly to the condition of vacuum [11]. Sensitivity: The ‘extraction volume’ which is typically located within the ionization region of the mass spectrometer, is the zone from which upon start-time, ion paths lead to the surface of the detector. The size of this volume essentially decides the sensitivity of the spectrometer. To achieve a high sensitivity of the spectrometer, it is necessary to achieve a high particle density in the extraction volume. A high particle density in the extraction volume is of advantage because the number of particles arriving in the detector is proportional to that. Thus the size of the extraction volume and the particle density within is a direct measure of the sensitivity of the time-of-flight mass spectrometer. Dynamic Range: The dynamic range of a time-of-flight mass spectrometer is defined as the factor by which the signal of certain specific mass is allowed to be smaller than other masses
without being buried by ions of these other masses that arrive at incorrect times. In a data spectrum, the dynamic range is measured by the ratio of the highest intensity peak to the lowest intensity one. This factor is decided by the small angle scattering events of ions with residual gas particles on their path to the detector. Speaking only for isomass ions, two types of scattering events can be distinguished: (a) scattering events that change the velocity or direction of the ions so strongly such that they do not reach the detector any more. As long as this type of scattering events occur only for a small part of the ions, the sensitivity and dynamic range will not be significantly impaired; (b) scattering events that change the velocity and the direction of the ions only in small amounts, such that they still arrive at the detector, but at incorrect times. These scattering events affect the sensitivity just as little as the first type of scattering events, but the dynamic range is influenced strongly. The number of scattering events of ions on their path to the detector is proportional to gas pressure of the respective regions of the path which clearly means that it is always better to have the lowest achievable base pressure within the drift space [8, 11]. Description Fig.1 shows the layout (side view) of the machine along with the mounting arrangement of the ion-optics and focusing lens system. Ions are channeled into the ion-optics in chamber A from the ion source chamber located at a direction perpendicular to the plane of the paper. Ions are then accelerated and focused into the drift space starting from B. In the linear mode operation ions are detected using a channeltron detector situated in the chamber behind the bellow (marked as D). In reflect mode operation, ions are turned by applying potential in the reflectron located inside the bellow in chamber D. A maximum of 13º deviation can be achieved that is well within the limit to channel the reflected ions into the detector chamber (not shown here) situated at the same horizontal plane and are detected using a high gain hybrid ion detector. Brief description of the individual components are outlined below;

Development of a new high resolution reflectron …..
Founder’s Day Special Issue, 2005
63
1. The Ion-Optics In the conventional design, the ionization is done (or the ions are channeled) within a pair of electrodes of which at least one is constructed out of a wire mesh through which the ions are extracted into the drift space. However, we have shown in reference [12] that the transmission of ions through the wire mesh not only cause considerable loss of ions but also impairs the dynamic range and resolution. Only 3% ions remain non-deviated while traversing the mesh. Most of the ions suffer small angle deflections from their original trajectories and ultimately reach the detector at incorrect time causing an unaccountable spread in the flight time. On the other hand the effect of these deflections is similar to the small angle scattering those the ions encounter with the background gas particles while passing through the drift space if the base pressure is not sufficiently low [11]. Hence, effectively these deflections also hamper the dynamic range of the spectrometer. The result of these simulation studies, given in detail in reference [12] has been the inspiration to develop a grid-less design which will also support the perpendicular injection because the spread in the perpendicular component of the kinetic energy of ions is much less compared to
the spread in their forward component of motion. The concept of the design of ion-optics as shown in Fig.2 below is derived out of the design of an ion-trap. The assembly of the four electrodes is shown in the inset of figure-1. It is fabricated as a single piece along with five electrode lens system that is juxtaposed to maintain the co-axis. Fig.2 shows the SIMION model of the ion-optics. The entire design has been simulated for its optimum size, shape and
Fig.1: Layout of the TOF mass spectrometer (view from one side). The ion-optics and the lens system, fabricated as a single piece is mounted in chamber A in line with the axis of the spectrometer. The reflectron is located within the bellow D.
Fig.2: The representative SIMION model of the ion-optics. Direction X is the beam axis towards the drift space and ions are channeled along the Z-direction. Photoionization, is carried within this volume where the laser is shot along Y-axis.

Development of a new high resolution reflectron …..
Founder’s Day Special Issue, 2005
64
configuration of the electrodes. This is a f our electrode system of which electrode-1 is the back-plate with a 2 mm rim on it. Electrodes 2, 3 & 4 are cylindrical in shape and have four quadrants each. This particular design is done in order to eliminate the dipolar and quadrupolar contributions of the electric field and finally only a linear gradient is retained. The PE surface is shown in Fig.3. The effective ionization volume of 2 mm3 is located centrally between 2 & 3. Ions from within this volume only are focused into the drift space. For photoionization, the laser is to be focused into this volume. The center of this volume is actually the intersection of the cross axis of the molecular beam from along the –Z direction. DC pulsed potential is applied with a very sharp rise time into this capacitor load using separate power supplies for each of 1, 2 & 3 under the control of a single microprocessor that is time synchronized with the reference pulse marking the zero of the flight recorder data acquisition circuit. The main important features of this optics are:
(i) this is a completely grid-less configuration, (2) the deflection and acceleration electrodes of the conventional design has been integrated here to result into a single zone having a linear field gradient, (3) ions are accelerated along the axis of this component which is actually at 90º to ions’ initial direction of introduction. 2. The Lens System The five piece symmetric lens system is coupled together with the ion–optics fabricating both the components as single piece as shown in Fig.4.
This is used to focus the beam to the reflectron. The three internal pieces are identical in construction and are separated by 2 mm from
each other using pure ruby balls. The potential on these three pieces L1, L2 and L3 are adjusted to focus the beam. Fig.5 shows the potential ramp on the lens system. Absolute
values however depend upon the acceleration potential used for different ionic species.Ions are deliberately traversed through a downhill ramp before inserting into the field free space. A-A’ shown in Fig.4 is the flow restriction used to sustain the differential pressure by three orders of magnitude. This flow restriction which essentially separates out the source region from the drift-space and detector region is constructed as a separate piece and assembled together with the lens system to maintain the co-axiallity. The length and diameter of this piece is optimized by simulation studies for unhindered motion of ions through it. We have discussed this aspect in detail in reference [11].
Fig. 3: The PE surface when the potential is applied to the ion-optics. Ions are accelerated along X-direction.
Fig. 4: The Lens assembly. L1, L2 and L3 are the pieces on which the potential is applied
Fig. 5: The potential ramp applied to the lens system

Development of a new high resolution reflectron …..
Founder’s Day Special Issue, 2005
65
3. The Reflectron In the conventional design the reflectron is constructed out of at least two homogeneous segmented field typically referred as the retarding and reflecting fields which are juxtaposed together [13-16]. There also exist designs with multiple segmented fields. These segments are created by the typical use of wire meshes those contain the homogeneous segments. However, the simulation studies of the deflection of ions while passing through wire mesh as discussed in reference [12] has led us to design the reflectron without the use of any grid that will have potential on it. That means, unlike the conventional practice, the design should not comprise of any segmented electric field. Rather, there should be a unique combination of electrodes giving rise to an inhomogeneous field. Finding a unique combination of this type, generally depend on the number of electrodes and their size and shape. Analytical solution to this problem by solving the L’place equation for cylindrical symmetry of the electrodes through Bessel function is rather involved. We have taken up the problem by solving for the sets of different designs using SIMION 7.0 windows version. The basic restriction for the size of the construction has been imposed upon by the size of the UHV formed bellow that is used to house it in the machine. The entire work of simulation had been a tedious optimization to achieve a good combination of electrodes in terms of number,
size and shape that will result into a unique energy focus for iso-mass ions of different energy. The final combination as shown in Fig.6
is made out of a total of eight electrodes of various size and shape. This gives a unique energy focus for ions varying in energy by ±3% and falling within the 70% central volume of the reflectron [12]. It is however found that to materialize the uniqueness of the simulation result, the actual construction of the cylindrical electrodes and also their position has to be extremely precise. This had been a tough task since the electrodes had to be housed within a high dielectric material in precise positions to attain a practical situation as obtained in simulation. This had finally been done by putting the rings into a very high precision (50 micron ID tolerance) large (diameter about 5”) glass tube (from WIlmad Glass, USA). Very high precision resistor chains
made out of helium sealed resistors (UHV compatible) with gold coated leads (from Angstra-OHM USA) have been used external to the glass tube to maintain the perfect potential difference by the use of a single precision power supply (Stanford Instruments, USA). 1 mm thick SS seamless cylinder has been used as the ground shield of the construction. It is about (φ100 × 200) mm in dimension and is mounted within chamber D (Fig.1) inside a Φ254 OD CF-F formed bellow. The bellow is having three knee-joint attachments at its exterior rim in order to set it at particular angular position to insert the reflected beam into the detector. Fig.7 shows the potential energy surface of the reflectron. The simulated ion trajectories show the motion of
Fig.6: The arrangement of electrodes in the reflectron
Fig.7: The PE surface of the reflectron and ion trajectories on the uphill

Development of a new high resolution reflectron …..
Founder’s Day Special Issue, 2005
66
isomass ions of different energies along the uphill and their subsequent bunching at the exit through the single grid held at ground potential. This is the only grid at the end electrode of the reflectron that faces the drift-space. Fig.8 shows the zoom view of the ion trajectories and velocity focusing. This single zone grid-less design has several advantages over the conventional segmented homogeneous field ion reflector design, such as, a. It saves from the considerable transmission
loss of ions while passing through several grids,
b. 90% transmission grids can be used but that causes a much higher deflection while passing through it, thereby reducing the resolution [12].
c. The overall size of the reflectron is much
smaller in this case since this has only one zone and has no additional retarding field associated with. This fact enables to achieve similar effect over a much shorter length.
d. This type of design has a unique focus. 4. Detector & Data acquisition For the linear mode operation, a channeltron detector (from Sujts, Germany) with 25 mm quality diameter is used. This is housed in the chamber behind the reflectron bellow. There is a 10 mm hole in the reflectron back-plate along the axis of TOF. Reflectron is switched off during this operation. The signal is amplified using the FastcomTec 7011 preamplifier discriminator and the pulses are converted to NIM pulses before being fed into the acquisition card.
For reflectron mode operation, a hybrid ion detector made out of double channelplate in chevron configuration coupled to a scintillator and a photomultiplier, is used. The entire length of the detector is about 2” and the channelplate has 18mm quality diameter (from Burle Electroptics, USA). This unique combination has a gain of 108 and is even useful for single photon counting events. This has an intrinsic width of 750ps with effective rise time of 450ps after optimized snubber circuit is used for the high frequency transmission. The signal is amplified using a 1.2 GHz wideband preamplifier (from FEMTO, Germany) and fed directly into the data acquisition card. The internal discriminator of the acquisition card is used to eliminate noise. The data acquisition is done using a commercially available PCI TOF data acquisition card from FastComTec Germany (Model P7886 and MCDWIN) using a P-IV 1.2GHz Pentium PC. The card has an internal time resolving capacity of 500ps. (Technical features of the card can readily be obtained from www.fastcomtec.de). The zero for the timer of the acquisition is done by triggering externally with the requisite reference pulse from the DC pulsed power supply (Digitronics, Pune). This is synchronized with the DC pulses applied at the ion-optics. There are three timings maintained simultaneously; the largest width being of the repetition time, then the reference pulse and the shortest width is of the DC pulse. Sufficiently large difference is kept between repeat DC pulses allowing ions from the source to accumulate within the ionization volume when there is no potential on it. All controls are done using the microprocessor run through PC by RS-232 interface. 5. The ion source Since the spectrometer is designed without coupling it directly to any particular ion source, it gives us the flexibility to interface with multiple ionization techniques. Even though the primary objective of this design is to couple the spectrometer with a molecular beam machine
Fig. 8: Ion trajectories within the reflectron showing the velocity focusing
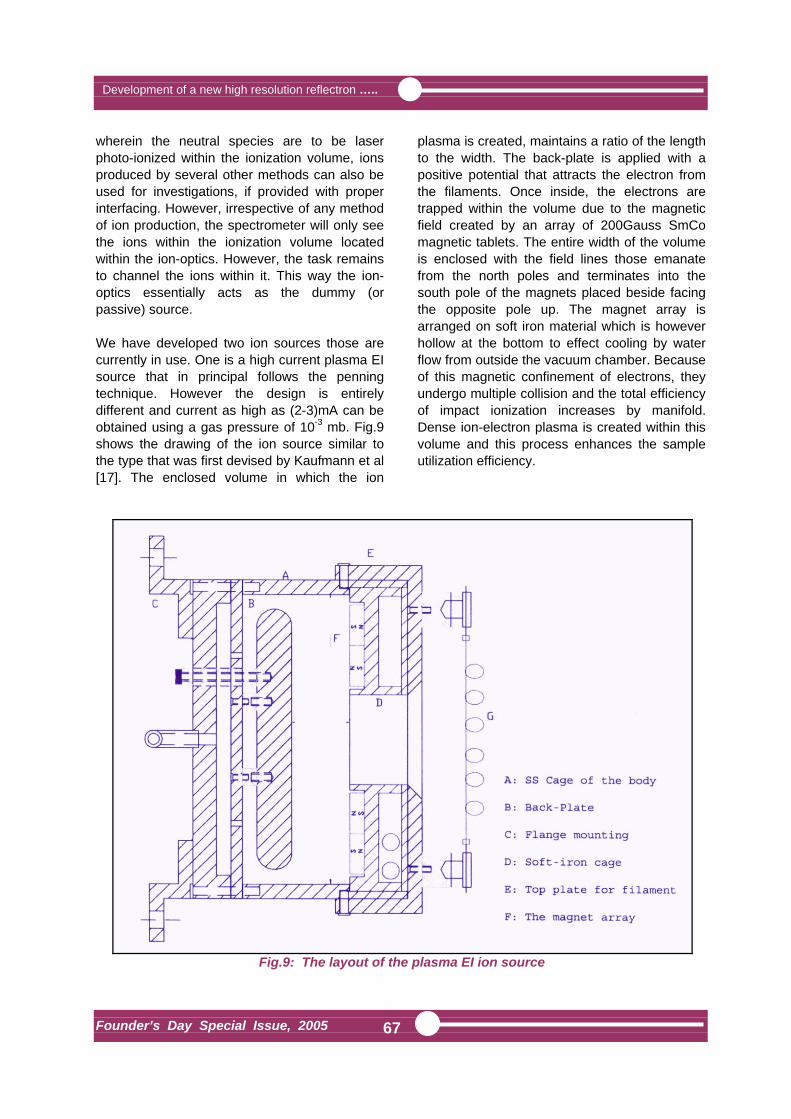
Development of a new high resolution reflectron …..
Founder’s Day Special Issue, 2005
67
wherein the neutral species are to be laser photo-ionized within the ionization volume, ions produced by several other methods can also be used for investigations, if provided with proper interfacing. However, irrespective of any method of ion production, the spectrometer will only see the ions within the ionization volume located within the ion-optics. However, the task remains to channel the ions within it. This way the ion-optics essentially acts as the dummy (or passive) source. We have developed two ion sources those are currently in use. One is a high current plasma EI source that in principal follows the penning technique. However the design is entirely different and current as high as (2-3)mA can be obtained using a gas pressure of 10-3 mb. Fig.9 shows the drawing of the ion source similar to the type that was first devised by Kaufmann et al [17]. The enclosed volume in which the ion
plasma is created, maintains a ratio of the length to the width. The back-plate is applied with a positive potential that attracts the electron from the filaments. Once inside, the electrons are trapped within the volume due to the magnetic field created by an array of 200Gauss SmCo magnetic tablets. The entire width of the volume is enclosed with the field lines those emanate from the north poles and terminates into the south pole of the magnets placed beside facing the opposite pole up. The magnet array is arranged on soft iron material which is however hollow at the bottom to effect cooling by water flow from outside the vacuum chamber. Because of this magnetic confinement of electrons, they undergo multiple collision and the total efficiency of impact ionization increases by manifold. Dense ion-electron plasma is created within this volume and this process enhances the sample utilization efficiency.
Fig.9: The layout of the plasma EI ion source
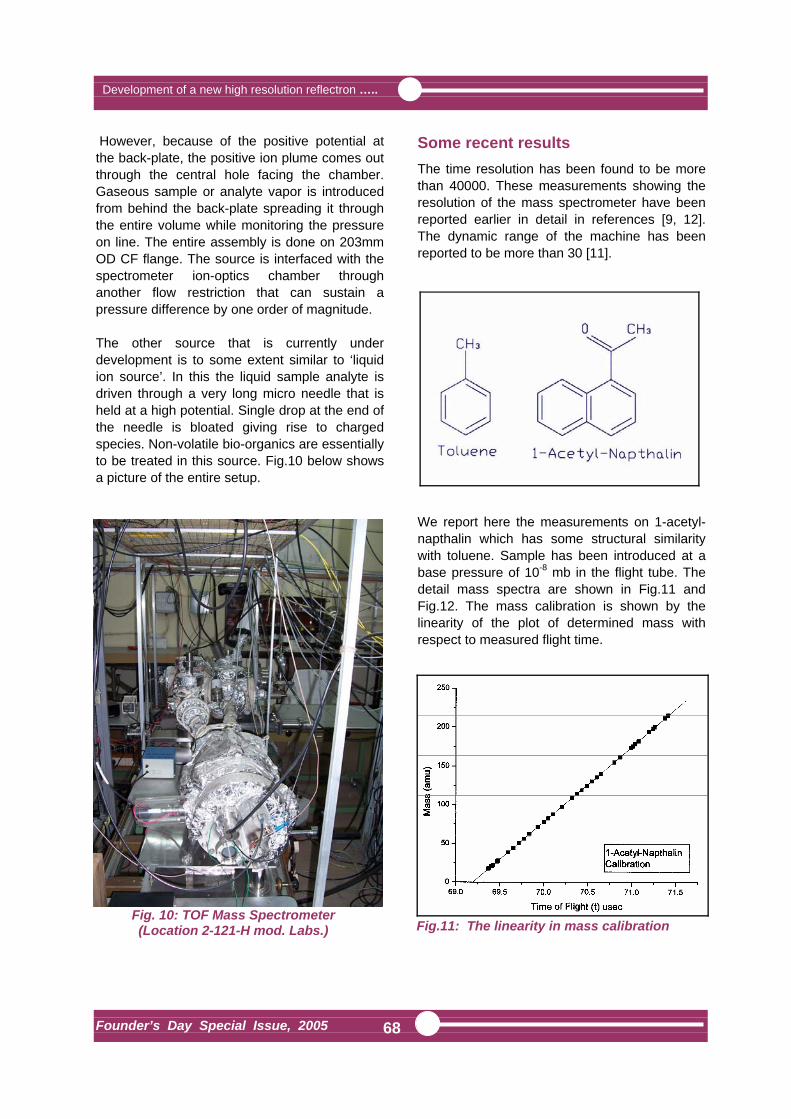
Development of a new high resolution reflectron …..
Founder’s Day Special Issue, 2005
68
However, because of the positive potential at the back-plate, the positive ion plume comes out through the central hole facing the chamber. Gaseous sample or analyte vapor is introduced from behind the back-plate spreading it through the entire volume while monitoring the pressure on line. The entire assembly is done on 203mm OD CF flange. The source is interfaced with the spectrometer ion-optics chamber through another flow restriction that can sustain a pressure difference by one order of magnitude. The other source that is currently under development is to some extent similar to ‘liquid ion source’. In this the liquid sample analyte is driven through a very long micro needle that is held at a high potential. Single drop at the end of the needle is bloated giving rise to charged species. Non-volatile bio-organics are essentially to be treated in this source. Fig.10 below shows a picture of the entire setup.
Some recent results The time resolution has been found to be more than 40000. These measurements showing the resolution of the mass spectrometer have been reported earlier in detail in references [9, 12]. The dynamic range of the machine has been reported to be more than 30 [11].
We report here the measurements on 1-acetyl-napthalin which has some structural similarity with toluene. Sample has been introduced at a base pressure of 10-8 mb in the flight tube. The detail mass spectra are shown in Fig.11 and Fig.12. The mass calibration is shown by the linearity of the plot of determined mass with respect to measured flight time.
Fig. 10: TOF Mass Spectrometer (Location 2-121-H mod. Labs.)
Fig.11: The linearity in mass calibration

Development of a new high resolution reflectron …..
Founder’s Day Special Issue, 2005
69
The calibration of the spectrum has been done by simultaneous measurement of the internal standards which are H2O and N2. Nitrogen has been introduced deliberately through a different minute leak path simultaneous with the sample and water abundance is due to the non-baked system.
The grouping at the low mass end appears to be basically from the presence of ionic species of the residual gas and chemical species from the running of the ion pump. These are also recorded in a simultaneous measurement of residual gas analyzer based on quadrupole mass filter. Almost single mass peaks between 35 to 100 amu are mainly due to the
characteristic fragments. Masses beyond 100 are anticipated to be the fractions created by combinations of smaller fractions.
However, the parent compound is not obtained at its original molar mass and there are some higher molar masses which might be the metastable combinations created because of the particular method of plasma ion production [17]. Nevertheless, the detail identification of the respective masses is continuing and will be reported shortly. References [1] W. C. Wiley, and I H McLaren, Rev Sci
Instrum, 26, 1150, (1955) [2] T. Bergmann, T. P. Martin, H. Schaber,
Rev. Sci. Instr. 60, 347 (1989); ibid 792 [3] T. Bergmann, H. Goehlich, T. P. Martin, H.
Schaber, Rev. Sci. Instr. 61, 2585 (1990) [4] T. Bergmann, T. P. Martin, H. Schaber,
Rev. Sci. Instr. 61, 2592 (1990) [5] James P. Reilly, Steven M. Colby, Timothy
B. King, US Patents No. 5712479 (1998) [6] M. L. Quiniou, Alexander J. Yates and
Patrik R. R. Langridge-Smith, Rapid Commun. Mass Spectrometry, 14, 361
(2000). [7] Haberland, Hans Kornmeier, Christoph
Ludewigt and Andreas Risch, Rev. Sci. Instr., 62(10), 2368 (1991) [8] T. Bergmann, Eva Martina Bergmann, US
Patent Nos. 4496998; ibid 4543624 (1996) [9] A. Bhowmick, W. C. J. Carvalho, A. V.
Korgaonkar, J. V. Yakhmi, V. C. Sahni, in Proceedings: 11th ISMAS Workshop on
Mass Spectrometry, Oct. 2004, Shilonbag, India pp. 201-209 (2004)
[10] F. Chandezon, B. Huber and C. Ristori, Rev. Sci. Instrum., 65(11), 3345 (1994).
[11] A. Bhowmick, S. C. Gadkari, J. V. Yakhmi, V. C. Sahni, Bulletin of Indian
Vacuum Society, vol. 8 (1), 19 (2005). [12] A. Bhowmick, W. C. J. Carvalho, A. V.
Korgaonkar, J. V. Yakhmi, V. C. Sahni, Int. J. Mod. Phys. B, vol 19 (accepted)
Fig.12: The detailed mass spectrum of 1- acetyl-napthalin

Development of a new high resolution reflectron …..
Founder’s Day Special Issue, 2005
70
[13] B.A. Mamyrin, V. I. Karataev, D. V. Shmikk and V. A. Zagulin, Sov. Phys. JETP, 37(1), (1973) 45.
[14] B.A. Mamyrin, Avt svid (Inventor’s Certificate) No. 198034, (1966); Byull izobr (Bulletin of Inventions), No.13, (1967).
[15] B.A.Mamyrin, Dokt Diss,Physico-Technical Institute, Academy of Sciences, USSR, Leningrad, (1966).
[16] B.A.Mamyrin, US Patent, 4072862 (1978). [17] E. Leon McCrary, M. A. Scituate, R.
Ronald Wiley, F. L. Melbourne, US Patent No. 5576600 (1995).
About the authors …
Dr Ashok Bhowmick has joined TP&PED in BARC as a scientific officer in August 1999. He has completed his Ph.D work from Saha Institute of Nuclear Physics, Kolkata in 1994. He obtained his Ph.D (Physics) award from the University of Calcutta. He was involved in experimental condensed matter physics, especially in the studies of layered compounds by Mossbauer Spectroscopy. He had done his first post-doctoral career at the ‘Institute of Experimental Physics’ in ‘Swiss Federal Institute of Technology, Lausanne’ (EPFL) Switzerland. He was awarded the international fellowship from ICSC World Laboratory, Geneva. Here he was involved
in the field of atomic clusters, and specially in the experimental deposition studies of atomic clusters. He also participated extensively in the development of a very sophisticated experimental setup including STM, for these studies. Following this career, he did his second postdoctoral career at the Department of Physics in Georgia Institute of Technology, (GaTech) Atlanta, USA. Here, he worked on the development of a molecular beam ion trap time-of-flight setup for the studies of atomic clusters in interaction free environment. He has taken up the development of this TOF machine and made it operational. Currently he is developing a molecular cluster beam setup in interface with the TOF machine described in this paper. ‘Innovative Research Award’ from ISMAS was given to him during the 11th ISMAS Workshop on Mass Spectrometry held at Shilonbug, Simla, in October 2004.
Dr Sanjay C. Gadkari joined BARC through 24th batch of training school. At present, he is Head of Synchrotron & Surface Analytical Instrumentation Section in TP&PED, BARC. He has been working on the development of technologies for material synthesis, single crystals, thin/thick films based gas sensors and electronic instruments. Areas of his current interest include development of beamlines on synchrotron radiation sources INDUS-I and INDUS-II at CAT, Indore and development of ultra-high vacuum based analytical instruments. He is editor of ‘Asian Journal of Physics’ and ‘Bulletin of Indian Vacuum Society’. He is member of
‘The National Academy of Sciences’, ‘Institute of Smart Structures & Systems’ and ‘Indian Vacuum Society’.
This paper received the ‘Innovative Research Award’ during the 11th ISMAS Workshop on Mass Spectrometry, held at Shilonbug, Simla, in October 2004.

Development of a new high resolution reflectron …..
Founder’s Day Special Issue, 2005
71
Dr J.V. Yakhmi, Associate Director, Physics Group and Head, Technical Physics and Prototype Engineering Division, BARC, has worked in BARC for the past 37 years on diverse areas of research in materials science, such as, high Tc superconductors, magnetic alloys, molecular materials, etc. His contributions to the field of molecular electronics and bio-sensors are internationally recognized. Dr V.C. Sahni is a well-known physicist, who has been working in the DAE in various capacities for about four decades. At present, he is Director of Centre for Advanced Technology, Indore, and Director of Physics Group, BARC.

A novel approach for the determination of 238Pu ….
Founder’s Day Special Issue, 2005
72
A Novel Approach for the Determination of 238Pu by Thermal Ionisation Mass Spectrometry (TIMS) S.K.Aggarwal and D.Alamelu Fuel Chemistry Division Bhabha Atomic Research Centre Introduction
hermal ionization mass spectrometry (TIMS) is widely used in nuclear technology for the determination of
different isotopes of plutonium (Pu), viz. 239Pu to 242Pu, required for various purposes in nuclear fuel cycle. However, the determination of 238Pu is hampered by the ubiquitous isobaric interference of 238U, which is always associated with Pu. Efforts have been made in our laboratory, in the past, to circumvent/minimise this problem. Preferential evaporation and ionization was employed to suppress the formation of U+ ion during thermal ionization. Also, addition of small amounts of 233U to the sample filament while loading Pu sample and confirming indirectly the absence of 238U+ peak by monitoring 233U+ signal during Pu analysis was tried. These approaches have been used in the past with limited success, but there always remained a doubt on 238Pu isotope data due to the qualitative nature of these methodologies. The advent of TIMS instruments equipped with multi-Faraday cup detector system and availability of interfering element correction (IEC) methodology in the software during data acquisition and reduction, has offered the possibility of on-line quantitative correction for the isobaric interferences. This necessitates the monitoring of another isotope e.g. 233U, 235U of the interfering isobaric nuclide i.e. 238U, with a prior knowledge of 238U/233U , 238U/235U atom ratio of uranium present in the sample. Since U+ and Pu+ ions appear at nearly similar heating currents of the vaporization and ionization filaments during thermal ionization, this
approach has eluded the nuclear mass spectroscopists and could not be adopted. To circumvent this problem, studies were carried out on the evaporation and ionization characteristics of Pu and U during thermal ionization and the formation of atomic and oxide ions of these two elements was monitored, using surrogate samples with different Pu/U amount ratios (1 to 10), at various heating currents of vaporization and ionization filaments. Two different sets of heating conditions of the filaments could be identified for determining U isotopes using UO+ ion first, followed by the determination of Pu isotopes, using Pu+ ion, at another set of filament heating conditions. The U and Pu isotope ratios are determined experimentally from the same filament loading, using same setting of different Faraday cups and by defining two different experiments for data acquisition and reduction. The methodology employs external addition of 235U ( > 90 atom% enrichment) as a monitor isotope to purified Pu solution, maintaining Pu/U amount ratio of about 5. This manuscript summarises the results of these investigations and demonstrates validation of this novel approach by determining 238Pu in a certified Pu sample viz. NIST-SRM-947-Pu containing about 0.25 atom% of 238Pu. Experimental A synthetic mixture was prepared by mixing solutions of enriched 235U and 239Pu with Pu/U amount ratio of 5, to study the evaporation and ionization characteristics of U and Pu. A double filament assembly of high purity Re filaments was used and the U+Pu mixture was loaded onto the filament from the nitrate medium. The
T
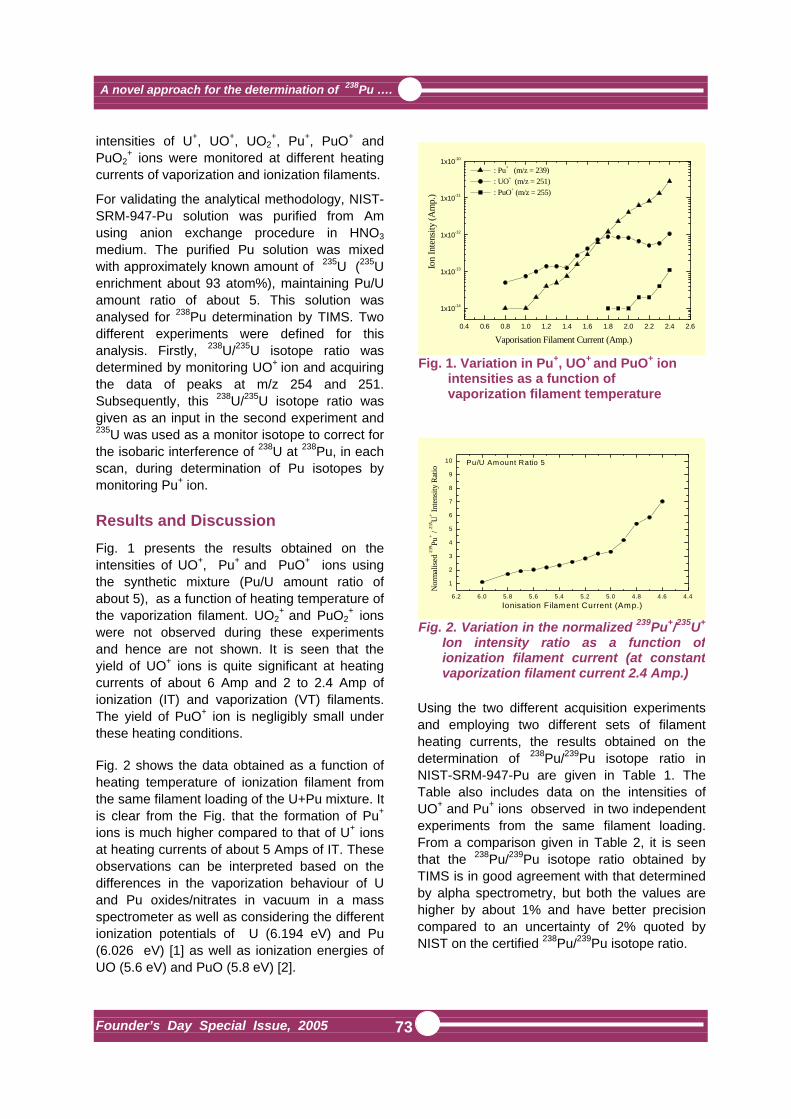
A novel approach for the determination of 238Pu ….
Founder’s Day Special Issue, 2005
73
intensities of U+, UO+, UO2+, Pu+, PuO+ and
PuO2+ ions were monitored at different heating
currents of vaporization and ionization filaments. For validating the analytical methodology, NIST-SRM-947-Pu solution was purified from Am using anion exchange procedure in HNO3 medium. The purified Pu solution was mixed with approximately known amount of 235U (235U enrichment about 93 atom%), maintaining Pu/U amount ratio of about 5. This solution was analysed for 238Pu determination by TIMS. Two different experiments were defined for this analysis. Firstly, 238U/235U isotope ratio was determined by monitoring UO+ ion and acquiring the data of peaks at m/z 254 and 251. Subsequently, this 238U/235U isotope ratio was given as an input in the second experiment and
235U was used as a monitor isotope to correct for the isobaric interference of 238U at 238Pu, in each scan, during determination of Pu isotopes by monitoring Pu+ ion. Results and Discussion Fig. 1 presents the results obtained on the intensities of UO+, Pu+ and PuO+ ions using the synthetic mixture (Pu/U amount ratio of about 5), as a function of heating temperature of the vaporization filament. UO2
+ and PuO2+ ions
were not observed during these experiments and hence are not shown. It is seen that the yield of UO+ ions is quite significant at heating currents of about 6 Amp and 2 to 2.4 Amp of ionization (IT) and vaporization (VT) filaments. The yield of PuO+ ion is negligibly small under these heating conditions. Fig. 2 shows the data obtained as a function of heating temperature of ionization filament from the same filament loading of the U+Pu mixture. It is clear from the Fig. that the formation of Pu+ ions is much higher compared to that of U+ ions at heating currents of about 5 Amps of IT. These observations can be interpreted based on the differences in the vaporization behaviour of U and Pu oxides/nitrates in vacuum in a mass spectrometer as well as considering the different ionization potentials of U (6.194 eV) and Pu (6.026 eV) [1] as well as ionization energies of UO (5.6 eV) and PuO (5.8 eV) [2].
Using the two different acquisition experiments and employing two different sets of filament heating currents, the results obtained on the determination of 238Pu/239Pu isotope ratio in NIST-SRM-947-Pu are given in Table 1. The Table also includes data on the intensities of UO+ and Pu+ ions observed in two independent experiments from the same filament loading. From a comparison given in Table 2, it is seen that the 238Pu/239Pu isotope ratio obtained by TIMS is in good agreement with that determined by alpha spectrometry, but both the values are higher by about 1% and have better precision compared to an uncertainty of 2% quoted by NIST on the certified 238Pu/239Pu isotope ratio.
0.4 0.6 0.8 1.0 1.2 1.4 1.6 1.8 2.0 2.2 2.4 2.6
1x10-14
1x10-13
1x10-12
1x10-11
1x10⁻¹⁰
: Pu+ (m/z = 239) : UO+ (m/z = 251) : PuO+ (m/z = 255)
Ion
Inte
nsity
(Am
p.)
Vaporisation Filament Current (Amp.)
Fig. 1. Variation in Pu+, UO+ and PuO+ ion intensities as a function of vaporization filament temperature
6.2 6.0 5.8 5.6 5.4 5.2 5.0 4.8 4.6 4.4
1
2
3
4
5
6
7
8
9
10
Nor
mal
ised
239 Pu
+ / 23
5 U+ In
tens
ity R
atio
Pu/U Amount Ratio 5
Ionisation Filament Current (Amp.)
Fig. 2. Variation in the normalized 239Pu+/235U+
Ion intensity ratio as a function of ionization filament current (at constant vaporization filament current 2.4 Amp.)

A novel approach for the determination of 238Pu ….
Founder’s Day Special Issue, 2005
74
The present studies thus demonstrate a novel approach for quantitative correction of isobaric interference of 238U at 238Pu in TIMS. The methodology does not need information on the exact amount of U added externally as well as 235U/238U isotope ratio of the U solution added. Moreover, since 235U/238U isotope ratio is determined in-situ from the same filament loading, any contamination or pick up of uranium from reagents, glass ware or laboratory environment prior to loading on the filament, will not affect the accuracy of 238Pu/239Pu isotope ratio determined. The methodology will be extremely useful for the characterization of new
reference materials of 238Pu, which have not been available commercially until now. References 1. N. Erdmann, M. Nunnemann, K. Eberhardt,
G. Herrmann, G .Huber, S. Kohler, J. V. Kratz, G. Passler, J. R. Peterson, N. Trautmann and A. Waldek J., Alloys and Compounds 271-273 (1998) 837.
2. Marta Santos, Joaquim Marcalo, Joao Paulo Leal, Antonio Pires de Matos, John K. Gibson and Richard G. Haire, Int. J. Mass Spectrom. 228 (2003) 457
.
This paper was awarded the First Prize in the category of Innovative Research Session presented during 10th ISMAS Workshop on Mass Spectrometry (10th ISMAS-WS 2003) held at Shilon Bagh, Shimla, during October 7-12, 2004
Table 1 : Mass spectrometric analysis data for NIST-SRM-947 Pu S. No.
235UO+ signal range (mV)
239Pu+ signal range (mV)
Observed 240Pu/239Pu atom ratio
Observed 238Pu/239Pu atom ratio
Normalized 238Pu/239Pu atom ratio*
1 120 to 90 980 to 1100 0.24104 (0.024%)
0.0030475 (0.69%)
0.0030482
2 150 to 80 950 to 1030 0.24097 (0.031%)
0.0030331 (0.41%)
0.0030329
*Internal normalization w.r.t. certified 240Pu / 239Pu isotope ratio value of 0.24099
Table 2 : Results on 238Pu/239Pu atom ratio in NIST-SRM-947-Pu (as on July 14, 2004) S.No. Technique 238Pu/239Pu atom ratio
1. TIMS (present methodology) 0.003046 (0.26%)*
2. Alpha spectrometry 0.003043 (0.14%)**
3. NIST certificate value 0.003022 (2%)
* Value obtained from five independent filament loadings **Value obtained from triplicate alpha spectra recording from each of the five electrodeposited sources, using certified 240Pu/239Pu atom ratio and half- life values of 87.74 yr, 24110 yr and 6553 yr, respectively, for 238Pu, 239Pu and 240Pu

A novel approach for the determination of 238Pu ….
Founder’s Day Special Issue, 2005
75
About the authors …
Dr S.K.Aggarwal is currently, Head, Fuel Chemistry Division, BARC. He received his B.Sc. (Hons.) from Guru Nanak Dev University, Amritsar, in 1972 with two Gold Medals. He joined the 16th Batch of BARC Training School in 1972 and received Homi Bhabha Award. He did his Ph.D. from Mumbai University in 1980. He is a coauthor of 300 scientific publications, which include 100 articles published in reputed journals. Dr Aggarwal has participated in several international and national conferences and in different international intercomparison experiments. He is a specialist in the field of atomic mass spectrometry and alpha spectrometry and is interested in various mass
spectrometric techniques. His other areas of interest include electrochemistry and solvent extraction. He represents India in the Executive Committee of International Mass Spectrometric Conferences. He has visited several countries in America, Europe and Australia as an expert as well as for delivering lectures. He is a recognized Ph.D. Guide of the Mumbai University.
Ms D.Alamelu, obtained her M.Sc. Degree in Physics from Annamalai University. After graduating from 38th Batch of Training School, BARC, she joined Mass Spectrometry Section of the Fuel Chemistry Division in 1995. Since then, she has been actively involved in the indigenous development of Time of Flight Mass Spectrometer. Her other areas of interest include thermal ionisation mass spectrometry and alpha spectrometry.

Evaluation of Antioxidant Activity and ....
Founder’s Day Special Issue, 2005
76
Evaluation of Antioxidant Activity and Phytochemical Analysis of Triphala G.H. Naik, K. I. Priyadarsini and Hari Mohan Radiation Chemistry & Chemical Dynamics Division Bhabha Atomic Research Centre
A b s t r a c t Ayurvedic formulation triphala was found to be effective in inhibiting γ-radiation induced damage in microsomal lipids and plasmid pBR322 DNA. The fast reaction kinetic tools like pulse radiolysis and stopped flow technique were used to asses its antioxidant activities and antioxidant equivalents. The phytochemical analysis showed that triphala is rich in polyphenols (38± 3%) and tannins (35 ± 3%). Based on these studies it is proposed that triphala is an effective antioxidant, which can act as a good radio protector.
Introduction
n the recent past, there has been growing interest in exploiting the biological activities of different ayurvedic medicinal herbs, owing to
their natural origin, cost effectiveness and lesser side effects [1,2]. Triphala is one of the ayurvedic medicinal herbal formulations prescribed by most health care practitioners. It is used as colon tonic, laxative, eye rejuvenator, anti-inflammatory, anti-viral etc. It is a composite mixture of three medicinal herbs Amalaki (Emblica officinalis), Haritaki (Terminalia chebula) and Bibhitaki (Terminalia belerica). Triphala is gentle for people of all ages, from children to seniors and hence is recommended for everybody [3]. Triphala has been tested as an antioxidant and also as a radioprotector in mice [4, 5]. In the present study, we tested the in vitro antioxidant activity under γ-radiation induced conditions. In order to understand the factors responsible for the antioxidant and radio protection activity, free radical reactions and phytochemical analysis of triphala were carried out. Experimental Lipid peroxidation in microsomes and DNA damage in pBR322 were carried out using 60Co γ-source [2]. Nanosecond pulse radiolysis and
stopped flow technique were used to study rates of free radical reaction and to determine the antioxidant equivalents. Phytochemical analysis were carried out by using HPLC and absorption spectrophotometry. Results and Discussion The aqueous extract of triphala (20 µg/ml) inhibited γ-radiation induced lipid peroxidation in rat liver microsomes at all the doses employed (120 – 360 Gy) to the extent of 65 to 85%. By using concentration profile studies (5-35 µg/ml) at a fixed dose of 240 Gy, IC50 value of 10µg/ml was determined. Triphala (25-200 µg/ml) was
I
Fig. 1 : Agarose gel electrophoretic pattern
showing protection by triphala of γ-radiation induced strand breaks in plasmid pBR 322 DNA as a function of concentration of the triphala. Lanes 1, 2 : pBR 322 control; Lanes 3, 4 : exposed to radiation dose of 6 Gy; Lanes 5-12 exposed to radiation dose of 6 Gy in presence of 200, 100, 50 and 25 µg/ml of triphala in duplicate.
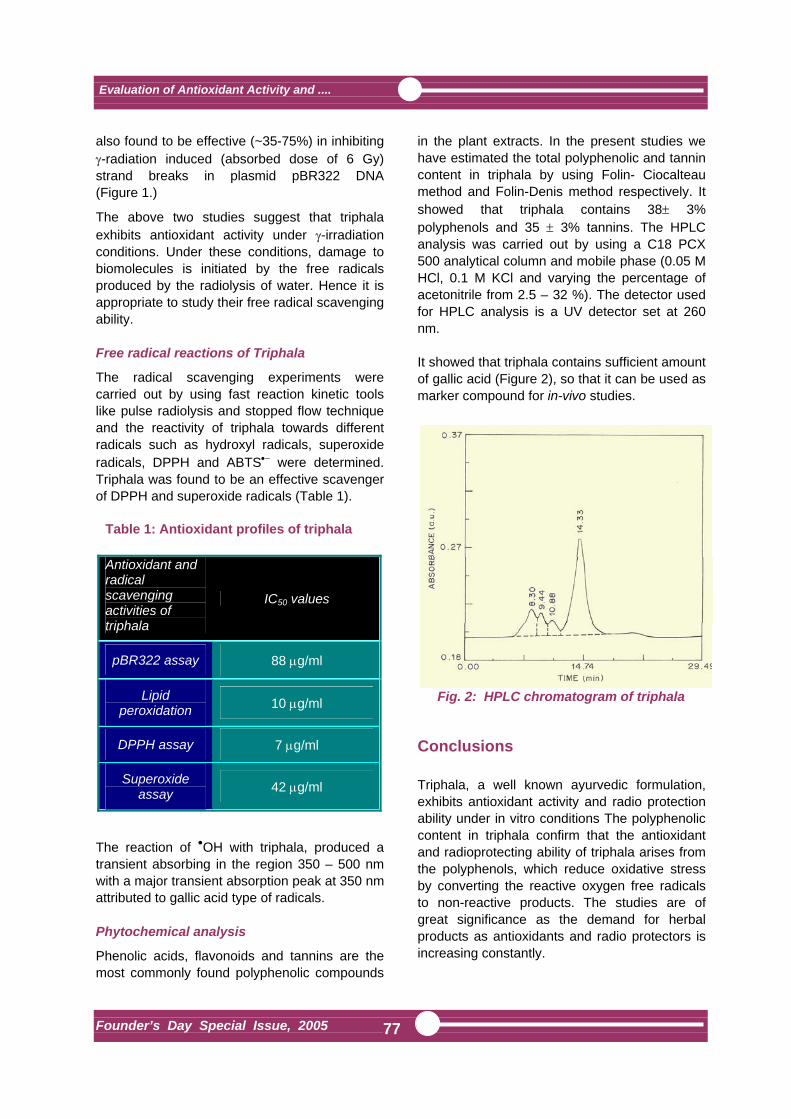
Evaluation of Antioxidant Activity and ....
Founder’s Day Special Issue, 2005
77
also found to be effective (~35-75%) in inhibiting γ-radiation induced (absorbed dose of 6 Gy) strand breaks in plasmid pBR322 DNA (Figure 1.) The above two studies suggest that triphala exhibits antioxidant activity under γ-irradiation conditions. Under these conditions, damage to biomolecules is initiated by the free radicals produced by the radiolysis of water. Hence it is appropriate to study their free radical scavenging ability. Free radical reactions of Triphala The radical scavenging experiments were carried out by using fast reaction kinetic tools like pulse radiolysis and stopped flow technique and the reactivity of triphala towards different radicals such as hydroxyl radicals, superoxide radicals, DPPH and ABTS•− were determined. Triphala was found to be an effective scavenger of DPPH and superoxide radicals (Table 1).
The reaction of OH with triphala, produced a transient absorbing in the region 350 – 500 nm with a major transient absorption peak at 350 nm attributed to gallic acid type of radicals. Phytochemical analysis Phenolic acids, flavonoids and tannins are the most commonly found polyphenolic compounds
in the plant extracts. In the present studies we have estimated the total polyphenolic and tannin content in triphala by using Folin- Ciocalteau method and Folin-Denis method respectively. It showed that triphala contains 38± 3% polyphenols and 35 ± 3% tannins. The HPLC analysis was carried out by using a C18 PCX 500 analytical column and mobile phase (0.05 M HCl, 0.1 M KCl and varying the percentage of acetonitrile from 2.5 – 32 %). The detector used for HPLC analysis is a UV detector set at 260 nm. It showed that triphala contains sufficient amount of gallic acid (Figure 2), so that it can be used as marker compound for in-vivo studies.
Conclusions Triphala, a well known ayurvedic formulation, exhibits antioxidant activity and radio protection ability under in vitro conditions The polyphenolic content in triphala confirm that the antioxidant and radioprotecting ability of triphala arises from the polyphenols, which reduce oxidative stress by converting the reactive oxygen free radicals to non-reactive products. The studies are of great significance as the demand for herbal products as antioxidants and radio protectors is increasing constantly.
Table 1: Antioxidant profiles of triphala Antioxidant and radical scavenging activities of triphala
IC50 values
pBR322 assay 88 µg/ml
Lipid peroxidation 10 µg/ml
DPPH assay 7 µg/ml
Superoxide assay 42 µg/ml
Fig. 2: HPLC chromatogram of triphala

Evaluation of Antioxidant Activity and ....
Founder’s Day Special Issue, 2005
78
References 1. Chopra RN, Nayar SL, Chopra IC. 1956.
Glossary of Indian medicinal plants. Council of Scientific and Industrial Research. New Delhi
2. Naik G. H., Priyadarsini K. I., Satav J.G., Banavalikar M. M., Sohani D.P., Biyani M.K., Mohan H. 2003 Comparative antioxidant activity of individual herbal components used in Ayurvedic medicine. Phytochemistry., 63., 97-104.
3. Khopde, S. M., Priyadarsini, K. I., Mohan, H., Gawandi, V. B., Satav J. G., Yakhmi J. V., Banavaliker M. M., Biyani M. K. and Mittal, J. P. 2001 Characterising the
antioxidant activity of amla (phyllanthus emblica) extract. Current Science, 81, 185-190.
4. Vani T., Rajani M., Sarkar S., Shishoo C. J. 1997 Antioxidant properties of the ayurvedic formulation Triphala and its constituents. Int J Pharmacognosy. 35, 313-317.
5. Jagetia GC, Baliga MS, Malagi KJ, Sethukumar KM. 2002. The evaluation of the radio protective effect of Triphala (an ayurvedic rejuvenating drug) in the mice exposed to gamma-radiation. Phyto medicine. 9: 99-108
About the authors …
Mr Ganesh Naik received his M.Sc. degree in Organic Chemistry from Somaiya College, Mumbai University in 2000. He is a DAE fellow working in Radiation Chemistry and Chemical Dynamics Division. He has been awarded Ph.D. degree in 2005 for his thesis entitled ‘Study of free radicals and excited states of some important biomolecules’. Dr K. Indira Priyadarsini is currently working on the elucidation of mechanisms of antioxidant action involving natural products and herbal extracts with the potential application as radioprotectors, employing nanosecond electron pulse radiolysis and in vitro biochemical studies. Dr Priyadarsini has co-authored more than 95 papers in peer reviewed international & national journals on antioxidants, free radical reactions, radiation chemistry, photochemistry and radiation biology. She has been elected as the Fellow of the National Academy of Sciences, India, 2003. She is the recipient of Homi Bhabha Science & Technology Award, 2003. Dr Hari Mohan joined Bhabha Atomic Research Centre in 1967. Since then he was involved in the study of fast reaction kinetics using accelerators and lasers. His research interests include free radical reactions of halogenated and sulfur compounds and biomolecules of natural origin. He has co-authored more than 200 research papers in national and international journals. He has superannuated in November, 2004 as Head, Radiation Chemistry Section of Radiation Chemistry & Chemical Dynamics Division of BARC.
This paper received the ‘Dr P.K. Bhattacharya Memorial Award’ for the year 2004 in the Trombay Symposium on “Radiation and Photochemisry”, held during January 8-12, 2004

Preparation and characterization of ligands …..
Founder’s Day Special Issue, 2005
79
Preparation and Characterization of Ligands Labeled with Reactor Produced Isotopes for Use as Potential Radiopharmaceuticals Tapas Das and M.R.A. Pillai Radiopharmaceuticals Division Bhabha Atomic Research Centre
A b s t r a c t
The work carried out involves the design, syntheses and characterization of new ligands and their complexation with different diagnostically and therapeutically important reactor produced isotopes to develop radiochemical agents which may find potential applications in nuclear medicine. First part of the work involved the development of Intra Vascular Radiation Therapy (IVRT) agents for liquid filled balloons for the prevention of restenosis after balloon angioplasty. Ligands like EC (ethylene dicysteine) and DOTA (1,4,7,10-tetraazacyclododecane-1,4,7,10-tetra acetic acid) were synthesized, characterized and radiolabeled with short-lived high energy β- emitters such as 188Re and 166Ho. The rapid renal excretion along with no accumulation in the vital organs observed in animals indicated the potential of these agents. The second part of the work involved development of tumor specific agents. Tumor avid molecules like porphyrin derivatives were synthesized and radiolabeled with 188Re. To exploit the hypoxic nature of certain tumors, nitroimidazole derivatives were coupled with suitably developed bifunctional chelating agents (BFCA) and subsequently radiolabeled with 99mTc. These agents showed good uptake in animal tumors. Third part of the work involved the development of receptor specific agents for which testosterone and estradiol molecules were synthetically modified and coupled with macrocyclic BFCA’s. The coupled products were radiolabeled with 99mTc and 177Lu and the radiolabeled products were tested in suitable cancer cell-lines which showed good binding indicating the potential of the agents developed.
This paper was selected for the Best Presentation Award by the Royal Society of Chemistry, West India Section, at the 15th Research Scholars’ Meet (RSM) of University of Mumbai held at R.D. National College and W.A. Science College, Bandra, during February 2003

Preparation and characterization of ligands …..
Founder’s Day Special Issue, 2005
80
About the authors …
Dr Tapas Das obtained M.Sc. (Chemistry) from Kalyani University (West Bengal) in 1997. After graduating from BARC Training School in 1998 (41st Batch, Chemistry discipline), he joined Radiopharmaceuticals Division, BARC. Since then he has been actively involved in the research and development work on diagnostic and therapeutic radiopharmaceuticals. He has obtained Ph.D. degree in Chemistry from University of Mumbai in 2004. He has published about 40 papers in various national and international journals. Dr M.R.A. Pillai is the former Head, Radiopharmaceuticals Division, BARC. He is currently working in the International Atomic Energy Agency (IAEA), Vienna. After graduating from the BARC Training School in 1976 (19th Batch, Chemistry discipline), he obtained his M.Sc. and Ph.D. degree from University of Mumbai. He did his post doctoral research and later worked as a visiting professor at the University of Missouri-Columbia, USA. He has co-authored a book, chapters in several books and has more than 100 publications in international journals.

Development of transgenic cyanobacterial ….
Founder’s Day Special Issue, 2005
81
Development of Transgenic Cyanobacterial Strains Using Electroporation Technique A.K. Chaurasia, A.S. Parasnis and S.K. Apte Molecular Biology Division Bhabha Atomic Research Centre
A b s t r a c t
Electroporation is a physical technique used in medical sciences and molecular biology for the drug delivery and gene transfer respectively. The technique aims at creating transient permeability of the cell membrane due to application of sharp electric field. Electroporation technique has been used to produce transgenic cyanobacterial strains. A binary vector pDUCA7 (12 Kb) was used to standardize the electrotransformation protocol of cyanobacteria. The vector has neomycin resistance gene (NmR) for the selection of transformants. The buffer containing salts like Li+, Na+, Rb+, Mg+2, and Ca+2 at different concentrations have been evaluated to attain optimum transformation efficiency. A buffer containing 10 mM HEPES (pH=7) 50 mM CaCl2 and 100 mM LiCl yielded highest number of transformants per microgram of DNA for Anabaena sp PCC 7120 as well as Nostoc muscorum strain 221.The technique is proposed to be used for development of cyanobacterial strains with enhanced biofertilizer potential for stressful environment.
References 1. Apte, S.K., Haselkorn, R., (1990), Cloning of Salinity Stress-induced gene from the salt-tolerant
nitrogen-fixing cyanobacterium Anabaena torulosa Plant Mol Biol 15 (5): 723-33. 2. Moser, P., Zakara, D., Kallas, T., (1993), Characterization of restriction barrier and
electrotransformation of the cyanobacterium Nostoc PCC 7121, Arch Microbiol 160: 229-237. 3. Thiel, T. and Poo, H. (1989) Transformation of a filamentous cyanobacterium by electroporation. J.
Bacteriol. 171: 5743-5746 About the authors …
Mr Akhilesh K. Chaurasia obtained his M.Sc. in Botany with one year specialization in “Cyanobacterial metabolism and Applied phycology” from Banaras Hindu University (BHU). He subsequently joined BHU as a Junior Research Fellow (JRF) on a DST (Department of Science and Technology) project entitled “Cyanobacterial blooms & secondary metabolites (toxin): Discovery, isolation & characterization of novel biochemicals” from January 2002 to September 2002. He joined BARC in October 2002 as a DBT (Department of Biotechnology) JRF on a project “Development of high potential transgenic cyanobacterial biofertilizer”.
This oral presentation was awarded the 2nd prize at the Raman Memorial Conference held at the Department of Physics, University of Pune, Pune, during February 26-27, 2004

Development of transgenic cyanobacterial ….
Founder’s Day Special Issue, 2005
82
Dr Shree Kumar Apte obtained his Master’s degree in Botany with a Gold Medal from the Jiwaji University, Gwalior, in 1972 and his Ph.D. from the Gujarat University, Ahmedabad, in 1985. He joined BARC through the 16th batch of Training School. His research interest relates to molecular and cellular mechanisms underlying the responses of life-forms to ionizing radiations and other environmental stresses. He has worked in international laboratories in the U.K., U.S.A. and Germany and has authored over 100 research papers with his colleagues. He is a recipient of Prof. J.V. Bhat
Eureka-Forbes Award for Excellence in Microbiology (1990) and the Cyanobacterial Biotechnology Young Scientist Award (1996). Presently he is the Head of Molecular Biology Division, BARC.

Separation of Americium from aged.…..
Founder’s Day Special Issue, 2005
83
Separation of Americium from Aged Plutonium Oxide Containing Uranium K.M. Michael, C. Janardanan, K. Kumaraguru, P.R. Rakshe, M. Rathinam, G.R. Dharampurikar, B.S. Thite, K.K. Gupta, S.D. Chaudhari, N. Sinalkar, Manisha Lokhande, R.T. Ajithlal, K. Vijayan, U. Jambunathan, S.K. Munshi and P.K. Dey Fuel Reprocessing Division Bhabha Atomic Research Centre and G.C. Jain Radio Metallurgy Division Bhabha Atomic Research Centre
he amount of 241Am present in aged PuO2 depends on two factors, namely, the amount of 241Pu present and the time
elapsed after the processing of Pu. Normally, power reactor fuel which has undergone more irradiation contains appreciable amount (2-3%) of 241Pu, which on emission of beta with a half life of 13.6 years forms 241Am. 241Am has a half life of 431 years which emits both alpha and gamma (60 keV, 35%). As the build up of 241Am increases, it will become mandatory to purify the PuO2 for safe handling. Several grammes of Americium oxide (AmO2) has been separated and purified from aged plutonium oxide (PuO2). PuO2 was chemically dissolved in nitric acid and HF mixture and subjected to anion exchange process. The effluent containing Am was precipitateed as oxalate after adjusting the pH to 1. The americium oxalate was ignited to 600oC to get oxide. During these operations, utmost care has been taken to minimise the 60 keV gamma exposure to working personnel. Before the actual separation experiment, the composition of the oxide was assayed by dissolving a representative sample, analysing it for Pu by coulometry, Am by gamma spectrometry and uranium by spectro-photometry. The PuO2 in batches of 200 g each was subjected to chemical leaching for 20 minutes with 16 M HNO3
(1) for the removal of uranium. The leach was then diluted with 0.5 M
HNO3 and allowed to settle for 10 minutes and decanted. This was repeated three times to ensure the complete leaching of uranium. The leach solution was analysed for Pu, Am and U. Pu was analysed by TTA extraction followed by radiometry, Am by gamma spectrometry and U by spectrophotometry using thiocyanate as the chromogenic reagent. The leached PuO2 was dissolved in a mixture of 1 L concentrated HNO3 (AR) and 0.03 M HF by heating to 80°C for 1 hour. The solution was decanted and fresh 1 L HNO3 was added and heated. Two times of addition of HNO3 and heating was found to be sufficient for the complete dissolution of PuO2. The dissolved plutonium was conditioned to Pu(IV) by the addition of NaNO2 and the acidity was adjusted to 7.2 M The solution was then passed through a preconditioned anion exchange (Dowex 1X4) (2) column (id = 3.5 cm and height = 30 cm) at a slow rate so that the effluent contains minimum Pu. The column was washed with 7.2 M HNO3. The loading effluent and washing were collected together and the pH was adjusted to 1 with slow addition of solid NaOH. To the above solution, equal volume of 0.1 N oxalic acid was added slowly with constant stirring and the precipitate was allowed to settle
T

Separation of Americium from aged.…..
Founder’s Day Special Issue, 2005
84
overnight(3). After the analysis of the supernatant for Am, the slurry was filtered and the precipitate was ignited at a specified temperature profile of 5 hours duration to get AmO2 powder. Sample of AmO2 was taken for chemical as well as spectroscopic analysis to ascertain the purity. Pu in the column was eluted with 0.5 M HNO3, precipitated as oxalate and ignited to get PuO2 separately. Table 1 shows the composition of PuO2 powder as well as the amount of Pu, Am and U in the leachate. It can be seen that virtually all U in the oxide powder has been leached out with negligible loss of Pu and Am. Table 2 shows the amount of Pu and Am in the ion exchange feed as well as the effluent. It can be seen that < 2 % of Pu only gets into the effluent and the concentration of Am is significantly high for precipitation. Prior to
precipitation, neutralisation of acid was carried out with solid NaOH to maintain the concentration of Am reasonably high. The Table also shows the amount of Am in the oxalate supernatant. 5-10 mg/L Am concentration in the oxalate supernatant obtained in the present case is slightly on the higher side than the reported value of 1.8 mg/L at 25oC in 0.1 M oxalic acid + 0.1 N HNO3
(4). This is probably because the solution is a mixture of 0.1 N HNO3, 0.1 N oxalic acid and 7 M NaNO3. In 0.25 N HNO3 alone, the solubility of Am is very high. The effect of high concentration of NaNO3 on the solubility of americium oxalate has not been fully understood which has to be further studied. The oxide obtained after ignition was found to be of high purity. The overall recovery of 241Am is > 95 %.
Table I : Amount of Pu, Am and U in the oxide as well as leachate (Weight of PuO2 per batch is 200 g)
Description Pu Am U
PuO2 composition 158 g 4.4 g 14.2g
Leachate of Batch I 1.41 g 0.07 g 14.0 g
Leachate of Batch II 0.80 g 0.03 g 14.0 g
Leachate of Batch III 1.38 g 0.09 g 14.0 g
Table II
Feed Effluent Batch No.
Pu Am Pu Am
Am in oxalate supernatant
I 189.1 g 3.94 g 48 mg 3.91 g 51 mg
II 155.0 g 4.31 g 65 mg 4.28 g 140 mg
III 187.5 g 4.52 g 100 mg 4.44 g 155 mg

Separation of Americium from aged.…..
Founder’s Day Special Issue, 2005
85
Recovery of Am from Aged Plutonium Oxide Containing U
Pu oxide Containing U,Am
(200 g)
Leaching with 16 M HNO3 (3 leaches of
500mL)
UO2(NO3)2
1.5 L
Dissolution 16 M HNO3+HF
2 L
Conditioning 7 M HNO3
10 L (~16 g/L Pu)
Ion exchange 2 L column Dowex 1X4
Oxalate precipitation Am2(C2O4)3
(at pH 1)
Eluted product Pu(NO3)4
12 L
Effluent + wash Bulk Am
12 L
Ignition Am oxide at
600 oC
Oxalate precipitation Pu(C2O4) 2
Ignition PuO2
Co-Precipitation of Am with Fe at
pH 7
Am free Effluent Sent to RSMS
Effluent Eluate
Effluent Treatment

Separation of Americium from aged.…..
Founder’s Day Special Issue, 2005
86
References 1. C.S.Dileep, G.M.Dhabolkar, K.Vijayan,
U.Jambunathan and A.Ramanujam, NUCAR 2001, 204, Feb. 7-10, University of Pune (2001)
2. J.L.Ryan and E.J.Wheelwright, USAEC report HW-55893 (Del) (1959)
3. W.J.Maraman, A.J.Beaumont, R.S.Day and
R.S. Winchester, LA 1699 (1954) 4. R.A.Penneman, USAEC report NAS-NS
3006, 5 (1960)
About the authors ….
Dr K.M. Michael graduated from the University of Kerala and joined BARC in 1973. He took his M.Sc. and Ph.D. degree in Chemistry from the Mumbai University in 1994 and 1999 respectively. He is a reconversion chemist engaged in Plutonium reconversion, U-233 and Am recovery. He has carried out several process development work pertaining to plutonium and Am processing, R & D works pertaining to the recovery of actinides from waste solutions was also carried out by him. He has to his credit more than 50 papers in national and international journals / Symposia. Mr C.Janardanan after obtaining B.Sc. (Chemistry) degree from Calicut University, Kerala, joined Fuel Reprocessing Division of BARC in 1984. After initial training, he started working as a process control chemist. He obtained his M.Sc. (Chemistry) degree in 1990 and Ph.D. (Chemistry) degree in 1998 from Mumbai University. His fields of specialization are ion exchange, solvent extraction, process development pertaining to fuel reprocessing etc. Of late, he has shown active interest in the separation and purification of Am from aged plutonium. There are about 20 research papers to his credit in national and international journals. Mr K. Kumaraguru joined BARC in 1982 after graduating from Madurai University. He took his M.Sc. degree from Bombay University in 1992. He is actively engaged in Plutonium reconversion, Uranium-233 and Americium recovery. He is also involved in designing of laboratories of reprocessing facilities and automation of reconversion process. He has carried out research of bio remediation of active waste. He has got 25 publications to his credit in national and international journals / symposia. Dr P.R. Rakshe graduated from the Shivaji University and joined in BARC in 1982. He took his M.Sc. & Ph.D. degree in Chemistry from Mumbai University in 1992 & 1997 respectively. He is a reprocessing chemist engaged in Plutonium reconversion, U-233 and Am recovery. His active field of interest is Electrochemistry and its allied techniques along with actinide separation. He is having more than 25 papers in national and international journals/ symposia.
In SESTEC Seminar held in July, 2004, this paper was adjudged as one of the best papers and given a cash award.
Separation of Americium from aged.…..
Founder’s Day Special Issue, 2005
87
Mr M. Rathinam joined FRD, BARC in April 1984 after graduating from Madurai Kamraj University. He had obtained his M.Sc. from the same University. His field of work is reprocessing of plutonium and recovery of U-233 and americium. His field of interest is NDA techniques in reprocessing plants. He has over 12 papers in national and international journals / symposia. Mr G. R. Dharampurikar graduated from Saugar University and joined BARC in 1983. He took his M.Sc. degree in Chemistry from Mumbai University. He is a reprocessing chemist engaged in plutonium reconversion, U-233 and Am recovery. His field of specialization includes actinide separation using membranes. He has to his credit about 20 papers in national and international journals/symposia. Mr B.S. Thite after obtaining his M.Sc. degree from Pune University, joined BARC in 1991. His field of work is reconversion of plutonium and recovery of U-233 and americium. He is having 10 publications in national and international journal/ symposia. Mr K.K. Gupta joined BARC in 1991 after graduation from University of Ajmer, Rajasthan. He did his M.Sc.(Chemistry) in 1997 from University of Mumbai. He has been involved in process control analysis of PUREX process. He carried out process development studies pertaining to solvent extraction, Ion exchange, and membrane based separation of actinides and fission products from reprocessing nuclear waste. There are about 20 publication to his credit in national and international journals.
Mr S.D. Chaudhari joined BARC in 1984 after graduating from university of Pune. He has been involved in process control analysis of PUREX process. He has shown active interest in solvent extraction and ion-exchange pertaining to PUREX process . There are 6 publication to his credit in national symposia. Mr Nitin Sinalkar after obtaining B.Sc. degree in Chemistry from Pune University joined Fuel Reprocessing Division, BARC, in 1997. His active field of work is Plutonium reconversion, processing of U233 and recovery of americium. He is having more than 10 publications in National and International symposia. Ms Manisha Lokhande joined Fuel Reprocessing Division, BARC in 1997 after obtaining her B.Sc. Degree in Chemistry from Mumbai University. Currently she is engaged in reconversion of plutonium from spent fuel reprocessing and recovery of 233U from irradiated thoria fuel. She is also involved in the recovery of americium from aged plutonium oxide. Her field of interest is quality assessment of solvents by Gas Chromatography and High Performance Liquid Chromatography. To her credit, she has got around ten publications in national and international symposia.

Separation of Americium from aged.…..
Founder’s Day Special Issue, 2005
88
Mr R.T. Ajithlal joined BARC in 1999 after graduation from Kerala University. His fields of specialization are reprocessing of Plutonium, Uranium-233 and Americium recovery. He has about 10 papers in national symposium/ seminars to his credit. Mr K. Vijayan joined BARC in 1966 after graduating from Mumbai University. He took his M.Sc. degree in Chemistry from Mumbai University in 1978. His field of specialisation is reconversion of plutonium from spent fuel reprocessing and recovery of americium from aged plutonium. He has taken part in the Pu metal production for PNE in 1974 and PURNIMA - I fuel core supply. He has to his credit about 40 research papers in national and international journals. Currently, he is holding the post of Superintendent, Process Control & Reconversion Laboratories.
Dr U. Jambunathan took his M.Sc.(Chemistry) degree from Madras University in 1968, Ph.D. in Chemistry from Mumbai University in 2000. After his graduation from XII batch of BARC training school, he joined FRD in 1969. He has taken part in the Plutonium production for PNE in 1974 and PURNIMA - I fuel core supply. Over the years he has developed expertise in reprocessing and is representing as a task force member for AHWR fuel development committee and PFBR fuel specification committee. At the invitation of IGCAR, he has extended his reprocessing expertise to
the recent LMC campaign for the processing of 25000, 50000 & recently 1,00,000 Megawatt burn up carbide fuel. He has developed different techniques for the recovery of Americium from different streams of Plutonium reconversion operations and he had the distinction of separating 1 gm of Americium from Carbothermic furnace graphite shield in 2000 and now from the aged Plutonium oxide. He has to his credit 80 publications in national and international journals/symposia
Mr S.K. Munshi, B.E. (Chemical Engineering), joined BARC in 1971 after graduation from Kashmir University. His field of expertise is reprocessing of spent fuel of research reactors and power reactors (PHWR). His also involved in the safety assessment of fuel cycle facilities and heavy water plants. He has to his credit ten research papers in National and International seminars / symposia. Mr Munshi is currently holding the post of Chief Superintendent, Reprocessing Facilities, Trombay. Mr P.K. Dey is a graduate in Chemical Engineering from Jadavpur University, Kolkata. He joined BARC in the year 1971 and is associated with the activities of spent fuel reprocessing of the Department. He is having vast experience in construction, commissioning and operation of reprocessing plants. He has carried out extensive R & D studies to improve the reprocessing technology for better recovery and minimization of radioactive waste generation. Presently he is the Head of Fuel Reprocessing Division of BARC and is responsible for operation of all the reprocessing plants in the country. Dr G.C. Jain obtained his M.Sc. (Chemistry) degree from Indore University and joined Radiometallurgy Division of BARC after graduating from 11th batch of BARC training school. He took his Ph.D. degree in Chemistry from Mumbai University in 1994. His field of specialization is plutonium chemistry, analytical chemistry of plutonium and nuclear fuel development and characterization. Dr Jain has over 24 research papers in national and international journals.
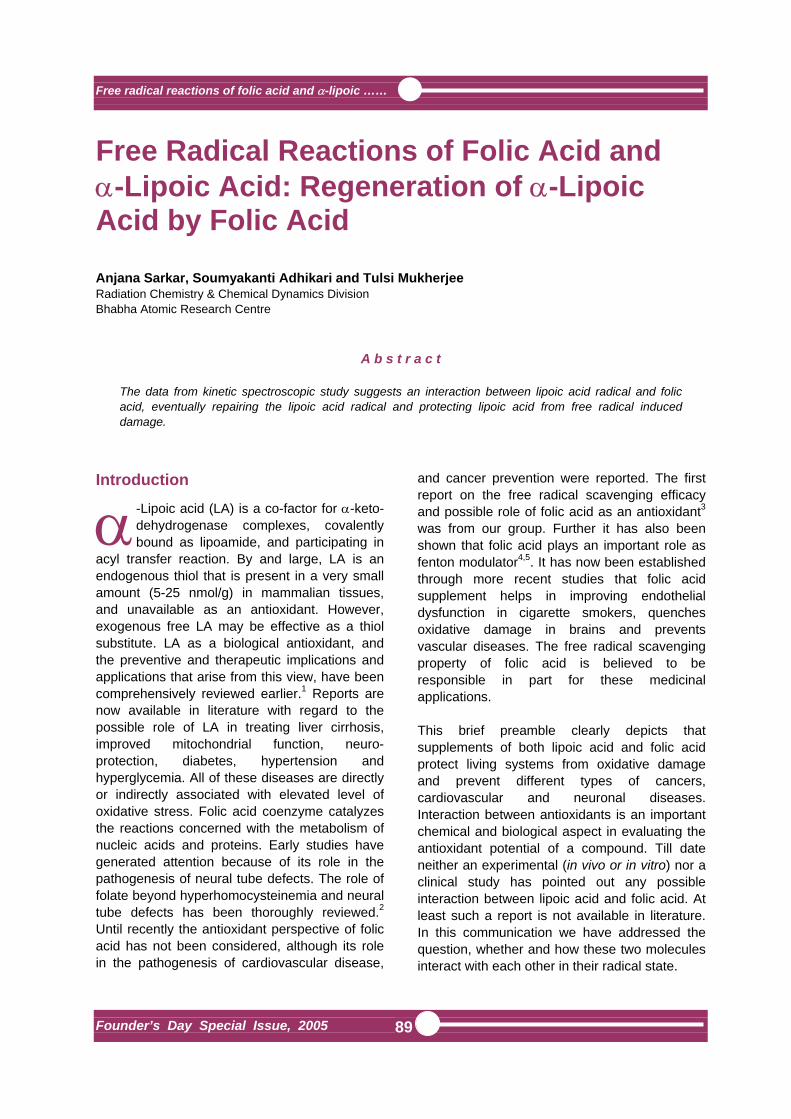
Free radical reactions of folic acid and α-lipoic ……
Founder’s Day Special Issue, 2005
89
Free Radical Reactions of Folic Acid and α-Lipoic Acid: Regeneration of α-Lipoic Acid by Folic Acid Anjana Sarkar, Soumyakanti Adhikari and Tulsi Mukherjee Radiation Chemistry & Chemical Dynamics Division Bhabha Atomic Research Centre
A b s t r a c t
The data from kinetic spectroscopic study suggests an interaction between lipoic acid radical and folic acid, eventually repairing the lipoic acid radical and protecting lipoic acid from free radical induced damage.
Introduction
-Lipoic acid (LA) is a co-factor for α-keto-dehydrogenase complexes, covalently bound as lipoamide, and participating in
acyl transfer reaction. By and large, LA is an endogenous thiol that is present in a very small amount (5-25 nmol/g) in mammalian tissues, and unavailable as an antioxidant. However, exogenous free LA may be effective as a thiol substitute. LA as a biological antioxidant, and the preventive and therapeutic implications and applications that arise from this view, have been comprehensively reviewed earlier.1 Reports are now available in literature with regard to the possible role of LA in treating liver cirrhosis, improved mitochondrial function, neuro-protection, diabetes, hypertension and hyperglycemia. All of these diseases are directly or indirectly associated with elevated level of oxidative stress. Folic acid coenzyme catalyzes the reactions concerned with the metabolism of nucleic acids and proteins. Early studies have generated attention because of its role in the pathogenesis of neural tube defects. The role of folate beyond hyperhomocysteinemia and neural tube defects has been thoroughly reviewed.2 Until recently the antioxidant perspective of folic acid has not been considered, although its role in the pathogenesis of cardiovascular disease,
and cancer prevention were reported. The first report on the free radical scavenging efficacy and possible role of folic acid as an antioxidant3 was from our group. Further it has also been shown that folic acid plays an important role as fenton modulator4,5. It has now been established through more recent studies that folic acid supplement helps in improving endothelial dysfunction in cigarette smokers, quenches oxidative damage in brains and prevents vascular diseases. The free radical scavenging property of folic acid is believed to be responsible in part for these medicinal applications. This brief preamble clearly depicts that supplements of both lipoic acid and folic acid protect living systems from oxidative damage and prevent different types of cancers, cardiovascular and neuronal diseases. Interaction between antioxidants is an important chemical and biological aspect in evaluating the antioxidant potential of a compound. Till date neither an experimental (in vivo or in vitro) nor a clinical study has pointed out any possible interaction between lipoic acid and folic acid. At least such a report is not available in literature. In this communication we have addressed the question, whether and how these two molecules interact with each other in their radical state.
α

Free radical reactions of folic acid and α-lipoic ……
Founder’s Day Special Issue, 2005
90
Materials and methods α-lipoic acid from Aldrich, USA, ethanol from E. MERCK, folic acid from Sigma Chemical Co. and were used as received. All other chemicals were of AR grade. The solvent used was freshly prepared de-ionised ‘nanopure’ water (conductivity < 0.06 µS cm-1) obtained from a Barnstead nano-pure cartridge filtration system (Barnstead Corp., Boston, MA, USA). Pulse radiolysis The pulse radiolysis system using 7 MeV electrons has been described earlier. The dosimetry was carried out using an air-saturated aqueous solution containing 5 x 10⁻² mol dm-3 KSCN assuming Gε for (SCN)2
.- = 23,889 dm3 mol-1 cm-1 per 100 eV at 500 nm. The kinetic spectrophotometric detection system covered the wavelength range from 250 to 800 nm. High purity (> 99.9 %) N2O, from BOC India Pvt. Ltd. was used as per requirement. The bimolecular rate constants were calculated by plotting the pseudo-first order rates of formation of the transients against the concerned solute concentrations. The uncertainty in the measurement in bimolecular rate constant is ±10%. Cyclic voltammetry The experiment was carried out with a cyclic voltammeter (Acochemie Autolab, model PGSTAT 20) using a three-electrode system viz. Ag/AgCl as the reference electrode, a glassy carbon electrode as the working electrode and a platinum wire as a counter electrode. The cell contained 10 mL of the sample solution and 0.1 mol dm-3 KCl. Cyclic voltammetry tracings were recorded from -0.25 to 1.4 V at a scan rate of 50mVs-1. Results and Discussion Before studying the free radical interaction process we felt it is imperative to have an idea about their redox potentials, as this property is very crucial for a better understanding of the electron transfer processes. With this perspective, we have measured the oxidation potential of both lipoic acid and folic acid in the
same medium as that for other experiments. The oxidation potential values were 1.0 V and 0.9 V for lipoic acid and folic acid, respectively (Figure 1), i.e., they are very close to each other. Probably this is the reason why no attempt has been made previously to study their interaction.
Lipoic acid reacts with .C2H4OH radical generating the corresponding radical cation
0.0 0.2 0.4 0.6 0.8 1.0 1.2 1.4
0
10
20
30
b
a
i/A x
104
E/V Fig. 1: Cyclic voltammetric diagrams for a. α-lipoic acid, and b. in ethanolic aqueous (1:1, v/v) solution of folic acid at pH 6.
300 350 400 450 500 550
0.00
0.01
0.02
0.03
0.04
0 200 400
0.000.010.020.030.04 0 20 40
0.000.010.020.030.04
time, µs
∆ A
bsor
banc
e
c
b
a
∆ A
bsor
banc
e
Wavelength, nm
b a
Fig. 2: Transient absorption spectra recorded from an N2O-saturated ethanolic aqueous (1:1, v/v) solution containing 1 x 10⁻³ mol dm-3 α-lipoic acid at pH 6. (a) 20 µs; (b) 50 µs; (c) 430 µs after the electron pulse. Inset: ∆ Absorbance versus time plot for the formation and decay of the lipoic acid radical at 400 nm

Free radical reactions of folic acid and α-lipoic ……
Founder’s Day Special Issue, 2005
91
which has an absorption maximum at around 400 nm (Fig.2). The bimolecular rate constant for this reaction as measured at 400 nm is 5.67 x 10⁷ dm3mol-1s-1. In general, reaction of oxidizing radicals with folic acid generates the phenoxyl radical of folic acid that absorbs at ~430 nm. This radical undergoes molecular rearrangement at a later stage giving rise to an absorption peak at ~390 nm due to a carbon-centered radical. Folic acid reacts with .C2H4OH radical showing a transient absorption spectrum with a maximum at 430 nm due to the phenoxyl radical. The rate constant for the formation of this radical was 5 x 10⁸ dm3mol-1s-1. On pulse radiolysis of a solution containing 1 x 10⁻³ mol dm-3 lipoic acid and 5 x 10⁻⁴ mol dm-3 folic acid, initially lipoic acid radical is formed, with absorption maximum at 400 nm. With the progress of time the absorption peak due to lipoic acid radical diminishes and that of folic acid radical at 430 nm emerges (Figure 3).
Despite the fact that the radicals formed from lipoic acid and folic acid have overlapping absorption bands it is clear that the characteristic changes in the spectra with time are in favour of the folic acid radical formation at
later stages. Only an electron transfer from folic acid to the lipoic acid radical can explain the continuing formation of the folic acid radical and decrease in lipoic acid radical. Thus, an efficient protection of lipoic acid by folic acid from free radical induced damage is evident. Even though the specific effect of α-lipoic acid and DHLA in antioxidant recycling was well established, the molecular level interaction of lipoic acid radical cation with vitamin C, E-analogue and other conventional antioxidants has been reported only recently.6 A closer look at these molecules reveal that the redox potential of the reported antioxidants fall in the range of vitamin C and E. Thus, it is no wonder, that the repair of the lipoic acid radical cation was possible due to the lowoxidation potentials of all these antioxidants including vitamin C and E analogue. The repair of DHLA by folic acid does not need to be addressed here, as the reaction of glutathiyl radical with folic acid and regeneration of the thiol has already been reported earlier.3 The interaction between lipoic acid radical and folic acid may be visualized as an inter-molecular process and governed by diffusion. But we have observed a ground-state interaction between these two molecules. The absorption spectra (Figure 4) of a mixture containing both show a strong interaction between these two molecules. Possibly this interaction facilitates the electron transfer from folic acid to LiPPS.+, in spite of folic acid being a moderate electron donor. A similar repair mechanism is operative in case of peroxyl radical induced oxidation of a mixture of α-lipoic acid and folic acid. The peroxyl radical chosen was trichloro methyl peroxyl radical, generated in mix-solvent (40% 2-propanol, 10% acetone, 50% water, v/v) by radiolysis. Our data on kinetic spectroscopic study suggests an interaction between lipoic acid radical and folic acid, eventually repairing the lipoic acid radical and protecting lipoic acid from free radical induced damage.
380 400 420 440 460 480 5000.005
0.010
0.015
0.020
0.025
cd
b
a
∆A
bsor
banc
e
Wavelength, nm Fig. 3: Transient absorption spectra recorded from an N2O-saturated ethanolic aqueous (1:1, v/v) solution containing 1 x 10⁻³ mol dm-3 lipoic acid and 5 x 10⁻⁴ mol dm-3 folic acid at pH 6. (a) 20 µs; (b) 120 µs; (c) 300 µs and (d) 400 µs after the electron pulse.
Free radical reactions of folic acid and α-lipoic ……
Founder’s Day Special Issue, 2005
92
The electron transfer from folic acid to lipoic acid radical is probably facilitated by the ground-state interaction between these two molecules. Schematically the whole reaction mechanism and the synergism can be represented as follows.
This new synergistic protective role involving folic acid and lipoic acid shows the potential use of these two already established therapeutic agents in combination and will provide a fertile field for continued research. References 1. L. Packer, E. H. Witt and H. J. Tritschler,
Free Radic. Biol. Med., 1995, 19, 227. 2. Y.-I. Kim, Nutr. Rev., 1999, 57, 314. 3. R. Joshi, S. Adhikari, B. S. Patro, S.
Chattopadhyay and T Mukherjee, Free Radic. Biol. Med., 2001, 30, 1390.
4. B. S. Patro, S Adhikari, T Mukherjee and S. Chattopadhyay Bioorg. Med. Chem. Lett. 2005, 15, 67.
5. B. S. Patro, S. Adhikari, T. Mukherjee and S. Chattopadhyay. Free Radical Biol. Med. (in print)
6. Lu, Y. Liu, Arch. Biochem. Biophys. 2002, 406, 78
About the authors …
Ms Anjana Sarkar received her M.Sc. degree in Physical Chemistry from Ruia College, University of Mumbai, in 2001. At present, she is a DAE fellow working in Radiation Chemistry and Chemical Dynamics Division, BARC, persuing her Ph.D. degree on a project entitled “Studies on generation and characterisation of some metal/semiconductor nanoparticles and organic intermediates.”
This paper received the Best Poster award in the International Conference on “Natural Product, Free Radicals and Radioprotectors in Health”, held at Annamalai Nagar during January 17-19, 2004
200 250 300 350 4000.0
0.5
1.0
1.5
2.0
d
a
e
a d
d
c
ba
Abs
orba
nce
Wavelength, nm
Fig. 4: Absorption spectra recorded from an ethanolic aqueous (1:1, v/v) solution containing 5 x 10⁻⁵ mol dm-3 folic acid and different concentration of α-lipoic acid at pH 7 .2 a. only folic acid; b. folic acid + 1 x 10⁻⁴ mol dm-3 α-lipoic acid; c.folic acid + 2.5 x 10⁻⁴ mol dm-3 α-lipoic acid; d. folic acid + 4 x 10⁻⁴ mol dm-3 α-lipoic acid; e. only 4 x 10⁻⁴ mol dm-3 α-lipoic acid

Free radical reactions of folic acid and α-lipoic ……
Founder’s Day Special Issue, 2005
93
Dr Soumyakanti Adhikari joined Chemistry Group in 1991 from the 34th. batch of BARC Training School. He is the recipient of the prestigious IUPAC (International Union for Pure and Applied Chemistry) Prize for Young Chemists in 2001. He had also been conferred the Distinguished Service Award in 2004 from the Asia Pacific Society for EPR/ESR Spectroscopy. Currently, he is holding the honorary post of Secretary General of the Society for Free Radical Research-India. He has been appointed as the Assiatant Editor for the Indian Journal of Radiation Research in 2005. His recent research focus is the mechanistic aspect of free radical interaction of bio and bio-active molecules including natural and synthetic antioxidants.
Dr Tulsi Mukherjee, Director, Chemistry Group, BARC, has been the scientist-in-charge from the very outset in establishing the fast kinetic techniques at BARC over last few 5-year plans with a considerable amount of indigenous efforts. He is the DAE Apex Coordinator for “Advance Research in Chemistry” for Xth 5-year plan. Dr Mukherjee has been the Guest Editor for several volumes of some international journals like Radiation Physics and Chemistry, Research on Chemical Intermediates, Proceedings of Academy of Science, etc. He is in the editorial board of many National and International Journals. He is currently the President, Indian Society for Radiation
and Photochemical Sciences, and Vice-President, Indian Chemical Society. Dr Mukherjee is also the Chairman of the Chemistry Committee for HRDC, BARC. He is a known personality in Chemistry Discipline for his tireless involvement in promoting chemical education and chemical research among Indian colleges and universities.

Heavy metal pollution abatement using …..
Founder’s Day Special Issue, 2005
94
Heavy Metal Pollution Abatement Using Rock Phosphate Mineral Sona Saxena and S.F. D’Souza Nuclear Agriculture and Biotechnology Division Bhabha Atomic Research Centre
A b s t r a c t The low- grade rock phosphate of Jhabua, Madhya Pradesh (India), was investigated for its possible application in the removal of lead, copper, zinc and cobalt ions from aqueous solutions. Effects of contact time, amount of adsorbent and initial concentration of metal ions were studied. Adsorption of heavy metal ions was found to follow the order: Pb2+>Cu2+>Zn2+>Co2+. The probable mechanism of metal ions removal by rock phosphate was found to be by its dissolutions followed by subsequent precipitation.
Introduction
he rapid industrialization and urbanization has resulted in the deterioration of water, air and land quality. Natural waters are
contaminated with several heavy metals arising from mining wastes and industrial discharges. The tremendous increase in the use of the heavy metals over the past few decades has eventually resulted in an increased flux of metallic substances in the environment. The heavy metals are of special concern because they are non-degradable and therefore persistent. Commonly encountered metals of concern include Pb2+, Cu2+, Zn2+, Co2+ etc. These metals are toxic in both their chemically combined forms as well as the elemental form. Exposure to these contaminants present even in low concentration in the environment can prove to be harmful to the human health. In order to solve heavy metal pollution in the environment, it is important to bring applicable solutions. Some in place treatment technologies available for the removal of heavy metal ions from aqueous solutions are chemical precipitation, ion exchange, coagulation, and bioremediation and sorption /adsorption [Sims et al., 1986]. Of all these techniques adsorption at solid substrate is preferred because of its high efficiency, easy handling and cost effectiveness as well as availability of different adsorbents [Mohammad, Mohammad, 1995].
Phosphate minerals have shown to have the potential to remediate heavy metal ions from aqueous solutions. Of all the inorganic phosphate sources apatites are most readily available. High-grade rock phosphates (> 30% P2O5) have already been utilized for the removal of heavy metal ions and have been very effective [Ma et al., 1993; Ma et al., 1995; Rechert and Binner, 1996]. However, the high-grade rock phosphates are not commercially viable due to their high cost. In the present scenario much emphasis have been made on the use of low cost, easily available adsorbents. The naturally occurring low-grade rock phosphates (<15% P2O5) of Jhabua (Madhya Pradesh) are considered as waste by manufacturers of phosphatic fertilizer and presently remain unutilized. We had initiated some work on the use of low-grade rock phosphate of Jhabua (M.P.) for the removal of heavy metals ions Pb2+, Cu2+ and Zn2+ [ Prasad et al., 2000; Prasad et al., 2001]. This paper is the overview of the comparative studies of the effectiveness of this low-grade, low cost rock phosphate mineral in remediating heavy metals like lead, copper, zinc and cobalt from aqueous solutions. Detailed studies on the optimization of different parameters for the removal of cobalt ions by rock phosphate (Jhabua) are in progress.
T

Heavy metal pollution abatement using …..
Founder’s Day Special Issue, 2005
95
Materials and Methods Materials: Representative samples of low-grade rock phosphate from Jhabua (Madhya Pradesh) were collected for the present study with the help of M. P. State Mining Corporation, Bhopal. The samples (1kg) was ground in a ball mill and sized by wet sieve analysis separately for experimental work. The representative ground sample after coning and quartering was subjected to wet chemical analysis. The chemical analysis of rock phosphate is given in Table-1. In the present studies rock phosphate of –150+105 µm size range was used for the removal of metal ions (Pb2+, Cu2+, Zn2+, Co2+) from aqueous solutions. Table 1: Chemical analysis of rock phosphate
sample.
*L.O.I. = Loss on Ignition Mineralogical analysis of rock phosphate sample reports mainly of calcite, apatite and quartz. Dolomite and iron oxide are the other associated gangue minerals [Prasad et al., 1994 ]. Methods: Stock solution (1000 mg/l) of different metal ions (Pb2+, Cu2+, Zn2+, Co2+) were prepared from analytical grade lead nitrate, copper nitrate, zinc nitrate and cobalt nitrate using double distilled water and serially diluted to prepare solutions of varying initial concentration for experimental work. Rock phosphate sample (0.5 g) was equilibrated with 100 ml of solution of different concentration (10, 50 and 100 mg/l) of individual metal ions. The
suspensions were shaken on an orbital shaker at 25oC for 10 min followed by required quiescent contact time. Suspensions were then filtered through Whatman filter paper No. 42. The filtrates were analyzed for metal concentration using atomic absorption spectrophotometer (GBC model No. 932). Results and Discussions Effect of contact time
The effect of contact time on the adsorption of Pb2+, Cu2+, Zn2+, Co2+ was studied for an initial concentration of 50 mg/l. It is observed from Fig 1(a) that the sorption of Pb2+, Cu2+, and Zn2+ is a very fast because equilibrium was reached within 30 minutes. Beyond 30 min adsorption trend was found to remain constant. However, in case of cobalt [Fig. 1 (b)] the adsorption is very slow and equilibrium is reached only in 84 h. It is interesting to notice that the fixation capacities of these metal ions are different despite the same experimental conditions. The
Constituents Weight Percent
P2O5 12.5
SiO2 26.5
CaO 32.6
Fe2O3 1.59
Al2O3 6.08
MgO 0.06
TiO2 .49
F 1.06
*L.O.I. 19.12
Fig. 1(a): Effect of contact time on %
adsorption of lead, copper and zinc by rock phosphate.
Fig.1(b): Effect of contact time on % adsorption
of cobalt by rock phosphate.

Heavy metal pollution abatement using …..
Founder’s Day Special Issue, 2005
96
fast uptake of metal ions Pb, Cu and Zn is certainly related to the availability of active sites on adsorbent surfaces but the preferential attachment of Pb2+ in comparison to Cu 2+, Zn2+ and Co2+ is related to atomic sizes of the cations and Ca2+ released by the adsorbent. Hence, further experiments were carried out by fixing a contact time of 30 min for Pb2+, Cu2+ and Zn2+ and 84 h for Co2+. Effect of amount of adsorbent To study the effect of amount of adsorbent on percent adsorption 0.05g to 5 g of rock phosphate was equilibrated with 50 mg/l of Pb2+, Cu2+, Zn2+, Co2+ solutions. The results are shown in Fig. 2. With the increase in the amount of rock phosphate added the percent adsorption of metal ions also increases. Effect of initial concentration of metal ions To evaluate the effect of initial metal ion concentration on adsorption behavior of Pb2+, Cu2+, Zn2+, Co2+ studies were conducted with initial concentration of 10, 50 and 100 mg/l with
fixed adsorbent dose of 5 g/l. From Table 2 it is clear that when the initial concentration of metal ions is increased from 10 to 100 mg/l , the amount of metal uptake per unit weight of the adsorbent (mg/g) increases whereas the percentage adsorption decreases. This can be explained in terms of relatively lesser number of active sites at higher concentration of metal ions. Similar observations were also made by other investigators [Krishnan and Anirudhan, 2002; Ahmed et al., 2003].
Fig. 2: Effect of amount of adsorbent (rock phosphate) on percent adsorption of lead, copper, zinc and cobalt.
Table 2: Values of percent adsorption and adsorption capacity at different initial concentration
Initial
conc.
mg/l
% Adsorption
Pb Cu Zn Co
Removal capacity (mg of metal/ g of rock phosphate) Pb Cu Zn Co
10 99.92 99.0 97.0 88.4 1.998 1.998 1.980 1.768
50 99.76 90.0 80.0 40.0 9.976 9.0 8.00 4.00
100 93.0 84.0 76.6 25.8 18.60 16.8 15.32 5.16

Heavy metal pollution abatement using …..
Founder’s Day Special Issue, 2005
97
Mechanism of removal of metal ions by rock phosphate The exact reaction mechanism responsible for the removal of metal ions by rock phosphate/ apatite is still unknown. But the sorption process, which generally involves species attachment from a solution to its co-existing solid surface by three types, namely surface adsorption, absorption or diffusion into the solid and precipitation or co precipitation appears to be the governing mechanism for the retention of metal ions by rock phosphate. It has been shown that the primary mechanism of metal ion removal by rock phosphate is governed by its dissolution in acidic environment followed by subsequent precipitation, recent evidences supports the removal to be governed by dissolution- precipitation mechanism. Hence, the process may be reduced to a generalized sorption process. Ca10(PO4)6F2 + 12 H+ 10Ca2+ + 6H2PO4
- + 2F- (1) dissolution 10M2+ + 6H2PO4-+2F- M10(PO4)6F2 + 12H+ (2)
precipitation In addition to the above hypothesis, where P in the form of H2PO4
- helps in precipitating metal ions in aqueous solutions, the possibility of exchange of Ca by metal ions cannot be ruled out. It may be interpreted that the dissolution of apatites also provides Ca, which exchanges with the aqueous metal leading to the precipitation of
corresponding mineral phase. This becomes clearer from Fig. 3. The higher the solubility of rock phosphate the more effective they are in removing metal ions. There are different theories such as free energy, rates of complex formation, ionic radius etc for binding of metal ions onto a given adsorbent, which provide insights into the factors governing the complex formation and ion exchange. It has been reported [Christopher et al., 2002] that in ion exchange process larger multivalent ions are more effectively removed in comparison to smaller ones. There is in fact isomorphic substitution of calcium with heavy divalent ions, which is correlated to their ionic radius and elcetronegativity [Perrone et al., 2001]. The hydrated radius of an ion is a function of charge and ionic radius, which dictates the removal phenomenon. The higher removal of Pb2+ having high electronegativity and ionic radius 1.20 Å is attributed to the fact that the ionic radius of Pb2+ is very close to the ionic radius of Ca2+ 0.99 Å. Cu2+ (ionic radius 0.79 Å) having smaller ionic radius than Ca2+ and high electronegativity show intermediate behavior. On the other hand Zn2+ with ionic radius 0.75 Å smaller than Ca2+ and low electronegativity is exchanged to a lesser extent than copper but more than cobalt. Co2+ on the other hand having high electronegativity but very small ionic radius 0.65 Å is hardly removed.
(A) (B)
Fig.3: Unit cell of rock phosphate (A) before and (B) after interaction with heavy metal ions

Heavy metal pollution abatement using …..
Founder’s Day Special Issue, 2005
98
Hence, higher removal of Pb may be attributed to the fact that the ionic radius of Co2+, Zn2+ and Cu2+ is smaller than the ionic radius of Ca2+ (0.99 Å) and Pb (1.20 Å). It corroborates the observations of earlier investigators [Le Geros and Le Geros, 1984; Yuping et al., 1994 ] that cations whose ionic radius were smaller than Ca2+ may be incorporated in the apatite lattice to a much lesser extent then those ations of larger ionic radius. This may be the reason for lower removal of Co2+, Zn2+ and Cu2+ in comparison to Pb2+. Conclusions The objective of this work was to study the effectiveness of the rock phosphate mineral of Jhabua (M.P.) in removing different heavy metal ions from aqueous solutions. 1. From the study of equilibration time,
between the metal ion studied the following tendency is observed Pb2+>Cu2+>Zn2+>Co2+. The maximum removal of Pb2+, Cu2+ and Zn2+was attained within 30 min of equilibration and on the other hand Co2+
removal being very slow needed 84 h equilibration time.
2. The increase in the quantity of rock
phosphate results in the increased removal of metal ions. The removal of heavy metal ions by rock phosphate is governed by dissolution of rock phosphate followed by subsequent precipitation.
3. Ionic theory holds good and justifies the
order of affinity (Pb2+>Cu2+>Zn2+>Co2+ ) of adsorbent for the removal of heavy metal ions. Hence, it can be concluded that the low grade rock phosphate of Jhabua (M.P.) are more effective in removing Pb2+ ions from aqueous solutions.
Acknowledgement The authors are grateful to M.P. State Mining Corporation, Bhopal for providing the rock phosphate samples. Sona Saxena acknowledges the financial assistance made by Board of Research in Nuclear Sciences,
Department of Atomic Energy, and Govt. of India, in the form of a postdoctoral fellowship. References 1. Ahmad, S.; Khalid, N.; Daud, M. Cadmium
decontamination from aqueous media using Lateritic Minerals. Sep. Sci. Technol. 38: 2003-20024; 2003.
2. Christopher, J.G.; Tran, Tri D.; Suffet Meu, H.I. Electrosorption of inorganic salts from aqueous solutions using carbon aero gels. Environ. Sci. Technol. 3010-3019; 2002.
3. Krishnan K. A.; Anriudhan T.S.A preliminary examination of the adsorption characteristics of Pb(II) ions using sulphurized activated carbon prepared from bagass pith. Ind. J. Chem. Technol. 9: 32-40; 2002.
4. Le Geros, R.Z.; LeGeros J.P. Phosphate minerals in human tissues. In Phospahte Minerals; Nriagu J.O., Moore P.B. Eds.; Springer-Verlag; Berlin, 351-385; 1984.
5. Ma, Q.Y.; Traina, S.J.; Logan, T.J.; Ryan, J.A. In situ lead immobilization by apatite. Environ. Sci. Technol, 27: 1803-1810; 1993.
6. Ma, Q.Y.; Logan, T.J.; Traina, S.J. Lead immobilization from aqueous solutions and contaminated soils using phosphate rocks. Environ. Sci. Technol., 29: 1118-1126; 1995.
7. Mohammad A.; Mohamed, N.P.A. Physico-chemical adsorption treatment s for minimization of heavy metal contents in water and wastewaters. J. Sci. Ind. Res., 56: 523-539; 1997.
8. Perrone, J.; Fourest, B.; Giffaut, E. Sorption of nickel on carbonate fluoroapatites. J. Colloid Interface Sci. 239: 303-313; 2001.
9. Prasad, M.; Majumdar, A.K.; Rao, G.M.; Rao, T.C. Flotation studies on a low-grade cherty calcareous rock phosphate ore from Jhabua, India. Minerals and Metallurgical Processing. 12: 92-96; 1994.
10. Prasad, M.; Saxena, S.; Amritphale, S. S.; Chandra, N. Kinetics and isotherm for aqueous lead adsorption by natural minerals’, Ind. Eng. Chem. Res. 39: 3034-37; 2000
11. Prasad, M.; Saxena, S.; Amritphale, S. S.; Chandra, N. Detoxification of aqueous

Heavy metal pollution abatement using …..
Founder’s Day Special Issue, 2005
99
zinc using fluoroapatite bearing lean grade rock phosphate. Environ. Technol. 22:
367-71; 2001. 12. Rechert, J.; Binner, J.G.P. An evaluation of
hydroxyapatite based filters for the removal of heavy metal ions from aqueous solutions. J. Mat. Sci. 31: 1231-1241; 1996.
13. Sims, R. ; Sorensen, D.; Sims, J.; Lean Mc,
J.; Mahmood, R.; Dupont, R.; Jurinak, J.; Wagner, K. Contaminated surface soils: in place treatment techniques. Noyes Publications Park Ridge. NJ 1986.
14. Yuping, X.; Schwartz, F.; Traina, S.F. Sorption of Zn2+ and Cd2+ on hydroxyapatite surface. Environ. Sci. Technol. 28; 1472-14580:1994.
About the authors …
Dr Sona Saxena obtained her Ph.D. in chemistry for her thesis “ Removal of toxic elements from aqueous solutions using different substrate materials”. She was the recipient of Dr K.S. Krishnan research associateship in the year 2002 (5th batch) at BARC, Mumbai. Her field of research interest is on remediation of metal/radionuclide pollutants. She has to her credit eight scientific papers in international journals and five papers in international and national conference proceedings. At present she is working as R&D in-charge in Associated Environmental Engineers Ltd., Vadodara, which is a part of United Phosphorus Ltd.
Dr S. F. D'Souza is currently the Head of the Nuclear Agriculture and Biotechnology Division of BARC. He obtained his Ph.D. in Biochemistry from University of Mumbai. His major research interest are in the field of Enzyme and Microbial Biotechnology with special reference to immobilized cells for use in bioprocessing, biosensors and bioremediation. He has to his credit over 100 scientific papers in international/ National journals. He is a member/expert at National Scientific committees including Member of the DBT-Task Force on
“Biotechnological Approaches for Food and Nutrition Security”, Vice President of ‘Biosensor Society of India, Member of the Board of Studies and Research Advisory Committees and has guided a number of Ph.D. and M.Sc. Theses. He is the recipient of the AMI- LOUIS PASTEUR AWARD for his significant contributions to the field of Microbiology and has been honoured as a Fellow of the National Academy of Science, Fellow of the Association of Food Scientists & Technologists, and Fellow of the Maharashtra Academy of Science.
This paper received the Best Poster award at the International Workshop on “Marine Pollution and Ecotoxicology” held at National Institute of Oceanography, Goa, during February, 2004

Induction of hairy roots in Gmelina arborea Roxb. ….=
Founder’s Day Special Issue, 2005
100
Induction of Hairy Roots in Gmelina arborea Roxb. Using Agrobacterium rhizogenes Shrutika Dhakulkar and Sujata Bhargava Department of Botany, University of Pune, Pune and T.R. Ganapathi, and V.A. Bapat
Nuclear Agriculture and Biotechnology Division Bhabha Atomic Research Centre
A b s t r a c t Seedling tissues of Gmelina arborea, a medicinally important tree species, were infected with wild type Agrobacterium rhizogenes strain ATTCC 15834, which led to the induction of hairy roots in 32% of the explants. Transgenic nature of the hairy roots was confirmed by PCR using rolB specific primers, and subsequently by Southern analysis of the PCR products. Eight transformed clones of hairy roots were established and grown in liquid medium for the analysis of secondary metabolites.
Introduction
enetic transformation of plants using Agrobacterium rhizogenes, the causative agent of hairy root disease in several
plants, has emerged as an important alternative to intact plants as well as cell cultures for the production of secondary metabolites (Giri and Narasu, 2000; Christey, 2001). Hairy roots have been reported to yield higher amounts of secondary metabolites than cell suspension cultures and in some cases, intact plant roots (Allan et al., 2002). The molecular mechanism involved revealed that hairy roots emerge because of integration of bacterial gene to plant genome, which is a result of a complex genetic engineering event passing through several steps. Several compounds having bioactive properties have been isolated from plants of diverse origin and have been widely used in pharmaceuticals. Due to enhanced demand for plant products, plants have been indiscriminately harvested cut for their products. This has not been appropriately balanced by growing new plants. There are other parameters, which control the content of a particular compound in the plant. It
is essential to have plants with desired level of compound that is not influenced by physical, chemical or biological factors. This has necessitated the search for other sources. Among the other alternatives for plant products, plant cell cultures have been widely studied for the production as well as for understanding the basic mechanism involved in the synthesis of a particular compound. Cell cultures grown under control conditions in a defined medium and free from environmental fluctuations. The growth cycle of cells in culture is fast and short compared to plants. Recently, cell cultures have been widely used in genetic engineering of plants, which have opened up new frontiers to understand and produce valuable plant products in desirable quantity. Several genes of interest have been incorporated to the plant genome for better yield of the products. However, the major limitation of cell cultures is their instability during long-term cultures and low product yields. To alleviate these problems, hairy roots offer unique advantages in their genetic and biosynthetic stability (Bapat and Ganapathi, 2005). They can be used as continuous source of various secondary metabolites. They have fast doubling time and it is easy to maintain them in simple
G

Induction of hairy roots in Gmelina arborea Roxb. ….=
Founder’s Day Special Issue, 2005
101
hormone free media. It has been found that they contain higher levels of secondary metabolites than callus or cell suspension cultures (Giri and Narasu, 2000).
Reports on genetic transformation of tree species are limited due to their recalicitrance and long life cycle. In this presentation, we report the induction of hairy roots in Gmelina
Fig.1: Induction of hairy roots in Gmelina arborea Roxb. A: Gmelina arborea plant in natural habitat; B: In vitro germinated seedlings; C: Pre-cultured cotyledon segments; D: Induction of hairy roots from the cut portion of cotyledon; E: Establishment of hairy roots in B5 medium; F: PCR analysis of hairy roots (Note the amplification of 780 bp rol B gene fragment in positive control (PC) and transformed hairy roots (1-8); and G: Southern analysis of the PCR products (M: Molecular weight marker, PC: Positive control, NC: Negative control, 1-8: Transformed root lines.)
Induction of hairy roots in Gmelina arborea Roxb. ….=
Founder’s Day Special Issue, 2005
102
arborea Roxb. an important timber-yielding tree from the family Verbenaceae and is naturally distributed in the moist deciduous forests of South East Asia (5-30oN latitude; 70-110oE longitude) (Fig. 1A). It is valued for its medicinal properties. Almost all parts of this tree are used in folk medicine for treating various stomach disorders, fevers and skin problems (Sharma et al., 2001). Roots of Gmelina are used in commercial Ayurvedic preparations (Tewari, 1995). The plant extracts are reported to exhibit anti-inflammatory and wound healing properties (Shirwaikar et al., 2003) and are also known to inhibit platelet aggregation (Faiza and Darakhshanda, 1998). Chemical constituents of Gmelina include lignans (Anjaneyulu et al., 1977), flavonoids (Nair and Subramanian, 1975), iridoid and phenylpropanoid glycosides (Hosny and Rosazza, 1998) and an isoxazole alkaloid (Barik et al., 1992). The induction of hairy roots is advantageous to explore the alternative source of these medicinal compounds present in this tree species. Materials and Methods Plant Material Seeds of Gmelina arborea were surface sterilized by immersing them in 1% bavistin (Carbendazim, BASF) solution containing 2 drops of Tween 20 for 2 h. After rinsing them once with 70% ethanol, the seeds were treated with 0.1% mercuric chloride for 10 min. Finally, rinsed four times with sterile distilled water. The seeds were germinated on modified MS (Murashige and Skoog, 1962) medium, which consisted of half strength MS macro elements (with complete omission of NH4NO3 and addition of full strength CaCl2.H2O), full strength MS minor salts and organic supplements, and 1.5% w/v sucrose for germination (Fig. 1B). Induction and establishment of hairy root cultures Wild type Agrobacterium rhizogenes ATCC 15834 (harboring pRi 15834) was used for hairy root induction. Different seedling explants like root, stem, leaf, hypocotyl, cotyledons, cotyledonary nodal segments and embryo axis were isolated from in vitro grown seedlings.
Cotyledons were isolated after 5 days, 15-20 days and 25-30 days from the in vitro grown seeds (Fig. 1C). All the explants were pre-cultured for two days on MS basal medium. The explants were co-cultivated with bacterial suspension for 30 min. After three days, they were transferred to MS medium supplemented with cefotaxime 400mg/l. Cefotaxime concentration was then halved each week from 400mg/l to 50mg/l, and finally cultures free of Agrobacterium rhizogenes were transferred to B5 (Gamborg et al., 1968) medium solidified with 0.2% Phytagel (Sigma). Hairy roots, which arose mainly from the cut surfaces of the explants, were separated, when they attained a length of 4-5 cm. All the cultures were maintained in complete darkness at 25 ± 2°C. Excised roots of in vitro germinated seedlings were cultured similarly and served as controls. Six different hairy root lines were established. These lines were maintained by subculture of 3-4 cm long pieces on B5 solid medium for four weeks. The hairy root cultures were also maintained in B5 liquid medium on a rotary shaker (80 rpm) in complete darkness. PCR analysis of hairy roots Genomic DNA was extracted using CTAB method (Doyle and Doyle, 1987) from each of the hairy root lines as well as from control non-transformed roots. PCR primers specific for the amplification of the 780 bp fragment of the rol B gene were used. A 50 µl PCR mix contained 200 ng of DNA, 10 pmoles primers, 200 µM dNTP mix, 1U of Taq DNA polymerase, 1X PCR buffer and 2 mM MgCl2. PCR conditions were 94°C for 5 min, 42 cycles of 94°C for 1 min, 52.5°C for 1.5 min and 72°C for 2 min. and a final extension at 72°C for 10 min. The sequences of the primers used in the PCR are as follows. 1. 5’ATGGATCCCAAATTGCTATTCCCCC ACGA3’ and 2. 5’TTAGGCTTCTTTCATTCGGTTTACTG CAGC 3’ Southern analysis of PCR products The PCR products separated on agarose gels were transferred to nylon membrane (Hybond

Induction of hairy roots in Gmelina arborea Roxb. ….=
Founder’s Day Special Issue, 2005
103
N+, Amersham, Pharmacia Biotech) by capillary transfer. The rol B gene amplified from Agrobacterium rhizogenes using the same primers was radiolabeled with α32P dCTP using a random primer kit (BRIT) according to manufacture’s instruction and used for Southern hybridisation. The blotting and subsequent hybridization was carried out according to Sambrook et al. (1989). Results Induction of hairy roots Cotyledon segments co-cultivated with Agrobacterium rhizogenes, resulted in 2-3% hairy root induction. Subsequently, root-induction response of cotyledon explants of varying ages was compared. Cotyledons isolated after 5 days from in vitro grown seeds showed maximum (32%) root induction (Fig. 1D). The time period required for root induction also varied with the age of cotyledon explants. The hairy roots were excised and grown on B5 basal medium (Fig. 1E). Eight different hairy root lines were established on both solid and liquid B5 medium and the hairy root cultures grew luxuriantly as compared to the non-transformed roots cultured similarly. Confirmation of transgenic nature of hairy roots The presence of rol B gene in the hairy root lines was detected by PCR analysis. All transformants showed the presence of diagnostic 780 bp rol B product amplification (Fig. 1F). The PCR products were further analyzed by Southern hybridization using radio labeled rol B fragment as a probe. Only the amplified products of the expected size (780 bp) in the positive control and hairy root lines hybridized with the probe, confirming the identity of this amplification product and the transgenic nature of the hairy root lines (Fig. 1G). Discussion The main objective of this investigation was to establish hairy roots in an important woody medicinal plant Gmelina arborea using Agrobacterium rhizogenes. In the present study,
induction of hairy roots occurred at a 32 % frequency. In other tree species like Azadirachta indica (Allan et al., 2002), a higher frequency of root induction has been reported. The variation in hairy root induction could possibly be attributed to the variation in virulence of different Agrobacterium rhizogenes strains used (Porter, 1991). In Linum flavum hairy roots were initiated from leaf discs with a success rate of approximately 50% using A. rhizogenes strains LBA9402 and TR105. In contrast, very low root induction rates were obtained with strains 15834 and A4 (Lin et al., 2003). In the present study, the best explant for hairy root induction and media for their rapid growth has been optimized. The hairy root cultures established in liquid B5 medium showed high growth rates as compared to non-transformed roots and could prove to be a useful system for production of secondary metabolites present in this important medicinal tree species. This is the first report on the induction of hairy roots in Gmelina arborea. Attempts have been made to use hairy roots not only for secondary metabolite or recombinant protein production but also for the improvement of woody and ornamental plants. Owing to their long generation cycles, tree improvement program are slow and tedious and it is difficult to introduce useful genes for genetic engineering by parental line crossing. Agrobacterium rhizogenes can be employed as rapid and direct route for introduction and expression of specific genes. This significantly reduces the time necessary for tree improvement and gives rise to novel gene combinations that cannot be obtained using traditional breeding methods. In some tree species difficulties in root initiation limits their vegetative propagation. A. rhizogenes can be used for the efficient rooting of the cuttings from recalcitrant woody species (Giri and Narasu, 2000). The hairy roots offer a valuable source of root-derived phyto-chemicals that are useful as cosmetics, pharmaceuticals and food additives. Transformed roots of many plant species have been widely studied for the in vitro production of secondary metabolites (Mukundan et al., 1998). They can be a promising source for the

Induction of hairy roots in Gmelina arborea Roxb. ….=
Founder’s Day Special Issue, 2005
104
continuous and standardized production of secondary metabolites under controlled conditions. They produce secondary metabolites over several successive generations without loosing genetic or biosynthetic stability. This property can be utilized by genetic engineering to enhance their biosynthetic capacity. The secondary metabolite synthesis in hairy roots is influenced by nutritional and environmental factors. The sucrose level, exogenous growth hormone, the nature of nitrogen source and their relative amounts, light, temperature and the presence of chemicals can all affect growth total biomass yield and secondary metabolite production. Optimization of these components would enable enhanced production desired secondary metabolites. Hairy roots would be the best choice for metabolic engineering of the secondary metabolite pathways to enhance the accumulation and secretion of high value metabolites. References 1. Allan, E.J., Eeswara, J.P., Jarvis, A.P.
Mordue, A.J., Morgan, E.D. and Stuchbury, T. Induction of hairy root cultures of Azadirachta indica A. Juss. and their production of azadirachtin and other important insect bioactive metabolites. Plant Cell Rep. 21, 2002, 374-79.
2. Anjaneyulu, A.S.R., Rao, A.M., Rao, V.K., Row, L.R., Pelter, A. and Ward, R.S. Novel hydroxy lignans from the heartwood of Gmelina arborea, Tetrahedron 33, 1977, 133–143.
3. Bapat, V.A. and Ganapathi, T. R. Hairy roots –A novel source for plant products and improvement. Natl. Acad. Sci. Lett. 28, 2005, 61-69.
4. Barik, B.R., Bhowmik, T., Dey, A.K., Patra, A., Chatterjee, A. and Joy, S.S. Premnazole an isoxazole alkaloid of Premna integrifolia and Gmelina arborea with anti-inflammatory activity, Fitoterapia 63/4, 1992, 295–299.
5. Christey, M.C. Use of Ri mediated transformation for production of transgenic plants. In vitro Cell Dev Biol 37, 2001, 687-700.
6. Doyle, J.J. and Doyle, J.L. A rapid DNA isolation procedure for small amount of fresh leaf tissue. Phytochem. Bull. 5, 1987, 547–555.
7. Faiza, H. and Darakhshanda, S. The inhibition of platelet aggregation and related physiological responses with crude drug extract of Gmelina arborea, in: Sixth International Symposium on New trends in Natural Products Chemistry, Publication 1998, 1996, pp. 279–86.
8. Gamborg, O.L., Miller, R.A. and Ojima, K. Nutrient requirement of suspension cultures of soybean cells. Exp. Cell Res. 50, 1968, 151–158.
9. Giri, A. and Narasu, M.L. Transgenic hairy roots: recent trends and applications. Biotechnology Advances18, 2000, 1-22.
10. Hosny, M. and Rosazza, P.N. Gmelinosides, Twelve acylated iridoid glycosides from Gmelina arborea, J. Nat. Prod. 61, 1998, 734–742.
11. Lin, H.W., Kwok, K.H. and Doran, P.M.. Development of Linum flavum hairy root cultures for production of coniferin. Biotechnology Letters 25, 2003, 521-525.
12. Mukundan, U., Rai, A., Dawda, H., Ratnaparkhi, S. and Bhinde, V., Secondary metabolites in Agrobacterium rhizogenes mediated transformed root cultures. In: Plant Tissue Culture and Molecular Biology applications and Prospects (Srivastava, P.S., ed.), , Narosa Publishing House, New Delhi, 1998, pp. 302-331.
13. Nair, A.G.R. and Subramanian, S.S. Quercetagetin and other flavones from Gmelina arborea and G. asiatica, Phytochemistry 14, 1975, 1135–1136.
14. Porter, J.R. Host range and implications of plant infections by Agrobacterium rhizogenes. Critical reviews in Plant Sciences 10, 1991, 387-21.
15. Sambrook, J., Fritsch, E.F.and Manitais, T. Molecular cloning a laboratory manual, Cold Spring Harbour Laboratory Press, Cold Spring Harbour, NY, 1989.
16. Sharma, P.C., Yelne, M.B. and Dennis, T.J. Database on Medicinal Plants Used in Ayurveda, vol. 3, Central Council for

Induction of hairy roots in Gmelina arborea Roxb. ….=
Founder’s Day Special Issue, 2005
105
17. Research in Ayurveda and Siddha, Department of ISM and H Ministry of health and Family Welfare Government of India, 2001, pp. 217–228.
18. Sharma, S.K. and Ramamurthy, V. Micropropagation of 4-year-old elite Eucalyptus terticornis trees. Plant Cell Rep. 19, 2000, 511–518
19. Shirwaikar, A., Ghosh, S. and Rao, P.G.M. Effect of Gmelina arborea Roxb. leaves on wound healing in rats, J. Nat. Remedies 3/1 2003, 45–48.
20. Tewari, D.N. A Monograph on Gamari (Gmelina arborea Roxb.), 1995, pp. 1–84
About the authors …
Ms Shrutika Dhakulkar completed her M.Sc. Bio-chemistry in 2001 from Department of Chemistry, University of Pune, and is currently pursuing her Ph.D in Biotechnology at the Department of Botany, University of Pune, under BARC-UoP Collaborative Research program.
Dr Sujata Bhargava completed her Ph.D. in 1984. Since 1986 she is teaching in the Botany Dept., University of Pune. Her areas of interest include Plant Physiology, Tissue culture and Biotechnology. She has worked on the changes in antioxidant metabolism of plants exposed to herbicide, drought, wounding and pathogen stress, through several research projects funded by UGC, CSIR and DBT. She was a recipient of the DAAD fellowship and has visited Germany several times under this program. More recently she has developed the complete micropropagation protocol for Gmelina arborea, an important timber tree, in a DBT
sponsored project. She has supervised three students for their Ph.D. degrees and has published about fifteen papers in peer-reviewed journals. Currently she is working on the mode of action of beta-aminobutyric acid in induction of resistance to fungal pathogens in a CSIR funded project.
Dr T.R. Ganapathi did his Ph.D. from Karnatak University, Dharwad, and joined BARC in 1991. His specialization is in the field of Plant Tissue Culture.He has standardized micropropagation protocols in banana and the technology has been transferred to user agencies. He has also established methods for somatic embryogenesis and Agrobacterium mediated transformation in banana using embryogenic cell cultures. He was awarded “DBT Overseas Associateship” for his post-doctoral work on genetic transformation in banana at the Boyce
Thompson Institute for Plant Research Inc., Ithaca, NY, USA. He was awarded INS medal in 2004 for his contribution to the banana biotechnological research work. Currently, he is working on Genetic Transformation of Crop Plants.
This paper won the Best Poster Presentation award at the National Seminar on “Assessment, Utilization and Conservation of Biodiversity” held at Department of Botany, University of Pune, Pune, during March 26-27, 2004

Induction of hairy roots in Gmelina arborea Roxb. ….=
Founder’s Day Special Issue, 2005
106
Dr V.A. Bapat, heads the Plant Cell Culture Technology Section of the Nuclear Agriculture and Biotechnology Division, BARC, Mumbai and is actively engaged in the micropropagation of economically important plants such as Sandalwood, Mulberry, Banana and Sugarcane. Banana micropropagation technology has been transferred to user agencies. His research work spanned different areas of plant cell, organ and anther culture, organogenesis, embryogenesis, protoplasts culture and synthetic seed technology. Dr Bapat has immensely worked on in vitro mutagenesis in plants using radiation. In recent years, he and his coworkers are
actively working on genetic engineering of crop plants for disease resistance in Tobacco, Potato and Banana. Delayed fruit ripening in Banana is another project on which Dr Bapat’s group is actively working. Research on hairy root cultures of Gmelina and Potato is also underway in Dr Bapat’s laboratory. In the area of molecular farming, Dr Bapat and his team have demonstrated Hepatitis B Surface Antigen expression in Tobacco, Tomato and Banana plants. Dr Bapat has published more than 125 research papers and reviews in several national and international journals and books. Dr Bapat is Fellow of National Academy of Sciences, India.

In-situ electrolytic reduction of uranium using ….
Founder’s Day Special Issue, 2005
107
In-Situ Electrolytic Reduction of Uranium Using Electropulse Column S.U. Salunke, Tessy Vincent and A.R. Patil Back End Technology Development Division Bhabha Atomic Research Centre.
artitioning of plutonium from uranium is an important step in the reprocessing of spent fuel using PUREX process. It
requires reducing the valency of plutonium in solution to tri-valent state by the addition of the reductant, uranous nitrate. Electrolytic reduction of uranyl ion in presence of hydrazine is the widely employed method for the production of uranous nitrate. But fuels with high plutonium content may require enhanced throughput capacity to accommodate large excess of uranium. To overcome this drawback a method involves in-situ electrolytic reduction in electropulse column has been developed. An electropulse column is essentially a combination of a pulse column and an electrolyser where mass transfer is accompanied by electrolytic process. Important reaction that take place in the electro-pulse column are as follows. Anodic reaction 2H2O O2 + 4H+ + 4e- [E0 = -1.229V] N2H5
+ N2 + 5H+ + 4e- [E0 = -0.23V] Cathodic reactions Pu4+ + e- Pu3+ [E0 = +0.92V] UO2
2+ + 4H+ + 2e U4+ +2H2O [E0= +0.33V] Chemical reaction 2Pu4+ + U4+ + 2H2O UO2+ + Pu3+ + 4H+ Pu (IV) is preferentially reduced to Pu (III) at the cathode as its reduction potential is higher than that of U (IV). By maintaining potential in the range of 100 and –500 mv (with reference to the standard calomel electrode) reduction of U (VI) to U (IV) also takes place. This results in
enhancing the rate of plutonium reduction. The rate of production of U (IV) can be controlled by varying the current input. In-situ electrolytic reduction of uranium was carried out in an electro-pulse column using titanium wire mesh cylinder as cathode and centrally installed tie rod of TSIA as anode. The jacketed column was provided with disengaging sections at either ends. Pulsing was achieved through a three-way solenoid valve. Organic solution and scrub were metered through peristaltic pumps. Flow sheet is given in Fig.1. The column and the solution tanks were maintained at negative pressure by an air ejector system. Gases produced during electrolysis were diluted with adequate volume of air. D.C. power was supplied form100V and 150 A rectifier unit. Operation and testing of electro reduction glass pulse column was carried out under simulated conditions of 1BX and 2BX partitioning columns. 15 electrolytic runs were taken and is summarized in table 1. The column was operated with aqueous phase continuous and jackleg control of interface. Solution of 30% TBP (diluted in n-dodecane), loaded with natural uranium was used as feed, nitric acid as scrub and hydrazine as holding reductant. During experimental runs uranium concentration in organic was varied from 75 to 60 g/L, scrub acidity 1- 0.5M, hydrazine concentration 0.6 - 0.4 M and organic to aqueous ratio varied form 2 to 3.3. In most of the cases the cathodic current density was maintained at 0.03ampere/sq. cm. and pulse frequency at 60 CPM based on the results gained by conducting the runs using glass column[1].
P

In-situ electrolytic reduction of uranium using ….
Founder’s Day Special Issue, 2005
108
1) Loaded organic tank (150L); 2) Scrub acid tank (75L); 3) Electro pulse column (8L); 4) Uranous receiving tank (75L); 5) Lean organic tank (150L)
Fig.1: Flowsheet for in-situ reduction studies
Table 1: Electropulse column test run Data
Cathode area = 700cm2 Hydrazene concentration ~ 0.35-0.6N TBP used = 30% HNO3 acidity ~ 0.5-1M Org. flow rate (LPH)
Aque. Flow rate (LPH)
U con in org (g/L)
Frequency (CPM)
Amplitude(mm)
Current(Amp)
Voltage (V)
U(IV) con (g/L)
Reduction efficiency
12.0 5.0 74.38 60 14 21 2.0 15.59 83.6 13.0 6.0 74.38 60 14 21 2.0 14.7 94.6 12.0 5.0 60.93 75 15 21 2.0 11.54 61.88 13.0 6.0 60.93 75 15 21 2.0 8.06 51.866 21.0 10.5 73.10 60 15 21 2.0 14.88 167.567 21.5 10.0 58.31 60 15 21 2.0 12.79 137.17 32.0 10.0 69.62 60 15 21 2.0 13.98 149.93 30.7 9.3 68.13 60 15 21 2.0 10.56 73.73 30.6 9.9 62.48 60 15 21 2.0 8.93 66.37 21.0 7.0 74.61 60 12 21 2.5 7.47 56.08 20.0 7.0 74.61 60 10 32 3.0 11.35 55.91 23.0 7.0 66.8 60 10 42 3.25 10.35 38.95

In-situ electrolytic reduction of uranium using ….
Founder’s Day Special Issue, 2005
109
Uranium reduction efficiency, Ru was found to be function of the residence time of the organic, uranium concentration in the feed organic, cathodic area, current density and O/A ratio. An increase in residence time from 1.4 to 3.5 resulted in more than 50% increase in efficiency of uranium reduction. Uranium reduction efficiency was found to be increased with higher uranium concentration in organic solution. The equation suggested by Cermak & Spaunburgh [2] was used to calculate uranium reduction efficiency Ru (calculated) = 0.000116 x (Sc /Lo) (f x A) (1 + Pa) (Logi + 2.55) x Co x e(0.883/Ca) Ru = Efficiency of Uranium reduction. % Co = Concentration of U(VI) in organic feed, g/l Ca = Concentration of nitric acid in aqueous feed, M Sc = Surface area of cathode, cm2
Lo = Flow rate of organic feed, ml/min Pa = Phase flow ratio, aqueous to organic f = Frequency of pulsing, cycles/min. A = Pulse amplitude, cm I = Cathode current density, (A/cm2) It is seen that the experimentally determined values of uranium reduction efficiency are much
lower than the calculated values. This may have resulted from limitation of low cathodic area obtainable in the setup, resulting in low Sc/Lo value. This study has demonstrated the feasibility of in-situ reduction of uranium in electro pulse column. However the experiments will have to be continued in improved and larger setup in order to obtain reduction efficiency of an order suitable for plant application. Acknowledgements The authors are grateful to Shri P.Gopinath Ex. Senior chemist, PESD without whose untiring efforts, this work would not have materialized. We are thankful to FRD laboratory for the analytical support and Material Development Section IGCAR, for the development of anode coating. References 1. A.F.Cermak, R.G. Spaunburgh, ‘
Development of Electropulse column for U-Pu partitioning in A.G.N.S
2. P.Gopinath, I.A Siddiqui, BARC/1991/I/011 (1991).
About the authors …
Mr S.U. Salunke joined BARC in year 1973. He is working for various Process development activities related to Fuel Reprocessing plants. Presently he is working in Back End Technology Development Division of Nuclear Recycle Group BARC. Ms Tessy Vincent obtained her M.Tech in Chemical Engineering from Bharathiar University, Coimbatore and joined BARC through 35th batch of Training School. After successfully completing her training course, she was placed in Process Engineering and Systems Development Division in 1992. Since then, she has been actively involved in the research and developmental work related to reprocessing and nuclear
This paper was adjudged as the Best Poster presentation in Separation Science and Technology (SESTEC)-2004 held at Mumbai during July 22-23, 2004

In-situ electrolytic reduction of uranium using ….
Founder’s Day Special Issue, 2005
110
waste management. Her other areas of interest include heavy metal extraction and development of decontamination techniques by supercritical fluids.
Mr A. R. Patil did his Chem. Engg. from UDCT, Mumbai. He joined BARC in 1973. He was associated with erection, testing commissioning, operation and trouble shooting and modifications of India’s first Power Reactor Fuel Reprocessing Plant, PREFRE at Tarapur and later on with design and planning activities for project ROP at Tarapur. He is currently heading Process Engineering Application Section of BETDD for process and equipment related R & D work for Fuel Reprocessing Plants.

Dose inter-comparison of glycine. …..
Founder’s Day Special Issue, 2005
111
Dose Inter-Comparison of Glycine (Spectrophotometric Read-out) System with Fricke Dosimeter, in Product Irradiation Box of Food Package Irradiator S.H. Shinde Radiation Safety Systems Division, Bhabha Atomic Research Centre and T. Mukherjee Radiation Chemistry & Chemical Dynamics Division Bhabha Atomic Research Centre
A b s t r a c t
Dose inter-comparison of glycine (400 mg / 20 ml FX, spectrophotometric read-out) system, useful in the dose range of 15 to 200Gy, was carried out with Fricke system in the irradiation box of the Food Package Irradiator, BARC. Sawdust was used as a simulated product. The maximum difference between the dose-rate value measured by the systems for identical positions in the irradiation box, is ±6%. The results indicate the usefulness of glycine system for food irradiation dosimetry of onions and potatoes, for Co-60 gamma rays. Feasibility of glycine system to be used as transfer dosimeter in various Food Irradiation Plants is being explored.
Introduction
lycine system (spectrophotometric read-out method) is based on indirect oxidation of ferrous ions to ferric ions,
when a known amount of irradiated amino acid powder is dissolved in an aerated aqueous acidic solution containing ferrous ammonium sulphate and xylenol orange. (2) The latter forms a complex with ferric ions and this complex is estimated spectrophoto-metrically. The change in absorbance is related to the absorbed dose. (3) In the present paper, dose inter-comparison of glycine (400 mg / 20 ml FX) system having a dose range from 15 to 200Gy, was carried out with Fricke system in the irradiation box of the Food Package Irradiator, BARC. Sawdust was used as a simulated product. The maximum difference between the dose-rate value measured by the systems for identical positions in the irradiation box is ±6%.
Experimental Reagents All reagents used were of Analytical Reagent grade. Glycine was obtained from Merck (Germany) and Xylenol Orange (XO) from Loba Chemie (Austria). Acidified ferrous ammonium sulphate – Xylenol Orange solutions (FX solution) used for glycine dosimeter and Fricke solution were prepared in singly distilled water. Preparation of dosimeters and irradiation set-up Dosimeter containers, polythene bags and glasswares were cleaned as per the recommended procedure (3). About 410mg of glycine powder was sealed in precleaned polythene bags. Each bag was then inserted into a polystyrene capsule of 6 mm i.d., 20 mm height and 3 mm wall thickness, which provided the necessary build-up for the dosimeters. Fricke dosimetric solution was filled in precleaned
G

Dose inter-comparison of glycine. …..
Founder’s Day Special Issue, 2005
112
polypropylene tubes, each having 13mm o.d., 54 mm height and 1mm wall thickness. Each of these dosimeters was further surrounded by polystyrene build-up cap of 3 mm wall thickness. 9 Fricke dosimeters along with 9 glycine dosimeters were placed on each of perspex sheet as shown in Fig. 1a. Further, three such sheets along with the dosimeters were placed in the product irradiation box filled with simulated product i.e. sawdust. Irradiation setup is as shown in Fig 2.
Spectrophotometric measurements Absorbance measurements were made using a Jasco V-530 spectrophotometer. For Glycine, 400 mg of irradiated / unirradiated powder was dissolved in 20 ml of FX solution containing 2.8 x 10⁻⁴ mol dm-3 ferrous ions and 0.5 x 10⁻⁴ mol dm-
3 Xylenol Orange in 0.155 mol dm-3 sulphuric acid. FX solution was used as reference for absorbance measurements using 10 cm optical cuvettes. The net change in the absorbance at 547 nm between the irradiated and unirradiated dosimeter was calculated and used for determining the corresponding dose from the dose response graph obtained for Co-60 gamma rays. For Fricke dosimeter, absorbance
Fig.1: (a) Placement of dosimeters on aPerspex sheet
1 Irradiation box filled with sawdust, 2 perspex sheets, 3 Source racks, 4 conveyor belt Fig. 2: Irradiation set-up of box in
multipurpose irradiator, showing the placement of three perspex sheet inside the box
Plane A
Plane B
Plane C
Fig. 1: (b) Positions of dosimeters placed on the perspex sheets

Dose inter-comparison of glycine. …..
Founder’s Day Special Issue, 2005
113
measurements and dose evaluations were carried as per the recommended procedure (1). Results and Discussions Dose inter-comparison between Glycine (400 mg / 20 ml FX) system was carried with Fricke system. There is a good agreement between the dose-rate values measured by both the systems
for identical positions in the irradiation box, as seen from the Table 1. The maximum difference between the dose rate value measured by the systems for a particular position in the irradiation box is ±6%. These results indicate the usefulness of glycine system for food irradiation dosimetry of onions and potatoes.
Table 1. Dose inter-comparison between glycine and Fricke systems
Plane Position Fricke dose Glycine dose Glycine value No. value, Gy value, Gy Fricke value
A 1 110.79 116.16 1.05 2 108.12 112.06 1.04 3 134.94 133.55 0.99 4 149.44 158.13 1.06 5 147.86 156.97 1.06 6 146.66 147.57 1.01 7 128.29 128.80 1.00 8 125.73 128.45 1.02
B 9 91.06 94.24 1.03 10 90.70 92.60 1.02 11 91.92 90.65 0.99 12 91.22 91.96 1.01 13 91.89 91.19 0.99 14 94.15 95.16 1.01 15 96.62 98.24 1.02 16 96.57 97.16 1.01
C 17 133.08 130.72 0.98 18 128.68 128.27 1.00 19 121.34 125.52 1.03 20 134.47 133.76 0.99 21 132.94 131.82 0.99 22 154.95 162.61 1.05 23 144.10 147.10 1.02 24 142.01 148.91 1.05

Dose inter-comparison of glycine. …..
Founder’s Day Special Issue, 2005
114
Acknowledgements Authors express their sincere thanks to Mr V.V. Shaha, Head, Radiation Standards Section and Dr D.N. Sharma, Head, Radiation Safety Systems Division for their encouragement in this work. Also the authors thank Chemical Dosimetry Group, Radiation Safety Systems Division and Dr A.G. Behere, Food Technology Division for valuable guidance and discussions, which made completion of this work possible.
References 1. ASTM E 1026 – 95, Standard Practice for
using the Fricke Reference Standard Dosimetry system.
2. Gupta, B.L., Bhat, R.M., Narayan, G.R. and Nilekani, S.R., Oxidation of ferrous ions by irradiated solid amino acids. Radiochemistry and Radiation Chemistry Symp., IIT, Kanpur, 296 (1985).
3. Gupta, B.L., Bhat, R.M., Narayan, G.R., and Nilekani, S.R., A spectrophotometric read-out method for free radical dosimetry. Radiat. Phys. Chem. 26(b), 647 (1985)
About the authors …
Mr S.H. Shinde is presently working in Radiation Safety Systems Division of Health, Safety and Environment Group, BARC. He is currently involved in research and development of chemical dosimeters, especially amino acid dosimeters based on spectrophotometric read-out method. .
Dr Tulsi Mukherjee is currently Director, Chemistry Group, BARC. His research expertise is in the areas of radiation chemistry, photochemistry and laser chemistry. He has nearly 200 journal publications and several awards to his credit.
This paper was adjudged as the Best Poster in NAARRI Conference 2004 held in Mumbai.

One-electron oxidation of selenomethionine …..
Founder’s Day Special Issue, 2005
115
One-Electron Oxidation of Selenomethionine in Aqueous Solutions B. Mishra, K. I. Priyadarsini and H. Mohan Radiation Chemistry & Chemical Dynamics Division Bhabha Atomic Research Centre,
A b s t r a c t Pulse radiolysis technique has been employed to study one-electron oxidation of seleno methionine (SeM) in aqueous solutions and hydroxyl radicals (OH) and specific one-electron oxidants have been used to induce oxidation. Hydroxyl radicals react with SeM at pH 7to form transient absorbing at 380 nm, which is assigned to intra-molecularly stabilize radical cation between oxidized selenium and nitrogen. At pH 1, dimer radical cation having absorption maxima at 480 nm is formed. The pH of the solution was observed to play an important role on the nature of transient species formed on oxidation. Cyclic voltammetry and pulse radiolysis studies revealed that one-electron oxidation of selenomethionine is easier compared to methionine.
Introduction
he radiation chemistry of organic sulfur (S) and selenium (Se) compounds in aqueous solutions are of current interest as the
radical species generated from these compounds are considered to be possible intermediates in redox reactions of S/Se-compound.1-2 Many of these compounds find applications as radioprotectors and are important building blocks for the synthesis of biologically important molecules. Even though S & Se belong to the same group in the periodic table, the chemistry of Se and tellurium compounds has been found to be different due difference in ionization potential, electronegativity and polarizablitity. One-electron oxidation of methionine has been studied and a few reports are available in literature.3 In order to understand the effect of selenium on the oxidation mechanism of methionine, detailed radiation chemical studies on aqueous solution of selenomethionine (SeM) have been carried out.
Experimental Section The solution of SeM (Aldrich chemicals) was prepared in nanopure water in phosphate buffers. Pulse radiolysis experiments were
carried out with high energy electron pulses (7 MeV, 50 ns) obtained from a linear electron accelerator. The dose for the experiment was ~9-10 Gy / pulse. Reaction of OH radical was carried out in N2O saturated aqueous solution and reaction with specific one electron oxidant. The reaction with H atom was carried out at pH 1 in presence of t-buatanol to scavenge OH radical. Results and Discussion SeM is reported to have two pKa values of 2.35 and 9.2 with an isoelectric point at 5.75, corresponding to COOH and NH3
+ groups respectively. It is present in different forms at different pH (scheme 1). In the zwitterionic form the NH3
+ and COO- are exceptional proton-donor and -acceptor groups respectively and the fast proton transfer provide enough concentration of an unprotonated amino group at neutral pH. However in acidic solutions (pH < 2), proton exchange from NH3
+ can no longer take place effectively. Reaction of OH radicals at pH 7 The transient absorption spectrum obtained on pulse radiolysis of N2O-saturated aqueous solution of SeM exhibits a broad absorption
T

One-electron oxidation of selenomethionine …..
Founder’s Day Special Issue, 2005
116
band with λmax at 380 nm with a small shoulder in 280 – 290 nm region (Fig 1a). The absorption band at 380 nm decayed by first order kinetics with k = 1.2x10⁴ s-1 and is unaffected by the presence of O2, suggesting the absence of a carbon centered radical. The transient absorbance at 380 nm remained independent of solute concentration, suggesting the formation of a monomeric species. H atom reaction with SeM did not produce any transient even at pH 1, which shows that the transient spectrum (Fig 1a or 1c) is mainly due to the reaction of OH radicals with SeM. Based on these studies and the data available for organic sulfur compounds, the transient absorption band at 380 nm could be due to one
of the three possibilities, viz., (1) OH-adduct at selenium, or (2) intra-molecularly stabilized 5-membered ring between oxidized selenium and nitrogen, (3) intra-molecularly stabilized 6-membered ring between oxidized selenium and oxygen of either carbonyl or OH group and (4) selenium centered radical cation. In analogy with studies reported for dialky sulfides, Se centered radical cation would be highly unstable and will have high tendency to stabilize on coordination with another Se or heteroatom. Due to higher difference in the electronegativity of Se and O (1.02 eV) as compared to Se and N (0.59 eV), intra-molecularly stabilized 6-membered ring configuration is expected to be less stable.
Fig.1: Fig 1a and c shows difference absorbance obtained on pulse radiolysis of N2O
saturated solution of SeM (0.5 mM) at pH 7 & 1 respectively. Inset (b) shows absorbance at 380 nm (o) and 480 nm () as a function of pH. Inset (d) shows variation of absorbance at 480 nm as a function of SeM concentration at pH 1.

One-electron oxidation of selenomethionine …..
Founder’s Day Special Issue, 2005
117
The reaction of SeM with specific one electron oxidation (Br2
-, (SCN)2-) at pH 7 produced
similar spectrum suggesting that the transient is one electron oxidized species and not OH adduct. Based on these studies, the transient absorption band at 380 nm is assigned to intra-molecularly stabilized 5-membered ring formed between oxidized selenium and nitrogen (scheme 1).
Reaction of OH radicals in acidic conditions As the pH of the solution is decreased, the transient absorbance at 380 nm decreases with the appearance of a new band at 480 nm. The variation of absorbance at 380 and 480 nm, formed on pulse radiolysis of N2O-saturated aqueous solution of SeM (5x10⁻⁴ M), as a function of pH (Fig 1b) gave an inflection point at 2.2. The transient absorption spectrum obtained on pulse radiolysis of N2 saturated aqueous solution of SeM (1 mM at pH 1), showed the formation of a transient absorption band at 480 nm (Fig 1c). At pH 7, 480 nm band is almost absent. Also the absorbance at 480 nm was observed to increase with increasing concentration of SeM (Fig 1d). This increase in the absorbance is due to the reaction of initially
formed transient species with SeM suggesting the formation of a dimeric species. The transient absorption band at 480 nm decayed by second order kinetics with 2k/εl value of 1.6x10⁵ s-1 and remained same in N2O/O2 conditions. The kinetic and spectroscopic properties of the transient species formed on reaction of OH radicals with SeM at pH 1 were different from those observed at pH 7. In order to identify the nature of the transient species formed on reaction of OH radicals with SeM at pH 1, pulse radiolysis studies were carried out with various specific one-electron oxidants (Cl2-, Tl+) at pH 1. The nature of the transient absorption band at pH 1, formed on reaction with specific one-electron oxidants was similar to that formed on reaction of OH radicals with SeM at pH 1. The absence of any vacant orbital on the nitrogen atom of NH3
+ group does not allow formation of intra-molecular bonding between oxidized selenium and nitrogen. Based on these studies and also the results available in literature on organic sulfur compounds, the transient absorption band is assigned to dimer radical cation formed on p orbital overlap of oxidized Se with Se of another SeM .
Scheme 1
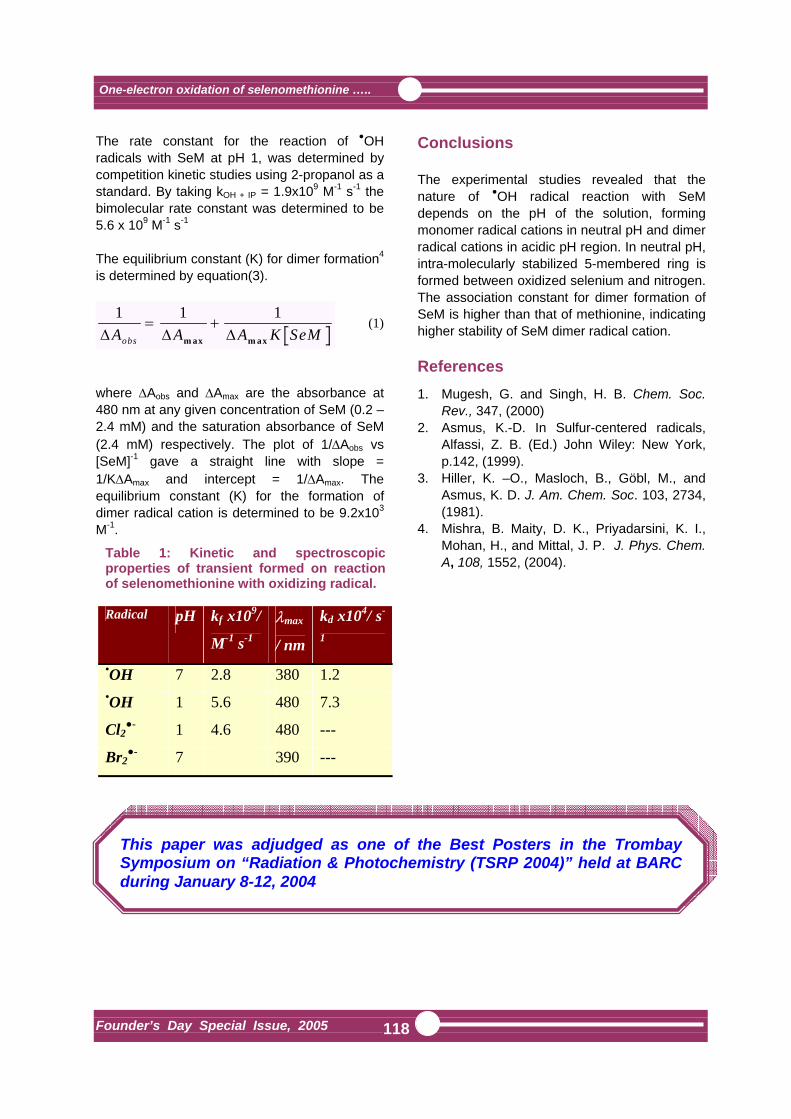
One-electron oxidation of selenomethionine …..
Founder’s Day Special Issue, 2005
118
The rate constant for the reaction of OH radicals with SeM at pH 1, was determined by competition kinetic studies using 2-propanol as a standard. By taking kOH + IP = 1.9x10⁹ M-1 s-1 the bimolecular rate constant was determined to be 5.6 x 10⁹ M-1 s-1
The equilibrium constant (K) for dimer formation4 is determined by equation(3).
1 1 1∆ ∆ ∆A A A K SeMobs
= +m ax m ax
(1)
where ∆Aobs and ∆Amax are the absorbance at 480 nm at any given concentration of SeM (0.2 – 2.4 mM) and the saturation absorbance of SeM (2.4 mM) respectively. The plot of 1/∆Aobs vs [SeM]-1 gave a straight line with slope = 1/K∆Amax and intercept = 1/∆Amax. The equilibrium constant (K) for the formation of dimer radical cation is determined to be 9.2x10³ M-1.
Conclusions The experimental studies revealed that the nature of OH radical reaction with SeM depends on the pH of the solution, forming monomer radical cations in neutral pH and dimer radical cations in acidic pH region. In neutral pH, intra-molecularly stabilized 5-membered ring is formed between oxidized selenium and nitrogen. The association constant for dimer formation of SeM is higher than that of methionine, indicating higher stability of SeM dimer radical cation. References 1. Mugesh, G. and Singh, H. B. Chem. Soc.
Rev., 347, (2000) 2. Asmus, K.-D. In Sulfur-centered radicals,
Alfassi, Z. B. (Ed.) John Wiley: New York, p.142, (1999).
3. Hiller, K. –O., Masloch, B., Göbl, M., and Asmus, K. D. J. Am. Chem. Soc. 103, 2734, (1981).
4. Mishra, B. Maity, D. K., Priyadarsini, K. I., Mohan, H., and Mittal, J. P. J. Phys. Chem. A, 108, 1552, (2004).
This paper was adjudged as one of the Best Posters in the Trombay Symposium on “Radiation & Photochemistry (TSRP 2004)” held at BARC during January 8-12, 2004
Table 1: Kinetic and spectroscopic properties of transient formed on reaction of selenomethionine with oxidizing radical. Radical pH kf x109/
M-1 s-1 λmax
/ nm
kd x104/ s-
1 •OH 7 2.8 380 1.2 •OH 1 5.6 480 7.3
Cl2- 1 4.6 480 ---
Br2- 7 390 ---

One-electron oxidation of selenomethionine …..
Founder’s Day Special Issue, 2005
119
About the authors …. Ms Beena Mishra received her M.Sc. degree in Chemistry with specialization in Inorganic Chemistry from Institute of Science, Mumbai, in 2001. She stood second in M. Sc. in Mumbai University. She is a DAE fellow working in Radiation Chemistry & Chemical Dynamics Division, BARC. She is persuing her Ph. D. degree in the subject entitled. “Free radical and transient studies of some biologically important organic and organometallic compounds”.
Dr K. Indira Priyadarsini is currently working on the elucidation of mechanisms of antioxidant action involving natural products and herbal extracts with the potential application as radioprotectors, employing electron pulse radiolysis and in vitro biochemical studies. Dr Priyadarsini has co-authored more than 95 papers in peer reviewed international journals on radiation chemistry, photochemistry and radiation biology. She has been elected as the Fellow of the National academy of Sciences, India, 2003.
Dr Hari Mohan joined BARC in 1967. Since then, he was actively involved in the study of first reaction kinetics using accelerators and leasers. His research interest includes free radical reaction of halogenated and sulfur compounds and biomolecules of natural origin. He had co-authored more than 200 research papers in international journals. He superannuated in November, 2004 as Head, Radiation Chemistry Section of Radiation Chemistry & Chemical Dynamics Division of BARC.

Occurrence of Campylobacter in Local …..
Founder’s Day Special Issue, 2005
120
Occurrence of Campylobacter in Local Poultry Meat in Pune and Mumbai J.R. Bandekar Food Technology Division Bhabha Atomic Research Centre
A.D. Raut and B.P. Kapadnis Department of Microbiology, University of Pune, Pune
A b s t r a c t
Microbiological quality of poultry meat samples was evaluated with special emphasis on Campylobacter as a poultry meat associated pathogen. 40 hot dressed chicken carcasses from retail outlets of local poultry meat in Pune and Mumbai were processed according to the FDA/CFSAN-BAM rinse method. 95% of the samples were found to be positive for Campylobacter with a MPN range between 102-104 cfu / kg of the sample. Aerobic plate counts were between 109-1010 cfu / kg and Enterobacteiraceae counts were between 107-1010 cfu / kg of meat sample. Campylobacter isolates were identified as C. jejuni, C. coli, C. fetus and C. lari according to the FDA/CFSAN-BAM scheme for Campylobacter identification and biochemical characterization. C. lari and C. jejuni were predominant in most of the samples. This study indicates significance of chickens as important reservoirs of this enteric pathogen and in transmission and dissemination of Campylobacter associated diseases.
Introduction
ampylobacter, a gram negative, non-sporulating, motile bacterium, is commonly isolated as a pathogen
associated with diarrhoea in many industrialized countries (10). Several incidences of Campylobacteriosis have also been reported from almost all parts of India (1, 6-8). Chickens are major reservoirs of and are frequently colonized by pathogenic Campylobacter species like C. jejuni and C. coli (5). Campylobacter infections are primarily because of handling and consumption of raw or undercooked poultry and due to cross contamination (10). Studies on isolation of Campylobacter from poultry meat have been carried out from the regions Tamilnadu and Calcutta using conventional method (11, 4). However, isolation and enumeration of Campylobacter from the carcasses of fresh hot dressed chickens from western regions of Maharashtra has not been
reported as yet. Present study aims at isolating Campylobacter from poultry carcasses using the Kapadnis-Baseri medium followed by enumerating them by PreT-KB MPN method (2). Materials and Methods Poultry samples In all 40 different hot dressed chicken carcasses (freshly slaughtered) were purchased from retails outlets in Pune (31) and Mumbai (9) during a span of eleven months. The samples were brought to the laboratory at room temperature and processed within 1 hr. Sample processing All the samples were processed according to the FDA/CFSAN-BAM rinse method (3). The carcasses were rinsed in sterile peptone water (1%) for 5 minutes on shaker and the rinse liquids were used for further analysis.
C

Occurrence of Campylobacter in Local …..
Founder’s Day Special Issue, 2005
121
Microbiological quality analysis and Campylobacter MPN Most Probable Number (MPN) of Campylobacter was determined using PreT-KB MPN method (2). At least one typical colony of Campylobacter per meat sample, isolated during MPN, was selected for biochemical identification. Microbiological quality of the rinse liquid was further evaluated by plating serial dilutions on plate count agar and Eosin Methylene Blue agar for Aerobic Plate Counts (APC) and Enterobacteriaceae counts, respectively. Identification Campylobacter isolates obtained were purified and identified according to the FDA / CFSAN-BAM biochemical identification scheme (3). Results Microbiological quality analysis and Campylobacter MPN 95% of all poultry meat samples were found to be positive for Campylobacter after biochemical identification. The MPN range of Campylobacter was between 102-104 cfu / kg of the meat sample. APC and Enterobacteriaceae counts
were between 109-1010 cfu / kg and 107-1010 cfu / kg respectively for both Pune and Mumbai regions together as seen in Table 1. Table 1: Microbial counts of processed meat samples
Seasonal variation in microbiological quality Isolation rate of Campylobacter from meat samples was observed to be maximum in the month of early December and dropped in January, the winter season. However, the rate increased in the months of March, April, May and July indicating rise in summer and early monsoon seasons. Similar patterns were found for enterobacteriaceae counts and APC, with higher values. (Fig 1)
Microbial Counts (CFU / kg. of the poultry meat)
Location (No of
samples)
Campylobacter-MPN
Enter-obacteriaceae
APC
Min 1.0 x 101 1.1 x 10⁷ 1.1 x 10⁹ Pune
(31) Max 5.0 x 104 1.8 x 10¹⁰ 5.1 x 10¹⁰
Min 1.5 x 10² 5.2 x 10⁹ 9.0 x 10⁹ Mumbai
(9) Max 1.8 x 103 1.5 x 10¹⁰ 2.8 x 10¹⁰
Fig 1: Campylobacter, Enterobacteriaceae and Aerobic Plate Counts of meat samples in different months
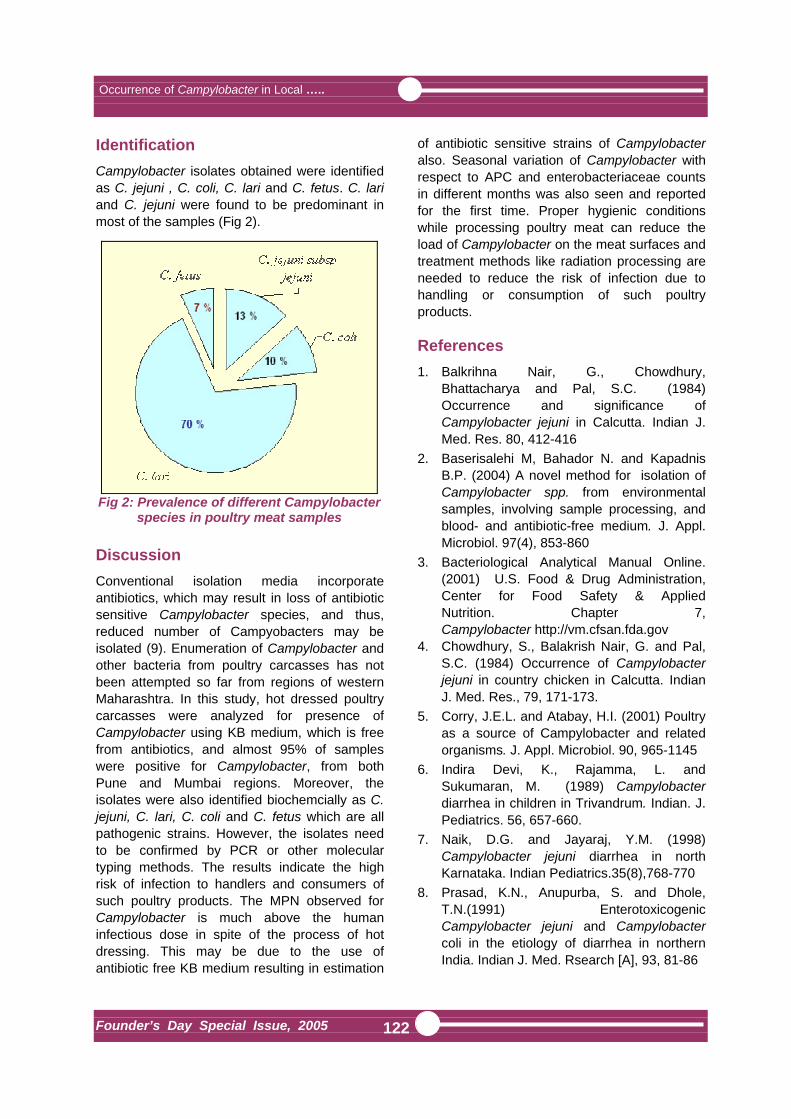
Occurrence of Campylobacter in Local …..
Founder’s Day Special Issue, 2005
122
Identification Campylobacter isolates obtained were identified as C. jejuni , C. coli, C. lari and C. fetus. C. lari and C. jejuni were found to be predominant in most of the samples (Fig 2).
Discussion Conventional isolation media incorporate antibiotics, which may result in loss of antibiotic sensitive Campylobacter species, and thus, reduced number of Campyobacters may be isolated (9). Enumeration of Campylobacter and other bacteria from poultry carcasses has not been attempted so far from regions of western Maharashtra. In this study, hot dressed poultry carcasses were analyzed for presence of Campylobacter using KB medium, which is free from antibiotics, and almost 95% of samples were positive for Campylobacter, from both Pune and Mumbai regions. Moreover, the isolates were also identified biochemcially as C. jejuni, C. lari, C. coli and C. fetus which are all pathogenic strains. However, the isolates need to be confirmed by PCR or other molecular typing methods. The results indicate the high risk of infection to handlers and consumers of such poultry products. The MPN observed for Campylobacter is much above the human infectious dose in spite of the process of hot dressing. This may be due to the use of antibiotic free KB medium resulting in estimation
of antibiotic sensitive strains of Campylobacter also. Seasonal variation of Campylobacter with respect to APC and enterobacteriaceae counts in different months was also seen and reported for the first time. Proper hygienic conditions while processing poultry meat can reduce the load of Campylobacter on the meat surfaces and treatment methods like radiation processing are needed to reduce the risk of infection due to handling or consumption of such poultry products.
References 1. Balkrihna Nair, G., Chowdhury,
Bhattacharya and Pal, S.C. (1984) Occurrence and significance of Campylobacter jejuni in Calcutta. Indian J. Med. Res. 80, 412-416
2. Baserisalehi M, Bahador N. and Kapadnis B.P. (2004) A novel method for isolation of Campylobacter spp. from environmental samples, involving sample processing, and blood- and antibiotic-free medium. J. Appl. Microbiol. 97(4), 853-860
3. Bacteriological Analytical Manual Online. (2001) U.S. Food & Drug Administration, Center for Food Safety & Applied Nutrition. Chapter 7, Campylobacter http://vm.cfsan.fda.gov
4. Chowdhury, S., Balakrish Nair, G. and Pal, S.C. (1984) Occurrence of Campylobacter jejuni in country chicken in Calcutta. Indian J. Med. Res., 79, 171-173.
5. Corry, J.E.L. and Atabay, H.I. (2001) Poultry as a source of Campylobacter and related organisms. J. Appl. Microbiol. 90, 965-1145
6. Indira Devi, K., Rajamma, L. and Sukumaran, M. (1989) Campylobacter diarrhea in children in Trivandrum. Indian. J. Pediatrics. 56, 657-660.
7. Naik, D.G. and Jayaraj, Y.M. (1998) Campylobacter jejuni diarrhea in north Karnataka. Indian Pediatrics.35(8),768-770
8. Prasad, K.N., Anupurba, S. and Dhole, T.N.(1991) Enterotoxicogenic Campylobacter jejuni and Campylobacter coli in the etiology of diarrhea in northern India. Indian J. Med. Rsearch [A], 93, 81-86
Fig 2: Prevalence of different Campylobacter species in poultry meat samples
Occurrence of Campylobacter in Local …..
Founder’s Day Special Issue, 2005
123
9. Silley, P. (2003) Campylobacter and fluoroquionolones: a bias data set. Environ. Microbiol. 5(4), 219-230
10. Stanley, K. and Jones, K. (2003) Cattle and Sheep farms as reservoirs of Campylobacter. J. Appl. Microbiol.. 94,104S-113S
11. Varma, S.K., Jagadeesh, N., Mukhopadhyay, H.K. and Dorairajan, N. (2000). Incidence of Campylobacter jejuni in poultry and Their Carcasses. J. Food Sci. Technol. 37, 639-641
About the authors …
Dr Jayant R. Bandekar joined 20th batch of BARC training school in 1976 after getting Master’s Degree in Microbiology with 1st rank from University of Poona. He was awarded Dr. Homi Bhabha Prize for first rank in radiobiology course in the training school. He obtained Ph. D. Degree in Microbiology from University of Poona. Dr. Bandekar was a post doctoral fellow at the State University of New York, USA. At present, Dr. Bandekar is Head, Food Microbiology Section in Food Technology Division. His major research interest involves food-borne bacterial pathogens and microbiological safety of irradiated foods. He is a research guide for M. Sc. and Ph. D. in Microbiology.
Mr Amol D. Raut has completed his M.Sc. (Microbiology) in 2001 from the Department of Microbiology, University of Pune, Pune. Presently he is working towards Ph.D. degree from University of Pune, under the guidance of Prof. Dr. B.P. Kapadnis and Dr. J.R. Bandekar. He has been awarded the Junior Research Fellowship in 2003 under the collaborative programme between B.A.R.C. and University of Pune for the project “ Isolation, Identification and radiation resistance of Campylobacter isolated from poultry meat “. Before joining the B.A.R.C. –UoP JRF programme, he was working as a Microbiologist in Research and Development department of Praj Industries Ltd., a Pune
based fermentation industry. He has comprehensive experience in the field of alcohol fermentation and was the R&D project leader for Asia’s first alcohol fermentation plant operating on sugarcane juice as a raw material. He was awarded the Chairman’s Best Performance award for consecutive two years, 2002 & 2003 during his tenure at Praj.
Dr B.P. Kapadnis obtained his Ph.D. from University of Pune and is currently Professor of Microbiology, Dept. of Microbiology at University of Pune,Pune. He has 25 years of teaching and research experience in the areas of Microbial taxonomy, Applied microbiology and Environmental Microbiology. He has published more than 26 research papers in international as well as national journals. He is a member of International societies like Society for Applied Microbiology and Society for General Microbiology, UK. Besides this he is a life member of Association of Microbiologists of India (AMI) and Association of Medical Microbiologists of India. His current areas of
research include Microbial Taxonomy, Plant microbe interactions, bioremediation and microbial biotechnology. He has two patents to his credit based on a new device and medium for isolation of Campylobacter. He has supervised research work at Ph.D. and M.Phil. level. He has collaborative research project with FTD and NABTD, BARC and VSI, Pune.He has ongoing research projects funded by various national funding agencies.
This paper received the 3rd prize in the poster session at ICFOST-2004 held at Mysore, during December 2004

Curcumin confers radiosensitizing effects ………….
Founder’s Day Special Issue, 2005
124
Curcumin Confers Radiosensitizing Effects on Mcf-7 Breast Cancer Cells
S. Girdhani and K.P. Mishra Radiation Biology and Health Sciences Division Bhabha Atomic Research Centre
urcuminoids are a group of phenolic compounds isolated from the rhizome of Curcuma longa with various
pharmacological properties. Studies have indicated that anti-cancer action of curcuminoids are attributed to their ability to induce apoptosis and cell cycle arrest but mechanisms of their action remain unexplained. Present work was designed to study the effects of curcumin and ionizing radiation on breast cancer cell line MCF 7. Incubation of cells treated with 100µM of curcumin for increasing time resulted in progressive reduction in cellular viability as examined by MTT. Subjecting cells to increasing doses of γ radiation showed decreased survival as measured by MTT. Typically, a dose of 5 Gy reduced the survival to 52 % 96 hr after irradiation. The combined treatment of cells with curcumin and radiation produced substantial synergistic toxic effects. Treatment of cells with 5µM curcumin followed by irradiation at 5Gy reduced survival of cells to 38%. Analysis of results after staining with PI and annexin V showed induction of apoptosis by these treatments. The induction of apoptosis after 24 and 48 hr over the untreated population was 9 and 13% compared to that by curcumin alone
(18.7 and 19.2%). The combination of radiation and curcurmin significantly enhanced the magnitude of apoptosis in these cells after 24 hr (24 %) and 48 hr (34 %) of treatment. The induction of apoptosis was further verified through cell cycle analysis by PI staining . An increase in the sub G1 phase was observed when curcumin was treated in combination with radiation. Exposure of cells to gamma radiation induced ROS as determined by dichlorodifluoro diacetate,a fluoresecence probe. Treatment of the cells with curcumin prior to radiation yielded reduced ROS. These results suggest a possibility of ROS independent pathway for the radiosensitizing effect of curcumin on MCF. To elucidate the mechanism through which these effects were mediated the expression levels of NF-κB were assessed through gel shift assay. Curcumin down regulates NF-κB levels activated via radiation. Thus suggesting acts through overcoming the effects of radiation induced prosurvival gene expression. Further investigations have shown the involvement of signaling factors in the mechanisms of radiosensitization by curcumin as measured by by clonogenic and biochemical assays
C
This paper won the award for Best Poster presentation at the International Conference on Recent Trends in Radiation Biology, held at Training School Hostel, Anushakti Nagar, Mumbai, during December 1-3, 2004
Curcumin confers radiosensitizing effects ………….
Founder’s Day Special Issue, 2005
125
Ms Swati Girdhani is a recipient of Senior Research Fellow of Council of Scientific and Industrial Research, Government of India and is carrying out work for Ph.D. degree at Radiation Biology and Health Sciences Division, BARC. under the guidance of Dr K.P. Mishra, Head, Radiation Biology and Health Sciences Division, BARC. Ms Girdhani did her Master in Biotechnology from the University of Allahabad.
Dr Kaushala Prasad Mishra joined BARC in 1969 through 12th Batch of BARC Training School in Chemistry after completing Master of Science in Chemistry from Allahabad University in 1968. He did his Ph.D. from Gujarat University on Mangnetic Resonance studies on normal and irradiated biological systems. Currently, Dr Mishra is the Head, Radiation Biology and Health Sciences Division, BARC. His field of research spans radiation biology, free radical biology and biophysical studies on biological systems. Dr Mishra has made significant contributions in the area of
radiation science. He has published more than 100 research papers in National and International Journals and has delivered almost equal number of invited talks, including keynote lectures and inaugural addresses in National and International Conferences. More recently, focus of his research has been on the role of ROS in oxidative stress induced apoptotic cell death relevant to radioprotection and cancer radiotherapy. He has edited a book titled Radiobiology and Biomedical Research. He has contributed more than 15 Chapters in Books published by national and International publishers. Together with his colleagues, Dr Mishra has designed and developed a Cell Electroporator for biomedical research and applications, which is under Technology Transfer from BARC. He is a recipient of Distinguished Science Service Award of Asia Pacific EPR Society in 2004. Dr Mishra is a Guest Faculty member in several Universities/Institutes of India. He is on Editorial Board of International Journal of Low Radiation. He is also a Member of the International Advisory Board of Iranian Journal of Radiation Research. He was invited as Visiting Scientist to several Universities/Institutions in India and abroad.

124
126
AUTHOR INDEX
Founder’s Day Special Issue, 2005 126
Adhikari, S. 89 Aggarwal, S.K.72 Ajithlal, R.T. 83 Alamelu, D. 72 Apte, S.K. 38,81 Bandekar, J.R.120 Banerjee, Sharmila 22 Bapat, V.A. 100 Bhandarkar, V.B. 49 Bhargava, Sujata 100 Bhowmick, A. 61 Chakraborty, S. 22 Chaudhari, P.R. 22 Chaudhari, S.D. 83 Chaurasia, A.K. 81 D’Souza, S.F. 94 Das, Tapas 22,79 Dey, P.K. 83 Dhakulkar, Shrutika 100 Dharampurikar, G.R. 83 Gadkari, S.C. 49,61 Ganapathi, T.R. 100 Girdhani, S. 124 Gupta, K.K. 83 Gupta, S.K. 49 Hari Mohan 76,115 Jain, G.C. 83 Jambunathan, U. 83 Janardanan, C. 83 Kapadnis, B.P. 120 Katti, V.R. 49 Kaur, Manmeet 49 Kothari, Kanchan 22 Kumaraguru, K. 83
Lagoo, K.D. 14 Lokhande, Manisha 83 Mathew, B. 22 Michael, K.M. 83 Mishra, Beena 115 Mishra, K.P. 124 Mukherjee, T. 89,111 Munshi, S.K. 83 Muthe, K.P. 49 Naik, G.H. 76 Narayana Rao, A.V.S.S. 14 Parasnis, A.S. 81 Patil, A.R. 107 Pillai, M.R.A. 22,79 Priyadarsini, K. I. 1,76,115 Puri, R.K. 14 Rajaram, Hema 38 Rakshe, P.R. 83 Rama Rao, A. 7 Rathinam, M. 83 Raut, A.D. 120 Sahni, V.C. 61 Salunke, S.U. 107 Samuel, Grace 22 Sarkar, Anjana 89 Sarma, H.D. 22 Saxena, Sona 94 Sengar, R.S. 14 Shinde, S.H. 111 Sinalkar, N. 83 Singh, Manjit 14 Thite, B.S. 83 Venkatesh, Meera 22 Vijayan, K. 83 Vincent,Tessy 107 Yakhmi, J.V. 61
