understanding populations the human population from 1900 to 2003, the population tripled in size to...
TRANSCRIPT

Understanding Populations

The Human Population• From 1900 to 2003, the
population tripled in size to reach 6.3 billion people
• Today, the human population count is over 7 billion and we are projected to reach 9 billion within the next 50 years
• While our population has increased, others have dramatically decreased

Human population growthWhat factors have contributed to this exponential growth pattern?
What factors have contributed to this exponential growth pattern?
1650500 million
20137 billion
Industrial Revolution
Significant advancesin medicine throughscience and technology
Bubonic plague "Black Death"
Population of… China: 1.3 billionIndia: 1.2 billion
adding 75 million/yearadding 75 million/year

Properties of Populations
For example, all of the bass in For example, all of the bass in a pond are considered a a pond are considered a population, because they population, because they are isolated in the pond are isolated in the pond and don’t interact with and don’t interact with
bass living in other pondsbass living in other ponds
• Populations are a group of organisms that belong to the same species and live in a particular place at the same time
• They can be widely distributed , or confined to a small area
Properties of Populations
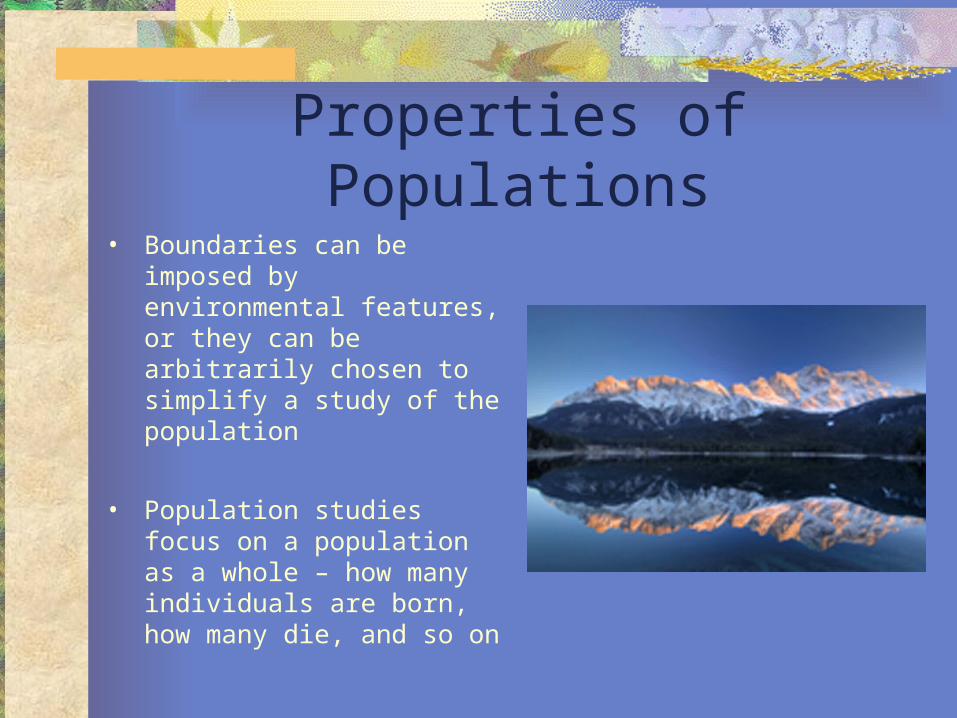
• Boundaries can be imposed by environmental features, or they can be arbitrarily chosen to simplify a study of the population
• Population studies focus on a population as a whole – how many individuals are born, how many die, and so on
Properties of Populations
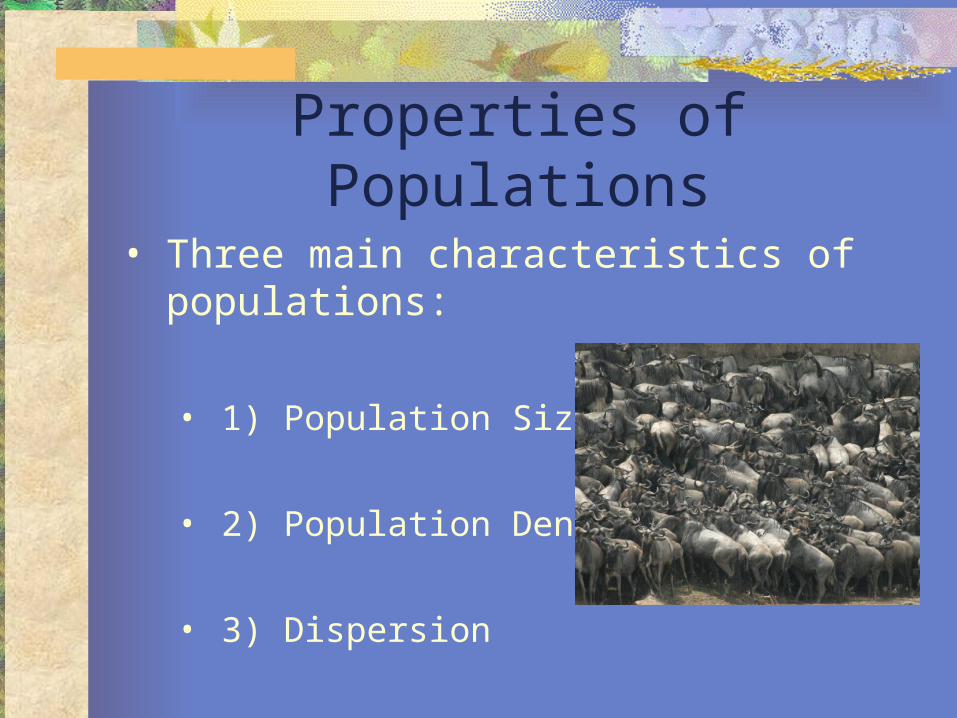
• Three main characteristics of populations:
• 1) Population Size
• 2) Population Density
• 3) Dispersion

Population Size
How many blades of How many blades of grass are in this football grass are in this football
field?field?
• The number of individuals that the population contains
• Size is a fundamental population property and can be difficult to measure directly, so sometimes we must estimate

Population Size
• How many oak trees are in this forest that is 10 km2?
• Extrapolate
• Count how many are in 1 km2 and multiply by 10.
AP Biology
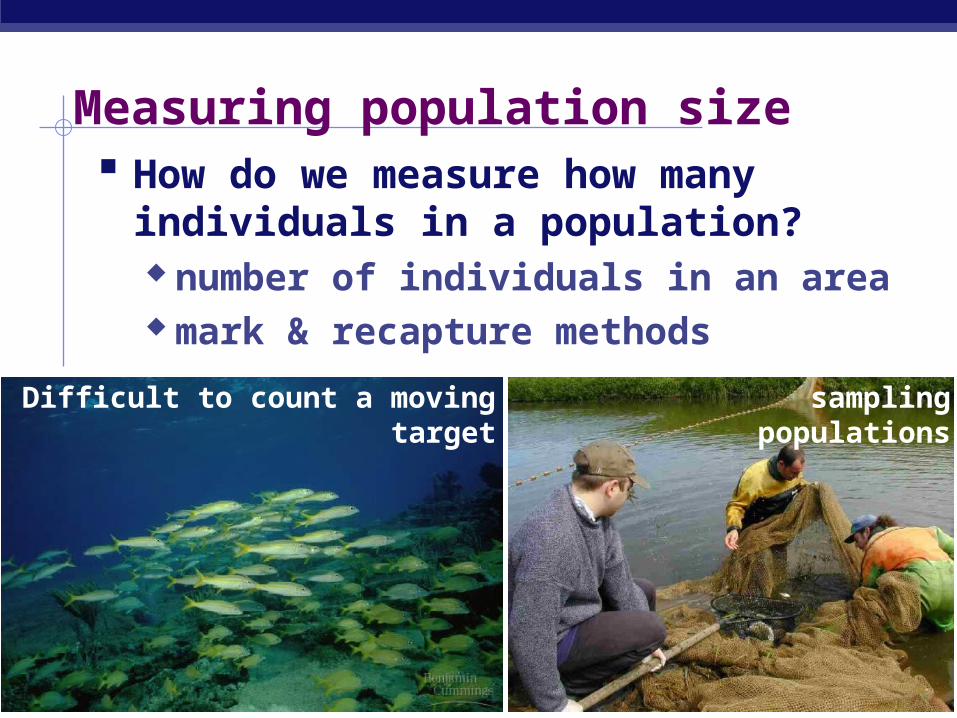
Difficult to count a moving target
Measuring population size How do we measure how many
individuals in a population? number of individuals in an area mark & recapture methods
sampling populations

Population Density
• A measure of how crowded a population is
• Expressed as the number of individuals per unit of area or volume
Dispersion
• From Latin dis- meaning out and spargere- meaning to scatter
• The spatial distribution of individuals within the population

Types of Dispersion
• Clumped – individuals clustered together
• Uniform – separated by a fairly consistent distance
• Random – each individual’s location is independent of the locations of other’s

Clumped Distributions
• Occur when resources such as food or living space are limited
• Occur because of species social behavior (flocks)

Uniform Distributions
• Result when individuals within the same habitat stay as far away from each other as possible
• When a bird locates its nest so it’s not close to other birds nests.

Random Dispersion
• Few populations are truly randomly dispersed
• Usually they show degrees of clumping or uniformity
• Also depends on the scale at which the population is being observed

Population Dynamics
• All populations are dynamic – they change over time
• Look at birth rate, death rate, and life expectancy

Population Dynamics
• Birth Rate: the number of births occurring in a period of time
• Death/Mortality Rate: the number of deaths in a period of time
• Life Expectancy: How long an individual is expected to live
US Population Dynamics
Birth Rate/yr 4 million
Death Rate/yr 2.6 million
Life Expectancy M = 74 yrsF = 80 yrs

Comparing Population Properties and Population Dynamics

Comparing Population Properties and Population Dynamics

Age Structure
• The distribution of individuals among different ages in a population
• Often presented as graphs
• Many important population processes vary with age

AP Biology
Age structure Relative number of individuals of each age
What do the data imply about population growth in these countries?
A CB

Patterns of Mortality
• Mortality data tends to match one of three curves on a graph
• Known as survivorship curves
• These show the probability that members of a population will survive to a certain age

Patterns of Mortality
• Type I – Death late in life (humans)
• Type II – Probability of dying doesn’t change (birds)
• Type III – More likely to die young (salmon)

TRUE
TRUE OR FALSE: A population consists of individuals of the same species living together in one place at the same time.

FALSE – IT REFERS TO THE DISTRIBUTION OF THE INDIVIDUALS OF A PARTICULAR POPULATION WITHIN A PARTICULAR AREA
TRUE OR FALSE: Dispersion is the term for how populations are distributed within a ecosystem.

FALSE – BOTH CAN FLUCTUATE
TRUE OR FALSE: The birth rate in a population equals the death rate.

Measuring Populations
A single pair of elephants can increase to a population of 19 million individuals within 750 years! Why
haven’t they increased their numbers?

Population Growth Rate
• The amount by which a population’s size changes in a given time
• Whether a population grows, shrinks, or remains the same size depends on:• Birth
• Death
• Immigration
• Emigration

Population Growth Rate
• Immigration – movement of individuals into a population
• Emigration – movement of individuals out of the population
• Immigration & birth add to a population
• Emigration & death subtract from a population
• Assume immigration = emigration

Population Size• Demographers divide large populations into groups
of 1,000 and to present data per capita, meaning per individual
• Birth rates, death rates, and growth rates for large populations are usually expressed per capita

Population Size
• Example:• If there are 52 births and 14 deaths per 1000
individuals per year:• Birth Rate = 52/1000 = 0.052 births per capita per yr
• Death Rate = 14/1000 = 0.014 deaths per capita per yr
• Growth rate can be calculated by:• Birth rate – Death Rate = Growth Rate

Population Size• Calculating per capita growth:
0.052 births per capita – 0.014 deaths per capita
= 0.038 growth per capita
• A positive growth rate means population is growing; negative means it’s shrinking

Population Size
• To find the number of new individuals that will be added to the population in a year, just multiply the per capita growth rate by the number of individuals in the population
Ex] Population = 50,000
Growth = 0.038 per capita
0.038 x 50,000 = 1900

The Exponential Model
• At a steady positive growth rate, the population will add a larger number of individuals with each generation
• A pattern of increase in number due to a steady growth rate is exponential growth

The Exponential Model
• A graph of the population size over time for exponential growth makes a J-shaped curve
• Population size grows slow when small, but increases as individuals join the population

The Exponential Model
• Leads us to predict that population size will increase indefinitely and by a greater number with each time period
• Do you think this trend will continue? What will the graph look like in the future?

Applying the Exponential Model
• This model matches observed patterns of growth of real populations, but only under a certain number of conditions and for a limited period of time
• Example] Bacteria can grow exponentially if provided with an abundance of food and space and if waste is removed

Applying the Exponential Model
• This doesn’t apply to most populations because resources aren’t unlimited and harmful waste accumulates
• Any factor, such as space, that restrains the growth of a population is called a limiting factor
• All populations are limited by their environment

Applying the Exponential Model
• As a population grows, competition intensifies for resources
• Thus, each individual’s ability to fight off disease, grow, and reproduce decreases
• This results in a decreasing birth rate and increasing death rate

The Logistic Model
• Builds on the exponential model but accounts for the influence of limiting factors
• Carrying capacity (K) is the number of individuals the environment can support over a long period of time

The Logistic Model
• The graph of this model looks like a stretched-out letter S
• When population is small, birth rates are high and death rates are low, so looks like exponential growth
• As size approaches K, the growth rate slows
• At K, the birth rate = death rate and growth stops

The Logistic Model
• Contains some assumptions• K is constant and
doesn’t fluctuate with environmental changes
• Reality is, it does. Ex] It is greater when prey is abundant and lower when it is scarce.

The logistic and exponential The logistic and exponential models are not universal models are not universal representations of real representations of real
populations – but – they are an populations – but – they are an important tool that scientists use important tool that scientists use to explain population growth and to explain population growth and
regulation.regulation.
True or False: Carrying capacity is the number of True or False: Carrying capacity is the number of individuals the environment can support for an individuals the environment can support for an
extended period of time.extended period of time.
True!!!True!!!

True or False: Population growth can be predicted True or False: Population growth can be predicted using only birth- and death-rate statistics.using only birth- and death-rate statistics.
False – Immigration and False – Immigration and emigration rates are important emigration rates are important
factors to consider!!!factors to consider!!!

How many new individuals will there be next year in a How many new individuals will there be next year in a population of 85,000 people if there are 98 births and 75 population of 85,000 people if there are 98 births and 75
deaths per thousand people?deaths per thousand people?
0.098 births per capita – 0.075 deaths per capita = 0.023 growth per capita0.098 births per capita – 0.075 deaths per capita = 0.023 growth per capita
0.023 x 85,000 = 1955 new individuals0.023 x 85,000 = 1955 new individuals