unctad technical notes on ict for development no. 19
TRANSCRIPT

U N I T E D N A T I O N S C O N F E R E N C E O N T R A D E A N D D E V E L O P M E N T
No15UNCTAD Technical Notes on ICT for Development No19
IMPACTS OF THE COVID-19 PANDEMIC ON TRADE IN THE DIGITAL ECONOMY

IMPACTS OF THE COVID-19 PANDEMIC ON TRADE IN THE DIGITAL ECONOMY
1 Introduction The COVID-19 pandemic has provided sudden and strong impetus for businesses and individuals to adopt or increase their use of digital tools to continue economic activity. By accelerating digitalization and deepening reliance on digital technologies, COVID-19 has boosted the importance of international information and communications technology (ICT) related goods and services in global trade.
Against a backdrop of sharply declining trade, the share of ICT goods in merchandise imports surged from around 13% in 2019 to nearly 16% in 2020 – the greatest annual increase since records began in 2000.
Similarly, ICT services grew to almost 14% of total services exports worldwide in 2020, while digitally deliverable services overall increased to nearly 64% of total services exports – having contracted relatively little against the backdrop of an unprecedented 20% decline in total services trade (see Box 1 for definitions).
However, countries have differed in the extent to which they have been able to benefit from demand for ICT goods, and to use ICTs to continue services trade through digital delivery. ICT goods trade declined sharply in least developed countries (LDCs) and Africa between 2019 and 2020, and while all regions increased ICT and digitally deliverable products’ share in total services trade, LDC exports of ICT services declined by 22% - as part of a 9% fall in digitally deliverable exports more broadly.
As such, the pandemic-related acceleration in digitalization risks further exacerbating digital divides, with least developed countries (LDCs) being left further behind. It is now more urgent than ever to ensure that those trailing in digital readiness can catch-up.
This note looks in more detail at the latest developments in ICT-related trade (ICT goods, ICT services, digitally-deliverable services).
2 COVID-19 pandemic drives ICT goods trade rebound The latest data for 2020 show growing reliance on digital technologies boosting international trade in computers and related equipment – reversing falls seen in 2019.
By accelerating digitalization, COVID-19 appears to have boosted trade in ICT goods, which had declined before the pandemic. Global exports of ICT goods increased by 4%, to over US$ 2.3 trillion in 2020. Meanwhile, imports of such goods grew by 1.1%, rising US$ 27 billion to almost US$ 2.5 trillion. This reflects an accelerating reliance on digital technologies during the lockdown measures introduced in many economies and stands out against overall falls in economic activities in the wake of the pandemic – in which overall merchandise trade contracted by around 7.5% (according to both export and import data).
2.1 Steep declines in LDCs and Africa
The upward trend in ICT goods exports was seen only in Eastern and South-Eastern Asia, where they surged by 8%. In all other regions exports declined. By far the sharpest drops occurred in LDCs (-82%) and in Africa (-48%) (Table 1).

Table 1. Global trade in ICT goods, 2019-2020, by development region
ICT goods exports
ICT goods imports
US$ millions
Change 2019-2020
(%)
% of merchandise
exports
US$ millions
Change 2019-2020
(%)
% of merchandise
imports World 2,354,900 4 15 2,493,697 1.1 16
Africa 1,650 -48 1.0 10,351 -49 5
Asia 1,815,302 6 27 1,478,921 4 24
Central and southern Asia 5,735 -13 2 44,574 -14 10
Eastern and South-Eastern Asia 1,800,746 8 30 1,413,318 9 27
Europe 324,719 -1 5 506,257 -3 8
Latin America and the Caribbean 65,247 -6 9 93,056 -20 14
Northern America 145,047 -5 8 378,791 4 13
Oceania 2,934 -14 1 26,322 0.4 11
Developed regions (M49) 536,679 -2 6 1,008,351 0.2 10
Developing regions (M49) 1,818,221 5 27 1,485,346 2 24
Least developed countries 115 -82 0.2 1,632 -49 4
Note: Not adjusted for re-exports/re-imports due to data availability (see annex). Changes calculated in current prices. Source: UNCTAD based on UNCTAD digital economy statistics (unctadstat.unctad.org).
Regarding imports, the picture is more mixed. While most regions registered declines in ICT goods imports in 2020, North America and Asia each saw an increase of 4%, with the latter powered by demand especially in eastern and south-eastern Asia. Oceania also registered some growth (0.4%). While import demand in developed regions as a whole stayed relatively flat (0.2% change), across developing regions ICT goods imports increased by 2% overall. However, this conceals greatly differing trends between developing countries as imports of ICT goods to the LDCs and to Africa declined by half (Figure 1). As such, the pandemic appears to be exacerbating existing divides by pushing further behind countries that were already struggling to engage in ICT goods trade.
Figure 1. Change in ICT goods exports and imports, 2019-2020
Note: Not adjusted for re-exports/re-imports due to data availability (see annex). Changes calculated in current prices. Source: UNCTAD based on UNCTAD digital economy statistics (unctadstat.unctad.org).
-90 -80 -70 -60 -50 -40 -30 -20 -10 - 10 20
Eastern and South-Eastern AsiaWorld
Northern AmericaEurope
OceaniaLatin America and the Caribbean
Central and southern AsiaAfrica
Developing regions (M49)Developed regions (M49)
Least developed countries
% change 2019-2020
ICT goods exports ICT goods imports

Nevertheless, as a result of the sharp drop in overall merchandise trade, the share of ICT goods in total merchandise imports increased in LDCs and Africa as it did in other regions in 2020 (reaching 3.5% for LDCs and 5.3% for Africa). However, the increases in other regions were larger and the extent to which LDCs and Africa trail other regions in terms of their engagement in ICT goods trade therefore increased in 2020 (Figure 2).
Figure 2. ICT goods exports and imports, as a share of total merchandise trade, 2019-2020
Note: Not adjusted for re-exports/re-imports due to data availability (see annex). Shares calculated in current prices (i.e. not adjusted for price changes between periods). Source: UNCTAD based on UNCTAD digital economy statistics (unctadstat.unctad.org).
2.2 Top exporters of ICT goods
Exports of ICT goods are geographically highly concentrated, with eastern and south-eastern Asia (led by China) accounting for over three-quarters of the global total.
Looking at the top-10 exporters of ICT goods in 2020 (Table 2), the greatest increase was observed in Taiwan Province of China (20%), building on a 7% increase in 2019, while the greatest rebound occurred in Singapore which registered 11% growth in 2020 following a 6% fall in 2019. Mexico reported the biggest decrease in 2020 (-6%).
Other economies with ICT goods exports exceeding US$ 1 billion that showed high growth rates included Latvia (28%), Estonia (26%), and Israel (19%). Meanwhile, such exports were most negatively affected in Canada (-22%), Turkey (-18%), Australia, Finland, and India (each -13%).

Table 2. Top-10 exporters of ICT goods in 2020
Exports US$
millions
Change 2019-
2020 (%)
Global market
share (%) China 701,868 6% 30%
Hong Kong SAR China 319,619 5% 14%
Taiwan Province of China 182,938 20% 8%
Republic of Korea 148,113 6% 6%
United States of America 138,375 -4% 6%
Singapore 126,411 11% 5%
Viet Nam 109,091 18% 5%
Malaysia 81,359 5% 3%
Germany 70,960 -3% 3%
Mexico 64,354 -6% 3%
Note: No adjustment for re-exports/re-imports due to data availability (see annex). Changes calculated in current prices. Source: UNCTAD based on UNCTAD digital economy statistics (unctadstat.unctad.org).
2.3 Top importers of ICT goods
In 2020, eastern and south-eastern Asia together accounted for 57% of global imports of ICT goods and developed regions for another 40%.
Imports increased in all of the top-10 importers except Germany, which registered a slight decline (-0.4%) (Table 3). Various other major ICT goods importers (over US$ 25 billion) that registered greater contractions include India (-12%), Mexico (-9%), Canada (-3%), France (-2%), and the United Kingdom (-1%). By contrast, significant increases were observed for Poland (+25%), Czechia and Thailand (+10% each).
The sharpest overall declines in ICT goods imports were recorded in Bolivia and Egypt (both -46%) while the greatest overall increases occurred in Gambia (75%), Albania (70%), and Barbados (49%).
Table 3. Top-10 importers of ICT goods in 2020
Imports US$
millions
Change 2019-
2020 (%)
Global market
share (%) China 516,389 11% 21%
United States of America 347,415 5% 14%
Hong Kong SAR China 325,552 5% 13%
Singapore 108,346 12% 4%
Germany 103,334 -0.4% 4%
Japan 89,726 2% 4%
Taiwan Province of China 89,104 18% 4%
Republic of Korea 83,576 5% 3%
Viet Nam 80,044 23% 3%
Netherlands 72,605 4% 3%
Note: No adjustment for re-exports/re-imports due to data availability (see annex). Changes calculated in current prices. Source: UNCTAD based on UNCTAD digital economy statistics (unctadstat.unctad.org).

2.4 Electronic components dominate ICT goods trade
The latest figures show that electronic components continue to be the main element of trade in ICT goods, comprising 44% of imports globally. Advances in electronic components help drive the fast pace of technological innovation in the ICT sector, and imports in 2020 increased in volume by 8% compared to 2019 (Figure 3).
In 2020, computers and peripheral equipment overtook communication equipment as the second largest component of ICT imports for the first time since 2013. Indeed, in 2020, imports of computers and peripheral equipment increased by 3% while imports of communication and consumer electronic equipment fell by around 10%. The COVID-19 pandemic is likely to have helped to drive this by incentivizing purchases of PCs and laptops more suited to in-depth work than communications devices such as smartphones, as well as peripherals such as screens, speakers, keyboards, and mice that can aid in working from home. At the same time, reduced incomes and financial uncertainty resulting from the pandemic may have suppressed demand for upgrades to mobile devices and consumer electronics.
Figure 3. Global imports of ICT goods by product US$ billions in current prices
Note: Current prices (i.e. no adjustment for price changes over time). No adjustment for re-exports/re-imports due to data availability (see annex). Source: UNCTAD based on UNCTAD digital economy statistics (unctadstat.unctad.org).
A key question is the extent to which the changes outlined above will endure as the pandemic progresses and afterwards – including the further exacerbation of pre-existing divides whereby the extent to which the LDCs and African countries can engage in ICT goods trade has been further reduced. Whether they will soon be able to return to previous levels of ICT goods exports and imports is likely to depend most immediately on the path of the pandemic in 2021 and the following years.
Just as ICT goods trade has been bolstered by pandemic-related changes, so too has trade in ICT services. The following section examines developments in the international trade of ICT services and the wider category of digitally deliverable services.

3 Services trade data for 2020 confirm the growing importance of digital technologies during the pandemic.
ICT services grew to almost 14% of total services exports worldwide in 2020, while digitally deliverable services overall increased to nearly 64% of total services exports - having contracted relatively little against the backdrop of an unprecedented 20% decline in total services trade. However, while these shares increased across all regions, the pandemic-related acceleration in digitalization risks further exacerbating digital divides, with LDCs falling further behind.
The COVID-19 pandemic has provided strong impetus for businesses and individuals to adopt digital tools, helping to drive a 6% increase in worldwide exports of ICT services. The value of ICT services exports worldwide reached US$676 billion in 2020 as the usage of communications services, computer services and software were boosted by the lockdown restrictions implemented in many economies. Meanwhile, exports of the wider category of digitally deliverable services – those which can be delivered remotely over ICT networks such as the Internet – fell by US$ 57 billion to a value of US$ 3.17 trillion worldwide (see Box 1 for more on the definitions and measurement of these products).
Digital technologies appear to have played an important role in supporting broader international trade and economic activity in 2020. While total services exports declined by 20% (an unprecedented drop since records began in 1990), worldwide exports of digitally deliverable services fell by only 1.8%. Digitally deliverable services contributed less than 1 percentage point of the total decline in services exports. Meanwhile, the growth of ICT services partially offset reductions in the trade of other service products by over half a percentage point (Figure 4).
Figure 4. Global exports of ICT services and digitally deliverable services, 2019-2020 US$ billions in current prices and change as a percentage of 2019 total services
Note: US$ values in current prices (i.e. not adjusted for price changes between periods). Source: UNCTAD based on UNCTAD digital economy statistics (unctadstat.unctad.org).
-
1,000
2,000
3,000
4,000
5,000
6,000
7,000
2019 2020
US$ billions
Total services Digitally deliverable services Of which: ICT services
-22
-18
-14
-10
-6
-2
2
Change 2019-2020
% of 2019total services
3.1 Least developed countries risk falling further behind in ICT-enabled services trade
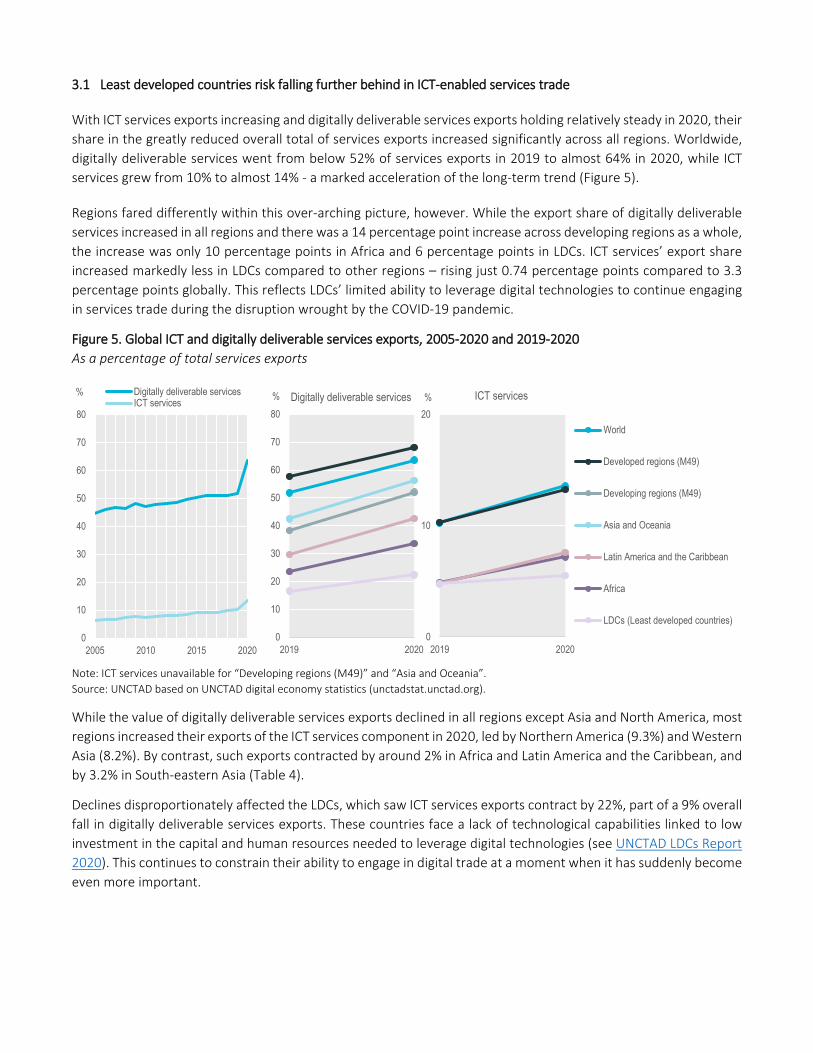
With ICT services exports increasing and digitally deliverable services exports holding relatively steady in 2020, their share in the greatly reduced overall total of services exports increased significantly across all regions. Worldwide, digitally deliverable services went from below 52% of services exports in 2019 to almost 64% in 2020, while ICT services grew from 10% to almost 14% - a marked acceleration of the long-term trend (Figure 5).
Regions fared differently within this over-arching picture, however. While the export share of digitally deliverable services increased in all regions and there was a 14 percentage point increase across developing regions as a whole, the increase was only 10 percentage points in Africa and 6 percentage points in LDCs. ICT services’ export share increased markedly less in LDCs compared to other regions – rising just 0.74 percentage points compared to 3.3 percentage points globally. This reflects LDCs’ limited ability to leverage digital technologies to continue engaging in services trade during the disruption wrought by the COVID-19 pandemic.
Figure 5. Global ICT and digitally deliverable services exports, 2005-2020 and 2019-2020 As a percentage of total services exports
Note: ICT services unavailable for “Developing regions (M49)” and “Asia and Oceania”. Source: UNCTAD based on UNCTAD digital economy statistics (unctadstat.unctad.org).
While the value of digitally deliverable services exports declined in all regions except Asia and North America, most regions increased their exports of the ICT services component in 2020, led by Northern America (9.3%) and Western Asia (8.2%). By contrast, such exports contracted by around 2% in Africa and Latin America and the Caribbean, and by 3.2% in South-eastern Asia (Table 4).
Declines disproportionately affected the LDCs, which saw ICT services exports contract by 22%, part of a 9% overall fall in digitally deliverable services exports. These countries face a lack of technological capabilities linked to low investment in the capital and human resources needed to leverage digital technologies (see UNCTAD LDCs Report 2020). This continues to constrain their ability to engage in digital trade at a moment when it has suddenly become even more important.
0
10
20
30
40
50
60
70
80
2019 2020
% Digitally deliverable services
World
Developed regions (M49)
Developing regions (M49)
Asia and Oceania
Latin America and the Caribbean
Africa
LDCs (Least developed countries)0
10
20
30
40
50
60
70
80
2005 2010 2015 2020
% Digitally deliverable servicesICT services
0
10
20
2019 2020
% ICT services

Table 4. Global ICT and digitally deliverable services exports, 2020 Digitally deliverable services exports ICT services exports Region/country group US$
millions % change
2019-2020 % of services
exports US$
millions Change
2019-2020 (%) % of services
exports World 3,167,587 -1.8 63.6 676,225 6 13.6
Africa 27,748 -5.1 33.6 5,962 -2 7.2 Asia 806,640 1.7 - - -
Central and southern Asia 163,612 3.7 69.6 71,885 4.9 30.6 Eastern Asia 376,412 2.4 58.4 - - - South-eastern Asia 180,422 -2.7 57.6 25,763 -3.2 8.2 Western Asia 86,193 5.1 39.6 38,613 8.2 17.8
Europe 1,665,072 -3.9 66.3 382,686 5.2 15.2 Latin America and the Caribbean 52,629 -10.9 42.5 9,423 -1.9 7.6 Northern America 594,846 1 75.1 58,318 9.3 7.4 Oceania 20,651 -6.7 32.9 4,591 4.7 8.7
Developed regions (M49) 2,436,427 -2.6 68.1 474,101 6.3 13.3 Developing regions (M49) 731,160 0.9 52.0 - - - Developing economies excluding China
576,785 -0.7 51.2 143,090 3.6 12.7
Least developed countries 7,382 -9 22.4 1,819 -22.3 5.5 Note: ICT services exports for Eastern Asia not publishable. Source: UNCTAD based on UNCTAD digital economy statistics (unctadstat.unctad.org).
Box 1. What are ICT services and digitally deliverable services?
ICT products are defined as those “intended to enable and/or fulfil the function of information processing and communication”. This definition was developed by the OECD (2011) and adopted by the Partnership on Measuring ICT for Development. ICT services therefore include telecommunications services, IT system design, software development, and related tasks.
Digitally deliverable services represent a broader concept: services which can be delivered over ICT networks (UNCTAD, 2015). These comprise the following categories from the 2010 Extended Balance of Payments Statistics breakdown:
• ICT services • Sales and marketing services not including trade
and leasing services • Information services • Insurance and financial services
• Management, administration, and back office services
• Licencing services • Engineering, related technical services, and R&D • Education and training services
The statistics presented are based on data collected within the framework of Balance of Payments statistics (compiled according to the concepts and definitions of the IMF Balance of Payments and International Investment Position Manual, Sixth Edition (BPM6, 2009)). Within that framework, ICT services are an aggregation of computer and telecommunications services, and digitally deliverable services are an aggregation of insurance and pension services, financial services, charges for the use of intellectual property, telecommunications, computer and information services, other business services and audiovisual and related services. ICT services are therefore a subset of digitally deliverable services, as shown in Figure 4.
References: UNCTAD (2015), International Trade in ICT Services and ICT-Enabled Services, https://unctad.org/system/files/official-document/tn_unctad_ict4d03_en.pdf. OECD (2011), OECD Guide to Measuring the Information Society 2011, http://dx.doi.org/10.1787/10.1787/9789264113541-en. IMF (2009), Balance of Payments and International Investment Position Manual, Sixth Edition, https://www.imf.org/external/pubs/ft/bop/2007/bopman6.htm.

3.2 Top importers and exporters
Although imports figures are not available at the regional level due to data asymmetries, many economies do provide data on ICT and digitally deliverable services imports. In 2020, of the economies for which data are available, Germany spent the most on imports of ICT services – over US$ 39.7 billion – though this was 1.4% lower than in 2019. Among the top-10 importers in 2020, Singapore and India were the only developing countries featuring. Their imports increased by 4.4% to US$ 16.6 billion and 14.5% to US$10.5 billion, respectively (Table 5).
When considered relative to GDP the picture is rather different. Cyprus spent the greatest share of GDP on ICT services imports in 2020 (8.9%), followed by Singapore (4.9%), and Belgium (2.1%). Tonga and Uruguay also feature, spending 1.4% and 1.3%, respectively.
Although Singapore was a net importer of ICT services in 2020, it is also among the top-10 ICT services exporters, both by value (US$ 15 billion) and contribution to GDP (4.4%). Overall, Ireland exported the most ICT services, contributing over US$ 151 billion to the economy – up by nearly 17% compared to 2019 and equivalent to 36% of GDP. This reflects Ireland’s status as a popular location for many ICT companies trading in Europe and globally, due in part to its relatively low corporation tax rates. India and China follow in terms of the overall value of ICT services exports, while Kuwait and Belize feature in the top-10 by contribution of ICT services exports to GDP in 2020.
Table 5. ICT services trade – top 10 importers and exporters 2020
ICT services imports
By value Rank By value as % of GDP
US$ millions Change %GDP
%GDP US$ millions Change
Germany 39,723 -1.4 1.1 1 Cyprus 8.9 2,112 20.4
United States of America 35,588 -11.5 0.2 2 Singapore 4.9 16,585 4.4
France 22,170 -1.0 0.9 3 Belgium 2.1 10,820 11.5
Japan 20,077 1.8 0.4 4 Sweden 1.9 10,203 13.1
Singapore 16,585 4.4 4.9 5 Finland 1.8 4,973 7.9
Italy 11,922 7.5 0.6 6 Austria 1.7 7,111 4.7
United Kingdom 11,827 -4.6 0.4 7 Norway 1.5 5,395 16.3
Belgium 10,820 11.5 2.1 8 Ireland 1.4 5,941 9.1
Netherlands 10,705 -38.1 1.2 9 Tonga 1.4 498 34.9
India 10,479 14.5 0.4 10 Uruguay 1.3 619 5.5
ICT services exports By value Rank By value as % of GDP
US$ millions Change %GDP
%GDP US$ millions Change
Ireland 151,463 16.8 36.1 1 Ireland 36.1 151,463 16.8
India 67,993 5.2 2.5 2 Cyprus 12.5 2,961 12.1
China 59,034 9.8 0.4 3 Israel 4.8 19,172 5.2
United States of America 49,816 12.4 0.2 4 Finland 4.7 12,825 -0.03
Germany 32,249 7.1 0.9 5 Belarus 4.5 2,679 12.1
United Kingdom 22,382 0.9 0.8 6 Singapore 4.4 14,974 -0.7
Israel 19,172 5.2 4.8 7 Kuwait 3.9 4,320 -1.2
France 18,009 -5.6 0.7 8 Ukraine 3.4 5,137 19.6
Singapore 14,974 -0.7 4.4 9 Estonia 3.3 1,012 5.3
Sweden 14,851 4.9 2.8 10 Belize 3.1 49 69.4
Note: Considers only economies for which UNCTAD holds 2020 data. Source: UNCTAD based on UNCTAD digital economy statistics (unctadstat.unctad.org).

Considering the broader class of digitally deliverable services, the United States was the biggest importer in 2020, spending US$ 317.6 billion, up 3% from 2019. As with ICT services, most of the top-10 importers of digitally deliverable services in 2020 were developed countries. Nevertheless, China imported the fifth-most (US$140 billion, up almost 9% from 2019) and Singapore also featured in the list (US$ 107 billion, -2.1% compared to 2019) (Table 6).
Relative to GDP, the United States spent only 1.5% on importing digitally deliverable services, a smaller share than in over 100 other countries. Luxembourg had the greatest GDP share of digitally deliverable services imports, with a value equivalent to 99.8% of 2020 GDP. Despite this, Luxembourg is a net exporter of digitally deliverable services, exporting over US$ 98 billion of digitally deliverable services in 2020, down almost 2% from 2019 but still equivalent to 134% of GDP1. The majority of these flows, both imports and exports, are comprised of financial services.
Digitally deliverable services trade flows are also economically significant for various developing countries. In 2020, such exports were worth 36% of GDP in Singapore, 30% in Anguilla, and 27% in the Seychelles. These countries also feature in the top-10 importers of digitally deliverable services in 2020, as do Saint Kitts and Nevis, Aruba, and Dominica. However, the dollar value of the underlying flows in these countries was lower in 2020 than in 2019.
Table 6. Digitally deliverable services trade – top 10 importers and exporters 2020
Digitally deliverable services imports
By value Rank By value as % of GDP
US$ millions Change (%) %GDP
%GDP US$ millions Change (%)
United States of America 317,625 3.0 1.5 1 Luxembourg 99.8 73,084 -1.4 Ireland 280,744 -10.1 66.9 2 Malta 84.5 12,031 8.8 Germany 183,443 0.5 4.8 3 Ireland 66.9 280,744 -10.1 United Kingdom 146,312 -4.0 5.4 4 Singapore 31.6 106,919 -2.1 China 139,610 8.9 0.9 5 Cyprus 27.3 6,459 22.7 France 135,269 -4.4 5.2 6 Seychelles 27.0 318 -17.4 Japan 133,278 1.9 2.6 7 Anguilla 16.3 50 -23.9 Netherlands 124,037 -35.3 13.6 8 Saint Kitts and Nevis 15.8 139 -20.6 Singapore 106,919 -2.1 31.6 9 Aruba 14.9 340 -15.7 Switzerland, Liechtenstein 88,098 3.2 11.7 10 Dominica 14.7 72 -29.2
Digitally deliverable services exports By value Rank By value as % of GDP
US$ millions Change (%) %GDP
%GDP US$ millions Change (%)
United States of America 533,093 0.8 2.5 1 Luxembourg 134.1 98,277 -1.9
United Kingdom 286,701 -2.8 10.6 2 Ireland 58.2 244,152 9.7
Ireland 244,152 9.7 58.2 3 Malta 58.1 8,273 -1.8
Germany 203,657 0.1 5.4 4 Singapore 36.2 122,274 -2
India 154,775 4.63 5.8 5 Cyprus 36.2 8,548 20.2
China 154,375 7.5 1.0 6 Anguilla 30.0 92 -6.5
France 142,942 -8 5.5 7 Seychelles 27.1 320 -10.9
Netherlands 126,809 -33.9 13.9 8 Belgium 14.5 74,763 -1.1
Singapore 122,274 -2 36.2 9 Netherlands 13.9 126,809 -33.9
Japan 114,741 -2.5 2.3 10 China, Hong Kong SAR 11.3 39,407 -3.3 Note: Considers only economies for which UNCTAD holds 2020 data. Source: UNCTAD based on UNCTAD digital economy statistics (unctadstat.unctad.org).
1 It is possible for exports to exceed the value of GDP because, while exports add to the calculated value of GDP, this is offset by the subtraction of imports.

3.3 Trade volatility is correlated with development status
The data show a strong relationship between countries’ stage of development and the (in)stability of trade in ICT and digitally deliverable services. For the LDCs, the average absolute2 percentage change in ICT services trade flows (both imports and exports) is twice that for other developing economies and three times that of developed economies. With respect to digitally deliverable services imports, the volatility experienced by LDCs is slightly less unequal, at around the same as the average for other developing economies, but still more than twice the average absolute percentage change experienced by developed economies. Digitally deliverable exports show the most contrast by development status: on average, the absolute change in exports for LDCs is twice that for other developing countries and almost five times that of developed economies.
One reason for this is LDCs’ relatively small volumes of trade in ICT and digitally deliverable services, which make the impact of trade shocks proportionately bigger. However, the GDP of LDCs is also relatively low, so this trade volatility can nonetheless be economically significant. That is especially important considering that the changes experienced by LDCs are more skewed toward falls in trade than for other economies.
Underlying the above trends is considerable variation between LDCs. While ICT services imports contracted by 60% in Nepal, Sao Tome and Principe, the Solomon Islands, and Zambia, they increased by the same proportion in Mozambique. Additionally, while digitally deliverable imports declined by around 40% in Bangladesh and Sudan, they increased by almost twice that in Uganda.
LDCs have also varied greatly in the extent to which they have been able to benefit from increased demand for ICT services and to use ICTs to continue services trade through digital delivery. On the export side, ICT services and wider digitally deliverable services exports roughly doubled in the Democratic Republic of the Congo, Sao Tome and Principe and Afghanistan but declined in almost all other LDCs. This includes ICT services exports declining by 40% in Angola and 60% in Myanmar, as well as digitally deliverable exports falling by almost 60% in Timor-Leste and around 30% in Zambia and Mozambique.
4 Action is needed to improve digital-readiness The COVID-19 pandemic has pushed businesses and individuals toward adopting and increasing their use of digital technologies. This has driven demand for both ICT goods and services. ICTs have also played a vital role in enabling a majority of wider services trade to continue despite the broad economic disruption wrought by the pandemic – with the long-term upward trend greatly accelerating to take digitally deliverable services to 64% of global services exports in 2020.
However, countries have differed in the extent to which they have been able to benefit from the growing demand for ICT goods and services or take up ICTs to mitigate the economic effects of the pandemic. Despite the growing importance of ICT and digitally deliverable services in in global trade, their low levels of digitalization and eTrade readiness have meant for many LDCs strong downturns in both. It is now more urgent than ever to ensure that those trailing in digital readiness can catch-up. The alternative is that inequalities are further exacerbated.
Across all countries, the ability to accurately track changes in the share of services being delivered remotely and to fully monitor the impacts of the pandemic on ICT and digitally deliverable services trade would be greatly enhanced by continuing efforts to break down services statistics by modes of supply.
UNCTAD offers a range of technical assistance and capacity building to support countries in engaging with and measuring their performance related to e-commerce and the digital economy.
2 i.e. disregarding whether the change was an increase or decrease
Annex. Re-exports and re-imports of ICT goods. A country’s exports can be distinguished into exports of domestic-produced goods and exports of foreign-produced goods. The latter is generally referred to as “re-exports”: exports of foreign goods in the same state as previously imported. Re-exports are included in a country’s total export statistics, but it is good practice to also separately record their amount for analytical purposes.
Similarly, imports can be distinguished into imports of foreign-produced goods and imports of goods that were produced domestically and previously exported. There are various reasons why an exported good might be returned to the country of origin including defects, defaulted or cancelled orders, import barriers, and price changes. These flows are termed “re-imports” and are included in the country’s import statistics, but it is good practice to also separately record their amount for analytical purposes.
The reason for recording the value of re-exports and re-imports is so that they can be treated appropriately in certain analytical settings. For example, when trying to estimate the global demand and supply of ICT goods, as indicated by trade flows, it is preferable to avoid counting the same ICT good multiple times (e.g. both when it is exported from its country of origin and when it is re-exported from a second country).
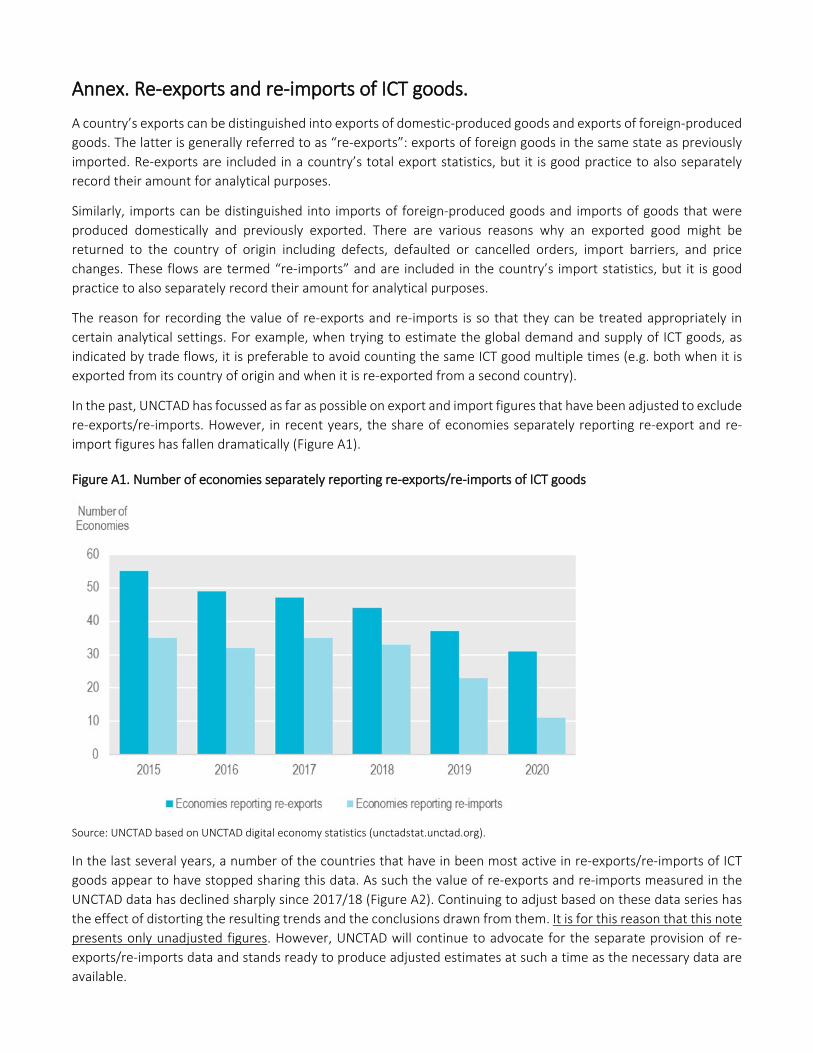
In the past, UNCTAD has focussed as far as possible on export and import figures that have been adjusted to exclude re-exports/re-imports. However, in recent years, the share of economies separately reporting re-export and re-import figures has fallen dramatically (Figure A1).
Figure A1. Number of economies separately reporting re-exports/re-imports of ICT goods
Source: UNCTAD based on UNCTAD digital economy statistics (unctadstat.unctad.org).
In the last several years, a number of the countries that have in been most active in re-exports/re-imports of ICT goods appear to have stopped sharing this data. As such the value of re-exports and re-imports measured in the UNCTAD data has declined sharply since 2017/18 (Figure A2). Continuing to adjust based on these data series has the effect of distorting the resulting trends and the conclusions drawn from them. It is for this reason that this note presents only unadjusted figures. However, UNCTAD will continue to advocate for the separate provision of re-exports/re-imports data and stands ready to produce adjusted estimates at such a time as the necessary data are available.

Figure A2. Value of reported re-exports and re-imports of ICT goods. US$ millions
Source: UNCTAD based on UNCTAD digital economy statistics (unctadstat.unctad.org).

UNCTAD Technical Notes on ICT for Development
For more information about UNCTAD’s work on ICT for Development please contact:
E-Commerce and Digital Economy Branch Division on Technology and Logistics unctad.org/topic/ecommerce-and-digital-economy [email protected]
UNCTAD Technical Notes on ICT for Development | Issue 19
1. Implications of Applying the New Definition of «ICT Goods», May 2011
2. Updating the Partnership Definition of ICT Goods From HS 2007 to HS 2012, January 2014
3. International Trade in ICT Services and ICT-enabled Services: Proposed Indicators from the Partnership on Measuring ICT for Development, October 2015
4. Global Assessment of Sex-disaggregated ICT Employment Statistics: Data Availability and Challenges on Measurement and Compilation, December 2015
5. Trade in ICT Goods and the 2015 Expansion of the WTO Information Technology Agreement, December 2015
6. In Search of Cross-border E-commerce Trade Data, April 2016
7. UNCTAD B2C E-commerce Index 2016, April 2016
8. The «New» Digital Economy and Development, October 2017
9. UNCTAD B2C E-commerce Index 2017, October 2017
10. Updating the Partnership Definition of ICT Goods From HS 2012 to HS 2017, February 2018
11. Implementing a Survey on Exports of ICT-enabled Services, June 2018
12. UNCTAD B2C E-commerce Index 2018: Focus on Africa, December 2018
13. Donor Support to the Digital Economy in Developing Countries, March 2019
14. UNCTAD B2C E-Commerce Index 2019, December 2019
15. UNCTAD Estimates of Global E-Commerce 2018, April 2020
16. Digital Economy Growth and Mineral Resources: Implications for Developing Countries, December 2020
17. The UNCTAD B2C E-commerce Index 2020 Spotlight on Latin America and the Caribbean, February 2021
18. Estimates of Global E-Commerce 2019 and Preliminary Assessment of COVID-19 Impact on Online Retail 2020, May 2021
IMPACTS OF THE COVID-19 PANDEMIC ON TRADE IN THE DIGITAL ECONOMY