uk residential market forecast - content.knightfrank.com · uk residential forecast november 2018...
TRANSCRIPT

RESEARCH
UK RESIDENTIAL MARKET FORECAST 2018

32
UK RESIDENTIAL FORECAST NOVEMBER 2018
KNIGHT FRANK RESEARCHRESEARCH KNIGHT FRANK
DROWNING OUT THE NOISE The national debate around Brexit is reaching a crescendo as we draw closer to a verdict on the final deal.
The political uncertainty thrown up by the lack of clarity around the UK’s future trading relationship with the rest of the world is having ramifications in all UK sectors, not just property.
However, when looking to the future, the Brexit noise can threaten to drown out everything else. It is worth putting in some earplugs to examine the other fundamentals of the housing market, as these too will determine what happens in the years to come, once the Brexit dust settles.
Affordability, for example, is a key issue. In the sales market it has been thrown into sharper focus by slowing activity in some parts of the country.
It’s no less of a factor in the rental market, however, where policy changes for landlords are affecting demand and supply dynamics, and pricing, in some parts of the UK.
The housing market, as with all markets, can absorb and adjust to change. Uncertainty is the most challenging factor of all, so sooner is better when it comes to a Brexit outcome.
Forecasting future trends in this environment has unique challenges. For these forecasts, we have assumed that a Brexit deal will be agreed, with a transition period until late 2020. Our forecasts are not directly comparable to our last forecasts released in May, as we have moved to using ONS data as a base for forecasting.
Pricing under pressureAs we have highlighted in previous reports, affordability is a key factor in the UK market. Average house prices are around 22% higher than at the previous peak of the market in late 2007, but, in London, prices are 60% higher. In the South East, average values are 37% higher. This growth in house prices has pushed the ONS’s measure of affordability (house price to median residence-based earnings) to 13.2 in London, up from 8.4 in 2007.
Affordability is a key issue for the sales market, thrown into sharper relief by slowing activity in some parts of the country.”
As affordability in some parts of London has become stretched, price growth has slowed, and reversed in some areas (examined in more detail later in the report). However, in other parts of the country, house price growth continues apace. This is particularly the case in Wales and the West Midlands, where affordability ratios are much more measured. Many of the UK’s cities are also seeing strong levels of growth.
We expect this trend to continue, with price growth in London slightly underperforming the UK average over the next five years, largely due to prices dipping in the capital this year and next. In contrast, price growth in the North East and Yorkshire & the Humber is expected to be the strongest, although all cumulative price growth forecasts are within a spectrum of five percentage points. Many UK cities have outperformed in terms of growth, and this trend is expected to continue.
Average house price growth across the UK, is expected to remain broadly unchanged over the next two years, which indicates pricing declines in real terms. However, as ever, we argue that headline figures can only tell you a very general story, with evidence that the market is becoming more localised. However, once the country leaves the EU, we expect a ‘relief bump’ as fears
over how the country might operate outside the EU are allayed.
The next election is slated for 2022, although there is a chance it may be brought forward. By 2023, house prices will have lagged behind wage growth for several years, and will likely return more closely to the average annual growth rate of 6% seen over the last 20 years.
Mortgage payments are one of the key measures of affordability. As such, changes to interest rates are another key factor in market movements. There is every chance that interest rates will rise further in the coming years. The Bank of England recently warned that “the monetary response to Brexit… could be in either direction”. Even so, any rate rises are likely to be moderate and well signposted, with the OBR forecasting that interest rates will be at 1.5% in 2023.
The current spread between mortgage rates for those with a 25% deposit and the base rate is around 1 percentage point, with home loan rates averaging 1.75%. However, this margin has been widening over the last year, suggesting the resulting rise in mortgage rates could be larger than a reflection of base rate movements. The margin on lending rates for 95% LTV mortgages for those with a 5% deposit is currently more than 2.5 percentage points over the base rate.
FIGURE 1
House Price to Residence-Based Earnings Ratio
Source: Knight Frank Research, ONS
UK RESIDENTIAL FORECAST NOVEMBER 2018
3KNIGHT FRANK RESEARCH
AVERAGE HOUSE PRICES ARE AROUND 22% HIGHER THAN AT THE PREVIOUS PEAK OF
THE MARKET IN LATE 2007, BUT IN LONDON, PRICES ARE 60% HIGHER.
GRÁINNE GILMORE Head of UK Residential Research
0
1
2
3
4
5
6
7
8
9
10
11
12
13
14
15
Yorkshire & the HumberEngland & WalesLondon
2002
2003
2004
2005
2006
2007
2008
2009
2010
2011
2012
2013
2014
2015
2016
2017
Please refer to the important notice at the end of this report
54
UK RESIDENTIAL FORECAST NOVEMBER 2018
KNIGHT FRANK RESEARCHRESEARCH KNIGHT FRANK
Source: Knight Frank Research, Land Registry, ONS
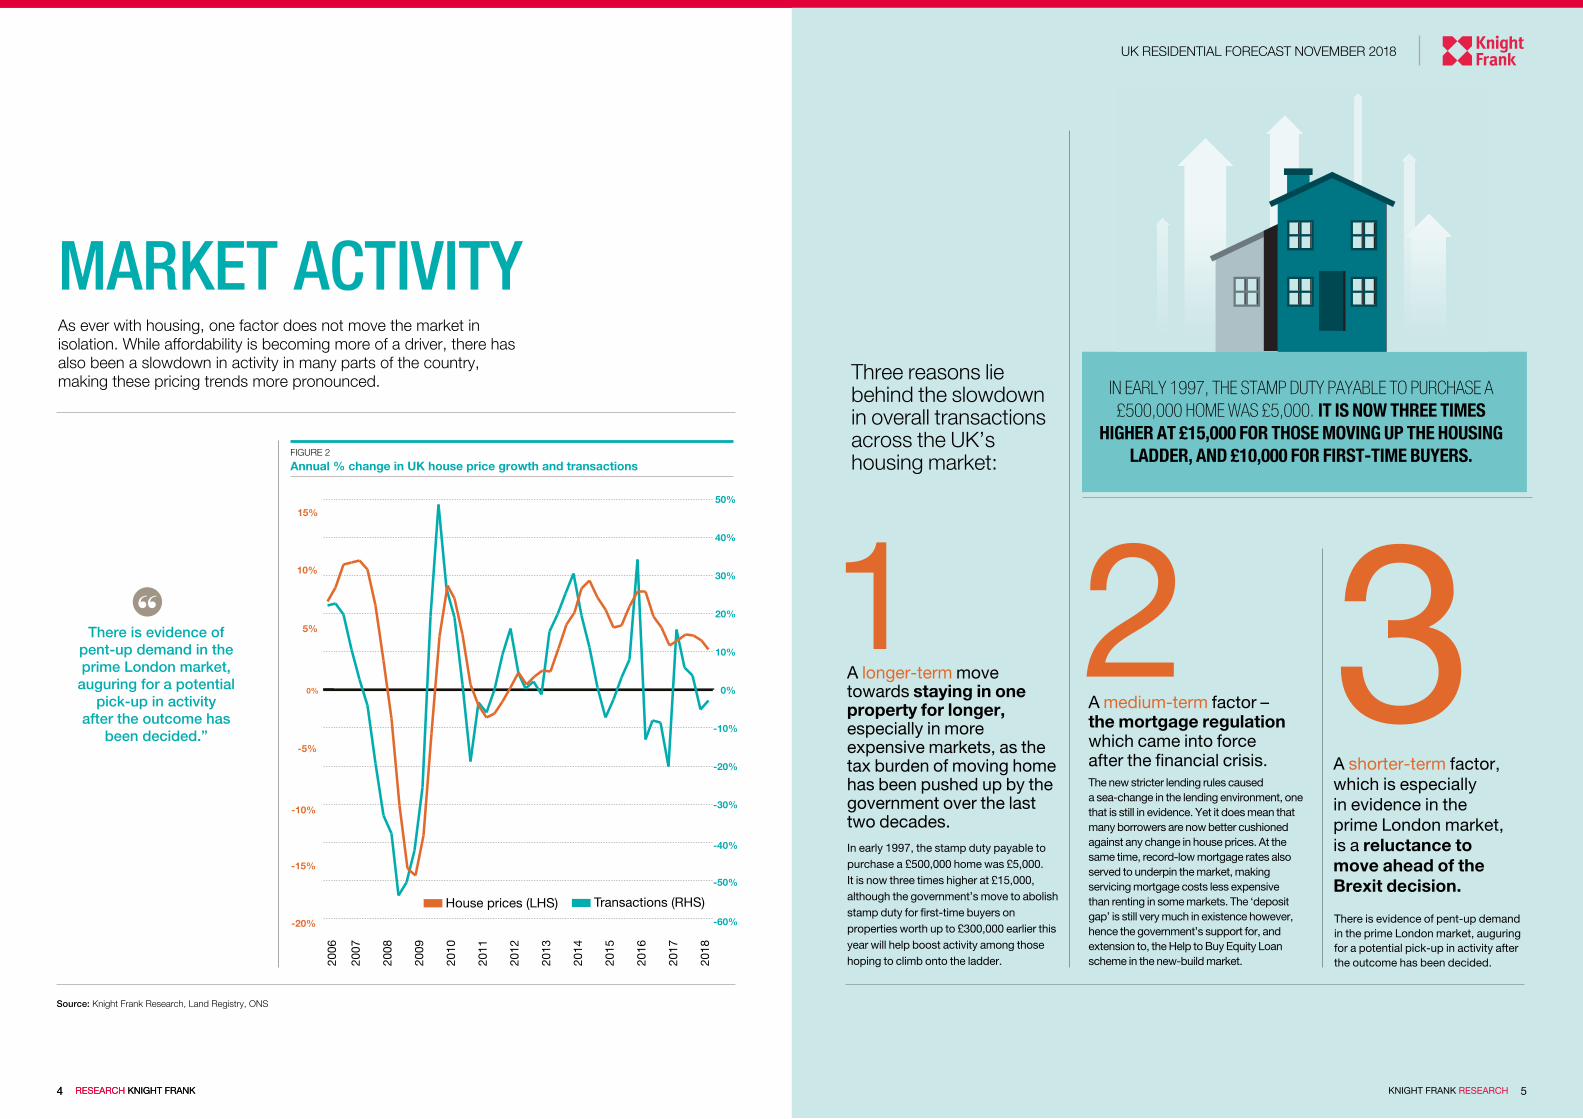
Three reasons lie behind the slowdown in overall transactions across the UK’s housing market:
MARKET ACTIVITY As ever with housing, one factor does not move the market in isolation. While affordability is becoming more of a driver, there has also been a slowdown in activity in many parts of the country, making these pricing trends more pronounced.
There is evidence of pent-up demand in the prime London market, auguring for a potential pick-up in activity after the outcome has been decided.
A shorter-term factor, which is especially in evidence in the prime London market, is a reluctance to move ahead of the Brexit decision.
UK RESIDENTIAL FORECAST NOVEMBER 2018
5KNIGHT FRANK RESEARCH4 RESEARCH KNIGHT FRANK
A longer-term move towards staying in one property for longer, especially in more expensive markets, as the tax burden of moving home has been pushed up by the government over the last two decades. In early 1997, the stamp duty payable to purchase a £500,000 home was £5,000. It is now three times higher at £15,000, although the government’s move to abolish stamp duty for first-time buyers on properties worth up to £300,000 earlier this year will help boost activity among those hoping to climb onto the ladder.
1 3A medium-term factor – the mortgage regulation which came into force after the financial crisis. The new stricter lending rules caused a sea-change in the lending environment, one that is still in evidence. Yet it does mean that many borrowers are now better cushioned against any change in house prices. At the same time, record-low mortgage rates also served to underpin the market, making servicing mortgage costs less expensive than renting in some markets. The ‘deposit gap’ is still very much in existence however, hence the government’s support for, and extension to, the Help to Buy Equity Loan scheme in the new-build market.
2FIGURE 2
Annual % change in UK house price growth and transactions
IN EARLY 1997, THE STAMP DUTY PAYABLE TO PURCHASE A £500,000 HOME WAS £5,000. IT IS NOW THREE TIMES
HIGHER AT £15,000 FOR THOSE MOVING UP THE HOUSING LADDER, AND £10,000 FOR FIRST-TIME BUYERS.
2018
2017
2016
2015
2014
2013
2012
2011
2010
2009
2008
2007
2006
-20%
-15%
-10%
-5%
0%
5%
10%
15%
-60%
-50%
-40%
-30%
-20%
-10%
0%
10%
20%
30%
40%
50%
Transactions (RHS) House prices (LHS)
There is evidence of pent-up demand in the prime London market,
auguring for a potential pick-up in activity
after the outcome has been decided.”
76
UK RESIDENTIAL FORECAST NOVEMBER 2018
KNIGHT FRANK RESEARCHRESEARCH KNIGHT FRANK
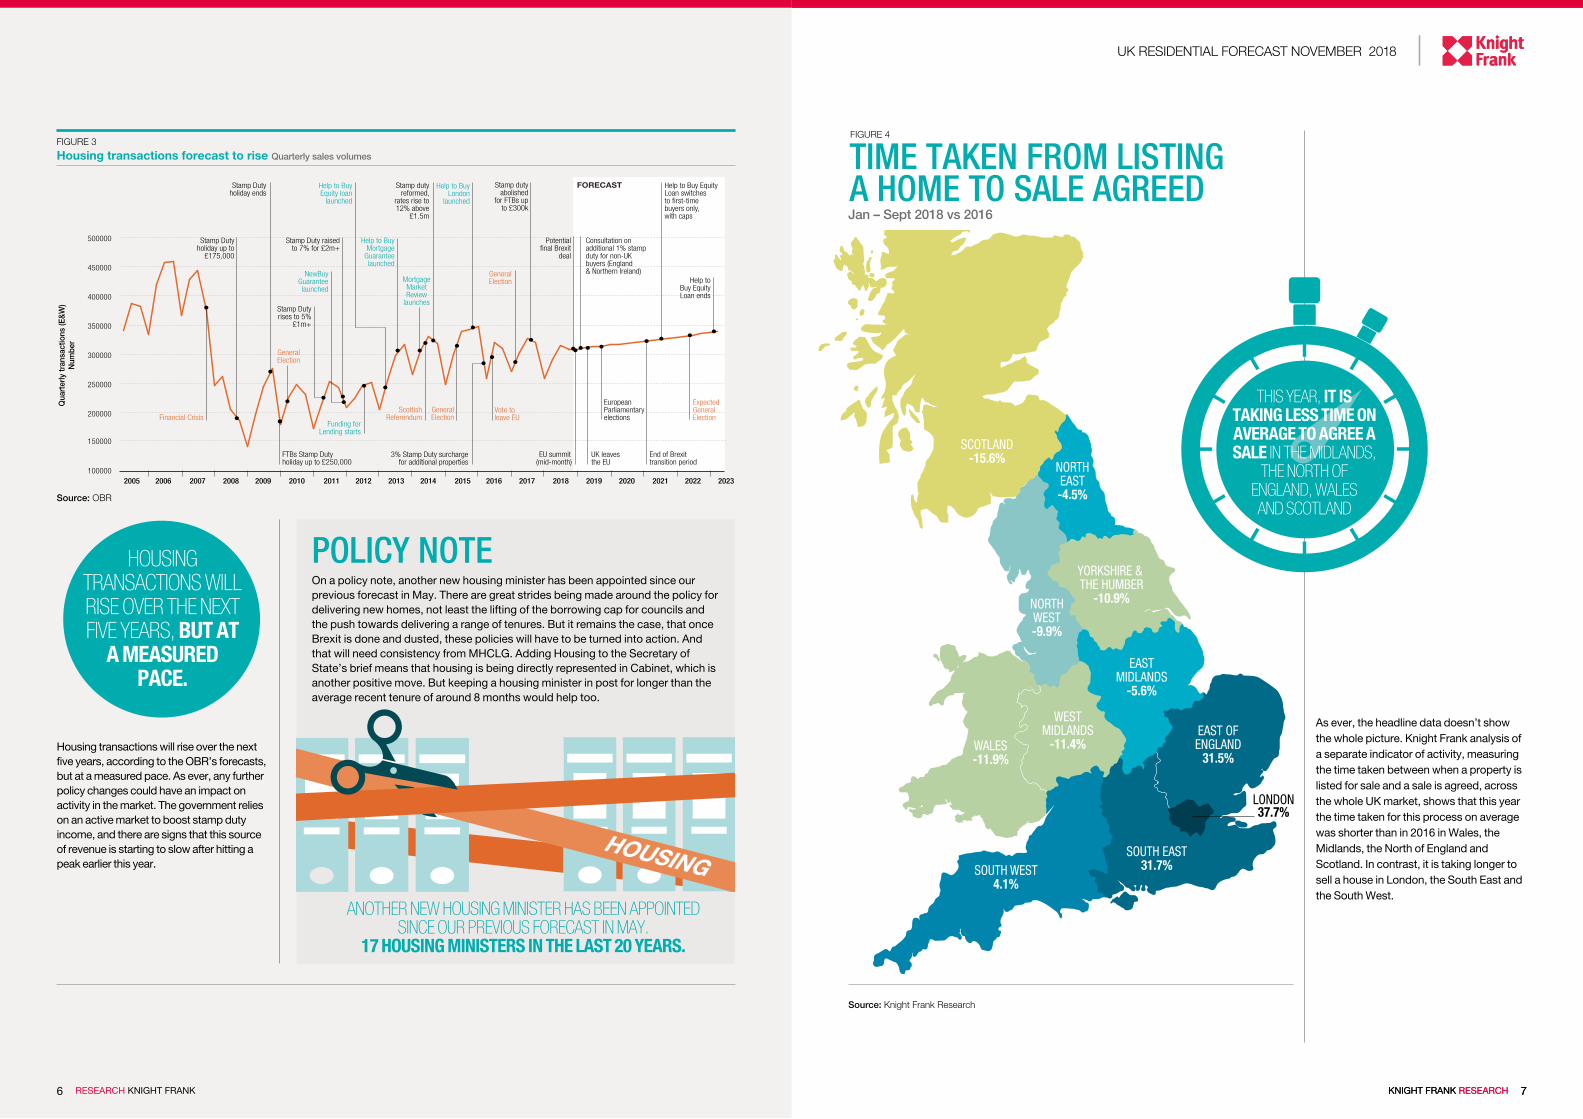
NORTHEAST-4.5%
WALES-11.9%
SCOTLAND-15.6%
NORTHWEST-9.9%
YORKSHIRE & THE HUMBER
-10.9%
EASTMIDLANDS
-5.6%
WESTMIDLANDS
-11.4%EAST OFENGLAND
31.5%
SOUTH EAST31.7%SOUTH WEST
4.1%
LONDON37.7%
Jan – Sept 2018 vs 2016
FIGURE 4
Source: Knight Frank Research
Source: OBR
7KNIGHT FRANK RESEARCH
FIGURE 3
Housing transactions forecast to rise Quarterly sales volumes
As ever, the headline data doesn’t show the whole picture. Knight Frank analysis of a separate indicator of activity, measuring the time taken between when a property is listed for sale and a sale is agreed, across the whole UK market, shows that this year the time taken for this process on average was shorter than in 2016 in Wales, the Midlands, the North of England and Scotland. In contrast, it is taking longer to sell a house in London, the South East and the South West.
6 RESEARCH KNIGHT FRANK
Qua
rter
ly tr
ansa
ctio
ns (E
&W
)N
umbe
r
Help to BuyEquity loan
launched
Help to BuyLondon
launched
Stamp dutyabolished
for FTBs upto £300k
FORECAST
Help to BuyMortgage
Guaranteelaunched
NewBuyGuaranteelaunched
Stamp dutyreformed,
rates rise to12% above
£1.5m
Stamp Dutyholiday ends
FTBs Stamp Dutyholiday up to £250,000
Funding forLending starts
3% Stamp Duty surcharge for additional properties
ScottishReferendum
Vote toleave EU
GeneralElection
GeneralElection
Stamp Duty raisedto 7% for £2m+
Stamp Dutyholiday up to
£175,000
Financial Crisis
EuropeanParliamentaryelections
ExpectedGeneralElection
End of Brexittransition period
Help to Buy EquityLoan switchesto first-timebuyers only,with caps
UK leavesthe EU
Potentialfinal Brexit
deal
EU summit(mid-month)
Consultation onadditional 1% stampduty for non-UKbuyers (England& Northern Ireland)
100000
150000
200000
250000
300000
350000
400000
450000
500000
2016 2017 2018 2019 2020 2021 2022 20232015201420132012201120102008 20092005 2006 2007
Stamp Dutyrises to 5%
£1m+
GeneralElection
MortgageMarketReview
launches
Help toBuy EquityLoan ends
Housing transactions will rise over the next five years, according to the OBR’s forecasts, but at a measured pace. As ever, any further policy changes could have an impact on activity in the market. The government relies on an active market to boost stamp duty income, and there are signs that this source of revenue is starting to slow after hitting a peak earlier this year.
THIS YEAR, IT IS TAKING LESS TIME ON AVERAGE TO AGREE A SALE IN THE MIDLANDS,
THE NORTH OF ENGLAND, WALES AND SCOTLAND
TIME TAKEN FROM LISTING A HOME TO SALE AGREED
HOUSING TRANSACTIONS WILL RISE OVER THE NEXT FIVE YEARS, BUT AT
A MEASURED PACE.
On a policy note, another new housing minister has been appointed since our previous forecast in May. There are great strides being made around the policy for delivering new homes, not least the lifting of the borrowing cap for councils and the push towards delivering a range of tenures. But it remains the case, that once Brexit is done and dusted, these policies will have to be turned into action. And that will need consistency from MHCLG. Adding Housing to the Secretary of State’s brief means that housing is being directly represented in Cabinet, which is another positive move. But keeping a housing minister in post for longer than the average recent tenure of around 8 months would help too.
ANOTHER NEW HOUSING MINISTER HAS BEEN APPOINTED SINCE OUR PREVIOUS FORECAST IN MAY.
17 HOUSING MINISTERS IN THE LAST 20 YEARS.
POLICY NOTE

UK RESIDENTIAL FORECAST NOVEMBER 2018
9KNIGHT FRANK RESEARCH
The politics of prime London Political uncertainty generated by Brexit is the principal reason sales volumes and pricing in prime London sales markets are on a downwards trajectory in the final quarter of 2018. Price declines have now more than compensated for higher rates of stamp duty, which suggests activity levels could strengthen once political uncertainty recedes.
We therefore expect modest price growth to return in 2019, based on the assumption that the UK and EU will finalise a Brexit deal, which is something both parties appear to be tentatively moving towards.
There is evidence that pent-up demand is forming in the sales market, which could drive this relief rally. While we don’t expect political risk surrounding Brexit to disappear completely in 2019, the key trigger for any rally is likely to be the point that the prospect of a disorderly exit from the EU disappears.
The proposal to levy an extra 1% stamp duty on overseas buyers could curb price growth to some extent in more central markets, together with a post-Brexit rise in sterling, but the precise impact of the new tax over the next several years is difficult to gauge because its implementation date is unclear.
Overall, we expect pricing to strengthen after 2019 as political uncertainty surrounding Brexit and the stability of the present government recedes.
However, political risk is unlikely to disappear ahead of the next election, due
to the after-effects of Brexit and ongoing global concerns such as protectionism. We therefore forecast weaker price growth in 2022, the year of the next scheduled UK general election, before stronger growth returns in 2023 as political risk fades.
It’s all Relative The rate of annual growth in the prime country market has averaged less than 1% since mid-2016. A succession of rises for stamp duty on high value property, the slowdown in the prime London market and more uncertainty over the short-to mid-term prospects for the UK economy, have combined to keep a lid on further growth.
Against the backdrop of Brexit negotiations, it’s likely that these current market conditions will continue in the short-term. While pricing is expected to remain subdued, the relative value on offer in most prime regional housing markets,especially when compared with London, should help underpin demand over our forecast period.
The ongoing pressure on property prices in the capital is likely to be reflected in traditional commuter markets, with stronger growth reserved for markets further afield. In Scotland, markets have been more robust, with Edinburgh the best-performing prime market tracked by Knight Frank over the past 12 months, a trend we expect will continue.
PRIME SALES MARKETS
Source: Knight Frank Research NB. Price forecasts are for existing homes. Property values in the new-build market may perform differently.*Based on Knight Frank indices and boundaries, existing homes only.
2018 2019 2020 2021 2022 2023 2019-2023
Mainstream residential sales markets
UK 2.0% -1.0% 1.0% 3.0% 2.0% 5.0% 10.3%
London -0.5% -2.0% 1.0% 3.0% 2.0% 5.0% 9.2%
South East 1.0% -1.0% 1.0% 2.5% 1.5% 5.0% 9.2%
South West 3.0% -2.0% 1.0% 2.5% 1.5% 4.5% 7.6%
East of England 1.5% -2.0% 0.0% 2.5% 1.5% 5.0% 7.1%
East Midlands 1.0% -1.5% 0.0% 2.5% 2.0% 5.0% 8.1%
West Midlands 2.5% -1.0% 0.5% 3.0% 2.5% 5.5% 10.8%
Yorks and Humber 2.5% 0.5% 1.0% 3.0% 2.5% 4.5% 12.0%
North West 3.0% 0.0% 1.5% 2.0% 2.5% 5.0% 11.4%
North East -0.5% 0.5% 2.5% 2.5% 2.5% 5.0% 13.6%
Wales 2.5% 0.0% 0.5% 2.0% 2.5% 4.5% 9.8%
Scotland 1.5% -1.0% 0.5% 3.0% 3.0% 4.5% 10.3%
Prime residential sales markets
Prime Central London -4.0% 1.0% 2.0% 3.5% 2.0% 4.5% 13.7%
Prime Outer London -5.0% 0.0% 2.0% 3.5% 2.0% 5.0% 13.1%
Prime Country 0.5% 0.5% 1.5% 1.5% 2.0% 2.5% 8.2%
2018-2023 FORECASTS: NOVEMBER 2018
Five year mainstream growth in UK
10.3%
Five year growth in Prime Central London
13.7%
8 RESEARCH KNIGHT FRANK

10
UK RESIDENTIAL FORECAST NOVEMBER 2018
RESEARCH KNIGHT FRANK
HIGHEST RISK
LOWEST RISK 3 7 106 95 8421
7
RISK MONITOR The risk score combines the likelihood of
these scenarios happening, and their impact. The score illustrates the chances that such a scenario results in pricing moving away from our central forecast.
PRIME LONDON 8
7
8
7
3 5
5
4
5
5
5
UK
UK RESIDENTIAL FORECAST NOVEMBER 2018
BREXIT/POLITICAL UPHEAVAL
Prolonged political uncertainty on the outcome of Brexit, or an exit with no deal, without the necessary no-deal planning and safeguards in place. Confidence in the government is affected by disunity within parties, undermining economic and consumer confidence.
GENERAL ELECTION
Uncertainty over a potential change in Government causes short-term slowdown in activity, and affects market sentiment.
GEO-POLITICAL FACTORS
Rising geo-political tensions cause a global economic slowdown, affecting the UK economy.
INTEREST RATES
Interest rates rise more quickly than expected, or move unexpectedly, prompting a sudden rise in mortgage rates.
UK ECONOMY
UK economic growth underperforms against expectations.
PROPERTY TAX CHANGES
After a series of rises in property taxes, and an announced consultation on an additional 1% stamp duty on non-UK buyers, policymakers implement more uplifts. Any additional charges could curb activity, particularly in the prime London market.
There is new supply coming from the Build-to-Rent sector. There are currently around 132,000 units of purpose-built rented accommodation already completed or in the pipeline.”
Scenarios
Residential rental markets 2018 2019 2020 2021 2022 2023 2019-2023
UK 1.0% 2.0% 2.0% 2.5% 2.5% 3.0% 12.6%
London 0.0% 2.5% 2.5% 3.0% 3.5% 3.5% 15.9%
Prime central London* 1.0% 3.0% 2.0% 1.0% 1.5% 2.0% 9.9%
Prime outer London* 0.0% 2.0% 1.5% 1.5% 2.0% 2.0% 9.3%
Source: Knight Frank Research NB. Price forecasts are for existing homes. Property values in the new-build market may perform differently.*Based on Knight Frank indices and boundaries, existing homes only.
Around one in five households in England are now living in the private rented sector, up from one in 10 at the turn of the century. In London, the proportion has risen to around 28%.
This comes despite the policy changes for the buy-to-let sector, with additional stamp duty for landlords buying investment properties and the cutting of mortgage interest relief between 2017 and 2020. Our most recent analysis based on mortgage lending data suggests that the growth of buy-to-let lending has slowed sharply over the last two years, but at present, there was still net growth in the sector of around 18,000 units last year, with more landlords entering the market or taking out additional new mortgages than those exiting the market. However, as the mortgage interest relief changes continue to come into force this year, next year and in 2020, more landlords may review their portfolios.
There is new supply coming from the Build-to-Rent sector, there are currently around 132,000 units of purpose-built rented accommodation in the pipeline. Half have been completed or are under construction, while the other half have yet to start construction. When compared to the 4.6 million PRS households across the country, the scale of the BTR sector can be seen, but it is growing rapidly.
Even so, the private rented market is likely to be characterised by falling overall supply over the coming years, which will put upward pressure on rents within the limits of rising household disposable income. In urban centres, there is a real opportunity for localised rental outperformance, especially near transport hubs in towns and cities where the local economy is outperforming.
Prime London’s Boomerang Landlords Rental values in prime London lettings markets strengthened in the final quarter of 2018 as supply fell. Average rents in prime central London grew 1.2% in the year to October, while the annual change in prime outer London was -1%, the most modest rate of decline since March 2016.
This year as an increasing number of landlords have attempted to sell their property following tax changes, although
some have now returned to the lettings market because their price expectations were not met.
Overall, we forecast stronger rental value growth in 2019 in prime central and prime outer London because the impetus to sell will remain as further tax changes for landlords take effect. This trend will only accelerate if the stabilising political environment produces modest house price growth.
In recent years, the government has introduced a series of tax reforms affecting landlords and the last Budget in October appeared to suggest this will remain the political direction of travel.
While declining supply will underpin rental values, so will stronger demand from corporate tenants. The impact of any Brexit deal on the prime London lettings market will be linked to London’s status as a leading global financial centre. There have been few indications this will be materially affected by Brexit but tenant demand is likely to strengthen once this risk disappears more fully.
Beyond 2020, as the recovery in the sales market consolidates, demand may start to move back into the sales market as house price inflation returns. However, tenant demand is likely to strengthen again as political uncertainty returns in 2022, the year of the next scheduled general election.
RENTAL MARKETS The number of households in the private rented sector continues to grow apace.
11KNIGHT FRANK RESEARCH
Knight Frank Research provides strategic advice, consultancy services and forecasting to a wide range of clients worldwide including developers, investors, funding organisations, corporate institutions and the public sector. All our clients recognise the need for expert independent advice customised to their specific needs.
Important Notice
This general document is provided strictly on the basis that you cannot rely on its contents and Knight Frank LLP (and our affiliates, members and employees) will have no responsibility or liability whatsoever in relation to the accuracy, reliability, currency, completeness or otherwise of its contents or as to any assumption made or as to any errors or for any loss or damage resulting from any use of or reference to the contents. You must take specific independent advice in each case. It is for general outline interest only and will contain selective information. It does not purport to be definitive or complete. Its contents will not necessarily be within the knowledge or represent the opinion of Knight Frank LLP. Knight Frank LLP is a property consultant regulated by the Royal Institution of Chartered Surveyors and only provides services relating to real estate, not financial services. It was prepared during the period of October 2018. It uses certain data available then, and reflects views of market sentiment at that time. Details or anticipated details may be provisional or have been estimated or otherwise provided by others without verification and may not be up to date when you read them. Computer-generated and other sample images or plans may only be broadly indicative and their subject matter may change. Images and photographs may show only certain parts of any property as they appeared at the time they were taken or as they were projected. Any forecasts or projections of future performance are inherently uncertain and liable to different outcomes or changes caused by circumstances whether of a political, economic, social or property market nature. Prices indicated in any currencies are usually based on a local figure provided to us and/or on a rate of exchange quoted on a selected date and may be rounded up or down. Any price indicated cannot be relied upon because the source or any relevant rate of exchange may not be accurate or up to date. VAT and other taxes may be payable in addition to any price in respect of any property according to the law applicable.
© Knight Frank LLP 2018. All rights reserved. No part of this presentation may be copied, disclosed or transmitted in any form or by any means, electronic or otherwise, without prior written permission from Knight Frank LLP for the specific form and content within which it appears. Each of the provisions set out in this notice shall only apply to the extent that any applicable laws permit. Knight Frank LLP is a limited liability partnership registered in England with registered number OC305934 and trades as Knight Frank. Our registered office is 55 Baker Street, London W1U 8AN, where you may look at a list of members’ names. Any person described as a partner is a member, consultant or employee of Knight Frank LLP, not a partner in a partnership.
FOR RESEARCH ENQUIRIES:
Oliver KnightAssociate+44 20 7861 5134 [email protected]
Tom BillHead of London Residential Research +44 20 7861 [email protected]
Gráinne Gilmore Head of UK Residential Research +44 20 7861 5102 [email protected]
Liam Bailey Global Head of Research +44 20 7861 5133 [email protected]
Patrick Gower Associate +44 20 3640 7015 [email protected]
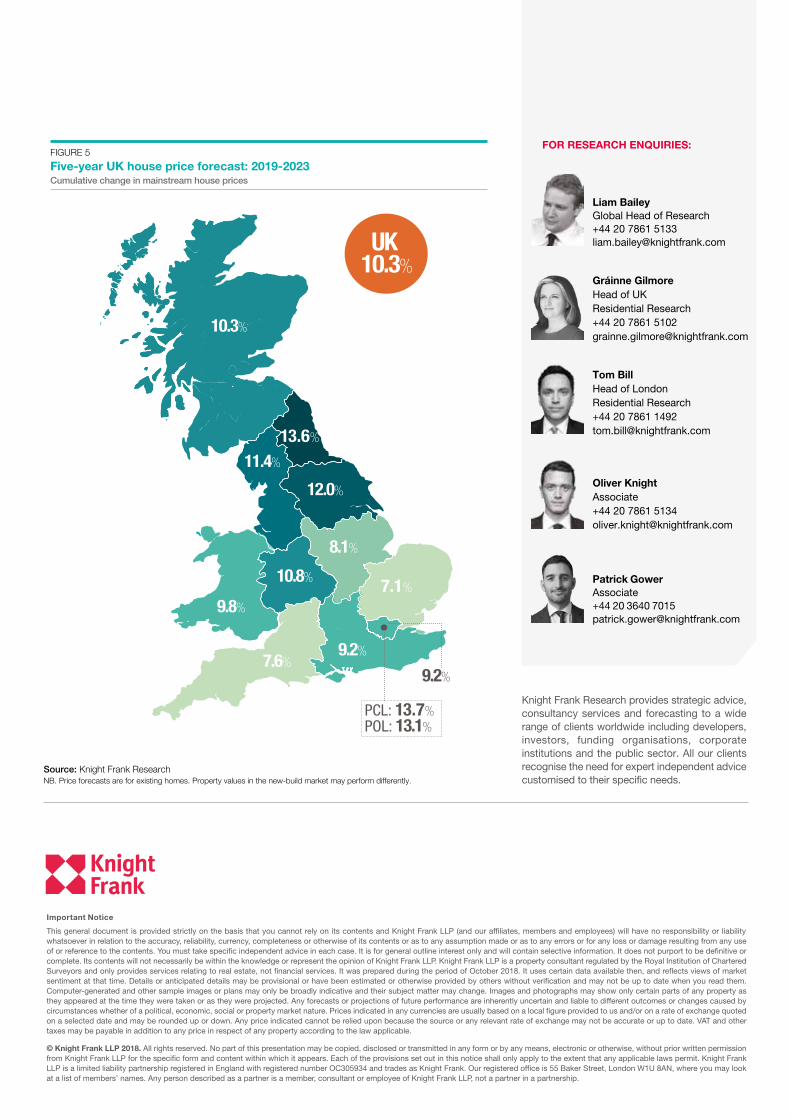
13.6%
12.0%
11.4%
8.1%
10.3%
10.8%
9.8%
7.6%
POL: 13.1%PCL: 13.7%
9.2%
9.2%
UK 10.3%
7.1%
FIGURE 5
Five-year UK house price forecast: 2019-2023 Cumulative change in mainstream house prices
Source: Knight Frank ResearchNB. Price forecasts are for existing homes. Property values in the new-build market may perform differently.