two-dimensional radiative transfer in protostellar
TRANSCRIPT
TWO-DIMENSIONAL RADIATIVE TRANSFER IN PROTOSTELLAR ENVELOPES. I.EFFECTS OF GEOMETRY ON CLASS I SOURCES
Barbara A.Whitney,1KennethWood,
2J. E. Bjorkman,
3and Michael J. Wolff
1
Received 2002 November 26; accepted 2003March 19
ABSTRACT
We present two-dimensional radiation transfer models of class I protostars and show the effect ofincluding more realistic geometries on the resulting spectral energy distributions and images. We begin with arotationally flattened infalling envelope as our comparison model and add a flared disk and bipolar cavity.The disk affects the spectral energy distribution most strongly at edge-on inclinations, causing a broad dip atabout 10 lm (independent of the silicate feature) due to high extinction and low scattering albedo in thiswavelength region. The bipolar cavities allow more direct stellar+disk radiation to emerge into polardirections and more scattering radiation to emerge into all directions. The wavelength-integrated flux, ofteninterpreted as luminosity, varies with viewing angle, with pole-on viewing angles seeing 2–4 times as muchflux as edge-on, depending on geometry. Thus, observational estimates of luminosity should take intoaccount the inclination of a source. The envelopes with cavities are significantly bluer in near-IR and mid-IRcolor-color plots than those without cavities. Using one-dimensional models to interpret Class I sources withbipolar cavities would lead to an underestimate of envelope mass and an overestimate of the implied evolu-tionary state. We compute images at near-, mid-, and far-IR wavelengths. We find that the mid-IR colors andimages are sensitive to scattering albedo and that the flared disk shadows the midplane on large size scales atall wavelengths plotted. Finally, our models produce polarization spectra that can be used to diagnose dustproperties, such as albedo variations due to grain growth. Our results of polarization across the 3.1 lm icefeature agree well with observations for ice mantles covering 5% of the radius of the grains.
Subject headings: circumstellar matter — dust, extinction — polarization — radiative transfer —stars: formation — stars: pre–main-sequence
1. INTRODUCTION
Lada and collaborators first classified pre–main-sequencestars into an evolutionary sequence, Classes I through III,by the shapes of their spectra energy distributions (SEDs)(Lada 1987; Myers et al. 1987; Adams, Lada, & Shu 1987).Class I sources, the subject of this paper, are thought to beT Tauri stars surrounded by infalling envelopes. Morerecently, an earlier stage, Class 0, was proposed to describemore deeply embedded sources (Andre, Ward-Thompson,& Barsony 1993). This called into question whether theClass I envelopes are merely remnants or are still collapsing,although detailed radiative transfer models of several ClassI sources require substantial envelope mass (typically 10–20times greater than a Class II disk), and suggests that theenvelopes are still infalling, if at a less embedded stage thanthe Class 0 stage (Adams et al. 1987; Kenyon et al. 1993a,1993b; Whitney, Kenyon, & Gomez 1997; D. P. Stark et al.2003, in preparation).
Adams et al. (1987) successfully interpreted the SEDs ofClass I sources with one-dimensional radiative transfermodels of spherically averaged rotationally flattened infal-ling envelopes. Kenyon et al. (1993a) applied ‘‘ 1.5 dimen-sional ’’ radiative transfer calculations to model the SEDs ofthe Taurus Class I sources, using the spherically averageddensity for calculating the temperature. The average model
infall rates and centrifugal radii were consistent withobserved sound speeds and disk sizes. Efstathiou & Rowan-Robinson (1991) also performed accurate two-dimensionalradiative transfer solutions using the rotationally flattenedinfalling envelope. All of these SED models of Class Isources tend to have similar features, steeply rising at about1 lm, then gradually rising to 100 lm and falling off to1000 lm (see Fig. 9, top left panel, for a similar model).More recently, Nakazato, Nakamoto, & Umemura (2003)calculated two-dimensional models of Class I objects thatincluded a disk and a piecewise spherically symmetric enve-lope divided into two latitude sectors, each having a radialpower law independent of polar angle. To create a bipolarcavity, the density was lowered in the polar sector.
Most of the previous one-dimensional and even thetwo-dimensional SED models of Class I sources under-estimate the optical/near-IR flux when compared toobservations. Scattered light models (Kenyon et al.1993b) showed that bipolar cavities are required to allowan escape path for the short-wavelength radiation and tofit the extended images and polarization maps of thesesources (Whitney et al. 1997; Lucas & Roche 1997,1998). Gomez, Whitney, & Kenyon (1997) found [S ii]emission from jets and Herbig-Haro objects in nearly allthe Taurus Class I sources, providing a mechanism forproducing the bipolar cavities. In addition, most of theClass I sources are known to have low-velocity molecularoutflows (Moriarty-Schieven et al. 1992, 1995a, 1995b;Chandler et al. 1996; Tamura et al. 1996; Hogerheijde etal. 1998). High spatial resolution images (Padgett et al.1999) and scattered-light models (D. P. Stark et al. 2003,in preparation) find that vertically extended disks, an
1 Space Science Institute, 3100 Marine Street, Suite A353, Boulder,CO 80303; [email protected].
2 School of Physics and Astronomy, University of St. Andrews, NorthHaugh, St. Andrews, Fife KY16 9AD, Scotland; [email protected].
3 Ritter Observatory, MS 113, Department of Physics and Astronomy,University of Toledo, Toledo, OH 43606-3390; [email protected].
The Astrophysical Journal, 591:1049–1063, 2003 July 10
# 2003. The American Astronomical Society. All rights reserved. Printed in U.S.A.
1049
expected consequence of rotational infall, are required inaddition to the infalling envelopes to fit the images sev-eral Class I sources. The hydrodynamic collapse modelsof Bate (1998) also produce substantial disks in Class Isources.
Since it is clear from these studies that Class I sourceshave disks and cavities in addition to infalling envelopes,we wish to determine whether these more complicatedgeometries give different SEDs than the previous modelsshow. This paper computes the exact solutions for two-dimensional radiative transfer in Class I sources includingthe realistic geometrical effects of a rotationally flattenedenvelope, a flared accretion disk, and bipolar cavity. Wefind that both the disks and cavities have substantialeffects on the resulting SEDs, especially in the mid-IR.These variations can be tested with new ground-basedand upcoming space-based infrared observations. In addi-tion to SEDs, we compute images and polarization. Thispaper details how the geometry affects the SED for asingle evolutionary state, the Class I source. In afollow-up paper we will explore these effects in an evolu-tionary sequence. The next section describes the models,x 3 shows the results of four different geometries, and x 4concludes with a discussion of the results.
2. RADIATIVE TRANSFER MODELS
2.1. Ingredients of theModel: Disk, Envelope,and Cavity Structure
We wish to use as realistic a geometry as possible todescribe the Class I protostar. Since disks appear to beubiquitous in star-forming regions (Cohen, Emerson, &Beichman 1989; Strom, Newton, & Strom 1989; Beckwithet al. 1990; Dutrey, Guilloteau, & Simon 1994; Koerner &Sargent 1995; Saito et al. 1995; Burrows et al. 1996) andtherefore the infalling envelope likely has angular momen-tum, we choose for the envelope geometry the infall solutionthat includes rotation (Ulrich 1976; Cassen & Moosman1981; Terebey, Shu, & Cassen 1984). On larger scales, mag-netic fields (Galli & Shu 1993a, 1993b; Li 1998; Ciolek &Konigl 1998) and initial motions prior to dynamical col-lapse (Foster & Chevalier 1993) may affect the structure, butwithin the infalling region, the effects of rotation likely dom-inate over magnetic effects. This region contributes most tothe SED and images. The density structure for the rotation-ally flattened infalling envelope within the infalling radius isgiven by
� ¼_MMenv
4�
GM�R3
c
� ��1=2r
Rc
� ��3=2
1þ l
l0
� ��1=2
� l
l0þ 2l20Rc
r
� ��1
; ð1Þ
where _MMenv is the envelope mass infall rate, Rc is the centri-fugal radius, l ¼ cos �, and l0 is the cosine polar angle of astreamline of infalling particles as r ! 1. The equation forthe streamline is given by
l30 þ l0ðr=Rc � 1Þ � lðr=RcÞ ¼ 0 : ð2Þ
For the disk structure, we use a standard flared accretiondensity (Shakura & Sunyaev 1973; Lynden-Bell & Pringle
1974; Pringle 1981; Bjorkman 1997; Hartmann 1998):
� ¼ �0 1�ffiffiffiffiffiffiffiR�$
r !R�$
� ��
exp � 1
2
z
hð$Þ
� �2( ); ð3Þ
where $ is the radial coordinate in the disk midplane andthe scale height increases with radius, h ¼ h0 $=R�ð Þ�. Forthe models presented here, we adopt � ¼ 1:25 and � ¼ 2:25,h0 ¼ 0:01R�, giving a scale height at the disk outer radius ofh 100 AUð Þ ¼ 10 AU. The � and � values are consistentwith detailed hydrostatic structure calculations (D’Alessioet al. 1998). The exact disk structure in an object with aninfalling envelope is likely to vary from this geometry, sincethe disks are accreting from the infalling envelope. How-ever, observations and models of Class I sources show mor-phologies consistent with vertically extended disks (Padgettet al. 1999; D. P. Stark et al. 2003, in preparation), so theflared disk seems to be a good starting point for this investi-gation. We include accretion energy, d _EEacc=dV , in the diskusing the �-disk prescription (Shakura & Sunyaev 1973;Kenyon & Hartmann 1987; Bjorkman 1997; Hartmann1998):
d _EEacc
dV¼ 3GM� _MMdiskffiffiffiffiffiffiffiffiffiffi
32�3p
$3hð$Þ1�
ffiffiffiffiffiffiffiR�$
r !exp � 1
2
z
hð$Þ
� �2( );
ð4Þ
where the disk accretion rate, _MMdisk, is given by
_MMdisk ¼ffiffiffiffiffiffiffiffiffiffi18�3
p�diskVc�0h
30=R� ; ð5Þ
with the critical velocity Vc ¼ GM�=R�ð Þ1=2. For the diskparameters used in this paper (x 3), Table 1 shows the result-ing disk accretion rate and accretion luminosity. Forsimplicity, accretion energy inside the dust destructionradius, Rdust, is emitted with the stellar spectrum. Thus theaccretion luminosity emitted within the dusty disk is
Lacc ¼GM� _MM
2Rdust3� 2
ffiffiffiffiffiffiffiffiffiffiffiffiffiffiffiffiffiffiffiR�=Rdust
p� �: ð6Þ
Since near-IR images of Class I sources require bipolarcavities to fit the observations (Kenyon et al. 1993b;Whitney et al. 1997), we include them in these models. We
TABLE 1
Model Parameters
Parameter Description Value
R* (R�) .................... Stellar radius 2.09
T* (K) ...................... Stellar temperature 4000
L* (L�)..................... Stellar luminosity 1
M* (M�) .................. Stellar mass 0.5
Mdisk (M�) ............... Diskmass 0.01
� .............................. Disk radial density exponent 2.25
� .............................. Disk scale height exponent 1.25
h0 ............................. Disk scale height atR* 0.01
Rd;min (R*)................ Disk inner radius 7.5
Rd;max (AU).............. Disk outer radius 100
�disk ......................... Disk viscosity parameter 0.01
LaccðRd;minÞ (L*)....... Disk accretion luminosity toRd;min 0.0078_MMdisk (M� yr�1)........ Disk accretion rate 1.4� 10�8
Re;min (R*) ................ Envelope inner radius 7.5
Re;max (AU) .............. Envelope outer radius 5000_MMenv (M� yr�1) ........ Envelope infall rate 5� 10�6
1050 WHITNEY ET AL. Vol. 591
choose two shapes to describe the cavities since both appearto be evident in observations (Padgett et al. 1999; D. P.Stark et al. 2003, in preparation; Reipurth et al. 2000).These are a streamline, which is conical on large scales, anda curved cavity. The streamline cavity shape might occur ifprecessing jets carve out a conical shape while infallingmaterial outside of the cavity continues to fall in alongstreamlines. The cause of a curved shape is less certain. Thestreamline cavity shape is defined by equation (2); at eachðl; rÞ, l0 is calculated, and if it is greater than the chosencavity angle, the density is set to the cavity density. Whitney& Hartmann (1993) show a picture of this cavity shape intheir Figure 1. The curved cavity follows z ¼ a$b, where$ ¼ x2 þ y2ð Þ1=2. We include a small amount of dust in thecavity with constant density, nH2
¼ 2� 104 cm�3, asexpected for a cylindrical outflow. The density in the cavitymay vary from nH2
� 103 106 cm�3 in the high- and low-velocity flow regions (Bachiller & Tafalla 1999; Reipurth &Raga 1999). A more realistic cavity density distributionincluding such large variations could have a substantialeffect on the radiative transfer and will be considered infuture work. The total mass in the cavity, about 6� 10�3
M�, is similar to observed outflow masses in Taurus Class Isources (Moriary-Schieven et al. 1995b; Chandler et al.1996; Hogerheijde et al. 1998).
2.2. Radiation TransferMethod
To calculate the radiative transfer, we incorporated theMonte Carlo radiative equilibrium routines developed byBjorkman & Wood (2001) into a three-dimensional spheri-cal-polar grid code (Whitney & Wolff 2001). Bjorkman &Wood tested their codes by comparing to a set of bench-mark calculations developed by Ivezic et al. (1997) forspherically symmetric codes. They then applied theirmethod to two-dimensional ellipsoidal envelopes andT Tauri disks (Wood et al. 2002a, 2002b). These codes use anumerical optical depth integrator that operates on an ana-lytically prescribed density. The numerical integrator hasdifficulty handling sharp density gradients. In order toinclude arbitrary density distributions, such as bipolar cav-ities or three-dimensional clumpy envelopes, we have devel-oped a code that uses a three-dimensional spherical-polargrid (Whitney &Wolff 2002). The density is constant withina grid cell, allowing for straightforward integration of opti-cal depth through the grid. Since the density in each cell iscomputed only once at the beginning of the processing, wecan incorporate very complicated analytic density formula-tions or use tabular densities derived from hydrodynamicalsimulations. For the protostellar envelope case, the grid hasvariable spacing in r and h to sample the vastly different den-sity variations and size scales from the inner disk region tothe outer envelope. The radial spacing is logarithmic in theinner region of the disk, to resolve the inner edge of the diskin optical depth, and then follows a power-law spacing outto the edge of the envelope, chosen to be 5000 AU for themodels presented here.
We include accretion in our disk, following Wood et al.(2002b). We also attach a diffusion solution to the innerregions (Bjorkman, Whitney, &Wood 2003). We tested ourgrid code by comparing calculations of ellipsoidal envelopesand T Tauri disks to the two-dimensional codes ofBjorkman & Wood (2001) and Wood et al. (2002a, 2002b).The results were identical.
In these models, the luminosity is produced by the centralstar and disk accretion; it then gets absorbed and reemittedor else scattered by the surrounding disk and envelope. Asdescribed in Bjorkman &Wood (2001), the radiative equili-brium algorithm corrects for the temperature in each gridcell by sampling the new photon frequency from a differ-enced emissivity function (the difference between that com-puted with the previous erroneous temperature and thatcomputed from the new corrected temperature). Energy isconserved and no iteration is required as the differencespectrum corrects for the previous temperature errors. Thescattering phase function is approximated using theHenyey-Greenstein function, with forward-scatteringparameter g and albedo ! computed at each wavelengthfrom our grain model (described below). Polarization iscalculated assuming a Rayleigh-like phase function for thelinear polarization (White 1979).
The Monte Carlo codes produce results simultaneously atall inclinations. We also incorporate the ‘‘ peeling-off ’’algorithm (Yusef-Zadeh, Morris, & White 1984; Wood &Reynolds 1999) to produce high signal-to-noise (S/N) imagesat a specific inclination in a given run. Images are producedat several wavelengths and convolved with broadband filterfunctions for comparison to observations. For this paper wechose for the near-IR images the Hubble Space Telescope(HST) NIC2 F110W (1.1 lm), F160W (1.6 lm), and F205W(2.1 lm) filters. For the mid-IR images, we chose the SpaceInfrared Telescope Facility (SIRTF) IRAC filter functions at3.6, 4.5, 5.8, and 8.0 lm. And for the far-IR images, we chosethe SIRTF MIPS filter functions at 24, 70, and 160 lm. Agiven run produces all the images simultaneously as it produ-ces the SEDs and polarization spectra. The models take �30minutes to produce high-quality spectra (that is, high fre-quency resolution and low noise) at all inclinations on a1 GHz Linux PC running g77 FORTRAN. To producehigh-quality images takes several hours.
2.3. DustModel
The dominant opacity source in the radiative transfermodels is dust grains. Our dust model is based on thatderived by Kim, Martin, & Hendry (1994) for the diffuseinterstellar medium (ISM; using a code kindly supplied byPeter Martin and Paul Hendry). To approximate dust prop-erties in nearby star formation regions, we produce a sizedistribution of grains that fits an extinction curve generatedby the Cardelli, Clayton, &Mathis (1989) prescription, withRV ¼ 4. This value of RV is typical of the denser regions inthe Taurus molecular cloud (Whittet et al. 2001). The sizedistribution is not a simple power law, because it is derivedfrom a maximum entropy method solution. The size distri-bution is similar to that shown in Figure 1a of Kim et al.(1994). We adopt the dielectric functions of astronomicalsilicate and graphite from Laor & Draine (1993). To illus-trate the effects of ices, which cause observable spectral fea-tures, we include a layer of water ice on the grains, coveringthe outer 5% of radius. We varied this value between 0%and 15% and found 5% to agree best with polarizationobservations, as discussed in x 3.5. The ice dielectricfunction is taken fromWarren (1984).
This grain model may be appropriate for the envelopeproperties but is likely not applicable in the midplane of thedisk, where grains should grow to meter size within a time-scale of 104–105 yr (Weidenschilling & Cuzzi 1993; Wetherill
No. 2, 2003 RADIATIVE TRANSFER IN PROTOSTARS. I. 1051
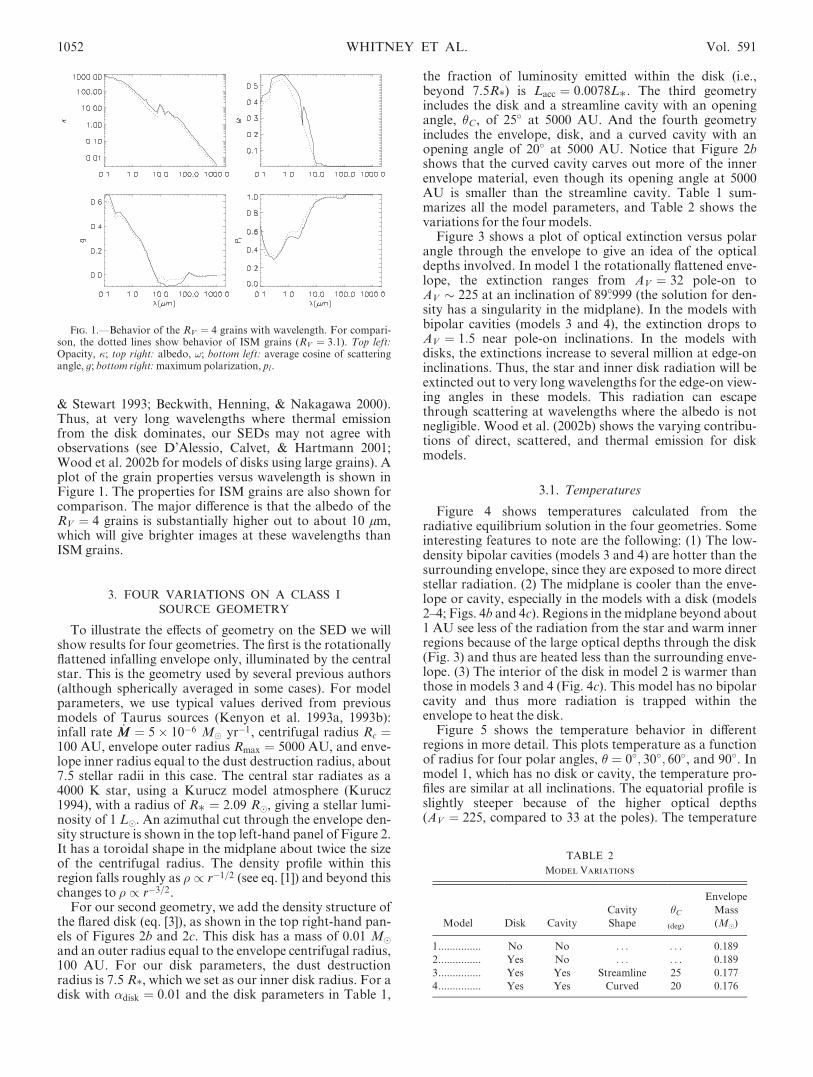
& Stewart 1993; Beckwith, Henning, & Nakagawa 2000).Thus, at very long wavelengths where thermal emissionfrom the disk dominates, our SEDs may not agree withobservations (see D’Alessio, Calvet, & Hartmann 2001;Wood et al. 2002b for models of disks using large grains). Aplot of the grain properties versus wavelength is shown inFigure 1. The properties for ISM grains are also shown forcomparison. The major difference is that the albedo of theRV ¼ 4 grains is substantially higher out to about 10 lm,which will give brighter images at these wavelengths thanISM grains.
3. FOUR VARIATIONS ON A CLASS ISOURCE GEOMETRY
To illustrate the effects of geometry on the SED we willshow results for four geometries. The first is the rotationallyflattened infalling envelope only, illuminated by the centralstar. This is the geometry used by several previous authors(although spherically averaged in some cases). For modelparameters, we use typical values derived from previousmodels of Taurus sources (Kenyon et al. 1993a, 1993b):infall rate _MM ¼ 5� 10�6 M� yr�1, centrifugal radius Rc ¼100 AU, envelope outer radius Rmax ¼ 5000 AU, and enve-lope inner radius equal to the dust destruction radius, about7.5 stellar radii in this case. The central star radiates as a4000 K star, using a Kurucz model atmosphere (Kurucz1994), with a radius of R� ¼ 2:09 R�, giving a stellar lumi-nosity of 1 L�. An azimuthal cut through the envelope den-sity structure is shown in the top left-hand panel of Figure 2.It has a toroidal shape in the midplane about twice the sizeof the centrifugal radius. The density profile within thisregion falls roughly as � / r�1=2 (see eq. [1]) and beyond thischanges to � / r�3=2.
For our second geometry, we add the density structure ofthe flared disk (eq. [3]), as shown in the top right-hand pan-els of Figures 2b and 2c. This disk has a mass of 0.01 M�and an outer radius equal to the envelope centrifugal radius,100 AU. For our disk parameters, the dust destructionradius is 7.5 R*, which we set as our inner disk radius. For adisk with �disk ¼ 0:01 and the disk parameters in Table 1,
the fraction of luminosity emitted within the disk (i.e.,beyond 7.5R*) is Lacc ¼ 0:0078L�. The third geometryincludes the disk and a streamline cavity with an openingangle, �C , of 25� at 5000 AU. And the fourth geometryincludes the envelope, disk, and a curved cavity with anopening angle of 20� at 5000 AU. Notice that Figure 2bshows that the curved cavity carves out more of the innerenvelope material, even though its opening angle at 5000AU is smaller than the streamline cavity. Table 1 sum-marizes all the model parameters, and Table 2 shows thevariations for the four models.
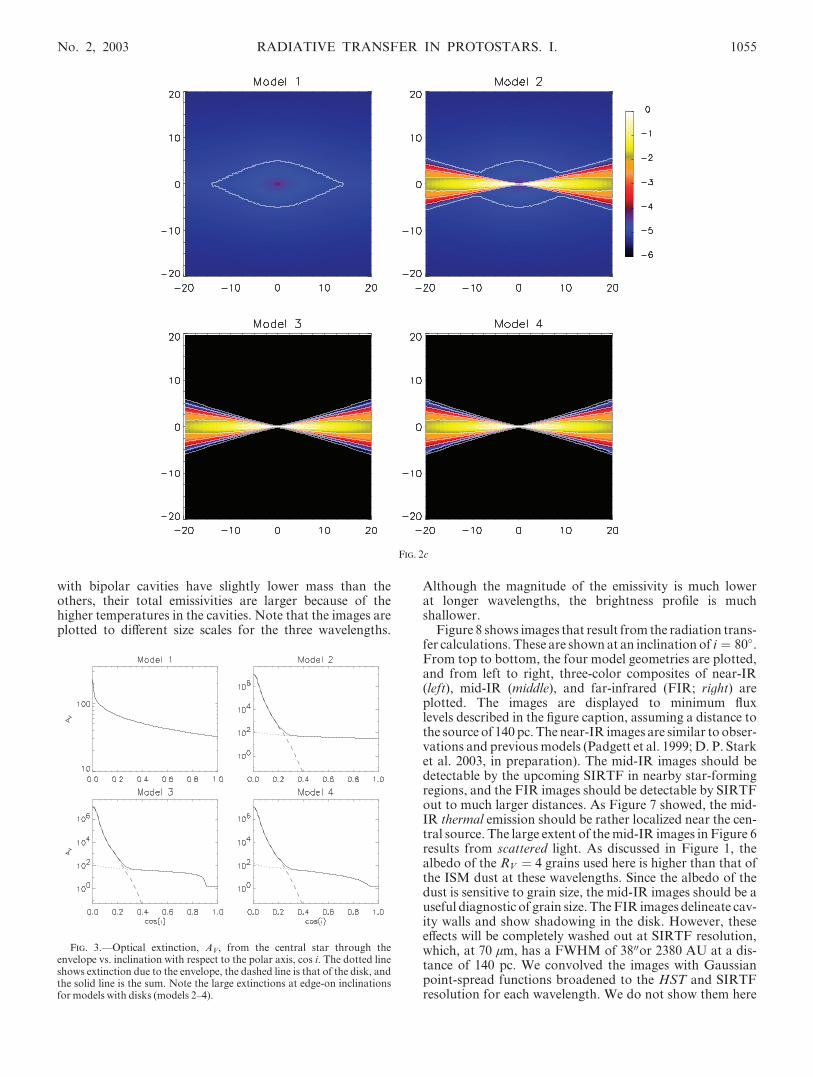
Figure 3 shows a plot of optical extinction versus polarangle through the envelope to give an idea of the opticaldepths involved. In model 1 the rotationally flattened enve-lope, the extinction ranges from AV ¼ 32 pole-on toAV � 225 at an inclination of 89=999 (the solution for den-sity has a singularity in the midplane). In the models withbipolar cavities (models 3 and 4), the extinction drops toAV ¼ 1:5 near pole-on inclinations. In the models withdisks, the extinctions increase to several million at edge-oninclinations. Thus, the star and inner disk radiation will beextincted out to very long wavelengths for the edge-on view-ing angles in these models. This radiation can escapethrough scattering at wavelengths where the albedo is notnegligible. Wood et al. (2002b) shows the varying contribu-tions of direct, scattered, and thermal emission for diskmodels.
3.1. Temperatures
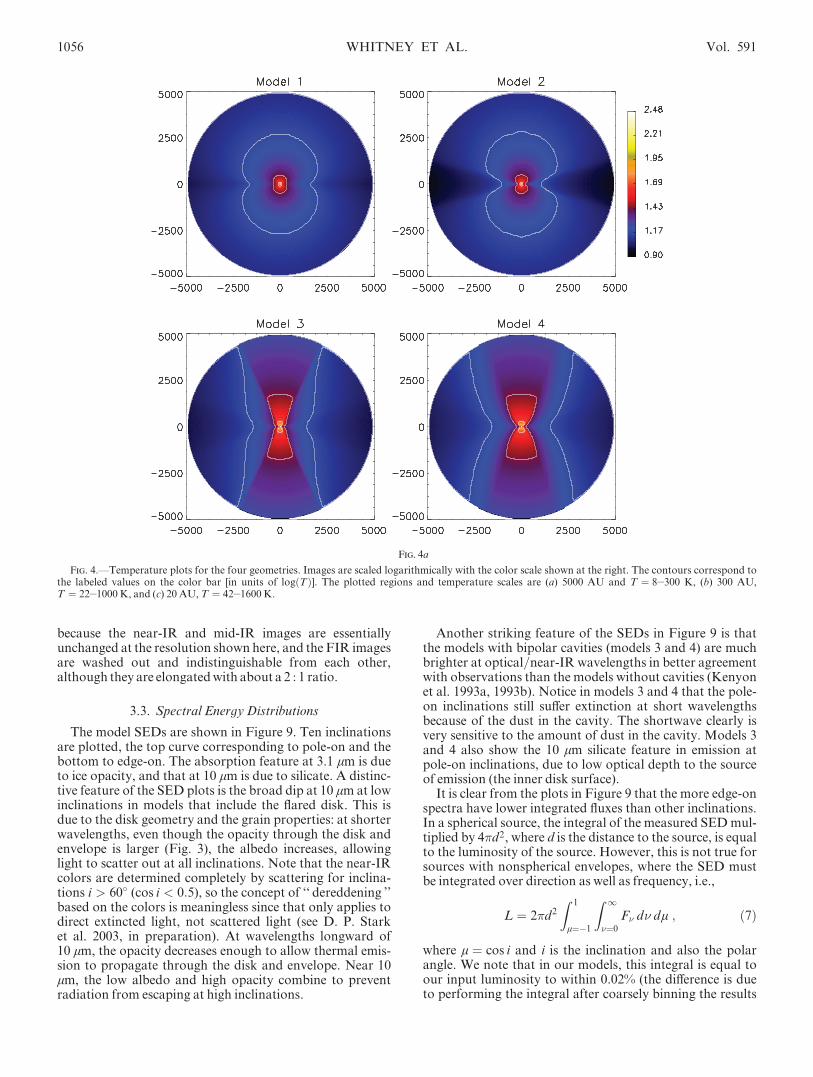
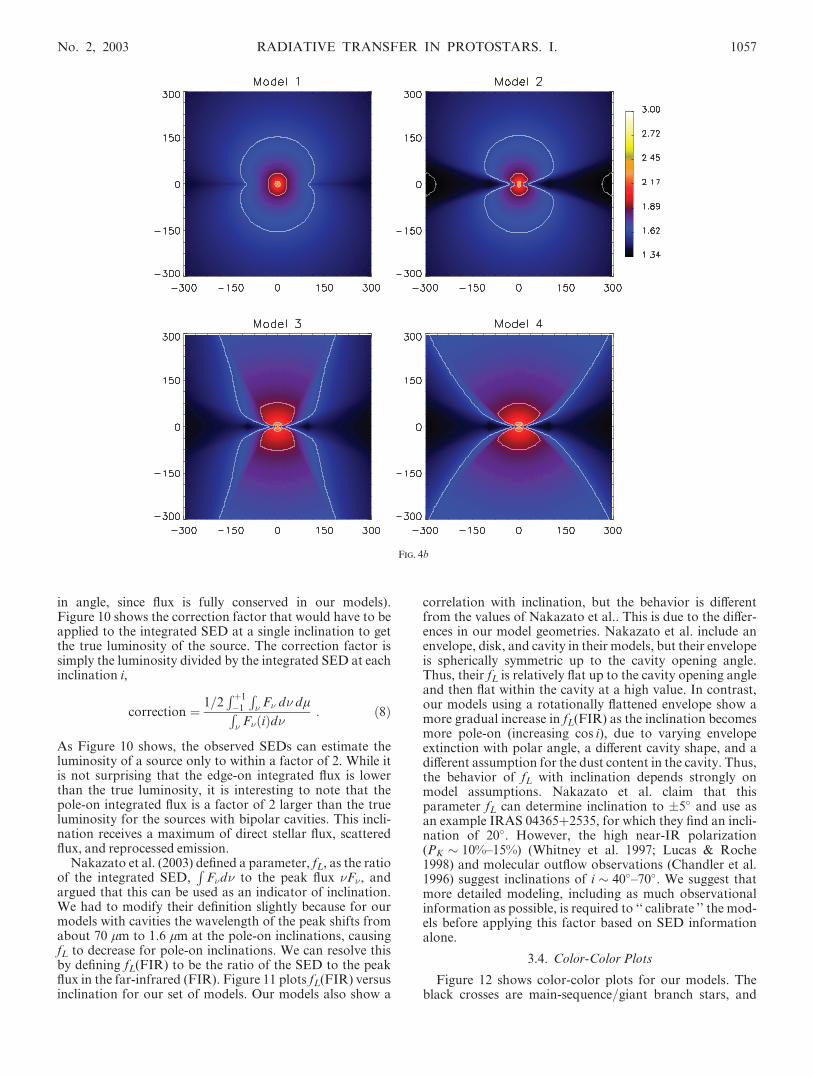
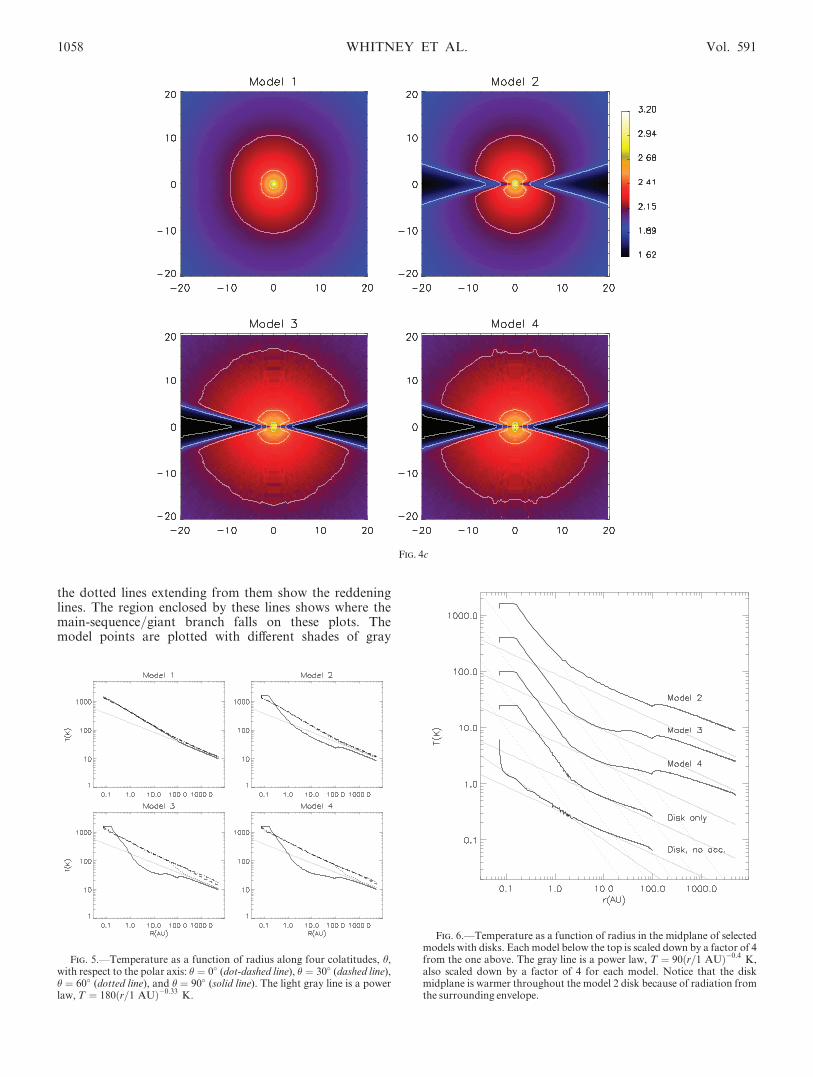
Figure 4 shows temperatures calculated from theradiative equilibrium solution in the four geometries. Someinteresting features to note are the following: (1) The low-density bipolar cavities (models 3 and 4) are hotter than thesurrounding envelope, since they are exposed to more directstellar radiation. (2) The midplane is cooler than the enve-lope or cavity, especially in the models with a disk (models2–4; Figs. 4b and 4c). Regions in the midplane beyond about1 AU see less of the radiation from the star and warm innerregions because of the large optical depths through the disk(Fig. 3) and thus are heated less than the surrounding enve-lope. (3) The interior of the disk in model 2 is warmer thanthose in models 3 and 4 (Fig. 4c). This model has no bipolarcavity and thus more radiation is trapped within theenvelope to heat the disk.
Figure 5 shows the temperature behavior in differentregions in more detail. This plots temperature as a functionof radius for four polar angles, � ¼ 0�; 30�; 60�, and 90�. Inmodel 1, which has no disk or cavity, the temperature pro-files are similar at all inclinations. The equatorial profile isslightly steeper because of the higher optical depths(AV ¼ 225, compared to 33 at the poles). The temperature
Fig. 1.—Behavior of the RV ¼ 4 grains with wavelength. For compari-son, the dotted lines show behavior of ISM grains (RV ¼ 3:1). Top left:Opacity, �; top right: albedo, !; bottom left: average cosine of scatteringangle, g; bottom right:maximum polarization, pl .
TABLE 2
Model Variations
Model Disk Cavity
Cavity
Shape
hC
(deg)
Envelope
Mass
(M�)
1............... No No . . . . . . 0.189
2............... Yes No . . . . . . 0.189
3............... Yes Yes Streamline 25 0.177
4............... Yes Yes Curved 20 0.176
1052 WHITNEY ET AL. Vol. 591

scales roughly as r�0.5 out to about 3 AU and then transi-tions to r�0:33 beyond 200 AU. As shown in Kenyon et al.(1993a), the temperature profile in optically thin regions isT / r�a, where a ¼ �2=ð4þ pÞ, and p is the power-lawexponent for the grain opacity, i.e., �� / �p. Beyond a radiusof 100 AU, the emitting temperatures are below 40 K, so thepeak of the blackbody function is longward of 75 lm. Atthese wavelengths, the opacity power-law exponent is p ¼ 2,giving an optically thin temperature profile of r�1/3 in agree-ment with our results. The light gray line plotted with eachmodel is a power law with a ¼ 0:33. In the inner region wecan attempt to compare to the diffusion solution, althoughour opacity exponent varies with wavelength and thereforetemperature. The diffusion solution (Kenyon et al. 1993a)givesT / r�a, where a ¼ ð1þ nÞ=ð4þ pÞ and n is the densitypower-law exponent, � / r�n. At 1 AU, for therotational infall solution, n ¼ 1
2. The temperature is 400 K,giving peak Planck emission at 7.5 lm. At this wavelengththere is a kink in the opacity law, where p varies between 0.5(on average) to the long wavelengths and 1.5 to the shortwavelengths. This gives a range of a ¼ 0:42 0:6 for the cal-culated temperature profile. Our value of a ¼ 0:5 is withinthis range. Kenyon et al. (1993a) find a value of a � 0:7 inenvelope geometries similar to those of our model 1; how-ever, the profiles in Efstathiou & Rowan-Robinson (1991)
appear to be closer to a � 0:5. These differences could be duein part to different grainmodels and envelope parameters.
The temperature profiles for models with disks and cavitieshave much more variation with polar angle, as shown inmodels 2–4 in Figure 5. The midplane temperature profileshows a steep drop in the disk, with T / r�1:15 out to 1 AUand flattening out to 100 AU. Then it follows a profile similarto that of the rest of the envelope, scaled to a lower tempera-ture. The temperature profile in the polar region in the mod-els with cavities (models 3–4) is similar to the models withoutcavities. It flattens out to the optically thin profile, a ¼ 1
3, at asmaller radius, leading to higher overall temperatures in thecavity. The 30� and 60� profiles (dotted and dashed lines)diverge from the 0� line where the path intersects the cavitywall and drops to the lower envelope scale. This happens ear-lier in model 3 thanmodel 4 because of the shape of the cavitywalls. At large radii, the models with cavities are hotter alongall directions, even in the midplane.
To better understand the temperature behavior in thedisk, in Figure 6 we compare the midplane temperature pro-file of the models with disks (models 2–4) with those of diskswith no envelopes. The gray line plotted with each model isa power law, T ¼ 90ðr=1 AUÞ�0:4 K. It is clear from theseplots that no single power law characterizes the temperaturebehavior in either the disk-only or disk+envelope models.
Fig. 2a
Fig. 2.—Density plots showing the four geometries. Model 1: rotationally flattened infalling envelope; model 2: same as model 1+flared disk; model 3: sameas model 2+streamline cavity; model 4: same as model 2+curved cavity. The scaling is logarithmic, plotted to 6 orders of magnitude from the peak shown. Thecontours each decrease by 1 order of magnitude and match the labels of the color bar. The plotted regions and peak densities are (a) 5000 AU, 3� 10�14 gcm�3, (b) 300 AU, 1:5� 10�12 g cm�3, and (c) 20 AU, 8� 10�12 g cm�3.
No. 2, 2003 RADIATIVE TRANSFER IN PROTOSTARS. I. 1053
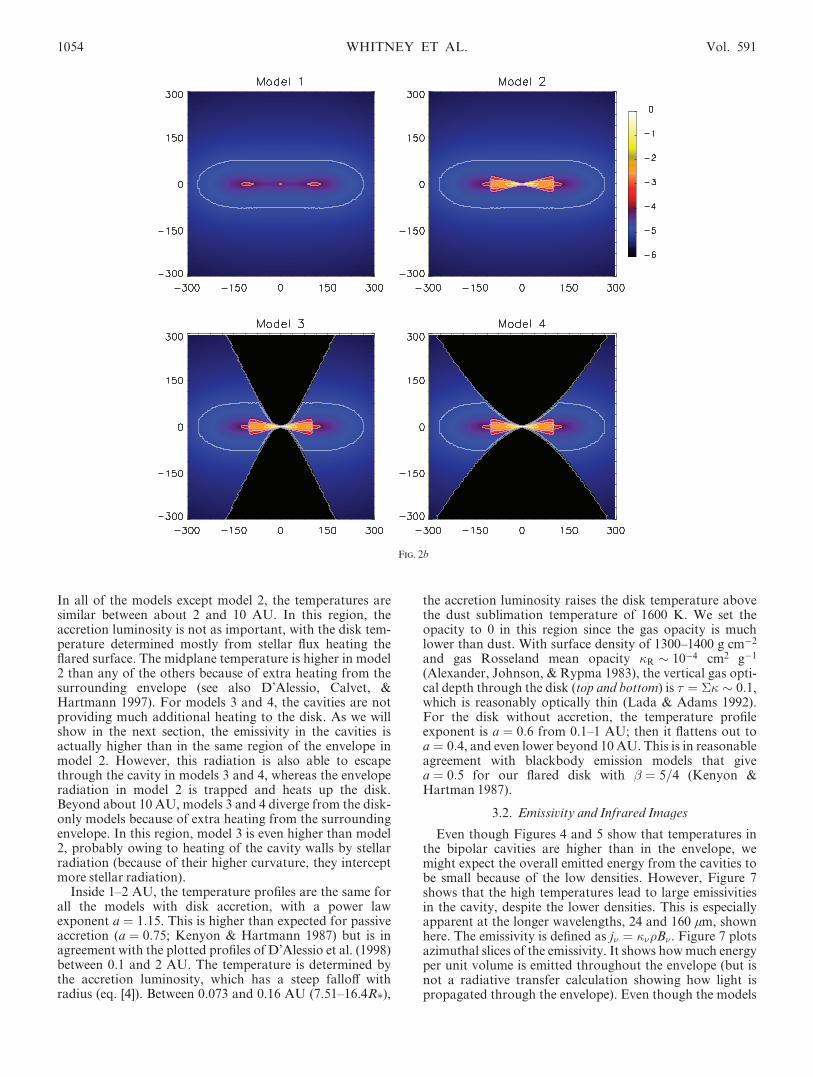
In all of the models except model 2, the temperatures aresimilar between about 2 and 10 AU. In this region, theaccretion luminosity is not as important, with the disk tem-perature determined mostly from stellar flux heating theflared surface. The midplane temperature is higher in model2 than any of the others because of extra heating from thesurrounding envelope (see also D’Alessio, Calvet, &Hartmann 1997). For models 3 and 4, the cavities are notproviding much additional heating to the disk. As we willshow in the next section, the emissivity in the cavities isactually higher than in the same region of the envelope inmodel 2. However, this radiation is also able to escapethrough the cavity in models 3 and 4, whereas the enveloperadiation in model 2 is trapped and heats up the disk.Beyond about 10 AU, models 3 and 4 diverge from the disk-only models because of extra heating from the surroundingenvelope. In this region, model 3 is even higher than model2, probably owing to heating of the cavity walls by stellarradiation (because of their higher curvature, they interceptmore stellar radiation).
Inside 1–2 AU, the temperature profiles are the same forall the models with disk accretion, with a power lawexponent a ¼ 1:15. This is higher than expected for passiveaccretion (a ¼ 0:75; Kenyon & Hartmann 1987) but is inagreement with the plotted profiles of D’Alessio et al. (1998)between 0.1 and 2 AU. The temperature is determined bythe accretion luminosity, which has a steep falloff withradius (eq. [4]). Between 0.073 and 0.16 AU (7.51–16.4R*),
the accretion luminosity raises the disk temperature abovethe dust sublimation temperature of 1600 K. We set theopacity to 0 in this region since the gas opacity is muchlower than dust. With surface density of 1300–1400 g cm�2
and gas Rosseland mean opacity �R � 10�4 cm2 g�1
(Alexander, Johnson, & Rypma 1983), the vertical gas opti-cal depth through the disk (top and bottom) is � ¼ �� � 0:1,which is reasonably optically thin (Lada & Adams 1992).For the disk without accretion, the temperature profileexponent is a ¼ 0:6 from 0.1–1 AU; then it flattens out toa ¼ 0:4, and even lower beyond 10 AU. This is in reasonableagreement with blackbody emission models that givea ¼ 0:5 for our flared disk with � ¼ 5=4 (Kenyon &Hartman 1987).
3.2. Emissivity and Infrared Images
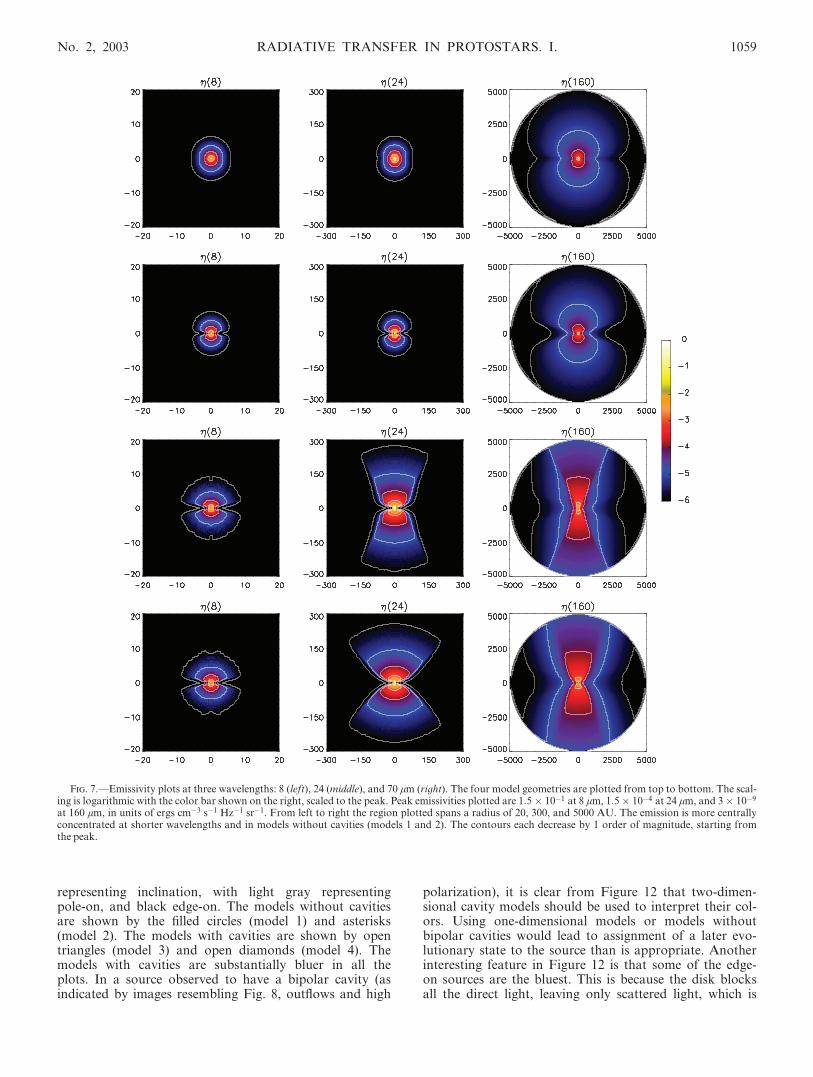
Even though Figures 4 and 5 show that temperatures inthe bipolar cavities are higher than in the envelope, wemight expect the overall emitted energy from the cavities tobe small because of the low densities. However, Figure 7shows that the high temperatures lead to large emissivitiesin the cavity, despite the lower densities. This is especiallyapparent at the longer wavelengths, 24 and 160 lm, shownhere. The emissivity is defined as j� ¼ ���B�. Figure 7 plotsazimuthal slices of the emissivity. It shows howmuch energyper unit volume is emitted throughout the envelope (but isnot a radiative transfer calculation showing how light ispropagated through the envelope). Even though the models
Fig. 2b
1054 WHITNEY ET AL. Vol. 591
with bipolar cavities have slightly lower mass than theothers, their total emissivities are larger because of thehigher temperatures in the cavities. Note that the images areplotted to different size scales for the three wavelengths.
Although the magnitude of the emissivity is much lowerat longer wavelengths, the brightness profile is muchshallower.
Figure 8 shows images that result from the radiation trans-fer calculations. These are shown at an inclination of i ¼ 80�.From top to bottom, the four model geometries are plotted,and from left to right, three-color composites of near-IR(left), mid-IR (middle), and far-infrared (FIR; right) areplotted. The images are displayed to minimum fluxlevels described in the figure caption, assuming a distance tothe source of 140 pc. The near-IR images are similar to obser-vations and previous models (Padgett et al. 1999; D. P. Starket al. 2003, in preparation). The mid-IR images should bedetectable by the upcoming SIRTF in nearby star-formingregions, and the FIR images should be detectable by SIRTFout to much larger distances. As Figure 7 showed, the mid-IR thermal emission should be rather localized near the cen-tral source. The large extent of themid-IR images in Figure 6results from scattered light. As discussed in Figure 1, thealbedo of the RV ¼ 4 grains used here is higher than that ofthe ISM dust at these wavelengths. Since the albedo of thedust is sensitive to grain size, the mid-IR images should be auseful diagnostic of grain size. TheFIR images delineate cav-ity walls and show shadowing in the disk. However, theseeffects will be completely washed out at SIRTF resolution,which, at 70 lm, has a FWHM of 3800or 2380 AU at a dis-tance of 140 pc. We convolved the images with Gaussianpoint-spread functions broadened to the HST and SIRTFresolution for each wavelength. We do not show them here
Fig. 2c
Fig. 3.—Optical extinction, AV, from the central star through theenvelope vs. inclination with respect to the polar axis, cos i. The dotted lineshows extinction due to the envelope, the dashed line is that of the disk, andthe solid line is the sum. Note the large extinctions at edge-on inclinationsfor models with disks (models 2–4).
No. 2, 2003 RADIATIVE TRANSFER IN PROTOSTARS. I. 1055
because the near-IR and mid-IR images are essentiallyunchanged at the resolution shown here, and the FIR imagesare washed out and indistinguishable from each other,although they are elongatedwith about a 2 : 1 ratio.
3.3. Spectral Energy Distributions
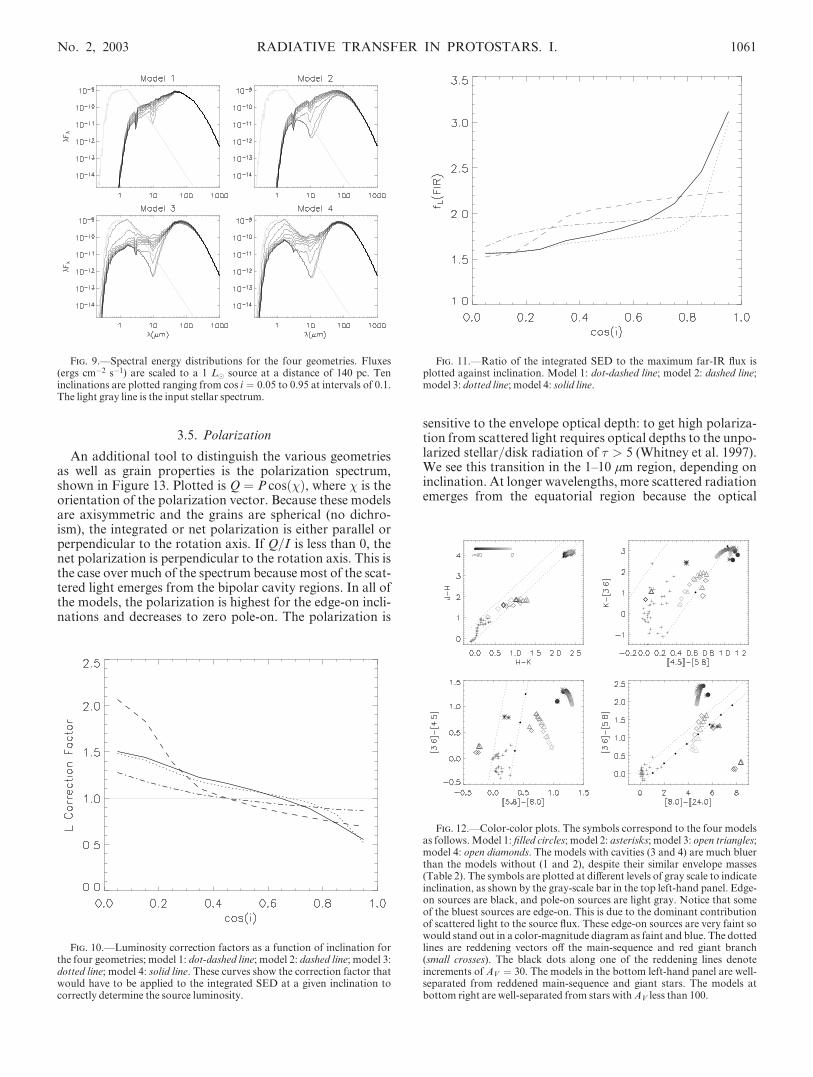
The model SEDs are shown in Figure 9. Ten inclinationsare plotted, the top curve corresponding to pole-on and thebottom to edge-on. The absorption feature at 3.1 lm is dueto ice opacity, and that at 10 lm is due to silicate. A distinc-tive feature of the SED plots is the broad dip at 10 lm at lowinclinations in models that include the flared disk. This isdue to the disk geometry and the grain properties: at shorterwavelengths, even though the opacity through the disk andenvelope is larger (Fig. 3), the albedo increases, allowinglight to scatter out at all inclinations. Note that the near-IRcolors are determined completely by scattering for inclina-tions i > 60� (cos i < 0:5), so the concept of ‘‘ dereddening ’’based on the colors is meaningless since that only applies todirect extincted light, not scattered light (see D. P. Starket al. 2003, in preparation). At wavelengths longward of10 lm, the opacity decreases enough to allow thermal emis-sion to propagate through the disk and envelope. Near 10lm, the low albedo and high opacity combine to preventradiation from escaping at high inclinations.
Another striking feature of the SEDs in Figure 9 is thatthe models with bipolar cavities (models 3 and 4) are muchbrighter at optical/near-IR wavelengths in better agreementwith observations than the models without cavities (Kenyonet al. 1993a, 1993b). Notice in models 3 and 4 that the pole-on inclinations still suffer extinction at short wavelengthsbecause of the dust in the cavity. The shortwave clearly isvery sensitive to the amount of dust in the cavity. Models 3and 4 also show the 10 lm silicate feature in emission atpole-on inclinations, due to low optical depth to the sourceof emission (the inner disk surface).
It is clear from the plots in Figure 9 that the more edge-onspectra have lower integrated fluxes than other inclinations.In a spherical source, the integral of the measured SEDmul-tiplied by 4�d2, where d is the distance to the source, is equalto the luminosity of the source. However, this is not true forsources with nonspherical envelopes, where the SED mustbe integrated over direction as well as frequency, i.e.,
L ¼ 2�d2
Z 1
l¼�1
Z 1
�¼0
F� d� dl ; ð7Þ
where l ¼ cos i and i is the inclination and also the polarangle. We note that in our models, this integral is equal toour input luminosity to within 0.02% (the difference is dueto performing the integral after coarsely binning the results
Fig. 4a
Fig. 4.—Temperature plots for the four geometries. Images are scaled logarithmically with the color scale shown at the right. The contours correspond tothe labeled values on the color bar [in units of logðTÞ]. The plotted regions and temperature scales are (a) 5000 AU and T ¼ 8 300 K, (b) 300 AU,T ¼ 22 1000K, and (c) 20 AU,T ¼ 42 1600K.
1056 WHITNEY ET AL. Vol. 591
in angle, since flux is fully conserved in our models).Figure 10 shows the correction factor that would have to beapplied to the integrated SED at a single inclination to getthe true luminosity of the source. The correction factor issimply the luminosity divided by the integrated SED at eachinclination i,
correction ¼1=2
Rþ1
�1
R� F� d� dlR
� F�ðiÞd�: ð8Þ
As Figure 10 shows, the observed SEDs can estimate theluminosity of a source only to within a factor of 2. While itis not surprising that the edge-on integrated flux is lowerthan the true luminosity, it is interesting to note that thepole-on integrated flux is a factor of 2 larger than the trueluminosity for the sources with bipolar cavities. This incli-nation receives a maximum of direct stellar flux, scatteredflux, and reprocessed emission.
Nakazato et al. (2003) defined a parameter, fL, as the ratioof the integrated SED,
RF�d� to the peak flux �F�, and
argued that this can be used as an indicator of inclination.We had to modify their definition slightly because for ourmodels with cavities the wavelength of the peak shifts fromabout 70 lm to 1.6 lm at the pole-on inclinations, causingfL to decrease for pole-on inclinations. We can resolve thisby defining fL(FIR) to be the ratio of the SED to the peakflux in the far-infrared (FIR). Figure 11 plots fL(FIR) versusinclination for our set of models. Our models also show a
correlation with inclination, but the behavior is differentfrom the values of Nakazato et al.. This is due to the differ-ences in our model geometries. Nakazato et al. include anenvelope, disk, and cavity in their models, but their envelopeis spherically symmetric up to the cavity opening angle.Thus, their fL is relatively flat up to the cavity opening angleand then flat within the cavity at a high value. In contrast,our models using a rotationally flattened envelope show amore gradual increase in fL(FIR) as the inclination becomesmore pole-on (increasing cos i), due to varying envelopeextinction with polar angle, a different cavity shape, and adifferent assumption for the dust content in the cavity. Thus,the behavior of fL with inclination depends strongly onmodel assumptions. Nakazato et al. claim that thisparameter fL can determine inclination to �5� and use asan example IRAS 04365+2535, for which they find an incli-nation of 20�. However, the high near-IR polarization(PK � 10% 15%) (Whitney et al. 1997; Lucas & Roche1998) and molecular outflow observations (Chandler et al.1996) suggest inclinations of i � 40� 70�. We suggest thatmore detailed modeling, including as much observationalinformation as possible, is required to ‘‘ calibrate ’’ the mod-els before applying this factor based on SED informationalone.
3.4. Color-Color Plots
Figure 12 shows color-color plots for our models. Theblack crosses are main-sequence/giant branch stars, and
Fig. 4b
No. 2, 2003 RADIATIVE TRANSFER IN PROTOSTARS. I. 1057
the dotted lines extending from them show the reddeninglines. The region enclosed by these lines shows where themain-sequence/giant branch falls on these plots. Themodel points are plotted with different shades of gray
Fig. 4c
Fig. 5.—Temperature as a function of radius along four colatitudes, h,with respect to the polar axis: � ¼ 0� (dot-dashed line), � ¼ 30� (dashed line),� ¼ 60� (dotted line), and � ¼ 90� (solid line). The light gray line is a powerlaw,T ¼ 180ðr=1 AUÞ�0:33 K.
Fig. 6.—Temperature as a function of radius in the midplane of selectedmodels with disks. Eachmodel below the top is scaled down by a factor of 4from the one above. The gray line is a power law, T ¼ 90ðr=1 AUÞ�0:4 K,also scaled down by a factor of 4 for each model. Notice that the diskmidplane is warmer throughout the model 2 disk because of radiation fromthe surrounding envelope.
1058 WHITNEY ET AL. Vol. 591
representing inclination, with light gray representingpole-on, and black edge-on. The models without cavitiesare shown by the filled circles (model 1) and asterisks(model 2). The models with cavities are shown by opentriangles (model 3) and open diamonds (model 4). Themodels with cavities are substantially bluer in all theplots. In a source observed to have a bipolar cavity (asindicated by images resembling Fig. 8, outflows and high
polarization), it is clear from Figure 12 that two-dimen-sional cavity models should be used to interpret their col-ors. Using one-dimensional models or models withoutbipolar cavities would lead to assignment of a later evo-lutionary state to the source than is appropriate. Anotherinteresting feature in Figure 12 is that some of the edge-on sources are the bluest. This is because the disk blocksall the direct light, leaving only scattered light, which is
Fig. 7.—Emissivity plots at three wavelengths: 8 (left), 24 (middle), and 70 lm (right). The four model geometries are plotted from top to bottom. The scal-ing is logarithmic with the color bar shown on the right, scaled to the peak. Peak emissivities plotted are 1:5� 10�1 at 8 lm, 1:5� 10�4 at 24 lm, and 3� 10�9
at 160 lm, in units of ergs cm�3 s�1 Hz�1 sr�1. From left to right the region plotted spans a radius of 20, 300, and 5000 AU. The emission is more centrallyconcentrated at shorter wavelengths and in models without cavities (models 1 and 2). The contours each decrease by 1 order of magnitude, starting fromthe peak.
No. 2, 2003 RADIATIVE TRANSFER IN PROTOSTARS. I. 1059
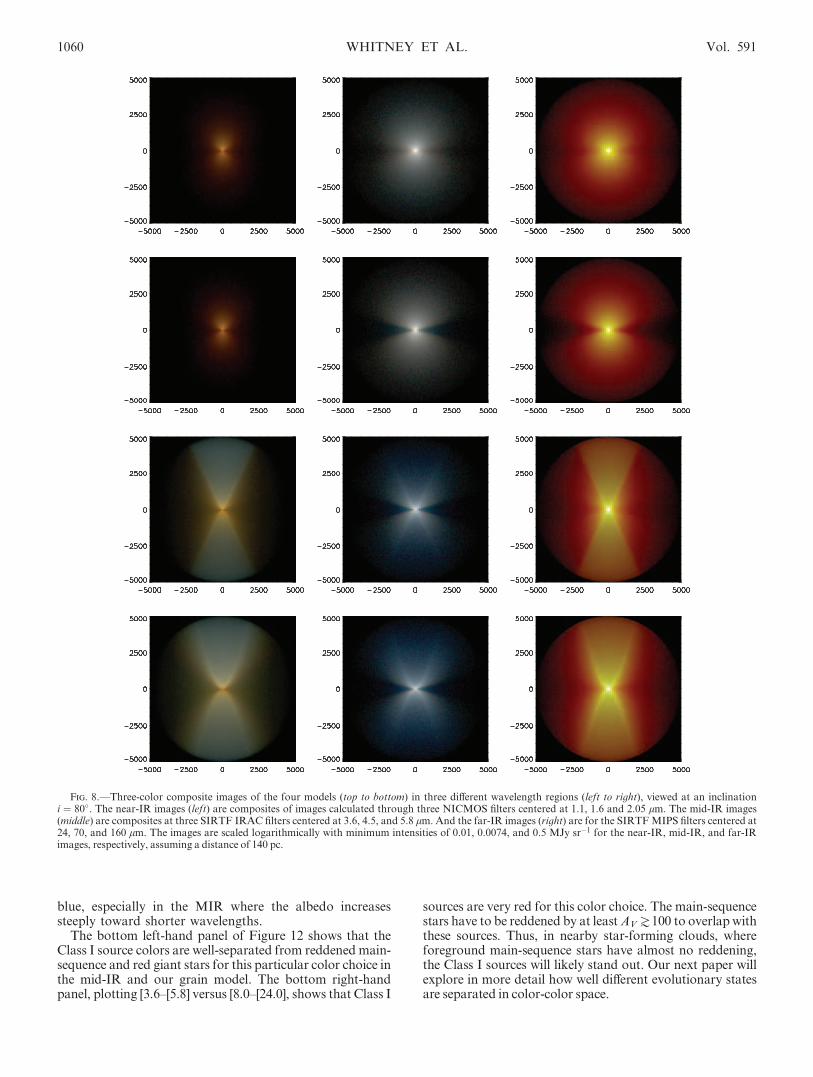
blue, especially in the MIR where the albedo increasessteeply toward shorter wavelengths.
The bottom left-hand panel of Figure 12 shows that theClass I source colors are well-separated from reddened main-sequence and red giant stars for this particular color choice inthe mid-IR and our grain model. The bottom right-handpanel, plotting [3.6–[5.8] versus [8.0–[24.0], shows that Class I
sources are very red for this color choice. The main-sequencestars have to be reddened by at leastAVe100 to overlap withthese sources. Thus, in nearby star-forming clouds, whereforeground main-sequence stars have almost no reddening,the Class I sources will likely stand out. Our next paper willexplore in more detail how well different evolutionary statesare separated in color-color space.
Fig. 8.—Three-color composite images of the four models (top to bottom) in three different wavelength regions (left to right), viewed at an inclinationi ¼ 80�. The near-IR images (left) are composites of images calculated through three NICMOS filters centered at 1.1, 1.6 and 2.05 lm. The mid-IR images(middle) are composites at three SIRTF IRAC filters centered at 3.6, 4.5, and 5.8 lm. And the far-IR images (right) are for the SIRTFMIPS filters centered at24, 70, and 160 lm. The images are scaled logarithmically with minimum intensities of 0.01, 0.0074, and 0.5 MJy sr�1 for the near-IR, mid-IR, and far-IRimages, respectively, assuming a distance of 140 pc.
1060 WHITNEY ET AL. Vol. 591
3.5. Polarization
An additional tool to distinguish the various geometriesas well as grain properties is the polarization spectrum,shown in Figure 13. Plotted is Q ¼ P cosðÞ, where is theorientation of the polarization vector. Because these modelsare axisymmetric and the grains are spherical (no dichro-ism), the integrated or net polarization is either parallel orperpendicular to the rotation axis. If Q=I is less than 0, thenet polarization is perpendicular to the rotation axis. This isthe case over much of the spectrum because most of the scat-tered light emerges from the bipolar cavity regions. In all ofthe models, the polarization is highest for the edge-on incli-nations and decreases to zero pole-on. The polarization is
sensitive to the envelope optical depth: to get high polariza-tion from scattered light requires optical depths to the unpo-larized stellar/disk radiation of � > 5 (Whitney et al. 1997).We see this transition in the 1–10 lm region, depending oninclination. At longer wavelengths, more scattered radiationemerges from the equatorial region because the optical
Fig. 9.—Spectral energy distributions for the four geometries. Fluxes(ergs cm�2 s�1) are scaled to a 1 L� source at a distance of 140 pc. Teninclinations are plotted ranging from cos i ¼ 0:05 to 0.95 at intervals of 0.1.The light gray line is the input stellar spectrum.
Fig. 10.—Luminosity correction factors as a function of inclination forthe four geometries; model 1: dot-dashed line; model 2: dashed line; model 3:dotted line; model 4: solid line. These curves show the correction factor thatwould have to be applied to the integrated SED at a given inclination tocorrectly determine the source luminosity.
Fig. 11.—Ratio of the integrated SED to the maximum far-IR flux isplotted against inclination. Model 1: dot-dashed line; model 2: dashed line;model 3: dotted line; model 4: solid line.
Fig. 12.—Color-color plots. The symbols correspond to the four modelsas follows.Model 1: filled circles; model 2: asterisks; model 3: open triangles;model 4: open diamonds. The models with cavities (3 and 4) are much bluerthan the models without (1 and 2), despite their similar envelope masses(Table 2). The symbols are plotted at different levels of gray scale to indicateinclination, as shown by the gray-scale bar in the top left-hand panel. Edge-on sources are black, and pole-on sources are light gray. Notice that someof the bluest sources are edge-on. This is due to the dominant contributionof scattered light to the source flux. These edge-on sources are very faint sowould stand out in a color-magnitude diagram as faint and blue. The dottedlines are reddening vectors off the main-sequence and red giant branch(small crosses). The black dots along one of the reddening lines denoteincrements of AV ¼ 30. The models in the bottom left-hand panel are well-separated from reddened main-sequence and giant stars. The models atbottom right are well-separated from stars withAV less than 100.
No. 2, 2003 RADIATIVE TRANSFER IN PROTOSTARS. I. 1061
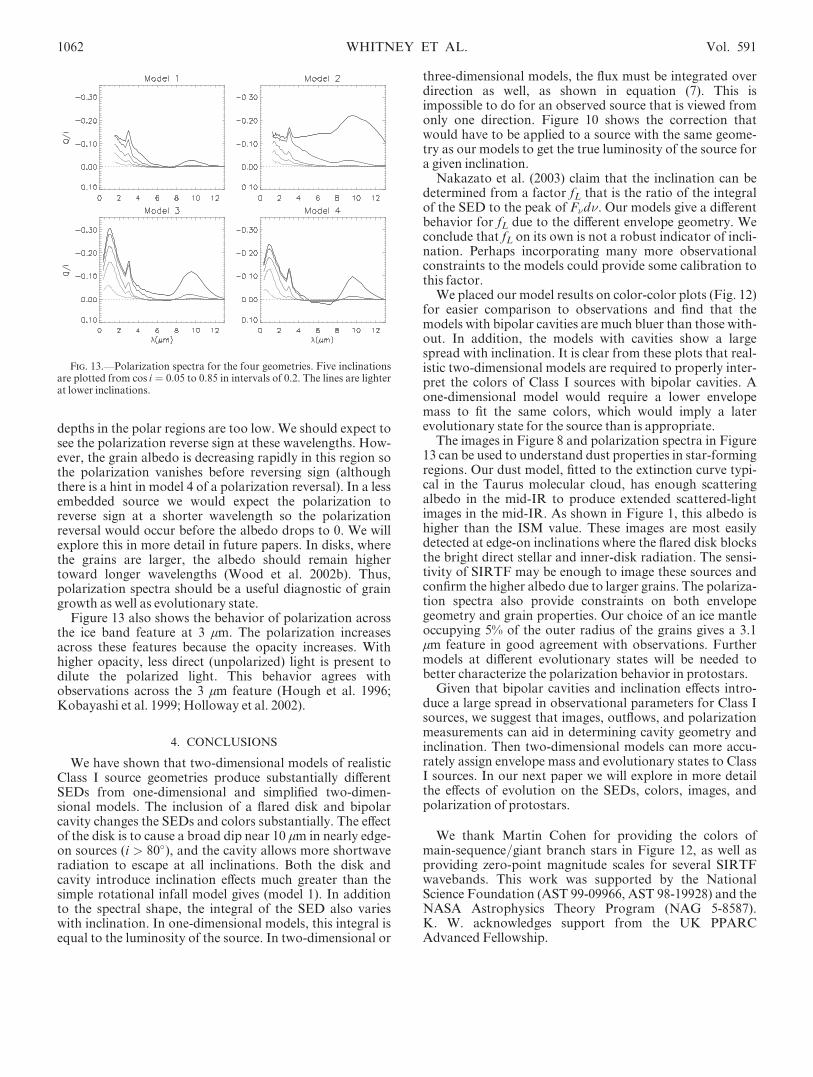
depths in the polar regions are too low. We should expect tosee the polarization reverse sign at these wavelengths. How-ever, the grain albedo is decreasing rapidly in this region sothe polarization vanishes before reversing sign (althoughthere is a hint in model 4 of a polarization reversal). In a lessembedded source we would expect the polarization toreverse sign at a shorter wavelength so the polarizationreversal would occur before the albedo drops to 0. We willexplore this in more detail in future papers. In disks, wherethe grains are larger, the albedo should remain highertoward longer wavelengths (Wood et al. 2002b). Thus,polarization spectra should be a useful diagnostic of graingrowth as well as evolutionary state.
Figure 13 also shows the behavior of polarization acrossthe ice band feature at 3 lm. The polarization increasesacross these features because the opacity increases. Withhigher opacity, less direct (unpolarized) light is present todilute the polarized light. This behavior agrees withobservations across the 3 lm feature (Hough et al. 1996;Kobayashi et al. 1999; Holloway et al. 2002).
4. CONCLUSIONS
We have shown that two-dimensional models of realisticClass I source geometries produce substantially differentSEDs from one-dimensional and simplified two-dimen-sional models. The inclusion of a flared disk and bipolarcavity changes the SEDs and colors substantially. The effectof the disk is to cause a broad dip near 10 lm in nearly edge-on sources (i > 80�), and the cavity allows more shortwaveradiation to escape at all inclinations. Both the disk andcavity introduce inclination effects much greater than thesimple rotational infall model gives (model 1). In additionto the spectral shape, the integral of the SED also varieswith inclination. In one-dimensional models, this integral isequal to the luminosity of the source. In two-dimensional or
three-dimensional models, the flux must be integrated overdirection as well, as shown in equation (7). This isimpossible to do for an observed source that is viewed fromonly one direction. Figure 10 shows the correction thatwould have to be applied to a source with the same geome-try as our models to get the true luminosity of the source fora given inclination.
Nakazato et al. (2003) claim that the inclination can bedetermined from a factor fL that is the ratio of the integralof the SED to the peak of F�d�. Our models give a differentbehavior for fL due to the different envelope geometry. Weconclude that fL on its own is not a robust indicator of incli-nation. Perhaps incorporating many more observationalconstraints to the models could provide some calibration tothis factor.
We placed our model results on color-color plots (Fig. 12)for easier comparison to observations and find that themodels with bipolar cavities are much bluer than those with-out. In addition, the models with cavities show a largespread with inclination. It is clear from these plots that real-istic two-dimensional models are required to properly inter-pret the colors of Class I sources with bipolar cavities. Aone-dimensional model would require a lower envelopemass to fit the same colors, which would imply a laterevolutionary state for the source than is appropriate.
The images in Figure 8 and polarization spectra in Figure13 can be used to understand dust properties in star-formingregions. Our dust model, fitted to the extinction curve typi-cal in the Taurus molecular cloud, has enough scatteringalbedo in the mid-IR to produce extended scattered-lightimages in the mid-IR. As shown in Figure 1, this albedo ishigher than the ISM value. These images are most easilydetected at edge-on inclinations where the flared disk blocksthe bright direct stellar and inner-disk radiation. The sensi-tivity of SIRTF may be enough to image these sources andconfirm the higher albedo due to larger grains. The polariza-tion spectra also provide constraints on both envelopegeometry and grain properties. Our choice of an ice mantleoccupying 5% of the outer radius of the grains gives a 3.1lm feature in good agreement with observations. Furthermodels at different evolutionary states will be needed tobetter characterize the polarization behavior in protostars.
Given that bipolar cavities and inclination effects intro-duce a large spread in observational parameters for Class Isources, we suggest that images, outflows, and polarizationmeasurements can aid in determining cavity geometry andinclination. Then two-dimensional models can more accu-rately assign envelope mass and evolutionary states to ClassI sources. In our next paper we will explore in more detailthe effects of evolution on the SEDs, colors, images, andpolarization of protostars.
We thank Martin Cohen for providing the colors ofmain-sequence/giant branch stars in Figure 12, as well asproviding zero-point magnitude scales for several SIRTFwavebands. This work was supported by the NationalScience Foundation (AST 99-09966, AST 98-19928) and theNASA Astrophysics Theory Program (NAG 5-8587).K. W. acknowledges support from the UK PPARCAdvanced Fellowship.
Fig. 13.—Polarization spectra for the four geometries. Five inclinationsare plotted from cos i ¼ 0:05 to 0.85 in intervals of 0.2. The lines are lighterat lower inclinations.
1062 WHITNEY ET AL. Vol. 591

REFERENCES
Adams, F. C., Lada, C. J., & Shu, F. H. 1987, ApJ, 312, 788Alexander, D. R., Johnson, H. R., & Rypma, R. L. 1983, ApJ, 272,773
Andre, P., Ward-Thompson, D., & Barsony,M. 1993, ApJ, 406, 122Bachiller, R. & Tafalla, M. 1999, in The Origin of Stars and PlanetarySystems, ed. C. J. Lada &N. D. Kylafis (Dordrecht: Kluwer), 227
Bate,M. R. 1998, ApJ, 508, L95Beckwith, S. V. W., Henning, T., & Nakagawa, Y. 2000, in Protostars andPlanets IV, ed. V. Mannings, A. P. Boss, & S. R. Russell (Tucson: Univ.Arizona Press), 533
Beckwith, S. V. W., Sargent, A. I., Chini, R. S., & Gusten, R. 1990, AJ, 99,924
Bjorkman, J. E. 1997, in Stellar Atmospheres: Theory and Observations,ed. J. P. De Greve, R. Blomme, & H. Hensberge (New York: Springer),239
Bjorkman, J. E., Whitney, B. A., &Wood, K. 2003, BAAS, 203, 4910Bjorkman, J. E., &Wood, K. 2001, ApJ, 554, 615Burrows, C. J., et al. 1996, ApJ, 473, 437Cardelli, J. A., Clayton, G. C., &Mathis, J. S. 1989, ApJ, 345, 245Cassen, P., &Moosman, A. 1981, Icarus, 48, 353Chandler, C. J., Terebey, S., Barsony,M.,Moore, T. J. T., &Gautier, T. N.1996, ApJ, 471, 308
Ciolek, G. E., &Konigl, A. 1998, ApJ, 504, 257Cohen,M., Emerson, J. P., & Beichman, C. A. 1989, ApJ, 339, 455D’Alessio, P., Calvet, N., &Hartmann, L. 1997, ApJ, 474, 397———. 2001, ApJ, 553, 321D’Alessio, P., Canto, J., Calvet, N., & Lizano, S. 1998, ApJ, 500, 411Dutrey, A., Guilloteau, S., & Simon,M. 1994, A&A, 286, 149Efstathiou, A., &Rowan-Robinson,M. 1991,MNRAS, 252, 528Foster, P., & Chevalier, R. A. 1993, ApJ, 416, 303Galli, D., & Shu, F. H. 1993a, ApJ, 417, 220———. 1993b, ApJ, 417, 243Gomez,M.,Whitney, B. A., &Kenyon, S. J. 1997, AJ, 114, 265Hartmann, L. 1998, Accretion Processes in Star Formation (Cambridge:Cambridge Univ. Press)
Hogerheijde, M. R., van Dishoeck, E. F., Blake, G. A., & van Langevelde,H. J. 1998, ApJ, 502, 315
Holloway, R. P., Chrysostomou, A., Aitken, D. K., Hough, J. H., &McCall, A. 2002,MNRAS, 336, 425
Hough, J. H., Chrysostomou, A., Messinger, D. W., Whittet, D. C. B.,Aitken, D. K., &Roche, P. F. 1996, ApJ, 461, 902
Ivezic, Z., Groenewegen,M. A. T., Men’shchikov, A., & Szczerba, R. 1997,MNRAS, 291, 121
Kenyon, S. J., Calvet, N., &Hartmann, L. 1993a, ApJ, 414, 676Kenyon, S. J., & Hartmann, L. 1987, ApJ, 323, 714Kenyon, S. J., Whitney, B., Gomez, M., & Hartmann, L. 1993b, ApJ, 414,773
Kim, S.-H.,Martin, P. G., &Hendry, P. D. 1994, ApJ, 422, 164Kobayashi, N., Nagata, T., Tamura, M., Takeuchi, T., Takami, H.,Kobayashi, Y., & Sato, S. 1999, ApJ, 517, 256
Koerner, D.W., & Sargent, A. I. 1995, AJ, 109, 2138
Kurucz, R. L. 1994, CD-ROM 19, Solar Model Abundance Model Atmos-pheres 1, 2, 4, 8 km/s (Cambridge: SAO)
Lada, C. J. 1987, in Star-Forming Regions, ed. M. Peimbert & J. Jugaka(Dordrecht: Kluwer), 1
Lada, C. J., & Adams, F. C. 1992, ApJ, 393, 278Laor, A., &Draine, B. T. 1993, ApJ, 402, 441Li, Z.-Y. 1998, ApJ, 497, 850Lynden-Bell, D., & Pringle, J. E. 1974,MNRAS, 168, 603Lucas, P.W., &Roche, P. F. 1997,MNRAS, 286, 895———. 1998,MNRAS, 299, 699Moriarty-Schieven, G. H., Butner, H. H., & Wannier, P. G. 1995a, ApJ,445, L55
Moriarty-Schieven, G. H., Wannier, P. G., Mangum, J. G., Tamura, M., &Olmsted, V. K. 1995b, ApJ, 455, 190
Moriarty-Schieven, G. H., Wannier, P. G., Tamura, M., & Keene, J. 1992,ApJ, 400, 260
Myers, P. C., Fuller, G. A., Mathieu, R. D., Beichman, C. A., Benson, P. J.,Schild, R. E., & Emerson, J. P. 1987, ApJ, 319, 340
Nakazato, T., Nakamoto, T., &Umemura,M. 2003, ApJ, 583, 322Padgett, D. L., Brandner, W., Stapelfeldt, K. R., Strom, S. E., Terebey, S.,&Koerner, D. 1999, AJ, 117, 1490
Pringle, J. E. 1981, ARA&A, 19, 137Reipurth, B., & Raga, A. C. 1999, in The Origin of Stars and PlanetarySystems, ed. C. J. Lada &N.D. Kylafis (Dordrecht: Kluwer), 267
Reipurth, B., Yu, K. C., Heathcote, S., Bally, J., & Rodrıguez, L. F. 2000,AJ, 120, 1449
Saito, M., Kawabe, R., Ishiguro, M., Miyama, S. M., & Hayashi, M. 1995,ApJ, 453, 384
Shakura, N. I., & Sunyaev, R. A. 1973, A&A, 24, 337Strom, K.M., Newton, G., & Strom, S. E. 1989, ApJS, 71, 183Tamura, M., Ohashi, N., Naomi, H., Itoh, Y., &Moriarty-Schieven, G. H.1996, AJ, 112, 2076
Terebey, S., Shu, F. H., & Cassen, P. 1984, ApJ, 286, 529Ulrich, R. K. 1976, ApJ, 210, 377Warren, S. G. 1984, Appl. Opt., 23, 1206Weidenschilling, S. J., & Cuzzi, J. N., 1993, ed. V. Mannings, A. P. Boss, &S. R. Russell (Tucson: Univ. Arizona Press), 1031
Wetherill, G.W., & Steward, G. R. 1993, Icarus, 106, 190White, R. L. 1979, ApJ, 229, 954Whitney, B. A., &Hartmann, L. 1993, ApJ, 402, 605Whitney, B. A., Kenyon, S. J., &Gomez,M. 1997, ApJ, 485, 703Whitney, B. A., &Wolff,M. J. 2002, ApJ, 574, 205Whittet, D. C. B., Gerakines, P. A., Hough, J. H., & Shenoy, S. S. 2001,ApJ, 547, 872
Wood, K., Lada, C. J., Bjorkman, J. E., Kenyon, S. J., Whitney, B., &Wolff,M. J. 2002a, ApJ, 567, 1183
Wood, K., &Reynolds, R. J. 1999, ApJ, 525, 799Wood, K., Wolff, M. J., Bjorkman, J. E., & Whitney, B. 2002b, ApJ, 564,887
Yusef-Zadeh, F.,Morris,M., &White, R. L. 1984, ApJ, 278, 186
No. 2, 2003 RADIATIVE TRANSFER IN PROTOSTARS. I. 1063