turnover in u. s. agricultural labor marketsare.berkeley.edu/~jperloff/pdf/turnover.pdf · turnover...
TRANSCRIPT
forthcoming: American Journal of Agricultural Economics
Turnover in U. S. Agricultural Labor Markets
Lien H. TranJeffrey M. Perloff
Lien Tran is Economist, Federal Trade Commission and Jeffrey Perloff is Professor, Depart-ment of Agricultural and Resource Economics, University of California, Berkeley, andmember of the Giannini Foundation. This paper is based, in part, on Tran’s doctoraldissertation. We are very grateful to Susan Gabbard for her extensive advice concerningprogramming and the nature of our data set. We thank Daniel Carroll of the Office of theAssistant Secretary for Policy, U.S. Department of Labor for permission to use the NAWSdata. We appreciate the constructive comments of an anonymous referee and Robert J.Myers. The views expressed in this paper are those of the authors’ and do not necessarilyreflect the views or policies of the U.S. Department of Labor. We are grateful to theGiannini Foundation and the Institute of Industrial Relations for supporting this research. Weused SAS, Bill Greene’s Limdep, and Ken White’s Shazam.
Turnover in U. S. Agricultural Labor Markets
Lien H. TranJeffrey M. Perloff
key words: farm labor, immigration, IRCA, legal status, Markov, migration
Agricultural workers move in and out of agriculture frequently. Migration betweentypes of jobs takes relatively little time. Female workers tend to stay out of the U.S. labormarket longer once they stop being employed and their access to jobs outside of agriculture ismore limited than that of their male counterparts. Predictions made when the 1986 Immigra-tion Reform and Control Act was passed that granting people amnesty would induce most ofthem to leave agriculture were incorrect.
Knowledge about labor migration patterns is important for policy analysis. For
example in January 2001, Senator Phil Gramm proposed legislation granting amnesty to some
seasonal agricultural workers who entered the country illegally and allowing additional guest
workers to enter the country (who could replace legalized workers if they leave agriculture).1
The debate on this and similar legislation is reminiscent of the heated discussions that
immediately preceded and followed passage of the Immigration Reform and Control Act
(IRCA) of 1986. IRCA granted amnesty to a substantial fraction of undocumented agricultur-
al workers in the United States, entitling them to remain and work legally in this country
under the Special Agricultural Worker (SAW) and Legally Authorized Worker (LAW)
programs.2 Based on beliefs about differences in labor migration patterns of legal and
undocumented workers, various groups forecasted that passage of IRCA would have dire
consequences for farmers and state governments.
Immediately before passage of IRCA, growers and several members of Congress
predicted that undocumented agricultural workers who received amnesty would likely leave
agriculture, thereby leading to a labor "shortage." Other groups claimed that workers who
received amnesty would join the ranks of the unemployed and strain local welfare systems.
The group predicting shortages was particularly vocal. Various industry experts were
quoted as concluding that (Washington Post)
The newly legalized aliens will suddenly find themselves with new options. Instead ofremaining in low-profile jobs to evade the Immigration and Naturalization Service,they are expected to compete for better jobs (in Silicon Valley, in construction, and invarious service industries).
2
Growers, then-Senator Peter Wilson of California, and other politicians claimed that such
migrations would result in agricultural labor shortages that "would leave weather-sensitive
crops rotting on the ground and cripple the $23-billion perishable produce industry."3
Growers successfully lobbied Congress so that the final version of IRCA allowed for guest
workers if "shortages" were observed.4
Immediately after passage of the law (but before officials knew how many workers
would apply for amnesty), growers contended that IRCA had caused a crisis. Libby Whitley,
executive vice president of the National Council of Agricultural Employers, stated that, be-
cause newly legal aliens would look for nonfarm jobs and that there would be "a sharp drop
in the hiring of illegal aliens," a very significant shortfall would occur "sooner rather than
later" (New York Times). A number of industry experts blamed passage of IRCA (Journal of
Commerce)
for the worst labor shortage in 25 years at the northern end of the West’s farm workertrail... Workers are needed to help harvests in Washington, Oregon and Idaho and tohelp irrigation in Montana, state officials said. Officials in Georgia report a shortage ofsome 1,000 workers... In Oregon, crop losses could exceed $300 million unless moreworkers are found soon. Gov. Neil Goldschmidt has formed a task force to study waysto ease the worker shortage, which has resulted in the loss of about one-third of thestate’s strawberry crop. Washington’s Gov. Booth Gardner has asked National Guardand prison officials to consider allowing troops and inmates to work in fields. And inIdaho, Gov. Cecil Andrus said he is prepared to provide "a large number" of inmatesalready authorized to work outside prison walls.
Overall, "The California Farm Bureau reported... that the supply of seasonal farmhands was
25 percent to 30 percent below the demand" (New York Times). (The Departments of
Agriculture and Labor later determined that no shortage existed so that no guest workers had
to be admitted under IRCA.)
3
While growers worried about worker shortages, other groups expressed concern that
some workers would shift from agriculture to unemployment, imposing substantial costs on
taxpayers (Washington Post):
The United States will undergo profound changes -- ranging from population andindustry shifts to serious financial burdens on local governments with high immigrantpopulations -- in coming years as the new immigration law gradually takes effect,according to specialists on immigration and population issues... All the specialistsagree that most of the illegal alien population is concentrated in small areas of thecountry and that local governments in those areas will face staggering financialproblems that may not have been anticipated. ... While the law prohibits the newlylegalized aliens from collecting federal welfare for five years, there is nothing to makethem ineligible for local assistance programs...
For the predicted labor shortages and welfare crises to occur, several assumptions
would have had to hold. A critical one was that workers who received amnesty would be
more likely to flee agriculture than would undocumented workers. To estimate the probabili-
ties of such flows between job-status categories, an economist needs to know the employment
histories and legal status of agricultural workers. This information was unavailable prior to
the U.S. Department of Labor’s National Agricultural Worker’s Survey (NAWS), which was
mandated by IRCA. Using the NAWS data, we estimate a Markovian model of "migration"
between agriculture, nonagricultural work, and unemployment.
In our model, rates of migration are conditional on legal status and demographic
characteristics. We use four legal status categories: U.S. citizens, individuals granted amnesty
under IRCA ("amnesty"), permanent residents ("green card" holders), and those who are unau-
thorized to work in this country ("undocumented"). We use our estimates to analyze the
speed of adjustment for each of these groups.
4
We start by presenting a Markovian model of employment turnover in the first section.
In the second section, we describe the data and present summary statistics. In the third
section, we discuss our empirical results. We draw conclusions in the last section.
The Model
We estimate a stationary, first-order Markov model of employment turnover (Boskin and
Nold and Amemiya). At time t, yij(t) = 1 if individual i is engaged in activity j (= 0, 1, 2)
and zero otherwise. The three activities are (1) working in U.S. agriculture, (2) working in a
nonagricultural job, or (3) unemployed or abroad. During periods of low demand in agricul-
ture, unemployed agricultural workers may stay in the United States looking for work
("unemployed") or return to home (for example, to Mexico), possibly for a brief visit.
The first-order Markovian model is a generalization of the qualitative response model
because yij(t) is a function of y i
k(t-1), where k = 0, 1, 2 indexes an individual’s status in the
previous period, as well as exogenous variables. This model is completely characterized by
the transition probability, P ikj(t) ≥ 0, that individual i is in activity j in time period t given that
person engaged in activity k in time period t - 1, and the distribution of yij(0), the initial
conditions. Because the model is assumed to be stationary, the transitional relationship
between any two activity states is constant over our sample period: P ikj(t) = P i
kj, which is
independent of t.
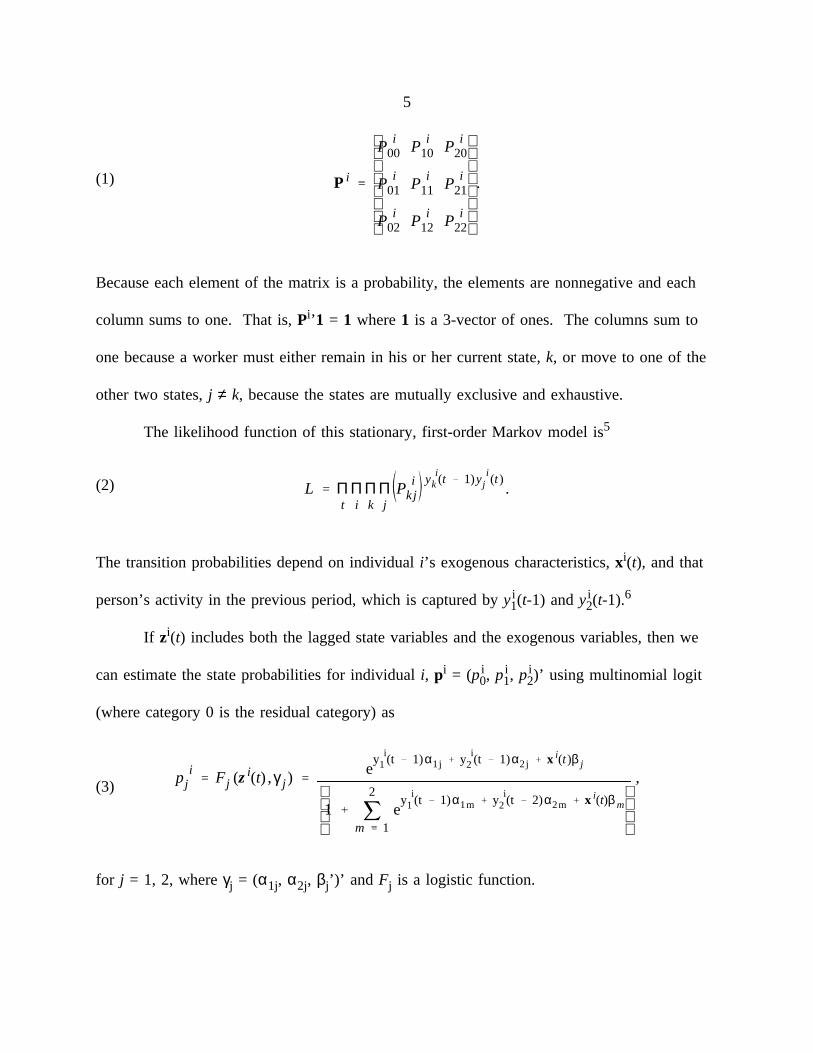
We summarize this information about transitional probabilities in the 3 × 3 Markov
matrix, Pi = {P ikj}:
5
(1) P i
Pi
00 Pi
10 Pi
20
Pi
01 Pi
11 Pi
21
Pi
02 Pi
12 Pi
22
.
Because each element of the matrix is a probability, the elements are nonnegative and each
column sums to one. That is, Pi’1 = 1 where 1 is a 3-vector of ones. The columns sum to
one because a worker must either remain in his or her current state, k, or move to one of the
other two states, j ≠ k, because the states are mutually exclusive and exhaustive.
The likelihood function of this stationary, first-order Markov model is5
(2) L Πt
Πi
Πk
Πj
Pi
k jy
ik (t 1)y
ij (t )
.
The transition probabilities depend on individual i’s exogenous characteristics, xi(t), and that
person’s activity in the previous period, which is captured by y i1(t-1) and y i
2(t-1).6
If zi(t) includes both the lagged state variables and the exogenous variables, then we
can estimate the state probabilities for individual i, pi = (p i0, p i
1, p i2)’ using multinomial logit
(where category 0 is the residual category) as
(3)p
ij Fj (z i(t) ,γj )
ey i
1 (t 1)α1j y i2 (t 1)α2j x i(t )β j
12
m 1e
y i1 (t 1)α1m y i
2 (t 2)α2m x i(t)β m
,
for j = 1, 2, where γj = (α1j, α2j, βj’)’ and Fj is a logistic function.
6
The probability that a worker is in activity j at time t, pij(t), is the sum of the proba-
bilities of being in each possible activity in the previous period, p ik(t - 1) for k = 0, 1, 2,
weighted by the appropriate transition probabilities:
pij(t) = P i
0j p i0(t - 1) + P i
1j p i1(t - 1) + P i
2j p i2(t - 1).
We can rewrite this expression in matrix form as
(4) pi(t) = Pipi(t - 1),
where pi(t) ≡ (p i0(t), p i
1(t), p i2(t))’.
Once we estimate the transitional probabilities P, we can determine both the steady
state and the adjustment path. We now consider a specific individual and drop the superscript
i for notational simplicity. The stationarity assumption guarantees (Amemiya) that
(5) p(t) = Pp(t - 1).
By substituting repeatedly using equation (5), we obtain
(6) p(t) = Ptp(0).
If limt→∞ Pt exists, then
(7) p i(∞) 1 (P i )∞ ,
where p(∞) is the vector of the equilibrium probabilities in the time limit (Amemiya).
Because the rank of I - P is 2, the solution is unique. After estimating the transition matrix,
we calculate the steady-state matrices for various legal and demographic groups using
equation 7.
7
The Data Set
The National Agricultural Workers’ Survey (NAWS) is a national, random sample of seasonal
agricultural service (SAS) workers conducted three times a year in January, April and May,
and October.7 Most field workers in perishable crops, including field tasks in fruit and
vegetables, nursery crops, field crops, and cash grains are SAS workers.
The NAWS uses site-area sampling to obtain a national representative cross-section.
First, 73 counties in 25 states from 12 distinct agricultural regions were selected. For each
interviewing cycle, interviews are conducted in a subsample of 30 randomly selected counties
using weights based on the size of the seasonal agricultural payroll in each county. The
number of interviews within a cycle is in proportion to the amount of SAS activity at that
time of year (Mines, Gabbard, and Boccalandro). Approximately nine out of ten subjects
agree to be interviewed.
The survey reports each individual’s activity over approximately a two-year period
preceding the date of the interview.8 Thus, we know the duration of each spell of employ-
ment, unemployment, or time outside the country for the survey’s historical period.
We determine an individual’s employment state — employed in agriculture, not
employed in this country (unemployed or out of the country), or employed in a nonagricultur-
al job — at monthly intervals. We choose this short time interval because many farm jobs
are of brief duration; some jobs would be missed were we to use a longer interval. As survey
respondents were chosen based on their farm activity, we do not include their activities at the
time of the interview to avoid sample selection bias.
8
We use a sample of 1,583 workers, which is a 20 percent random subsample of the
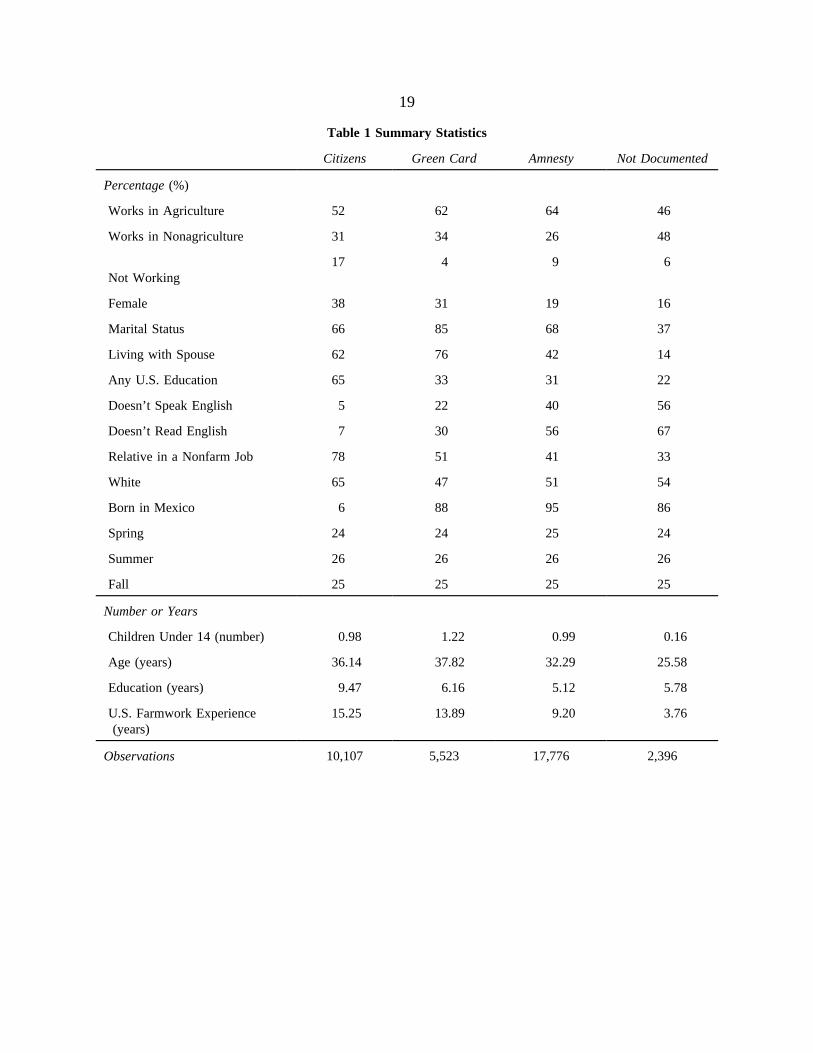
population of workers in the survey for the years 1987-1991. Table 1 shows the means and
standard deviations of these variables by legal status. Legal status, race, and ethnicity are all
self-reported.9 In our sample, 28 percent are citizens, 50 percent were granted amnesty, 15
percent have green cards, and 7 percent are undocumented. (The share of undocumented
workers was unusually low in the years immediately after the passage of IRCA due to the
amnesty program and the initial fear of unauthorized immigrants that enforcement of the law
would be strict. Their share of the work force grew substantially in the 1990’s.)
Most of the sample (86 percent) are Hispanic. Only 4 percent of the sample are
blacks, and slightly more than half of those are native citizens.10 Most of the native-born
citizens speak English, have a one-third chance of being female, a two-thirds chance of being
white, and a less than fifty percent chance of being Hispanic. In contrast, nonnative citizens
typically cannot speak English, are slightly more likely to be female, less likely to be white,
and much more likely to be Hispanic. Single male Mexicans are more likely to be in this
country illegally than other groups and hence were more likely to have qualified for amnesty.
Virtually all these agricultural workers had less than a high school education. The
undocumented workers’ average age is 26, roughly a decade younger than the average in the
other groups. Consequently, the undocumented average many fewer years of U.S. farmwork
experience than those in the other groups.

9
Empirical Results
We estimated the Markov model of migration using maximum likelihood separately for each
of our four legal status groups: citizens, green card holders, workers with amnesty, and people
who lack documentation to legally work in the United States.
Aggregation
We used likelihood-ratio tests to determine whether we could aggregate across legal-
status groups. In each case, we tested whether all the coefficients are identical with the
exception of the intercept. That is, we allowed separate coefficients for each legal-status
dummy variable in our aggregate equation but forced all the slope coefficients to be identical
across legal-status groups.
We first tested whether all four groups could be aggregated into a single equation.
We reject this hypothesis: The likelihood-ratio test statistic is 499, which exceeds the critical
χ2.05(123).
Next, we tested the hypothesis that the three authorized worker groups (citizens, green
card holders, and workers with amnesty) have identical migration equations. The likelihood-
ratio test statistic is 336 > χ2. 05(82). Based on these tests, we decided to estimate separate
equations for each legal-status group.
Migration Equations
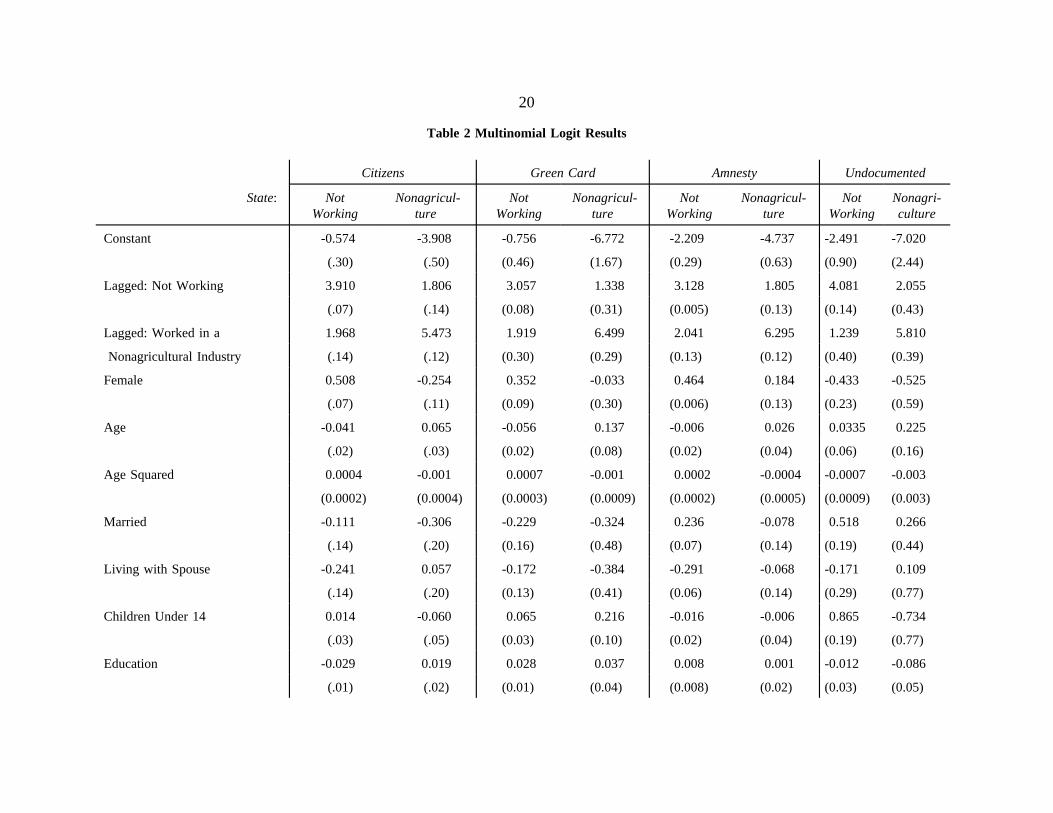
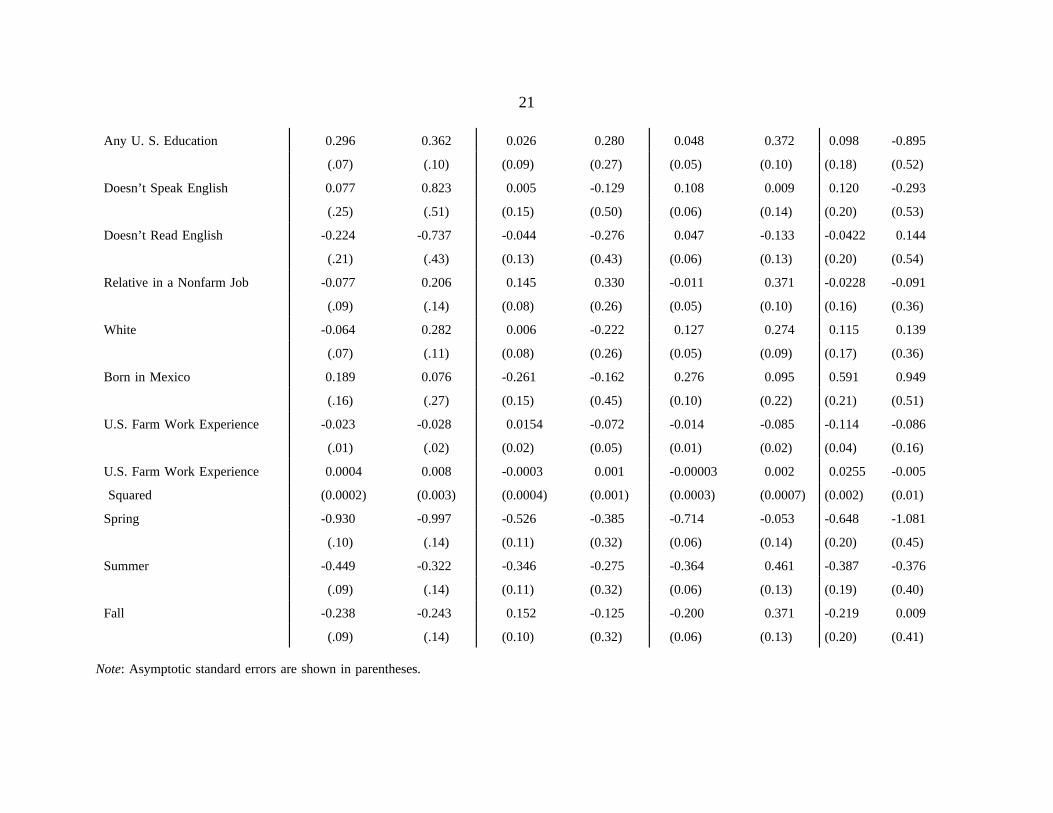
The multinomial logit estimates for each legal-status group are reported in table 2,
where the residual category is agricultural work. For each legal-status group, both lagged
state variables have relatively large positive coefficients that are statistically significantly
10
different than zero at the 0.05 level. Consequently, an individual’s state this period is likely
to be the same as in the previous period, all else the same.
The female dummy variables also tend to have relatively large coefficients in absolute
value that are statistically significantly different from zero. Except for unauthorized workers,
female workers are significantly more likely to not be working in the United States than are
male workers. Female citizens are less likely to be in nonagricultural work.
Some of the age variables have statistically significant effects but no obvious pattern
emerges. Having had some U.S. education increases the probability of not being employed
and of working in a nonagricultural job for citizens. For amnesty workers, such education
increases the probability of nonagricultural work. Being white increases the probability of
nonagricultural work for citizens, and for workers with amnesty. Having been born in
Mexico increases the probability of not being employed for unauthorized workers and for
workers with amnesty but reduces this probability for green card holders.
An inability to speak or read English has statistically significant effects for citizens
and workers with amnesty, suggesting that the lack of these skills are impediments to
mobility for some people with legal work status. Not being able to read English reduces the
probability of nonagricultural work for citizens and not being able to speak English increases
the probability of not being employed for people with amnesty.
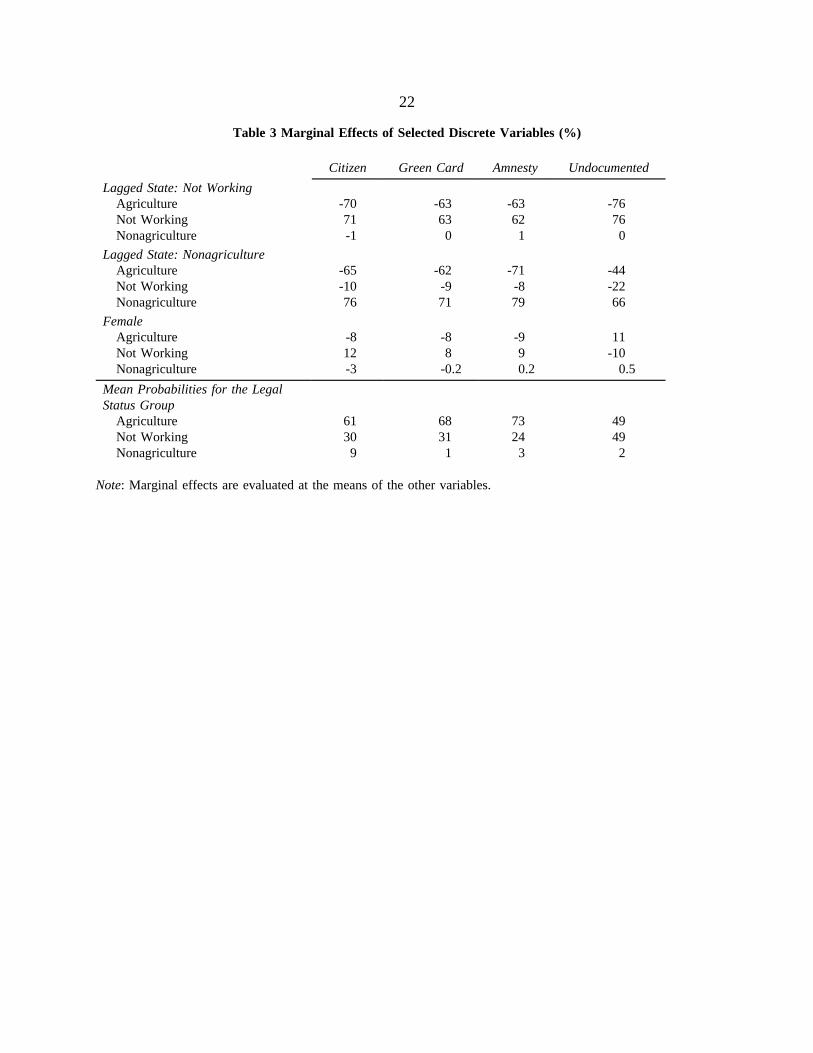
Marginal Effects
We are particularly interested in how the statistically significant lagged states and
gender variables affect the probabilities of being in any given state. Because the multinomial
logit equation is highly nonlinear, it is difficult to interpret the effects of variables directly
11
from their coefficients. To analyze the effect of these independent variables on the probabili-
ties, we calculate the marginal effects of changing one of these variables at a time. Each
reported marginal effect in table 3 is the difference between the probability when the relevant
dummy variable equals one minus the probability when that variable is zero, holding the other
variables constant at their mean values.11
For example, table 3 shows the following marginal effects for a worker who has
amnesty. All else the same, a person who was not working last period, compared to one who
was employed in agriculture, is 63 percent less likely to work in agriculture this period, 62
percent more likely to not be working this period, and 1 percent more likely to be working in
a nonagricultural industry this period. The comparable marginal effects for a person who
worked in a nonagricultural industry last period compared to one who did not are -71 percent,
-8 percent, and 79 percent, respectively. A female (compared to a male) is 9 percent less
likely to work in agriculture, 9 percent more likely to be out of work, and trivially more
likely to have a nonagricultural job.
The marginal effects are qualitatively similar across the three groups of authorized
workers. The undocumented workers have different effects than the other groups. In
particular, authorized female workers are less likely to work in agriculture and more likely to
not be employed than comparable males, whereas unauthorized female workers are more
likely to be employed in agriculture and less likely to be out of work than their male
counterparts. The marginal effects of the lagged nonagricultural state dummy are quantita-
tively different from those for authorized workers.
12
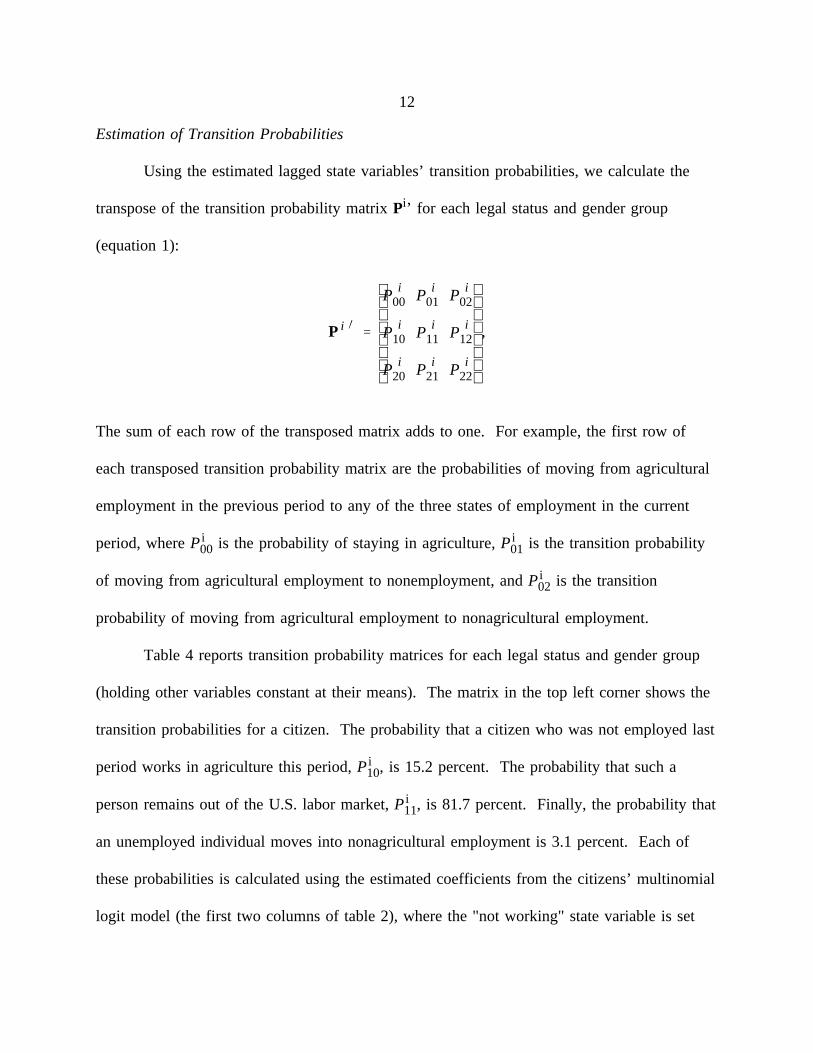
Estimation of Transition Probabilities
Using the estimated lagged state variables’ transition probabilities, we calculate the
transpose of the transition probability matrix Pi’ for each legal status and gender group
(equation 1):
P i
Pi
00 Pi
01 Pi
02
Pi
10 Pi
11 Pi
12
Pi
20 Pi
21 Pi
22
,
The sum of each row of the transposed matrix adds to one. For example, the first row of
each transposed transition probability matrix are the probabilities of moving from agricultural
employment in the previous period to any of the three states of employment in the current
period, where P i00 is the probability of staying in agriculture, P i
01 is the transition probability
of moving from agricultural employment to nonemployment, and P i02 is the transition
probability of moving from agricultural employment to nonagricultural employment.
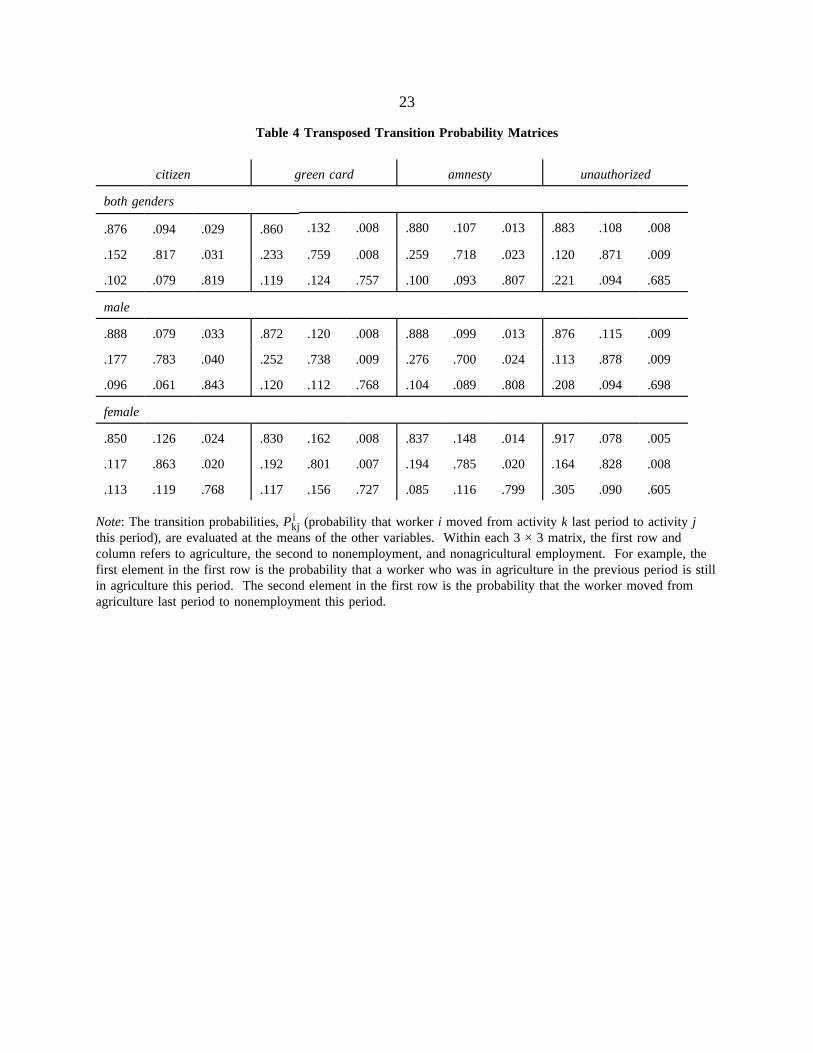
Table 4 reports transition probability matrices for each legal status and gender group
(holding other variables constant at their means). The matrix in the top left corner shows the
transition probabilities for a citizen. The probability that a citizen who was not employed last
period works in agriculture this period, P i10, is 15.2 percent. The probability that such a
person remains out of the U.S. labor market, P i11, is 81.7 percent. Finally, the probability that
an unemployed individual moves into nonagricultural employment is 3.1 percent. Each of
these probabilities is calculated using the estimated coefficients from the citizens’ multinomial
logit model (the first two columns of table 2), where the "not working" state variable is set

13
equal to one, the other lagged state variables are set equal to zero, and the other explanatory
variables are set at their mean values.
In each of the transition matrices, the probabilities along the principal diagonal range
between 60.5 percent and 91.7 percent. That is, it is very likely that an individual will
remain in the same state from one month to the next. The size of the probabilities in most of
the transition matrices are similar across legal-status and gender groups. In general, males
and females have similar transition matrices. The largest gender difference is for unautho-
rized workers.
For example, an unauthorized male who worked in agriculture last month has a 87.6
percent probability of working in agriculture this month, whereas the probability is 91.7
percent for a comparable female. Consequently, the probability that such an unauthorized
immigrant who worked in agriculture last month would leave agriculture this month is 12.4
percent for a male and 8.3 percent for a female. The probability than an unauthorized male
who was not working last month is working in agriculture this month is 11.3 percent, com-
pared to 16.4 percent for an unauthorized female. The probability that the male moved from
a nonagricultural job to an agricultural job is 20.8 percent, while that for a female is 30.5
percent. For the other legal-status groups, the differences between males and females are
smaller. We also examined transition probability matrices for other demographic divisions
but found no striking differences across groups.
Our most striking result is something that we did not find. When IRCA was passed,
many observers worried that formerly unauthorized workers who received amnesty would

14
leave agriculture, greatly driving up wages. However, table 4 shows that there is little
difference among the transition matrices for workers with amnesty and those of other groups.
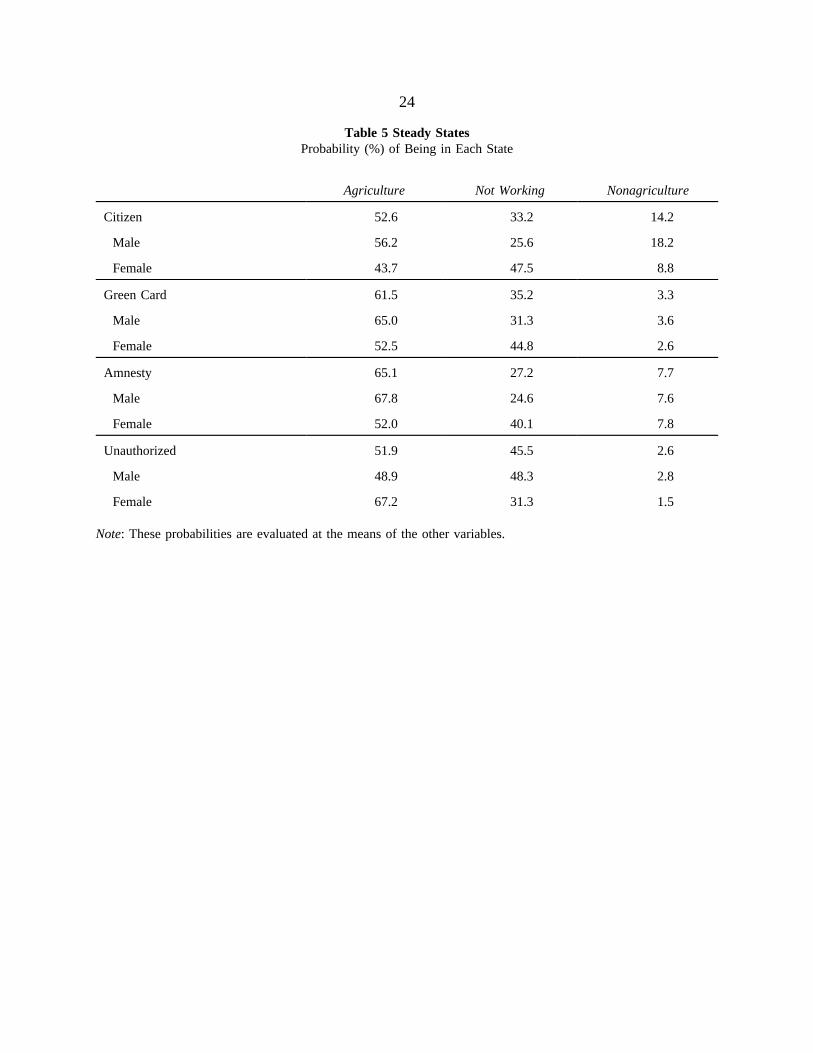
Steady-State Probabilities
Although the transition matrices appear to differ little, those small differences matter
in the steady state. Table 5 summarizes the steady probabilities for the same demographic
groups as in table 4.
The first column of the table shows that the long-run probabilities that a typical male
is working in agriculture in a given month is 56.2 percent for citizens, 65.0 percent for green
card holders, 67.8 percent for those with amnesty, and only 48.9 percent for the unauthorized.
In the long run, male citizens are much more likely to hold a nonagricultural job, 18.2
percent, than are green card holders, 3.2 percent, those with amnesty, 7.6 percent, and the
unauthorized, 2.8 percent.
An unauthorized male has a much higher probability of not working, 48.3 percent,
than a citizen, 25.6 percent, green card holders, 31.3 percent, or a man with amnesty, 24.6
percent. Females are more likely to not be working than males for legal workers but not for
the unauthorized. The probability of a female being out of work is 47.5 percent, 44.8 percent,
40.1 percent, and 31.3 percent for citizens, green card holders, people with amnesty, and the
unauthorized.
One interpretation of these results is that when an unauthorized worker was granted
amnesty, the probability that that worker would be in agriculture in any given month in the
long run rose from 51.9 percent to 65.1 percent across genders. The probability that a male
15
works in agriculture increased from 48.9 percent to 67.8 percent, but the probability for a
female fell from 67.2 percent to 52.0 percent.
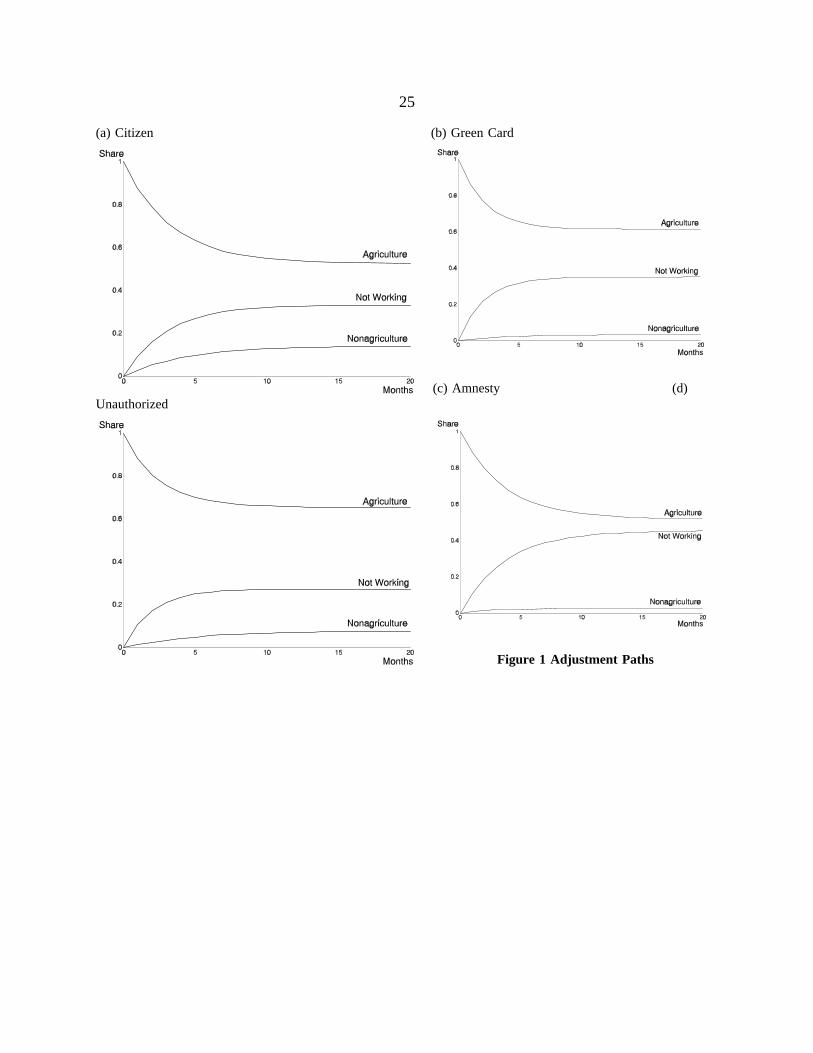
How long does it take to reach the steady states? Figure 1 shows the adjustment paths
for our four legal-status groups given that an individual was working in agriculture in the
initial period. As the figures illustrate, most of the adjustment occurs within half a year and
virtually all the adjustment occurs within a year and a half.
Conclusions
Agricultural workers move in and out of agriculture frequently. Adjustments (migration
between types of jobs) take relatively little time.
The pattern of migration differs across gender, age, and education groups. Probably
the most important demographic effect that we find is that female workers tend to stay out of
the U.S. labor market longer once they stop being employed and their access to jobs outside
of agriculture is more limited than that of their male counterparts.
We show that job mobility patterns differ statistically significantly by legal status.
Nonetheless, we conclude that the 1986 Immigration Reform and Control Act (IRCA) had
less of an effect on the agricultural labor market than was anticipated. Prior to the passage of
IRCA, many farmers and legislators loudly predicted that granting amnesty to farm workers
would drive them out of agriculture. We conclude that this fear was unwarranted. The
transitional probabilities between job categories are virtually the same across legal status
groups, indicating that the law had little short-run effect. Moreover, the steady state probabil-
ity of working in agriculture is higher for someone with amnesty than for an undocumented

16
worker, so that IRCA increased the long-run probability that people granted amnesty stayed in
agriculture.
17
References
Amemiya, T. Advanced Econometrics. Cambridge, MA: Harvard University Press,
1985.
Boskin, M. J., and F. C. Nold. "A Markov Model of Turnover in Aid to Families with
Dependent Children." J. Human Resources 10(Fall 1975):467-81.
Journal of Commerce. “Immigration Law Blamed for Farm Labor Shortage,” June 16, 1987,
p. 5A.
Los Angeles Times. “New Wave of Cheap Labor Seen; Alien Farm Workers Fear Immigra-
tion Law Change,” October 22, 1985, p. 1.
Mines, Richard, Susan Gabbard, and Beatriz Boccalandro. "Findings from the National
Agricultural Workers Survey (NAWS) 1990: A Demographic and Employment Profiles
of Perishable Crop Farm Workers." Office of Program Economics, Research Report
No. 1. Office of the Assistant Secretary for Policy, U. S. Department of Labor. July
1991.
New York Times. “Shortage of Farm Workers Puts Pressure on the Harvest,” June 21, 1987,
Part 2, p. 20.
Rosenberg, H. R., V. J. Horowitz, and D. L. Egan. Labor Management Laws in California
Agriculture. University of California, Division of Agriculture and Natural Resources,
2nd Edition, 1995.
Sandoval, R. "Call for Quick Action on Mexican Laborers in U.S. Surprises Advocates,"
Dallas Morning News, January 11, 2001.

18
Washington Post. "Aliens Law to Change Nation," November 28, 1986, p. A16.
19
Table 1 Summary Statistics
Citizens Green Card Amnesty Not Documented
Percentage (%)
Works in Agriculture 52 62 64 46
Works in Nonagriculture 31 34 26 48
Not Working17 4 9 6
Female 38 31 19 16
Marital Status 66 85 68 37
Living with Spouse 62 76 42 14
Any U.S. Education 65 33 31 22
Doesn’t Speak English 5 22 40 56
Doesn’t Read English 7 30 56 67
Relative in a Nonfarm Job 78 51 41 33
White 65 47 51 54
Born in Mexico 6 88 95 86
Spring 24 24 25 24
Summer 26 26 26 26
Fall 25 25 25 25
Number or Years
Children Under 14 (number) 0.98 1.22 0.99 0.16
Age (years) 36.14 37.82 32.29 25.58
Education (years) 9.47 6.16 5.12 5.78
U.S. Farmwork Experience(years)
15.25 13.89 9.20 3.76
Observations 10,107 5,523 17,776 2,396
20
Table 2 Multinomial Logit Results
Citizens Green Card Amnesty Undocumented
State: NotWorking
Nonagricul-ture
NotWorking
Nonagricul-ture
NotWorking
Nonagricul-ture
NotWorking
Nonagri-culture
Constant -0.574 -3.908 -0.756 -6.772 -2.209 -4.737 -2.491 -7.020
(.30) (.50) (0.46) (1.67) (0.29) (0.63) (0.90) (2.44)
Lagged: Not Working 3.910 1.806 3.057 1.338 3.128 1.805 4.081 2.055
(.07) (.14) (0.08) (0.31) (0.005) (0.13) (0.14) (0.43)
Lagged: Worked in a 1.968 5.473 1.919 6.499 2.041 6.295 1.239 5.810
Nonagricultural Industry (.14) (.12) (0.30) (0.29) (0.13) (0.12) (0.40) (0.39)
Female 0.508 -0.254 0.352 -0.033 0.464 0.184 -0.433 -0.525
(.07) (.11) (0.09) (0.30) (0.006) (0.13) (0.23) (0.59)
Age -0.041 0.065 -0.056 0.137 -0.006 0.026 0.0335 0.225
(.02) (.03) (0.02) (0.08) (0.02) (0.04) (0.06) (0.16)
Age Squared 0.0004 -0.001 0.0007 -0.001 0.0002 -0.0004 -0.0007 -0.003
(0.0002) (0.0004) (0.0003) (0.0009) (0.0002) (0.0005) (0.0009) (0.003)
Married -0.111 -0.306 -0.229 -0.324 0.236 -0.078 0.518 0.266
(.14) (.20) (0.16) (0.48) (0.07) (0.14) (0.19) (0.44)
Living with Spouse -0.241 0.057 -0.172 -0.384 -0.291 -0.068 -0.171 0.109
(.14) (.20) (0.13) (0.41) (0.06) (0.14) (0.29) (0.77)
Children Under 14 0.014 -0.060 0.065 0.216 -0.016 -0.006 0.865 -0.734
(.03) (.05) (0.03) (0.10) (0.02) (0.04) (0.19) (0.77)
Education -0.029 0.019 0.028 0.037 0.008 0.001 -0.012 -0.086
(.01) (.02) (0.01) (0.04) (0.008) (0.02) (0.03) (0.05)
21
Any U. S. Education 0.296 0.362 0.026 0.280 0.048 0.372 0.098 -0.895
(.07) (.10) (0.09) (0.27) (0.05) (0.10) (0.18) (0.52)
Doesn’t Speak English 0.077 0.823 0.005 -0.129 0.108 0.009 0.120 -0.293
(.25) (.51) (0.15) (0.50) (0.06) (0.14) (0.20) (0.53)
Doesn’t Read English -0.224 -0.737 -0.044 -0.276 0.047 -0.133 -0.0422 0.144
(.21) (.43) (0.13) (0.43) (0.06) (0.13) (0.20) (0.54)
Relative in a Nonfarm Job -0.077 0.206 0.145 0.330 -0.011 0.371 -0.0228 -0.091
(.09) (.14) (0.08) (0.26) (0.05) (0.10) (0.16) (0.36)
White -0.064 0.282 0.006 -0.222 0.127 0.274 0.115 0.139
(.07) (.11) (0.08) (0.26) (0.05) (0.09) (0.17) (0.36)
Born in Mexico 0.189 0.076 -0.261 -0.162 0.276 0.095 0.591 0.949
(.16) (.27) (0.15) (0.45) (0.10) (0.22) (0.21) (0.51)
U.S. Farm Work Experience -0.023 -0.028 0.0154 -0.072 -0.014 -0.085 -0.114 -0.086
(.01) (.02) (0.02) (0.05) (0.01) (0.02) (0.04) (0.16)
U.S. Farm Work Experience 0.0004 0.008 -0.0003 0.001 -0.00003 0.002 0.0255 -0.005
Squared (0.0002) (0.003) (0.0004) (0.001) (0.0003) (0.0007) (0.002) (0.01)
Spring -0.930 -0.997 -0.526 -0.385 -0.714 -0.053 -0.648 -1.081
(.10) (.14) (0.11) (0.32) (0.06) (0.14) (0.20) (0.45)
Summer -0.449 -0.322 -0.346 -0.275 -0.364 0.461 -0.387 -0.376
(.09) (.14) (0.11) (0.32) (0.06) (0.13) (0.19) (0.40)
Fall -0.238 -0.243 0.152 -0.125 -0.200 0.371 -0.219 0.009
(.09) (.14) (0.10) (0.32) (0.06) (0.13) (0.20) (0.41)
Note: Asymptotic standard errors are shown in parentheses.
22
Table 3 Marginal Effects of Selected Discrete Variables (%)
Citizen Green Card Amnesty Undocumented
Lagged State: Not WorkingAgricultureNot WorkingNonagriculture
-7071-1
-63630
-63621
-76760
Lagged State: NonagricultureAgricultureNot WorkingNonagriculture
-65-1076
-62-971
-71-879
-44-2266
FemaleAgricultureNot WorkingNonagriculture
-812-3
-88
-0.2
-990.2
11-10
0.5
Mean Probabilities for the LegalStatus Group
AgricultureNot WorkingNonagriculture
61309
68311
73243
49492
Note: Marginal effects are evaluated at the means of the other variables.
23
Table 4 Transposed Transition Probability Matrices
citizen green card amnesty unauthorized
both genders
.876 .094 .029 .860 .132 .008 .880 .107 .013 .883 .108 .008
.152 .817 .031 .233 .759 .008 .259 .718 .023 .120 .871 .009
.102 .079 .819 .119 .124 .757 .100 .093 .807 .221 .094 .685
male
.888 .079 .033 .872 .120 .008 .888 .099 .013 .876 .115 .009
.177 .783 .040 .252 .738 .009 .276 .700 .024 .113 .878 .009
.096 .061 .843 .120 .112 .768 .104 .089 .808 .208 .094 .698
female
.850 .126 .024 .830 .162 .008 .837 .148 .014 .917 .078 .005
.117 .863 .020 .192 .801 .007 .194 .785 .020 .164 .828 .008
.113 .119 .768 .117 .156 .727 .085 .116 .799 .305 .090 .605
Note: The transition probabilities, P ikj (probability that worker i moved from activity k last period to activity j
this period), are evaluated at the means of the other variables. Within each 3 × 3 matrix, the first row andcolumn refers to agriculture, the second to nonemployment, and nonagricultural employment. For example, thefirst element in the first row is the probability that a worker who was in agriculture in the previous period is stillin agriculture this period. The second element in the first row is the probability that the worker moved fromagriculture last period to nonemployment this period.
24
Table 5 Steady StatesProbability (%) of Being in Each State
Agriculture Not Working Nonagriculture
Citizen 52.6 33.2 14.2
Male 56.2 25.6 18.2
Female 43.7 47.5 8.8
Green Card 61.5 35.2 3.3
Male 65.0 31.3 3.6
Female 52.5 44.8 2.6
Amnesty 65.1 27.2 7.7
Male 67.8 24.6 7.6
Female 52.0 40.1 7.8
Unauthorized 51.9 45.5 2.6
Male 48.9 48.3 2.8
Female 67.2 31.3 1.5
Note: These probabilities are evaluated at the means of the other variables.
25
(a) Citizen (b) Green Card
(c) Amnesty (d)Unauthorized
Figure 1 Adjustment Paths
26
Footnotes
1. See Sandoval. In 2000, several similar measures were debated and one minor change
in immigration law was passed.
2. Undocumented aliens who could establish continuous residence in the United States
from January 1, 1982 could apply for general amnesty by May 4, 1988. They received
temporary legal status for 2½ years and then could obtain permanent resident (green card)
status. We concentrate on the SAW program. Seasonal Agricultural Workers (SAWs) who
could establish they worked for 90 days continuously in field work between May 1, 1985 and
May 1, 1986 could obtain amnesty if they applied by November 30, 1988. SAWs received
temporary work authorization status, then legal temporary resident status, and then legal
permanent resident (green card) status. This entire process took at least one year and
normally two or more years. Aliens with temporary or permanent status could live and work
anywhere and at any job within the United States.
3. Los Angeles Times. Economists, of course, argued that wages would rise to clear the
labor market eliminating labor shortages. As usual, industry representatives responded that
(Washington Post) "industries where the illegal aliens worked will not be competitive if they
are forced to pay higher wages."
4. The data set we use was financed by IRCA for the to determine the supply of
agricultural workers as part of the process of deciding whether to admit guest workers.
5. We would have to include the initial probabilities, pi(0) = (p i0(0), p i
1(0), p i2(0))’, in the
likelihood function were they not known.
6. Because a worker must have been in one of the three activities in the previous period,
we do not include y i0(t-1) in the equation because it equals 1 - y i
1(t-1) - y i2(t-1).
27
7. Employer names were obtained from the Bureau of Labor Statistics, the Agricultural
Soil and Conservation Service, and Farm Labor Contractor Registration lists, as well as from
other sources. NAWS Regional Coordinators contacted randomly selected employers,
explained the purpose of the survey, and obtained access to the work site to schedule worker
interviews. Workers were then selected randomly and interviewed outside of work hours at
the worker’s home of at another location selected by the worker.
8. The survey question asked about the two calendar years prior to the earliest possible
interview. Thus, for those workers who were interviewed toward the end of the year, we
have a history of nearly three years. This variation is not a problem in our estimation
procedure if our maintained assumption is correct that there are no sources of unobserved
heterogeneity.
9. Workers were assured that they would not be reported to the authorities if they
admitted to being here illegally. A series of questions were used to check for obvious
inaccuracies in legal status. Some of these individuals may have forged documents (such as
green cards). If employers viewed these documents as reliable, however, a forged document
and a legitimate document would have the same effect on wages. Documents that establish
identity and employment eligibility include a valid passport, a certificate of U. S. Citizenship,
a certificate of Naturalization, a Temporary Resident Card, an Employment Authorization
card, a Resident Alien card, or an Alien Registration Receipt card (Rosenberg, Horowitz, and
Egan).
10. The residual racial group after removing whites and blacks consists primarily (91
percent) of Hispanics who do not classify themselves as either white or black. Approximately
5 percent are Asians and 2 percent are Native Americans. Black, Asian, and Native Ameri-
28
can dummy variables were not included because these groups were not represented in all of
the legal status categories.
11. The marginal effects of changing continuous variables are (ignoring the observation
superscript) ∂Pj/∂zj = Pj(1 - Pj)γ and ∂Pj/∂zk = -PjPkγ.