job openings and labor turnover - october 2016
TRANSCRIPT
For release 10:00 a.m. (EST) Tuesday, January 9, 2018 USDL-18-0036
Technical information: (202) 691-5870 • [email protected] • www.bls.gov/jlt
Media contact: (202) 691-5902 • [email protected]
JOB OPENINGS AND LABOR TURNOVER – NOVEMBER 2017
The number of job openings was little changed at 5.9 million on the last business day of November, the
U.S. Bureau of Labor Statistics reported today. Over the month, hires and separations were little
changed at 5.5 million and 5.2 million, respectively. Within separations, the quits rate was unchanged at
2.2 percent and the layoffs and discharges rate was little changed 1.1 percent. This release includes
estimates of the number and rate of job openings, hires, and separations for the nonfarm sector by
industry and by four geographic regions.
Job Openings
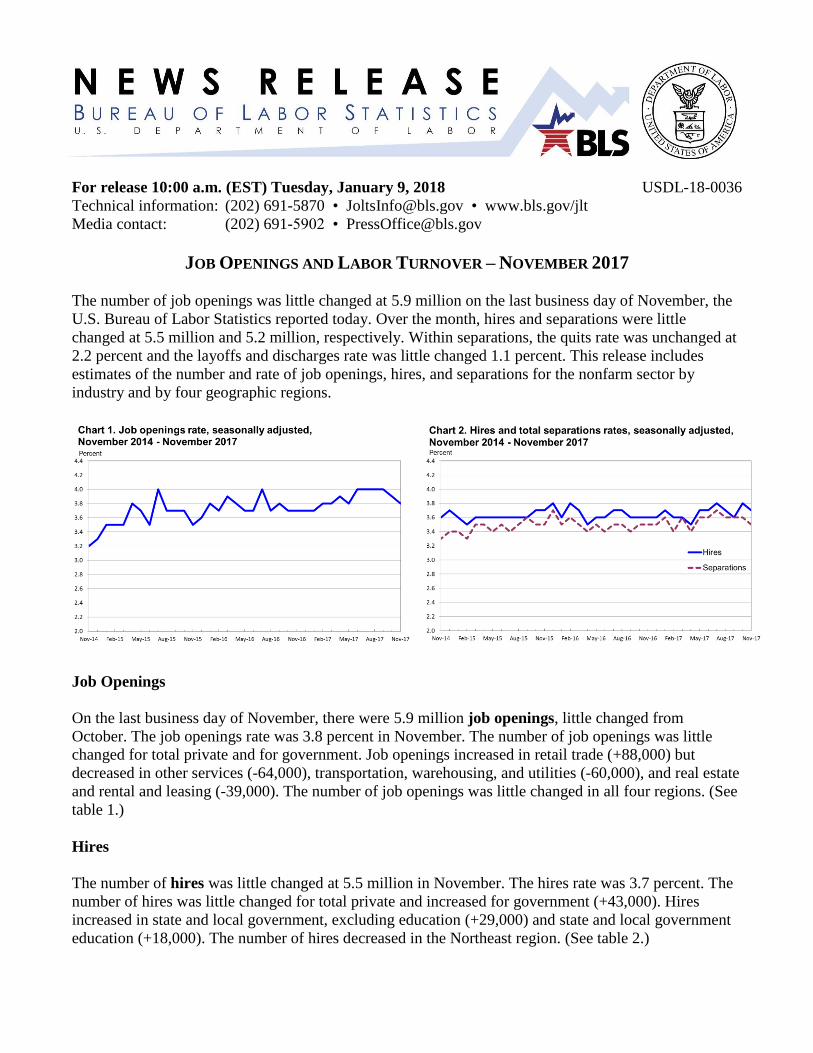
On the last business day of November, there were 5.9 million job openings, little changed from
October. The job openings rate was 3.8 percent in November. The number of job openings was little
changed for total private and for government. Job openings increased in retail trade (+88,000) but
decreased in other services (-64,000), transportation, warehousing, and utilities (-60,000), and real estate
and rental and leasing (-39,000). The number of job openings was little changed in all four regions. (See
table 1.)
Hires
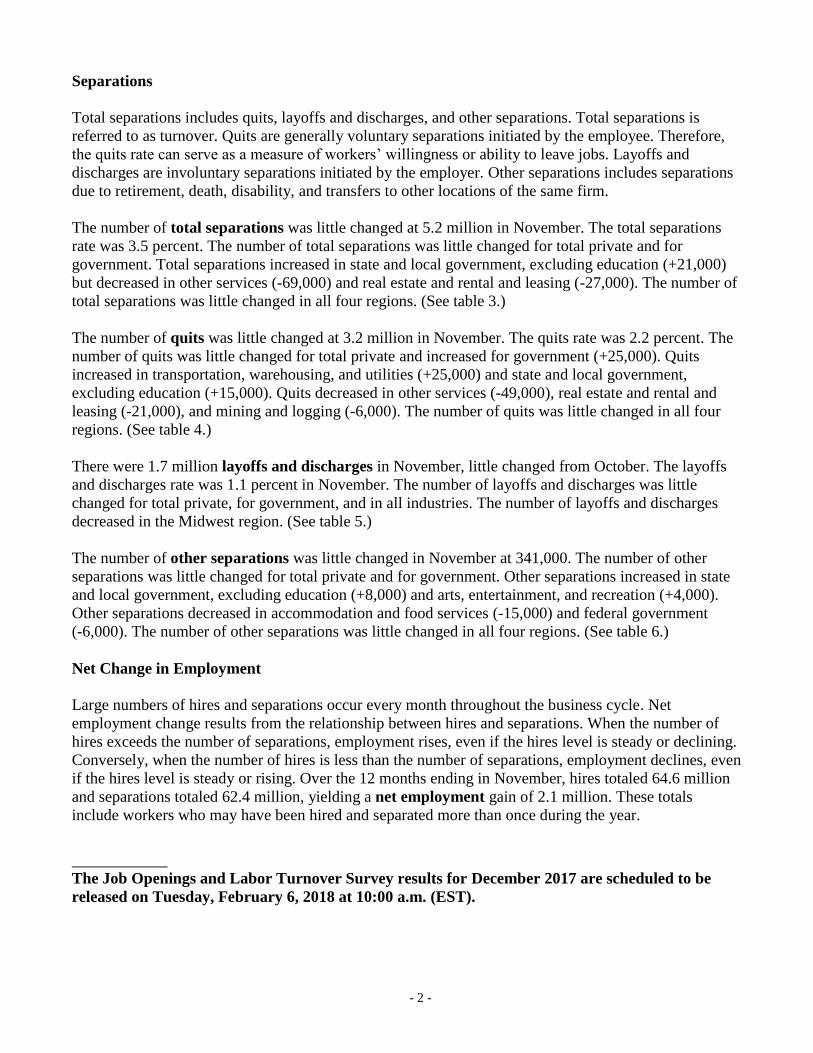
The number of hires was little changed at 5.5 million in November. The hires rate was 3.7 percent. The
number of hires was little changed for total private and increased for government (+43,000). Hires
increased in state and local government, excluding education (+29,000) and state and local government
education (+18,000). The number of hires decreased in the Northeast region. (See table 2.)
- 2 -
Separations
Total separations includes quits, layoffs and discharges, and other separations. Total separations is
referred to as turnover. Quits are generally voluntary separations initiated by the employee. Therefore,
the quits rate can serve as a measure of workers’ willingness or ability to leave jobs. Layoffs and
discharges are involuntary separations initiated by the employer. Other separations includes separations
due to retirement, death, disability, and transfers to other locations of the same firm.
The number of total separations was little changed at 5.2 million in November. The total separations
rate was 3.5 percent. The number of total separations was little changed for total private and for
government. Total separations increased in state and local government, excluding education (+21,000)
but decreased in other services (-69,000) and real estate and rental and leasing (-27,000). The number of
total separations was little changed in all four regions. (See table 3.)
The number of quits was little changed at 3.2 million in November. The quits rate was 2.2 percent. The
number of quits was little changed for total private and increased for government (+25,000). Quits
increased in transportation, warehousing, and utilities (+25,000) and state and local government,
excluding education (+15,000). Quits decreased in other services (-49,000), real estate and rental and
leasing (-21,000), and mining and logging (-6,000). The number of quits was little changed in all four
regions. (See table 4.)
There were 1.7 million layoffs and discharges in November, little changed from October. The layoffs
and discharges rate was 1.1 percent in November. The number of layoffs and discharges was little
changed for total private, for government, and in all industries. The number of layoffs and discharges
decreased in the Midwest region. (See table 5.)
The number of other separations was little changed in November at 341,000. The number of other
separations was little changed for total private and for government. Other separations increased in state
and local government, excluding education (+8,000) and arts, entertainment, and recreation (+4,000).
Other separations decreased in accommodation and food services (-15,000) and federal government
(-6,000). The number of other separations was little changed in all four regions. (See table 6.)
Net Change in Employment
Large numbers of hires and separations occur every month throughout the business cycle. Net
employment change results from the relationship between hires and separations. When the number of
hires exceeds the number of separations, employment rises, even if the hires level is steady or declining.
Conversely, when the number of hires is less than the number of separations, employment declines, even
if the hires level is steady or rising. Over the 12 months ending in November, hires totaled 64.6 million
and separations totaled 62.4 million, yielding a net employment gain of 2.1 million. These totals
include workers who may have been hired and separated more than once during the year.
The Job Openings and Labor Turnover Survey results for December 2017 are scheduled to be
released on Tuesday, February 6, 2018 at 10:00 a.m. (EST).
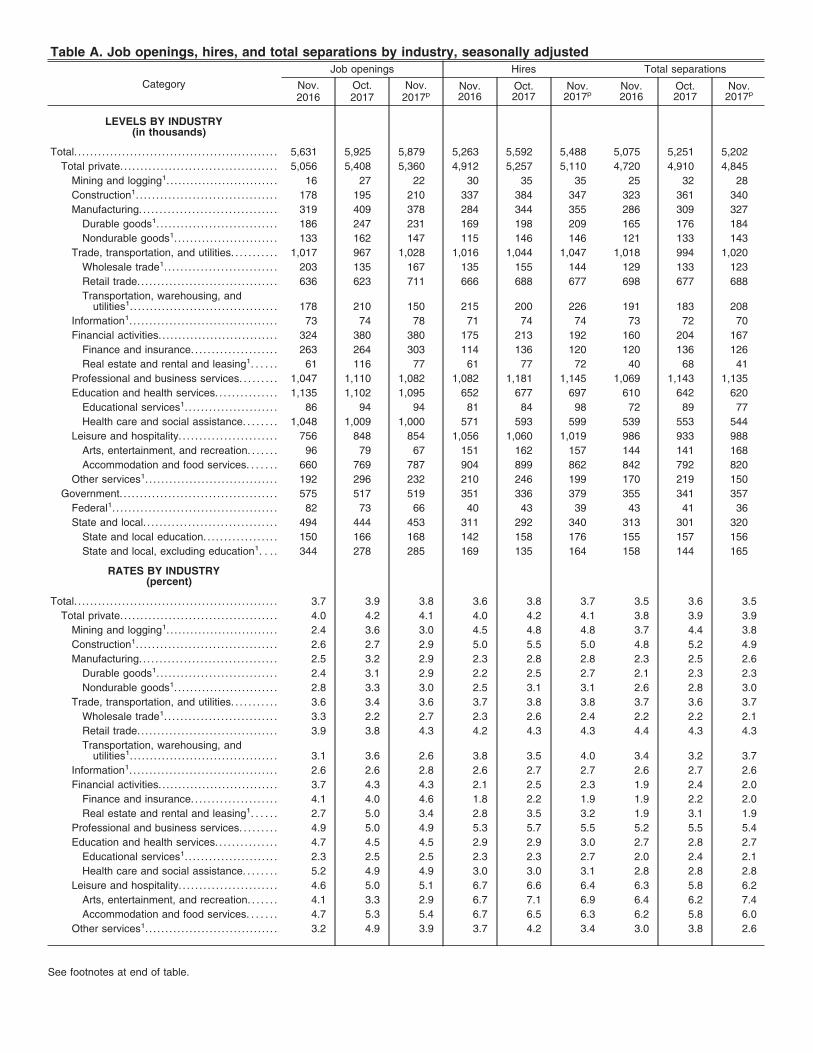
Table A. Job openings, hires, and total separations by industry, seasonally adjusted
Category
Job openings Hires Total separations
Nov.2016
Oct.2017
Nov.2017p
Nov.2016
Oct.2017
Nov.2017p
Nov.2016
Oct.2017
Nov.2017p
LEVELS BY INDUSTRY(in thousands)
Total. . . . . . . . . . . . . . . . . . . . . . . . . . . . . . . . . . . . . . . . . . . . . . . . . . . 5,631 5,925 5,879 5,263 5,592 5,488 5,075 5,251 5,202
Total private. . . . . . . . . . . . . . . . . . . . . . . . . . . . . . . . . . . . . . . 5,056 5,408 5,360 4,912 5,257 5,110 4,720 4,910 4,845
Mining and logging1. . . . . . . . . . . . . . . . . . . . . . . . . . . . 16 27 22 30 35 35 25 32 28
Construction1. . . . . . . . . . . . . . . . . . . . . . . . . . . . . . . . . . . 178 195 210 337 384 347 323 361 340
Manufacturing. . . . . . . . . . . . . . . . . . . . . . . . . . . . . . . . . . 319 409 378 284 344 355 286 309 327
Durable goods1. . . . . . . . . . . . . . . . . . . . . . . . . . . . . . 186 247 231 169 198 209 165 176 184
Nondurable goods1. . . . . . . . . . . . . . . . . . . . . . . . . . 133 162 147 115 146 146 121 133 143
Trade, transportation, and utilities. . . . . . . . . . . 1,017 967 1,028 1,016 1,044 1,047 1,018 994 1,020
Wholesale trade1. . . . . . . . . . . . . . . . . . . . . . . . . . . . 203 135 167 135 155 144 129 133 123
Retail trade.. . . . . . . . . . . . . . . . . . . . . . . . . . . . . . . . . . 636 623 711 666 688 677 698 677 688
Transportation, warehousing, andutilities1. . . . . . . . . . . . . . . . . . . . . . . . . . . . . . . . . . . . . 178 210 150 215 200 226 191 183 208
Information1. . . . . . . . . . . . . . . . . . . . . . . . . . . . . . . . . . . . . 73 74 78 71 74 74 73 72 70
Financial activities. . . . . . . . . . . . . . . . . . . . . . . . . . . . . . 324 380 380 175 213 192 160 204 167
Finance and insurance. . . . . . . . . . . . . . . . . . . . . 263 264 303 114 136 120 120 136 126
Real estate and rental and leasing1. . . . . . 61 116 77 61 77 72 40 68 41
Professional and business services. . . . . . . . . 1,047 1,110 1,082 1,082 1,181 1,145 1,069 1,143 1,135
Education and health services. . . . . . . . . . . . . . . 1,135 1,102 1,095 652 677 697 610 642 620
Educational services1. . . . . . . . . . . . . . . . . . . . . . . 86 94 94 81 84 98 72 89 77
Health care and social assistance. . . . . . . . 1,048 1,009 1,000 571 593 599 539 553 544
Leisure and hospitality. . . . . . . . . . . . . . . . . . . . . . . . 756 848 854 1,056 1,060 1,019 986 933 988
Arts, entertainment, and recreation. . . . . . . 96 79 67 151 162 157 144 141 168
Accommodation and food services. . . . . . . 660 769 787 904 899 862 842 792 820
Other services1. . . . . . . . . . . . . . . . . . . . . . . . . . . . . . . . . 192 296 232 210 246 199 170 219 150
Government. . . . . . . . . . . . . . . . . . . . . . . . . . . . . . . . . . . . . . . 575 517 519 351 336 379 355 341 357
Federal1. . . . . . . . . . . . . . . . . . . . . . . . . . . . . . . . . . . . . . . . . 82 73 66 40 43 39 43 41 36
State and local. . . . . . . . . . . . . . . . . . . . . . . . . . . . . . . . . 494 444 453 311 292 340 313 301 320
State and local education. . . . . . . . . . . . . . . . . . 150 166 168 142 158 176 155 157 156
State and local, excluding education1. . . . 344 278 285 169 135 164 158 144 165
RATES BY INDUSTRY(percent)
Total. . . . . . . . . . . . . . . . . . . . . . . . . . . . . . . . . . . . . . . . . . . . . . . . . . . 3.7 3.9 3.8 3.6 3.8 3.7 3.5 3.6 3.5
Total private. . . . . . . . . . . . . . . . . . . . . . . . . . . . . . . . . . . . . . . 4.0 4.2 4.1 4.0 4.2 4.1 3.8 3.9 3.9
Mining and logging1. . . . . . . . . . . . . . . . . . . . . . . . . . . . 2.4 3.6 3.0 4.5 4.8 4.8 3.7 4.4 3.8
Construction1. . . . . . . . . . . . . . . . . . . . . . . . . . . . . . . . . . . 2.6 2.7 2.9 5.0 5.5 5.0 4.8 5.2 4.9
Manufacturing. . . . . . . . . . . . . . . . . . . . . . . . . . . . . . . . . . 2.5 3.2 2.9 2.3 2.8 2.8 2.3 2.5 2.6
Durable goods1. . . . . . . . . . . . . . . . . . . . . . . . . . . . . . 2.4 3.1 2.9 2.2 2.5 2.7 2.1 2.3 2.3
Nondurable goods1. . . . . . . . . . . . . . . . . . . . . . . . . . 2.8 3.3 3.0 2.5 3.1 3.1 2.6 2.8 3.0
Trade, transportation, and utilities. . . . . . . . . . . 3.6 3.4 3.6 3.7 3.8 3.8 3.7 3.6 3.7
Wholesale trade1. . . . . . . . . . . . . . . . . . . . . . . . . . . . 3.3 2.2 2.7 2.3 2.6 2.4 2.2 2.2 2.1
Retail trade.. . . . . . . . . . . . . . . . . . . . . . . . . . . . . . . . . . 3.9 3.8 4.3 4.2 4.3 4.3 4.4 4.3 4.3
Transportation, warehousing, andutilities1. . . . . . . . . . . . . . . . . . . . . . . . . . . . . . . . . . . . . 3.1 3.6 2.6 3.8 3.5 4.0 3.4 3.2 3.7
Information1. . . . . . . . . . . . . . . . . . . . . . . . . . . . . . . . . . . . . 2.6 2.6 2.8 2.6 2.7 2.7 2.6 2.7 2.6
Financial activities. . . . . . . . . . . . . . . . . . . . . . . . . . . . . . 3.7 4.3 4.3 2.1 2.5 2.3 1.9 2.4 2.0
Finance and insurance. . . . . . . . . . . . . . . . . . . . . 4.1 4.0 4.6 1.8 2.2 1.9 1.9 2.2 2.0
Real estate and rental and leasing1. . . . . . 2.7 5.0 3.4 2.8 3.5 3.2 1.9 3.1 1.9
Professional and business services. . . . . . . . . 4.9 5.0 4.9 5.3 5.7 5.5 5.2 5.5 5.4
Education and health services. . . . . . . . . . . . . . . 4.7 4.5 4.5 2.9 2.9 3.0 2.7 2.8 2.7
Educational services1. . . . . . . . . . . . . . . . . . . . . . . 2.3 2.5 2.5 2.3 2.3 2.7 2.0 2.4 2.1
Health care and social assistance. . . . . . . . 5.2 4.9 4.9 3.0 3.0 3.1 2.8 2.8 2.8
Leisure and hospitality. . . . . . . . . . . . . . . . . . . . . . . . 4.6 5.0 5.1 6.7 6.6 6.4 6.3 5.8 6.2
Arts, entertainment, and recreation. . . . . . . 4.1 3.3 2.9 6.7 7.1 6.9 6.4 6.2 7.4
Accommodation and food services. . . . . . . 4.7 5.3 5.4 6.7 6.5 6.3 6.2 5.8 6.0
Other services1. . . . . . . . . . . . . . . . . . . . . . . . . . . . . . . . . 3.2 4.9 3.9 3.7 4.2 3.4 3.0 3.8 2.6
See footnotes at end of table.
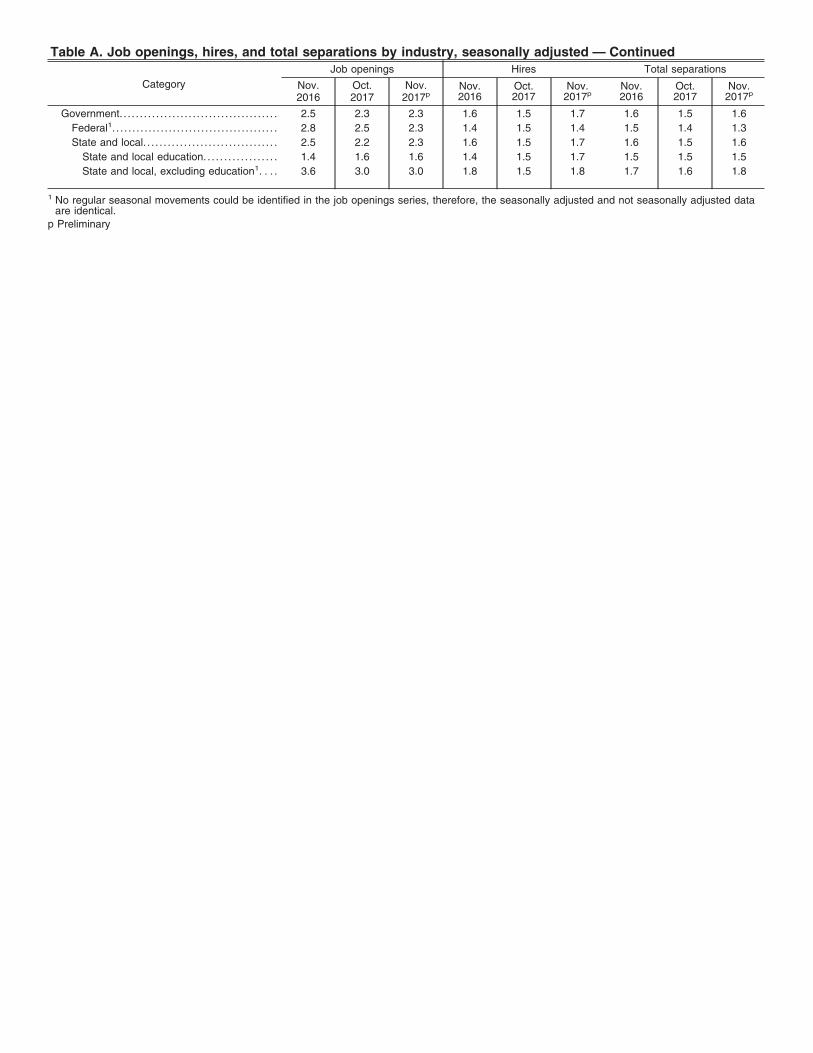
Table A. Job openings, hires, and total separations by industry, seasonally adjusted — Continued
Category
Job openings Hires Total separations
Nov.2016
Oct.2017
Nov.2017p
Nov.2016
Oct.2017
Nov.2017p
Nov.2016
Oct.2017
Nov.2017p
Government. . . . . . . . . . . . . . . . . . . . . . . . . . . . . . . . . . . . . . . 2.5 2.3 2.3 1.6 1.5 1.7 1.6 1.5 1.6
Federal1. . . . . . . . . . . . . . . . . . . . . . . . . . . . . . . . . . . . . . . . . 2.8 2.5 2.3 1.4 1.5 1.4 1.5 1.4 1.3
State and local. . . . . . . . . . . . . . . . . . . . . . . . . . . . . . . . . 2.5 2.2 2.3 1.6 1.5 1.7 1.6 1.5 1.6
State and local education. . . . . . . . . . . . . . . . . . 1.4 1.6 1.6 1.4 1.5 1.7 1.5 1.5 1.5
State and local, excluding education1. . . . 3.6 3.0 3.0 1.8 1.5 1.8 1.7 1.6 1.8
1 No regular seasonal movements could be identified in the job openings series, therefore, the seasonally adjusted and not seasonally adjusted dataare identical.
p Preliminary
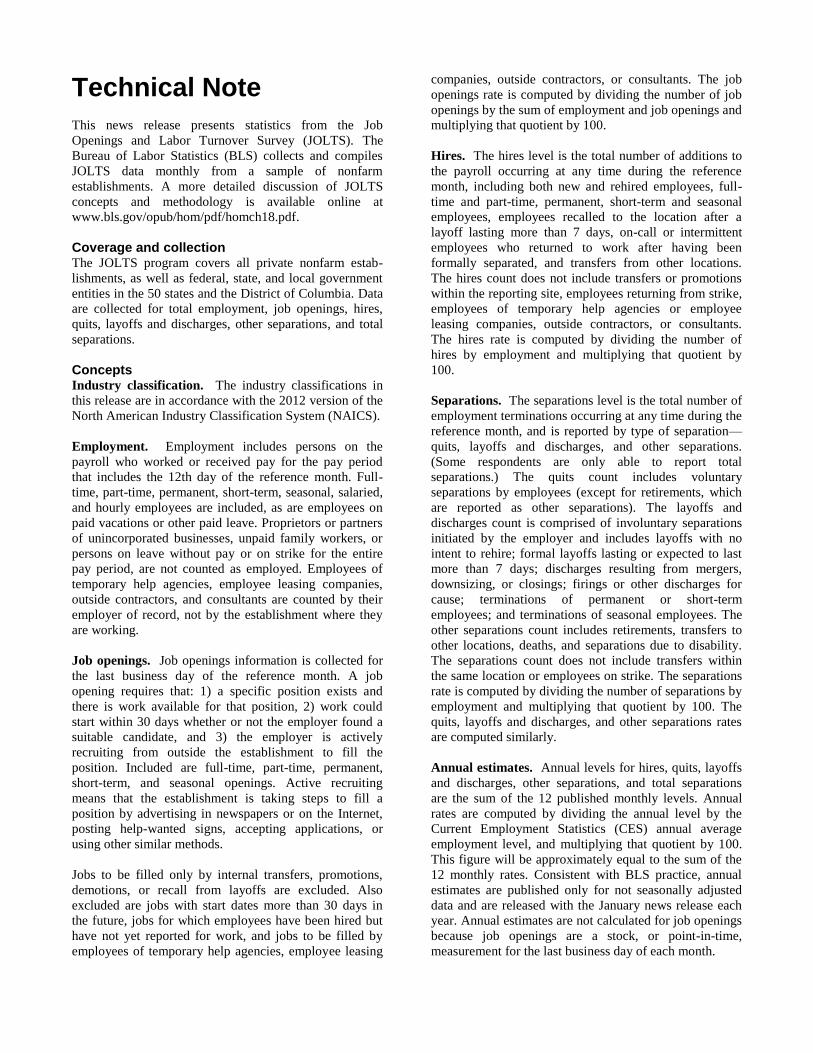
Technical Note
This news release presents statistics from the Job
Openings and Labor Turnover Survey (JOLTS). The
Bureau of Labor Statistics (BLS) collects and compiles
JOLTS data monthly from a sample of nonfarm
establishments. A more detailed discussion of JOLTS
concepts and methodology is available online at
www.bls.gov/opub/hom/pdf/homch18.pdf.
Coverage and collection
The JOLTS program covers all private nonfarm estab-
lishments, as well as federal, state, and local government
entities in the 50 states and the District of Columbia. Data
are collected for total employment, job openings, hires,
quits, layoffs and discharges, other separations, and total
separations.
Concepts
Industry classification. The industry classifications in
this release are in accordance with the 2012 version of the
North American Industry Classification System (NAICS).
Employment. Employment includes persons on the
payroll who worked or received pay for the pay period
that includes the 12th day of the reference month. Full-
time, part-time, permanent, short-term, seasonal, salaried,
and hourly employees are included, as are employees on
paid vacations or other paid leave. Proprietors or partners
of unincorporated businesses, unpaid family workers, or
persons on leave without pay or on strike for the entire
pay period, are not counted as employed. Employees of
temporary help agencies, employee leasing companies,
outside contractors, and consultants are counted by their
employer of record, not by the establishment where they
are working.
Job openings. Job openings information is collected for
the last business day of the reference month. A job
opening requires that: 1) a specific position exists and
there is work available for that position, 2) work could
start within 30 days whether or not the employer found a
suitable candidate, and 3) the employer is actively
recruiting from outside the establishment to fill the
position. Included are full-time, part-time, permanent,
short-term, and seasonal openings. Active recruiting
means that the establishment is taking steps to fill a
position by advertising in newspapers or on the Internet,
posting help-wanted signs, accepting applications, or
using other similar methods.
Jobs to be filled only by internal transfers, promotions,
demotions, or recall from layoffs are excluded. Also
excluded are jobs with start dates more than 30 days in
the future, jobs for which employees have been hired but
have not yet reported for work, and jobs to be filled by
employees of temporary help agencies, employee leasing
companies, outside contractors, or consultants. The job
openings rate is computed by dividing the number of job
openings by the sum of employment and job openings and
multiplying that quotient by 100.
Hires. The hires level is the total number of additions to
the payroll occurring at any time during the reference
month, including both new and rehired employees, full-
time and part-time, permanent, short-term and seasonal
employees, employees recalled to the location after a
layoff lasting more than 7 days, on-call or intermittent
employees who returned to work after having been
formally separated, and transfers from other locations.
The hires count does not include transfers or promotions
within the reporting site, employees returning from strike,
employees of temporary help agencies or employee
leasing companies, outside contractors, or consultants.
The hires rate is computed by dividing the number of
hires by employment and multiplying that quotient by
100.
Separations. The separations level is the total number of
employment terminations occurring at any time during the
reference month, and is reported by type of separation—
quits, layoffs and discharges, and other separations.
(Some respondents are only able to report total
separations.) The quits count includes voluntary
separations by employees (except for retirements, which
are reported as other separations). The layoffs and
discharges count is comprised of involuntary separations
initiated by the employer and includes layoffs with no
intent to rehire; formal layoffs lasting or expected to last
more than 7 days; discharges resulting from mergers,
downsizing, or closings; firings or other discharges for
cause; terminations of permanent or short-term
employees; and terminations of seasonal employees. The
other separations count includes retirements, transfers to
other locations, deaths, and separations due to disability.
The separations count does not include transfers within
the same location or employees on strike. The separations
rate is computed by dividing the number of separations by
employment and multiplying that quotient by 100. The
quits, layoffs and discharges, and other separations rates
are computed similarly.
Annual estimates. Annual levels for hires, quits, layoffs
and discharges, other separations, and total separations
are the sum of the 12 published monthly levels. Annual
rates are computed by dividing the annual level by the
Current Employment Statistics (CES) annual average
employment level, and multiplying that quotient by 100.
This figure will be approximately equal to the sum of the
12 monthly rates. Consistent with BLS practice, annual
estimates are published only for not seasonally adjusted
data and are released with the January news release each
year. Annual estimates are not calculated for job openings
because job openings are a stock, or point-in-time,
measurement for the last business day of each month.
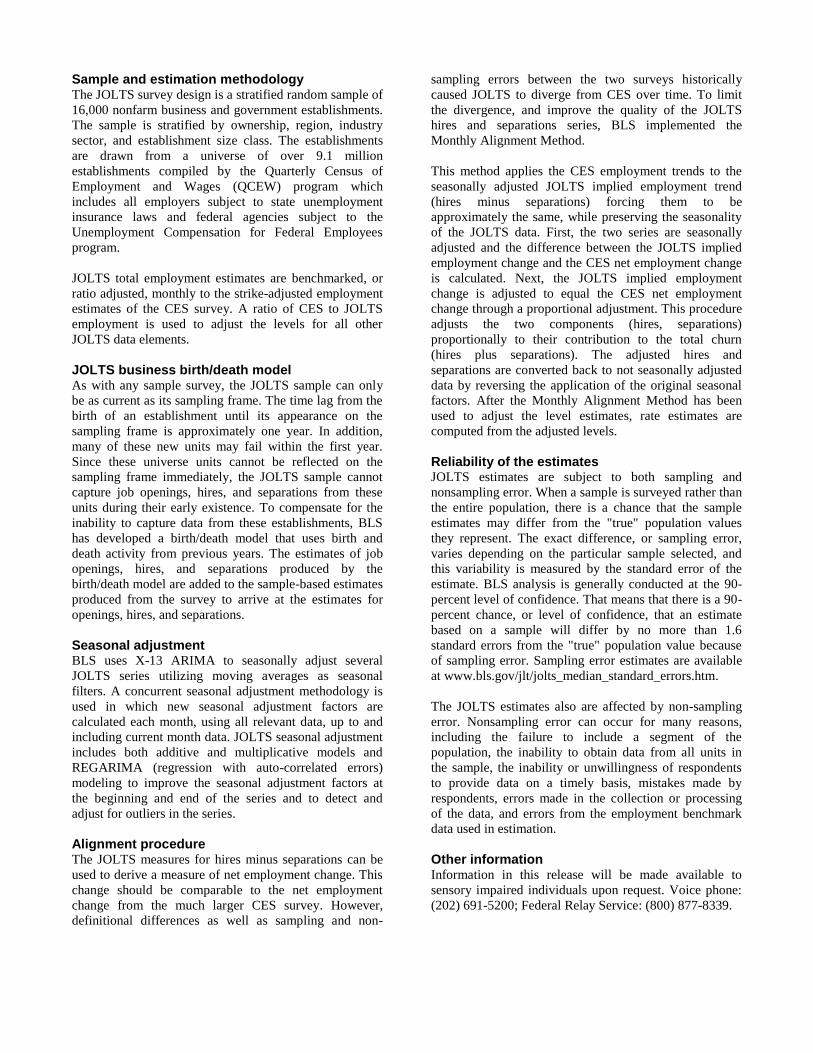
Sample and estimation methodology The JOLTS survey design is a stratified random sample of
16,000 nonfarm business and government establishments.
The sample is stratified by ownership, region, industry
sector, and establishment size class. The establishments
are drawn from a universe of over 9.1 million
establishments compiled by the Quarterly Census of
Employment and Wages (QCEW) program which
includes all employers subject to state unemployment
insurance laws and federal agencies subject to the
Unemployment Compensation for Federal Employees
program.
JOLTS total employment estimates are benchmarked, or
ratio adjusted, monthly to the strike-adjusted employment
estimates of the CES survey. A ratio of CES to JOLTS
employment is used to adjust the levels for all other
JOLTS data elements.
JOLTS business birth/death model As with any sample survey, the JOLTS sample can only
be as current as its sampling frame. The time lag from the
birth of an establishment until its appearance on the
sampling frame is approximately one year. In addition,
many of these new units may fail within the first year.
Since these universe units cannot be reflected on the
sampling frame immediately, the JOLTS sample cannot
capture job openings, hires, and separations from these
units during their early existence. To compensate for the
inability to capture data from these establishments, BLS
has developed a birth/death model that uses birth and
death activity from previous years. The estimates of job
openings, hires, and separations produced by the
birth/death model are added to the sample-based estimates
produced from the survey to arrive at the estimates for
openings, hires, and separations.
Seasonal adjustment BLS uses X-13 ARIMA to seasonally adjust several
JOLTS series utilizing moving averages as seasonal
filters. A concurrent seasonal adjustment methodology is
used in which new seasonal adjustment factors are
calculated each month, using all relevant data, up to and
including current month data. JOLTS seasonal adjustment
includes both additive and multiplicative models and
REGARIMA (regression with auto-correlated errors)
modeling to improve the seasonal adjustment factors at
the beginning and end of the series and to detect and
adjust for outliers in the series.
Alignment procedure The JOLTS measures for hires minus separations can be
used to derive a measure of net employment change. This
change should be comparable to the net employment
change from the much larger CES survey. However,
definitional differences as well as sampling and non-
sampling errors between the two surveys historically
caused JOLTS to diverge from CES over time. To limit
the divergence, and improve the quality of the JOLTS
hires and separations series, BLS implemented the
Monthly Alignment Method.
This method applies the CES employment trends to the
seasonally adjusted JOLTS implied employment trend
(hires minus separations) forcing them to be
approximately the same, while preserving the seasonality
of the JOLTS data. First, the two series are seasonally
adjusted and the difference between the JOLTS implied
employment change and the CES net employment change
is calculated. Next, the JOLTS implied employment
change is adjusted to equal the CES net employment
change through a proportional adjustment. This procedure
adjusts the two components (hires, separations)
proportionally to their contribution to the total churn
(hires plus separations). The adjusted hires and
separations are converted back to not seasonally adjusted
data by reversing the application of the original seasonal
factors. After the Monthly Alignment Method has been
used to adjust the level estimates, rate estimates are
computed from the adjusted levels.
Reliability of the estimates JOLTS estimates are subject to both sampling and
nonsampling error. When a sample is surveyed rather than
the entire population, there is a chance that the sample
estimates may differ from the "true" population values
they represent. The exact difference, or sampling error,
varies depending on the particular sample selected, and
this variability is measured by the standard error of the
estimate. BLS analysis is generally conducted at the 90-
percent level of confidence. That means that there is a 90-
percent chance, or level of confidence, that an estimate
based on a sample will differ by no more than 1.6
standard errors from the "true" population value because
of sampling error. Sampling error estimates are available
at www.bls.gov/jlt/jolts_median_standard_errors.htm.
The JOLTS estimates also are affected by non-sampling
error. Nonsampling error can occur for many reasons,
including the failure to include a segment of the
population, the inability to obtain data from all units in
the sample, the inability or unwillingness of respondents
to provide data on a timely basis, mistakes made by
respondents, errors made in the collection or processing
of the data, and errors from the employment benchmark
data used in estimation.
Other information
Information in this release will be made available to
sensory impaired individuals upon request. Voice phone:
(202) 691-5200; Federal Relay Service: (800) 877-8339.
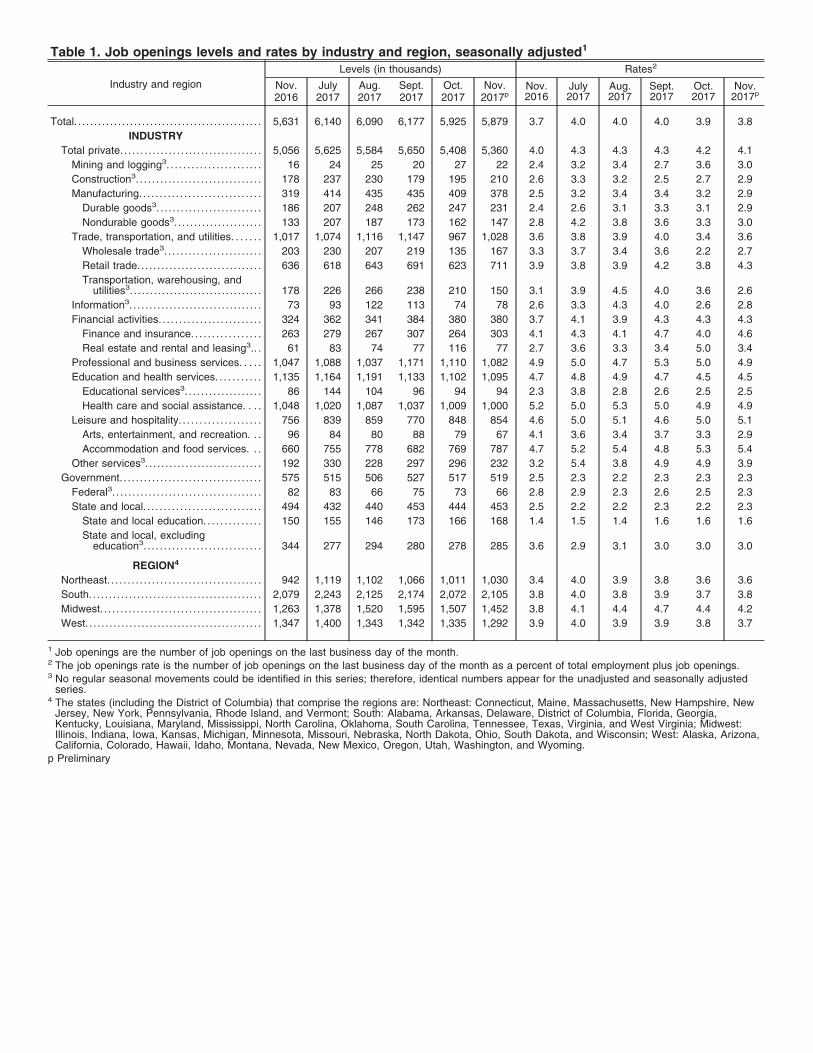
Table 1. Job openings levels and rates by industry and region, seasonally adjusted1
Industry and region
Levels (in thousands) Rates2
Nov.2016
July2017
Aug.2017
Sept.2017
Oct.2017
Nov.2017p
Nov.2016
July2017
Aug.2017
Sept.2017
Oct.2017
Nov.2017p
Total. . . . . . . . . . . . . . . . . . . . . . . . . . . . . . . . . . . . . . . . . . . . . . . 5,631 6,140 6,090 6,177 5,925 5,879 3.7 4.0 4.0 4.0 3.9 3.8
INDUSTRY
Total private. . . . . . . . . . . . . . . . . . . . . . . . . . . . . . . . . . . 5,056 5,625 5,584 5,650 5,408 5,360 4.0 4.3 4.3 4.3 4.2 4.1
Mining and logging3. . . . . . . . . . . . . . . . . . . . . . . 16 24 25 20 27 22 2.4 3.2 3.4 2.7 3.6 3.0
Construction3. . . . . . . . . . . . . . . . . . . . . . . . . . . . . . . 178 237 230 179 195 210 2.6 3.3 3.2 2.5 2.7 2.9
Manufacturing. . . . . . . . . . . . . . . . . . . . . . . . . . . . . . 319 414 435 435 409 378 2.5 3.2 3.4 3.4 3.2 2.9
Durable goods3. . . . . . . . . . . . . . . . . . . . . . . . . . 186 207 248 262 247 231 2.4 2.6 3.1 3.3 3.1 2.9
Nondurable goods3. . . . . . . . . . . . . . . . . . . . . . 133 207 187 173 162 147 2.8 4.2 3.8 3.6 3.3 3.0
Trade, transportation, and utilities. . . . . . . 1,017 1,074 1,116 1,147 967 1,028 3.6 3.8 3.9 4.0 3.4 3.6
Wholesale trade3. . . . . . . . . . . . . . . . . . . . . . . . 203 230 207 219 135 167 3.3 3.7 3.4 3.6 2.2 2.7
Retail trade.. . . . . . . . . . . . . . . . . . . . . . . . . . . . . . 636 618 643 691 623 711 3.9 3.8 3.9 4.2 3.8 4.3
Transportation, warehousing, andutilities3. . . . . . . . . . . . . . . . . . . . . . . . . . . . . . . . . 178 226 266 238 210 150 3.1 3.9 4.5 4.0 3.6 2.6
Information3. . . . . . . . . . . . . . . . . . . . . . . . . . . . . . . . . 73 93 122 113 74 78 2.6 3.3 4.3 4.0 2.6 2.8
Financial activities. . . . . . . . . . . . . . . . . . . . . . . . . 324 362 341 384 380 380 3.7 4.1 3.9 4.3 4.3 4.3
Finance and insurance. . . . . . . . . . . . . . . . . 263 279 267 307 264 303 4.1 4.3 4.1 4.7 4.0 4.6
Real estate and rental and leasing3.. . 61 83 74 77 116 77 2.7 3.6 3.3 3.4 5.0 3.4
Professional and business services. . . . . 1,047 1,088 1,037 1,171 1,110 1,082 4.9 5.0 4.7 5.3 5.0 4.9
Education and health services. . . . . . . . . . . 1,135 1,164 1,191 1,133 1,102 1,095 4.7 4.8 4.9 4.7 4.5 4.5
Educational services3. . . . . . . . . . . . . . . . . . . 86 144 104 96 94 94 2.3 3.8 2.8 2.6 2.5 2.5
Health care and social assistance. . . . 1,048 1,020 1,087 1,037 1,009 1,000 5.2 5.0 5.3 5.0 4.9 4.9
Leisure and hospitality. . . . . . . . . . . . . . . . . . . . 756 839 859 770 848 854 4.6 5.0 5.1 4.6 5.0 5.1
Arts, entertainment, and recreation. . . 96 84 80 88 79 67 4.1 3.6 3.4 3.7 3.3 2.9
Accommodation and food services. . . 660 755 778 682 769 787 4.7 5.2 5.4 4.8 5.3 5.4
Other services3. . . . . . . . . . . . . . . . . . . . . . . . . . . . . 192 330 228 297 296 232 3.2 5.4 3.8 4.9 4.9 3.9
Government. . . . . . . . . . . . . . . . . . . . . . . . . . . . . . . . . . . 575 515 506 527 517 519 2.5 2.3 2.2 2.3 2.3 2.3
Federal3. . . . . . . . . . . . . . . . . . . . . . . . . . . . . . . . . . . . . 82 83 66 75 73 66 2.8 2.9 2.3 2.6 2.5 2.3
State and local. . . . . . . . . . . . . . . . . . . . . . . . . . . . . 494 432 440 453 444 453 2.5 2.2 2.2 2.3 2.2 2.3
State and local education. . . . . . . . . . . . . . 150 155 146 173 166 168 1.4 1.5 1.4 1.6 1.6 1.6
State and local, excludingeducation3. . . . . . . . . . . . . . . . . . . . . . . . . . . . . 344 277 294 280 278 285 3.6 2.9 3.1 3.0 3.0 3.0
REGION4
Northeast. . . . . . . . . . . . . . . . . . . . . . . . . . . . . . . . . . . . . . 942 1,119 1,102 1,066 1,011 1,030 3.4 4.0 3.9 3.8 3.6 3.6
South. . . . . . . . . . . . . . . . . . . . . . . . . . . . . . . . . . . . . . . . . . . 2,079 2,243 2,125 2,174 2,072 2,105 3.8 4.0 3.8 3.9 3.7 3.8
Midwest. . . . . . . . . . . . . . . . . . . . . . . . . . . . . . . . . . . . . . . . 1,263 1,378 1,520 1,595 1,507 1,452 3.8 4.1 4.4 4.7 4.4 4.2
West. . . . . . . . . . . . . . . . . . . . . . . . . . . . . . . . . . . . . . . . . . . . 1,347 1,400 1,343 1,342 1,335 1,292 3.9 4.0 3.9 3.9 3.8 3.7
1 Job openings are the number of job openings on the last business day of the month.2 The job openings rate is the number of job openings on the last business day of the month as a percent of total employment plus job openings.3 No regular seasonal movements could be identified in this series; therefore, identical numbers appear for the unadjusted and seasonally adjusted
series.4 The states (including the District of Columbia) that comprise the regions are: Northeast: Connecticut, Maine, Massachusetts, New Hampshire, New
Jersey, New York, Pennsylvania, Rhode Island, and Vermont; South: Alabama, Arkansas, Delaware, District of Columbia, Florida, Georgia,Kentucky, Louisiana, Maryland, Mississippi, North Carolina, Oklahoma, South Carolina, Tennessee, Texas, Virginia, and West Virginia; Midwest:Illinois, Indiana, Iowa, Kansas, Michigan, Minnesota, Missouri, Nebraska, North Dakota, Ohio, South Dakota, and Wisconsin; West: Alaska, Arizona,California, Colorado, Hawaii, Idaho, Montana, Nevada, New Mexico, Oregon, Utah, Washington, and Wyoming.
p Preliminary
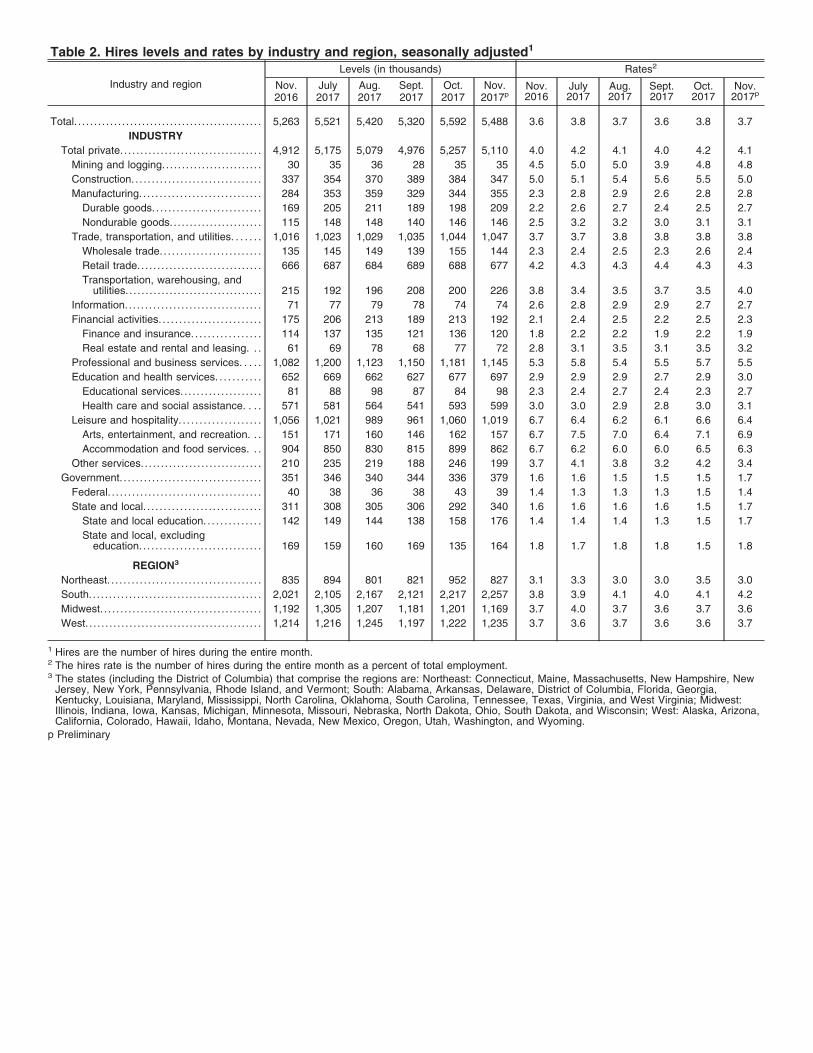
Table 2. Hires levels and rates by industry and region, seasonally adjusted1
Industry and region
Levels (in thousands) Rates2
Nov.2016
July2017
Aug.2017
Sept.2017
Oct.2017
Nov.2017p
Nov.2016
July2017
Aug.2017
Sept.2017
Oct.2017
Nov.2017p
Total. . . . . . . . . . . . . . . . . . . . . . . . . . . . . . . . . . . . . . . . . . . . . . . 5,263 5,521 5,420 5,320 5,592 5,488 3.6 3.8 3.7 3.6 3.8 3.7
INDUSTRY
Total private. . . . . . . . . . . . . . . . . . . . . . . . . . . . . . . . . . . 4,912 5,175 5,079 4,976 5,257 5,110 4.0 4.2 4.1 4.0 4.2 4.1
Mining and logging.. . . . . . . . . . . . . . . . . . . . . . . . 30 35 36 28 35 35 4.5 5.0 5.0 3.9 4.8 4.8
Construction. . . . . . . . . . . . . . . . . . . . . . . . . . . . . . . . 337 354 370 389 384 347 5.0 5.1 5.4 5.6 5.5 5.0
Manufacturing. . . . . . . . . . . . . . . . . . . . . . . . . . . . . . 284 353 359 329 344 355 2.3 2.8 2.9 2.6 2.8 2.8
Durable goods. . . . . . . . . . . . . . . . . . . . . . . . . . . 169 205 211 189 198 209 2.2 2.6 2.7 2.4 2.5 2.7
Nondurable goods.. . . . . . . . . . . . . . . . . . . . . . 115 148 148 140 146 146 2.5 3.2 3.2 3.0 3.1 3.1
Trade, transportation, and utilities. . . . . . . 1,016 1,023 1,029 1,035 1,044 1,047 3.7 3.7 3.8 3.8 3.8 3.8
Wholesale trade. . . . . . . . . . . . . . . . . . . . . . . . . 135 145 149 139 155 144 2.3 2.4 2.5 2.3 2.6 2.4
Retail trade.. . . . . . . . . . . . . . . . . . . . . . . . . . . . . . 666 687 684 689 688 677 4.2 4.3 4.3 4.4 4.3 4.3
Transportation, warehousing, andutilities. . . . . . . . . . . . . . . . . . . . . . . . . . . . . . . . . . 215 192 196 208 200 226 3.8 3.4 3.5 3.7 3.5 4.0
Information. . . . . . . . . . . . . . . . . . . . . . . . . . . . . . . . . . 71 77 79 78 74 74 2.6 2.8 2.9 2.9 2.7 2.7
Financial activities. . . . . . . . . . . . . . . . . . . . . . . . . 175 206 213 189 213 192 2.1 2.4 2.5 2.2 2.5 2.3
Finance and insurance. . . . . . . . . . . . . . . . . 114 137 135 121 136 120 1.8 2.2 2.2 1.9 2.2 1.9
Real estate and rental and leasing. . . 61 69 78 68 77 72 2.8 3.1 3.5 3.1 3.5 3.2
Professional and business services. . . . . 1,082 1,200 1,123 1,150 1,181 1,145 5.3 5.8 5.4 5.5 5.7 5.5
Education and health services. . . . . . . . . . . 652 669 662 627 677 697 2.9 2.9 2.9 2.7 2.9 3.0
Educational services. . . . . . . . . . . . . . . . . . . . 81 88 98 87 84 98 2.3 2.4 2.7 2.4 2.3 2.7
Health care and social assistance. . . . 571 581 564 541 593 599 3.0 3.0 2.9 2.8 3.0 3.1
Leisure and hospitality. . . . . . . . . . . . . . . . . . . . 1,056 1,021 989 961 1,060 1,019 6.7 6.4 6.2 6.1 6.6 6.4
Arts, entertainment, and recreation. . . 151 171 160 146 162 157 6.7 7.5 7.0 6.4 7.1 6.9
Accommodation and food services. . . 904 850 830 815 899 862 6.7 6.2 6.0 6.0 6.5 6.3
Other services. . . . . . . . . . . . . . . . . . . . . . . . . . . . . . 210 235 219 188 246 199 3.7 4.1 3.8 3.2 4.2 3.4
Government. . . . . . . . . . . . . . . . . . . . . . . . . . . . . . . . . . . 351 346 340 344 336 379 1.6 1.6 1.5 1.5 1.5 1.7
Federal. . . . . . . . . . . . . . . . . . . . . . . . . . . . . . . . . . . . . . 40 38 36 38 43 39 1.4 1.3 1.3 1.3 1.5 1.4
State and local. . . . . . . . . . . . . . . . . . . . . . . . . . . . . 311 308 305 306 292 340 1.6 1.6 1.6 1.6 1.5 1.7
State and local education. . . . . . . . . . . . . . 142 149 144 138 158 176 1.4 1.4 1.4 1.3 1.5 1.7
State and local, excludingeducation. . . . . . . . . . . . . . . . . . . . . . . . . . . . . . 169 159 160 169 135 164 1.8 1.7 1.8 1.8 1.5 1.8
REGION3
Northeast. . . . . . . . . . . . . . . . . . . . . . . . . . . . . . . . . . . . . . 835 894 801 821 952 827 3.1 3.3 3.0 3.0 3.5 3.0
South. . . . . . . . . . . . . . . . . . . . . . . . . . . . . . . . . . . . . . . . . . . 2,021 2,105 2,167 2,121 2,217 2,257 3.8 3.9 4.1 4.0 4.1 4.2
Midwest. . . . . . . . . . . . . . . . . . . . . . . . . . . . . . . . . . . . . . . . 1,192 1,305 1,207 1,181 1,201 1,169 3.7 4.0 3.7 3.6 3.7 3.6
West. . . . . . . . . . . . . . . . . . . . . . . . . . . . . . . . . . . . . . . . . . . . 1,214 1,216 1,245 1,197 1,222 1,235 3.7 3.6 3.7 3.6 3.6 3.7
1 Hires are the number of hires during the entire month.2 The hires rate is the number of hires during the entire month as a percent of total employment.3 The states (including the District of Columbia) that comprise the regions are: Northeast: Connecticut, Maine, Massachusetts, New Hampshire, New
Jersey, New York, Pennsylvania, Rhode Island, and Vermont; South: Alabama, Arkansas, Delaware, District of Columbia, Florida, Georgia,Kentucky, Louisiana, Maryland, Mississippi, North Carolina, Oklahoma, South Carolina, Tennessee, Texas, Virginia, and West Virginia; Midwest:Illinois, Indiana, Iowa, Kansas, Michigan, Minnesota, Missouri, Nebraska, North Dakota, Ohio, South Dakota, and Wisconsin; West: Alaska, Arizona,California, Colorado, Hawaii, Idaho, Montana, Nevada, New Mexico, Oregon, Utah, Washington, and Wyoming.
p Preliminary
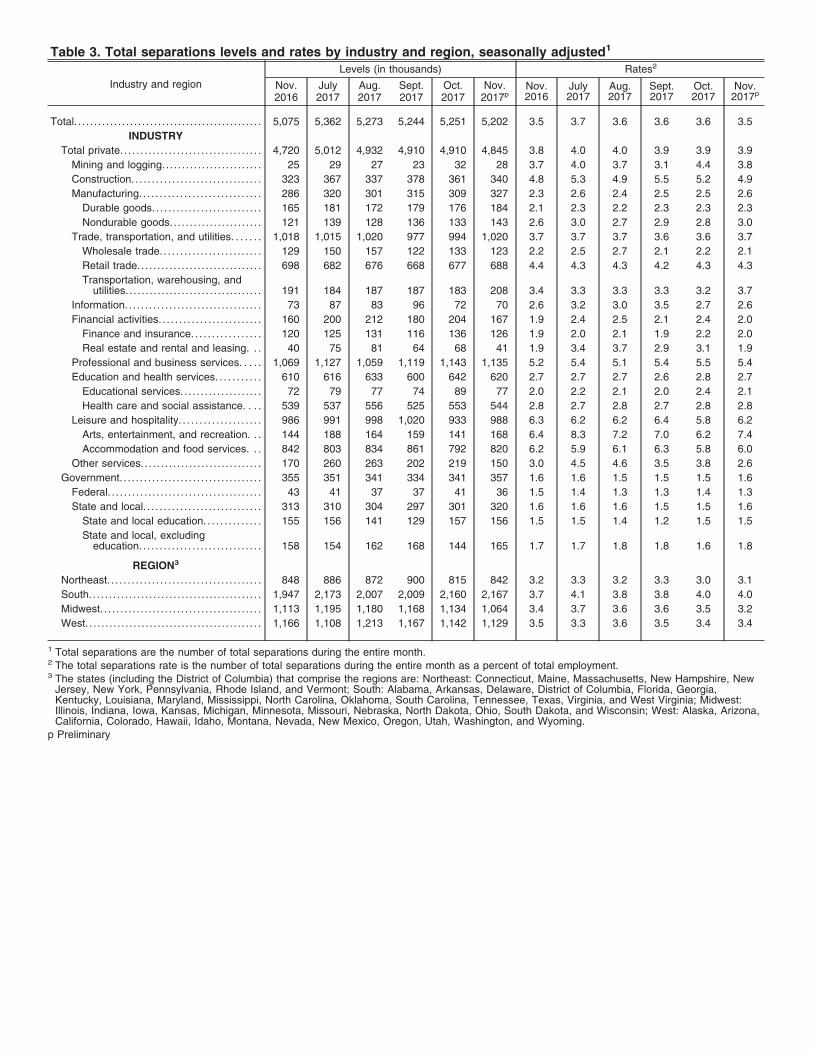
Table 3. Total separations levels and rates by industry and region, seasonally adjusted1
Industry and region
Levels (in thousands) Rates2
Nov.2016
July2017
Aug.2017
Sept.2017
Oct.2017
Nov.2017p
Nov.2016
July2017
Aug.2017
Sept.2017
Oct.2017
Nov.2017p
Total. . . . . . . . . . . . . . . . . . . . . . . . . . . . . . . . . . . . . . . . . . . . . . . 5,075 5,362 5,273 5,244 5,251 5,202 3.5 3.7 3.6 3.6 3.6 3.5
INDUSTRY
Total private. . . . . . . . . . . . . . . . . . . . . . . . . . . . . . . . . . . 4,720 5,012 4,932 4,910 4,910 4,845 3.8 4.0 4.0 3.9 3.9 3.9
Mining and logging.. . . . . . . . . . . . . . . . . . . . . . . . 25 29 27 23 32 28 3.7 4.0 3.7 3.1 4.4 3.8
Construction. . . . . . . . . . . . . . . . . . . . . . . . . . . . . . . . 323 367 337 378 361 340 4.8 5.3 4.9 5.5 5.2 4.9
Manufacturing. . . . . . . . . . . . . . . . . . . . . . . . . . . . . . 286 320 301 315 309 327 2.3 2.6 2.4 2.5 2.5 2.6
Durable goods. . . . . . . . . . . . . . . . . . . . . . . . . . . 165 181 172 179 176 184 2.1 2.3 2.2 2.3 2.3 2.3
Nondurable goods.. . . . . . . . . . . . . . . . . . . . . . 121 139 128 136 133 143 2.6 3.0 2.7 2.9 2.8 3.0
Trade, transportation, and utilities. . . . . . . 1,018 1,015 1,020 977 994 1,020 3.7 3.7 3.7 3.6 3.6 3.7
Wholesale trade. . . . . . . . . . . . . . . . . . . . . . . . . 129 150 157 122 133 123 2.2 2.5 2.7 2.1 2.2 2.1
Retail trade.. . . . . . . . . . . . . . . . . . . . . . . . . . . . . . 698 682 676 668 677 688 4.4 4.3 4.3 4.2 4.3 4.3
Transportation, warehousing, andutilities. . . . . . . . . . . . . . . . . . . . . . . . . . . . . . . . . . 191 184 187 187 183 208 3.4 3.3 3.3 3.3 3.2 3.7
Information. . . . . . . . . . . . . . . . . . . . . . . . . . . . . . . . . . 73 87 83 96 72 70 2.6 3.2 3.0 3.5 2.7 2.6
Financial activities. . . . . . . . . . . . . . . . . . . . . . . . . 160 200 212 180 204 167 1.9 2.4 2.5 2.1 2.4 2.0
Finance and insurance. . . . . . . . . . . . . . . . . 120 125 131 116 136 126 1.9 2.0 2.1 1.9 2.2 2.0
Real estate and rental and leasing. . . 40 75 81 64 68 41 1.9 3.4 3.7 2.9 3.1 1.9
Professional and business services. . . . . 1,069 1,127 1,059 1,119 1,143 1,135 5.2 5.4 5.1 5.4 5.5 5.4
Education and health services. . . . . . . . . . . 610 616 633 600 642 620 2.7 2.7 2.7 2.6 2.8 2.7
Educational services. . . . . . . . . . . . . . . . . . . . 72 79 77 74 89 77 2.0 2.2 2.1 2.0 2.4 2.1
Health care and social assistance. . . . 539 537 556 525 553 544 2.8 2.7 2.8 2.7 2.8 2.8
Leisure and hospitality. . . . . . . . . . . . . . . . . . . . 986 991 998 1,020 933 988 6.3 6.2 6.2 6.4 5.8 6.2
Arts, entertainment, and recreation. . . 144 188 164 159 141 168 6.4 8.3 7.2 7.0 6.2 7.4
Accommodation and food services. . . 842 803 834 861 792 820 6.2 5.9 6.1 6.3 5.8 6.0
Other services. . . . . . . . . . . . . . . . . . . . . . . . . . . . . . 170 260 263 202 219 150 3.0 4.5 4.6 3.5 3.8 2.6
Government. . . . . . . . . . . . . . . . . . . . . . . . . . . . . . . . . . . 355 351 341 334 341 357 1.6 1.6 1.5 1.5 1.5 1.6
Federal. . . . . . . . . . . . . . . . . . . . . . . . . . . . . . . . . . . . . . 43 41 37 37 41 36 1.5 1.4 1.3 1.3 1.4 1.3
State and local. . . . . . . . . . . . . . . . . . . . . . . . . . . . . 313 310 304 297 301 320 1.6 1.6 1.6 1.5 1.5 1.6
State and local education. . . . . . . . . . . . . . 155 156 141 129 157 156 1.5 1.5 1.4 1.2 1.5 1.5
State and local, excludingeducation. . . . . . . . . . . . . . . . . . . . . . . . . . . . . . 158 154 162 168 144 165 1.7 1.7 1.8 1.8 1.6 1.8
REGION3
Northeast. . . . . . . . . . . . . . . . . . . . . . . . . . . . . . . . . . . . . . 848 886 872 900 815 842 3.2 3.3 3.2 3.3 3.0 3.1
South. . . . . . . . . . . . . . . . . . . . . . . . . . . . . . . . . . . . . . . . . . . 1,947 2,173 2,007 2,009 2,160 2,167 3.7 4.1 3.8 3.8 4.0 4.0
Midwest. . . . . . . . . . . . . . . . . . . . . . . . . . . . . . . . . . . . . . . . 1,113 1,195 1,180 1,168 1,134 1,064 3.4 3.7 3.6 3.6 3.5 3.2
West. . . . . . . . . . . . . . . . . . . . . . . . . . . . . . . . . . . . . . . . . . . . 1,166 1,108 1,213 1,167 1,142 1,129 3.5 3.3 3.6 3.5 3.4 3.4
1 Total separations are the number of total separations during the entire month.2 The total separations rate is the number of total separations during the entire month as a percent of total employment.3 The states (including the District of Columbia) that comprise the regions are: Northeast: Connecticut, Maine, Massachusetts, New Hampshire, New
Jersey, New York, Pennsylvania, Rhode Island, and Vermont; South: Alabama, Arkansas, Delaware, District of Columbia, Florida, Georgia,Kentucky, Louisiana, Maryland, Mississippi, North Carolina, Oklahoma, South Carolina, Tennessee, Texas, Virginia, and West Virginia; Midwest:Illinois, Indiana, Iowa, Kansas, Michigan, Minnesota, Missouri, Nebraska, North Dakota, Ohio, South Dakota, and Wisconsin; West: Alaska, Arizona,California, Colorado, Hawaii, Idaho, Montana, Nevada, New Mexico, Oregon, Utah, Washington, and Wyoming.
p Preliminary

Table 4. Quits levels and rates by industry and region, seasonally adjusted1
Industry and region
Levels (in thousands) Rates2
Nov.2016
July2017
Aug.2017
Sept.2017
Oct.2017
Nov.2017p
Nov.2016
July2017
Aug.2017
Sept.2017
Oct.2017
Nov.2017p
Total. . . . . . . . . . . . . . . . . . . . . . . . . . . . . . . . . . . . . . . . . . . . . . . 3,080 3,194 3,093 3,180 3,187 3,174 2.1 2.2 2.1 2.2 2.2 2.2
INDUSTRY
Total private. . . . . . . . . . . . . . . . . . . . . . . . . . . . . . . . . . . 2,909 3,023 2,929 3,014 3,020 2,983 2.4 2.4 2.4 2.4 2.4 2.4
Mining and logging.. . . . . . . . . . . . . . . . . . . . . . . . 13 18 11 15 20 14 2.0 2.5 1.5 2.1 2.8 2.0
Construction. . . . . . . . . . . . . . . . . . . . . . . . . . . . . . . . 150 141 140 154 164 153 2.2 2.0 2.0 2.2 2.4 2.2
Manufacturing. . . . . . . . . . . . . . . . . . . . . . . . . . . . . . 164 191 185 189 192 199 1.3 1.5 1.5 1.5 1.5 1.6
Durable goods. . . . . . . . . . . . . . . . . . . . . . . . . . . 93 109 98 107 109 112 1.2 1.4 1.3 1.4 1.4 1.4
Nondurable goods.. . . . . . . . . . . . . . . . . . . . . . 71 82 86 81 83 86 1.5 1.8 1.8 1.7 1.8 1.8
Trade, transportation, and utilities. . . . . . . 655 662 639 619 655 656 2.4 2.4 2.3 2.3 2.4 2.4
Wholesale trade. . . . . . . . . . . . . . . . . . . . . . . . . 87 91 85 82 93 87 1.5 1.5 1.4 1.4 1.6 1.5
Retail trade.. . . . . . . . . . . . . . . . . . . . . . . . . . . . . . 460 456 456 435 455 437 2.9 2.9 2.9 2.7 2.9 2.8
Transportation, warehousing, andutilities. . . . . . . . . . . . . . . . . . . . . . . . . . . . . . . . . . 108 115 98 101 107 132 1.9 2.1 1.7 1.8 1.9 2.3
Information. . . . . . . . . . . . . . . . . . . . . . . . . . . . . . . . . . 35 58 46 55 46 41 1.3 2.1 1.7 2.0 1.7 1.5
Financial activities. . . . . . . . . . . . . . . . . . . . . . . . . 85 116 118 112 121 108 1.0 1.4 1.4 1.3 1.4 1.3
Finance and insurance. . . . . . . . . . . . . . . . . 66 75 73 78 78 86 1.1 1.2 1.2 1.2 1.2 1.4
Real estate and rental and leasing3.. . 19 41 45 34 43 22 0.9 1.9 2.0 1.5 1.9 1.0
Professional and business services. . . . . 635 615 590 663 657 698 3.1 3.0 2.8 3.2 3.1 3.3
Education and health services. . . . . . . . . . . 395 391 395 403 437 412 1.7 1.7 1.7 1.7 1.9 1.8
Educational services. . . . . . . . . . . . . . . . . . . . 44 42 47 43 44 45 1.2 1.2 1.3 1.2 1.2 1.2
Health care and social assistance. . . . 351 349 349 360 393 367 1.8 1.8 1.8 1.8 2.0 1.9
Leisure and hospitality. . . . . . . . . . . . . . . . . . . . 693 666 639 675 619 643 4.4 4.2 4.0 4.2 3.9 4.0
Arts, entertainment, and recreation. . . 77 66 60 48 61 71 3.4 2.9 2.7 2.1 2.7 3.1
Accommodation and food services. . . 616 601 579 627 557 572 4.6 4.4 4.2 4.6 4.1 4.2
Other services3. . . . . . . . . . . . . . . . . . . . . . . . . . . . . 83 165 166 131 109 60 1.5 2.9 2.9 2.3 1.9 1.0
Government. . . . . . . . . . . . . . . . . . . . . . . . . . . . . . . . . . . 171 171 164 166 167 192 0.8 0.8 0.7 0.7 0.7 0.9
Federal. . . . . . . . . . . . . . . . . . . . . . . . . . . . . . . . . . . . . . 17 14 15 15 15 16 0.6 0.5 0.5 0.5 0.6 0.6
State and local. . . . . . . . . . . . . . . . . . . . . . . . . . . . . 154 157 149 151 152 175 0.8 0.8 0.8 0.8 0.8 0.9
State and local education. . . . . . . . . . . . . . 80 81 75 69 81 89 0.8 0.8 0.7 0.7 0.8 0.9
State and local, excludingeducation. . . . . . . . . . . . . . . . . . . . . . . . . . . . . . 73 75 73 82 71 86 0.8 0.8 0.8 0.9 0.8 0.9
REGION4
Northeast. . . . . . . . . . . . . . . . . . . . . . . . . . . . . . . . . . . . . . 475 445 447 434 431 444 1.8 1.6 1.6 1.6 1.6 1.6
South. . . . . . . . . . . . . . . . . . . . . . . . . . . . . . . . . . . . . . . . . . . 1,207 1,372 1,205 1,273 1,395 1,327 2.3 2.6 2.3 2.4 2.6 2.5
Midwest. . . . . . . . . . . . . . . . . . . . . . . . . . . . . . . . . . . . . . . . 695 700 688 755 660 681 2.2 2.1 2.1 2.3 2.0 2.1
West. . . . . . . . . . . . . . . . . . . . . . . . . . . . . . . . . . . . . . . . . . . . 703 677 752 718 700 722 2.1 2.0 2.2 2.1 2.1 2.1
1 Quits are the number of quits during the entire month.2 The quits rate is the number of quits during the entire month as a percent of total employment.3 No regular seasonal movements could be identified in this series; therefore, identical numbers appear for the unadjusted and seasonally adjusted
series.4 The states (including the District of Columbia) that comprise the regions are: Northeast: Connecticut, Maine, Massachusetts, New Hampshire, New
Jersey, New York, Pennsylvania, Rhode Island, and Vermont; South: Alabama, Arkansas, Delaware, District of Columbia, Florida, Georgia,Kentucky, Louisiana, Maryland, Mississippi, North Carolina, Oklahoma, South Carolina, Tennessee, Texas, Virginia, and West Virginia; Midwest:Illinois, Indiana, Iowa, Kansas, Michigan, Minnesota, Missouri, Nebraska, North Dakota, Ohio, South Dakota, and Wisconsin; West: Alaska, Arizona,California, Colorado, Hawaii, Idaho, Montana, Nevada, New Mexico, Oregon, Utah, Washington, and Wyoming.
p Preliminary
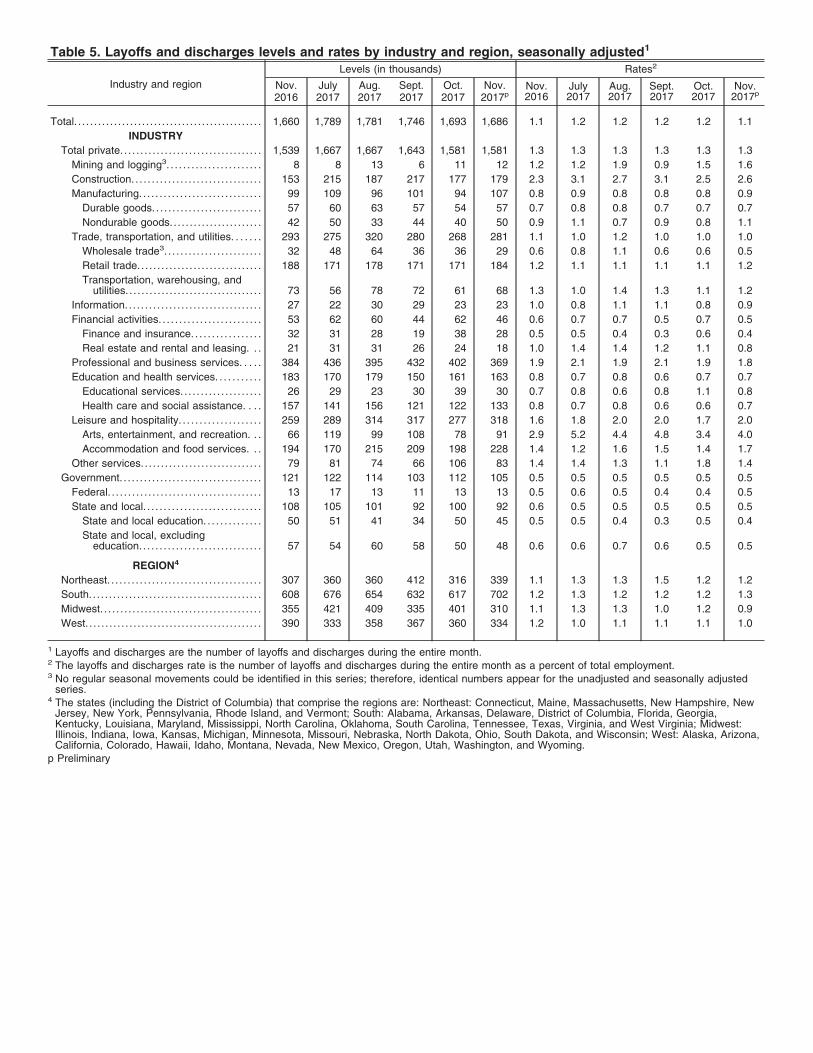
Table 5. Layoffs and discharges levels and rates by industry and region, seasonally adjusted1
Industry and region
Levels (in thousands) Rates2
Nov.2016
July2017
Aug.2017
Sept.2017
Oct.2017
Nov.2017p
Nov.2016
July2017
Aug.2017
Sept.2017
Oct.2017
Nov.2017p
Total. . . . . . . . . . . . . . . . . . . . . . . . . . . . . . . . . . . . . . . . . . . . . . . 1,660 1,789 1,781 1,746 1,693 1,686 1.1 1.2 1.2 1.2 1.2 1.1
INDUSTRY
Total private. . . . . . . . . . . . . . . . . . . . . . . . . . . . . . . . . . . 1,539 1,667 1,667 1,643 1,581 1,581 1.3 1.3 1.3 1.3 1.3 1.3
Mining and logging3. . . . . . . . . . . . . . . . . . . . . . . 8 8 13 6 11 12 1.2 1.2 1.9 0.9 1.5 1.6
Construction. . . . . . . . . . . . . . . . . . . . . . . . . . . . . . . . 153 215 187 217 177 179 2.3 3.1 2.7 3.1 2.5 2.6
Manufacturing. . . . . . . . . . . . . . . . . . . . . . . . . . . . . . 99 109 96 101 94 107 0.8 0.9 0.8 0.8 0.8 0.9
Durable goods. . . . . . . . . . . . . . . . . . . . . . . . . . . 57 60 63 57 54 57 0.7 0.8 0.8 0.7 0.7 0.7
Nondurable goods.. . . . . . . . . . . . . . . . . . . . . . 42 50 33 44 40 50 0.9 1.1 0.7 0.9 0.8 1.1
Trade, transportation, and utilities. . . . . . . 293 275 320 280 268 281 1.1 1.0 1.2 1.0 1.0 1.0
Wholesale trade3. . . . . . . . . . . . . . . . . . . . . . . . 32 48 64 36 36 29 0.6 0.8 1.1 0.6 0.6 0.5
Retail trade.. . . . . . . . . . . . . . . . . . . . . . . . . . . . . . 188 171 178 171 171 184 1.2 1.1 1.1 1.1 1.1 1.2
Transportation, warehousing, andutilities. . . . . . . . . . . . . . . . . . . . . . . . . . . . . . . . . . 73 56 78 72 61 68 1.3 1.0 1.4 1.3 1.1 1.2
Information. . . . . . . . . . . . . . . . . . . . . . . . . . . . . . . . . . 27 22 30 29 23 23 1.0 0.8 1.1 1.1 0.8 0.9
Financial activities. . . . . . . . . . . . . . . . . . . . . . . . . 53 62 60 44 62 46 0.6 0.7 0.7 0.5 0.7 0.5
Finance and insurance. . . . . . . . . . . . . . . . . 32 31 28 19 38 28 0.5 0.5 0.4 0.3 0.6 0.4
Real estate and rental and leasing. . . 21 31 31 26 24 18 1.0 1.4 1.4 1.2 1.1 0.8
Professional and business services. . . . . 384 436 395 432 402 369 1.9 2.1 1.9 2.1 1.9 1.8
Education and health services. . . . . . . . . . . 183 170 179 150 161 163 0.8 0.7 0.8 0.6 0.7 0.7
Educational services. . . . . . . . . . . . . . . . . . . . 26 29 23 30 39 30 0.7 0.8 0.6 0.8 1.1 0.8
Health care and social assistance. . . . 157 141 156 121 122 133 0.8 0.7 0.8 0.6 0.6 0.7
Leisure and hospitality. . . . . . . . . . . . . . . . . . . . 259 289 314 317 277 318 1.6 1.8 2.0 2.0 1.7 2.0
Arts, entertainment, and recreation. . . 66 119 99 108 78 91 2.9 5.2 4.4 4.8 3.4 4.0
Accommodation and food services. . . 194 170 215 209 198 228 1.4 1.2 1.6 1.5 1.4 1.7
Other services. . . . . . . . . . . . . . . . . . . . . . . . . . . . . . 79 81 74 66 106 83 1.4 1.4 1.3 1.1 1.8 1.4
Government. . . . . . . . . . . . . . . . . . . . . . . . . . . . . . . . . . . 121 122 114 103 112 105 0.5 0.5 0.5 0.5 0.5 0.5
Federal. . . . . . . . . . . . . . . . . . . . . . . . . . . . . . . . . . . . . . 13 17 13 11 13 13 0.5 0.6 0.5 0.4 0.4 0.5
State and local. . . . . . . . . . . . . . . . . . . . . . . . . . . . . 108 105 101 92 100 92 0.6 0.5 0.5 0.5 0.5 0.5
State and local education. . . . . . . . . . . . . . 50 51 41 34 50 45 0.5 0.5 0.4 0.3 0.5 0.4
State and local, excludingeducation. . . . . . . . . . . . . . . . . . . . . . . . . . . . . . 57 54 60 58 50 48 0.6 0.6 0.7 0.6 0.5 0.5
REGION4
Northeast. . . . . . . . . . . . . . . . . . . . . . . . . . . . . . . . . . . . . . 307 360 360 412 316 339 1.1 1.3 1.3 1.5 1.2 1.2
South. . . . . . . . . . . . . . . . . . . . . . . . . . . . . . . . . . . . . . . . . . . 608 676 654 632 617 702 1.2 1.3 1.2 1.2 1.2 1.3
Midwest. . . . . . . . . . . . . . . . . . . . . . . . . . . . . . . . . . . . . . . . 355 421 409 335 401 310 1.1 1.3 1.3 1.0 1.2 0.9
West. . . . . . . . . . . . . . . . . . . . . . . . . . . . . . . . . . . . . . . . . . . . 390 333 358 367 360 334 1.2 1.0 1.1 1.1 1.1 1.0
1 Layoffs and discharges are the number of layoffs and discharges during the entire month.2 The layoffs and discharges rate is the number of layoffs and discharges during the entire month as a percent of total employment.3 No regular seasonal movements could be identified in this series; therefore, identical numbers appear for the unadjusted and seasonally adjusted
series.4 The states (including the District of Columbia) that comprise the regions are: Northeast: Connecticut, Maine, Massachusetts, New Hampshire, New
Jersey, New York, Pennsylvania, Rhode Island, and Vermont; South: Alabama, Arkansas, Delaware, District of Columbia, Florida, Georgia,Kentucky, Louisiana, Maryland, Mississippi, North Carolina, Oklahoma, South Carolina, Tennessee, Texas, Virginia, and West Virginia; Midwest:Illinois, Indiana, Iowa, Kansas, Michigan, Minnesota, Missouri, Nebraska, North Dakota, Ohio, South Dakota, and Wisconsin; West: Alaska, Arizona,California, Colorado, Hawaii, Idaho, Montana, Nevada, New Mexico, Oregon, Utah, Washington, and Wyoming.
p Preliminary
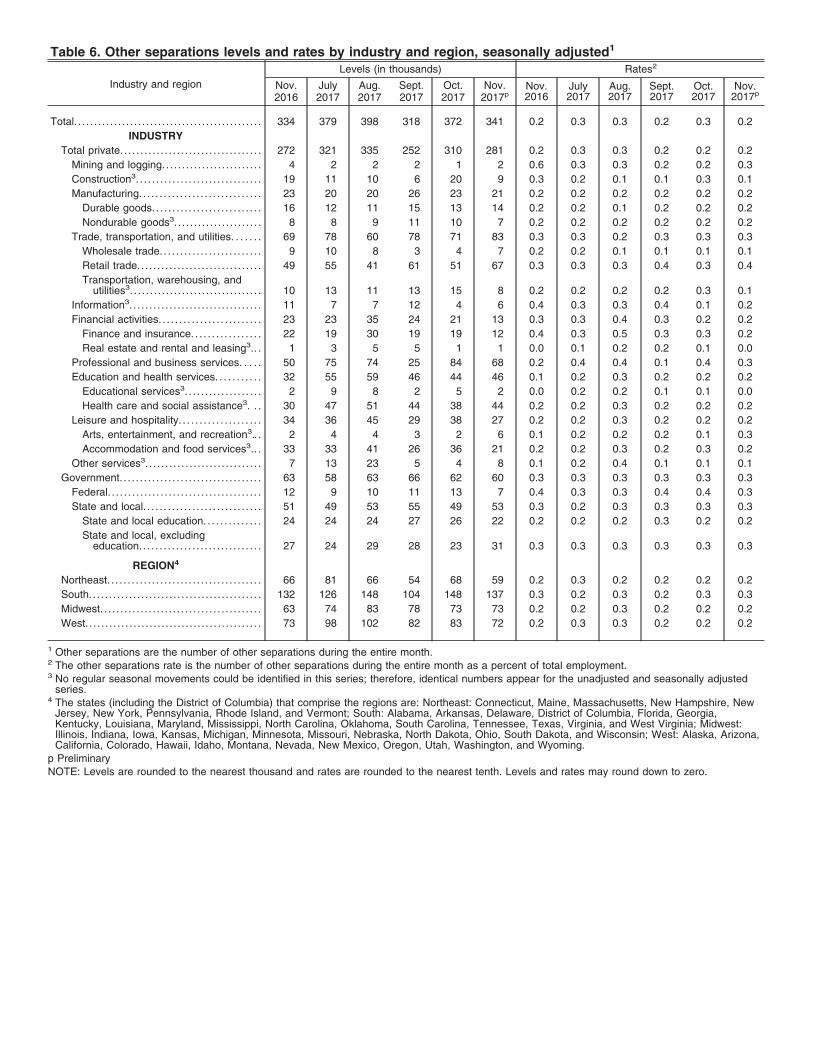
Table 6. Other separations levels and rates by industry and region, seasonally adjusted1
Industry and region
Levels (in thousands) Rates2
Nov.2016
July2017
Aug.2017
Sept.2017
Oct.2017
Nov.2017p
Nov.2016
July2017
Aug.2017
Sept.2017
Oct.2017
Nov.2017p
Total. . . . . . . . . . . . . . . . . . . . . . . . . . . . . . . . . . . . . . . . . . . . . . . 334 379 398 318 372 341 0.2 0.3 0.3 0.2 0.3 0.2
INDUSTRY
Total private. . . . . . . . . . . . . . . . . . . . . . . . . . . . . . . . . . . 272 321 335 252 310 281 0.2 0.3 0.3 0.2 0.2 0.2
Mining and logging.. . . . . . . . . . . . . . . . . . . . . . . . 4 2 2 2 1 2 0.6 0.3 0.3 0.2 0.2 0.3
Construction3. . . . . . . . . . . . . . . . . . . . . . . . . . . . . . . 19 11 10 6 20 9 0.3 0.2 0.1 0.1 0.3 0.1
Manufacturing. . . . . . . . . . . . . . . . . . . . . . . . . . . . . . 23 20 20 26 23 21 0.2 0.2 0.2 0.2 0.2 0.2
Durable goods. . . . . . . . . . . . . . . . . . . . . . . . . . . 16 12 11 15 13 14 0.2 0.2 0.1 0.2 0.2 0.2
Nondurable goods3. . . . . . . . . . . . . . . . . . . . . . 8 8 9 11 10 7 0.2 0.2 0.2 0.2 0.2 0.2
Trade, transportation, and utilities. . . . . . . 69 78 60 78 71 83 0.3 0.3 0.2 0.3 0.3 0.3
Wholesale trade. . . . . . . . . . . . . . . . . . . . . . . . . 9 10 8 3 4 7 0.2 0.2 0.1 0.1 0.1 0.1
Retail trade.. . . . . . . . . . . . . . . . . . . . . . . . . . . . . . 49 55 41 61 51 67 0.3 0.3 0.3 0.4 0.3 0.4
Transportation, warehousing, andutilities3. . . . . . . . . . . . . . . . . . . . . . . . . . . . . . . . . 10 13 11 13 15 8 0.2 0.2 0.2 0.2 0.3 0.1
Information3. . . . . . . . . . . . . . . . . . . . . . . . . . . . . . . . . 11 7 7 12 4 6 0.4 0.3 0.3 0.4 0.1 0.2
Financial activities. . . . . . . . . . . . . . . . . . . . . . . . . 23 23 35 24 21 13 0.3 0.3 0.4 0.3 0.2 0.2
Finance and insurance. . . . . . . . . . . . . . . . . 22 19 30 19 19 12 0.4 0.3 0.5 0.3 0.3 0.2
Real estate and rental and leasing3.. . 1 3 5 5 1 1 0.0 0.1 0.2 0.2 0.1 0.0
Professional and business services. . . . . 50 75 74 25 84 68 0.2 0.4 0.4 0.1 0.4 0.3
Education and health services. . . . . . . . . . . 32 55 59 46 44 46 0.1 0.2 0.3 0.2 0.2 0.2
Educational services3. . . . . . . . . . . . . . . . . . . 2 9 8 2 5 2 0.0 0.2 0.2 0.1 0.1 0.0
Health care and social assistance3. . . 30 47 51 44 38 44 0.2 0.2 0.3 0.2 0.2 0.2
Leisure and hospitality. . . . . . . . . . . . . . . . . . . . 34 36 45 29 38 27 0.2 0.2 0.3 0.2 0.2 0.2
Arts, entertainment, and recreation3.. . 2 4 4 3 2 6 0.1 0.2 0.2 0.2 0.1 0.3
Accommodation and food services3.. . 33 33 41 26 36 21 0.2 0.2 0.3 0.2 0.3 0.2
Other services3. . . . . . . . . . . . . . . . . . . . . . . . . . . . . 7 13 23 5 4 8 0.1 0.2 0.4 0.1 0.1 0.1
Government. . . . . . . . . . . . . . . . . . . . . . . . . . . . . . . . . . . 63 58 63 66 62 60 0.3 0.3 0.3 0.3 0.3 0.3
Federal. . . . . . . . . . . . . . . . . . . . . . . . . . . . . . . . . . . . . . 12 9 10 11 13 7 0.4 0.3 0.3 0.4 0.4 0.3
State and local. . . . . . . . . . . . . . . . . . . . . . . . . . . . . 51 49 53 55 49 53 0.3 0.2 0.3 0.3 0.3 0.3
State and local education. . . . . . . . . . . . . . 24 24 24 27 26 22 0.2 0.2 0.2 0.3 0.2 0.2
State and local, excludingeducation. . . . . . . . . . . . . . . . . . . . . . . . . . . . . . 27 24 29 28 23 31 0.3 0.3 0.3 0.3 0.3 0.3
REGION4
Northeast. . . . . . . . . . . . . . . . . . . . . . . . . . . . . . . . . . . . . . 66 81 66 54 68 59 0.2 0.3 0.2 0.2 0.2 0.2
South. . . . . . . . . . . . . . . . . . . . . . . . . . . . . . . . . . . . . . . . . . . 132 126 148 104 148 137 0.3 0.2 0.3 0.2 0.3 0.3
Midwest. . . . . . . . . . . . . . . . . . . . . . . . . . . . . . . . . . . . . . . . 63 74 83 78 73 73 0.2 0.2 0.3 0.2 0.2 0.2
West. . . . . . . . . . . . . . . . . . . . . . . . . . . . . . . . . . . . . . . . . . . . 73 98 102 82 83 72 0.2 0.3 0.3 0.2 0.2 0.2
1 Other separations are the number of other separations during the entire month.2 The other separations rate is the number of other separations during the entire month as a percent of total employment.3 No regular seasonal movements could be identified in this series; therefore, identical numbers appear for the unadjusted and seasonally adjusted
series.4 The states (including the District of Columbia) that comprise the regions are: Northeast: Connecticut, Maine, Massachusetts, New Hampshire, New
Jersey, New York, Pennsylvania, Rhode Island, and Vermont; South: Alabama, Arkansas, Delaware, District of Columbia, Florida, Georgia,Kentucky, Louisiana, Maryland, Mississippi, North Carolina, Oklahoma, South Carolina, Tennessee, Texas, Virginia, and West Virginia; Midwest:Illinois, Indiana, Iowa, Kansas, Michigan, Minnesota, Missouri, Nebraska, North Dakota, Ohio, South Dakota, and Wisconsin; West: Alaska, Arizona,California, Colorado, Hawaii, Idaho, Montana, Nevada, New Mexico, Oregon, Utah, Washington, and Wyoming.
p Preliminary
NOTE: Levels are rounded to the nearest thousand and rates are rounded to the nearest tenth. Levels and rates may round down to zero.

Table 7. Job openings levels and rates by industry and region, not seasonally adjusted1
Industry and region
Levels (in thousands) Rates2
Nov.2016
Oct.2017
Nov.2017p
Nov.2016
Oct.2017
Nov.2017p
Total. . . . . . . . . . . . . . . . . . . . . . . . . . . . . . . . . . . . . . . . . . . . . . . . . . . . . . . . . . . . . . . . . . . . . 5,379 6,177 5,661 3.5 4.0 3.7
INDUSTRY
Total private. . . . . . . . . . . . . . . . . . . . . . . . . . . . . . . . . . . . . . . . . . . . . . . . . . . . . . . . . . 4,815 5,668 5,154 3.7 4.3 3.9
Mining and logging. . . . . . . . . . . . . . . . . . . . . . . . . . . . . . . . . . . . . . . . . . . . . . . 16 27 22 2.3 3.6 2.9
Construction.. . . . . . . . . . . . . . . . . . . . . . . . . . . . . . . . . . . . . . . . . . . . . . . . . . . . . . 178 195 210 2.5 2.7 2.9
Manufacturing. . . . . . . . . . . . . . . . . . . . . . . . . . . . . . . . . . . . . . . . . . . . . . . . . . . . . 319 409 378 2.5 3.2 2.9
Durable goods.. . . . . . . . . . . . . . . . . . . . . . . . . . . . . . . . . . . . . . . . . . . . . . . . . 186 247 231 2.4 3.1 2.9
Nondurable goods. . . . . . . . . . . . . . . . . . . . . . . . . . . . . . . . . . . . . . . . . . . . . 133 162 147 2.8 3.3 3.0
Trade, transportation, and utilities. . . . . . . . . . . . . . . . . . . . . . . . . . . . . . 956 1,051 998 3.3 3.7 3.4
Wholesale trade.. . . . . . . . . . . . . . . . . . . . . . . . . . . . . . . . . . . . . . . . . . . . . . . 203 135 167 3.3 2.2 2.7
Retail trade. . . . . . . . . . . . . . . . . . . . . . . . . . . . . . . . . . . . . . . . . . . . . . . . . . . . . 575 706 681 3.4 4.3 4.0
Transportation, warehousing, and utilities. . . . . . . . . . . . . . . . . . 178 210 150 3.0 3.5 2.5
Information. . . . . . . . . . . . . . . . . . . . . . . . . . . . . . . . . . . . . . . . . . . . . . . . . . . . . . . . 73 74 78 2.6 2.6 2.8
Financial activities. . . . . . . . . . . . . . . . . . . . . . . . . . . . . . . . . . . . . . . . . . . . . . . . 307 391 368 3.6 4.4 4.2
Finance and insurance.. . . . . . . . . . . . . . . . . . . . . . . . . . . . . . . . . . . . . . . 246 274 291 3.8 4.2 4.4
Real estate and rental and leasing. . . . . . . . . . . . . . . . . . . . . . . . . . 61 116 77 2.7 5.0 3.4
Professional and business services. . . . . . . . . . . . . . . . . . . . . . . . . . . . 1,004 1,191 1,041 4.7 5.3 4.7
Education and health services. . . . . . . . . . . . . . . . . . . . . . . . . . . . . . . . . . 1,093 1,168 1,046 4.5 4.7 4.3
Educational services. . . . . . . . . . . . . . . . . . . . . . . . . . . . . . . . . . . . . . . . . . 86 94 94 2.2 2.4 2.4
Health care and social assistance.. . . . . . . . . . . . . . . . . . . . . . . . . . 1,007 1,074 952 5.0 5.2 4.6
Leisure and hospitality. . . . . . . . . . . . . . . . . . . . . . . . . . . . . . . . . . . . . . . . . . . 677 867 779 4.2 5.2 4.7
Arts, entertainment, and recreation.. . . . . . . . . . . . . . . . . . . . . . . . . 82 82 56 3.8 3.5 2.6
Accommodation and food services. . . . . . . . . . . . . . . . . . . . . . . . . . 595 785 723 4.3 5.4 5.0
Other services. . . . . . . . . . . . . . . . . . . . . . . . . . . . . . . . . . . . . . . . . . . . . . . . . . . . 192 296 232 3.2 4.9 3.9
Government. . . . . . . . . . . . . . . . . . . . . . . . . . . . . . . . . . . . . . . . . . . . . . . . . . . . . . . . . . 564 509 507 2.4 2.2 2.2
Federal. . . . . . . . . . . . . . . . . . . . . . . . . . . . . . . . . . . . . . . . . . . . . . . . . . . . . . . . . . . . . 82 73 66 2.8 2.5 2.3
State and local. . . . . . . . . . . . . . . . . . . . . . . . . . . . . . . . . . . . . . . . . . . . . . . . . . . . 482 436 441 2.4 2.1 2.2
State and local education.. . . . . . . . . . . . . . . . . . . . . . . . . . . . . . . . . . . . 139 158 156 1.3 1.4 1.4
State and local, excluding education. . . . . . . . . . . . . . . . . . . . . . . . 344 278 285 3.6 3.0 3.0
REGION3
Northeast. . . . . . . . . . . . . . . . . . . . . . . . . . . . . . . . . . . . . . . . . . . . . . . . . . . . . . . . . . . . . 916 1,056 998 3.3 3.7 3.5
South. . . . . . . . . . . . . . . . . . . . . . . . . . . . . . . . . . . . . . . . . . . . . . . . . . . . . . . . . . . . . . . . . 1,933 2,126 1,991 3.5 3.8 3.5
Midwest. . . . . . . . . . . . . . . . . . . . . . . . . . . . . . . . . . . . . . . . . . . . . . . . . . . . . . . . . . . . . . . 1,248 1,561 1,440 3.7 4.5 4.2
West. . . . . . . . . . . . . . . . . . . . . . . . . . . . . . . . . . . . . . . . . . . . . . . . . . . . . . . . . . . . . . . . . . 1,282 1,434 1,232 3.7 4.1 3.5
1 Job openings are the number of job openings on the last business day of the month.2 The job openings rate is the number of job openings on the last business day of the month as a percent of total employment plus job openings.3 The states (including the District of Columbia) that comprise the regions are: Northeast: Connecticut, Maine, Massachusetts, New Hampshire, New
Jersey, New York, Pennsylvania, Rhode Island, and Vermont; South: Alabama, Arkansas, Delaware, District of Columbia, Florida, Georgia,Kentucky, Louisiana, Maryland, Mississippi, North Carolina, Oklahoma, South Carolina, Tennessee, Texas, Virginia, and West Virginia; Midwest:Illinois, Indiana, Iowa, Kansas, Michigan, Minnesota, Missouri, Nebraska, North Dakota, Ohio, South Dakota, and Wisconsin; West: Alaska, Arizona,California, Colorado, Hawaii, Idaho, Montana, Nevada, New Mexico, Oregon, Utah, Washington, and Wyoming.
p Preliminary
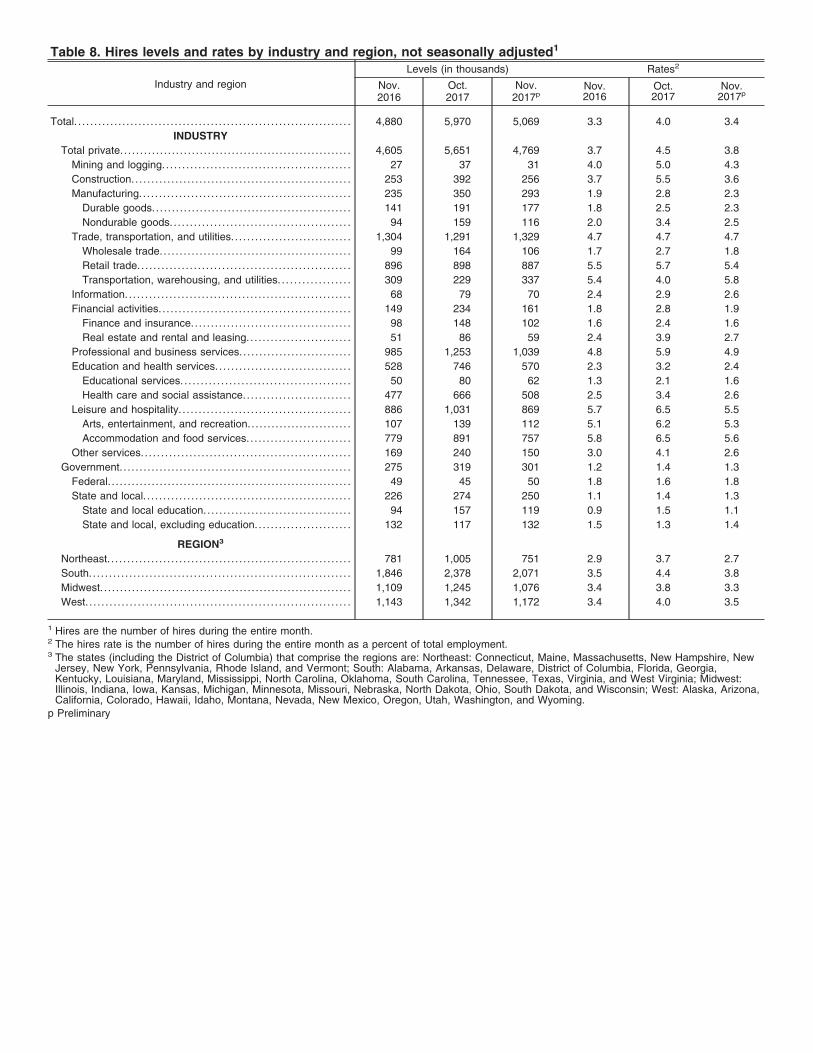
Table 8. Hires levels and rates by industry and region, not seasonally adjusted1
Industry and region
Levels (in thousands) Rates2
Nov.2016
Oct.2017
Nov.2017p
Nov.2016
Oct.2017
Nov.2017p
Total. . . . . . . . . . . . . . . . . . . . . . . . . . . . . . . . . . . . . . . . . . . . . . . . . . . . . . . . . . . . . . . . . . . . . 4,880 5,970 5,069 3.3 4.0 3.4
INDUSTRY
Total private. . . . . . . . . . . . . . . . . . . . . . . . . . . . . . . . . . . . . . . . . . . . . . . . . . . . . . . . . . 4,605 5,651 4,769 3.7 4.5 3.8
Mining and logging. . . . . . . . . . . . . . . . . . . . . . . . . . . . . . . . . . . . . . . . . . . . . . . 27 37 31 4.0 5.0 4.3
Construction.. . . . . . . . . . . . . . . . . . . . . . . . . . . . . . . . . . . . . . . . . . . . . . . . . . . . . . 253 392 256 3.7 5.5 3.6
Manufacturing. . . . . . . . . . . . . . . . . . . . . . . . . . . . . . . . . . . . . . . . . . . . . . . . . . . . . 235 350 293 1.9 2.8 2.3
Durable goods.. . . . . . . . . . . . . . . . . . . . . . . . . . . . . . . . . . . . . . . . . . . . . . . . . 141 191 177 1.8 2.5 2.3
Nondurable goods. . . . . . . . . . . . . . . . . . . . . . . . . . . . . . . . . . . . . . . . . . . . . 94 159 116 2.0 3.4 2.5
Trade, transportation, and utilities. . . . . . . . . . . . . . . . . . . . . . . . . . . . . . 1,304 1,291 1,329 4.7 4.7 4.7
Wholesale trade.. . . . . . . . . . . . . . . . . . . . . . . . . . . . . . . . . . . . . . . . . . . . . . . 99 164 106 1.7 2.7 1.8
Retail trade. . . . . . . . . . . . . . . . . . . . . . . . . . . . . . . . . . . . . . . . . . . . . . . . . . . . . 896 898 887 5.5 5.7 5.4
Transportation, warehousing, and utilities. . . . . . . . . . . . . . . . . . 309 229 337 5.4 4.0 5.8
Information. . . . . . . . . . . . . . . . . . . . . . . . . . . . . . . . . . . . . . . . . . . . . . . . . . . . . . . . 68 79 70 2.4 2.9 2.6
Financial activities. . . . . . . . . . . . . . . . . . . . . . . . . . . . . . . . . . . . . . . . . . . . . . . . 149 234 161 1.8 2.8 1.9
Finance and insurance.. . . . . . . . . . . . . . . . . . . . . . . . . . . . . . . . . . . . . . . 98 148 102 1.6 2.4 1.6
Real estate and rental and leasing. . . . . . . . . . . . . . . . . . . . . . . . . . 51 86 59 2.4 3.9 2.7
Professional and business services. . . . . . . . . . . . . . . . . . . . . . . . . . . . 985 1,253 1,039 4.8 5.9 4.9
Education and health services. . . . . . . . . . . . . . . . . . . . . . . . . . . . . . . . . . 528 746 570 2.3 3.2 2.4
Educational services. . . . . . . . . . . . . . . . . . . . . . . . . . . . . . . . . . . . . . . . . . 50 80 62 1.3 2.1 1.6
Health care and social assistance.. . . . . . . . . . . . . . . . . . . . . . . . . . 477 666 508 2.5 3.4 2.6
Leisure and hospitality. . . . . . . . . . . . . . . . . . . . . . . . . . . . . . . . . . . . . . . . . . . 886 1,031 869 5.7 6.5 5.5
Arts, entertainment, and recreation.. . . . . . . . . . . . . . . . . . . . . . . . . 107 139 112 5.1 6.2 5.3
Accommodation and food services. . . . . . . . . . . . . . . . . . . . . . . . . . 779 891 757 5.8 6.5 5.6
Other services. . . . . . . . . . . . . . . . . . . . . . . . . . . . . . . . . . . . . . . . . . . . . . . . . . . . 169 240 150 3.0 4.1 2.6
Government. . . . . . . . . . . . . . . . . . . . . . . . . . . . . . . . . . . . . . . . . . . . . . . . . . . . . . . . . . 275 319 301 1.2 1.4 1.3
Federal. . . . . . . . . . . . . . . . . . . . . . . . . . . . . . . . . . . . . . . . . . . . . . . . . . . . . . . . . . . . . 49 45 50 1.8 1.6 1.8
State and local. . . . . . . . . . . . . . . . . . . . . . . . . . . . . . . . . . . . . . . . . . . . . . . . . . . . 226 274 250 1.1 1.4 1.3
State and local education.. . . . . . . . . . . . . . . . . . . . . . . . . . . . . . . . . . . . 94 157 119 0.9 1.5 1.1
State and local, excluding education. . . . . . . . . . . . . . . . . . . . . . . . 132 117 132 1.5 1.3 1.4
REGION3
Northeast. . . . . . . . . . . . . . . . . . . . . . . . . . . . . . . . . . . . . . . . . . . . . . . . . . . . . . . . . . . . . 781 1,005 751 2.9 3.7 2.7
South. . . . . . . . . . . . . . . . . . . . . . . . . . . . . . . . . . . . . . . . . . . . . . . . . . . . . . . . . . . . . . . . . 1,846 2,378 2,071 3.5 4.4 3.8
Midwest. . . . . . . . . . . . . . . . . . . . . . . . . . . . . . . . . . . . . . . . . . . . . . . . . . . . . . . . . . . . . . . 1,109 1,245 1,076 3.4 3.8 3.3
West. . . . . . . . . . . . . . . . . . . . . . . . . . . . . . . . . . . . . . . . . . . . . . . . . . . . . . . . . . . . . . . . . . 1,143 1,342 1,172 3.4 4.0 3.5
1 Hires are the number of hires during the entire month.2 The hires rate is the number of hires during the entire month as a percent of total employment.3 The states (including the District of Columbia) that comprise the regions are: Northeast: Connecticut, Maine, Massachusetts, New Hampshire, New
Jersey, New York, Pennsylvania, Rhode Island, and Vermont; South: Alabama, Arkansas, Delaware, District of Columbia, Florida, Georgia,Kentucky, Louisiana, Maryland, Mississippi, North Carolina, Oklahoma, South Carolina, Tennessee, Texas, Virginia, and West Virginia; Midwest:Illinois, Indiana, Iowa, Kansas, Michigan, Minnesota, Missouri, Nebraska, North Dakota, Ohio, South Dakota, and Wisconsin; West: Alaska, Arizona,California, Colorado, Hawaii, Idaho, Montana, Nevada, New Mexico, Oregon, Utah, Washington, and Wyoming.
p Preliminary
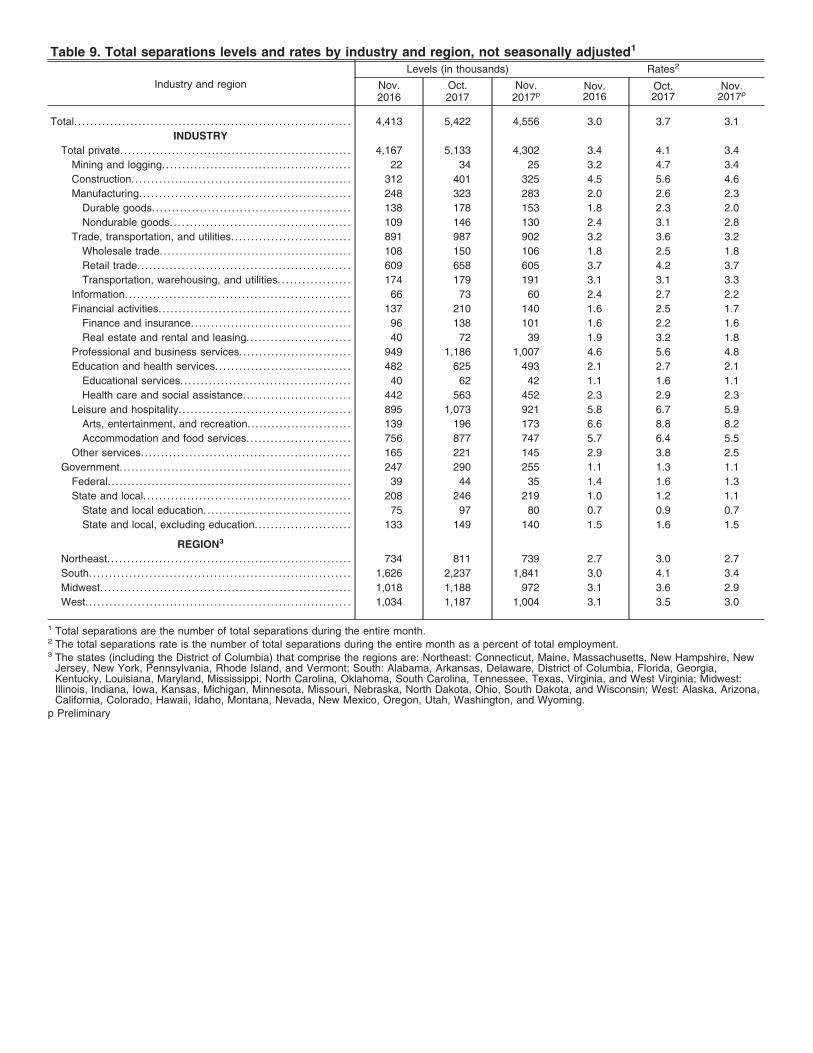
Table 9. Total separations levels and rates by industry and region, not seasonally adjusted1
Industry and region
Levels (in thousands) Rates2
Nov.2016
Oct.2017
Nov.2017p
Nov.2016
Oct.2017
Nov.2017p
Total. . . . . . . . . . . . . . . . . . . . . . . . . . . . . . . . . . . . . . . . . . . . . . . . . . . . . . . . . . . . . . . . . . . . . 4,413 5,422 4,556 3.0 3.7 3.1
INDUSTRY
Total private. . . . . . . . . . . . . . . . . . . . . . . . . . . . . . . . . . . . . . . . . . . . . . . . . . . . . . . . . . 4,167 5,133 4,302 3.4 4.1 3.4
Mining and logging. . . . . . . . . . . . . . . . . . . . . . . . . . . . . . . . . . . . . . . . . . . . . . . 22 34 25 3.2 4.7 3.4
Construction.. . . . . . . . . . . . . . . . . . . . . . . . . . . . . . . . . . . . . . . . . . . . . . . . . . . . . . 312 401 325 4.5 5.6 4.6
Manufacturing. . . . . . . . . . . . . . . . . . . . . . . . . . . . . . . . . . . . . . . . . . . . . . . . . . . . . 248 323 283 2.0 2.6 2.3
Durable goods.. . . . . . . . . . . . . . . . . . . . . . . . . . . . . . . . . . . . . . . . . . . . . . . . . 138 178 153 1.8 2.3 2.0
Nondurable goods. . . . . . . . . . . . . . . . . . . . . . . . . . . . . . . . . . . . . . . . . . . . . 109 146 130 2.4 3.1 2.8
Trade, transportation, and utilities. . . . . . . . . . . . . . . . . . . . . . . . . . . . . . 891 987 902 3.2 3.6 3.2
Wholesale trade.. . . . . . . . . . . . . . . . . . . . . . . . . . . . . . . . . . . . . . . . . . . . . . . 108 150 106 1.8 2.5 1.8
Retail trade. . . . . . . . . . . . . . . . . . . . . . . . . . . . . . . . . . . . . . . . . . . . . . . . . . . . . 609 658 605 3.7 4.2 3.7
Transportation, warehousing, and utilities. . . . . . . . . . . . . . . . . . 174 179 191 3.1 3.1 3.3
Information. . . . . . . . . . . . . . . . . . . . . . . . . . . . . . . . . . . . . . . . . . . . . . . . . . . . . . . . 66 73 60 2.4 2.7 2.2
Financial activities. . . . . . . . . . . . . . . . . . . . . . . . . . . . . . . . . . . . . . . . . . . . . . . . 137 210 140 1.6 2.5 1.7
Finance and insurance.. . . . . . . . . . . . . . . . . . . . . . . . . . . . . . . . . . . . . . . 96 138 101 1.6 2.2 1.6
Real estate and rental and leasing. . . . . . . . . . . . . . . . . . . . . . . . . . 40 72 39 1.9 3.2 1.8
Professional and business services. . . . . . . . . . . . . . . . . . . . . . . . . . . . 949 1,186 1,007 4.6 5.6 4.8
Education and health services. . . . . . . . . . . . . . . . . . . . . . . . . . . . . . . . . . 482 625 493 2.1 2.7 2.1
Educational services. . . . . . . . . . . . . . . . . . . . . . . . . . . . . . . . . . . . . . . . . . 40 62 42 1.1 1.6 1.1
Health care and social assistance.. . . . . . . . . . . . . . . . . . . . . . . . . . 442 563 452 2.3 2.9 2.3
Leisure and hospitality. . . . . . . . . . . . . . . . . . . . . . . . . . . . . . . . . . . . . . . . . . . 895 1,073 921 5.8 6.7 5.9
Arts, entertainment, and recreation.. . . . . . . . . . . . . . . . . . . . . . . . . 139 196 173 6.6 8.8 8.2
Accommodation and food services. . . . . . . . . . . . . . . . . . . . . . . . . . 756 877 747 5.7 6.4 5.5
Other services. . . . . . . . . . . . . . . . . . . . . . . . . . . . . . . . . . . . . . . . . . . . . . . . . . . . 165 221 145 2.9 3.8 2.5
Government. . . . . . . . . . . . . . . . . . . . . . . . . . . . . . . . . . . . . . . . . . . . . . . . . . . . . . . . . . 247 290 255 1.1 1.3 1.1
Federal. . . . . . . . . . . . . . . . . . . . . . . . . . . . . . . . . . . . . . . . . . . . . . . . . . . . . . . . . . . . . 39 44 35 1.4 1.6 1.3
State and local. . . . . . . . . . . . . . . . . . . . . . . . . . . . . . . . . . . . . . . . . . . . . . . . . . . . 208 246 219 1.0 1.2 1.1
State and local education.. . . . . . . . . . . . . . . . . . . . . . . . . . . . . . . . . . . . 75 97 80 0.7 0.9 0.7
State and local, excluding education. . . . . . . . . . . . . . . . . . . . . . . . 133 149 140 1.5 1.6 1.5
REGION3
Northeast. . . . . . . . . . . . . . . . . . . . . . . . . . . . . . . . . . . . . . . . . . . . . . . . . . . . . . . . . . . . . 734 811 739 2.7 3.0 2.7
South. . . . . . . . . . . . . . . . . . . . . . . . . . . . . . . . . . . . . . . . . . . . . . . . . . . . . . . . . . . . . . . . . 1,626 2,237 1,841 3.0 4.1 3.4
Midwest. . . . . . . . . . . . . . . . . . . . . . . . . . . . . . . . . . . . . . . . . . . . . . . . . . . . . . . . . . . . . . . 1,018 1,188 972 3.1 3.6 2.9
West. . . . . . . . . . . . . . . . . . . . . . . . . . . . . . . . . . . . . . . . . . . . . . . . . . . . . . . . . . . . . . . . . . 1,034 1,187 1,004 3.1 3.5 3.0
1 Total separations are the number of total separations during the entire month.2 The total separations rate is the number of total separations during the entire month as a percent of total employment.3 The states (including the District of Columbia) that comprise the regions are: Northeast: Connecticut, Maine, Massachusetts, New Hampshire, New
Jersey, New York, Pennsylvania, Rhode Island, and Vermont; South: Alabama, Arkansas, Delaware, District of Columbia, Florida, Georgia,Kentucky, Louisiana, Maryland, Mississippi, North Carolina, Oklahoma, South Carolina, Tennessee, Texas, Virginia, and West Virginia; Midwest:Illinois, Indiana, Iowa, Kansas, Michigan, Minnesota, Missouri, Nebraska, North Dakota, Ohio, South Dakota, and Wisconsin; West: Alaska, Arizona,California, Colorado, Hawaii, Idaho, Montana, Nevada, New Mexico, Oregon, Utah, Washington, and Wyoming.
p Preliminary
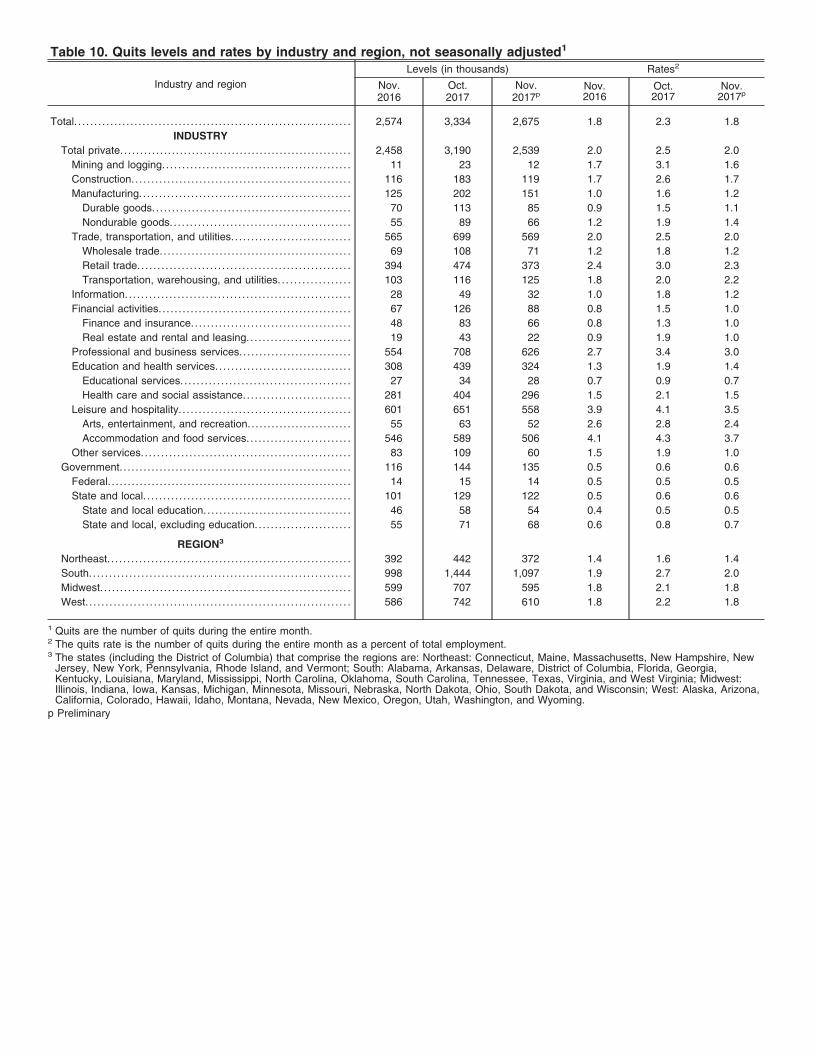
Table 10. Quits levels and rates by industry and region, not seasonally adjusted1
Industry and region
Levels (in thousands) Rates2
Nov.2016
Oct.2017
Nov.2017p
Nov.2016
Oct.2017
Nov.2017p
Total. . . . . . . . . . . . . . . . . . . . . . . . . . . . . . . . . . . . . . . . . . . . . . . . . . . . . . . . . . . . . . . . . . . . . 2,574 3,334 2,675 1.8 2.3 1.8
INDUSTRY
Total private. . . . . . . . . . . . . . . . . . . . . . . . . . . . . . . . . . . . . . . . . . . . . . . . . . . . . . . . . . 2,458 3,190 2,539 2.0 2.5 2.0
Mining and logging. . . . . . . . . . . . . . . . . . . . . . . . . . . . . . . . . . . . . . . . . . . . . . . 11 23 12 1.7 3.1 1.6
Construction.. . . . . . . . . . . . . . . . . . . . . . . . . . . . . . . . . . . . . . . . . . . . . . . . . . . . . . 116 183 119 1.7 2.6 1.7
Manufacturing. . . . . . . . . . . . . . . . . . . . . . . . . . . . . . . . . . . . . . . . . . . . . . . . . . . . . 125 202 151 1.0 1.6 1.2
Durable goods.. . . . . . . . . . . . . . . . . . . . . . . . . . . . . . . . . . . . . . . . . . . . . . . . . 70 113 85 0.9 1.5 1.1
Nondurable goods. . . . . . . . . . . . . . . . . . . . . . . . . . . . . . . . . . . . . . . . . . . . . 55 89 66 1.2 1.9 1.4
Trade, transportation, and utilities. . . . . . . . . . . . . . . . . . . . . . . . . . . . . . 565 699 569 2.0 2.5 2.0
Wholesale trade.. . . . . . . . . . . . . . . . . . . . . . . . . . . . . . . . . . . . . . . . . . . . . . . 69 108 71 1.2 1.8 1.2
Retail trade. . . . . . . . . . . . . . . . . . . . . . . . . . . . . . . . . . . . . . . . . . . . . . . . . . . . . 394 474 373 2.4 3.0 2.3
Transportation, warehousing, and utilities. . . . . . . . . . . . . . . . . . 103 116 125 1.8 2.0 2.2
Information. . . . . . . . . . . . . . . . . . . . . . . . . . . . . . . . . . . . . . . . . . . . . . . . . . . . . . . . 28 49 32 1.0 1.8 1.2
Financial activities. . . . . . . . . . . . . . . . . . . . . . . . . . . . . . . . . . . . . . . . . . . . . . . . 67 126 88 0.8 1.5 1.0
Finance and insurance.. . . . . . . . . . . . . . . . . . . . . . . . . . . . . . . . . . . . . . . 48 83 66 0.8 1.3 1.0
Real estate and rental and leasing. . . . . . . . . . . . . . . . . . . . . . . . . . 19 43 22 0.9 1.9 1.0
Professional and business services. . . . . . . . . . . . . . . . . . . . . . . . . . . . 554 708 626 2.7 3.4 3.0
Education and health services. . . . . . . . . . . . . . . . . . . . . . . . . . . . . . . . . . 308 439 324 1.3 1.9 1.4
Educational services. . . . . . . . . . . . . . . . . . . . . . . . . . . . . . . . . . . . . . . . . . 27 34 28 0.7 0.9 0.7
Health care and social assistance.. . . . . . . . . . . . . . . . . . . . . . . . . . 281 404 296 1.5 2.1 1.5
Leisure and hospitality. . . . . . . . . . . . . . . . . . . . . . . . . . . . . . . . . . . . . . . . . . . 601 651 558 3.9 4.1 3.5
Arts, entertainment, and recreation.. . . . . . . . . . . . . . . . . . . . . . . . . 55 63 52 2.6 2.8 2.4
Accommodation and food services. . . . . . . . . . . . . . . . . . . . . . . . . . 546 589 506 4.1 4.3 3.7
Other services. . . . . . . . . . . . . . . . . . . . . . . . . . . . . . . . . . . . . . . . . . . . . . . . . . . . 83 109 60 1.5 1.9 1.0
Government. . . . . . . . . . . . . . . . . . . . . . . . . . . . . . . . . . . . . . . . . . . . . . . . . . . . . . . . . . 116 144 135 0.5 0.6 0.6
Federal. . . . . . . . . . . . . . . . . . . . . . . . . . . . . . . . . . . . . . . . . . . . . . . . . . . . . . . . . . . . . 14 15 14 0.5 0.5 0.5
State and local. . . . . . . . . . . . . . . . . . . . . . . . . . . . . . . . . . . . . . . . . . . . . . . . . . . . 101 129 122 0.5 0.6 0.6
State and local education.. . . . . . . . . . . . . . . . . . . . . . . . . . . . . . . . . . . . 46 58 54 0.4 0.5 0.5
State and local, excluding education. . . . . . . . . . . . . . . . . . . . . . . . 55 71 68 0.6 0.8 0.7
REGION3
Northeast. . . . . . . . . . . . . . . . . . . . . . . . . . . . . . . . . . . . . . . . . . . . . . . . . . . . . . . . . . . . . 392 442 372 1.4 1.6 1.4
South. . . . . . . . . . . . . . . . . . . . . . . . . . . . . . . . . . . . . . . . . . . . . . . . . . . . . . . . . . . . . . . . . 998 1,444 1,097 1.9 2.7 2.0
Midwest. . . . . . . . . . . . . . . . . . . . . . . . . . . . . . . . . . . . . . . . . . . . . . . . . . . . . . . . . . . . . . . 599 707 595 1.8 2.1 1.8
West. . . . . . . . . . . . . . . . . . . . . . . . . . . . . . . . . . . . . . . . . . . . . . . . . . . . . . . . . . . . . . . . . . 586 742 610 1.8 2.2 1.8
1 Quits are the number of quits during the entire month.2 The quits rate is the number of quits during the entire month as a percent of total employment.3 The states (including the District of Columbia) that comprise the regions are: Northeast: Connecticut, Maine, Massachusetts, New Hampshire, New
Jersey, New York, Pennsylvania, Rhode Island, and Vermont; South: Alabama, Arkansas, Delaware, District of Columbia, Florida, Georgia,Kentucky, Louisiana, Maryland, Mississippi, North Carolina, Oklahoma, South Carolina, Tennessee, Texas, Virginia, and West Virginia; Midwest:Illinois, Indiana, Iowa, Kansas, Michigan, Minnesota, Missouri, Nebraska, North Dakota, Ohio, South Dakota, and Wisconsin; West: Alaska, Arizona,California, Colorado, Hawaii, Idaho, Montana, Nevada, New Mexico, Oregon, Utah, Washington, and Wyoming.
p Preliminary
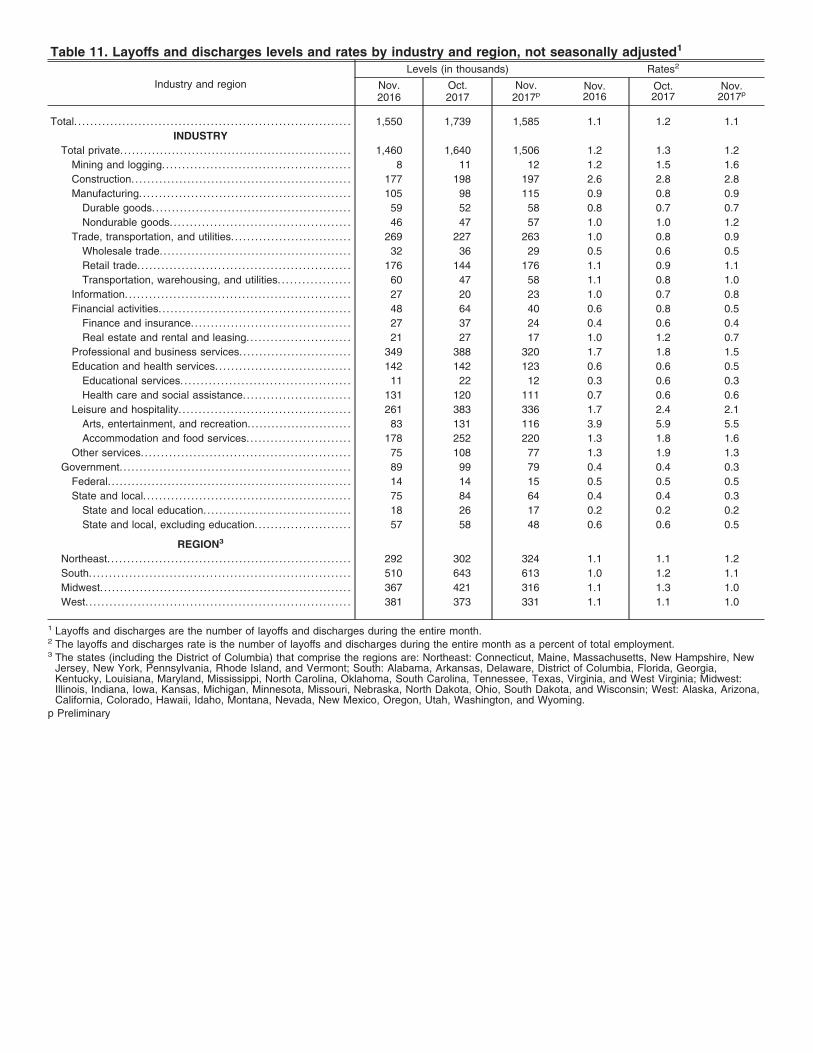
Table 11. Layoffs and discharges levels and rates by industry and region, not seasonally adjusted1
Industry and region
Levels (in thousands) Rates2
Nov.2016
Oct.2017
Nov.2017p
Nov.2016
Oct.2017
Nov.2017p
Total. . . . . . . . . . . . . . . . . . . . . . . . . . . . . . . . . . . . . . . . . . . . . . . . . . . . . . . . . . . . . . . . . . . . . 1,550 1,739 1,585 1.1 1.2 1.1
INDUSTRY
Total private. . . . . . . . . . . . . . . . . . . . . . . . . . . . . . . . . . . . . . . . . . . . . . . . . . . . . . . . . . 1,460 1,640 1,506 1.2 1.3 1.2
Mining and logging. . . . . . . . . . . . . . . . . . . . . . . . . . . . . . . . . . . . . . . . . . . . . . . 8 11 12 1.2 1.5 1.6
Construction.. . . . . . . . . . . . . . . . . . . . . . . . . . . . . . . . . . . . . . . . . . . . . . . . . . . . . . 177 198 197 2.6 2.8 2.8
Manufacturing. . . . . . . . . . . . . . . . . . . . . . . . . . . . . . . . . . . . . . . . . . . . . . . . . . . . . 105 98 115 0.9 0.8 0.9
Durable goods.. . . . . . . . . . . . . . . . . . . . . . . . . . . . . . . . . . . . . . . . . . . . . . . . . 59 52 58 0.8 0.7 0.7
Nondurable goods. . . . . . . . . . . . . . . . . . . . . . . . . . . . . . . . . . . . . . . . . . . . . 46 47 57 1.0 1.0 1.2
Trade, transportation, and utilities. . . . . . . . . . . . . . . . . . . . . . . . . . . . . . 269 227 263 1.0 0.8 0.9
Wholesale trade.. . . . . . . . . . . . . . . . . . . . . . . . . . . . . . . . . . . . . . . . . . . . . . . 32 36 29 0.5 0.6 0.5
Retail trade. . . . . . . . . . . . . . . . . . . . . . . . . . . . . . . . . . . . . . . . . . . . . . . . . . . . . 176 144 176 1.1 0.9 1.1
Transportation, warehousing, and utilities. . . . . . . . . . . . . . . . . . 60 47 58 1.1 0.8 1.0
Information. . . . . . . . . . . . . . . . . . . . . . . . . . . . . . . . . . . . . . . . . . . . . . . . . . . . . . . . 27 20 23 1.0 0.7 0.8
Financial activities. . . . . . . . . . . . . . . . . . . . . . . . . . . . . . . . . . . . . . . . . . . . . . . . 48 64 40 0.6 0.8 0.5
Finance and insurance.. . . . . . . . . . . . . . . . . . . . . . . . . . . . . . . . . . . . . . . 27 37 24 0.4 0.6 0.4
Real estate and rental and leasing. . . . . . . . . . . . . . . . . . . . . . . . . . 21 27 17 1.0 1.2 0.7
Professional and business services. . . . . . . . . . . . . . . . . . . . . . . . . . . . 349 388 320 1.7 1.8 1.5
Education and health services. . . . . . . . . . . . . . . . . . . . . . . . . . . . . . . . . . 142 142 123 0.6 0.6 0.5
Educational services. . . . . . . . . . . . . . . . . . . . . . . . . . . . . . . . . . . . . . . . . . 11 22 12 0.3 0.6 0.3
Health care and social assistance.. . . . . . . . . . . . . . . . . . . . . . . . . . 131 120 111 0.7 0.6 0.6
Leisure and hospitality. . . . . . . . . . . . . . . . . . . . . . . . . . . . . . . . . . . . . . . . . . . 261 383 336 1.7 2.4 2.1
Arts, entertainment, and recreation.. . . . . . . . . . . . . . . . . . . . . . . . . 83 131 116 3.9 5.9 5.5
Accommodation and food services. . . . . . . . . . . . . . . . . . . . . . . . . . 178 252 220 1.3 1.8 1.6
Other services. . . . . . . . . . . . . . . . . . . . . . . . . . . . . . . . . . . . . . . . . . . . . . . . . . . . 75 108 77 1.3 1.9 1.3
Government. . . . . . . . . . . . . . . . . . . . . . . . . . . . . . . . . . . . . . . . . . . . . . . . . . . . . . . . . . 89 99 79 0.4 0.4 0.3
Federal. . . . . . . . . . . . . . . . . . . . . . . . . . . . . . . . . . . . . . . . . . . . . . . . . . . . . . . . . . . . . 14 14 15 0.5 0.5 0.5
State and local. . . . . . . . . . . . . . . . . . . . . . . . . . . . . . . . . . . . . . . . . . . . . . . . . . . . 75 84 64 0.4 0.4 0.3
State and local education.. . . . . . . . . . . . . . . . . . . . . . . . . . . . . . . . . . . . 18 26 17 0.2 0.2 0.2
State and local, excluding education. . . . . . . . . . . . . . . . . . . . . . . . 57 58 48 0.6 0.6 0.5
REGION3
Northeast. . . . . . . . . . . . . . . . . . . . . . . . . . . . . . . . . . . . . . . . . . . . . . . . . . . . . . . . . . . . . 292 302 324 1.1 1.1 1.2
South. . . . . . . . . . . . . . . . . . . . . . . . . . . . . . . . . . . . . . . . . . . . . . . . . . . . . . . . . . . . . . . . . 510 643 613 1.0 1.2 1.1
Midwest. . . . . . . . . . . . . . . . . . . . . . . . . . . . . . . . . . . . . . . . . . . . . . . . . . . . . . . . . . . . . . . 367 421 316 1.1 1.3 1.0
West. . . . . . . . . . . . . . . . . . . . . . . . . . . . . . . . . . . . . . . . . . . . . . . . . . . . . . . . . . . . . . . . . . 381 373 331 1.1 1.1 1.0
1 Layoffs and discharges are the number of layoffs and discharges during the entire month.2 The layoffs and discharges rate is the number of layoffs and discharges during the entire month as a percent of total employment.3 The states (including the District of Columbia) that comprise the regions are: Northeast: Connecticut, Maine, Massachusetts, New Hampshire, New
Jersey, New York, Pennsylvania, Rhode Island, and Vermont; South: Alabama, Arkansas, Delaware, District of Columbia, Florida, Georgia,Kentucky, Louisiana, Maryland, Mississippi, North Carolina, Oklahoma, South Carolina, Tennessee, Texas, Virginia, and West Virginia; Midwest:Illinois, Indiana, Iowa, Kansas, Michigan, Minnesota, Missouri, Nebraska, North Dakota, Ohio, South Dakota, and Wisconsin; West: Alaska, Arizona,California, Colorado, Hawaii, Idaho, Montana, Nevada, New Mexico, Oregon, Utah, Washington, and Wyoming.
p Preliminary
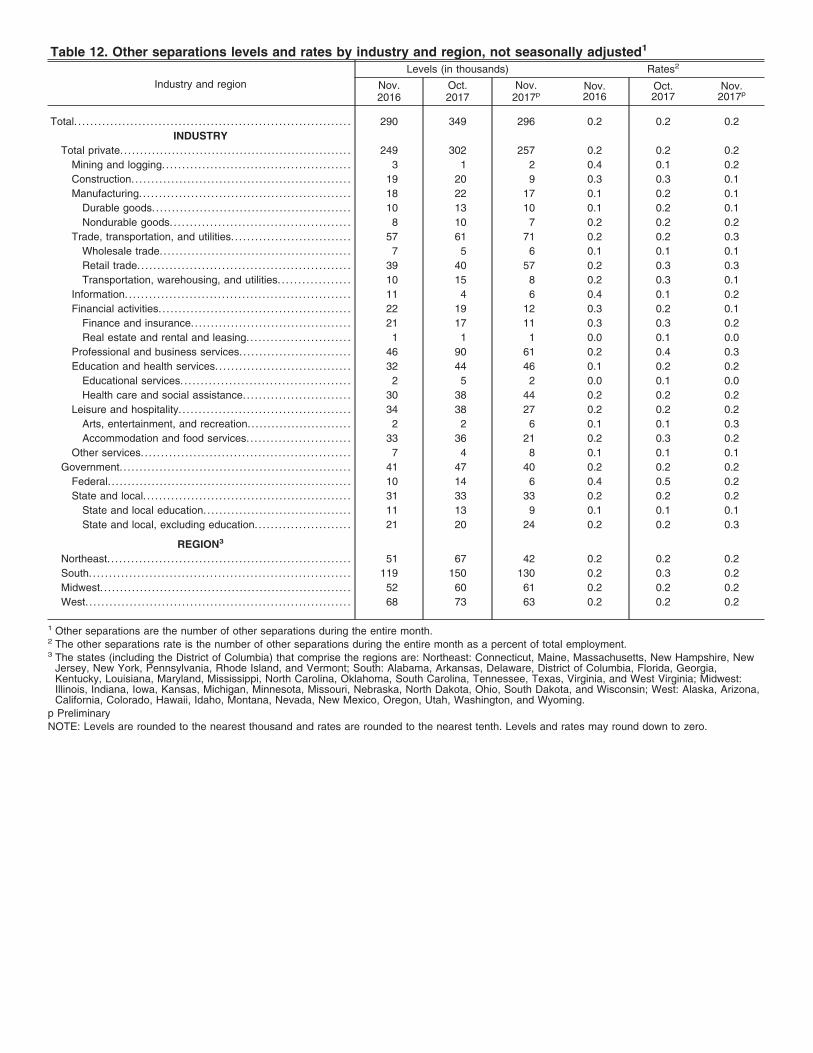
Table 12. Other separations levels and rates by industry and region, not seasonally adjusted1
Industry and region
Levels (in thousands) Rates2
Nov.2016
Oct.2017
Nov.2017p
Nov.2016
Oct.2017
Nov.2017p
Total. . . . . . . . . . . . . . . . . . . . . . . . . . . . . . . . . . . . . . . . . . . . . . . . . . . . . . . . . . . . . . . . . . . . . 290 349 296 0.2 0.2 0.2
INDUSTRY
Total private. . . . . . . . . . . . . . . . . . . . . . . . . . . . . . . . . . . . . . . . . . . . . . . . . . . . . . . . . . 249 302 257 0.2 0.2 0.2
Mining and logging. . . . . . . . . . . . . . . . . . . . . . . . . . . . . . . . . . . . . . . . . . . . . . . 3 1 2 0.4 0.1 0.2
Construction.. . . . . . . . . . . . . . . . . . . . . . . . . . . . . . . . . . . . . . . . . . . . . . . . . . . . . . 19 20 9 0.3 0.3 0.1
Manufacturing. . . . . . . . . . . . . . . . . . . . . . . . . . . . . . . . . . . . . . . . . . . . . . . . . . . . . 18 22 17 0.1 0.2 0.1
Durable goods.. . . . . . . . . . . . . . . . . . . . . . . . . . . . . . . . . . . . . . . . . . . . . . . . . 10 13 10 0.1 0.2 0.1
Nondurable goods. . . . . . . . . . . . . . . . . . . . . . . . . . . . . . . . . . . . . . . . . . . . . 8 10 7 0.2 0.2 0.2
Trade, transportation, and utilities. . . . . . . . . . . . . . . . . . . . . . . . . . . . . . 57 61 71 0.2 0.2 0.3
Wholesale trade.. . . . . . . . . . . . . . . . . . . . . . . . . . . . . . . . . . . . . . . . . . . . . . . 7 5 6 0.1 0.1 0.1
Retail trade. . . . . . . . . . . . . . . . . . . . . . . . . . . . . . . . . . . . . . . . . . . . . . . . . . . . . 39 40 57 0.2 0.3 0.3
Transportation, warehousing, and utilities. . . . . . . . . . . . . . . . . . 10 15 8 0.2 0.3 0.1
Information. . . . . . . . . . . . . . . . . . . . . . . . . . . . . . . . . . . . . . . . . . . . . . . . . . . . . . . . 11 4 6 0.4 0.1 0.2
Financial activities. . . . . . . . . . . . . . . . . . . . . . . . . . . . . . . . . . . . . . . . . . . . . . . . 22 19 12 0.3 0.2 0.1
Finance and insurance.. . . . . . . . . . . . . . . . . . . . . . . . . . . . . . . . . . . . . . . 21 17 11 0.3 0.3 0.2
Real estate and rental and leasing. . . . . . . . . . . . . . . . . . . . . . . . . . 1 1 1 0.0 0.1 0.0
Professional and business services. . . . . . . . . . . . . . . . . . . . . . . . . . . . 46 90 61 0.2 0.4 0.3
Education and health services. . . . . . . . . . . . . . . . . . . . . . . . . . . . . . . . . . 32 44 46 0.1 0.2 0.2
Educational services. . . . . . . . . . . . . . . . . . . . . . . . . . . . . . . . . . . . . . . . . . 2 5 2 0.0 0.1 0.0
Health care and social assistance.. . . . . . . . . . . . . . . . . . . . . . . . . . 30 38 44 0.2 0.2 0.2
Leisure and hospitality. . . . . . . . . . . . . . . . . . . . . . . . . . . . . . . . . . . . . . . . . . . 34 38 27 0.2 0.2 0.2
Arts, entertainment, and recreation.. . . . . . . . . . . . . . . . . . . . . . . . . 2 2 6 0.1 0.1 0.3
Accommodation and food services. . . . . . . . . . . . . . . . . . . . . . . . . . 33 36 21 0.2 0.3 0.2
Other services. . . . . . . . . . . . . . . . . . . . . . . . . . . . . . . . . . . . . . . . . . . . . . . . . . . . 7 4 8 0.1 0.1 0.1
Government. . . . . . . . . . . . . . . . . . . . . . . . . . . . . . . . . . . . . . . . . . . . . . . . . . . . . . . . . . 41 47 40 0.2 0.2 0.2
Federal. . . . . . . . . . . . . . . . . . . . . . . . . . . . . . . . . . . . . . . . . . . . . . . . . . . . . . . . . . . . . 10 14 6 0.4 0.5 0.2
State and local. . . . . . . . . . . . . . . . . . . . . . . . . . . . . . . . . . . . . . . . . . . . . . . . . . . . 31 33 33 0.2 0.2 0.2
State and local education.. . . . . . . . . . . . . . . . . . . . . . . . . . . . . . . . . . . . 11 13 9 0.1 0.1 0.1
State and local, excluding education. . . . . . . . . . . . . . . . . . . . . . . . 21 20 24 0.2 0.2 0.3
REGION3
Northeast. . . . . . . . . . . . . . . . . . . . . . . . . . . . . . . . . . . . . . . . . . . . . . . . . . . . . . . . . . . . . 51 67 42 0.2 0.2 0.2
South. . . . . . . . . . . . . . . . . . . . . . . . . . . . . . . . . . . . . . . . . . . . . . . . . . . . . . . . . . . . . . . . . 119 150 130 0.2 0.3 0.2
Midwest. . . . . . . . . . . . . . . . . . . . . . . . . . . . . . . . . . . . . . . . . . . . . . . . . . . . . . . . . . . . . . . 52 60 61 0.2 0.2 0.2
West. . . . . . . . . . . . . . . . . . . . . . . . . . . . . . . . . . . . . . . . . . . . . . . . . . . . . . . . . . . . . . . . . . 68 73 63 0.2 0.2 0.2
1 Other separations are the number of other separations during the entire month.2 The other separations rate is the number of other separations during the entire month as a percent of total employment.3 The states (including the District of Columbia) that comprise the regions are: Northeast: Connecticut, Maine, Massachusetts, New Hampshire, New
Jersey, New York, Pennsylvania, Rhode Island, and Vermont; South: Alabama, Arkansas, Delaware, District of Columbia, Florida, Georgia,Kentucky, Louisiana, Maryland, Mississippi, North Carolina, Oklahoma, South Carolina, Tennessee, Texas, Virginia, and West Virginia; Midwest:Illinois, Indiana, Iowa, Kansas, Michigan, Minnesota, Missouri, Nebraska, North Dakota, Ohio, South Dakota, and Wisconsin; West: Alaska, Arizona,California, Colorado, Hawaii, Idaho, Montana, Nevada, New Mexico, Oregon, Utah, Washington, and Wyoming.
p Preliminary
NOTE: Levels are rounded to the nearest thousand and rates are rounded to the nearest tenth. Levels and rates may round down to zero.