tuba city, arizona, land management project site semi ... · u0192600 gjo–2004–550−tac tuba...
TRANSCRIPT
U0192600
GJO–2004–550−TAC
Tuba City, Arizona, Land Management Project Site Semi-Annual Performance Evaluation
March 2003 through August 2003
January 2004
Work Performed by S.M. Stoller Corporation under DOE Contract No. DE–AC01–02GJ79491 for the U.S. Department of Energy, Grand Junction, Colorado

This page intentionally left blank
Document Number U0192600 Contents
DOE/Office of Legacy Management Tuba City Semi-Annual Performance Evaluation January 2004 Page iii
Contents
1.0 Introduction ............................................................................................................................1 1.1 Performance Monitoring...............................................................................................1 1.2 Performance Standards .................................................................................................2 1.3 Ground Water Remediation Goals................................................................................2 1.4 Hydrogeologic Setting ..................................................................................................3
2.0 Six-Month Extraction and Treatment Summary ....................................................................4 2.1 Treated Water Quality and Aquifer Injection...............................................................5
3.0 Extent of Ground Water Contamination ................................................................................5 3.1 Horizons A through D ..................................................................................................5 3.2 Horizons E and Deeper.................................................................................................7 3.3 Extent of Contamination Summary ..............................................................................7
4.0 Hydraulic Response of Aquifer to Extraction and Injection ..................................................8 4.1 Water Table ..................................................................................................................8
4.1.1 Ground Water Mounding...................................................................................9 4.2 Water Level Drawdowns ..............................................................................................9
4.2.1 Extraction Well Drawdowns and Pumping Rates............................................10 4.3 Horizontal Flow Gradients .........................................................................................11 4.4 Vertical Hydraulic Gradients......................................................................................12
5.0 Plume Capture and Contaminant Recovery .........................................................................14 5.1 Plume Capture ............................................................................................................14 5.2 Contaminant Recovery from Aquifer Horizons .........................................................14 5.3 Contaminant Removal Rates ......................................................................................15
6.0 Summary ..............................................................................................................................15 7.0 Recommendations ................................................................................................................16 8.0 References ............................................................................................................................16
Figures Figure 1. Tuba City Site Location................................................................................................. 19 Figure 2. Tuba City Site Features ................................................................................................. 20 Figure 3. Rate of Uranium Treatment, March through August 2003 ........................................... 21 Figure 4. Rate of Nitrate and Sulfate Treatment, March through August 2003 ........................... 21 Figure 5a. Nitrate Concentrations in Ground Water, Horizons A and B, Baseline Period........... 22 Figure 5b. Nitrate Concentrations in Ground Water, Horizons A and B, August 2003 ............... 23 Figure 6a. Nitrate Concentrations in Ground Water, Horizons C and D, Baseline Period........... 24 Figure 6b. Nitrate Concentrations in Ground Water, Horizons C and D, August 2003 ............... 25 Figure 7a. Nitrate Concentrations in Ground Water, Horizons E and Deeper, Baseline Period .. 26 Figure 7b. Nitrate Concentrations in Ground Water, Horizons E and Deeper, August 2003....... 27 Figure 8a. Uranium Concentrations in Ground Water, Horizons A and B, Baseline Period........ 28 Figure 8b. Uranium Concentrations in Ground Water, Horizons A and B, August 2003 ............ 29 Figure 9a. Uranium Concentrations in Ground Water, Horizons C and D, Baseline Period........ 30 Figure 9b. Uranium Concentrations in Ground Water, Horizons C and D, August 2003 ............ 31 Figure 10a. Uranium Concentrations in Ground Water, Horizons E and Deeper, Baseline Period
............................................................................................................................................... 32 Figure 10b. Uranium Concentrations in Ground Water, Horizons E and Deeper, August 2003.. 33

Contents Document Number U0192600
Tuba City Semi-Annual Performance Evaluation DOE/Office of Legacy Management Page iv January 2004
Figure 11a. Sulfate Concentrations in Ground Water, Horizons A and B, Baseline Period ........ 34 Figure 11b. Sulfate Concentrations in Ground Water, Horizons A and B, August 2003............. 35 Figure 12a. Sulfate Concentrations in Ground Water, Horizons C and D, Baseline Period ........ 36 Figure 12b. Sulfate Concentrations in Ground Water, Horizons C and D, August 2003............. 37 Figure 13a. Sulfate Concentrations in Ground Water, Horizons E and Deeper, Baseline Period 38 Figure 13b. Sulfate Concentrations in Ground Water, Horizons E and Deeper, August 2003 .... 39 Figure 14a. Water Table Contour Map, Baseline Period.............................................................. 40 Figure 14b. Water Table Contour Map, July 2003 ....................................................................... 41 Figure 15. Water Level Drawdowns, Horizons A and B, July 2003 ............................................ 42 Figure 16. Water Level Drawdowns, Horizons C and D, July 2003 ............................................ 43 Figure 17. Water Level Drawdowns, Horizons E and Deeper, July 2003.................................... 44 Figure 18. Available Drawdown in Extraction Wells, July/August 2003 .................................... 45 Figure 19a. Horizontal Hydraulic Gradient Direction and Relative Magnitude, Horizons A and B,
Baseline Period ..................................................................................................................... 46 Figure 19b. Horizontal Hydraulic Gradient Direction and Relative Magnitude, Horizons A and
B, July 2003 .......................................................................................................................... 46 Figure 20a. Horizontal Hydraulic Gradient Direction and Relative Magnitude, Horizons C and D,
Baseline Period ..................................................................................................................... 47 Figure 20b. Horizontal Hydraulic Gradient Direction and Relative Magnitude, Horizons C and
D, July 2003.......................................................................................................................... 47 Figure 21. Horizontal Hydraulic Gradient Direction and Relative Magnitude, Horizon E, July
2003 and Baseline Period...................................................................................................... 48 Figure 22. Horizontal Hydraulic Gradient Direction and Relative Magnitude, Horizon G, July
2003 and Baseline Period...................................................................................................... 49 Figure 23. Horizontal Hydraulic Gradient Direction and Relative Magnitude, Horizon I, July
2003 and Baseline Period...................................................................................................... 50 Figure 24. Contaminant Plume Capture Zone, Horizons A and B ............................................... 51 Figure 25. Contaminant Plume Capture Zone, Horizons C and D ............................................... 51 Figure 26. Uranium Concentration versus Time, Horizons A and B Monitor Wells ................... 52 Figure 27.Uranium Concentration versus Time, Horizons C and D Extraction Wells................. 52 Figure A−1. Well Screen Intervals and Horizons.................................................................... A−11
Tables Table 1. Ground Water Remediation Goals.................................................................................... 3 Table 2. COPC Mass Removal Summary....................................................................................... 4 Table 3. Vertical Hydraulic Gradients Between Horizons ........................................................... 13 Table A−1. Aquifer Horizon Elevations.................................................................................... A−3 Table A−2. Well Screen Intervals.............................................................................................. A−4 Table A−3. Extraction and Injection Well Design Rates and Screened Horizons..................... A−7 Table A−4. Extraction Well Pumping Rate Summary............................................................... A−8 Table B−1. Baseline and August 2003 Nitrate Concentrations ................................................. B−3 Table B−2. Baseline and August 2003 Molybdenum Concentrations....................................... B−6 Table B−3. Baseline and August 2003 Selenium Concentrations ............................................. B−9 Table B−4. Baseline and August 2003 Sulfate Concentrations............................................... B−12 Table B−5. Baseline and August 2003 Uranium Concentrations ............................................ B−15 Table C−1. August 2003 Drawdown from Baseline Ground Water Levels .............................. C−3

Document Number U0192600 Contents
DOE/Office of Legacy Management Tuba City Semi-Annual Performance Evaluation January 2004 Page v
Appendices Appendix A Tuba City Project Well Data Appendix B Ground Water Sample Results for August 2003 and the Baseline Period for
Contaminants Requiring Remediation Appendix C Water Levels and Drawdown Information

This page intentionally left blank

Document Number U0192600 March 2003 through August 2003
DOE/Office of Legacy Management Tuba City Semi-Annual Performance Evaluation January 2004 Page 1
1.0 Introduction
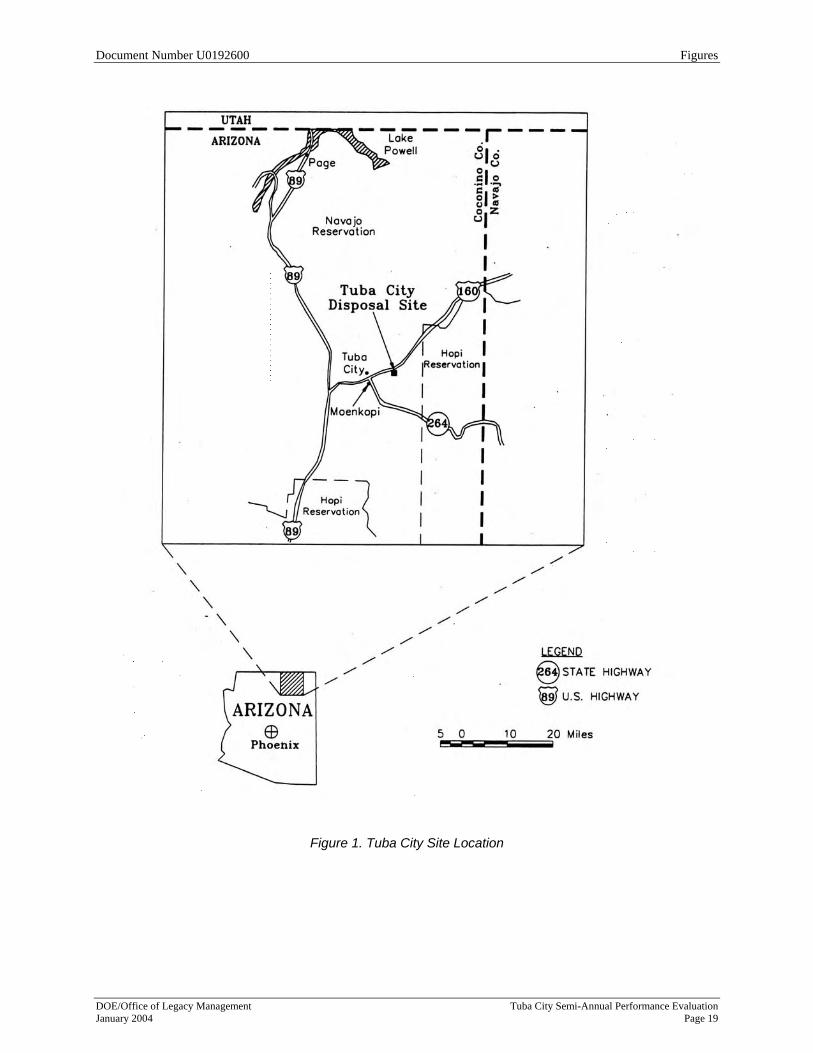
This report presents an evaluation of the pump-and-treat ground water remediation system at the U.S. Department of Energy (DOE) Tuba City site, near Tuba City, Arizona (Figure 1), for the period of March through August 2003. The evaluation is based primarily on a comparison of site conditions in July and August 2003 with baseline conditions established during 1999 through February 2002 (DOE 2003a). Cumulative effects, such as treatment volumes and contaminant mass removal since full-time remediation began in mid-2002, are also addressed. The main ground water contaminants requiring remediation are nitrate and uranium, which extend vertically about 100 to 200 feet (ft) below the top of the Navajo Sandstone bedrock aquifer. Ground water contamination, as nitrate, laterally extends a maximum of 2,000 ft to the south and southwest of the 145-acre site to affect an off-site area of approximately 120 acres. The ground water remediation system comprises (1) 25 ground water extraction wells completed within the most contaminated region of aquifer, (2) ion-exchange pre-treatment and distillation treatment, (3) solar evaporation of waste liquids in engineered ponds, (4) infiltration of treated water via an engineered trench on the upgradient side of the plume, and (5) six injection wells along the downgradient terminus of the contaminant plume to return treated water to the aquifer. To date, the injection wells have not been used; all treated ground water is discharged to the infiltration trench. Primary site features are shown in Figure 2. 1.1 Performance Monitoring The scope of routine monitoring conducted to evaluate remediation system performance is summarized below. Treatment System • Bulk inflow to treatment system is metered continuously and recorded weekly (equivalent
to the bulk ground water extraction rate). • Treatment system effluent flows (waste-stream and distillate) are metered continuously and
recorded weekly. • Bulk inflow composition is analyzed weekly from a composite sample collected over a
5-day period. • Treatment system effluents/compositions are analyzed weekly from composite samples
collected over a 5-day period. Extraction and Injection System • Ground water levels in monitoring wells are measured and recorded monthly. • Ground water levels in extraction wells are measured and recorded twice yearly (February
and August; not all extraction wells are currently equipped for water level measurement). • Monitor wells are sampled twice yearly (February and August) for water quality analysis. • Extraction wells are sampled monthly for water quality analysis. • Flow from each extraction well is monitored continuously and flow totals are recorded
daily per well.

March 2003 through August 2003 Document Number U0192600
Tuba City Semi-Annual Performance Evaluation DOE/Office of Legacy Management Page 2 January 2004
1.2 Performance Standards Specific performance standards as established for the Tuba City ground water remediation system (DOE 2003a) are summarized below. General Performance Standards • Horizontal hydraulic gradients within contaminated regions should point inward to the
extraction wells. • Vertical hydraulic gradients above and below the extraction well screens should be
downward and upward, respectively. • The extraction system should ultimately reduce contaminant concentrations within the
plume to acceptable levels. Extraction System Design Standards • The actual cumulative extraction rate should approximate the design cumulative extraction
rate of 100 gallons per minute (gpm). • Actual drawdown in the vicinity of the extraction wells should approximate the design
drawdown of 30 ft. • The existing extraction system should capture those portions of the plume having the
greatest dissolved contaminant mass. Treatment System Design Standards • The system was designed to treat 100 gpm with an on-stream factor of 85 percent. The
actual influent rate will be compared to the design influent rate to verify that the system is performing as expected.
• The system was designed to produce distillate with less than 50 milligrams per liter (mg/L) total dissolved solids (TDS). The actual effluent dissolved solids concentration will be compared to the design effluent concentration to assess treatment effectiveness.
• The system was designed to produce approximately 15 percent of the original volume of influent water as concentrated brine. Deviation from this percentage is an efficiency performance measure of the treatment process.
1.3 Ground Water Remediation Goals Contaminants requiring active ground water remediation at the Tuba City site are molybdenum, nitrate, selenium, uranium, and sulfate (DOE 1999). Restoration goals for each analyte but sulfate correspond to maximum contaminant levels (MCLs) as established by the U.S. Environmental Agency (EPA) (Table 1). The Navajo Nation proposed the remediation goal for sulfate, which has no MCL. Water quality goals requested by the Navajo Nation for other parameters are also indicated in Table 1.

Document Number U0192600 March 2003 through August 2003
DOE/Office of Legacy Management Tuba City Semi-Annual Performance Evaluation January 2004 Page 3
Table 1. Ground Water Remediation Goals
Constituent/Property Remediation Goal Baseline Concentrations in Plume
Nitratea 10 mg/L as N (44 mg/L as NO3–) 840–1,500 mg/L
Molybdenuma 0.10 mg/L 0.01–0.58 mg/L Seleniuma 0.01 mg/L 0.01–0.10 mg/L Uraniuma 30 pCi/L (0.044 mg/L) U-234 + U-238 0.3–0.6 mg/L TDSb 500 mg/L 3,500–10,000 mg/L Sulfateb 250 mg/L 1,700–3,500 mg/L Chlorideb 250 mg/L 20–440 mg/L pHb 6.5–8.5 6.3–7.6 Corrosivityb not corrosive not applicable
aMCL and required remediation goal. bSecondary remediation goal requested by the Navajo Nation.
1.4 Hydrogeologic Setting Ground water beneath the Tuba City site occurs in the N-Aquifer, which comprises relatively flat-lying sedimentary rocks of the Navajo Sandstone, Kayenta Formation, and Moenave Formation. The Navajo Sandstone consists of fine-to-medium grained massively cross-bedded aeolian sand. It is weakly cemented and friable in the site area. Occasional remnants of former playa lakes are present as resistant, thin limestone beds. Sandstone, siltstone, and mudstone of fluvial origin comprise the Kayenta Formation. A transitional zone (“intertonguing” interval) approximately 250 to 350 ft thick, sharing both aeolian and fluvial features, separates the Navajo Sandstone and Kayenta Formation. Combined thickness the Navajo Sandstone and intertonguing interval is between about 500 and 600 ft at the site. Little is known about the Moenave Formation in the site area. From a regional perspective, it tends to be a relatively fine-grained unit (Cooley et al. 1969) and, therefore, is not expected to transmit ground water readily. In addition, because the Moenave Formation lies several hundreds of feet below the deepest measured contamination at the site, it is unlikely to provide a medium for contaminant movement. As discussed in the following paragraph, local ground water within this unit may be affected by regional ground water discharge south of the Tuba City site. Predominantly north to south ground water flow is controlled by regional discharge to Moenkopi Wash located approximately 2 miles south of the site (Figure 2). Significant vertical hydraulic gradients in project monitor wells suggest that vertical flow may be an important process. The site lies on the middle of three alluvial terraces associated with ancestral surface flows in the wash. Locally, ground water in the Navajo Sandstone is discharged as evapotranspiration from a greasewood stand along the base of the escarpment separating the middle and lower terraces (Figure 2). Under non-pumping conditions, depth to ground water in the Navajo Sandstone under the disposal cell area is generally 50 ft; however, ground water is about 20 ft below ground surface in the greasewood area under pumping and non-pumping conditions. The terraces are mantled with up to about 25 to 30 ft of unconsolidated, unsaturated dune sand and alluvium. The basal alluvium may be locally saturated in the greasewood area, where the depth to water is about 18 to 20 ft below ground surface.

March 2003 through August 2003 Document Number U0192600
Tuba City Semi-Annual Performance Evaluation DOE/Office of Legacy Management Page 4 January 2004
For convenience in evaluating subsurface conditions, the aquifer beneath the site is divided into 50-ft intervals, each of which is assigned a letter designation, beginning with the 5,000−5,050 ft elevation interval (Horizon A) and ending with the 4,400−4,450 ft elevation interval (Horizon M). Horizons A through C approximately comprise the Navajo Sandstone, Horizons D through J are approximately equivalent to the intertonguing interval, and Horizons K through M generally correspond to the upper portion of the Kayenta Formation. Tabulated and graphical information regarding aquifer horizons and the screened intervals of site wells is provided in Appendix A. Well designations are according to the horizon in which the mid-point of the screen is located. The Tuba City ground water investigation focuses primarily on the upper 250 ft of the bedrock aquifer (Horizons A through E). Ground water extraction wells uniformly screen Horizons C and D entirely, and about one-half of Horizons B and E.
2.0 Six-Month Extraction and Treatment Summary
Between February 28 and August 29, 2003, the treatment unit was in operation for 2,510 hours out of a possible 4,368 hours, resulting in an on-stream factor of 57 percent. The 28 percent difference between the actual on-stream time and design capacity (85 percent on-stream time) was due primarily to unanticipated treatment system shutdown in early April and late May. A total of 15,668,000 gallons of water was treated during the 6-month period, resulting in an average on-stream feed rate of 104 gpm and an effective rate, accounting for all downtime, of about 60 gpm. As of August 29, 2003, approximately sixty million gallons of ground water had been treated, which amounts to about 2 percent of the total estimated volume of the pre-pumping contaminant plume. The weekly inflow rate and the variation of uranium mass in the bulk feed to the treatment system for the 6-month period is shown in Figure 3. Minimum and maximum uranium concentrations were 0.20 and 0.67 mg/L, respectively. The mean uranium concentration, determined from the weekly average concentration, was 0.35 mg/L, and the mass of uranium removed from the aquifer for the period was 44 pounds. Table 2 presents additional data regarding uranium recovery and analogous recovery data for nitrate and sulfate. Variation in nitrate and sulfate concentrations in the bulk extract is shown in Figure 4. Predicted remediation times as determined from current removal rates are provided in Section 5.3.
Table 2. COPC Mass Removal Summary
COPC Average
Bulk Feed Composition
(mg/L)
Six-Month Mass
Removal (lb)
Cumulative Mass
Removed (lb)
Initial Mass above
Remedial Goal (lb)a
Initial Volume of
Ground Water above Goal (gal)a
Cumulative Mass
Reduction (%)
Nitrate 458 58,860 218,170 12,400,000 3.4E+09 1.8 Sulfate 1,108 141,640 539,930 17,900,000 2.7E+09 3.0
Uranium 0.35 44 169 2,800 3.0E+09 6.1 aSource: DOE 2003a
Document Number U0192600 March 2003 through August 2003
DOE/Office of Legacy Management Tuba City Semi-Annual Performance Evaluation January 2004 Page 5
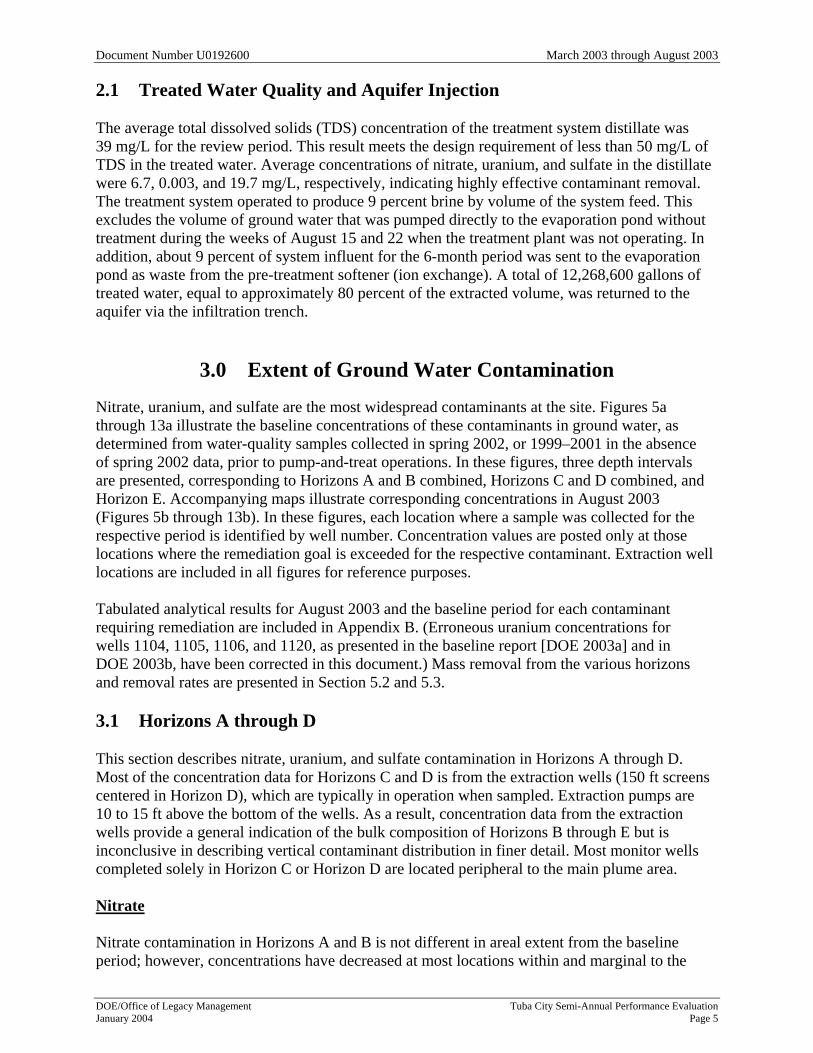
2.1 Treated Water Quality and Aquifer Injection The average total dissolved solids (TDS) concentration of the treatment system distillate was 39 mg/L for the review period. This result meets the design requirement of less than 50 mg/L of TDS in the treated water. Average concentrations of nitrate, uranium, and sulfate in the distillate were 6.7, 0.003, and 19.7 mg/L, respectively, indicating highly effective contaminant removal. The treatment system operated to produce 9 percent brine by volume of the system feed. This excludes the volume of ground water that was pumped directly to the evaporation pond without treatment during the weeks of August 15 and 22 when the treatment plant was not operating. In addition, about 9 percent of system influent for the 6-month period was sent to the evaporation pond as waste from the pre-treatment softener (ion exchange). A total of 12,268,600 gallons of treated water, equal to approximately 80 percent of the extracted volume, was returned to the aquifer via the infiltration trench.
3.0 Extent of Ground Water Contamination
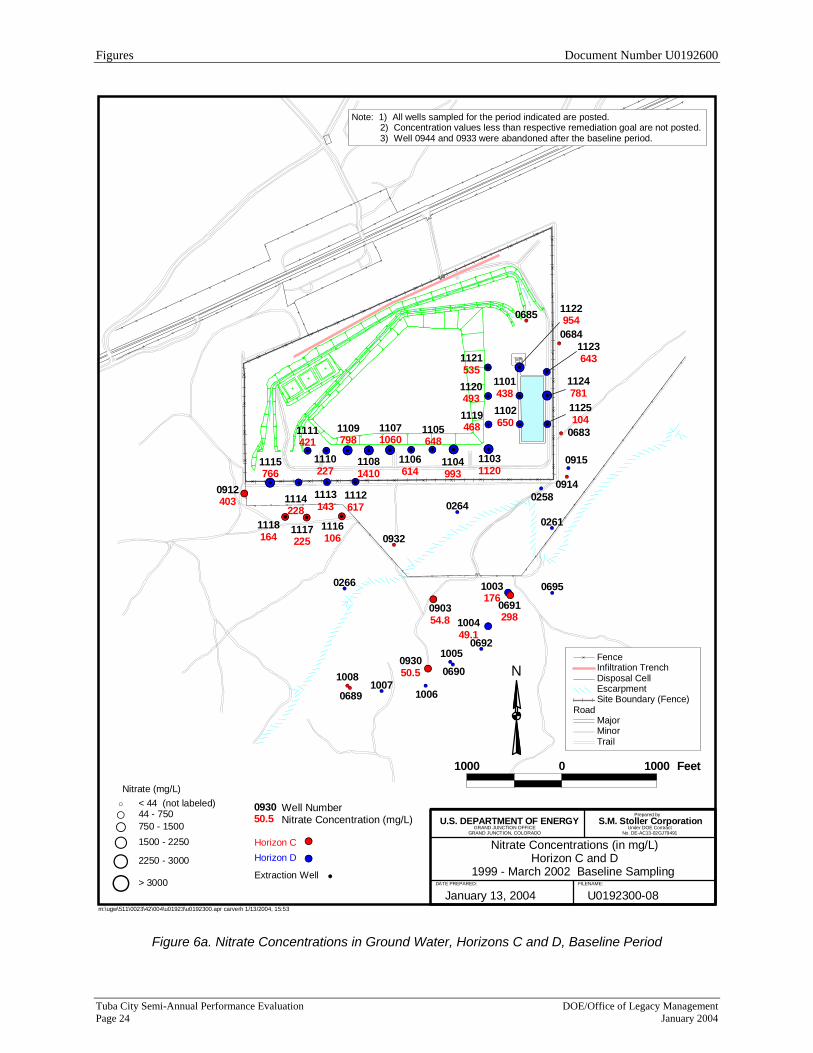
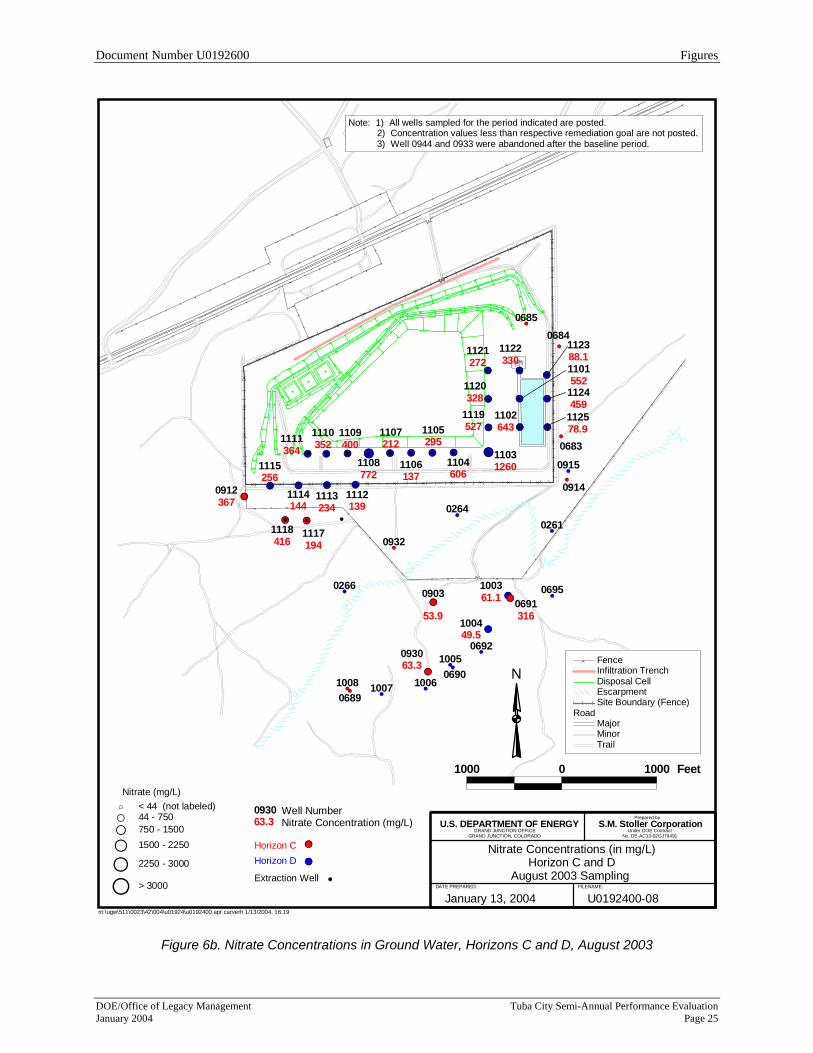
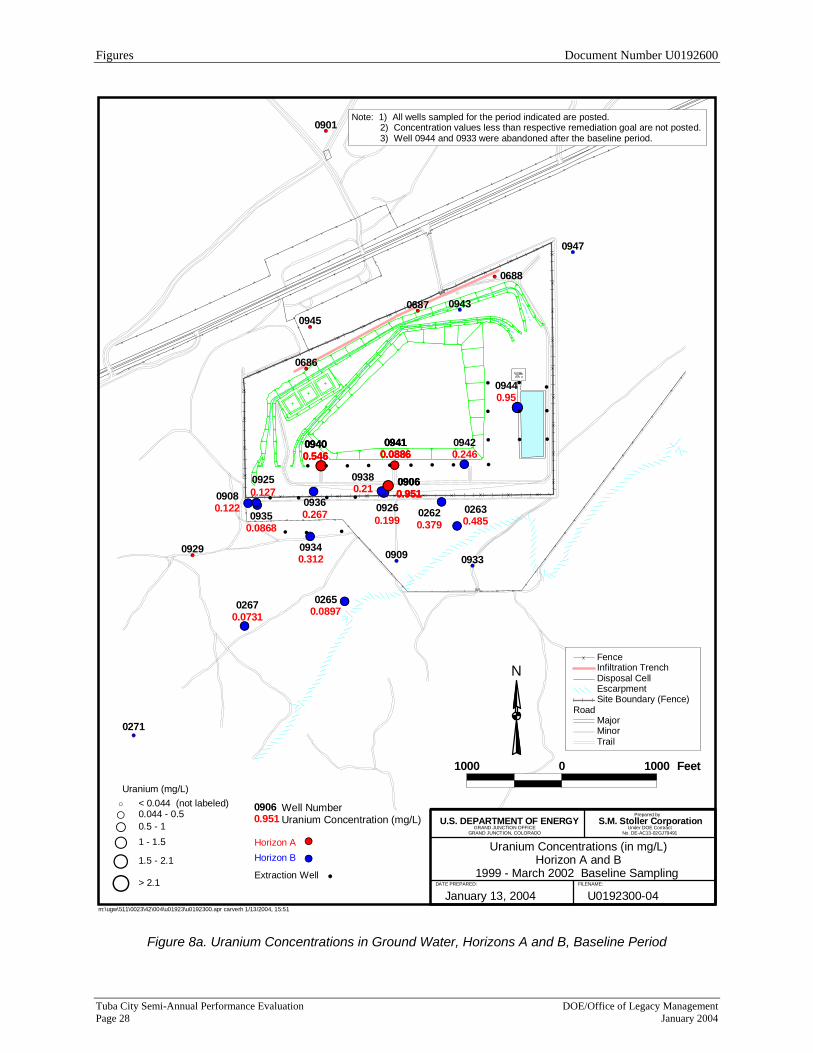
Nitrate, uranium, and sulfate are the most widespread contaminants at the site. Figures 5a through 13a illustrate the baseline concentrations of these contaminants in ground water, as determined from water-quality samples collected in spring 2002, or 1999–2001 in the absence of spring 2002 data, prior to pump-and-treat operations. In these figures, three depth intervals are presented, corresponding to Horizons A and B combined, Horizons C and D combined, and Horizon E. Accompanying maps illustrate corresponding concentrations in August 2003 (Figures 5b through 13b). In these figures, each location where a sample was collected for the respective period is identified by well number. Concentration values are posted only at those locations where the remediation goal is exceeded for the respective contaminant. Extraction well locations are included in all figures for reference purposes. Tabulated analytical results for August 2003 and the baseline period for each contaminant requiring remediation are included in Appendix B. (Erroneous uranium concentrations for wells 1104, 1105, 1106, and 1120, as presented in the baseline report [DOE 2003a] and in DOE 2003b, have been corrected in this document.) Mass removal from the various horizons and removal rates are presented in Section 5.2 and 5.3. 3.1 Horizons A through D This section describes nitrate, uranium, and sulfate contamination in Horizons A through D. Most of the concentration data for Horizons C and D is from the extraction wells (150 ft screens centered in Horizon D), which are typically in operation when sampled. Extraction pumps are 10 to 15 ft above the bottom of the wells. As a result, concentration data from the extraction wells provide a general indication of the bulk composition of Horizons B through E but is inconclusive in describing vertical contaminant distribution in finer detail. Most monitor wells completed solely in Horizon C or Horizon D are located peripheral to the main plume area. Nitrate Nitrate contamination in Horizons A and B is not different in areal extent from the baseline period; however, concentrations have decreased at most locations within and marginal to the

March 2003 through August 2003 Document Number U0192600
Tuba City Semi-Annual Performance Evaluation DOE/Office of Legacy Management Page 6 January 2004
main plume (Figures 5a and 5b). An exception to the general decreasing trend occurs at well 943, located at the east section of the infiltration trench, where the nitrate concentration has increased to exceed the remediation goal for this constituent. Nitrate concentrations in C and D horizon monitor wells have not changed appreciably since the baseline period (Figures 6a and 6b). Wells that were uncontaminated during the baseline period remain uncontaminated (e.g., wells 266, 932, and 264), and concentrations at the remaining locations are similar to baseline values (e.g., nitrate concentrations at well 912 of 403 and 367 mg/L, baseline and August 2003 results, respectively). Nitrate concentrations in the extraction wells are generally less than during the baseline period. However, this latter observation may be due to the fact that since the start of remediation, extraction well samples are more likely mixtures of ground water from multiple horizons, some of which may be uncontaminated (e.g., Horizon E, Figures 7a and 7b). Uranium The areal extent of uranium contamination in Horizons A and B during August 2003 is very similar to that observed during the baseline period (Figures 8a and 8b). However, concentrations in these shallow horizons have generally decreased at many locations within and marginal to the main plume. Again, well 943 (located at the east section of the infiltration trench) provides an exception to this observation, as uranium concentrations have increased to exceed the remediation goal of 0.044 mg/L. Figures 9a and 9b show that uranium concentrations in C and D horizon monitor wells have also not changed appreciably since the baseline period: wells that were uncontaminated during the baseline period remain uncontaminated (e.g., wells 266, 912, 932, and 264), and uranium concentrations at the remaining monitoring locations are similar to baseline values (e.g., uranium concentrations at well 932 of 0.0016 and 0.0017 mg/L, baseline and August 2003 results, respectively). As with nitrate, and for the same reason, uranium concentrations in the extraction wells are generally less than during the baseline period. Uranium contamination in the horizons deeper than Horizon E, as shown in Figures 10a and 10b, is discussed in Section 3.2. Sulfate Sulfate contamination in Horizons A and B is also not different in areal extent from the baseline period (Figures 11a and 11b). Since that time however, sulfate concentrations have decreased at some locations and increased at others, including previously mentioned well 943. Sulfate concentration increases are mainly localized within the extraction field and are not suggestive of plume expansion. Sulfate concentrations in C and D horizon monitor wells have not changed appreciably between the baseline period and August 2003 (Figures 12a and 12b). Wells that were uncontaminated during the baseline period remain uncontaminated (e.g., wells 266, 932, and 264), and sulfate concentrations at the remaining monitor wells are similar to baseline values. Sulfate concentrations in the extraction wells are generally less than during the baseline period.

Document Number U0192600 March 2003 through August 2003
DOE/Office of Legacy Management Tuba City Semi-Annual Performance Evaluation January 2004 Page 7
3.2 Horizons E and Deeper Baseline sampling results indicated contamination of nitrate, uranium and sulfate at well 251, completed with mid-screen depth in Horizon E (Figures 7b, 10b, and 13b). Since the start of ground water remediation, concentrations of each contaminant in well 251 have decreased to below each respective water quality goal. Contamination levels at the remaining upper terrace E-horizon well (well 268) has remained consistent with background values throughout the baseline and remediation periods. Water quality results for the only Horizon E well on the lower terrace (well 920) indicate that ground water contamination has never reached that location. These data indicate that contamination in Horizon E was minor in lateral extent and magnitude prior to the start of ground water remediation, and that presently Horizon E is not contaminated. Deep wells 254 (Horizon I), 255 (Horizon M), 256 (Horizon I), and 257 (Horizon M) were installed in May 2000. Each of these wells exhibits contamination of either nitrate, uranium, or sulfate in excess of the remediation goal. Concentrations of these constituents during initial samplings at each location were consistent with background or did not exceed remediation goals. Since the first appearance of contamination in these wells, concentrations have generally been unstable. The origin of this apparent contamination in the deep horizons is uncertain. A fifth deep well (well 253, Horizon M), installed in May 2000 adjacent to wells 251 and 252, also showed evidence of contamination. Because of extensive grout invasion of the well screen, well 253 was abandoned in April 2001. Since that time, down-hole video images indicate that grout has apparently also invaded the screens of wells 254 and 256 (the camera cable could not reach the screen depths of wells 255 and 257). Material collected from the bottom of well 254 in October 2003 had the appearance and texture of bentonite grout. At that time, the well depth was approximately 15 ft higher than when first installed. The delayed arrival of contamination in deep wells 253 through 257, combined with evidence of potentially compromised annular seals, as indicated by grout invasion, and the apparent absence of contamination in overlying Horizon E, suggests that monitoring results from these wells may be unrepresentative of the ground water in the formation intercepted by their screens. DOE is preparing a separate report, due in 2004, to specifically address the source of contamination in these wells and determine if subsequent action is warranted. 3.3 Extent of Contamination Summary • Nitrate, uranium, and sulfate contamination in Horizons A and B is similar in areal extent
than that observed in the baseline period. In general, concentrations have decreased at many locations within and marginal to the main plume.
• Nitrate, uranium, and sulfate concentrations in C and D horizon monitor wells have not
changed appreciably from those measured under baseline conditions. Wells that were uncontaminated during the baseline period remain uncontaminated, and concentrations at the remaining locations are similar to baseline values.
• Concentrations of nitrate, uranium, and sulfate at well 943 (Horizon B) have increased
from relatively low levels in the baseline period to exceed the remediation goals in
March 2003 through August 2003 Document Number U0192600
Tuba City Semi-Annual Performance Evaluation DOE/Office of Legacy Management Page 8 January 2004
August 2003. The cause of the increases is not certain. Ground water at this location is estimated to be within the capture zone of the extraction system.
• On the lower terrace, uranium contamination occurs only in well 691 (Horizon C) but
at a concentration that does not greatly exceed the remediation goal. Nitrate and sulfate concentrations remain above the remediation goal at that location and in adjacent well 1003 (Horizon D). Surrounding wells on the lower terrace indicate minor nitrate contamination (less than twice the remediation goal) and no sulfate contamination.
• Ground water contamination in Horizon E slightly exceeded remediation goals in the
baseline period. Remediation goals have since been attained in Horizon E. • Due to potentially compromised annular well seals, low-level contamination in Horizons I
and M (wells 254, 255, 256, 257) may be unrepresentative of the ground water in the formation intercepted by the well screens.
4.0 Hydraulic Response of Aquifer to Extraction and Injection
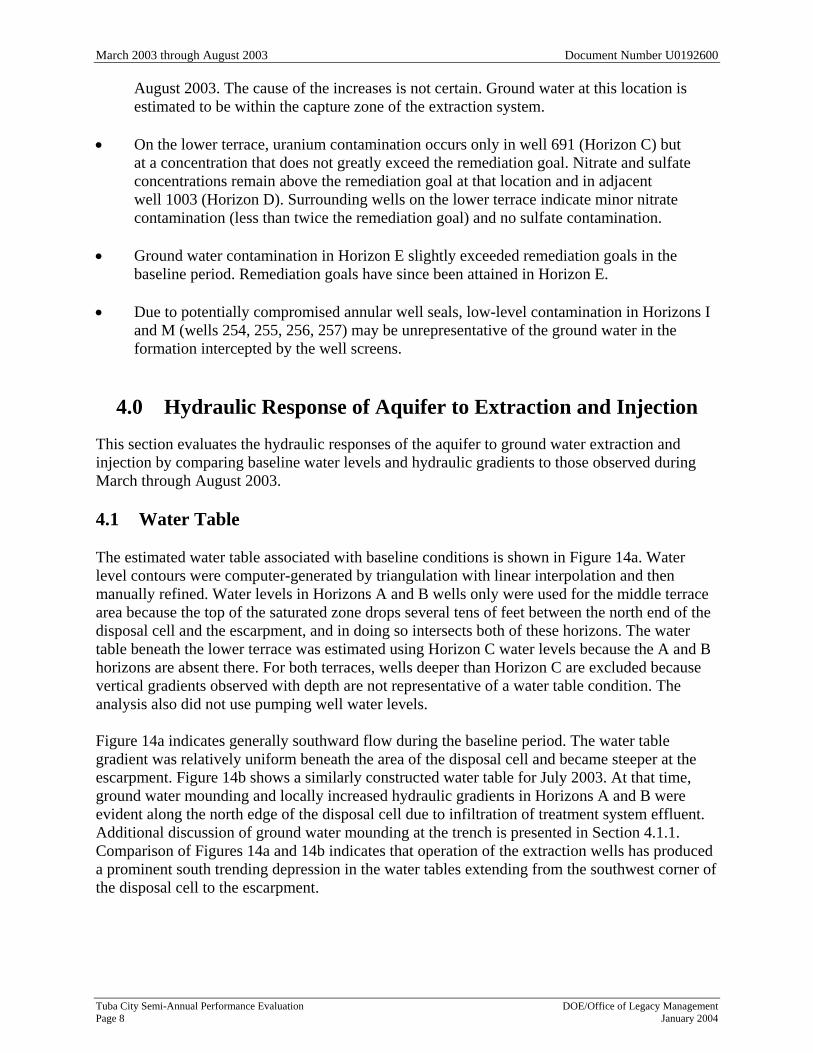
This section evaluates the hydraulic responses of the aquifer to ground water extraction and injection by comparing baseline water levels and hydraulic gradients to those observed during March through August 2003. 4.1 Water Table The estimated water table associated with baseline conditions is shown in Figure 14a. Water level contours were computer-generated by triangulation with linear interpolation and then manually refined. Water levels in Horizons A and B wells only were used for the middle terrace area because the top of the saturated zone drops several tens of feet between the north end of the disposal cell and the escarpment, and in doing so intersects both of these horizons. The water table beneath the lower terrace was estimated using Horizon C water levels because the A and B horizons are absent there. For both terraces, wells deeper than Horizon C are excluded because vertical gradients observed with depth are not representative of a water table condition. The analysis also did not use pumping well water levels. Figure 14a indicates generally southward flow during the baseline period. The water table gradient was relatively uniform beneath the area of the disposal cell and became steeper at the escarpment. Figure 14b shows a similarly constructed water table for July 2003. At that time, ground water mounding and locally increased hydraulic gradients in Horizons A and B were evident along the north edge of the disposal cell due to infiltration of treatment system effluent. Additional discussion of ground water mounding at the trench is presented in Section 4.1.1. Comparison of Figures 14a and 14b indicates that operation of the extraction wells has produced a prominent south trending depression in the water tables extending from the southwest corner of the disposal cell to the escarpment.

Document Number U0192600 March 2003 through August 2003
DOE/Office of Legacy Management Tuba City Semi-Annual Performance Evaluation January 2004 Page 9
4.1.1 Ground Water Mounding
Treatment plant distillate enters the infiltration trench at a concrete vault about halfway between its endpoints and is then conveyed in perforated PVC piping to the northeast and southwest by gravity flow. The piping lies in a 3-ft thick gravel bed underlain by bedrock sandstone or unconsolidated alluvium, depending on location. Non-uniform infiltration of the treated water has created the asymmetrical ground water mound along the trench shown in Figure 14b. About 18 ft of mounding, relative to baseline conditions, resulted beneath the west section of the trench in July 2003, whereas only about 1 ft of mounding occurred beneath the eastern section. Mounding is greatest toward the southwest end of the trench either because most treatment effluent enters that end; or, the resistance to flow in Horizon A is larger below the southwest part of the trench. Ground water modeling performed in support of remedial system design predicted approximately 5 ft of mounding distributed uniformly along the length of the trench (DOE 1998). Ground water mounding at the infiltration trench should be evaluated before any major change is made to the ground water extraction and treatment system to ensure that the water table will not rise to the level of the mill tailings. At present, the sloped base of the tailings, in combination with sustained drawdown along the south edge of the disposal cell, should provide an adequate margin of safety in preventing the water table from intersecting the tailings and further mobilizing contaminants to ground water. As a precaution, and to evaluate hydraulic response, all distillate was discharged to the run-on drain along the north side of the disposal cell from mid-August through late November 2003. 4.2 Water Level Drawdowns Figures 15, 16, and 17 illustrate computed drawdown in monitor wells during July 2003, relative to baseline water levels, for the various depth horizons. Drawdown calculation data are included in Appendix C. Section 4.2.1 evaluates drawdown and pumping rates in the extraction wells. Horizons A and B Figure 15 shows that water level changes have occurred in all A and B-horizon wells between the baseline period and July 2003. However, measured drawdown in a well does not imply that the well is necessarily within the capture zone of the extraction system (see Section 5.1). Monitor wells completed solely in Horizons A or B are absent within and immediately surrounding the extraction well field east of the disposal cell, and therefore drawdown analysis for that area is not possible. Immediately south of the cell, the maximum observed drawdown is 17 to 18 ft, occurring at or near the center of extraction. Extraction well screens intercept about 20 to 25 ft of Horizon B but no portion of Horizon A. Significant drawdown (2 to 7 ft) results on the middle terrace along the escarpment south of the site. Drawdown in the shallow horizons diminishes to 0.2 ft at well 271, located about 2,000 ft southwest of the extraction well field. Numerical modeling of the site predicted steady-state drawdown of 20 to 30 ft in the immediate area surrounding the extraction wells (DOE 1998) at a total extraction rate of 100 gpm. Ground water extraction during the month preceding the July 2003 water level measurements increased steadily from zero to about 85 gpm. Considering the non-steady pumping during this period, the model result is a close approximation to observed drawdown.
March 2003 through August 2003 Document Number U0192600
Tuba City Semi-Annual Performance Evaluation DOE/Office of Legacy Management Page 10 January 2004
Horizons C and D All C and D-horizon monitor wells appear to be within the zone of influence of the extraction system (Figure 16). Direct analysis of Horizons C and D drawdown within the extraction well field is not possible due to the lack of monitoring wells; however, significant drawdown (10 to 20 ft) occurs in the immediately surrounding area. Generally, 2 to 3 ft of drawdown is observed on the lower terrace, although the actual capture zone does not extend to these lower terrace locations (see Section 5.1). Horizon E and Deeper Extraction well screens extend downward to intercept the upper 25 to 35 ft of Horizon E. Within the extraction well field, drawdowns at Horizon E wells 251 and 268 on July 30, 2003 were about 20 and 30 ft, respectively. Both wells are fully screened across Horizon E and portions of Horizons D and F. Drawdown at the remaining Horizon E well (well 920), located on the lower terrace about 1,200 ft south of the disposal cell, was 9.5 ft. This latter result may indicate relatively high hydraulic conductivity within the horizon. Significant drawdowns observed in Horizons G, I, and M. (up to 8.7, 16.8, and 1.4 ft, respectively; Figure 17) are not necessarily the result of ground water capture from these horizons, but may instead be due to reduced flows to the deep zones from the overlying horizons. 4.2.1 Extraction Well Drawdowns and Pumping Rates
Twenty-four wells were pumped to extract ground water during the period of review. Continuous pumping at many locations is not possible because of well-yield limitations. On-off pump cycling was particularly evident among extraction wells 1112 to 1118 located south of the fence line on the south side of the disposal cell (Figure 2), although on-off cycling affected most locations at some time during the review period. While pumping, the rates at individual wells ranged from about 2.5 to 6.5 gpm, which is consistent with design criteria for the extraction system (Appendix A). However, the effective pumping rate at a given well, which accounts for the time that the pump is idle during the on-off cycles, are generally lower (Table A−4, Appendix A). Sustained pumping tends to increase the incidence of on-off cycling thus decreasing the effective pumping rate. The available drawdown (height of water column above the pump intake) in a well while being pumped is an indication of whether aquifer properties or pump capacity limit the extraction rate. Water levels in all pumping wells (except well 1105) were measured on June 30 and July 1, 2003 to determine available drawdowns. Figure 18 shows the amount of available drawdown in the extraction wells. East of the disposal cell, available drawdown tended to range from about 100 to 140 ft; the single exception (80 ft) occurred at well 1122. Available drawdown ranged from about 50 to 150 ft in the group of wells near the southwest corner of the cell, and from 10 to 156 ft along the south side of the disposal cell. Uncertainty is introduced into these calculations because, for a given well, it is not known at which point during the on-off pump cycle that the water level was measured. In July 2003, 0.75-horsepower pumps in wells 1105, 1106, and 1120 were replaced with 1.5-hp pumps to determine if greater extraction rates could be sustained. Results varied. Extraction rates increased by about 10 percent at wells 1106 and 1120; however, available drawdowns at these wells were reduced to 90 percent and 20 percent of the pre-pumping drawdowns, respectively.

Document Number U0192600 March 2003 through August 2003
DOE/Office of Legacy Management Tuba City Semi-Annual Performance Evaluation January 2004 Page 11
Well 1105 was then inoperable through mid-August but has since sustained an extraction rate of 14.5 gpm. Water levels in well 1105 were not measured for the period since pump operation was restored. Formation yield appears to be rate-limiting in the south group of extraction wells 1112 through 1118 and so current pump capacity is probably adequate for those locations. Mixed results of increasing the pumping capacity at wells 1105, 1106, and 1120 indicates that the potential to achieve greater extraction at other locations by increasing pump capacity is difficult to predict. 4.3 Horizontal Flow Gradients Water level data for the summer of 2003 were analyzed to estimate ground water flow directions within discrete depth intervals of the aquifer. This was accomplished using a grid-based contouring and surface mapping computer program (Surfer, v. 7) to produce a three-dimensional surface of the hydraulic head in the aquifer, as estimated by triangulation and linear interpolation. Horizons A and B were combined in this analysis, as were Horizons C and D. Horizons E, G, and I were evaluated separately. In addition to the potentiometric surface, program output included a hydraulic gradient vector at each grid node. Figures 19 through 23 illustrate the hydraulic gradients for the baseline period and July 2003. Within each vertical interval analyzed, vector scaling (symbol length) is proportional to the magnitude of the hydraulic gradient. However, the proportionality is not preserved between depth intervals. Filled arrows are used to represent baseline hydraulic gradient vectors; unfilled arrows are used to represent July 2003 conditions. Horizons A and B A comparison of baseline and July 2003 flow directions in Horizons A and B suggests that since the start of remediation, horizontal flow is effected in relatively shallow ground water in the area of the infiltration trench, beneath the disposal cell, and within the extraction field south of the disposal cell. North and northwest of the disposal cell, flow directions in July 2003 indicate radially outward flow from the infiltration trench (Figure 19b). Infiltration at the trench combines with ground water extraction to the south to create steeper hydraulic gradient beneath the cell than occurred under baseline conditions. Convergent flow directed toward extraction wells occurs within the extraction field south of the disposal cell but not significantly beyond. The extent to which ground water extraction influences flow directions in Horizons A and B east of the cell is indeterminate because no monitoring wells are located in that area. Section 5.1 presents contaminant capture information for Horizons A and B using both hydraulic gradient and contaminant data. Horizons C and D Figures 20a and 20b illustrate computed horizontal gradient vectors in Horizons C and D. The analysis included water levels in monitor wells and pumping levels in the extraction wells. Without the extraction well data, vector analysis predicted no capture of ground water from these horizons, primarily because there are monitor wells within or adjacent to the extraction field.

March 2003 through August 2003 Document Number U0192600
Tuba City Semi-Annual Performance Evaluation DOE/Office of Legacy Management Page 12 January 2004
The extraction wells have caused a reversal in flow within Horizons C and D for much of the region south of the well field. Capture is not apparent in the area south of extraction wells 1113, 1112, and 1116 because yields from those wells are low, leading to prolonged intervals of water level recovery without pumping. Extremely low yield entirely prevents use of well 1116. Low yields from these wells may not be problematic, however, because Horizons C and D in this area may not be contaminated. As indicated in sample results from wells 266 and 932, measured concentrations of nitrate, uranium, and sulfate in Horizons C and D a short distance south of the extraction field are less than the respective remediation goals (Figures 6, 9, and 12). The influence of the well field east of the disposal cell is to create westward flow toward those extraction wells. Ground water capture does not occur anywhere on the lower terrace or in the southwest area of the middle terrace. Horizon E and Deeper Figure 21 presents the horizontal flow direction calculated for a limited area of Horizon E. The July 2003 flow direction deviated east of the baseline direction and the magnitude of the gradient was less. The E-horizon flow direction in February 2003 was identical to that of the baseline although the magnitude of the gradient was less (DOE 2003a). Relatively greater drawdown in July at well 268, located at the south end of the east group of extraction wells, resulted in the apparent deviation in flow direction. The difference in drawdown and apparent flow direction may be a transient effect of the varied pumping histories preceding analysis. Although not indicated in Figure 21, ground water capture from Horizon E is probable because all but three of the extraction wells (1116, 1117, and 1118) have screens extending into that horizon. The extent of capture in Horizon E cannot be fully characterized by horizontal flow vectors because the only three monitor wells having screens centered on this interval are too widely spaced. The reduction in the magnitude of the hydraulic gradient suggests, however, that the rate of southward horizontal ground water flow in Horizon E has decreased in response to ground water extraction. Figure 22 shows no significant change in the direction or magnitude of horizontal gradients between baseline and July 2003 conditions for Horizon G, indicating that current ground water extraction exerts no influence on horizontal flow in this horizon. The lack of response is likely because the deepest screened interval in the extraction wells is Horizon E. Flow directions in Horizon I implied by the calculated gradients have remained consistent with the baseline condition (Figure 23). However, the magnitudes of the gradients were significantly less in July 2003 than those computed for baseline conditions. This reduction in hydraulic gradient magnitude was not observed during the previous evaluation period (DOE 2003a). It is inconclusive at this time whether the gradient reduction in Horizon I during July 2003 is real or the result of other factors such as a failed annular seal in one of the wells used in this analysis. 4.4 Vertical Hydraulic Gradients Analysis of vertical flow gradients provides some indication of the capture depth of the extraction system. Table 3 presents a comparison of computed vertical gradients under baseline and July 2003 conditions. Data for wells that screen adjacent horizons is limited to five paired sets within Horizons A through D. No well pairs exist that screen adjacent deeper horizons.

Document Number U0192600 March 2003 through August 2003
DOE/Office of Legacy Management Tuba City Semi-Annual Performance Evaluation January 2004 Page 13
Table 3. Vertical Hydraulic Gradients Between Horizons
Well Pair Horizons Date Gradienta (ft/ft) Date Gradienta
(ft/ft) 901−910 A−B September 1998 0.024 July 2003 0.028 906−938 A−B February 1999 0.040 July 2003 0.071 908−912 B−C March 2000 0.019 July 2003 0.057 909−932 B−C September 2000 0.67 July 2003 0.73 914−915 C−D February 1999 -0.24 July 2003 -0.011 903−920 C−E September 2000 0.030 July 2003 0.090 915−916 D−G February 1999 0.14 July 2003 0.099 251−252 E−I May 2000 0.040 July 2003 -0.045 268−256 E−I May 2000 0.10 July 2003 -0.020 920−921 E−I September 2000 0.060 July 2003 0.04 254−255 I−M May 2000 0.073 July 2003 0.10 256−257 I−M May 2000 0.011 July 2003 0.00
aPositive gradient indicates downward flow potential; negative gradient indicates upward flow potential. In Horizons A, B, and C, which are above the screen centers of the majority of the extraction wells, July 2003 vertical gradients indicate downward flow. The downward vertical gradient at upgradient well pair 901/910 (Horizons A and B, respectively) has essentially remained unchanged from the baseline condition. At the remaining locations used to compute vertical gradients in these upper horizons, the magnitude of the downward gradient in July 2003 was larger than baseline equivalents. At well pair 914/915, flow between Horizons C and D remained upward during the evaluation period, although the vertical gradient at this location had a lower magnitude compared to the baseline value. Contaminant concentrations at these wells during July 2003 are consistent with background levels. Upward flow from mid to upper horizons at this location on the middle terrace may be due to ground water discharge by evapotranspiration along the base of escarpment, where Horizons A, B, and C are exposed and a stand of phreatophytes (greasewood) is present. Well 916, nested with wells 914 and 915, is screened solely in Horizon G. Contrary to the upward gradient observed in the 914/915 well pair a downward vertical flow potential persists between wells 915 (Horizon D) and 916 (Horizon G). The relatively large gradient (approximately 0.1 ft/ft) remains consistent with the baseline gradient computed for this well pair. The apparent vertical flow divide at this location may signify divergence of a shallow flow system from a deeper regional system that ultimately discharges at Moenkopi Wash. Since the start of ground water remediation, the vertical flow gradient between the E and I horizons at middle terrace well pairs 251/252 and 268/256 has been upward, in contrast to the downward potential observed at these locations for the baseline period. The reversal in the vertical gradient between these horizons suggests that operation of the extraction system contributes in preventing downward migration of contaminants on the middle terrace. The vertical flow potential between Horizons E and I on the lower terrace, as indicated at well pair 920/921, has remained downward since the baseline period although at a slightly decreased magnitude since the start of pumping. Downward vertical gradients have also persisted between the C and E horizons at the same location as indicated by well pair 903/920.

March 2003 through August 2003 Document Number U0192600
Tuba City Semi-Annual Performance Evaluation DOE/Office of Legacy Management Page 14 January 2004
Computed vertical gradients between Horizons I and M at middle terrace well pair 254/255 have been downward during and since the baseline period. Since the start of remediation, the flow potential between well 256 (I horizon) and 257 (M horizon) changed from downward to neutral. This effect appears to primarily result from pumping, as manifested in extensive drawdown in Horizon E, moderate drawdown in Horizon I, and relatively stable water levels in Horizon M.
5.0 Plume Capture and Contaminant Recovery
5.1 Plume Capture The estimated capture zone of the extraction system, as it affects contaminant recovery, is illustrated in Figures 24 and 25 for Horizons A and B combined, and C and D combined, respectively. The dashed line in each figure defines the southern extent of the ground water capture zone as determined by analysis of July 2003 water level data described in Section 4.0. Proportionally scaled circles indicate the relative magnitude of contaminant concentration in wells where the respective remediation goal is exceeded. Figures 24 and 25 suggest that the current configuration and operation of the extraction system effectively captures the region of maximum contamination. Hydraulic containment of all contaminated flow from the site is also achieved. Upward flow potentials from deep zones to Horizon E (Section 4.4) and the absence of contamination in Horizon E (Section 3.0) are indicative of vertical containment of contaminated ground water within the main plume area. Contamination currently not captured by the extraction system includes moderately high concentrations of uranium and nitrate in wells 262 and 263 located in the southeast portion of the middle terrace area. In the remaining middle terrace area beyond the capture zone, uranium concentrations are less than or marginally exceed the uranium remediation goal. Moderate levels of nitrate and sulfate are also present. Migration of contamination toward Moenkopi Wash within these areas may be hindered by ground water discharge along the escarpment and to the greasewood stand. Contamination on the lower terrace is generally restricted to dilute concentrations of nitrate, uranium, and sulfate at co-located wells 691 (Horizon C) and 1003 (Horizon D), approximately 1,500 ft south of the site. Contaminant concentrations are lower in the D-horizon than in the C-horizon at this location. Uranium levels are below the standard at well 1003. Low levels of nitrate (50 to 63 mg/L) in wells 903, 1004, and 930 are the only other indications of contamination on the lower terrace. 5.2 Contaminant Recovery from Aquifer Horizons Monitoring results indicate that contamination is currently restricted to Horizons A through D; however, the relative contribution of contaminated ground water from each of these horizons to the treatment system is difficult to evaluate because the screened intervals of many of the wells used to define contaminant extent intercept more than one horizon. For example, on the basis of uranium concentration data from the pumping wells, Horizon D appears to be highly contaminated; however, pumping well screens generally extend from within Horizon B to within
Document Number U0192600 March 2003 through August 2003
DOE/Office of Legacy Management Tuba City Semi-Annual Performance Evaluation January 2004 Page 15
Horizon E. Because the baseline distribution of contamination with depth in the extraction wells was not determined it is currently not possible to discern which of the intercepted horizons contains the greatest contamination. Excluding the extraction wells, Horizon C and D monitor wells are located peripheral to the main plume area. Numerous A and B horizon wells that exhibit high levels of contamination define the main portion of the plume near the site; however, there are no co-located C and D wells to indicate the depth to which the contamination extends. There are several locations toward the margins of the contaminant plume where wells completed in either Horizon A or B are near or adjacent to Horizon C or D wells (e.g., wells 935 and 912, B and C horizons, respectively; 265 [B] and 266 [D]; 909 [B] and 932 [C], and 263 [B] and 264 [D]). In each case, contaminant concentrations in the well screened in Horizon A or B exceed those in the corresponding C or D horizon well. For example, nitrate concentrations at wells 265 (B) and 256 (D) in August 2003 were 575 and 14 mg/L, respectively. Where present on the lower terrace, contamination also decreases significantly from Horizon C to Horizon D. Given this apparent reduction in contaminant concentrations with depth, it is possible that Horizons A and B contribute the greater proportion of contamination to the extraction system. Relatively large drawdowns measured in Horizon A and B wells on the middle terrace tend to support this possibility. 5.3 Contaminant Removal Rates Since the start of remediation in mid-2002, the masses of nitrate, uranium, and sulfate removed from the aquifer total approximately 218,000, 169, and 540,000 pounds, respectively (Table 2). The cumulative removal rates for these contaminants through 1.2 years of full-scale remediation (June 2002 through August 2003) are 182,000; 141, and 450,000 lb/yr, respectively. At these rates, remediation of the nitrate, uranium, and sulfate, plumes will require 68, 20, and 40 years, respectively, since June 2002. This prediction is valid only if volumetric extraction rates increase over time to compensate for decreasing concentrations of contaminants in the ground water, and if the entire plume is captured through expansion of the existing extraction system. By comparison, the estimated volume of contaminated ground water (approximately 3 × 10⁹ gal; Table 2) will require about 67 years to extract at the current, sustained design pumping rate (85 gpm), assuming full plume capture. Figure 26 displays uranium concentration over time at monitor well locations in Horizons A and B within the most contaminated regions of the ground water plume. Analogous concentration versus time data for selected extraction wells are shown in Figure 27. These plots indicate that uranium concentrations are in general static or slightly decreasing since the start of remediation. Increasing concentrations at well 936 are indicative of southward migration of contamination from near the disposal cell to the extraction wells.
6.0 Summary
• Capture of the main portion of the contaminant plume has been achieved. • Vertical plume containment has been achieved. • Ground water remediation goals have been achieved for aquifer horizon E. • On-stream extraction and treatment flow rates achieve design objectives. • Distillate quality meets or exceeds remediation objectives.

March 2003 through August 2003 Document Number U0192600
Tuba City Semi-Annual Performance Evaluation DOE/Office of Legacy Management Page 16 January 2004
• Eighty-percent of extracted water has been returned to the aquifer. • Extraction from Horizon E, although unavoidable with the current system, may no longer
benefit remediation objectives.
7.0 Recommendations
Recommendations pertaining to the operation of present remediation system and the future remediation strategy for the site will be addressed in a separate report prepared in March 2004.
8.0 References
U. S. Department of Energy (DOE), 1998. Final Site Observational Work Plan for the UMTRA Project Site Near Tuba City, Arizona, MAC-GWTUB1.1, U. S. Department of Energy Grand Junction Office, Grand Junction, Colorado, September. ⎯⎯⎯, 1999. Phase I Ground Water Compliance Action Plan for the Tuba City, Arizona, UMTRA Site, GJO−99−99−TAR. U. S. Department of Energy Grand Junction Office, Grand Junction, Colorado, June. ⎯⎯⎯, 2003a. Tuba City UMTRA Site Baseline Performance Evaluation, GJO−2002−370−TAC, GJO-GWTUB 30.13.2-1. U. S. Department of Energy Grand Junction Office, Grand Junction, Colorado, May. ———, 2003b. Tuba City UMTRA Project Site Semi-Annual Performance Evaluation through August 2002, GJO−2003−422−TAC, GJO-GWTUB 30.13.2-2. U. S. Department of Energy Grand Junction Office, Grand Junction, Colorado, May. Cooley, M.E., J.W. Harshbarger, J.P. Akers, and W.F. Hardt, 1969. Regional Hydrogeology of the Navajo and Hopi Indian Reservations, Arizona, New Mexico and Utah, U.S. Geological Survey Professional Paper 521-A, 61 p.

Figures

This page intentionally left blank
Document Number U0192600 Figures
DOE/Office of Legacy Management Tuba City Semi-Annual Performance Evaluation January 2004 Page 19
Figure 1. Tuba City Site Location

Figures Document Number U0192600
Tuba City Semi-Annual Performance Evaluation DOE/Office of Legacy Management Page 20 January 2004
%U%U%U
%U %U
%U
%U
%U
%U
%U
%U %U
%U
%U
%U
%U
%U%U
%U%U
%U%U
%U
%U
%U
%U %U
%U %U %U
%U
%U
%U
%U
%U
%U
%U%U
%U
%U
%U
%U
%U
%U%U
%U
%U
%U
%U
%U
%U
%U
%[
%[
%[
%[
%[
%[
%[
%[
#þ
#þ
#þ#þ#þ
#þ
#S
#S
#S
#S#S#S#S#S#S#S#S
#S#S#S
#S#S
#S
#S
#S
#S
#S #S #S
#S
#S
Water TreatmentSystem
1117
0692
0691
0690
0689
0688
0687
0686
0695
1004
1008 1007 1006
1005
1003
0268
0262
0256
0946
0685
0684
0683
0267
0264
0266
0265
0263
0261
0258
0254
0252
0251
0947
09450943
0942
0941
0938
0936
0934
0930
0921
09160914
091309120908
0906
0903
09320929
0920
0915
09090935
0257
0255
000M 000J
000I 1102 1125
1124
112311221121
1120
1119
1118
1113
1116
1115 1114 11121111
1109 1108
1107 1106
1105 1104 1103
1101
1110
GreasewoodStand
0271
0940
0968
09010910
0911
0948
LowerTerrace
MiddleTerrace
UpperTerrace
1000 0 1000 FeetRoad
MajorMinorTrail
EscarpmentDisposal CellEvaporation PondInfiltration TrenchFenceGreasewood_breaks.shp
%U Plume Monitoring Well%[ Injection Monitoring Well#þ Injection Well#S Extraction Well N
S.M. Stoller CorporationWork Performed by
Under DOE ContractNo. DE-AC13-02GJ79491
DATE PREPARED:
*
FILENAME:
GRAND JUNCTION OFFICEGRAND JUNCTION, COLORADO
U.S. DEPARTMENT OF ENERGY
Tuba City Site Features
U0193500-01
Disposal Cell
Escarpment
GreasewoodStand
MoenkopiWash
0.5 0 0.5 Miles
N
m:\ugw\511\0023\42\004\u01935\u0193500.apr carverh 1/13/2004, 16:41
January 13, 2004
Figure 2. Tuba City Site Features

Document Number U0192600 Figures
DOE/Office of Legacy Management Tuba City Semi-Annual Performance Evaluation January 2004 Page 21
0
10
20
30
40
50
60
70
80
90
100
01-Mar-03 01-Apr-03 01-May-03 01-Jun-03 01-Jul-03 01-Aug-03 01-Sep-03
Date
Wee
kly
Ave
rage
d Fe
ed R
ate
[gpm
]
0.0
0.1
0.2
0.3
0.4
0.5
0.6
0.7
0.8
Wee
kly
Ave
rage
d C
once
ntra
tion
[mg/
L]
feed rate [gpm]
uranium [mg/L]
Figure 3. Rate of Uranium Treatment, March through August 2003
0
10
20
30
40
50
60
70
80
90
100
1-Mar-03 1-Apr-03 1-May-03 1-Jun-03 1-Jul-03 1-Aug-03 1-Sep-03
date
Wee
kly
Feed
Rat
e [g
pm]
0
200
400
600
800
1,000
1,200
1,400
1,600
1,800
Wee
kly
Ave
rage
d C
once
ntra
tion
[mg/
L]
feed rate [gpm]
nitrate as NO3 [mg/L]
sulfate [mg/L]
Figure 4. Rate of Nitrate and Sulfate Treatment, March through August 2003

Figures Document Number U0192600
Tuba City Semi-Annual Performance Evaluation DOE/Office of Legacy Management Page 22 January 2004
#S
#S
#S
#S#S#S
#S
#S
#S #S#S
#S
#S
#S
#S
#S
#S
#S
#S
#S
#S
#S
#S #S
#S
#S
#S
#S
#
#
#
########
###
##
#
#
#
#
# ##
#
#
0906
0940 0941
0687
1470
1800 358
60.6
69.50929
0901
0945
0686
0688
525
1010
485
651
629
994
2320
2950
1420
1450
1360
380
1140
720
1640
0935
0944
0909
0908
0925
0926
09330934
0936
0937
0938
0942
0943
0947
0262
0263
02650267
0271
1000 0 1000 Feet
N
DATE PREPARED:
*
FILENAME:
*Nitrate Concentrations (in mg/L)
Horizon A and B1999 - March 2002 Baseline Sampling
U0192300-07
U.S. DEPARTMENT OF ENERGYGRAND JUNCTION OFFICE
GRAND JUNCTION, COLORADOUnder DOE Contract
No. DE-AC13-02GJ79491
Prepared byS.M. Stoller Corporation
Nitrate (mg/L)< 44 (not labeled)44 - 750750 - 15001500 - 2250
2250 - 3000
> 3000
S
S
SSSS
14700906 Well Number
Nitrate Concentration (mg/L)
Horizon AHorizon B
#S
#S
Extraction Well #S
RoadMajorMinorTrail
Site Boundary (Fence)EscarpmentDisposal CellInfiltration TrenchFence
Note: 1) All wells sampled for the period indicated are posted. 2) Concentration values less than respective remediation goal are not posted. 3) Well 0944 and 0933 were abandoned after the baseline period.
m:\ugw\511\0023\42\004\u01923\u0192300.apr carverh 1/13/2004, 15:52
January 13, 2004
Figure 5a. Nitrate Concentrations in Ground Water, Horizons A and B, Baseline Period

Document Number U0192600 Figures
DOE/Office of Legacy Management Tuba City Semi-Annual Performance Evaluation January 2004 Page 23
#S
#S
#S
#S
#S
#S
#S
#S
#S
#S
#S
#S
#S
#S
#S
#S #S
#S
#S
#S
#S
#S
#
#
#
########
###
##
#
#
#
#
# ##
#
#
0906
0940 0941
1230
1780 684
652
451
689
2250
1210
329
516848
575
1480
0935
0909
0908
0934
0942
0943
02620263
0265
0267
23100936
0271
0901
0945
09460686
0688
0687
092965.9
1000 0 1000 Feet
N
DATE PREPARED:
*
FILENAME:
* Nitrate Concentrations (in mg/L)Horizon A and B
August 2003 Sampling
U0192400-07
U.S. DEPARTMENT OF ENERGYGRAND JUNCTION OFFICE
GRAND JUNCTION, COLORADOUnder DOE Contract
No. DE-AC13-02GJ79491
Prepared byS.M. Stoller Corporation
Nitrate (mg/L)< 44 (not labeled)44 - 750750 - 15001500 - 2250
2250 - 3000
> 3000
S
S
SSSS
12300906 Well Number
Nitrate Concentration (mg/L)
Horizon AHorizon B
#S
#S
Extraction Well #S
RoadMajorMinorTrail
Site Boundary (Fence)EscarpmentDisposal CellInfiltration TrenchFence
Note: 1) All wells sampled for the period indicated are posted. 2) Concentration values less than respective remediation goal are not posted. 3) Well 0944 and 0933 were abandoned after the baseline period.
m:\ugw\511\0023\42\004\u01924\u0192400.apr carverh 1/13/2004, 16:19
January 13, 2004
Figure 5b. Nitrate Concentrations in Ground Water, Horizons A and B, August 2003
Figures Document Number U0192600
Tuba City Semi-Annual Performance Evaluation DOE/Office of Legacy Management Page 24 January 2004
#S
#S
#S
#S
#S
#S
#S
#S
#S
#S
#S
#S#S
#S
#S
#S#S#S#S#S#S#S#S
#S#S#S #S
#S
#S
#S #S #S
#S
#S
#S
#S
#S
#S
#S
#S
#S
#S
#S
#S
#S
#S
#S#S#S
#
#
#
########
###
##
#
#
#
#
# ##
#
#
111611171118
0691
0930
0903
0912
106225164
29854.8
403
50.5
1003
1004
176
49.1
1110
1102
11031104
1105
1106
1107
1108
11091111
11121114
1115
1113
1119
1120
1121
1122
1123
1124
1125
227
438
650
1120993
648
614
1060
1410
798421
617228
766
143
468
493
535
954
643
781
104
0932
0914
0689
0683
0684
0685
1008
0915
0695
0258
0261
0266
0264
0690
06921005
10061007
1101
DATE PREPARED:
*
FILENAME:
*
U0192300-08
Nitrate Concentrations (in mg/L)Horizon C and D
1999 - March 2002 Baseline Sampling
U.S. DEPARTMENT OF ENERGYGRAND JUNCTION OFFICE
GRAND JUNCTION, COLORADOUnder DOE Contract
No. DE-AC13-02GJ79491
Prepared byS.M. Stoller Corporation
N
1000 0 1000 Feet
RoadMajorMinorTrail
Site Boundary (Fence)EscarpmentDisposal CellInfiltration TrenchFence
Nitrate (mg/L)< 44 (not labeled)44 - 750750 - 15001500 - 2250
2250 - 3000
> 3000
S
S
SSSS
50.50930 Well Number
Nitrate Concentration (mg/L)
Horizon CHorizon D
#S
#S
Extraction Well #S
Note: 1) All wells sampled for the period indicated are posted. 2) Concentration values less than respective remediation goal are not posted. 3) Well 0944 and 0933 were abandoned after the baseline period.
m:\ugw\511\0023\42\004\u01923\u0192300.apr carverh 1/13/2004, 15:53
January 13, 2004
Figure 6a. Nitrate Concentrations in Ground Water, Horizons C and D, Baseline Period
Document Number U0192600 Figures
DOE/Office of Legacy Management Tuba City Semi-Annual Performance Evaluation January 2004 Page 25
#S
#S
#S
#S
#S
#S
#S
#S
#S
#S
#S#S
#S
#S
#S#S#S#S#S#S#S#S
#S#S#S #S
#S
#S
#S #S #S
#S
#S
#S
#S
#S
#S
#S
#S
#S
#S
#S
#S
#S
#S
#S#S
#
#
#
########
###
##
#
#
#
#
# ##
#
#
0903
0912
0930
53.9
367
63.3
0691316
11171118194416
1003
1004
61.1
49.5
1110
1101
1102
11031104
1105
1106
1107
1108
11091111
11121114
1115
1113
1119
1120
1121 1122 1123
1124
1125
352
552
643
1260606
295
137
212
772
400364
139144
256
234
527
328
272 330 88.1
459
78.9
0932
0914
0689
0683
06840685
1008
0915
0695
0261
0266
0264
0690
06921005
10061007
DATE PREPARED:
*
FILENAME:
*
U0192400-08
Nitrate Concentrations (in mg/L)Horizon C and D
August 2003 Sampling
U.S. DEPARTMENT OF ENERGYGRAND JUNCTION OFFICE
GRAND JUNCTION, COLORADOUnder DOE Contract
No. DE-AC13-02GJ79491
Prepared byS.M. Stoller Corporation
N
1000 0 1000 Feet
RoadMajorMinorTrail
Site Boundary (Fence)EscarpmentDisposal CellInfiltration TrenchFence
Nitrate (mg/L)< 44 (not labeled)44 - 750750 - 15001500 - 2250
2250 - 3000
> 3000
S
S
SSSS
63.30930 Well Number
Nitrate Concentration (mg/L)
Horizon CHorizon D
#S
#S
Extraction Well #S
Note: 1) All wells sampled for the period indicated are posted. 2) Concentration values less than respective remediation goal are not posted. 3) Well 0944 and 0933 were abandoned after the baseline period.
m:\ugw\511\0023\42\004\u01924\u0192400.apr carverh 1/13/2004, 16:19
January 13, 2004
Figure 6b. Nitrate Concentrations in Ground Water, Horizons C and D, August 2003

Figures Document Number U0192600
Tuba City Semi-Annual Performance Evaluation DOE/Office of Legacy Management Page 26 January 2004
#S
#S
#S
#S#S #S
#S
#S
#S
#S
#S#
#
#
########
###
##
#
#
#
#
# ##
#
#
0920 E
0251 E
0268 E
0913 G
0916 G
0921 I
0256 I
0252 I
0254 I
0255 M 0257 M
426
189354
DATE PREPARED:
*
FILENAME:
*
U0192300-09
Nitrate Concentrations (in mg/L)Horizon E and Deeper
1999 - March 2002 Baseline Sampling
U.S. DEPARTMENT OF ENERGYGRAND JUNCTION OFFICE
GRAND JUNCTION, COLORADOUnder DOE Contract
No. DE-AC13-02GJ79491
Prepared byS.M. Stoller Corporation
N
1000 0 1000 Feet
RoadMajorMinorTrail
Site Boundary (Fence)EscarpmentDisposal CellInfiltration TrenchFence
Nitrate (mg/L)< 44 (not labeled)44 - 750750 - 15001500 - 2250
2250 - 3000
> 3000
S
S
SSSS
4260251 E Well Number and Horizon
Nitrate Concentration (mg/L)
#SExtraction Well
Note: 1) All wells sampled for the period indicated are posted. 2) Concentration values less than respective remediation goal are not posted. 3) Well 0944 and 0933 were abandoned after the baseline period.
m:\ugw\511\0023\42\004\u01923\u0192300.apr carverh 1/14/2004, 8:02
January 14, 2004
Figure 7a. Nitrate Concentrations in Ground Water, Horizons E and Deeper, Baseline Period

Document Number U0192600 Figures
DOE/Office of Legacy Management Tuba City Semi-Annual Performance Evaluation January 2004 Page 27
#S
#S
#S
#S#S #S
#S
#S
#S
#S
#S#
#
#
########
###
##
#
#
#
#
# ##
#
#
51.2
484 0256 I0254 I
0920 E
0251 E
0268 E
0913 G
0916 G0255 M
0257 M
0921 I
0252 I
DATE PREPARED:
*
FILENAME:
*
U0192400-09
Nitrate Concentrations (in mg/L)Horizon E and DeeperAugust 2003 Sampling
U.S. DEPARTMENT OF ENERGYGRAND JUNCTION OFFICE
GRAND JUNCTION, COLORADOUnder DOE Contract
No. DE-AC13-02GJ79491
Prepared byS.M. Stoller Corporation
N
1000 0 1000 Feet
RoadMajorMinorTrail
Site Boundary (Fence)EscarpmentDisposal CellInfiltration TrenchFence
Nitrate (mg/L)< 44 (not labeled)44 - 750750 - 15001500 - 2250
2250 - 3000
> 3000
S
S
SSSS
4840254 I Well Number and Horizon
Nitrate Concentration (mg/L)
#SExtraction Well
Note: 1) All wells sampled for the period indicated are posted. 2) Concentration values less than respective remediation goal are not posted. 3) Well 0944 and 0933 were abandoned after the baseline period.
m:\ugw\511\0023\42\004\u01924\u0192400.apr carverh 1/13/2004, 16:19
January 13, 2004
Figure 7b. Nitrate Concentrations in Ground Water, Horizons E and Deeper, August 2003
Figures Document Number U0192600
Tuba City Semi-Annual Performance Evaluation DOE/Office of Legacy Management Page 28 January 2004
#S
#S
#S
#S#S#S
#S
#S
#S #S#S
#S
#S
#S
#S
#S
#S
#S
#S
#S
#S
#S
#S #S
#S
#S
#S
#S
#
#
#
########
###
##
#
#
#
#
# ##
#
#
0906
0940 0941
0.951
0.546 0.0886
0935
0944
0908 0936
0938
0942
0262 0263
02650267
0934
0.0868
0.95
0.122
0.312
0.267
0.21
0.379 0.485
0.08970.0731
0.246
0906
0940 0941
0.951
0.546 0.0886
0906
0940 0941
0.951
0.546 0.0886
0925
09260.127
0.199
0929
0901
0945
0686
0688
0687
0909 0933
0943
0947
0271
DATE PREPARED:
*
FILENAME:
*
U0192300-04
Uranium Concentrations (in mg/L)Horizon A and B
1999 - March 2002 Baseline Sampling
U.S. DEPARTMENT OF ENERGYGRAND JUNCTION OFFICE
GRAND JUNCTION, COLORADOUnder DOE Contract
No. DE-AC13-02GJ79491
Prepared byS.M. Stoller Corporation
N
1000 0 1000 Feet
RoadMajorMinorTrail
Site Boundary (Fence)EscarpmentDisposal CellInfiltration TrenchFence
Uranium (mg/L)
> 2.1
1.5 - 2.1
1 - 1.50.5 - 10.044 - 0.5< 0.044 (not labeled)S
S
SSSS
0.9510906 Well Number
Uranium Concentration (mg/L)
Extraction Well #S
#S
#S
Horizon BHorizon A
Note: 1) All wells sampled for the period indicated are posted. 2) Concentration values less than respective remediation goal are not posted. 3) Well 0944 and 0933 were abandoned after the baseline period.
m:\ugw\511\0023\42\004\u01923\u0192300.apr carverh 1/13/2004, 15:51
January 13, 2004
Figure 8a. Uranium Concentrations in Ground Water, Horizons A and B, Baseline Period

Document Number U0192600 Figures
DOE/Office of Legacy Management Tuba City Semi-Annual Performance Evaluation January 2004 Page 29
#S
#S
#S
#S
#S
#S
#S
#S
#S
#S
#S
#S
#S
#S
#S
#S #S
#S
#S
#S
#S
#S
#
#
#
########
###
##
#
#
#
#
# ##
#
#
0.667
0.428 0.0858
0906
0940 0941
0.1140.106
0.35
0.606
0.232
0.278
0.4250.173
0.0551
0.0784
09350908
0934
0936
0942
0943
02620263
0265
0267
0929
0901
0945
09460686
0688
0687
0909
0271
DATE PREPARED:
*
FILENAME:
*
U0192400-04
Uranium Concentrations (in mg/L)Horizon A and B
August 2003 Sampling
U.S. DEPARTMENT OF ENERGYGRAND JUNCTION OFFICE
GRAND JUNCTION, COLORADOUnder DOE Contract
No. DE-AC13-02GJ79491
Prepared byS.M. Stoller Corporation
N
1000 0 1000 Feet
RoadMajorMinorTrail
Site Boundary (Fence)EscarpmentDisposal CellInfiltration TrenchFence
Uranium (mg/L)
> 2.1
1.5 - 2.1
1 - 1.50.5 - 10.044 - 0.5< 0.044 (not labeled)S
S
SSSS
0.6670906 Well Number
Uranium Concentration (mg/L)
Extraction Well #S
#S
#S
Horizon BHorizon A
Note: 1) All wells sampled for the period indicated are posted. 2) Concentration values less than respective remediation goal are not posted. 3) Well 0944 and 0933 were abandoned after the baseline period.
m:\ugw\511\0023\42\004\u01924\u0192400.apr carverh 1/13/2004, 16:18
January 13, 2004
Figure 8b. Uranium Concentrations in Ground Water, Horizons A and B, August 2003

Figures Document Number U0192600
Tuba City Semi-Annual Performance Evaluation DOE/Office of Legacy Management Page 30 January 2004
#S
#S
#S
#S
#S
#S
#S
#S
#S
#S
#S
#S#S
#S
#S
#S#S#S#S#S#S#S#S
#S#S#S #S
#S
#S
#S #S #S
#S
#S
#S
#S
#S
#S
#S
#S
#S
#S
#S
#S
#S
#S
#S#S#S
#
#
#
########
###
##
#
#
#
#
# ##
#
#
06910.0657
1110
1101
1102
11031104
1105
1106
1107
1108
11091111
11121115
1119
1120
1121 1122 1123
1124
0.0528
0.245
0.533
0.3550.194
2.1
2.1
0.118
0.646
0.5650.161
0.130.41
0.555
1.3
0.849 0.878 0.261
0.171
0915
0695
0258
0261
0266
0264
0690
0692
10031004
1005
10061007
1114 1113
1125
0932
0903
0912 0914
0930
0689
0683
0684
0685
1008
111611171118
DATE PREPARED:
*
FILENAME:
*
U0192300-05
Uranium Concentrations (in mg/L)Horizon C and D
1999 - March 2002 Baseline Sampling
U.S. DEPARTMENT OF ENERGYGRAND JUNCTION OFFICE
GRAND JUNCTION, COLORADOUnder DOE Contract
No. DE-AC13-02GJ79491
Prepared byS.M. Stoller Corporation
N
1000 0 1000 Feet
RoadMajorMinorTrail
Site Boundary (Fence)EscarpmentDisposal CellInfiltration TrenchFence
#SExtraction Well
Well NumberUranium Concentration (mg/L)
11070.118
SSSSSS < 0.044 (not labeled)
0.044 - 0.50.5 - 11 - 1.5
1.5 - 2.1
> 2.1
Uranium (mg/L)
#S
#S
Horizon DHorizon C
Note: 1) All wells sampled for the period indicated are posted. 2) Concentration values less than respective remediation goal are not posted. 3) Well 0944 and 0933 were abandoned after the baseline period.
m:\ugw\511\0023\42\004\u01923\u0192300.apr carverh 1/13/2004, 15:51
January 13, 2004
Figure 9a. Uranium Concentrations in Ground Water, Horizons C and D, Baseline Period

Document Number U0192600 Figures
DOE/Office of Legacy Management Tuba City Semi-Annual Performance Evaluation January 2004 Page 31
#S
#S
#S
#S
#S
#S
#S
#S
#S
#S
#S#S
#S
#S
#S#S#S#S#S#S#S#S
#S#S#S #S
#S
#S
#S #S #S
#S
#S
#S
#S
#S
#S
#S
#S
#S
#S
#S
#S
#S
#S
#S#S
#
#
#
########
###
##
#
#
#
#
# ##
#
#
0.06140691
0.0586
0.342
0.4850.5190.0945
0.248
0.616
0.259
0.24
0.134
0.0544
0.192
0.671
0.444
0.338
0.118
1110
1101
110211031104
1105
1106
1108
1109
1111
1115
1119
1120
1121
1122
1124
0915
0695
0261
0266
0264
0690
0692
1003
1004
1005
10061007
1107
11121114
1113
1123
1125
0932
0903
0912 0914
0930
0689
0683
0684
0685
1008
11171118
DATE PREPARED:
*
FILENAME:
*
U0192400-05
Uranium Concentrations (in mg/L)Horizon C and D
August 2003 Sampling
U.S. DEPARTMENT OF ENERGYGRAND JUNCTION OFFICE
GRAND JUNCTION, COLORADOUnder DOE Contract
No. DE-AC13-02GJ79491
Prepared byS.M. Stoller Corporation
N
1000 0 1000 Feet
RoadMajorMinorTrail
Site Boundary (Fence)EscarpmentDisposal CellInfiltration TrenchFence
#SExtraction Well
Well NumberUranium Concentration (mg/L)
11080.259
SSSSSS < 0.044 (not labeled)
0.044 - 0.50.5 - 11 - 1.5
1.5 - 2.1
> 2.1
Uranium (mg/L)
#S
#S
Horizon DHorizon C
Note: 1) All wells sampled for the period indicated are posted. 2) Concentration values less than respective remediation goal are not posted. 3) Well 0944 and 0933 were abandoned after the baseline period.
m:\ugw\511\0023\42\004\u01924\u0192400.apr carverh 1/13/2004, 16:18
January 13, 2004
Figure 9b. Uranium Concentrations in Ground Water, Horizons C and D, August 2003

Figures Document Number U0192600
Tuba City Semi-Annual Performance Evaluation DOE/Office of Legacy Management Page 32 January 2004
#S
#S
#S
#S#S #S
#S
#S
#S
#S
#S#
#
#
########
###
##
#
#
#
#
# ##
#
#
0.04810251 E 0.0775
0.209
0256 I
0254 I
0255 M 0257 M
0921 I
0252 I0913 G
0916 G
0920 E
0268 E
DATE PREPARED:
*
FILENAME:
*
U0192300-06
Uranium Concentrations (in mg/L)Horizon E and Deeper
1999 - March 2002 Baseline Sampling
U.S. DEPARTMENT OF ENERGYGRAND JUNCTION OFFICE
GRAND JUNCTION, COLORADOUnder DOE Contract
No. DE-AC13-02GJ79491
Prepared byS.M. Stoller Corporation
N
1000 0 1000 Feet
RoadMajorMinorTrail
Site Boundary (Fence)EscarpmentDisposal CellInfiltration TrenchFence
Uranium (mg/L)
> 2.1
1.5 - 2.1
1 - 1.50.5 - 10.044 - 0.5< 0.044 (not labeled)S
S
SSSS
0.2090254 I Well Number and Horizon
Uranium Concentration (mg/L)
#SExtraction Well
Note: 1) All wells sampled for the period indicated are posted. 2) Concentration values less than respective remediation goal are not posted. 3) Well 0944 and 0933 were abandoned after the baseline period.
m:\ugw\511\0023\42\004\u01923\u0192300.apr carverh 1/14/2004, 8:01
January 14, 2004
Figure 10a. Uranium Concentrations in Ground Water, Horizons E and Deeper, Baseline Period

Document Number U0192600 Figures
DOE/Office of Legacy Management Tuba City Semi-Annual Performance Evaluation January 2004 Page 33
#S
#S
#S
#S#S #S
#S
#S
#S
#S
#S#
#
#
########
###
##
#
#
#
#
# ##
#
#0254 I0.128
0255 M 0257 M
0921 I
0256 I
0252 I0913 G
0916 G
0920 E
0251 E
0268 E
DATE PREPARED:
*
FILENAME:
*
U0192400-06
Uranium Concentrations (in mg/L)Horizon E and DeeperAugust 2003 Sampling
U.S. DEPARTMENT OF ENERGYGRAND JUNCTION OFFICE
GRAND JUNCTION, COLORADOUnder DOE Contract
No. DE-AC13-02GJ79491
Prepared byS.M. Stoller Corporation
N
1000 0 1000 Feet
RoadMajorMinorTrail
Site Boundary (Fence)EscarpmentDisposal CellInfiltration TrenchFence
Uranium (mg/L)
> 2.1
1.5 - 2.1
1 - 1.50.5 - 10.044 - 0.5< 0.044 (not labeled)S
S
SSSS
0.1280254 I Well Number and Horizon
Uranium Concentration (mg/L)
#SExtraction Well
Note: 1) All wells sampled for the period indicated are posted. 2) Concentration values less than respective remediation goal are not posted. 3) Well 0944 and 0933 were abandoned after the baseline period.
m:\ugw\511\0023\42\004\u01924\u0192400.apr carverh 1/13/2004, 16:18
January 13, 2004
Figure 10b. Uranium Concentrations in Ground Water, Horizons E and Deeper, August 2003

Figures Document Number U0192600
Tuba City Semi-Annual Performance Evaluation DOE/Office of Legacy Management Page 34 January 2004
#S
#S
#S
#S#S#S
#S
#S
#S #S#S
#S
#S
#S
#S
#S
#S
#S
#S
#S
#S
#S
#S #S
#S
#S
#S
#S
#
#
#
########
###
##
#
#
#
#
# ##
#
#
0687
0906
0940 0941
329
1660
7550 745
0935
0944
0909
0908
0936 0938
0942
0262 0263
02650267
0934
2690
1590
666
2430
7360
4360 2120
931 1990
15203680
3030
06873290687329
26300925
14300926
0929
0901
0945
0686
0688
0933
0943
0947
0271
DATE PREPARED:
*
FILENAME:
*Sulfate Concentrations (in mg/L)
Horizon A and B1999 - March 2002 Baseline Sampling
U0192300-01
U.S. DEPARTMENT OF ENERGYGRAND JUNCTION OFFICE
GRAND JUNCTION, COLORADOUnder DOE Contract
No. DE-AC13-02GJ79491
Prepared byS.M. Stoller Corporation
N
1000 0 1000 Feet
RoadMajorMinorTrail
Site Boundary (Fence)EscarpmentDisposal CellInfiltration TrenchFence
#SExtraction Well
Well NumberSulfate Concentration (mg/L)
09061660
SSSSSS < 250 (not labeled)
250 - 19001900 - 38003800 - 5700
5700 - 7500
> 7500
Sulfate (mg/L)
#S
#S
Horizon BHorizon A
Note: 1) All wells sampled for the period indicated are posted. 2) Concentration values less than respective remediation goal are not posted. 3) Well 0944 and 0933 were abandoned after the baseline period.
m:\ugw\511\0023\42\004\u01923\u0192300.apr carverh 1/13/2004, 15:46
January 13, 2004
Figure 11a. Sulfate Concentrations in Ground Water, Horizons A and B, Baseline Period

Document Number U0192600 Figures
DOE/Office of Legacy Management Tuba City Semi-Annual Performance Evaluation January 2004 Page 35
#S
#S
#S
#S
#S
#S
#S
#S
#S
#S
#S
#S
#S
#S
#S
#S #S
#S
#S
#S
#S
#S
#
#
#
########
###
##
#
#
#
#
# ##
#
#
1650
10300 1010
0906
0940 0941
2930
564
2400
2640
2890
543
1190 1640
1070
3690
0935
0909
0908
0934
0942
0943
0262 0263
0265
0267
32400936
0929
0901
0945
09460686
0688
0687
0271
DATE PREPARED:
*
FILENAME:
*Sulfate Concentrations (in mg/L)
Horizon A and BAugust 2003 Sampling
U0192400-01
U.S. DEPARTMENT OF ENERGYGRAND JUNCTION OFFICE
GRAND JUNCTION, COLORADOUnder DOE Contract
No. DE-AC13-02GJ79491
Prepared byS.M. Stoller Corporation
N
1000 0 1000 Feet
RoadMajorMinorTrail
Site Boundary (Fence)EscarpmentDisposal CellInfiltration TrenchFence
#SExtraction Well
Well NumberSulfate Concentration (mg/L)
09061650
SSSSSS < 250 (not labeled)
250 - 19001900 - 38003800 - 5700
5700 - 7500
> 7500
Sulfate (mg/L)
#S
#S
Horizon BHorizon A
Note: 1) All wells sampled for the period indicated are posted. 2) Concentration values less than respective remediation goal are not posted. 3) Well 0944 and 0933 were abandoned after the baseline period.
m:\ugw\511\0023\42\004\u01924\u0192400.apr carverh 1/13/2004, 16:04
January 13, 2004
Figure 11b. Sulfate Concentrations in Ground Water, Horizons A and B, August 2003
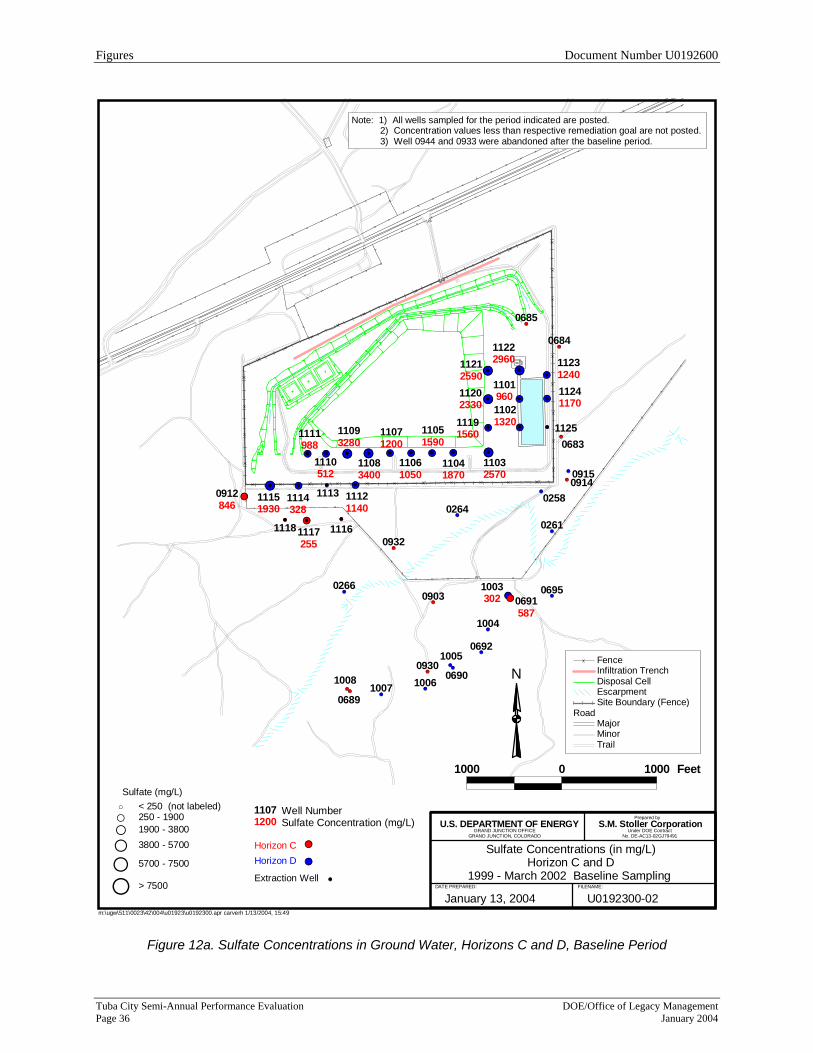
Figures Document Number U0192600
Tuba City Semi-Annual Performance Evaluation DOE/Office of Legacy Management Page 36 January 2004
#S
#S
#S
#S
#S
#S
#S
#S
#S
#S
#S
#S#S
#S
#S
#S#S#S#S#S#S#S#S
#S#S#S #S
#S
#S
#S #S #S
#S
#S
#S
#S
#S
#S
#S
#S
#S
#S
#S
#S
#S
#S
#S#S#S
#
#
#
########
###
##
#
#
#
#
# ##
#
#
1117
0691
0912
255
587
846
1003302
1110
1101
1102
11031104
1105
1106
1107
1108
11091111
111211141115
1119
1120
11211122
1123
1124
512
960
1320
25701870
1590
1050
1200
3400
3280988
11403281930
1560
2330
25902960
1240
1170
0932
0903
0914
0930
0689
0683
0684
0685
1008
11161118
0915
0695
0258
0261
0266
0264
0690
0692
1004
1005
10061007
1113
1125
DATE PREPARED:
*
FILENAME:
*
U0192300-02
Sulfate Concentrations (in mg/L)Horizon C and D
1999 - March 2002 Baseline Sampling
U.S. DEPARTMENT OF ENERGYGRAND JUNCTION OFFICE
GRAND JUNCTION, COLORADOUnder DOE Contract
No. DE-AC13-02GJ79491
Prepared byS.M. Stoller Corporation
N
1000 0 1000 Feet
RoadMajorMinorTrail
Site Boundary (Fence)EscarpmentDisposal CellInfiltration TrenchFence
#SExtraction Well
Well NumberSulfate Concentration (mg/L)
11071200
SSSSSS < 250 (not labeled)
250 - 19001900 - 38003800 - 5700
5700 - 7500
> 7500
Sulfate (mg/L)
#S
#S
Horizon DHorizon C
Note: 1) All wells sampled for the period indicated are posted. 2) Concentration values less than respective remediation goal are not posted. 3) Well 0944 and 0933 were abandoned after the baseline period.
m:\ugw\511\0023\42\004\u01923\u0192300.apr carverh 1/13/2004, 15:49
January 13, 2004
Figure 12a. Sulfate Concentrations in Ground Water, Horizons C and D, Baseline Period
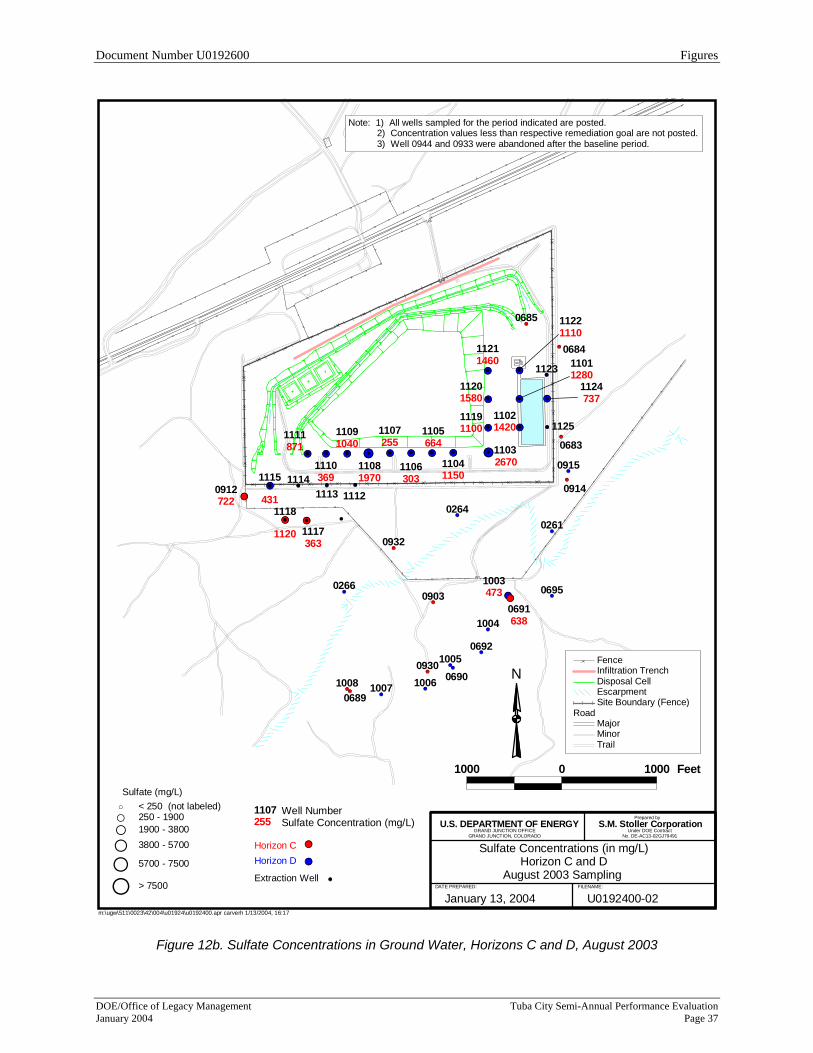
Document Number U0192600 Figures
DOE/Office of Legacy Management Tuba City Semi-Annual Performance Evaluation January 2004 Page 37
#S
#S
#S
#S
#S
#S
#S
#S
#S
#S
#S#S
#S
#S
#S#S#S#S#S#S#S#S
#S#S#S #S
#S
#S
#S #S #S
#S
#S
#S
#S
#S
#S
#S
#S
#S
#S
#S
#S
#S
#S
#S#S
#
#
#
########
###
##
#
#
#
#
# ##
#
#
7220912
6380691
3631120 1117
1118
4731003
369
1280
1420
26701150
664
303
255
1970
1040871
431
1100
1580
1460
1110
737
1110
1101
1102
11031104
1105
1106
1107
1108
11091111
1115
1119
1120
1121
1122
1124
0932
0903
0914
0930
0689
0683
0684
0685
1008
0915
0695
0261
0266
0264
0690
0692
1004
1005
10061007
11121114
1113
1123
1125
DATE PREPARED:
*
FILENAME:
*
U0192400-02
Sulfate Concentrations (in mg/L)Horizon C and D
August 2003 Sampling
U.S. DEPARTMENT OF ENERGYGRAND JUNCTION OFFICE
GRAND JUNCTION, COLORADOUnder DOE Contract
No. DE-AC13-02GJ79491
Prepared byS.M. Stoller Corporation
N
1000 0 1000 Feet
RoadMajorMinorTrail
Site Boundary (Fence)EscarpmentDisposal CellInfiltration TrenchFence
#SExtraction Well
Well NumberSulfate Concentration (mg/L)
1107255
SSSSSS < 250 (not labeled)
250 - 19001900 - 38003800 - 5700
5700 - 7500
> 7500
Sulfate (mg/L)
#S
#S
Horizon DHorizon C
Note: 1) All wells sampled for the period indicated are posted. 2) Concentration values less than respective remediation goal are not posted. 3) Well 0944 and 0933 were abandoned after the baseline period.
m:\ugw\511\0023\42\004\u01924\u0192400.apr carverh 1/13/2004, 16:17
January 13, 2004
Figure 12b. Sulfate Concentrations in Ground Water, Horizons C and D, August 2003

Figures Document Number U0192600
Tuba City Semi-Annual Performance Evaluation DOE/Office of Legacy Management Page 38 January 2004
#S
#S
#S
#S#S #S
#S
#S
#S
#S
#S#
#
#
########
###
##
#
#
#
#
# ##
#
#
0251 E617
0256 I0254 I368505
0920 E
0268 E
0913 G0916 G
0921 I
0252 I0255 M 0257 M
DATE PREPARED:
*
FILENAME:
*
U0192300-03
Sulfate Concentrations (in mg/L)Horizon E and Deeper
1999 - March 2002 Baseline Sampling
U.S. DEPARTMENT OF ENERGYGRAND JUNCTION OFFICE
GRAND JUNCTION, COLORADOUnder DOE Contract
No. DE-AC13-02GJ79491
Prepared byS.M. Stoller Corporation
N
1000 0 1000 Feet
RoadMajorMinorTrail
Site Boundary (Fence)EscarpmentDisposal CellInfiltration TrenchFence
Extraction Well #S
Sulfate (mg/L)
> 7500
5700 - 7500
3800 - 57001900 - 3800250 - 1900< 250 (not labeled)S
S
SSSS
5050254 I Well Number and Horizon
Sulfate Concentration (mg/L)
Note: 1) All wells sampled for the period indicated are posted. 2) Concentration values less than respective remediation goal are not posted. 3) Well 0944 and 0933 were abandoned after the baseline period.
m:\ugw\511\0023\42\004\u01923\u0192300.apr carverh 1/14/2004, 8:00
January 14, 2004
Figure 13a. Sulfate Concentrations in Ground Water, Horizons E and Deeper, Baseline Period

Document Number U0192600 Figures
DOE/Office of Legacy Management Tuba City Semi-Annual Performance Evaluation January 2004 Page 39
#S #S
#S
#S
#S
#S
#S
#S
#S
#S
#S#
#
#
########
###
##
#
#
#
#
# ##
#
#0254 I608
38903000255 M
0257 M
0920 E
0251 E
0268 E
0913 G
0916 G
0921 I
0256 I
0252 I
DATE PREPARED:
*
FILENAME:
*
U0192400-03
Sulfate Concentrations (in mg/L)Horizon E and DeeperAugust 2003 Sampling
U.S. DEPARTMENT OF ENERGYGRAND JUNCTION OFFICE
GRAND JUNCTION, COLORADOUnder DOE Contract
No. DE-AC13-02GJ79491
Prepared byS.M. Stoller Corporation
N
1000 0 1000 Feet
RoadMajorMinorTrail
Site Boundary (Fence)EscarpmentDisposal CellInfiltration TrenchFence
Extraction Well #S
Sulfate (mg/L)
> 7500
5700 - 7500
3800 - 57001900 - 3800250 - 1900< 250 (not labeled)S
S
SSSS
6080254 I Well Number and Horizon
Sulfate Concentration (mg/L)
Note: 1) All wells sampled for the period indicated are posted. 2) Concentration values less than respective remediation goal are not posted. 3) Well 0944 and 0933 were abandoned after the baseline period.
m:\ugw\511\0023\42\004\u01924\u0192400.apr carverh 1/13/2004, 16:17
January 13, 2004
Figure 13b. Sulfate Concentrations in Ground Water, Horizons E and Deeper, August 2003

Figures Document Number U0192600
Tuba City Semi-Annual Performance Evaluation DOE/Office of Legacy Management Page 40 January 2004
%U %U
%U
%U
%U
%U
%U
%U
%U
%U
%U
%U%U
%U
%U %U
%U
%U
%U
%U
0906
0940
0941
0686
0687
0688
0936
0945
0935
0909
0908
0934
0942
0943
0263
0265
0267
0262
0903
0691
5017.7
5015.6
5015.8
5028.1
5035.4
5027.1
5011.5
5037.2
5008.7
4998.8
5008.1
5001.1
5012.2
5028.6
5009.5
4983.5
5000.1
5013.6
4957.9 4944.8
4990
5040
5030
5020
5010
5000
700 0 700 Feet
NS.M. Stoller Corporation
Work Performed by
Under DOE ContractNo. DE-AC13-02GJ79491
DATE PREPARED:
*
FILENAME:
GRAND JUNCTION OFFICEGRAND JUNCTION, COLORADO
U.S. DEPARTMENT OF ENERGY
Water Table Elevations (in ft. above mean sea level)Tuba City
August 2001
U0182700-02
C%UB%UA%U
Monitor Wells
Note: Ground water level postedbelow monitor well identification.
m:\ugw\511\0023\42\003\u01827\u0182700.apr carverh 9/18/2003, 15:38
September 18, 2003
Figure 14a. Water Table Contour Map, Baseline Period

Document Number U0192600 Figures
DOE/Office of Legacy Management Tuba City Semi-Annual Performance Evaluation January 2004 Page 41
%U %U
%U
%U
%U
%U
%U %U
%U
%U
%U
%U
%U
%U
%U
%U
%U
%U %U
%U
%U
%U
%U
%U
ESCARPMENT
EXISTINGDISPOSAL
CELL
5050
5030
5020
5010
5000
4990
09060940 0941
0945
0946
0686
0688
0687
5007.95000.6 4999.6
5039.8
5054.2
5046.5
5028.5
5043.3
0935
0909
0908
0934
0936 0938
0942
0943
0947
0262
0263
0265
0267
5003.7
4996.1
5003.6
4994.9
4995.6 5006.9
5008
5030.1
5023.9
5001.8
5002.4
4981.4
4999.1 49554941.60903
0691
5000
505050
40
4950496049704980
0929
5003.9
N
S.M. Stoller CorporationPrepared by
Under DOE ContractNo. DE-AC13-02GJ79491
DATE PREPARED:
*
FILENAME:
GRAND JUNCTION OFFICEGRAND JUNCTION, COLORADO
U.S. DEPARTMENT OF ENERGY
* Water Table Elevations (in ft above mean sea level)Tuba CityJuly 2003
U0192500-01
700 0 700 Feet
Note: Ground water elevation (ft.) postedbelow monitor well identification.
Monitor Well Horizon%U A%U B%U C
m:\ugw\511\0023\42\004\u01925\u0192500.apr carverh 1/20/2004, 15:53
January 20, 2004
Figure 14b. Water Table Contour Map, July 2003

Figures Document Number U0192600
Tuba City Semi-Annual Performance Evaluation DOE/Office of Legacy Management Page 42 January 2004
#S
#S
#S
#S
#S
#S
#S
#S
#S
#S
#S
#S
#S
#S
#S
#S
#S
#S #S
#S
#S
#S
#S
#S
#
#
#
########
###
##
#
#
#
#
# ##
#
#
0929
0901
0906
0940
0941
0945
09460686
0688
0687
0935
0909
0908
0910
0934
0938
0942
0943
0947
02620263
0265
0267
0271
2.5
-0.3
10.4
16.1
17.8
-2.2
-14.4-18.3
-1.5
-7.8
5.6
3.4
4.5
-0.8
7
12
7.1
-0.9
1.9
11.87.1
2.1
0.9
0.2
1000 0 1000 FeetRoad
MajorMinorTrail
EscarpmentDisposal CellEvaporation PondInfiltration TrenchFence
#S B Horizon#S A Horizon# Extraction Well N
S.M. Stoller CorporationWork Performed by
Under DOE ContractNo. DE-AC13-02GJ79491
DATE PREPARED:
*
FILENAME:
GRAND JUNCTION OFFICEGRAND JUNCTION, COLORADO
U.S. DEPARTMENT OF ENERGY
Water Level Draw DownHorizons A and B
U0193000-01
Note: Ground water draw down(ft.), July 2003. Positive values
indicate draw down, negativevalues indicate mounding
m:\ugw\511\0023\42\004\u01930\u0193000.apr carverh 12/16/2003, 10:04
December 16, 2003
Figure 15. Water Level Drawdowns, Horizons A and B, July 2003

Document Number U0192600 Figures
DOE/Office of Legacy Management Tuba City Semi-Annual Performance Evaluation January 2004 Page 43
#S
#S
#S
#S
#S
#S
#S
#S
#S
#S
#S
#S#S
#S
#S
#S
#S
#S
#S
#S
#S
#S
#S
#S
#
#
#
########
###
##
#
#
#
#
# ##
#
#
0915
0695
0258
0261
0266
0264
0690
0692
1003
1004
1005
1006
1007
0932
0903
0912 0914
0930
0689
0691
0683
06840685
1008
9.6
1.2
10.7
3.5
6.9
21.5
1.5
2.6
3.2
1.6
0.4
2.1
1.9
6.5
3.3
3.3 6.1
0.7
2.2
3.4
16.8
19.64.6
2
1000 0 1000 FeetRoad
MajorMinorTrail
EscarpmentDisposal CellEvaporation PondInfiltration TrenchFence
#S D Horizon#S C Horizon# Extraction Well N
S.M. Stoller CorporationWork Performed by
Under DOE ContractNo. DE-AC13-02GJ79491
DATE PREPARED:
*
FILENAME:
GRAND JUNCTION OFFICEGRAND JUNCTION, COLORADO
U.S. DEPARTMENT OF ENERGY
Water Level Draw DownHorizons C and D
U0193000-02
Note: Ground water draw down(ft.), July 2003. Positive values
indicate draw down, negativevalues indicate mounding
m:\ugw\511\0023\42\004\u01930\u0193000.apr carverh 12/16/2003, 10:05
December 16, 2003
Figure 16. Water Level Drawdowns, Horizons C and D, July 2003

Figures Document Number U0192600
Tuba City Semi-Annual Performance Evaluation DOE/Office of Legacy Management Page 44 January 2004
#S #S
#S
#S
#S
#S
#S
#S
#S
#S
#S
#S#
#
#
########
###
##
#
#
#
#
# ##
#
#
0920 E
0251 E
0268 E
0911 F
0913 G
0916 E0255 M 0257 M
0921 I
0256 I
0252 I
0254 I
9.5
20
29.5
-0.5
3.5
8.71.4 1.2
5.2
13.8
5.5
16.8
1000 0 1000 FeetRoad
MajorMinorTrail
EscarpmentDisposal CellEvaporation PondInfiltration TrenchFence
# Extraction WellN
S.M. Stoller CorporationWork Performed by
Under DOE ContractNo. DE-AC13-02GJ79491
DATE PREPARED:
*
FILENAME:
GRAND JUNCTION OFFICEGRAND JUNCTION, COLORADO
U.S. DEPARTMENT OF ENERGY
Water Level Draw DownHorizons E, F, G, H, I, M
U0193000-03
Note: Ground water draw down(ft.), July 2003. Positive values
indicate draw down, negativevalues indicate mounding
m:\ugw\511\0023\42\004\u01930\u0193000.apr carverh 1/20/2004, 8:22
January 20, 2004
Figure 17. Water Level Drawdowns, Horizons E and Deeper, July 2003

Document Number U0192600 Figures
DOE/Office of Legacy Management Tuba City Semi-Annual Performance Evaluation January 2004 Page 45
#S
#S
#S #S
#S
#S
#S
#S#S#S#S#S#S#S#S
#S#S#S
#S#S#S
#S #S #S
#S
42
126
143
1441610
156
122
4783
14748
91
8568
83
79
120
103
139
80
137
140
1361110
1101
1102
11031104
1105
1106
1107
1108
11091111
11121114
1115
11161117
1113
1118
1119
1120
1121
1122
1123
1124
1125
1000 0 1000 FeetRoad
MajorMinorTrail
EscarpmentDisposal CellEvaporation PondInfiltration TrenchFence
#S Extraction Well
N
S.M. Stoller CorporationWork Performed by
Under DOE ContractNo. DE-AC13-02GJ79491
DATE PREPARED:
*
FILENAME:
GRAND JUNCTION OFFICEGRAND JUNCTION, COLORADO
U.S. DEPARTMENT OF ENERGY
Available Drawdown During Pumpingat Extraction Wells, July 2003
U0193000-04
Note: Available drawdownin (ft) equals the height of thewater column above the pump
during pumping.
m:\ugw\511\0023\42\004\u01930\u0193000.apr carverh 1/13/2004, 16:54
January 13, 2004
Figure 18. Available Drawdown in Extraction Wells, July/August 2003
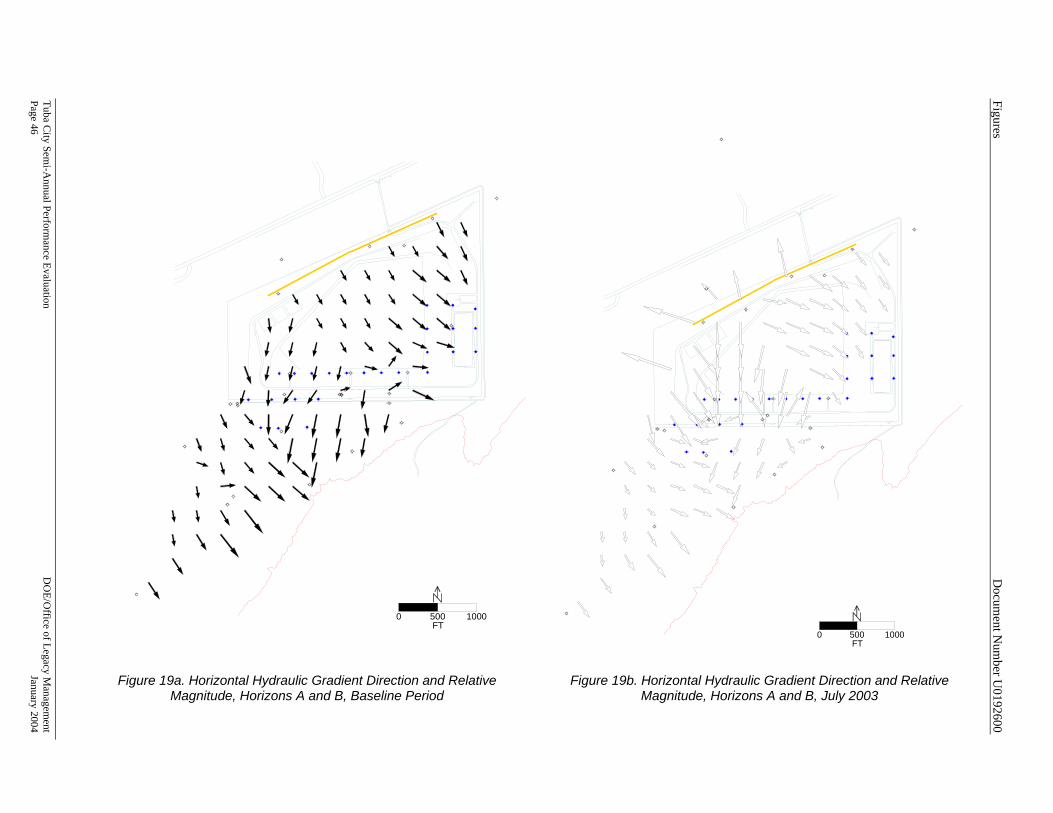
Figures D
ocument N
umber U
0192600
Tuba City Sem
i-Annual Perform
ance Evaluation D
OE/O
ffice of Legacy Managem
ent Page 46
January 2004
0 500 1000FT
0 500 1000FT
Figure 19a. Horizontal Hydraulic Gradient Direction and Relative
Magnitude, Horizons A and B, Baseline Period
Figure 19b. Horizontal Hydraulic Gradient Direction and Relative Magnitude, Horizons A and B, July 2003

Docum
ent Num
ber U0192600
Figures
DO
E/Office of Legacy M
anagement
Tuba City Sem
i-Annual Perform
ance Evaluation January 2004
Page 47
0 500 1000FT
0 500 1000FT
Figure 20a. Horizontal Hydraulic Gradient Direction and Relative Magnitude, Horizons C and D, Baseline Period
Figure 20b. Horizontal Hydraulic Gradient Direction and Relative Magnitude, Horizons C and D, July 2003

Figures Document Number U0192600
Tuba City Semi-Annual Performance Evaluation DOE/Office of Legacy Management Page 48 January 2004
0 500 1000FT
Figure 21. Horizontal Hydraulic Gradient Direction and Relative Magnitude, Horizon E, July 2003 and Baseline Period
Note: Solid arrows represent baseline conditions. Open arrows represent July 2003 conditions.

Document Number U0192600 Figures
DOE/Office of Legacy Management Tuba City Semi-Annual Performance Evaluation January 2004 Page 49
0 500 1000FT
Figure 22. Horizontal Hydraulic Gradient Direction and Relative Magnitude, Horizon G, July 2003 and Baseline Period
Note: Solid arrows represent baseline conditions. Open arrows represent July 2003 conditions.

Figures Document Number U0192600
Tuba City Semi-Annual Performance Evaluation DOE/Office of Legacy Management Page 50 January 2004
0 500 1000FT
Figure 23. Horizontal Hydraulic Gradient Direction and Relative Magnitude, Horizon I, July 2003 and
Baseline Period
Note: Solid arrows represent baseline conditions. Open arrows represent July 2003 conditions.

Document Number U0192600 Figures
DOE/Office of Legacy Management Tuba City Semi-Annual Performance Evaluation January 2004 Page 51
0 500 1000FT
?
Nitrate concentration >44 mg/L
Uranium concentration >0.044 mg/L
Sulfate concentration >250 mg/L
Extraction well
KEY
Approximate extent of ground water capturein Horizons A and B
Figure 24. Contaminant Plume Capture Zone, Horizons A and B
0 500 1000FT
Nitrate concentration >44 mg/L
Uranium concentration >0.044 mg/L
Sulfate concentration >250 mg/L
Extraction well
KEY
Approximate extent of ground water capturein Horizons C and D
Figure 25. Contaminant Plume Capture Zone, Horizons C and D

Figures Document Number U0192600
Tuba City Semi-Annual Performance Evaluation DOE/Office of Legacy Management Page 52 January 2004
0
0.2
0.4
0.6
0.8
1
1.2
10/01
/1995
04/01
/1996
10/01
/1996
04/01
/1997
10/01
/1997
04/01
/1998
10/01
/1998
04/01
/1999
10/01
/1999
04/01
/2000
10/01
/2000
04/01
/2001
10/01
/2001
04/01
/2002
10/01
/2002
04/01
/2003
10/01
/2003
Date
Ura
nium
(mg/
L)
Loc 0262
Loc 0906
Loc 0908
Loc 0934
Loc 0936
Loc 0940
Loc 0941
Loc 0942
Figure 26. Uranium Concentration versus Time, Horizons A and B Monitor Wells
0
0.5
1
1.5
2
2.5
3
03/01
/2000
09/01
/2000
03/01
/2001
09/01
/2001
03/01
/2002
09/01
/2002
03/01
/2003
09/01
/2003
Date
Ura
nium
(mg/
L)
Loc 1105
Loc 1106
Loc 1111
Loc 1112
Loc 1115
Loc 1120
Loc 1124
Figure 27.Uranium Concentration versus Time, Horizons C and D Extraction Wells

Appendix A
Tuba City Project Well Data

This page intentionally left blank
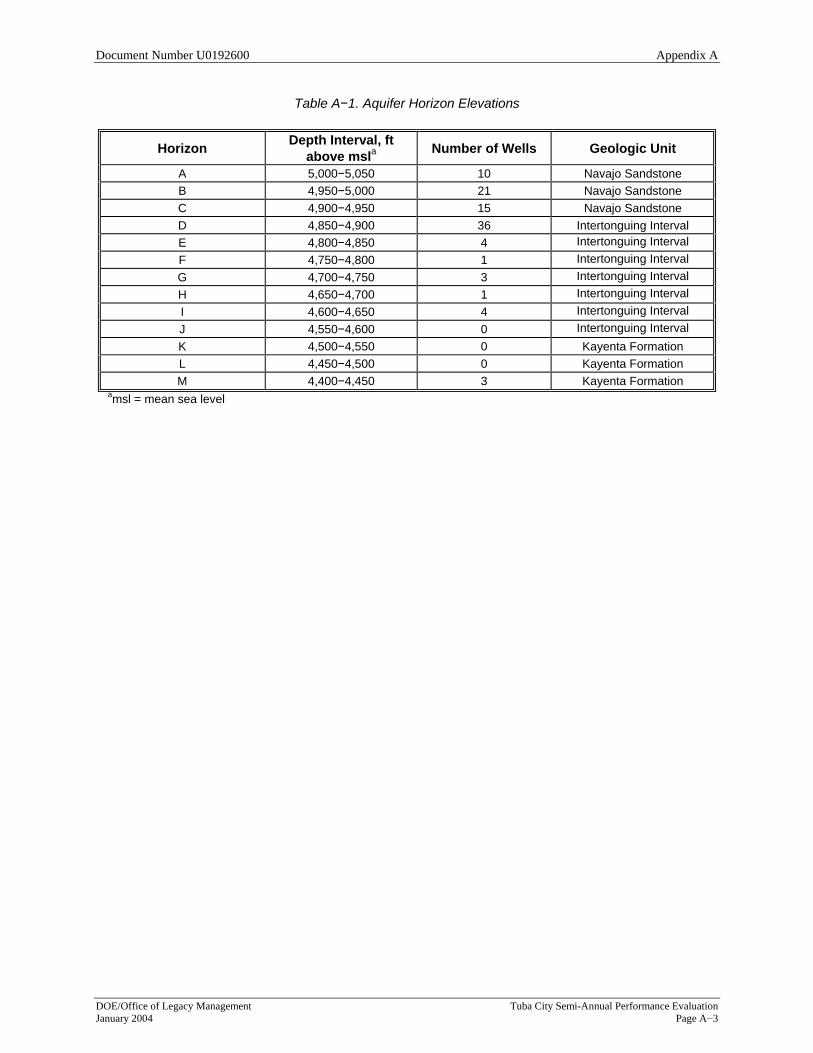
Document Number U0192600 Appendix A
DOE/Office of Legacy Management Tuba City Semi-Annual Performance Evaluation January 2004 Page A−3
Table A−1. Aquifer Horizon Elevations
Horizon Depth Interval, ft above msla Number of Wells Geologic Unit
A 5,000−5,050 10 Navajo Sandstone B 4,950−5,000 21 Navajo Sandstone C 4,900−4,950 15 Navajo Sandstone D 4,850−4,900 36 Intertonguing Interval E 4,800−4,850 4 Intertonguing Interval F 4,750−4,800 1 Intertonguing Interval G 4,700−4,750 3 Intertonguing Interval H 4,650−4,700 1 Intertonguing Interval I 4,600−4,650 4 Intertonguing Interval J 4,550−4,600 0 Intertonguing Interval K 4,500−4,550 0 Kayenta Formation L 4,450−4,500 0 Kayenta Formation M 4,400−4,450 3 Kayenta Formation
amsl = mean sea level

Appendix A Document Number U0192600
Tuba City Semi-Annual Performance Evaluation DOE/Office of Legacy Management Page A−4 January 2004
Table A−2. Well Screen Intervals
Screen Depth (ft) Screen Elevation (ft) Well ID Mid-Screen
Horizon Top Bottom Screen
Length [ft] Top Mid Bottom Well Type
0686 A 60 100 40 5,045.5 5,025.5 5,005.5 monitor
0687 A 60 100 40 5,047.6 5,027.6 5,007.6 monitor 0688 A 60 100 40 5,044.1 5,024.1 5,004.1 monitor 0901 A 58 78 20 5,045.8 5,035.8 5,025.8 monitor 0906 A 44 64 20 5,016.9 5,006.9 4,996.9 monitor 0928 A 30 55 25 5,022.1 5,009.6 4,997.1 monitor 0929 A No data 90 No data No data No data No data monitor 0940 A 45 60 15 5,017.9 5,010.4 5,002.9 monitor 0941 A 45 65 20 5,018.0 5,008.0 4,998.0 monitor 0945 A 110 130 20 5,028.1 5,018.1 5,008.1 monitor 0946 A 40 60 20 5,057.6 5,047.6 5,037.6 monitor 0262 B 60 100 40 4,999.2 4,979.2 4,959.2 monitor 0263 B 60 100 40 5,000.2 4,980.2 4,960.2 monitor 0265 B 60 100 40 4,991.1 4,971.1 4,951.1 monitor 0267 B 60 100 40 4,990.8 4,970.8 4,950.8 monitor 0271 B 60 100 40 4,984.0 4,964.0 4,944.0 monitor 0905 B 63 78 15 5,006.0 4,998.5 4,991.0 monitor 0908 B 52 67 15 5,005.3 4,997.8 4,990.3 monitor 0909 B 65 80 15 4,990.8 4,983.3 4,975.8 monitor 0910 B 97 197 100 5,007.6 4,957.6 4,907.6 monitor 0918 B 61 66 5 4,986.2 4,983.7 4,981.2 monitor 0925 B 53 93 40 5,005.8 4,985.8 4,965.8 monitor 0926 B 42 92 50 5,018.3 4,993.3 4,968.3 monitor 0934 B 45 90 45 5,013.0 4,990.5 4,968.0 monitor 0935 B 50 90 40 5,008.8 4,988.8 4,968.8 monitor 0936 B 42 82 40 5,017.9 4,997.9 4,977.9 monitor 0937 B 40 95 55 5,020.2 4,992.7 4,965.2 monitor 0938 B 40 95 55 5,020.4 4,992.9 4,965.4 monitor 0939 B 40 95 55 5,021.1 4,993.6 4,966.1 monitor 0942 B 54 74 20 5,009.5 4,999.5 4,989.5 monitor 0943 B 101 121 20 4,994.1 4,984.1 4,974.1 monitor 0947 B 105 125 20 4,990.0 4,980.0 4,970.0 monitor 0683 C 95 145 50 4,973.2 4,948.2 4,923.2 monitor 0684 C 124 176 51 4,943.1 4,917.4 4,891.8 monitor 0685 C 94 146 52 4,975.6 4,949.7 4,923.8 monitor 0689 C 55 95 40 4,923.9 4,903.9 4,883.9 monitor 0691 C 55 95 40 4,921.9 4,901.9 4,881.9 monitor 0903 C 28 48 20 4,953.5 4,943.5 4,933.5 monitor 0912 C 123 163 40 4,934.7 4,914.7 4,894.7 monitor 0914 C 137 154 17 4,930.3 4,921.8 4,913.3 monitor 0917 C 128 148 20 4,917.8 4,907.8 4,897.8 monitor 0930 C 20 50 30 4,933.0 4,918.0 4,903.0 monitor 0932 C 113 133 20 4,942.3 4,932.3 4,922.3 monitor

Document Number U0192600 Appendix A
Table A−2 (continued). Well Screen Intervals
DOE/Office of Legacy Management Tuba City Semi-Annual Performance Evaluation January 2004 Page A−5
Screen Depth (ft) Screen Elevation (ft) Well ID Mid-Screen
Horizon Top Bottom
Screen Length [ft] Top Mid Bottom
Well Type
1008 C 56 106 50 4,926.8 4,901.6 4,876.4 injection
1116 C 92 196 104 4,964.1 4,912.5 4,861.0 extraction
1117 C 92 196 104 4,965.3 4,913.7 4,862.1 extraction 1118 C 90 196 106 4,967.9 4,915.1 4,862.3 extraction 0258 D 159 199 40 4,894.0 4,874.0 4,854.0 monitor 0261 D 160 200 40 4,907.0 4,887.0 4,867.0 monitor 0264 D 160 200 40 4,899.6 4,879.6 4,859.6 monitor 0266 D 160 200 40 4,890.6 4,870.6 4,850.6 monitor 0690 D 55 95 40 4,893.3 4,873.3 4,853.3 monitor 0692 D 55 95 40 4,895.6 4,875.6 4,855.6 monitor 0695 D 55 95 40 4,919.3 4,899.3 4,879.3 monitor 0904 D 28 38 10 4,873.8 4,868.8 4,863.8 monitor 0915 D 170 180 10 4,897.8 4,892.8 4,887.8 monitor 1003 D 56 106 50 4,923.4 4,898.4 4,873.4 injection
1004 D 46 96 50 4,918.1 4,893.1 4,868.1 injection
1005 D 46 96 50 4,904.7 4,879.7 4,854.7 injection 1006 D 46 96 50 4,903.7 4,878.7 4,853.7 injection 1007 D 46 96 50 4,915.6 4,890.5 4,865.4 injection 1101 D 96 252 156 4,974.2 4,896.6 4,818.9 extraction 1102 D 102 252 150 4,968.8 4,893.8 4,818.8 extraction 1103 D 100 250 150 4,962.3 4,887.3 4,812.3 extraction 1104 D 90 245 155 4,972.3 4,894.8 4,817.3 extraction 1105 D 90 245 155 4,972.1 4,894.6 4,817.1 extraction 1106 D 97 251 154 4,966.0 4,888.7 4,811.4 extraction 1107 D 91 246 155 4,971.2 4,894.0 4,816.8 extraction 1108 D 96 246 150 4,966.1 4,891.1 4,816.1 extraction 1109 D 90 245 155 4,972.1 4,894.7 4,817.3 extraction 1110 D 96 246 150 4,966.8 4,891.8 4,816.8 extraction 1111 D 91 245 154 4,971.9 4,894.7 4,817.5 extraction 1112 D 91 246 155 4,969.1 4,891.6 4,814.1 extraction 1113 D 91 246 155 4,968.7 4,891.2 4,813.7 extraction 1114 D 91 246 155 4,968.5 4,891.0 4,813.6 extraction 1115 D 91 246 155 4,968.6 4,891.2 4,813.7 extraction 1119 D 95 245 150 4,968.7 4,893.7 4,818.7 extraction 1120 D 96 246 150 4,971.0 4,896.0 4,821.0 extraction 1121 D 98 248 150 4,972.0 4,897.0 4,822.0 extraction 1122 D 97 251 154 4,973.4 4,896.3 4,819.2 extraction 1123 D 91 245 154 4,976.2 4,899.2 4,822.2 extraction 1124 D 88 246 158 4,978.7 4,899.9 4,821.1 extraction 1125 D 96 246 150 4,972.8 4,897.8 4,822.8 extraction 0251 E 200 300 100 4,858.9 4,808.9 4,758.9 monitor 0268 E 200 300 100 4,864.5 4,814.5 4,764.5 monitor 0920 E 114 154 40 4,866.0 4,846.0 4,826.0 monitor

Appendix A Document Number U0192600
Table A−2 (continued). Well Screen Intervals
Tuba City Semi-Annual Performance Evaluation DOE/Office of Legacy Management Page A−6 January 2004
Screen Depth (ft) Screen Elevation (ft) Well ID Mid-Screen
Horizon Top Bottom
Screen Length [ft] Top Mid Bottom
Well Type
0948 E 222 402 180 4,893.9 4,803.9 4,713.9 monitor 0911 F 309 349 40 4,795.2 4,775.2 4,755.2 monitor 0913 G 329 369 40 4,729.2 4,709.2 4,689.2 monitor 0916 G 346 356 10 4,721.7 4,716.7 4,711.7 monitor 0919 G 338 348 10 4,707.9 4,702.9 4,697.9 monitor 0902 H 63 73 10 4,673.7 4,668.7 4,663.7 monitor 0252 I 400 500 100 4,658.9 4,608.9 4,558.9 monitor 0254 I 400 500 100 4,662.7 4,612.7 4,562.7 monitor 0256 I 400 500 100 4,664.0 4,614.0 4,564.0 monitor 0921 I 313 353 40 4,663.7 4,643.7 4,623.7 monitor 0253 M 600 700 100 4,458.8 4,408.8 4,358.8 monitor 0255 M 600 700 100 4,462.3 4,412.3 4,362.3 monitor 0257 M 600 700 100 4,463.4 4,413.4 4,363.4 monitor

Document Number U0192600 Appendix A
DOE/Office of Legacy Management Tuba City Semi-Annual Performance Evaluation January 2004 Page A−7
Table A−3. Extraction and Injection Well Design Rates and Screened Horizons
Well Number Well Type Design
Pumping Rate
(gpm)
Screen Length
(ft)
Horizon Top of Well Screen
Horizon Bottom Of Well Screen
1003 Injection 1.0 50 C D 1004 Injection 1.0 50 C D 1005 Injection 1.0 50 C D 1006 Injection 1.0 50 C D 1007 Injection 1.0 50 C D 1008 Injection 1.0 50 C D
Infiltration Trench Infiltration Trench 57.0 NA NA NA 1101 Extraction 4.0 155 B D 1102 Extraction 3.0 150 B E 1103 Extraction 4.0 150 B E 1104 Extraction 4.0 155 B E 1105 Extraction 5.0 155 B E 1106 Extraction 5.1 155 B E 1107 Extraction 5.1 154 B E 1108 Extraction 5.1 150 B E 1109 Extraction 5.1 155 B E 1110 Extraction 5.0 150 B E 1111 Extraction 8.6 154 B E 1112 Extraction 3.1 155 B E 1113 Extraction 2.0 155 B E 1114 Extraction 3.5 155 B E 1115 Extraction 3.5 155 B E 1116 Extraction 2.0 103 B D 1117 Extraction 2.0 103 B D 1118 Extraction 3.2 106 B D 1119 Extraction 2.6 155 B E 1120 Extraction 2.6 150 B E 1121 Extraction 3.1 150 B E 1122 Extraction 2.6 154 B E 1123 Extraction 3.1 154 B E 1124 Extraction 2.6 158 B E 1125 Extraction 2.6 150 B E

Appendix A Document Number U0192600
Tuba City Semi-Annual Performance Evaluation DOE/Office of Legacy Management Page A−8 January 2004
Table A−4. Extraction Well Pumping Rate Summary
Well Pump On [days] 1
Pump Off [days] 2
On-Stream Factor
[percent] 3
Gallons Pumped
Design Rate
[gpm]
On-Stream
Rate [gpm]
Effective Rate
[gpm]
Effective minus Design [gpm]
August-03 Treatment Plant Total Time On: 27.9 days 1101 17.56 10.38 63% 159,183 4.0 6.3 4.0 0.0 1102 17.53 10.42 63% 164,034 3.0 6.5 4.1 1.1 1103 27.93 0.01 100% 265,102 4.0 6.6 6.6 2.6 1104 22.06 5.88 79% 153,715 4.0 4.8 3.8 -0.2 1105 7.93 20.01 28% 166,161 5.0 14.5 4.1 -0.9 1106 20.30 7.64 73% 142,418 5.1 4.9 3.5 -1.6 1107 18.89 9.05 68% 132,371 5.1 4.9 3.3 -1.8 1108 19.91 8.03 71% 148,520 5.1 5.2 3.7 -1.4 1109 19.91 8.03 71% 89,975 5.1 3.1 2.2 -2.9 1110 15.91 12.03 57% 101,257 5.0 4.4 2.5 -2.5 1111 18.83 9.11 67% 127,781 8.6 4.7 3.2 -5.4 1112 12.90 15.04 46% 63,682 3.1 3.4 1.6 -1.5 1113 5.88 22.06 21% 34,849 2.0 4.1 0.9 -1.1 1114 18.48 9.46 66% 140,379 3.5 5.3 3.5 0.0 1115 18.83 9.11 67% 145,429 3.5 5.4 3.6 0.1 1116 0.00 27.94 0% 0 2.0 0.0 0.0 -2.0 1117 18.52 9.42 66% 163,616 2.0 6.1 4.1 2.1 1118 18.66 9.28 67% 99,855 3.2 3.7 2.5 -0.7 1119 21.58 6.37 77% 155,340 2.6 5.0 3.9 1.3 1120 27.87 0.07 100% 192,762 2.6 4.8 4.8 2.2 1121 27.85 0.09 100% 198,266 3.1 4.9 4.9 1.8 1122 27.88 0.06 100% 160,676 2.6 4.0 4.0 1.4 1123 10.32 17.62 37% 9,266 3.1 0.6 0.2 -2.9 1124 18.84 9.10 67% 137,877 2.6 5.1 3.4 0.8 1125 18.67 9.27 67% 117,782 2.6 4.4 2.9 0.3
Cumulative 3,270,296 92.5 122.8 81.4 -11.1

Document Number U0192600 Appendix A
Table A-4 (continued). Extraction Well Pumping Rate Summary
DOE/Office of Legacy Management Tuba City Semi-Annual Performance Evaluation January 2004 Page A−9
Well Pump On [days] 1
Pump Off [days] 2
On-Stream Factor
[percent] 3
Gallons Pumped
Design Rate
[gpm]
On-Stream
Rate [gpm]
Effective Rate
[gpm]
Effective minus Design [gpm]
July-03 Treatment Plant Total Time On: 22.1 days 1101 21.46 0.67 97% 199,607 4.0 6.5 6.3 2.3 1102 21.46 0.67 97% 207,012 3.0 6.7 6.5 3.5 1103 21.46 0.67 97% 208,074 4.0 6.7 6.5 2.5 1104 21.38 0.75 97% 161,103 4.0 5.2 5.1 1.1 1105 16.66 5.47 75% 132,411 5.0 5.5 4.2 -0.8 1106 20.28 1.85 92% 119,674 5.1 4.1 3.8 -1.3 1107 20.01 2.12 90% 152,051 5.1 5.3 4.8 -0.3 1108 22.09 0.04 100% 169,142 5.1 5.3 5.3 0.2 1109 22.12 0.01 100% 110,268 5.1 3.5 3.5 -1.6 1110 19.69 2.44 89% 129,500 5.0 4.6 4.1 -0.9 1111 22.12 0.01 100% 157,752 8.6 5.0 5.0 -3.6 1112 16.18 5.95 73% 81,751 3.1 3.5 2.6 -0.5 1113 8.96 13.17 40% 53,762 2.0 4.2 1.7 -0.3 1114 19.81 2.32 90% 159,302 3.5 5.6 5.0 1.5 1115 22.11 0.02 100% 174,614 3.5 5.5 5.5 2.0 1116 0.00 22.13 0% 0 2.0 0.0 0.0 -2.0 1117 19.93 2.20 90% 174,888 2.0 6.1 5.5 3.5 1118 20.54 1.59 93% 125,025 3.2 4.2 3.9 0.7 1119 20.67 1.46 93% 163,680 2.6 5.5 5.1 2.5 1120 21.18 0.95 96% 160,085 2.6 5.2 5.0 2.4 1121 22.12 0.01 100% 166,450 3.1 5.2 5.2 2.1 1122 22.11 0.02 100% 129,463 2.6 4.1 4.1 1.5 1123 20.65 1.48 93% 18,373 3.1 0.6 0.6 -2.5 1124 22.12 0.01 100% 162,634 2.6 5.1 5.1 2.5 1125 18.52 3.61 84% 116,258 2.6 4.4 3.6 1.0
Cumulative 3,432,873 92.5 117.5 107.7 15.2
1 Computed as the total time during the 27.9 day period that the pump is discharging ground water. 2 Computed as the total time during the 27.9 day period that the pump is idle due to low water level. 3 Computed as the percent of the 27.9 day period that the pump is discharging ground water. On-stream factors less than 100% imply on/off pump cycling due to low water levels.

Appendix A Document Number U0192600
Tuba City Semi-Annual Performance Evaluation DOE/Office of Legacy Management Page A−10 January 2004
End of current text

Document Number U0192600 Appendix A
DOE/Office of Legacy Management Tuba City Semi-Annual Performance Evaluation January 2004 Page A−11
Figure A−1. Well Screen Intervals and Horizons

This page intentionally left blank

Appendix B
Ground Water Sample Results for August 2003 and the Baseline Period for Contaminants Requiring Remediation

This page intentionally left blank

Document Number U0192600 Appendix B
DOE/Office of Legacy Management Tuba City Semi-Annual Performance Evaluation January 2004 Page B−3
Table B−1. Baseline and August 2003 Nitrate Concentrations
Well Number Horizon Baseline Nitrate Concentration (mg/L)
Year Sampled, Baseline
August 2003 Nitrate Concentration (mg/L)
MCL=44.0 mg/L 0686 A 32.2 2002 13.9 0687 A 60.6 2002 14.9 0688 A 35.1 2002 35.4 0901 A 13 2001 13.2 0906 A 1470 2002 1230 0929 A 69.5 2002 65.9 0940 A 1800 2002 1780 0941 A 358 2002 684 0945 A 12.7 2002 12 0946 A NS 34.1 0262 B 380 2001 516 0263 B 1140 2001 848 0265 B 720 2001 575 0267 B 1640 2002 1480 0271 B 15.6 2002 15.5 0908 B 651 2002 689 0909 B 485 2002 451 0910 B NS NS 0918 B NS NS 0934 B 2320 2002 2250 0935 B 525 2002 652 0936 B 2950 2002 2310 0938 B 1450 1999 NS 0942 B 1360 2002 1210 0943 B 22.1 2002 329 0947 B 12.5 2002 NS 0683 C 14.1 2002 14 0684 C 13.9 2002 13.8 0685 C 14.3 2002 13.7 0689 C 14.3 2002 14.2 0691 C 298 2002 316 0903 C 54.8 2002 53.9 0912 C 403 2001 367 0914 C 13 2001 12.1 0917 C 15.7 2001 82.6 0930 C 50.9 2002 63.3 0932 C 25.3 2002 23.8 1008 C 15.7 2000 15.1 1116 C 106 2002 NS 1117 C 225 2002 194 1118 C 164 2002 416 0258 D 15 2000 NS 0261 D 14 2001 14.3 0264 D 24.3 2001 38

Appendix B Document Number U0192600
Table B−1 (continued). Baseline and August 2003 Nitrate Concentrations
Tuba City Semi-Annual Performance Evaluation DOE/Office of Legacy Management Page B−4 January 2004
Well Number Horizon Baseline Nitrate Concentration (mg/L)
Year Sampled, Baseline
August 2003 Nitrate Concentration (mg/L)
MCL=44.0 mg/L 0266 D 14 2001 14.1 0690 D 12.5 2002 12 0692 D 12.5 2002 13.6 0695 D 25.4 2002 25.3 0904 D 5.13 2001 4.97 0915 D 14.1 2001 12.6 1003 D 176 2000 61.1 1004 D 49.1 2000 49.5 1005 D 14.5 2000 14.1 1006 D 14.1 2000 13.4 1007 D 15.3 2000 14.6 1101 D 438 2002 552 1102 D 650 2002 643 1103 D 1120 2002 1260 1104 D 993 2002 606 1105 D 648 2002 295 1106 D 614 2002 137 1107 D 1060 2002 212 1108 D 1410 2002 772 1109 D 798 2002 400 1110 D 227 2002 352 1111 D 421 2002 364 1112 D 617 2002 139 1113 D 143 2002 234 1114 D 228 2002 144 1115 D 766 2002 256 1119 D 468 2002 527 1120 D 493 2002 328 1121 D 573 2002 273 1122 D 954 2002 330 1123 D 643 2002 88.1 1124 D 781 2002 459 1125 D 104 2002 78.9 0251 E 426 2002 12.8 0268 E 15.4 2002 13.9 0920 E 14.8 2001 15.1 0948 E NS NS 0911 F NS NS 0913 G 12.4 2001 13.2 0916 G 11.6 2001 10.8 0919 G NS NS 0902 H NS NS 0252 I 15.3 2002 10.5 0254 I 354 2002 484

Document Number U0192600 Appendix B
Table B−1 (continued). Baseline and August 2003 Nitrate Concentrations
DOE/Office of Legacy Management Tuba City Semi-Annual Performance Evaluation January 2004 Page B−5
Well Number Horizon Baseline Nitrate Concentration (mg/L)
Year Sampled, Baseline
August 2003 Nitrate Concentration (mg/L)
MCL=44.0 mg/L 0256 I 189 2002 51.2 0921 I 11 2001 11.1 0255 M 9.6 2000 0.0191 0257 M 6.9 2000 0.0191
NS = Not sampled

March 2003 through August 2003 Document Number U0192600
Tuba City Semi-Annual Performance Evaluation DOE/Office of Legacy Management Page B−6 January 2004
Table B−2. Baseline and August 2003 Molybdenum Concentrations
Well Number Horizon Baseline Molybdenum Concentration (mg/L)
Year Sampled, Baseline
August 2003 Molybdenum Concentration (mg/L)
MCL=0.1 mg/L 0686 A 0.0015 2002 0.0026 0687 A 0.0113 2002 0.0041 0688 A 0.0015 2002 0.0017 0901 A 0.00078 2001 0.0017 0906 A 0.0137 2002 0.031 0929 A 0.0015 2002 0.0017 0940 A 0.0015 2002 0.0017 0941 A 0.0284 2002 0.141 0945 A 0.0015 2002 0.0017 0946 A NS 0.0017 0262 B 0.432 2001 0.472 0263 B 0.192 2001 0.0363 0265 B 0.00046 2001 0.0017 0267 B 0.0015 2002 0.0017 0271 B 0.0015 2002 0.0017 0908 B 0.0015 2002 0.0017 0909 B 0.0015 2002 0.0017 0910 B NS NS 0918 B NS NS 0934 B 0.0015 2002 0.0017 0935 B 0.0015 2002 0.0017 0936 B 0.0015 2002 0.0017 0938 B 0.001 1999 NS 0942 B 0.021 2002 0.0083 0943 B 0.0015 2002 0.0017 0947 B 0.0015 2002 NS 0683 C 0.0015 2002 0.0017 0684 C 0.0015 2002 0.0017 0685 C 0.0015 2002 0.0017 0689 C 0.0015 2002 0.0017 0691 C 0.0015 2002 0.0017 0903 C 0.0015 2002 0.0017 0912 C 0.0003 2001 0.0017 0914 C 0.00081 2001 0.0017 0917 C 0.0013 2001 0.0017 0930 C 0.0015 2002 0.0017 0930 C 0.0015 2002 0.0017 0932 C 0.0018 2002 0.0017 1008 C 0.0004 2000 0.0017 1116 C 0.0015 2002 NS 1117 C 0.0015 2002 0.0017 1118 C 0.0015 2002 0.0017 0258 D 0.00063 2000 NS

Document Number U0192600 Appendix B
Table B−2 (continued). Baseline and August 2003 Molybdenum Concentrations
DOE/Office of Legacy Management Tuba City Semi-Annual Performance Evaluation January 2004 Page B−7
Well Number Horizon Baseline Molybdenum Concentration (mg/L)
Year Sampled, Baseline
August 2003 Molybdenum Concentration (mg/L)
MCL=0.1 mg/L 0261 D 0.0026 2001 0.0017 0264 D 0.0031 2001 0.0017 0266 D 0.00058 2001 0.0017 0690 D 0.0015 2002 0.0017 0692 D 0.0015 2002 0.0017 0695 D 0.0015 2002 0.0017 0904 D 0.00077 2001 0.0017 0915 D 0.00054 2001 0.0017 1003 D 0.0004 2000 0.0017 1004 D 0.0004 2000 0.0017 1005 D 0.0004 2000 0.0017 1006 D 0.0004 2000 0.0017 1007 D 0.0004 2000 0.0017 1101 D 0.0015 2002 0.0017 1102 D 0.0015 2002 0.0017 1103 D 0.0015 2002 0.0017 1104 D 0.0916 2002 0.038 1105 D 2.96 2002 0.203 1106 D 1.26 2002 0.382 1107 D 0.16 2002 0.0237 1108 D 0.0015 2002 0.0017 1109 D 0.0015 2002 0.0017 1110 D 0.0015 2002 0.0017 1111 D 0.0015 2002 0.0017 1112 D 0.0015 2002 0.0017 1113 D 0.0015 2002 0.0017 1114 D 0.0027 2002 0.0017 1115 D 0.0015 2002 0.0017 1119 D 0.0053 2002 0.0017 1120 D 0.0815 2002 0.0258 1121 D 0.105 2002 0.0475 1122 D 0.0015 2002 0.0017 1123 D 0.0015 2002 0.0017 1124 D 0.0015 2002 0.0017 1125 D 0.0015 2002 0.0017 0251 E 0.0015 2002 0.0017 0268 E 0.0015 2002 0.0017 0920 E 0.0003 2001 0.0017 0911 F NS NS 0913 G 0.0003 2001 0.0017 0916 G 0.00096 2001 0.0017 0919 G NS NS 0902 H NS NS

March 2003 through August 2003 Document Number U0192600
Table B−2 (continued). Baseline and August 2003 Molybdenum Concentrations
Tuba City Semi-Annual Performance Evaluation DOE/Office of Legacy Management Page B−8 January 2004
Well Number Horizon Baseline Molybdenum Concentration (mg/L)
Year Sampled, Baseline
August 2003 Molybdenum Concentration (mg/L)
MCL=0.1 mg/L 0252 I 0.0015 2002 0.0017 0254 I 0.164 2002 0.0535 0256 I 0.0015 2002 0.0017 0921 I 0.0003 2001 0.0017 0255 M 0.0043 2000 0.0482 0257 M 0.00041 2000 0.0316
NS = Not sampled

Document Number U0192600 March 2003 through August 2003
DOE/Office of Legacy Management Tuba City Semi-Annual Performance Evaluation January 2004 Page B−9
Table B−3. Baseline and August 2003 Selenium Concentrations
Well Number Horizon Baseline Selenium Concentration (mg/L)
Year Sampled, Baseline
August 2003 Selenium Concentration (mg/L)
MCL=0.01 mg/L 0686 A 0.0088 2002 0.002 0687 A 0.0145 2002 0.00095 0688 A 0.0033 2002 0.0033 0901 A 0.0024 2001 0.0025 0906 A 0.0335 2002 0.0298 0929 A 0.0028 2002 0.0038 0940 A 0.105 2002 0.0716 0941 A 0.0348 2002 0.0781 0945 A 0.0035 2002 0.0016 0946 A NS 0.0092 0262 B 0.0621 2001 0.0607 0263 B 0.0632 2001 0.0459 0265 B 0.0071 2001 0.0054 0267 B 0.0532 2002 0.0487 0271 B 0.0016 2002 0.0017 0908 B 0.0163 2002 0.0171 0909 B 0.0224 2002 0.0215 0910 B NS NS 0918 B NS NS 0934 B 0.0116 2002 0.0108 0935 B 0.0195 2002 0.0228 0936 B 0.0869 2002 0.0566 0938 B 0.0432 1999 0942 B 0.0348 2002 0.0331 0943 B 0.0021 2002 0.0084 0947 B 0.0019 2002 0683 C 0.0022 2002 0.0019 0684 C 0.0019 2002 0.0019 0685 C 0.0017 2002 0.0017 0689 C 0.0014 2002 0.0014 0691 C 0.0046 2002 0.0048 0903 C 0.0023 2002 0.0022 0912 C 0.0137 2001 0.0113 0914 C 0.0016 2001 0.0013 0917 C 0.0017 2001 0.0015 0930 C 0.002 2002 0.0022 0932 C 0.0019 2002 0.0016 1008 C 0.0015 2000 0.0015 1116 C 0.0018 2002 NS 1117 C 0.0028 2002 0.0054 1118 C 0.0028 2002 0.013 0258 D 0.0018 2000 NS 0261 D 0.0021 2001 0.0001 0264 D 0.0018 2001 0.0018

Appendix B Document Number U0192600
Table B−3 (continued). Baseline and August 2003 Selenium Concentrations
Tuba City Semi-Annual Performance Evaluation DOE/Office of Legacy Management Page B−10 January 2004
Well Number Horizon Baseline Selenium Concentration (mg/L)
Year Sampled, Baseline
August 2003 Selenium Concentration (mg/L)
MCL=0.01 mg/L 0266 D 0.0013 2001 0.0012 0690 D 0.0014 2002 0.0014 0692 D 0.0022 2002 0.0025 0695 D 0.0019 2002 0.0021 0904 D 0.0131 2001 0.014 0915 D 0.0019 2001 0.0016 1003 D 0.003 2000 0.0036 1004 D 0.0021 2000 0.0021 1005 D 0.0014 2000 0.0014 1006 D 0.0013 2000 0.0014 1007 D 0.0013 2000 0.0014 1101 D 0.0188 2002 0.0284 1102 D 0.0121 2002 0.0219 1103 D 0.0613 2002 0.0545 1104 D 0.0344 2002 0.0182 1105 D 0.0871 2002 0.0177 1106 D 0.0925 2002 0.0319 1107 D 0.0903 2002 0.0131 1108 D 0.0704 2002 0.0364 1109 D 0.0372 2002 0.0144 1110 D 0.0081 2002 0.0071 1111 D 0.0172 2002 0.0141 1112 D 0.0154 2002 0.0043 1113 D 0.0025 2002 0.0039 1114 D 0.0035 2002 0.0031 1115 D 0.0362 2002 0.0076 1119 D 0.029 2002 0.0216 1120 D 0.0563 2002 0.0331 1121 D 0.0455 2002 0.025 1122 D 0.0558 2002 0.0234 1123 D 0.0449 2002 0.0048 1124 D 0.0186 2002 0.0135 1125 D 0.0025 2002 0.0026 0251 E 0.0035 2002 0.0012 0268 E 0.0018 2002 0.0016 0920 E 0.0014 2001 0.0014 0948 E NS NS 0911 F NS NS 0913 G 0.00063 2001 0.00093 0916 G 0.001 2001 0.0012 0919 G NS NS 0902 H NS NS 0252 I 0.00092 2002 0.00077 0254 I 0.0531 2002 0.0519

Document Number U0192600 Appendix B
Table B−3 (continued). Baseline and August 2003 Selenium Concentrations
DOE/Office of Legacy Management Tuba City Semi-Annual Performance Evaluation January 2004 Page B−11
Well Number Horizon Baseline Selenium Concentration (mg/L)
Year Sampled, Baseline
August 2003 Selenium Concentration (mg/L)
MCL=0.01 mg/L 0256 I 0.0031 2002 0.0013 0921 I 0.00091 2001 0.00098 0255 M 0.0011 2000 0.0001 0257 M 0.0013 2000 0.00045
NS = Not sampled

Appendix B Document Number U0192600
Tuba City Semi-Annual Performance Evaluation DOE/Office of Legacy Management Page B−12 January 2004
Table B−4. Baseline and August 2003 Sulfate Concentrations
Well Number Horizon Baseline Sulfate Concentration (mg/L)
Year Sampled, Baseline
August 2003 Sulfate Concentration (mg/L)
No MCL for sulfate 0686 A 98.6 2002 52.2 0687 A 329 2002 48.7 0688 A 40 2002 44.9 0901 A 26.2 2001 28.6 0906 A 1660 2002 1650 0929 A 28.1 2002 29.1 0940 A 7550 2002 10300 0941 A 745 2002 1010 0945 A 32.1 2002 15.3 0946 A NS 161 0262 B 931 2001 1190 0263 B 1990 2001 1640 0265 B 1520 2001 1070 0267 B 3680 2002 3690 0271 B 16.4 2002 15.9 0908 B 2430 2002 2400 0909 B 666 2002 564 0910 B NS NS 0918 B NS NS 0934 B 7360 2002 2640 0935 B 2690 2002 2930 0936 B 4360 2002 3240 0938 B 2120 1999 NS 0942 B 3030 2002 2890 0943 B 29 2002 543 0947 B 18.7 2002 NS 0683 C 21.6 2002 19.1 0684 C 18 2002 16.8 0685 C 26.2 2002 16 0689 C 13.7 2002 14.2 0691 C 587 2002 638 0903 C 76.5 2002 71.9 0912 C 846 2001 722 0914 C 15.6 2001 14.4 0917 C 13.9 2001 15.2 0930 C 59.8 2002 75.4 0932 C 30.2 2002 26.6 1008 C 13 2000 14 1116 C 176 2002 NS 1117 C 255 2002 363 1118 C 163 2002 1120 0258 D 17.4 2000 NS 0261 D 18.2 2001 19.4 0264 D 37.7 2001 57.9

Document Number U0192600 Appendix B
Table B−4 (continued). Baseline and August 2003 Sulfate Concentrations
DOE/Office of Legacy Management Tuba City Semi-Annual Performance Evaluation January 2004 Page B−13
Well Number Horizon Baseline Sulfate Concentration (mg/L)
Year Sampled, Baseline
August 2003 Sulfate Concentration (mg/L)
No MCL for sulfate 0266 D 10.9 2001 10.9 0690 D 13.8 2002 13 0692 D 20.8 2002 21.9 0695 D 50.4 2002 51.4 0904 D 96.5 2001 87.9 0915 D 17.8 2001 17.4 1003 D 302 2000 473 1004 D 66.2 2000 74.3 1005 D 12.7 2000 13.1 1006 D 12.2 2000 12.5 1007 D 11.7 2000 12.1 1101 D 960 2002 1280 1102 D 1320 2002 1420 1103 D 2570 2002 2670 1104 D 1870 2002 1150 1105 D 1590 2002 664 1106 D 1050 2002 303 1107 D 1200 2002 255 1108 D 3400 2002 1970 1109 D 3280 2002 1040 1110 D 512 2002 369 1111 D 988 2002 871 1112 D 1140 2002 217 1113 D 136 2002 205 1114 D 328 2002 183 1115 D 1930 2002 431 1119 D 1560 2002 1100 1120 D 2330 2002 1580 1121 D 2590 2002 1460 1122 D 2960 2002 1110 1123 D 1240 2002 173 1124 D 1170 2002 737 1125 D 165 2002 123 0251 E 617 2002 11.7 0268 E 17.4 2002 18.9 0920 E 12.7 2001 13.5 0948 E NS NS 0911 F NS NS 0913 G 8.43 2001 9.11 0916 G 13.5 2001 11.8 0919 G NS NS 0902 H NS NS 0252 I 19.2 2002 8.03 0254 I 505 2002 608

Appendix B Document Number U0192600
Table B−4 (continued). Baseline and August 2003 Sulfate Concentrations
Tuba City Semi-Annual Performance Evaluation DOE/Office of Legacy Management Page B−14 January 2004
Well Number Horizon Baseline Sulfate Concentration (mg/L)
Year Sampled, Baseline
August 2003 Sulfate Concentration (mg/L)
No MCL for sulfate 0256 I 368 2002 90.9 0921 I 8.52 2001 8.83 0255 M 102 2000 3890 0257 M 13.4 2000 300
NS = Not sampled

Document Number U0192600 Appendix B
DOE/Office of Legacy Management Tuba City Semi-Annual Performance Evaluation January 2004 Page B−15
Table B−5. Baseline and August 2003 Uranium Concentrations
Well Number Horizon Baseline Uranium Concentration (mg/L)
Year Sampled, Baseline
August 2003 Uranium Concentration (mg/L)
MCL=0.044 mg/L 0686 A 0.0021 2002 0.00036 0687 A 0.0208 2002 0.00048 0688 A 0.002 2002 0.0023 0901 A 0.0026 2001 0.0027 0906 A 0.951 2002 0.667 0929 A 0.0012 2002 0.0018 0940 A 0.546 2002 0.428 0941 A 0.0886 2002 0.0858 0945 A 0.0031 2002 0.0013 0946 A NS 0.001 0262 B 0.379 2001 0.425 0263 B 0.485 2001 0.173 0265 B 0.0897 2001 0.0551 0267 B 0.0731 2002 0.0784 0271 B 0.0014 2002 0.0016 0908 B 0.122 2002 0.106 0909 B 0.0389 2002 0.0279 0910 B NS NS 0918 B NS NS 0934 B 0.312 2002 0.35 0935 B 0.0868 2002 0.114 0936 B 0.267 2002 0.606 0938 B 0.21 1999 NS 0942 B 0.246 2002 0.232 0943 B 0.0049 2002 0.278 0947 B 0.0024 2002 NS 0683 C 0.0012 2002 0.0014 0684 C 0.0019 2002 0.0014 0685 C 0.0012 2002 0.0016 0689 C 0.0011 2002 0.0013 0691 C 0.0657 2002 0.0614 0903 C 0.0022 2002 0.0024 0912 C 0.0342 2001 0.0318 0914 C 0.0013 2001 0.00093 0917 C 0.0013 2001 0.0011 0930 C 0.0023 2002 0.0031 0932 C 0.0016 2002 0.0017 1008 C 0.001 2000 0.0014 1116 C 0.0081 2002 NS 1117 C 0.0151 2002 0.0154 1118 C 0.0098 2002 0.0422 0258 D 0.0018 2000 NS 0261 D 0.0018 2001 0.0014 0264 D 0.0033 2001 0.0037

Appendix B Document Number U0192600
Table B−5 (continued). Baseline and August 2003 Uranium Concentrations
Tuba City Semi-Annual Performance Evaluation DOE/Office of Legacy Management Page B−16 January 2004
Well Number Horizon Baseline Uranium Concentration (mg/L)
Year Sampled, Baseline
August 2003 Uranium Concentration (mg/L)
MCL=0.044 mg/L 0266 D 0.0019 2001 0.0017 0690 D 0.0018 2002 0.0024 0692 D 0.0015 2002 0.0017 0695 D 0.002 2002 0.0024 0904 D 0.0044 2001 0.0037 0915 D 0.0017 2001 0.0001 1003 D 0.0205 2000 0.0351 1004 D 0.0053 2000 0.0082 1005 D 0.0013 2000 0.0016 1006 D 0.0014 2000 0.0015 1007 D 0.0012 2000 0.0015 1101 D 0.245 2002 0.342 1102 D 0.533 2002 0.485 1103 D 0.355 2002 0.519 1104 D 0.194 2002 0.0945 1105 D 2.1 2002 0.248 1106 D 2.1 2002 0.616 1107 D 0.118 2002 0.0343 1108 D 0.646 2002 0.259 1109 D 0.565 2002 0.24 1110 D 0.0528 2002 0.0586 1111 D 0.161 2002 0.134 1112 D 0.13 2002 0.0372 1113 D 0.0149 2002 0.0258 1114 D 0.0277 2002 0.0151 1115 D 0.41 2002 0.0544 1119 D 0.555 2002 0.192 1120 D 1.3 2002 0.671 1121 D 0.857 2002 0.444 1122 D 0.878 2002 0.338 1123 D 0.261 2002 0.0384 1124 D 0.171 2002 0.118 1125 D 0.0176 2002 0.0218 0251 E 0.0481 2002 0.0016 0268 E 0.0014 2002 0.0023 0920 E 0.0017 2001 0.0016 0948 E NS NS 0911 F NS NS 0913 G 0.0016 2001 0.0014 0916 G 0.0014 2001 0.0001 0919 G NS NS 0902 H NS NS 0252 I 0.0024 2002 0.0023 0254 I 0.209 2002 0.128

Document Number U0192600 Appendix B
Table B−5 (continued). Baseline and August 2003 Uranium Concentrations
DOE/Office of Legacy Management Tuba City Semi-Annual Performance Evaluation January 2004 Page B−17
Well Number Horizon Baseline Uranium Concentration (mg/L)
Year Sampled, Baseline
August 2003 Uranium Concentration (mg/L)
MCL=0.044 mg/L 0256 I 0.0775 2002 0.0186 0921 I 0.0047 2001 0.0028 0255 M 0.0029 2000 0.0025 0257 M 0.0037 2000 0.0154
NS = Not sampled

Appendix B Document Number U0192600
Tuba City Semi-Annual Performance Evaluation DOE/Office of Legacy Management Page B−18 January 2004
End of current text

Appendix C
Water Levels and Drawdown Information

This page intentionally left blank

Document Number U0192600 Appendix C
DOE/Office of Legacy Management Tuba City Semi-Annual Performance Evaluation January 2004 Page C−3
Table C−1. August 2003 Drawdown from Baseline Ground Water Levels
Baseline Water-Level Elevation July 2003 Water-Level Elevation Monitor Well Number (ft above msla) (ft above msla) Drawdownb (ft)
Horizon A 686 5,028.17 5,046.5 -18.33 687 5,035.41 5,043.26 -7.85 688 5,026.99 5,028.45 -1.46 901 5,054.93 5,055.22 -0.29 906 5,018.29 5,007.93 10.36 929 5,006.39 5,003.94 2.45 940 5,016.62 5,000.55 16.07 941 5,017.32 4,999.56 17.76 945 5,037.57 5,039.76 -2.19 946 5,039.74 5,054.17 -14.43
Horizon B 262 5,013.59 5,001.77 11.8 263 5,009.50 5,002.36 7.1 265 4,983.48 4,981.37 2.1 267 4,999.98 4,999.11 0.9 271 4,993.48 4,993.31 0.2 908 5,008.05 5,003.55 4.5 909 4,998.56 4,996.12 3.4 910 5,052.26 5,053.04 -0.8 934 5,001.91 4,994.87 7.0 935 5,009.25 5,003.65 5.6 936 5,012.58 4,995.6 17.0 938 5,018.89 5,006.94 12.0 942 5,015.05 5,007.98 7.1 943 5,029.14 5,030.05 -0.9 947 5,025.86 5,023.94 1.9
Horizon C 683 4,994.44 4,977.66 16.8 684 5,004.28 4,984.72 19.6 685 5,018.81 5,014.22 4.6 689 4,946.10 4,943.91 2.2 691 4,945.01 4,941.64 3.4 903 4,958.20 4,954.95 3.3 912 5,002.07 4,998.77 3.3 914 4,969.30 4,963.17 6.1 917 4,979.19 4,979.08 0.1 930 4,935.84 4,935.12 0.7 932 4,965.52 4,959.04 6.5
Horizon D 258 4,975.64 4,964.91 10.7 261 4,948.85 4,945.31 3.5 264 4,988.39 4966.92 21.5 266 4,967.32 4,960.42 6.9 690 4,928.64 4,927.1 1.5

Appendix C Document Number U0192600
Table C−1 (continued). August 2003 Drawdown from Baseline Ground Water Levels
Tuba City Semi-Annual Performance Evaluation DOE/Office of Legacy Management Page C−4 January 2004
Baseline Water-Level Elevation July 2003 Water-Level Elevation Monitor Well Number (ft above msla) (ft above msla) Drawdownb (ft)
692 4,932.22 4,928.49 2.6 695 4,931.53 4,930.38 1.2 904 4,882.49 4,882.26 0.2 915 4,975.79 4,966.21 9.6
1003 4,944.75 4,941.55 3.2 1004 4,943.02 4,941.4 1.6 1005 4,926.81 4,926.38 0.4 1006 4,933.19 4,931.14 2.1 1007 4,939.61 4,937.74 1.9
Horizon E 251 4,999.75 4,979.79 20.0 268 4,986.44 4,956.95 29.5 920 4,955.57 4,946.09 9.5
Horizon F 911 5,057.28 5,057.78 -0.5
Horizon G 913 4,995.04 4,991.56 3.5 916 4,957.55 4,948.86 8.7 919 4,903.39 4,902.58 0.8
Horizon I 252 4,994.30 4,988.82 5.5 254 5,009.88 4,993.08 16.8 256 4,974.68 4,960.86 13.8 921 4,943.98 4,938.74 5.2
Horizon M 255 4,974.49 4,973.11 1.4 257 4,962.07 4,960.87 1.2
amsl = mean sea level bDrawdown = Baseline water level—July 2003 water level. Positive values indicate drawdown; negative values indicate mounding.