try walking camberwell principal pedestrian network demonstration project hywel rowlands
TRANSCRIPT

Try Walking CamberwellPrincipal Pedestrian Network Demonstration Project
Hywel Rowlands

Camberwell Junction Activity Area

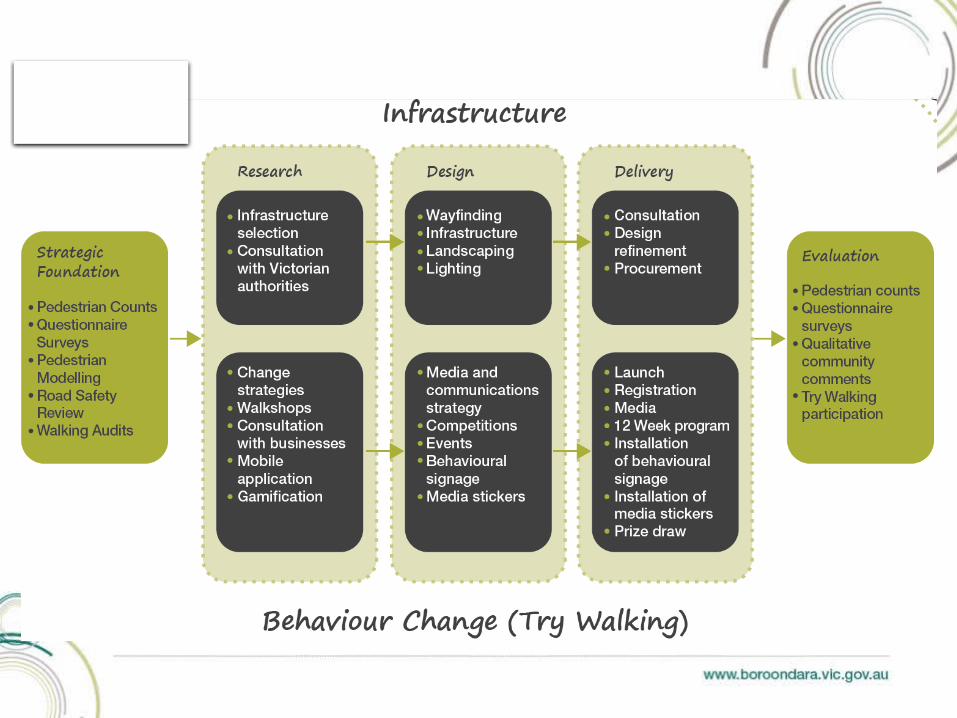
Aims
• Increase the number of walk trips
• Reduce private car use
Objectives
• Apply and assess the Principal Pedestrian Network methodology
• Deliver infrastructure and behaviour change
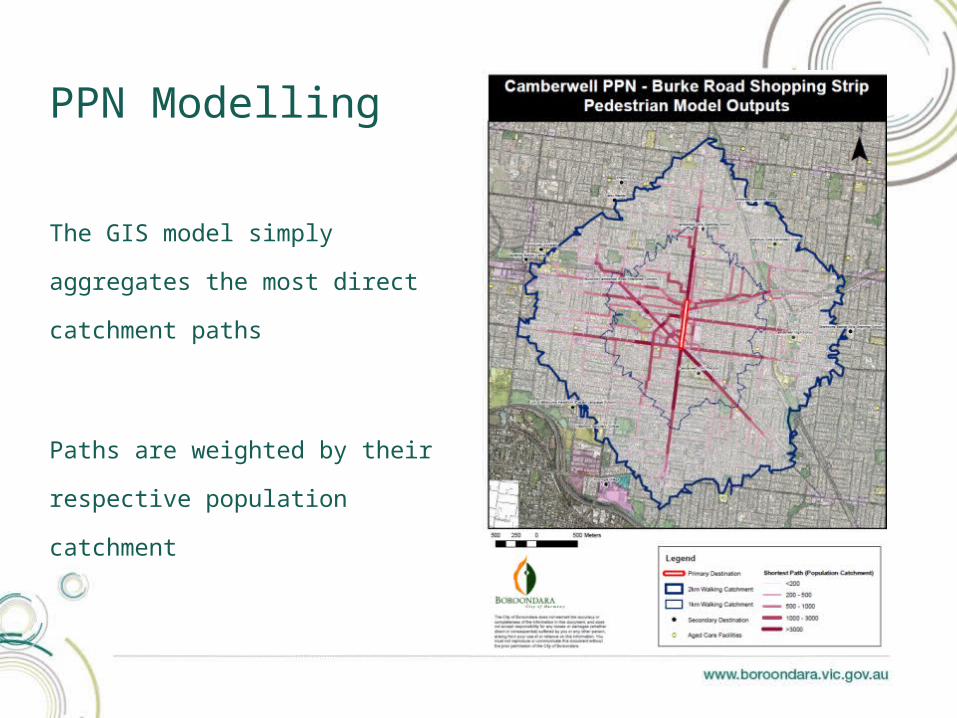
PPN Modelling
The GIS model simply
aggregates the most direct
catchment paths
Paths are weighted by their
respective population catchment
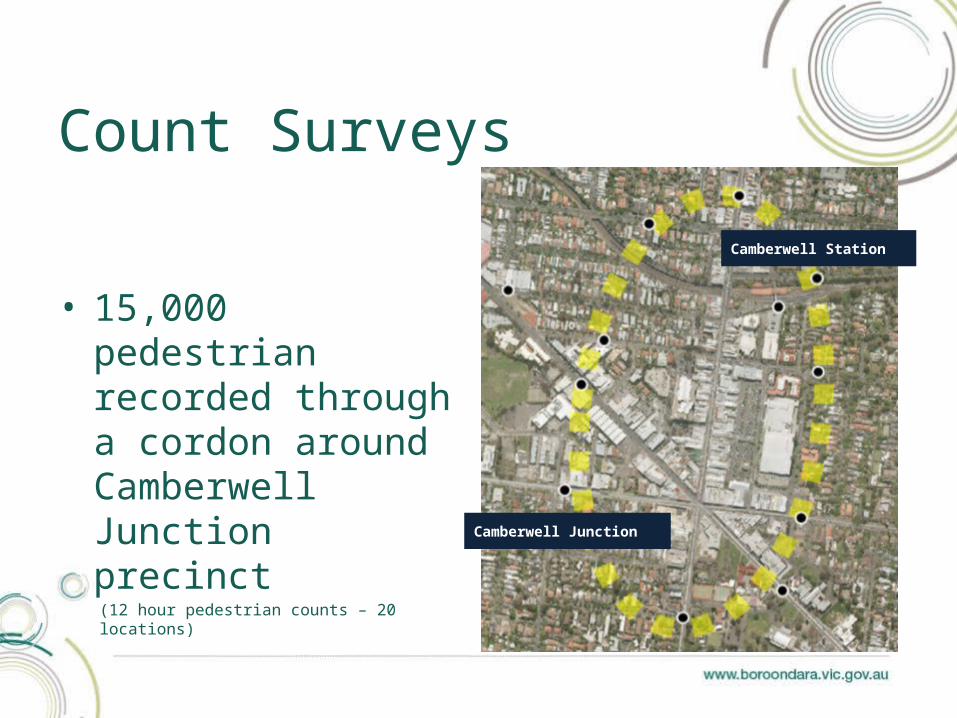
Count Surveys
• 15,000 pedestrian recorded through a cordon around Camberwell Junction precinct (12 hour pedestrian counts – 20 locations)
Camberwell Station
Camberwell Junction

2
3
2
4
4
3
1
1
1
1
5
11
6
6
9
18
1
2
1
3
2
Weekday Weekend
Factor = modelled population/pedestrian counts
1

Half of all respondents travelled by car,
20% identified that walking was an option
Walking could accommodate
>30% mode share,
Questionnaire Surveys
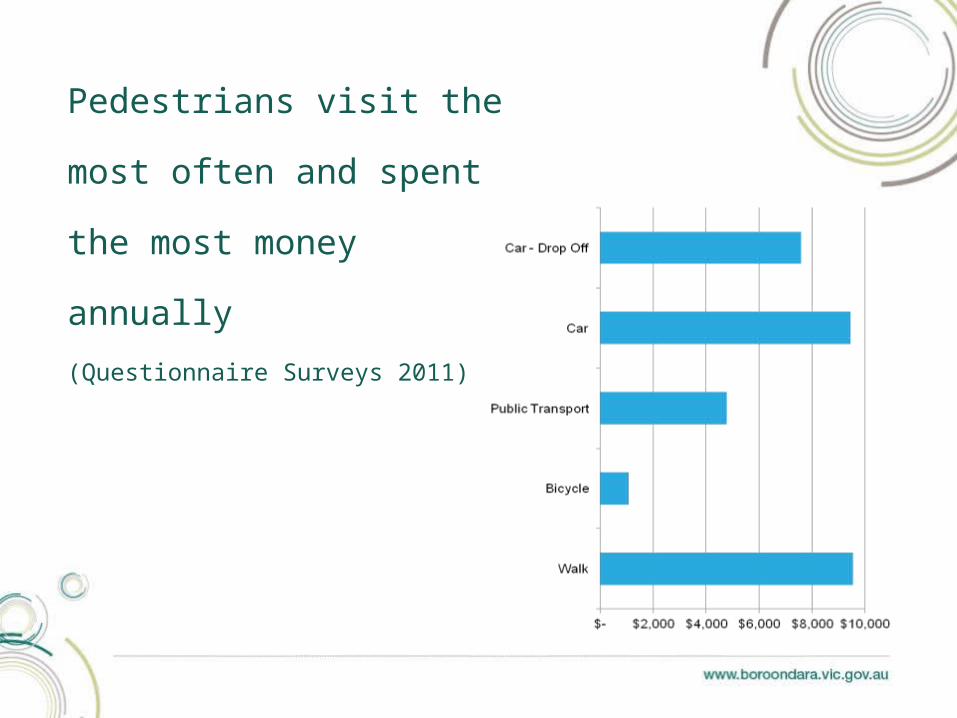
Pedestrians visit the most
often and spent the most
money annually
(Questionnaire Surveys 2011)

Research
• Complete gaps - paths/crossings etc• Remove risky locations and reduce speed• Direct paths that are convenient to walk• Trees and green space• Amenity and information• Car share (reducing car ownership)• Behaviour change initiatives
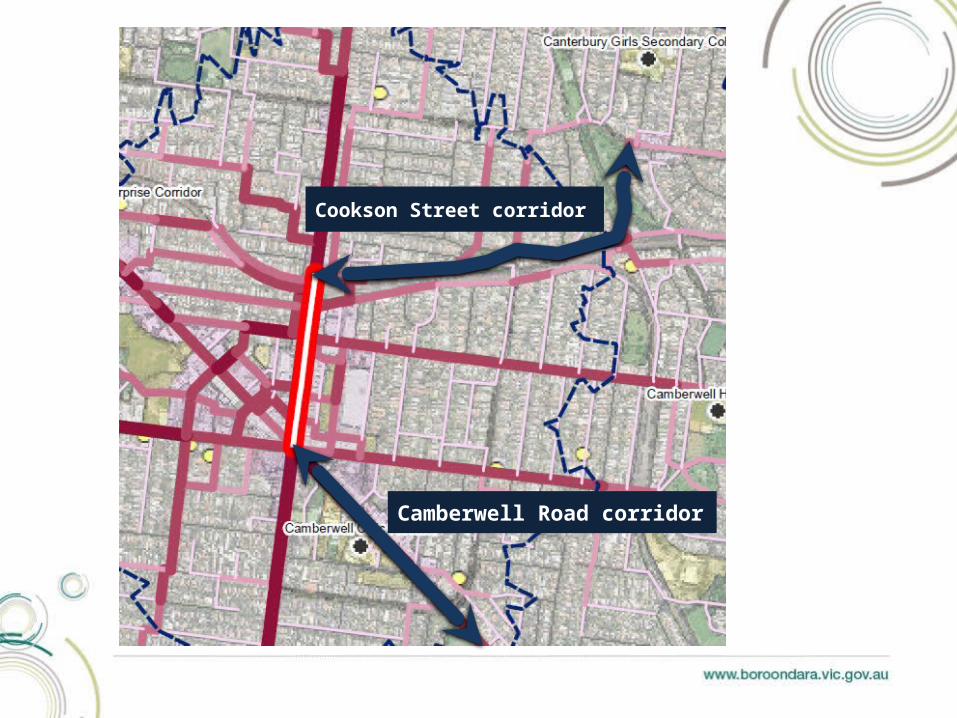
Cookson Street corridor
Camberwell Road corridor

Cookson Street Corridor
Connects to• Trains• Trams• Shops• Employment• Schools• Parks
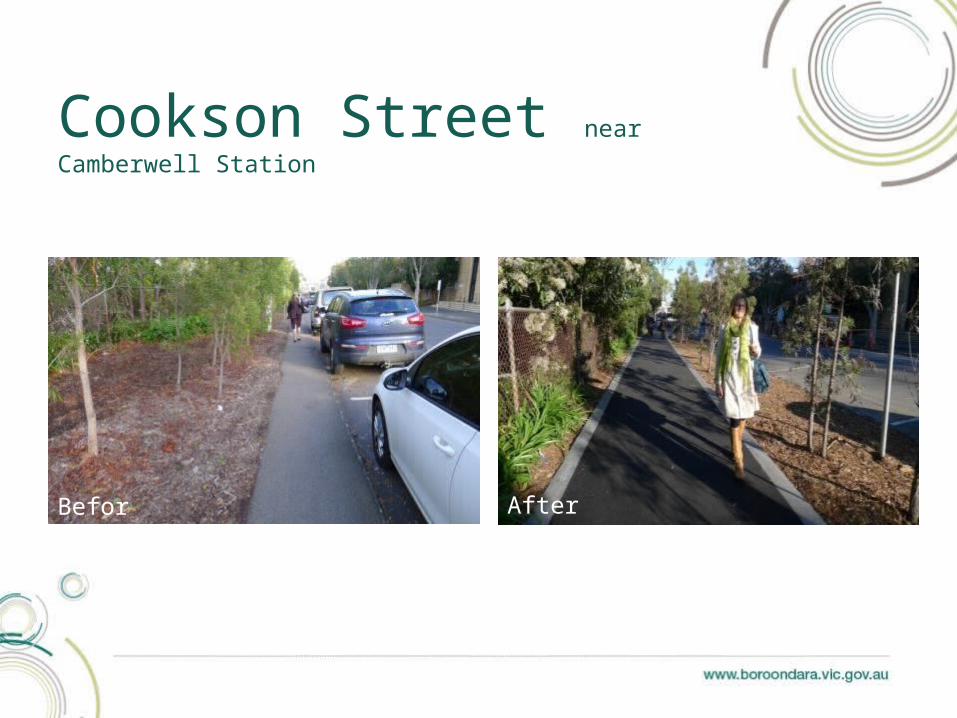
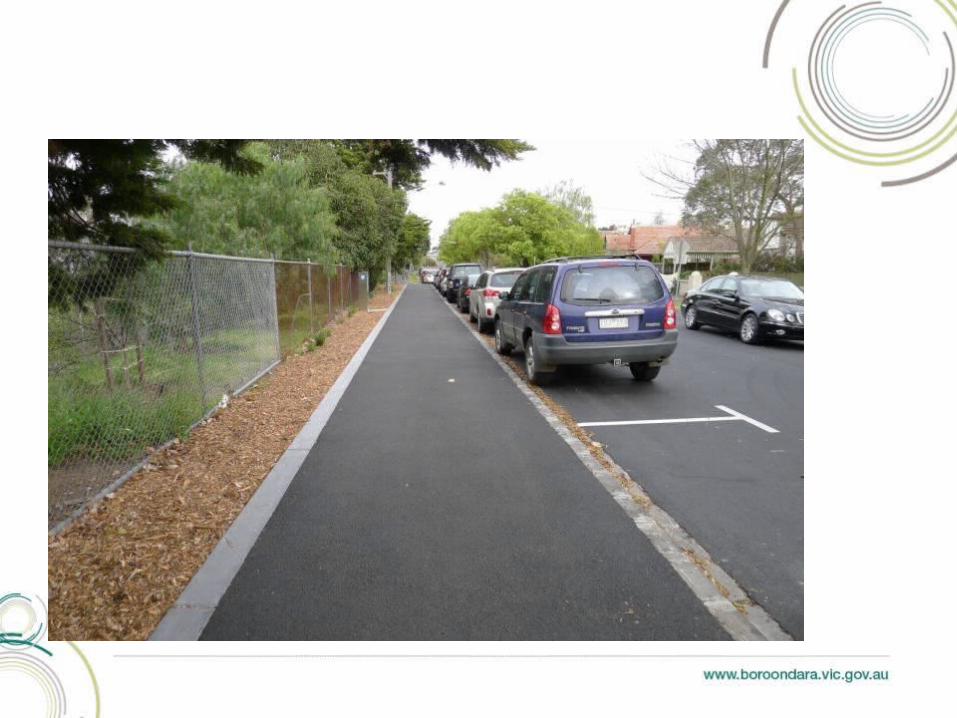
Cookson Street near Camberwell Station
Before After

Cookson Street
Before After

Cookson Street Corner adjacent Read Gardens
Before After


East Camberwell Station
Before After

Further resolution required
• No ped crashes• 2000 vph• Vehicle every 2
seconds• 60 km/h road• 1/3 pedestrians
run to crossTowards Camberwell Station
Towards East Camberwell Station
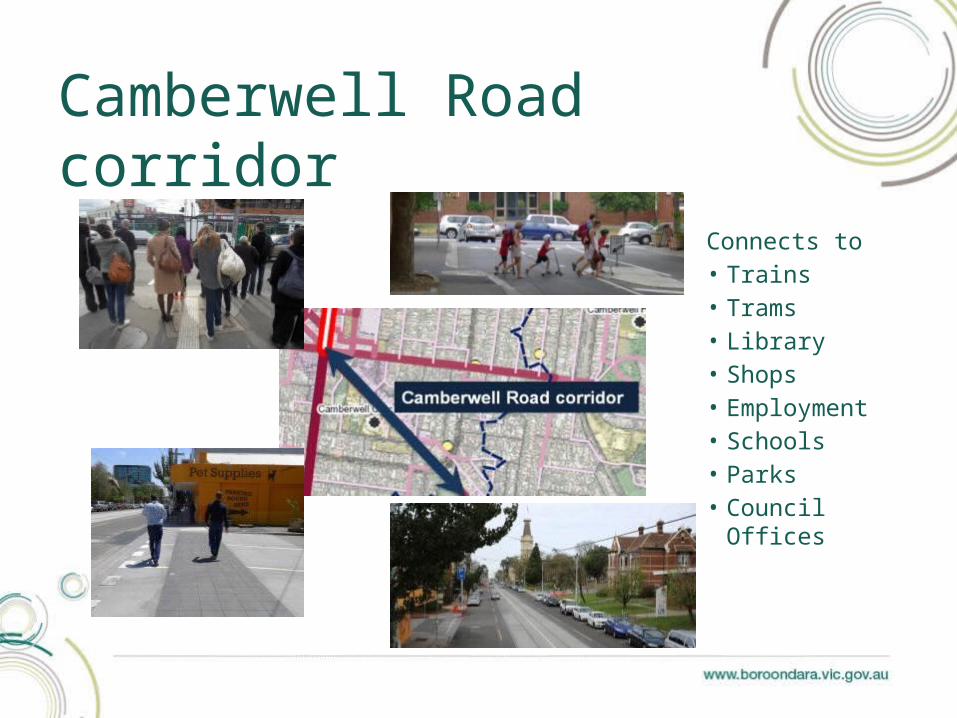
Camberwell Road corridor
Connects to• Trains• Trams• Library• Shops• Employment• Schools• Parks• Council Offices

Before
After After
16 raised crossings in Boroondara reviewed
11 crashes involved pedestrians 5 years prior
2 crashes involved pedestrians 5 years post
Anecdotal evidence on behaviour
Raised side road treatments
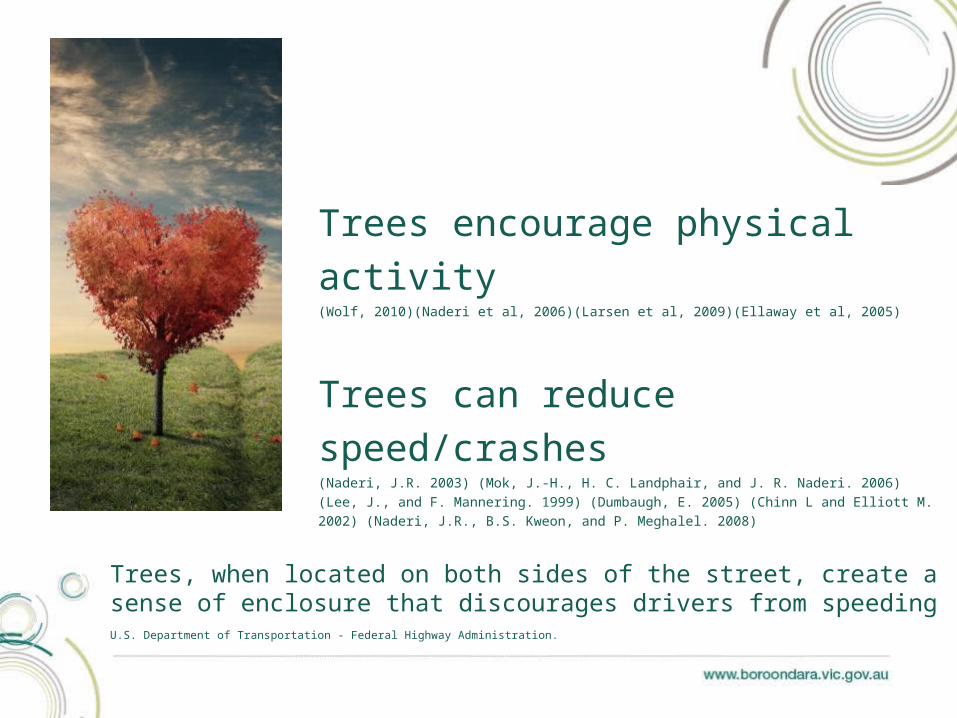
Trees encourage physical activity(Wolf, 2010)(Naderi et al, 2006)(Larsen et al, 2009)(Ellaway et al, 2005)
Trees can reduce speed/crashes(Naderi, J.R. 2003) (Mok, J.-H., H. C. Landphair, and J. R. Naderi. 2006) (Lee, J., and F. Mannering. 1999)
(Dumbaugh, E. 2005) (Chinn L and Elliott M. 2002) (Naderi, J.R., B.S. Kweon, and P. Meghalel. 2008)
Trees, when located on both sides of the street, create a sense of enclosure that discourages drivers from speeding U.S. Department of Transportation - Federal Highway Administration.
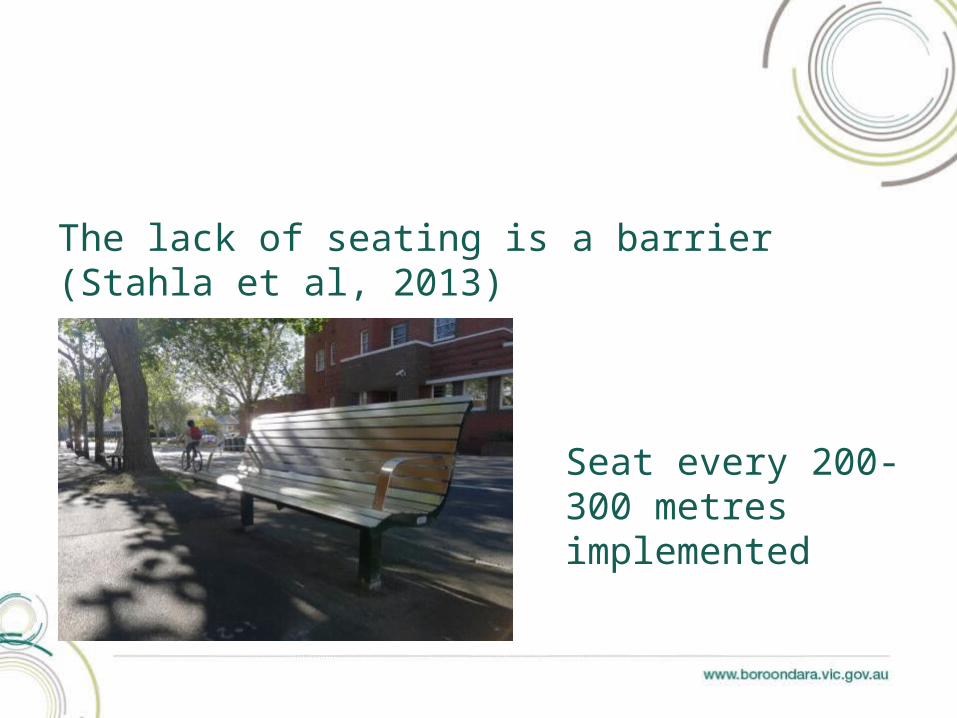
The lack of seating is a barrier (Stahla et al, 2013)
Seat every 200-300 metres implemented
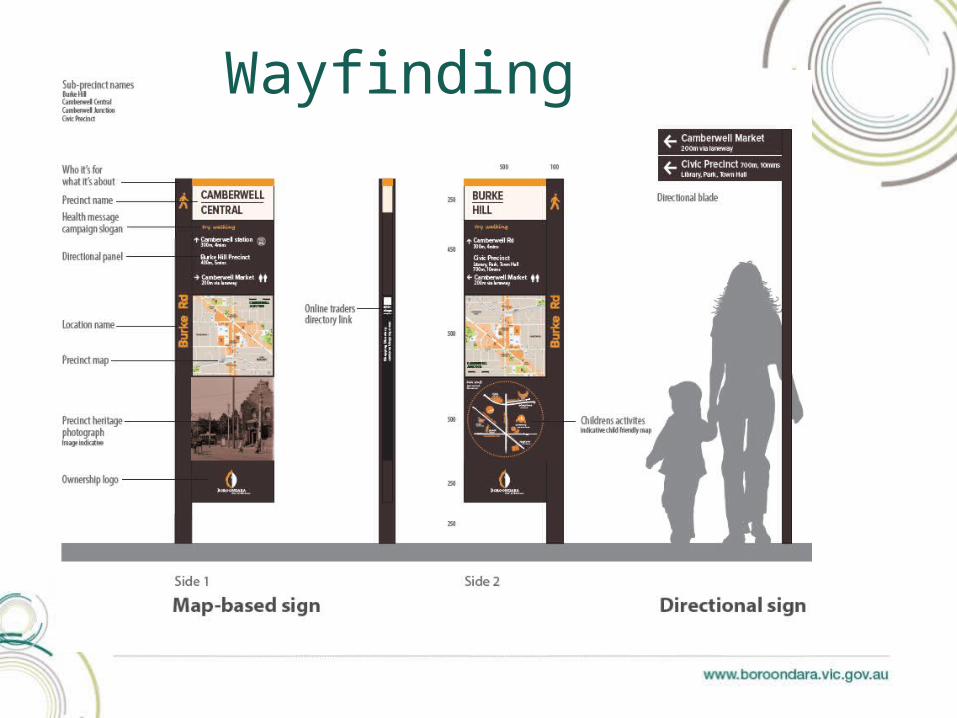
Wayfinding

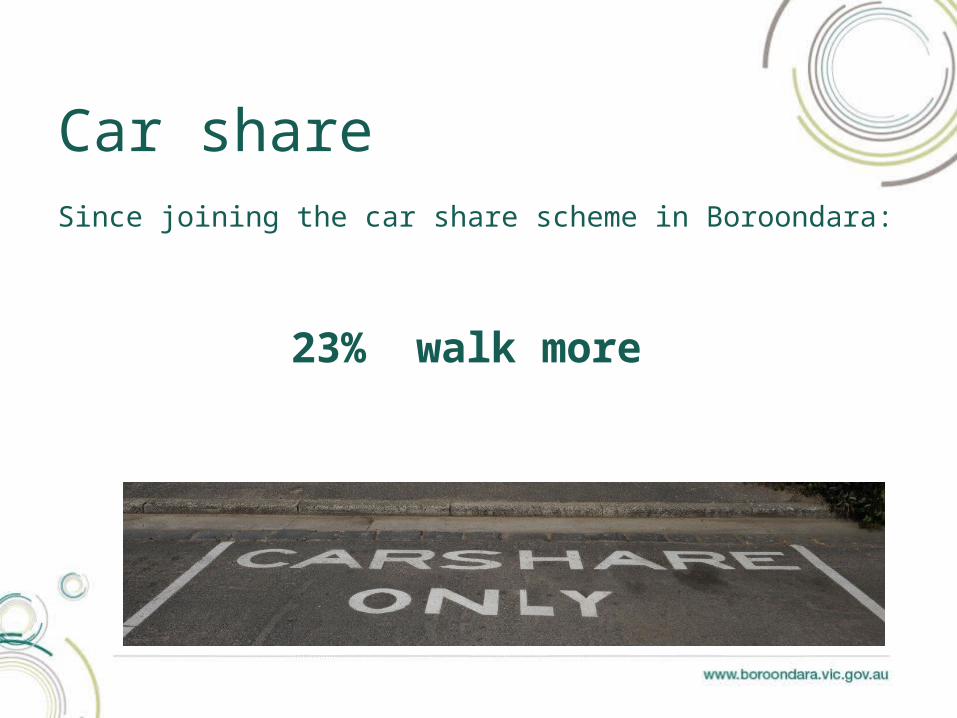
Car share
Since joining the car share scheme in Boroondara:
23% walk more
Behaviour change

• Enjoyment and fun• Autonomy• Reciprocity• Commitment• Prompts• Incentives• Social norming• Habits
Behavioural Elements
Fun and freedom
Social normingIncentives
Habits

• Driver Frustrations• Normalise walking• Loss aversion• Avoid being anti-car• Social activities• Fun and enjoyment• Short distances• Small changes• Local business
Design Principles
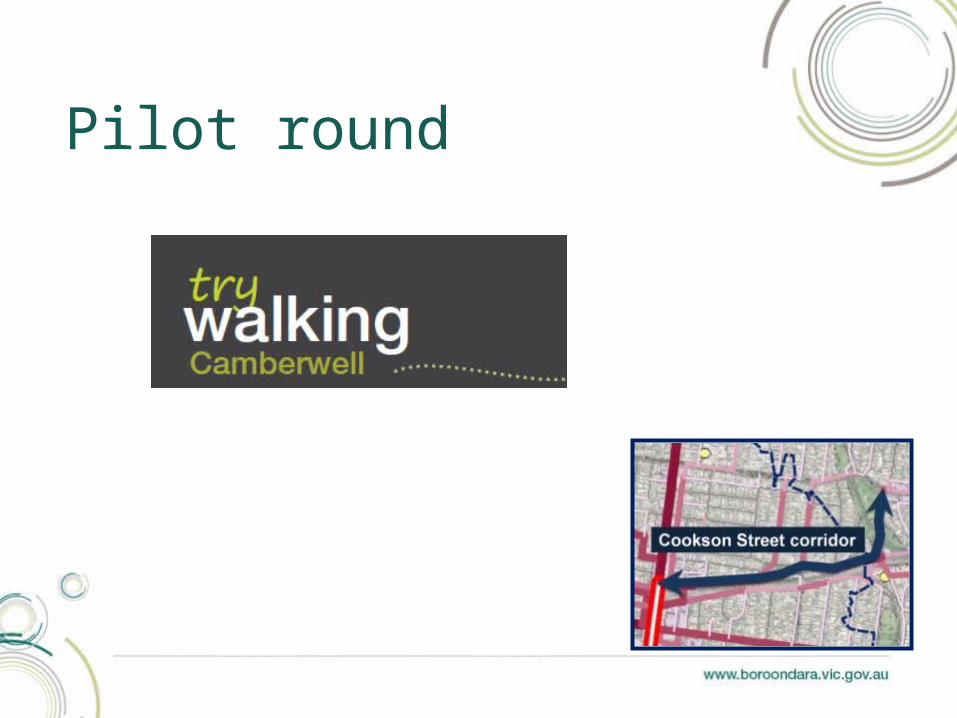
Pilot round

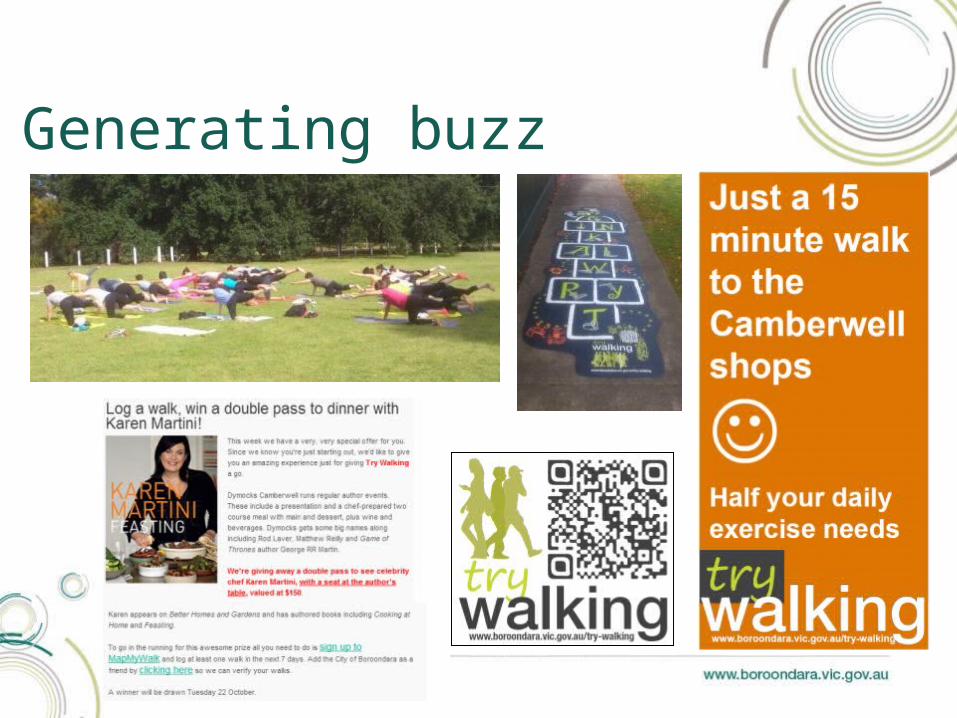
Generating buzz


Loss aversion prize draw
• $750 first prize – 17-20 walks per week• $200 second prize – 14-16 walks per week• $50 third prize – 10-13 walks per week
Local business incentives
• Featured businesses for one week each• Discount or other reward for visiting• Business gets free marketing and potential customers
directed there
Loss aversion
incentives

• 154 unique visitors to website
• 55 people regularly receive emails
• 16 participants using the app
Pilot participation
Motivating the Pilot group proved difficult

• Bupa partnership – prizes, Bupa Ground Miles
• Increased focus on health benefits of walking
• Lottery with regret
Second round

• Gamification elements• Badges• Awards• Leaderboard
• Shows daily progress
• Easy to use, no need to log specific walks
Bupa Ground Miles
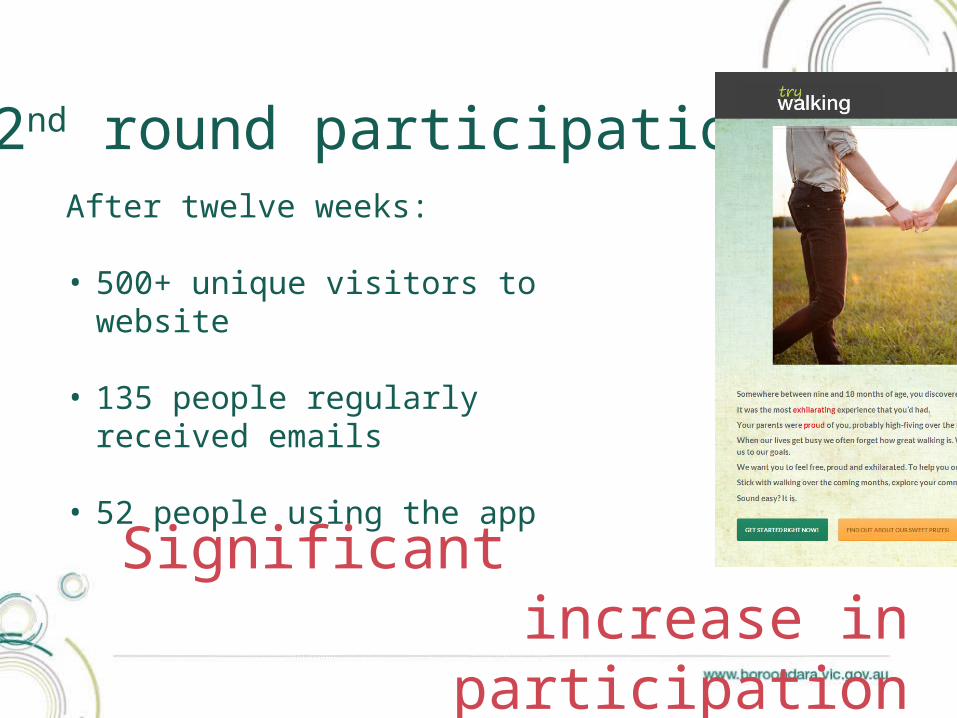
After twelve weeks:
• 500+ unique visitors to website
• 135 people regularly received emails
• 52 people using the app
2nd round participation
Significant increase in participation

Evaluation• Pedestrian counts
• Mobile application use Try Walking participants
• Interview surveys
• Email questionnaire Try Walking participants
• Comments and feedback
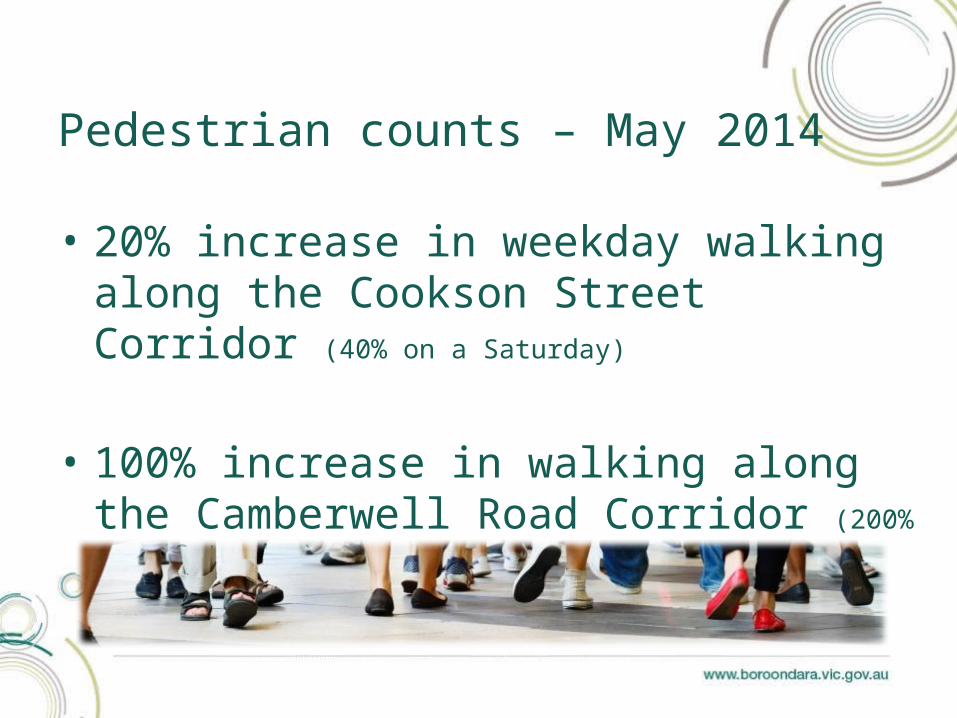
• 20% increase in weekday walking along the Cookson Street Corridor (40% on a Saturday)
• 100% increase in walking along the Camberwell Road Corridor (200% on a Saturday)
Pedestrian counts – May 2014
• Pilot - Cookson St Corridor
Reverted to base count level
• Second round – Camberwell Road Corridor 65% weekday 217% Saturday
To be continued …….. May 2015 counts
Longer term counts – Nov 2015

• 17% indicated they knew about Try Walking• A third indicated they walked more • A third indicated left the car at home more
Interview questionnaire – Nov 2015
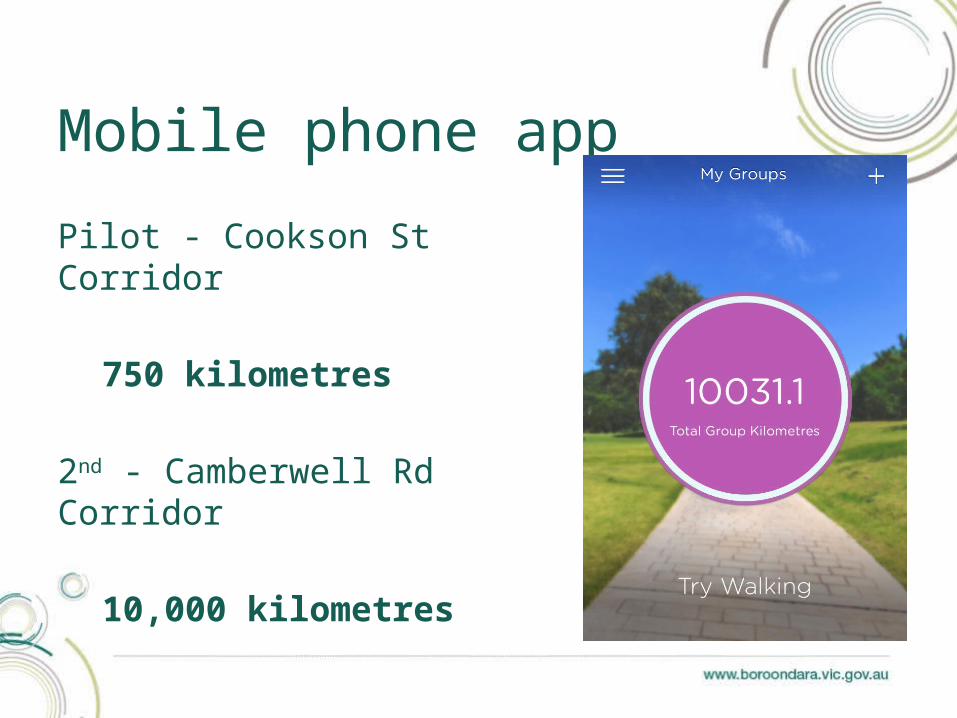
Pilot - Cookson St Corridor
750 kilometres
2nd - Camberwell Rd Corridor
10,000 kilometres
Mobile phone app
• 88% of these participants indicated that they walk more often
• 64% indicated that they drove less
Email questionnaire (Try Walking participants)

• Almost everyone is supportive of walking• We underestimate the scale of walking• We underestimate the value of walking• Modelling and surveys help to focus improvement• We learnt a lot about behaviour change• Significant increase in walking in the short term• Clear stated change in behaviour from the
community
Summary

“I love listening toaudio books while
I walk…To me Boroondara
has a hundred goodbooks reflected in
itsparks and leafy
streets”- Tish