hywel rowlands
TRANSCRIPT

Walking in Camberwell
City of Boroondara
Hywel Rowlands
Matthew Austin

• Overview
• Plan development
• Infrastructure
• Behaviour change
• Results

Partnership between
• Australian Governments Liveable Cities Program
• Department of Transport Planning Local Infrastructure
• Boroondara Council (plus 3 other Councils)
The Principal Pedestrian
Network Demonstration project

Camberwell Junction Activity Area

Objectives
• Increase the number of walk trips
• Reduce private car use
• Apply and assess the Principal Pedestrian Network methodology
• Deliver infrastructure and behaviour change

How do we increase walking participation?
How do we reduce car use?
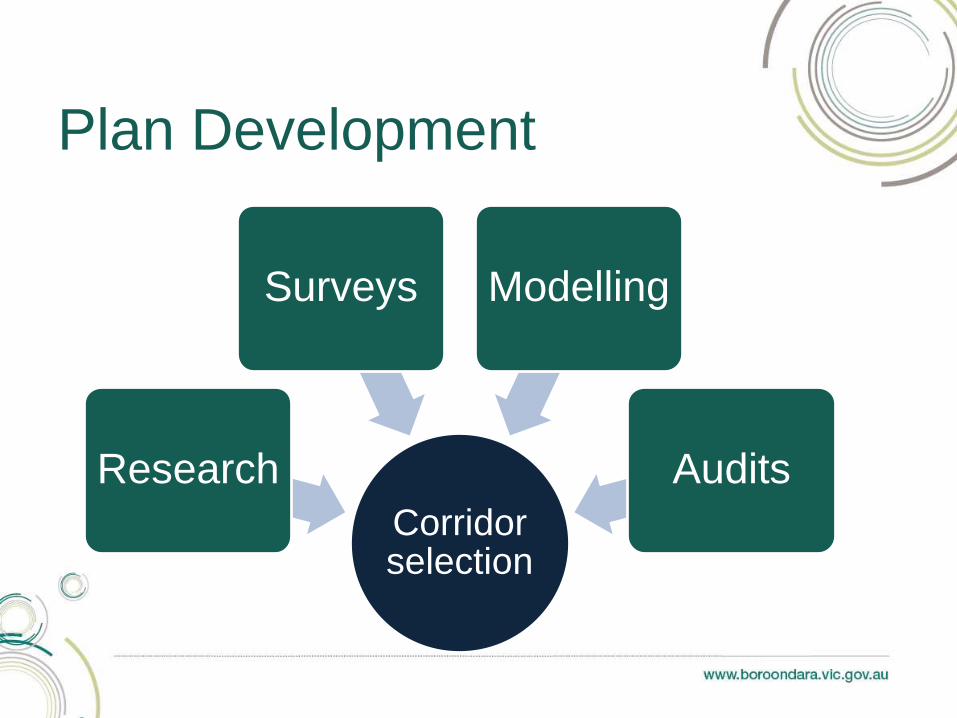
Plan Development
Corridor selection
Research
Surveys Modelling
Audits

Research
• Complete gaps - paths/crossings etc
• Remove risky locations and reduce speed
• Direct paths that are convenient to walk
• Trees and green space
• Amenity and information
• Car share (reducing car ownership)
• Behaviour change initiatives

Count Surveys
• 15,000 pedestrian
recorded through a
cordon around
Camberwell Junction
precinct (12 hour pedestrian counts – 20 locations)
Camberwell Station
Camberwell Junction

Questionnaire Surveys
• Origin
• Mode of transport
• Transport choice
• Trip purpose
• Trip frequency
• Spend

Half of all respondents travelled by car,
20% identified that walking was an option
Walking could accommodate
>30% mode share,

Pedestrians visit the most
often and spent the most
money annually
(Questionnaire Surveys 2012)

Modelling
The GIS model simply aggregates
the most direct catchment paths
Paths are weighted by their
respective population catchment

2
3
2
4
4
3
1
1
1
1
5
11
6
6
9
18
1
2
1
3
2
Weekday Weekend
Factor = modelled population/pedestrian counts
1

Cookson Street corridor
Camberwell Road corridor

Cookson Street Corridor
Connects to
• Trains
• Trams
• Shops
• Employment
• Schools
• Parks

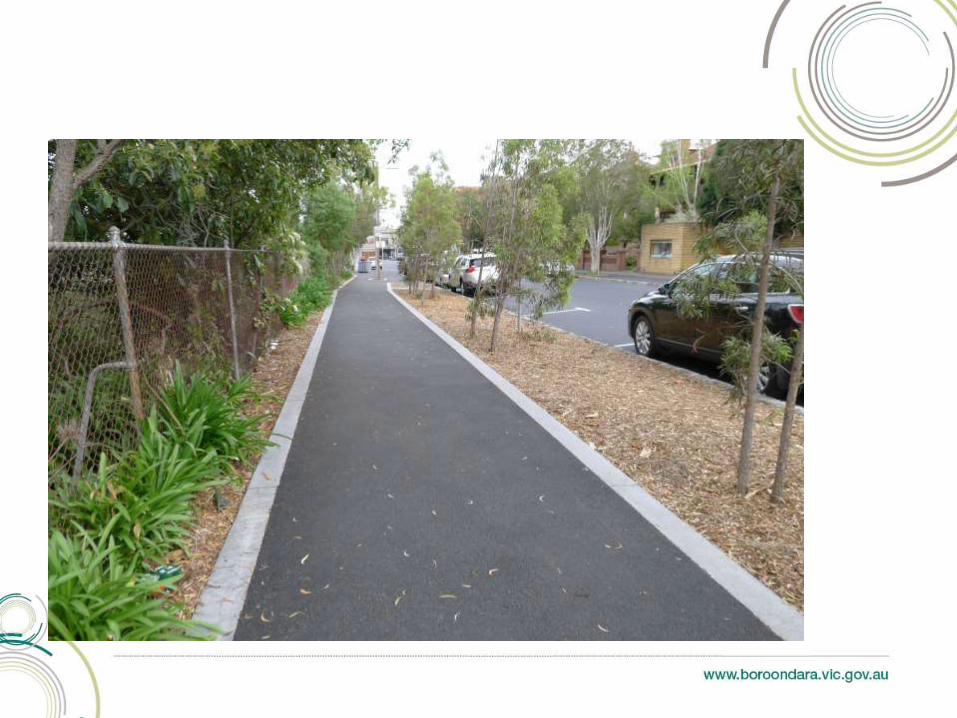
Cookson Street near Camberwell Station
Before After

Cookson Street
Before After

Cookson Street Corner adjacent Read Gardens
Before After
Before


East Camberwell Station
Before After

Further resolution required
• No ped crashes
• 2000 vph
• Vehicle every 2
seconds
• 60 km/h road
• 1/3 pedestrians
run to crossTowards
Camberwell Station
Towards East
Camberwell Station

Camberwell Road corridor
Connects to
• Trains
• Trams
• Library
• Shops
• Employment
• Schools
• Parks
• Council Offices

Before
After After

Just the mere presence of trees and greenery
has the effect of enticing more people to walk
and exercise (Wolf, 2010)
Trees were variables that parents considered
when allowing their child to walk (Naderi and
Kim, 2006)
The likelihood of walking or biking to school
was positively associated with …… street
trees (Larsen et al, 2009)
More greenery was associated with being
physically active and not being overweight or
obese (Ellaway et al, 2005)
Trees encourage physical activity

Evidence indicates that landscaping/trees in urban
streets/arterials can reduce speeds and crashes (Naderi, J.R. 2003) (Mok, J.-H., H. C. Landphair, and J. R. Naderi. 2006) (Lee, J., and F. Mannering. 1999) (Dumbaugh, E.
2005) (Chinn L and Elliott M. 2002) (Naderi, J.R., B.S. Kweon, and P. Meghalel. 2008)
Trees, when located on both sides of the street, create a
sense of enclosure that discourages drivers from speeding U.S. Department of Transportation - Federal Highway Administration.
Trees can reduce speed/crashes

The lack of seating is a barrier (Stahla et al, 2013)
Seat every 200-300
metres implemented
After

Wayfinding

Car share
Since joining the car share scheme in Boroondara:
• 8.7% had sold a car,
• 21.7% had avoided buying a car
• 23% walk more
• 27% cycle more

Behaviour change
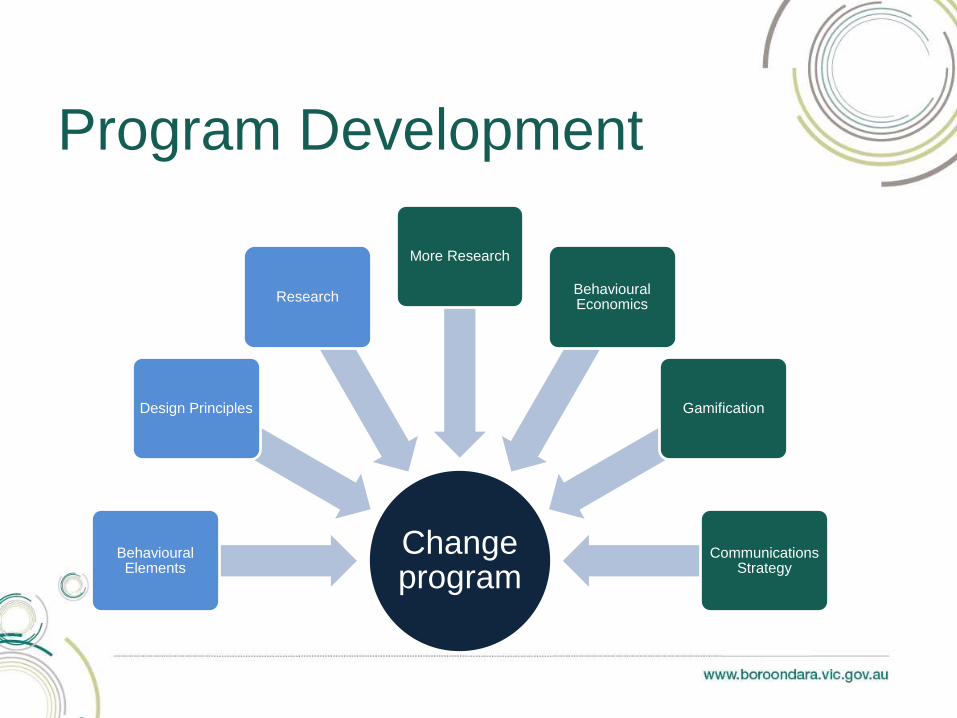
Program Development
Change program
Behavioural Elements
Design Principles
Research
More Research
Behavioural Economics
Gamification
Communications Strategy

• Enjoyment and fun
• Autonomy
• Reciprocity
• Commitment
• Prompts
• Incentives
• Social proof / norming
• Habits
Behavioural Elements

• Driver Frustrations
• Normalise walking
• Loss aversion
• Avoid being anti-car
• Social activities
• Fun and enjoyment
• Short distances
• Small changes
• Local business
Design Principles

Pilot round

Communications


Generating buzz

Loss aversion prize draw
• $750 first prize – 17-20 walks per week
• $200 second prize – 14-16 walks per week
• $50 third prize – 10-13 walks per week
Local business incentives
• Featured businesses for one week each
• Discount or other reward for visiting
• Business gets free marketing and potential customers
directed there
Loss aversion
incentives

• Available on iPhones and Android
• GPS to track trips
• Records distance, time and compares with others
• Friends

• 154 unique visitors to website
• 55 people regularly receive emails
• 16 participants
…total distance logged via MapMyWalk: 725km
Pilot round results
725 km

• MapMyWalk was difficult to use
• Financial incentives and rewards did not resonate
• Local shopping incentives did not motivate
Lessons learnt

• Bupa partnership – promotion, prizes, Bupa Ground Miles
• Increased focus on health benefits of walking
• Decreased focus on incentives and local shopping
Second round

• Gamification elements
• Badges
• Awards
• Leaderboard
• Shows daily progress
• Easy to use, no need to
log specific walks
Bupa Ground Miles

After twelve weeks:
• 500+ unique visitors to website
• 135 people regularly received emails
• 52 people using the app
…total distance logged:
10,004km
Second round results
10,004 km

Media

Results

• 20% increase in weekday walking along the
Cookson Street Corridor (40% on a Saturday)
• 100% increase in walking along the
Camberwell Road Corridor (200% on a Saturday)
Preliminary walking increase

Pilot initiative –
• 750 kilometres walked in 12 weeks
Second round –
• 10,000 kilometres walked in 12 weeks
Try Walking participation

• 88% of these participants indicated that they walk more often
• 64% indicated that they drove less
Try Walking participants

HEAT analysis – WHOAssumptions
Value of statistical life in Australia – $3.5m
Crude mortality rate in Australia – 550 per 100,000
Infrastructure life – 30 years
Cookson Street Camberwell Road
Initial count 808 1100
Interim count 982 2181
Proportion (conservative) 75% 33%
Mean distance 800m 500m
Total cost $461,000 $330,000
Cost / Benefit 1:6 1:14

Focus on walking corridors to access a destination
Latent demand can be evaluated and best value achieved
Behaviour change promoted walking and the improvements
Self-efficacy – building belief in ones ability
Almost everyone is supportive of improving walking conditions
A mode shift to walking can be achieved and this
should be integral in managing our health,
environmental, traffic and parking challenges
In summary

Brochure

Thank you