trip generation and parking study - ite western district final report... · trip generation and...
TRANSCRIPT
TRIP GENERATION AND PARKING STUDY
WAIPIO PENINSULA SOCCER COMPLEX
HONOLULU, HI
INSTITUTE OF TRANSPORTATION ENGINEERS
UNIVERSITY OF HAWAII, MANOA
STUDENT CHAPTER
MARCH 2011
Trip Generation and Parking Study
University of Hawaii, ITE Student Chapter
2
Trip and Parking Generation Data Project in Waipio Peninsula Soccer Complex
Background The ITE student members conducted a trip and parking generation study at the Waipio
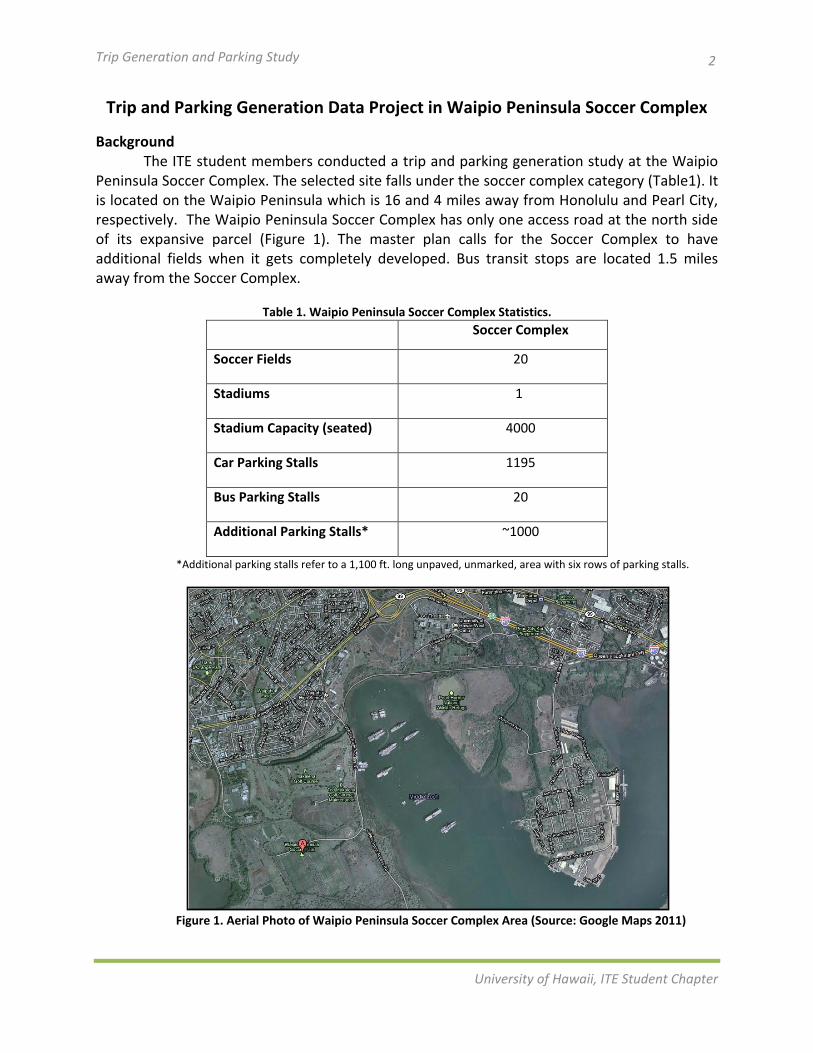
Peninsula Soccer Complex. The selected site falls under the soccer complex category (Table1). It is located on the Waipio Peninsula which is 16 and 4 miles away from Honolulu and Pearl City, respectively. The Waipio Peninsula Soccer Complex has only one access road at the north side of its expansive parcel (Figure 1). The master plan calls for the Soccer Complex to have additional fields when it gets completely developed. Bus transit stops are located 1.5 miles away from the Soccer Complex.
Table 1. Waipio Peninsula Soccer Complex Statistics.
Soccer Complex
Soccer Fields 20
Stadiums 1
Stadium Capacity (seated) 4000
Car Parking Stalls 1195
Bus Parking Stalls 20
Additional Parking Stalls* ~1000
*Additional parking stalls refer to a 1,100 ft. long unpaved, unmarked, area with six rows of parking stalls.
Figure 1. Aerial Photo of Waipio Peninsula Soccer Complex Area (Source: Google Maps 2011)
Trip Generation and Parking Study
University of Hawaii, ITE Student Chapter
3
Data Collection Traffic data were collected for three days (Thursday, Saturday and Sunday) for 12 hours
(7:00 AM to 7:00 PM each day) for a total of 36 hours of traffic observations, to study the traffic impact of the Soccer Complex when it is used for practice or routine league games that take place usually during a weekday and tournaments that take place during the weekend. Pedestrian and bicycle movements also were collected to study their impact in traffic generation.
Trip and parking generation data were collected by observers who recorded the license plate numbers (3 letters and 1 number to maintain privacy) of the entering and exiting vehicles in 15-minute time intervals. The number of vehicles that use the parking lot or just enter the facility for dropping-off was estimated.
Results
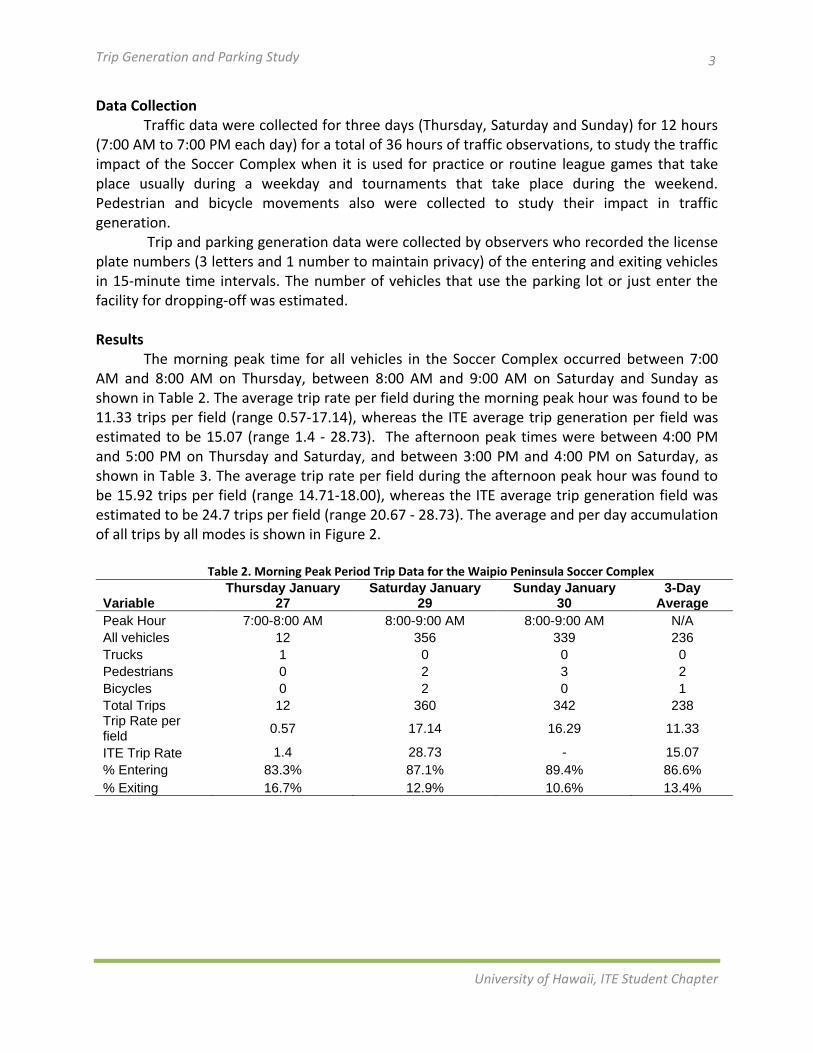
The morning peak time for all vehicles in the Soccer Complex occurred between 7:00 AM and 8:00 AM on Thursday, between 8:00 AM and 9:00 AM on Saturday and Sunday as shown in Table 2. The average trip rate per field during the morning peak hour was found to be 11.33 trips per field (range 0.57-17.14), whereas the ITE average trip generation per field was estimated to be 15.07 (range 1.4 - 28.73). The afternoon peak times were between 4:00 PM and 5:00 PM on Thursday and Saturday, and between 3:00 PM and 4:00 PM on Saturday, as shown in Table 3. The average trip rate per field during the afternoon peak hour was found to be 15.92 trips per field (range 14.71-18.00), whereas the ITE average trip generation field was estimated to be 24.7 trips per field (range 20.67 - 28.73). The average and per day accumulation of all trips by all modes is shown in Figure 2.
Table 2. Morning Peak Period Trip Data for the Waipio Peninsula Soccer Complex
Variable Thursday January
27 Saturday January
29 Sunday January
30 3-Day
Average
Peak Hour 7:00-8:00 AM 8:00-9:00 AM 8:00-9:00 AM N/A
All vehicles 12 356 339 236
Trucks 1 0 0 0
Pedestrians 0 2 3 2
Bicycles 0 2 0 1
Total Trips 12 360 342 238 Trip Rate per field
0.57 17.14 16.29 11.33
ITE Trip Rate 1.4 28.73 - 15.07
% Entering 83.3% 87.1% 89.4% 86.6%
% Exiting 16.7% 12.9% 10.6% 13.4%
Trip Generation and Parking Study
University of Hawaii, ITE Student Chapter
4
Table 3. Afternoon Peak Period Trip Data for the Waipio Peninsula Soccer Complex
Variable Thursday January
27 Saturday January
29 Sunday January
30 3-Day Average
Peak Hour 4:00-5:00 PM 4:00-5:00 PM 3:00-4:00 PM N/A
All vehicles 307 316 377 333
Trucks 1 1 0 1
Pedestrians 1 0 1 1
Bicycles 1 0 0 0
Total Trips 309 316 378 334 Trip Rate per field
14.71 15.05 18.00 15.92
ITE Trip Rate 20.67 28.73 - 24.70
% Entering 72.0% 6.6% 37.1% 38.6%
% Exiting 28.0% 93.4% 62.9% 61.4%
Figure 2. Accumulation of Hourly Trips
The mode split for all trips at the Soccer Complex shown in Table 4 and 5 indicate that
the majority of the trips are made in passenger vehicles; other non-motor modes account for less than 2%. Although there are 30 parking stalls for buses in the Soccer Complex, during Saturday and Sunday very few of them came in. The percentage of trucks that came in during Thursday is slightly higher compared with Saturday and Sunday, and most of these trucks were mainly maintenance heavy duty vehicles for the Soccer Complex.
0
100
200
300
400
500
600
700
7:0
0
8:0
0
9:0
0
10
:00
11
:00
12
:00
13
:00
14
:00
15
:00
16
:00
17
:00
18
:00
19
:00A
ccu
mu
lati
on
of
Trip
s (H
ou
rly)
Hour
Sunday Saturday Thursday 3-Day Average
Trip Generation and Parking Study
University of Hawaii, ITE Student Chapter
5
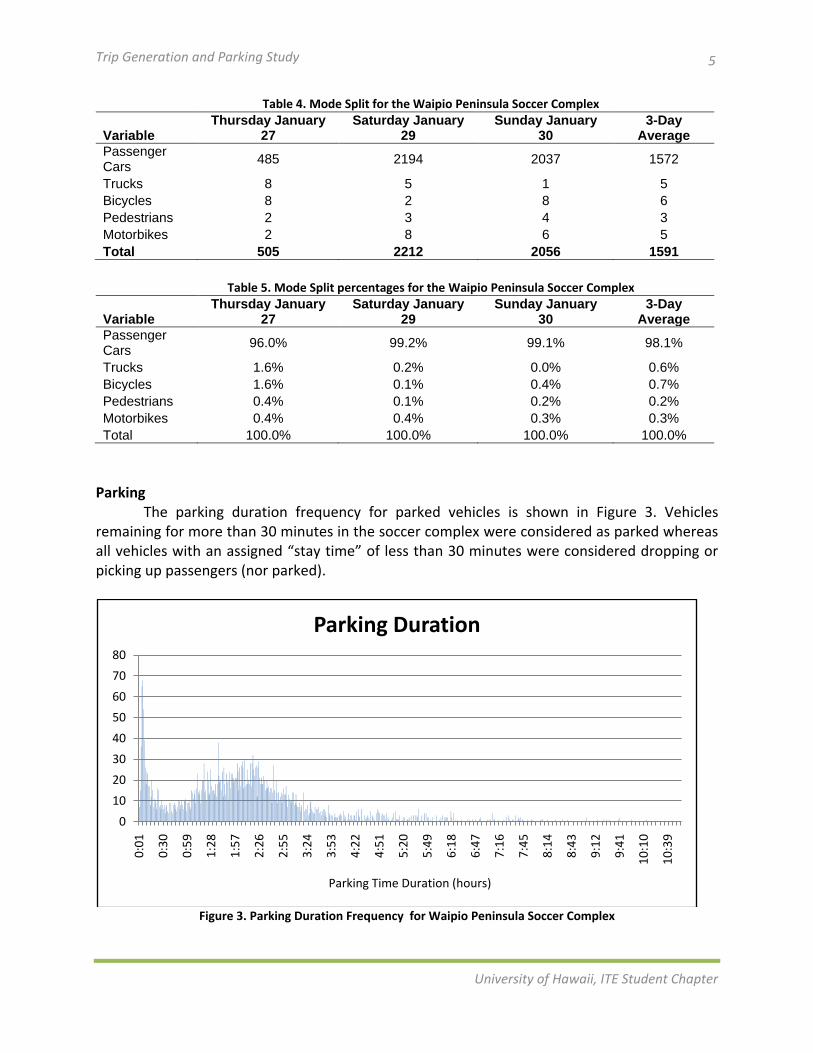
Table 4. Mode Split for the Waipio Peninsula Soccer Complex
Variable Thursday January
27 Saturday January
29 Sunday January
30 3-Day
Average
Passenger Cars
485 2194 2037 1572
Trucks 8 5 1 5
Bicycles 8 2 8 6
Pedestrians 2 3 4 3
Motorbikes 2 8 6 5
Total 505 2212 2056 1591
Table 5. Mode Split percentages for the Waipio Peninsula Soccer Complex
Variable Thursday January
27 Saturday January
29 Sunday January
30 3-Day
Average
Passenger Cars
96.0% 99.2% 99.1% 98.1%
Trucks 1.6% 0.2% 0.0% 0.6%
Bicycles 1.6% 0.1% 0.4% 0.7%
Pedestrians 0.4% 0.1% 0.2% 0.2%
Motorbikes 0.4% 0.4% 0.3% 0.3%
Total 100.0% 100.0% 100.0% 100.0%
Parking The parking duration frequency for parked vehicles is shown in Figure 3. Vehicles
remaining for more than 30 minutes in the soccer complex were considered as parked whereas all vehicles with an assigned “stay time” of less than 30 minutes were considered dropping or picking up passengers (nor parked).
Figure 3. Parking Duration Frequency for Waipio Peninsula Soccer Complex
0
10
20
30
40
50
60
70
80
0:0
1
0:3
0
0:5
9
1:2
8
1:5
7
2:2
6
2:5
5
3:2
4
3:5
3
4:2
2
4:5
1
5:2
0
5:4
9
6:1
8
6:4
7
7:1
6
7:4
5
8:1
4
8:4
3
9:1
2
9:4
1
10
:10
10
:39
Parking Time Duration (hours)
Parking Duration
Trip Generation and Parking Study
University of Hawaii, ITE Student Chapter
6
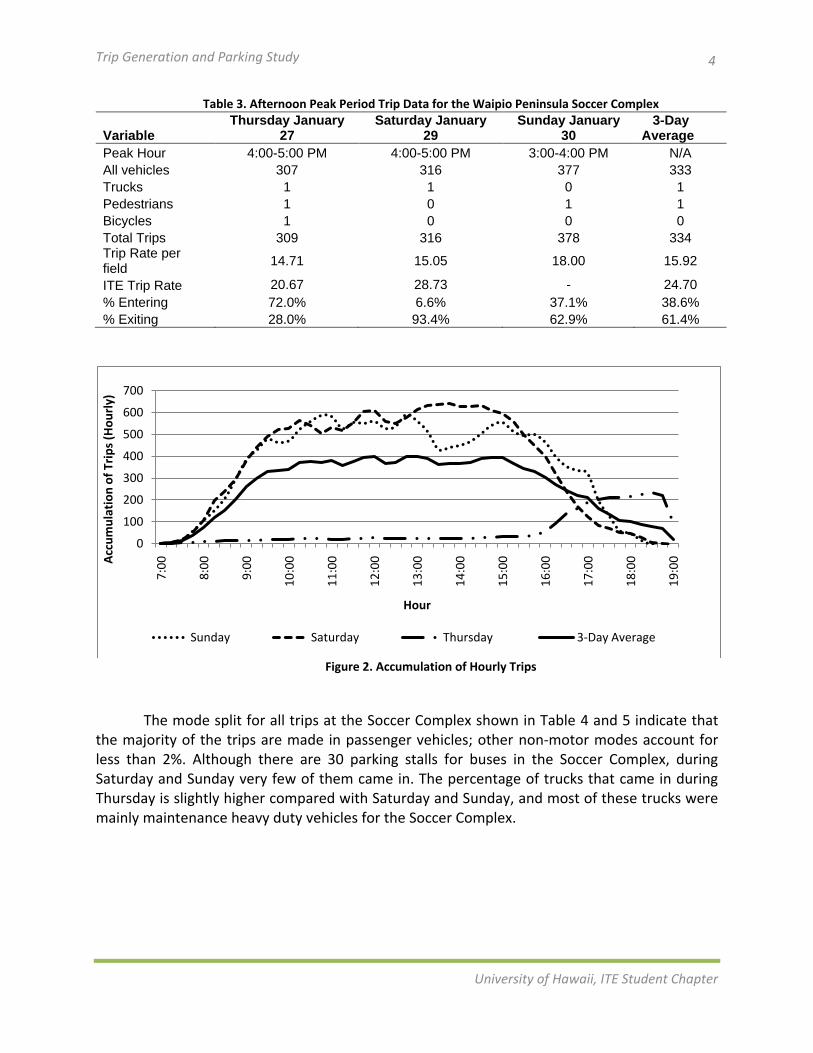
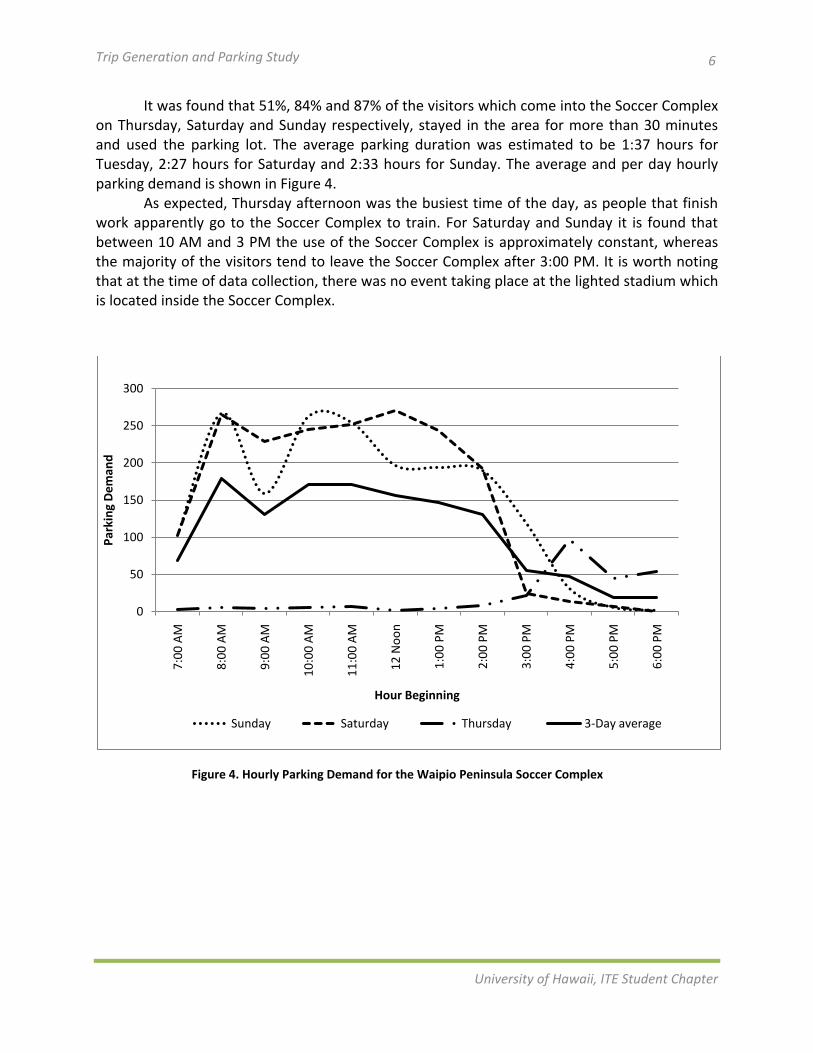
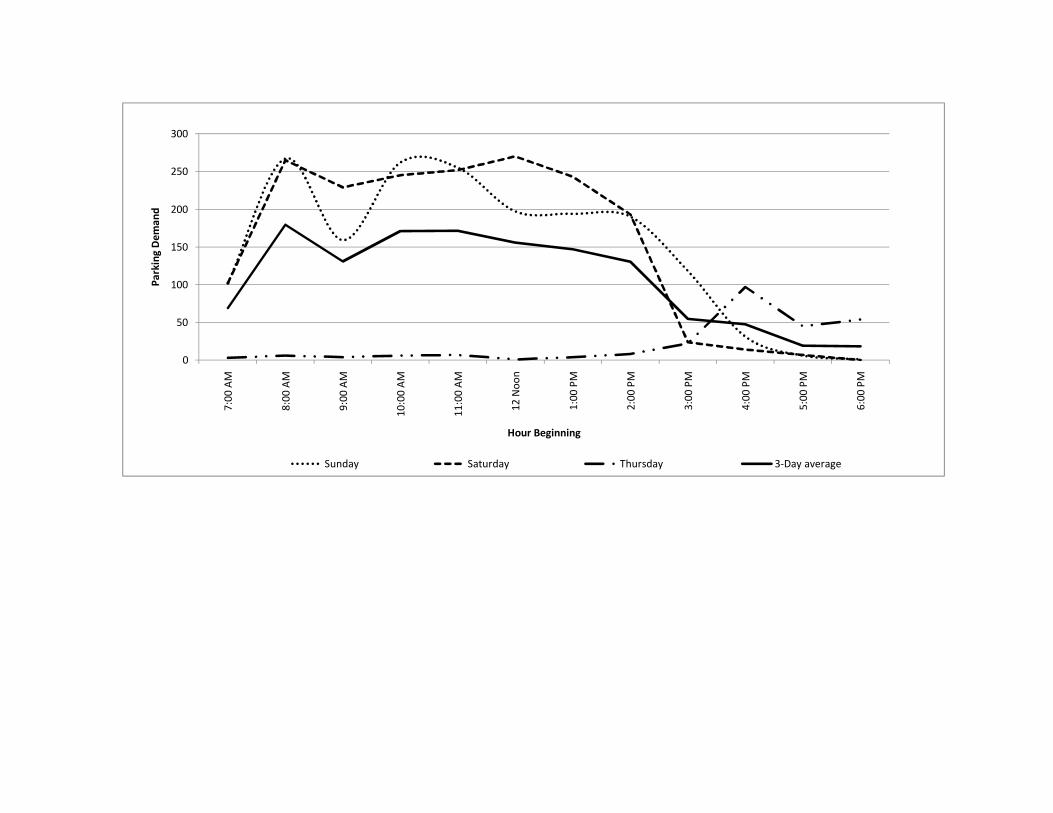
It was found that 51%, 84% and 87% of the visitors which come into the Soccer Complex on Thursday, Saturday and Sunday respectively, stayed in the area for more than 30 minutes and used the parking lot. The average parking duration was estimated to be 1:37 hours for Tuesday, 2:27 hours for Saturday and 2:33 hours for Sunday. The average and per day hourly parking demand is shown in Figure 4.
As expected, Thursday afternoon was the busiest time of the day, as people that finish work apparently go to the Soccer Complex to train. For Saturday and Sunday it is found that between 10 AM and 3 PM the use of the Soccer Complex is approximately constant, whereas the majority of the visitors tend to leave the Soccer Complex after 3:00 PM. It is worth noting that at the time of data collection, there was no event taking place at the lighted stadium which is located inside the Soccer Complex.
Figure 4. Hourly Parking Demand for the Waipio Peninsula Soccer Complex
0
50
100
150
200
250
300
7:0
0 A
M
8:0
0 A
M
9:0
0 A
M
10
:00
AM
11
:00
AM
12
No
on
1:0
0 P
M
2:0
0 P
M
3:0
0 P
M
4:0
0 P
M
5:0
0 P
M
6:0
0 P
M
Par
kin
g D
em
and
Hour Beginning
Sunday Saturday Thursday 3-Day average
� ��������� �� �������1 ITE Land Use Code:
Source: Source No. (ITE use only):
Name of Development: Day of the Week:
City: State/Province: Zip/Postal Code: Day: Month: Year:
Country: Metropolitan Area:
Institute of Transportation Engineers
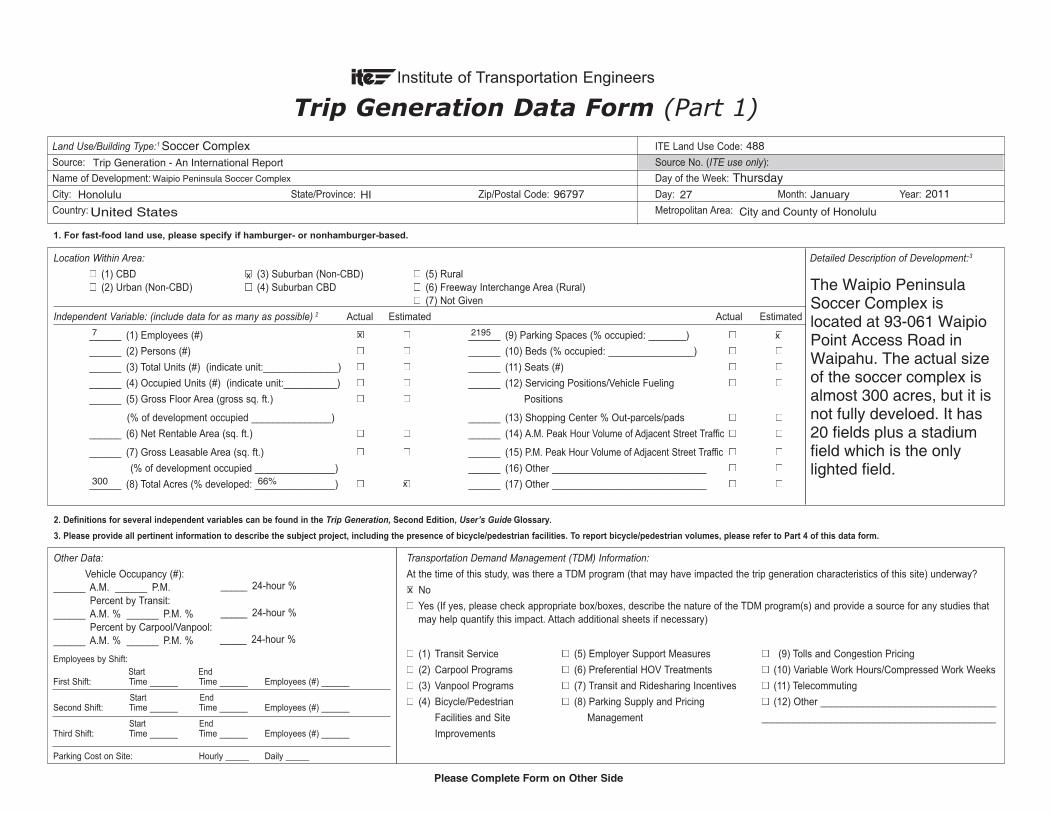
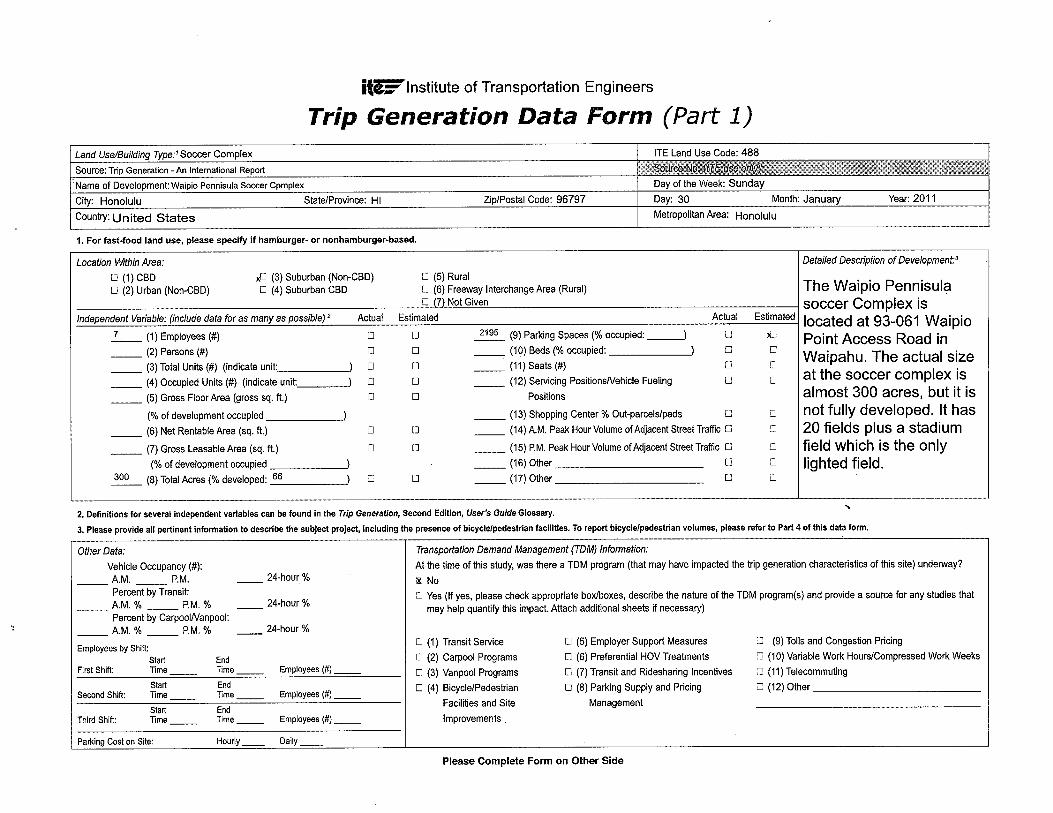
Trip Generation Data Form (Part 1)
1. For fast-food land use, please specify if hamburger- or nonhamburger-based.
2. Definitions for several independent variables can be found in the Trip Generation, Second Edition, User’s Guide ��������.
3. Please provide all pertinent information to describe the subject project, including the presence of bicycle/pedestrian facilities. To report bicycle/pedestrian volumes, please refer to Part 4 of this data form.
����������
Vehicle Occupancy (#): ______ A.M. ______ P.M. Percent by Transit: ______ A.M. % ______ P.M. % Percent by Carpool/Vanpool: ______ A.M. % ______ P.M. %
����������� �������������������������������� ���
At the time of this study, was there a TDM program (that may have impacted the trip generation characteristics of this site) underway?
� No
� Yes (If yes, please check appropriate box/boxes, describe the nature of the TDM program(s) and provide a source for any studies that may help quantify this impact. Attach additional sheets if necessary)
� (1) Transit Service � (5) Employer Support Measures � (9) Tolls and Congestion Pricing
� (2) Carpool Programs � (6) Preferential HOV Treatments � (10) Variable Work Hours/Compressed Work Weeks
� (3) Vanpool Programs � (7) Transit and Ridesharing Incentives � (11) Telecommuting
� (4) Bicycle/Pedestrian � (8) Parking Supply and Pricing � (12) Other _________________________________
Facilities and Site Management ____________________________________________
Improvements
Please Complete Form on Other Side
��!�� ���" �� ��#���� ����������������������������������������������������������������������������������������������� �����!� �� �������$�������3
� (1) CBD � (3) Suburban (Non-CBD) � (5) Rural � (2) Urban (Non-CBD) � (4) Suburban CBD � (6) Freeway Interchange Area (Rural) � (7) Not Given
Independent Variable: (include data for as many as possible) 2 Actual Estimated Actual Estimated
______ (1) Employees (#) � � ______ (9) Parking Spaces (% occupied: _______) � �
______ (2) Persons (#) � � ______ (10) Beds (% occupied: ________________) � �
______ (3) Total Units (#) (indicate unit:______________) � � ______ (11) Seats (#) � �
______ (4) Occupied Units (#) (indicate unit:__________) � � ______ (12) Servicing Positions/Vehicle Fueling � �
______ (5) Gross Floor Area (gross sq. ft.) � � Positions
(% of development occupied _______________) ______ (13) Shopping Center % Out-parcels/pads � �
______ (6) Net Rentable Area (sq. ft.) � � ______ (14) A.M. Peak Hour Volume of Adjacent Street Traffic � �
______ (7) Gross Leasable Area (sq. ft.) � � ______ (15) P.M. Peak Hour Volume of Adjacent Street Traffic � �
(% of development occupied _______________) � ______ (16) Other _____________________________ � �
______ (8) Total Acres (% developed: _______________) � �� ______ (17) Other _____________________________ � �
_____ 24-hour %
_____ 24-hour %
_____ 24-hour %
Employees by Shift:
First Shift: Time ______ Time ______ Employees (#) ______
Second Shift: Time ______ Time ______ Employees (#) ______
Third Shift: Time ______ Time ______ Employees (#) ______
Parking Cost on Site: Hourly _____ Daily _____
Start End
Start End
Start End
Soccer Complex 488
Trip Generation - An International Report
ThursdayWaipio Peninsula Soccer Complex
Honolulu HI 96797 27 January 2011
United States City and County of Honolulu
x
x
7 2195
300 66%
x x
x
The Waipio PeninsulaSoccer Complex islocated at 93-061 WaipioPoint Access Road inWaipahu. The actual sizeof the soccer complex isalmost 300 acres, but it isnot fully develoed. It has20 fields plus a stadiumfield which is the onlylighted field.
Average Weekday (M-F) Saturday Sunday
Enter Exit Total Enter Exit Total Enter Exit Total
All Trucks All Trucks All Trucks All Trucks All Trucks All Trucks All Trucks All Trucks All Trucks
24-Hour VolumeA.M. Peak Hour of Adjacent1 Street Traffic (7 – 9)Time (ex.: 7:15 - 8:15):P.M. Peak Hour of Adjacent1 Street Traffic (4 – 6) Time:A.M. Peak Hour Generator 2
Time:P.M. Peak Hour Generator2 Time:Peak Hour Generator3
Time (Weekend):
Institute of Transportation Engineers
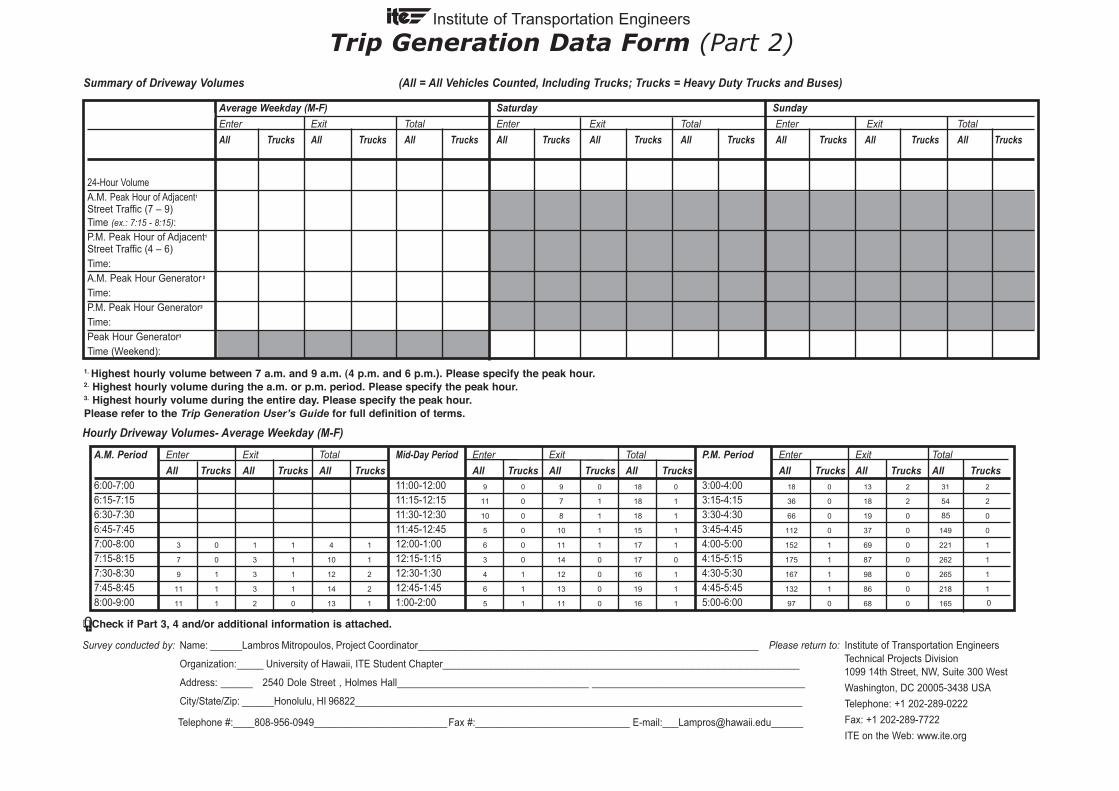
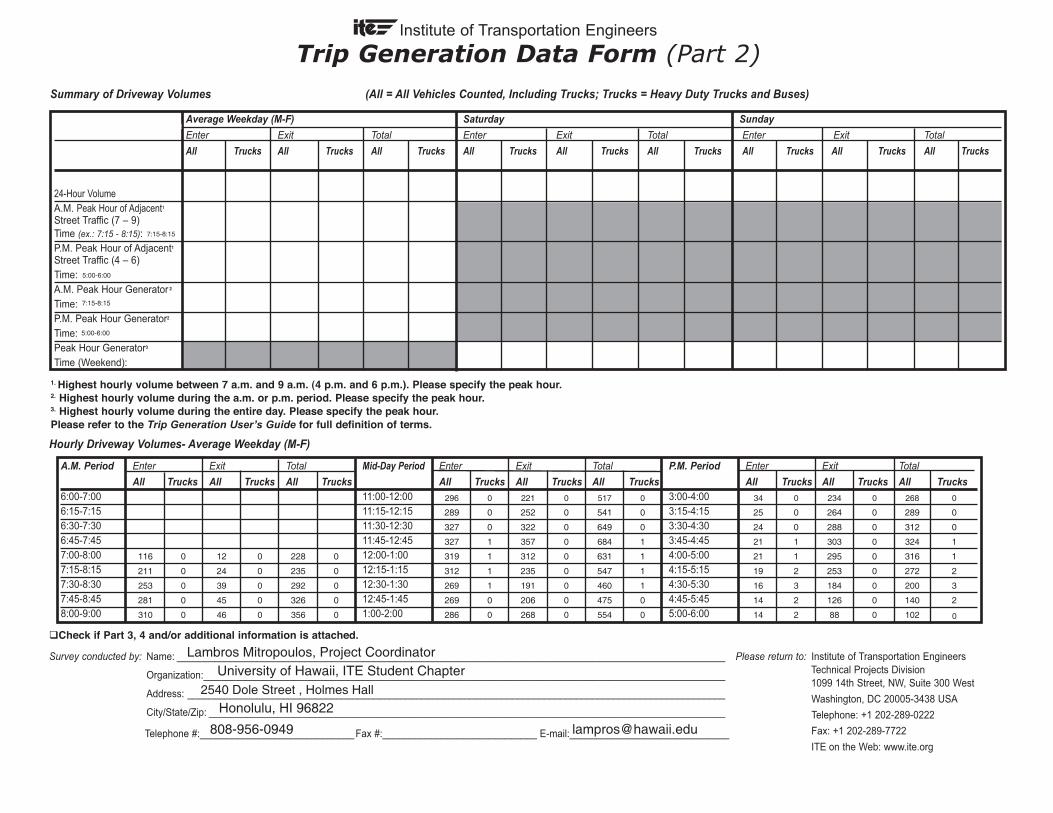
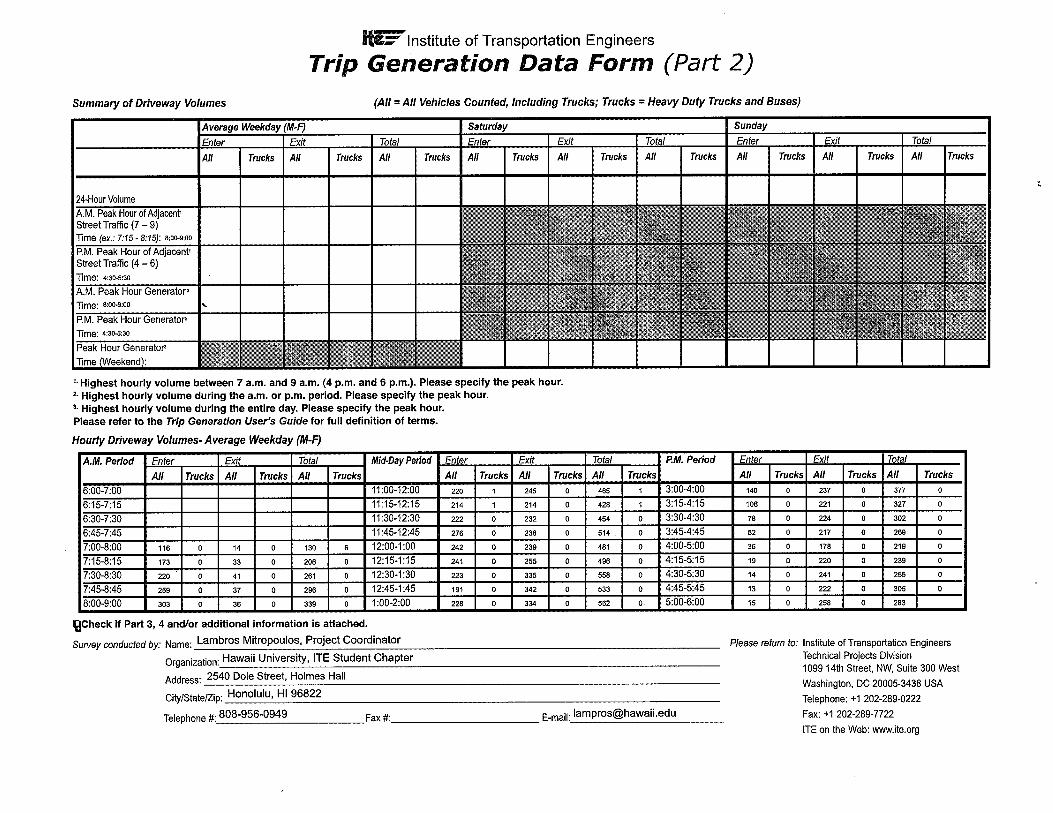
Trip Generation Data Form (Part 2)Summary of Driveway Volumes (All = All Vehicles Counted, Including Trucks; Trucks = Heavy Duty Trucks and Buses)
Survey conducted by: Name: ______Lambros Mitropoulos, Project Coordinator________________________________________________________________
Organization: _____ University of Hawaii, ITE Student Chapter___________________________________________________________________
Address: ______ 2540 Dole Street , Holmes Hall____________________________________ ________________________________________
City/State/Zip: ______Honolulu, HI 96822____________________________________________________________________________________
Telephone #:____808-956-0949_________________________ Fax #:_____________________________ E-mail:[email protected]______
Please return to: Institute of Transportation Engineers Technical Projects Division 1099 14th Street, NW, Suite 300 West
Washington, DC 20005-3438 USA
Telephone: +1 202-289-0222
Fax: +1 202-289-7722
ITE on the Web: www.ite.org
A.M. Period Enter Exit Total Mid-Day Period Enter Exit Total P.M. Period Enter Exit Total
All Trucks All Trucks All Trucks All Trucks All Trucks All Trucks All Trucks All Trucks All Trucks6:00-7:00 11:00-12:00 3:00-4:006:15-7:15 11:15-12:15 3:15-4:15 6:30-7:30 11:30-12:30 3:30-4:306:45-7:45 11:45-12:45 3:45-4:457:00-8:00 12:00-1:00 4:00-5:007:15-8:15 12:15-1:15 4:15-5:157:30-8:30 12:30-1:30 4:30-5:307:45-8:45 12:45-1:45 4:45-5:458:00-9:00 1:00-2:00 5:00-6:00
1. Highest hourly volume between 7 a.m. and 9 a.m. (4 p.m. and 6 p.m.). Please specify the peak hour.2. Highest hourly volume during the a.m. or p.m. period. Please specify the peak hour.3. Highest hourly volume during the entire day. Please specify the peak hour.Please refer to the Trip Generation User’s Guide for full definition of terms.
Hourly Driveway Volumes- Average Weekday (M-F)
�Check if Part 3, 4 and/or additional information is attached.
0
9 0 9 0 18 0 18 0 13 2 31 2
11 0 7 1 18 1 36 0 18 2 54 2
10 0 8 1 18 1 66 0 19 0 3 0
5 0 10 1 15 1 112 0 37 0 149 0
3 0 1 1 4 1 6 0 11 1 17 1 152 1 69 0 221 1
7 0 3 1 10 1 3 0 14 0 17 0 175 1 87 0 262 1
9 1 3 1 12 2 4 1 12 0 16 1 167 1 98 0 265 1
11 1 3 1 14 2 6 1 13 0 19 1 132 1 86 0 218 1
11 1 2 0 13 1 5 1 11 0 16 1 97 0 68 0 165
0
85
A.M. Period Enter Exit Total P.M. Period Enter Exit Total
All Trucks All Trucks All Trucks All Trucks All Trucks All Trucks12:00-12:15 12:00-12:1512:15-12:30 12:15-12:3012:30-12:45 12:30-12:4512:45-1:00 12:45-1:001:00-1:15 1:00-1:151:15-1:30 1:15-1:301:30-1:45 1:30-1:451:45-2:00 1:45-2:002:00-2:15 2:00-2:152:15-2:30 2:15-2:302:30-2:45 2:30-2:452:45-3:00 2:45-3:00 3:00-3:15 3:00-3:153:15-3:30 3:15-3:303:30-3:45 3:30-3:45 3:45-4:00 3:45-4:004:00-4:15 4:00-4:154:15-4:30 4:15-4:304:30-4:45 4:30-4:454:45-5:00 4:45-5:005:00-5:15 5:00-5:155:15-5:30 5:15-5:305:30-5:45 5:30-5:455:45-6:00 5:45-6:006:00-6:15 6:00-6:156:15-6:30 6:15-6:306:30-6:45 6:30-6:456:45-7:00 6:45-7:007:00-7:15 7:00-7:157:15-7:30 7:15-7:307:30-7:45 7:30-7:457:45-8:00 7:45-8:008:00-8:15 8:00-8:158:15-8:30 8:15-8:308:30-8:45 8:30-8:458:45-9:00 8:45-9:009:00-9:15 9:00-9:159:15-9:30 9:15-9:309:30-9:45 9:30-9:459:45-10:00 9:45-10:0010:00-10:15 10:00-10:1510:15-10:30 10:15-10:3010:30-10:45 10:30-10:4510:45-11:00 10:45-11:0011:00-11:15 11:00-11:1511:15-11:30 11:15-11:3011:30-11:45 11:30-11:4511:45-12:00 11:45-12:00
Institute of Transportation Engineers
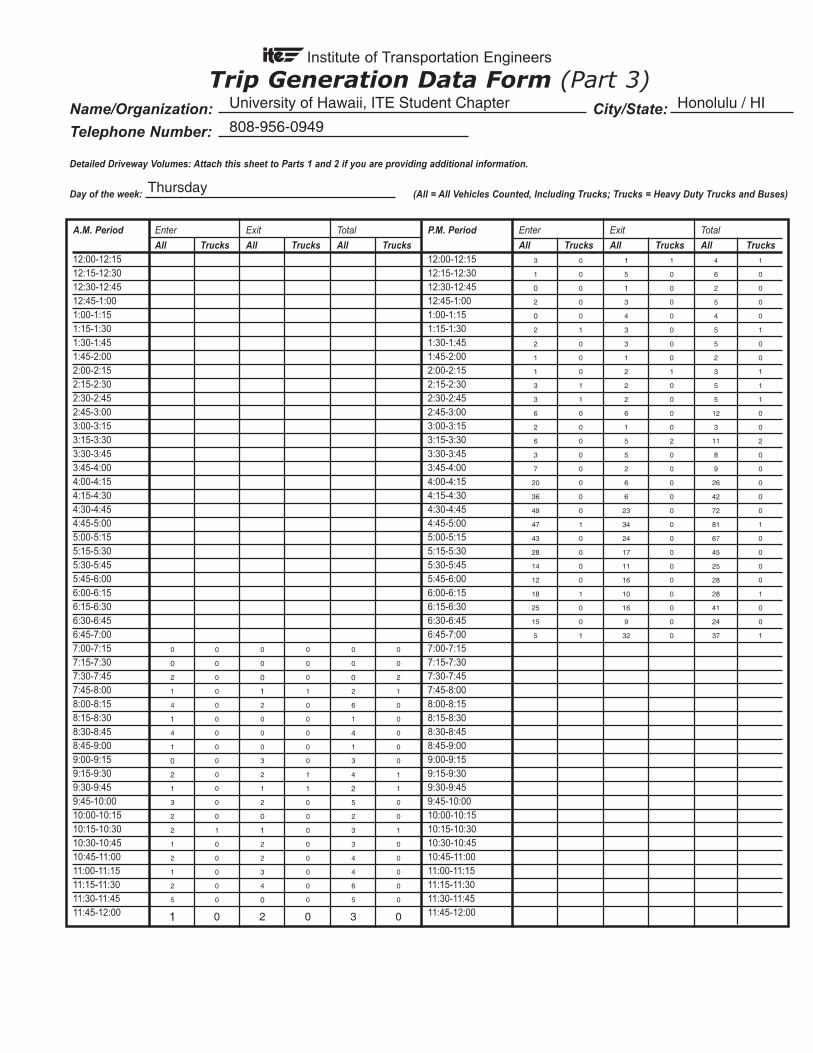
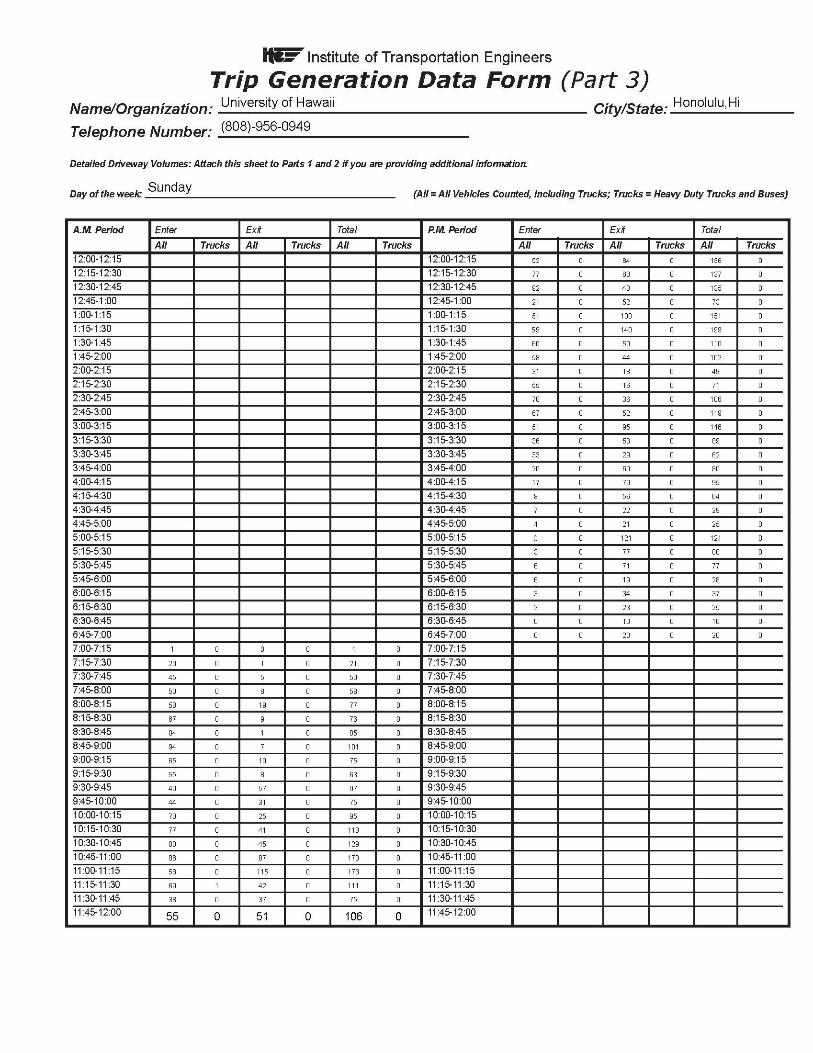
Trip Generation Data Form (Part 3)Name/Organization: City/State:
Telephone Number:
Detailed Driveway Volumes: Attach this sheet to Parts 1 and 2 if you are providing additional information.
Day of the week: (All = All Vehicles Counted, Including Trucks; Trucks = Heavy Duty Trucks and Buses)
University of Hawaii, ITE Student Chapter Honolulu / HI
808-956-0949
Thursday
3 0 1 1 4 1
1 0 5 0 6 0
0 0 1 0 2 0
2 0 3 0 5 0
0 0 4 0 4 0
2 1 3 0 5 1
2 0 3 0 5 0
1 0 1 0 2 0
1 0 2 1 3 1
3 1 2 0 5 1
3 1 2 0 5 1
6 0 6 0 12 0
2 0 1 0 3 0
6 0 5 2 11 2
3 0 5 0 8 0
7 0 2 0 9 0
20 0 6 0 26 0
36 0 6 0 42 0
49 0 23 0 72 0
47 1 34 0 81 1
43 0 24 0 67 0
28 0 17 0 45 0
14 0 11 0 25 0
12 0 16 0 28 0
18 1 10 0 28 1
25 0 16 0 41 0
15 0 9 0 24 0
5 1 32 0 37 1
0 0 0 0 0 0
0 0 0 0 0 0
2 0 0 0 0 2
1 0 1 1 2 1
4 0 2 0 6 0
1 0 0 0 1 0
4 0 0 0 4 0
1 0 0 0 1 0
0 0 3 0 3 0
2 0 2 1 4 1
1 0 1 1 2 1
3 0 2 0 5 0
2 0 0 0 2 0
2 1 1 0 3 1
1 0 2 0 3 0
2 0 2 0 4 0
1 0 3 0 4 0
2 0 4 0 6 0
5 0 0 0 5 0
1 0 2 0 3 0

� ��������� �� �������1 ITE Land Use Code:
Source: Source No. (ITE use only):
Name of Development: Day of the Week:
City: State/Province: Zip/Postal Code: Day: Month: Year:
Country: Metropolitan Area:
Institute of Transportation Engineers
Trip Generation Data Form (Part 1)
1. For fast-food land use, please specify if hamburger- or nonhamburger-based.
2. Definitions for several independent variables can be found in the Trip Generation, Second Edition, User’s Guide ��������.
3. Please provide all pertinent information to describe the subject project, including the presence of bicycle/pedestrian facilities. To report bicycle/pedestrian volumes, please refer to Part 4 of this data form.
����������
Vehicle Occupancy (#): ______ A.M. ______ P.M. Percent by Transit: ______ A.M. % ______ P.M. % Percent by Carpool/Vanpool: ______ A.M. % ______ P.M. %
����������� �������������������������������� ���
At the time of this study, was there a TDM program (that may have impacted the trip generation characteristics of this site) underway?
� No
� Yes (If yes, please check appropriate box/boxes, describe the nature of the TDM program(s) and provide a source for any studies that may help quantify this impact. Attach additional sheets if necessary)
� (1) Transit Service � (5) Employer Support Measures � (9) Tolls and Congestion Pricing
� (2) Carpool Programs � (6) Preferential HOV Treatments � (10) Variable Work Hours/Compressed Work Weeks
� (3) Vanpool Programs � (7) Transit and Ridesharing Incentives � (11) Telecommuting
� (4) Bicycle/Pedestrian � (8) Parking Supply and Pricing � (12) Other _________________________________
Facilities and Site Management ____________________________________________
Improvements
Please Complete Form on Other Side
��!�� ���" �� ��#���� ����������������������������������������������������������������������������������������������� �����!� �� �������$�������3
� (1) CBD � (3) Suburban (Non-CBD) � (5) Rural � (2) Urban (Non-CBD) � (4) Suburban CBD � (6) Freeway Interchange Area (Rural) � (7) Not Given
Independent Variable: (include data for as many as possible) 2 Actual Estimated Actual Estimated
______ (1) Employees (#) � � ______ (9) Parking Spaces (% occupied: _______) � �
______ (2) Persons (#) � � ______ (10) Beds (% occupied: ________________) � �
______ (3) Total Units (#) (indicate unit:______________) � � ______ (11) Seats (#) � �
______ (4) Occupied Units (#) (indicate unit:__________) � � ______ (12) Servicing Positions/Vehicle Fueling � �
______ (5) Gross Floor Area (gross sq. ft.) � � Positions
(% of development occupied _______________) ______ (13) Shopping Center % Out-parcels/pads � �
______ (6) Net Rentable Area (sq. ft.) � � ______ (14) A.M. Peak Hour Volume of Adjacent Street Traffic � �
______ (7) Gross Leasable Area (sq. ft.) � � ______ (15) P.M. Peak Hour Volume of Adjacent Street Traffic � �
(% of development occupied _______________) � ______ (16) Other _____________________________ � �
______ (8) Total Acres (% developed: _______________) � �� ______ (17) Other _____________________________ � �
_____ 24-hour %
_____ 24-hour %
_____ 24-hour %
Employees by Shift:
First Shift: Time ______ Time ______ Employees (#) ______
Second Shift: Time ______ Time ______ Employees (#) ______
Third Shift: Time ______ Time ______ Employees (#) ______
Parking Cost on Site: Hourly _____ Daily _____
Start End
Start End
Start End
Soccer Complex 488
Trip Generation - An International Report
SaturdayWaipio Peninsula Soccer Complex
Honolulu HI 96797 29 January 2011
United States City and County of Honolulu
x
x
7 2195
300 66%
x x
x
The Waipio PeninsulaSoccer Complex islocated at 93-061 WaipioPoint Access Road inWaipahu. The actual sizeof the soccer complex isalmost 300 acres, but it isnot fully develoed. It has20 fields plus a stadiumfield which is the onlylighted field.
Average Weekday (M-F) Saturday Sunday
Enter Exit Total Enter Exit Total Enter Exit Total
All Trucks All Trucks All Trucks All Trucks All Trucks All Trucks All Trucks All Trucks All Trucks
24-Hour VolumeA.M. Peak Hour of Adjacent1 Street Traffic (7 – 9)Time (ex.: 7:15 - 8:15):P.M. Peak Hour of Adjacent1 Street Traffic (4 – 6) Time:A.M. Peak Hour Generator 2
Time:P.M. Peak Hour Generator2 Time:Peak Hour Generator3
Time (Weekend):
Institute of Transportation Engineers
Trip Generation Data Form (Part 2)Summary of Driveway Volumes (All = All Vehicles Counted, Including Trucks; Trucks = Heavy Duty Trucks and Buses)
Survey conducted by: Name: _______________________________________________________________________________________________________
Organization: __________________________________________________________________________________________________
Address: _____________________________________________________________________________________________________
City/State/Zip: _________________________________________________________________________________________________
Telephone #:_____________________________ Fax #:_____________________________ E-mail:______________________________
Please return to: Institute of Transportation Engineers Technical Projects Division 1099 14th Street, NW, Suite 300 West
Washington, DC 20005-3438 USA
Telephone: +1 202-289-0222
Fax: +1 202-289-7722
ITE on the Web: www.ite.org
A.M. Period Enter Exit Total Mid-Day Period Enter Exit Total P.M. Period Enter Exit Total
All Trucks All Trucks All Trucks All Trucks All Trucks All Trucks All Trucks All Trucks All Trucks6:00-7:00 11:00-12:00 3:00-4:006:15-7:15 11:15-12:15 3:15-4:15 6:30-7:30 11:30-12:30 3:30-4:306:45-7:45 11:45-12:45 3:45-4:457:00-8:00 12:00-1:00 4:00-5:007:15-8:15 12:15-1:15 4:15-5:157:30-8:30 12:30-1:30 4:30-5:307:45-8:45 12:45-1:45 4:45-5:458:00-9:00 1:00-2:00 5:00-6:00
1. Highest hourly volume between 7 a.m. and 9 a.m. (4 p.m. and 6 p.m.). Please specify the peak hour.2. Highest hourly volume during the a.m. or p.m. period. Please specify the peak hour.3. Highest hourly volume during the entire day. Please specify the peak hour.Please refer to the Trip Generation User’s Guide for full definition of terms.
Hourly Driveway Volumes- Average Weekday (M-F)
�Check if Part 3, 4 and/or additional information is attached.
7:15-8:15
5:00-6:00
5:00-6:00
7:15-8:15
296 0 221 0 517 0 34 0 234 0 268 0
289 0 252 0 541 0 25 0 264 0 289 0
327 0 322 0 649 0 24 0 288 0 312 0
327 1 357 0 684 1 21 1 303 0 324 1
116 0 12 0 228 0 319 1 312 0 631 1 21 1 295 0 316 1
211 0 24 0 235 0 312 1 235 0 547 1 19 2 253 0 272 2
253 0 39 0 292 0 269 1 191 0 460 1 16 3 184 0 200 3
281 0 45 0 326 0 269 0 206 0 475 0 14 2 126 0 140 2
310 0 46 0 356 0 286 0 268 0 554 0 14 2 88 0 102
Lambros Mitropoulos, Project Coordinator University of Hawaii, ITE Student Chapter
2540 Dole Street , Holmes Hall
Honolulu, HI 96822
808-956-0949 [email protected]
0
A.M. Period Enter Exit Total P.M. Period Enter Exit Total
All Trucks All Trucks All Trucks All Trucks All Trucks All Trucks12:00-12:15 12:00-12:1512:15-12:30 12:15-12:3012:30-12:45 12:30-12:4512:45-1:00 12:45-1:001:00-1:15 1:00-1:151:15-1:30 1:15-1:301:30-1:45 1:30-1:451:45-2:00 1:45-2:002:00-2:15 2:00-2:152:15-2:30 2:15-2:302:30-2:45 2:30-2:452:45-3:00 2:45-3:00 3:00-3:15 3:00-3:153:15-3:30 3:15-3:303:30-3:45 3:30-3:45 3:45-4:00 3:45-4:004:00-4:15 4:00-4:154:15-4:30 4:15-4:304:30-4:45 4:30-4:454:45-5:00 4:45-5:005:00-5:15 5:00-5:155:15-5:30 5:15-5:305:30-5:45 5:30-5:455:45-6:00 5:45-6:006:00-6:15 6:00-6:156:15-6:30 6:15-6:306:30-6:45 6:30-6:456:45-7:00 6:45-7:007:00-7:15 7:00-7:157:15-7:30 7:15-7:307:30-7:45 7:30-7:457:45-8:00 7:45-8:008:00-8:15 8:00-8:158:15-8:30 8:15-8:308:30-8:45 8:30-8:458:45-9:00 8:45-9:009:00-9:15 9:00-9:159:15-9:30 9:15-9:309:30-9:45 9:30-9:459:45-10:00 9:45-10:0010:00-10:15 10:00-10:1510:15-10:30 10:15-10:3010:30-10:45 10:30-10:4510:45-11:00 10:45-11:0011:00-11:15 11:00-11:1511:15-11:30 11:15-11:3011:30-11:45 11:30-11:4511:45-12:00 11:45-12:00
Institute of Transportation Engineers
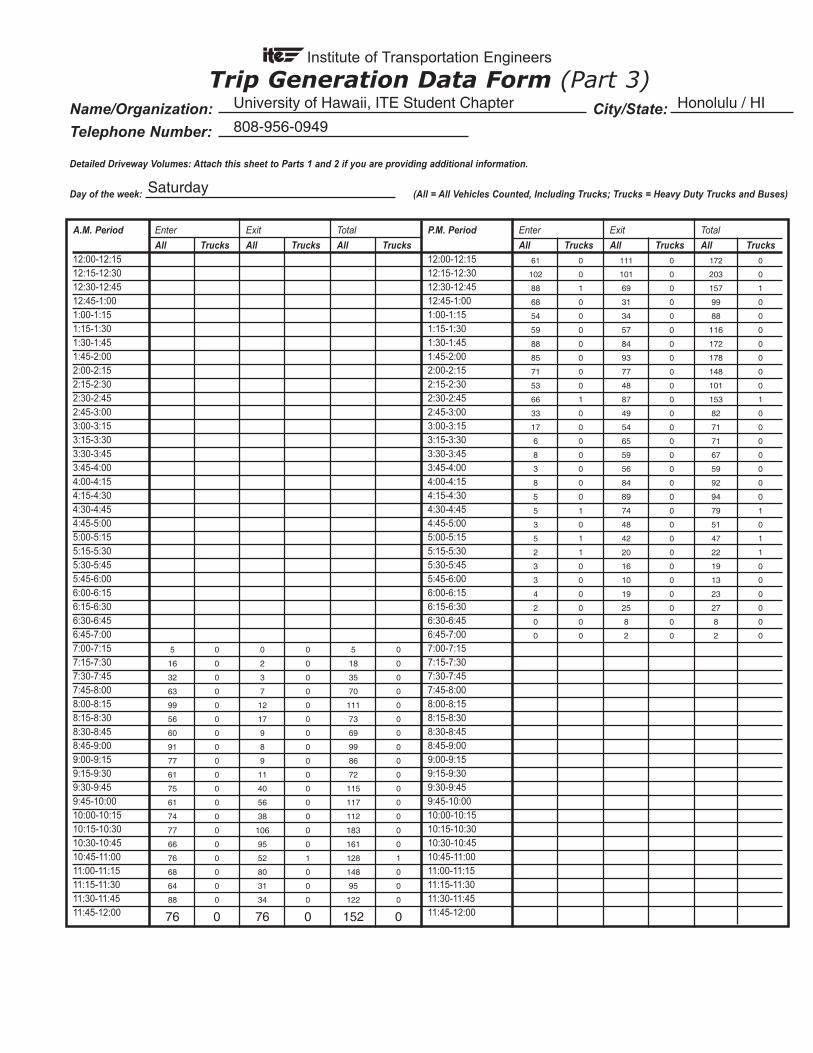
Trip Generation Data Form (Part 3)Name/Organization: City/State:
Telephone Number:
Detailed Driveway Volumes: Attach this sheet to Parts 1 and 2 if you are providing additional information.
Day of the week: (All = All Vehicles Counted, Including Trucks; Trucks = Heavy Duty Trucks and Buses)
University of Hawaii, ITE Student Chapter Honolulu / HI
808-956-0949
Saturday
61 0 111 0 172 0
102 0 101 0 203 0
88 1 69 0 157 1
68 0 31 0 99 0
54 0 34 0 88 0
59 0 57 0 116 0
88 0 84 0 172 0
85 0 93 0 178 0
71 0 77 0 148 0
53 0 48 0 101 0
66 1 87 0 153 1
33 0 49 0 82 0
17 0 54 0 71 0
6 0 65 0 71 0
8 0 59 0 67 0
3 0 56 0 59 0
8 0 84 0 92 0
5 0 89 0 94 0
5 1 74 0 79 1
3 0 48 0 51 0
5 1 42 0 47 1
2 1 20 0 22 1
3 0 16 0 19 0
3 0 10 0 13 0
4 0 19 0 23 0
2 0 25 0 27 0
0 0 8 0 8 0
0 0 2 0 2 0
5 0 0 0 5 0
16 0 2 0 18 0
32 0 3 0 35 0
63 0 7 0 70 0
99 0 12 0 111 0
56 0 17 0 73 0
60 0 9 0 69 0
91 0 8 0 99 0
77 0 9 0 86 0
61 0 11 0 72 0
75 0 40 0 115 0
61 0 56 0 117 0
74 0 38 0 112 0
77 0 106 0 183 0
66 0 95 0 161 0
76 0 52 1 128 1
68 0 80 0 148 0
64 0 31 0 95 0
88 0 34 0 122 0
76 0 76 0 152 0
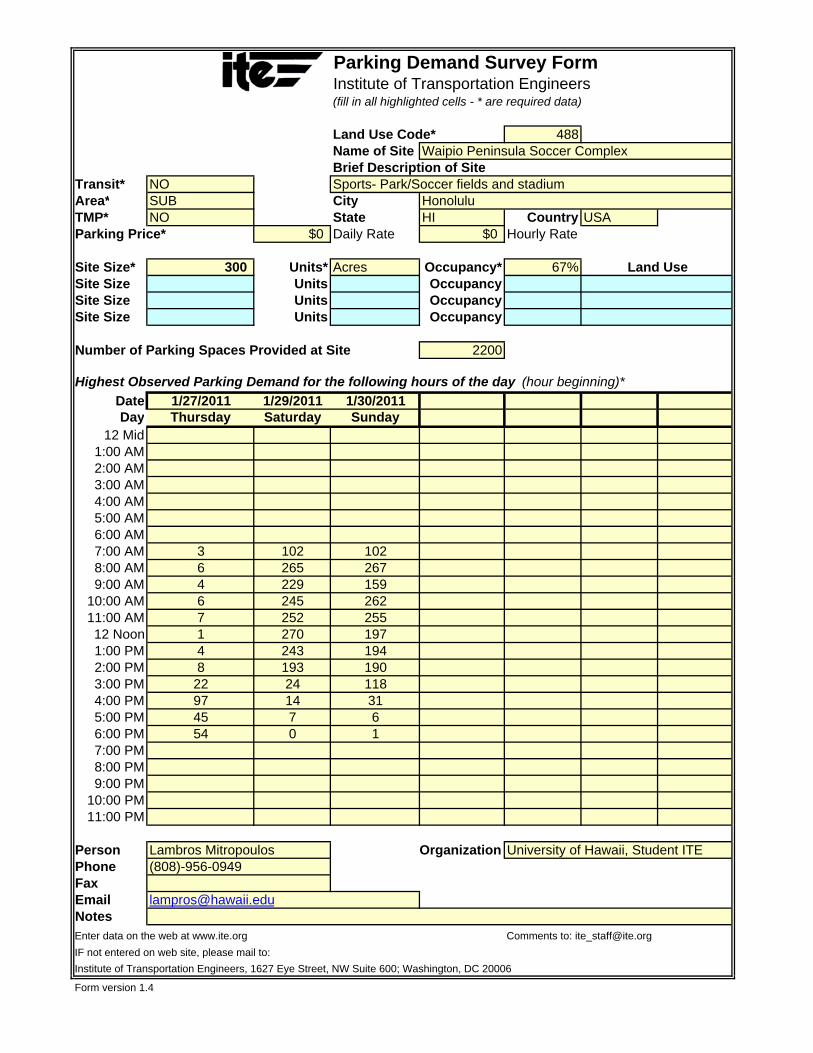
Parking Demand Survey FormInstitute of Transportation Engineers(fill in all highlighted cells - * are required data)
Land Use Code* 488Name of Site Waipio Peninsula Soccer ComplexBrief Description of Site
Transit* NOArea* SUB City HonoluluTMP* NO State HI Country USAParking Price* $0 Daily Rate $0 Hourly Rate
Site Size* 300 Units* Acres Occupancy* 67%Site Size Units OccupancySite Size Units OccupancySite Size Units Occupancy
Number of Parking Spaces Provided at Site 2200
Highest Observed Parking Demand for the following hours of the day (hour beginning)*
Date 1/27/2011 1/29/2011 1/30/2011Day Thursday Saturday Sunday
12 Mid1:00 AM2:00 AM3:00 AM4:00 AM5:00 AM6:00 AM7:00 AM 3 102 1028:00 AM 6 265 2679:00 AM 4 229 159
10:00 AM 6 245 26211:00 AM 7 252 25512 Noon 1 270 1971:00 PM 4 243 1942:00 PM 8 193 1903:00 PM 22 24 1184:00 PM 97 14 315:00 PM 45 7 66:00 PM 54 0 17:00 PM8:00 PM9:00 PM
10:00 PM11:00 PM
Person Lambros Mitropoulos Organization University of Hawaii, Student ITEPhone (808)-956-0949FaxEmail [email protected] data on the web at www.ite.org Comments to: [email protected]
IF not entered on web site, please mail to:
Institute of Transportation Engineers, 1627 Eye Street, NW Suite 600; Washington, DC 20006
Form version 1.4
Land Use
Sports- Park/Soccer fields and stadium
Average6917913117117115614713055471918
0
50
100
150
200
250
300
7:00
AM
8:00
AM
9:00
AM
10:00 AM
11:00 AM
12 Noo
n
1:00
PM
2:00
PM
3:00
PM
4:00
PM
5:00
PM
6:00
PM
Parking Dem
and
Hour Beginning
Sunday Saturday Thursday 3‐Day average