trip generation and parking study - ite western district final report... · the ite student chapter...
TRANSCRIPT

Trip Generation and Parking Study New Californian Apartments, Berkeley
Institute of Transportation Engineers University of California, Berkeley
Student Chapter
Spring 2012

Page 2 of 7
Background
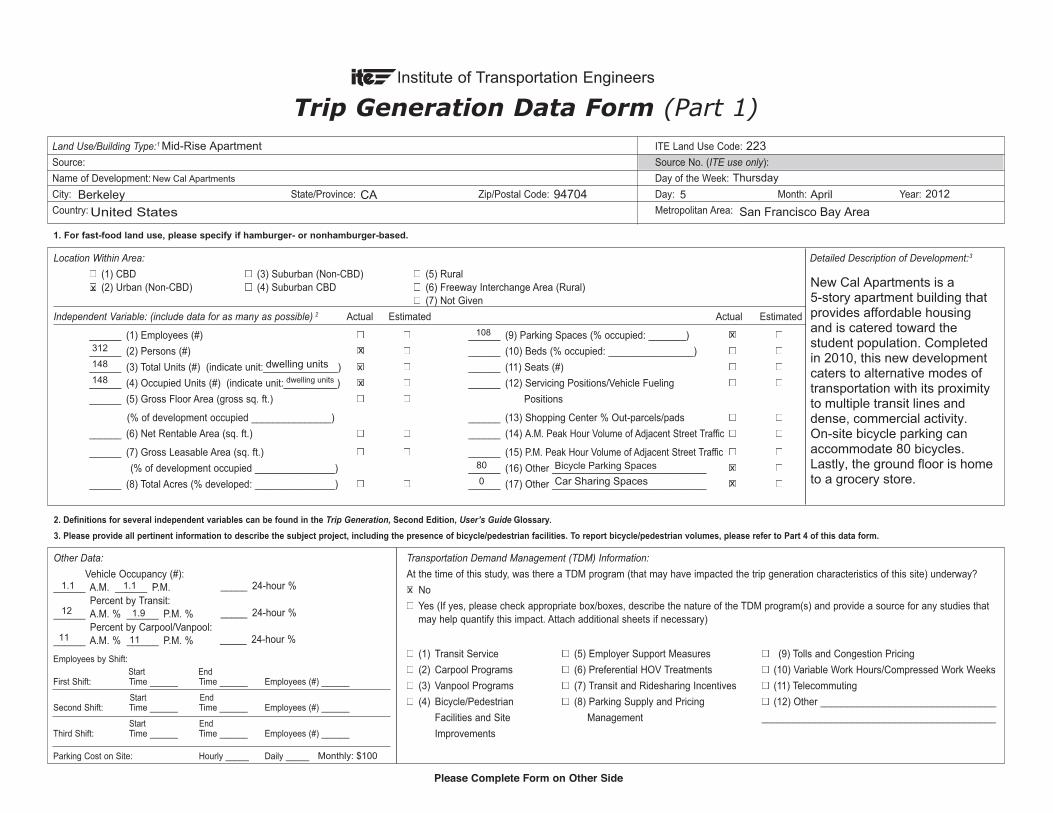
The ITE Student Chapter at UC Berkeley (Cal ITE) has completed a trip generation and parking study of the New Californian Apartments, a mid-rise apartment building located on 1988 Martin Luther King Jr. Way.
Figure 1: Exterior Photo of New Californian Apartments
General Parking Stories 5 Total Spaces for Rental 108
Housing Standard Spaces 104 Residents 312 Handicap Spaces 4
Dwelling Units 148 Motorcycle Spaces 0 Occupancy Rate 1.00 Car Share Spaces 0
Average Household Size 2.1 Bicycle Spaces 80
Figure 2: Table of New Californian Statistics

Page 3 of 7
Figure 3: Area Map (Source: Google Maps 2012)
Data Collected
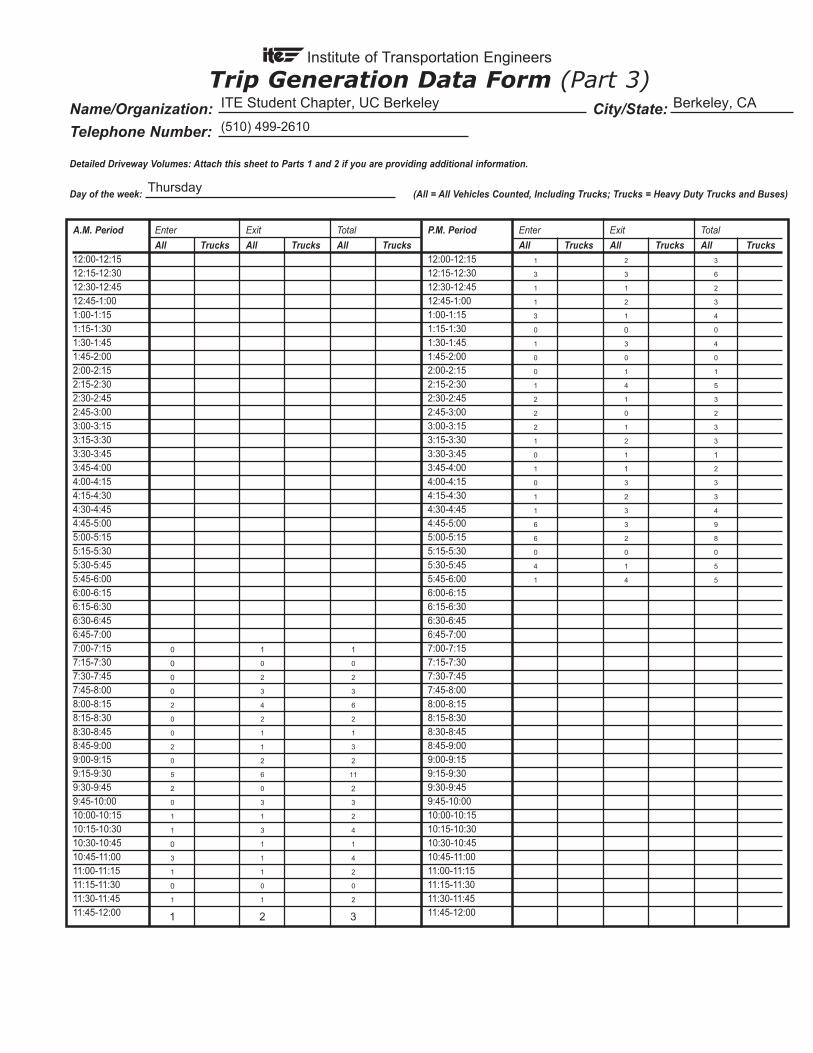
Data collection took place from 7:00am to 6:00pm on three weekdays in April 2012: Tuesday the 3rd, Thursday the 5th, and Wednesday the 11th. Through the participation of 11 volunteers, Cal ITE recorded all person trip and vehicle trip at New Californian. Volunteers were stationed at the main lobby entrance and the parking garage entrance and recorded the mode of travel taken by residents as they left or returned. Person-trips are characterized by mode choice. Vehicle-trips were identified by occupancy.
Results: Trip Generation
The total hourly trips over the observation period are shown in Figure 4. All three days of the observation yield the same hour for the AM peak period and indicate a predictable travel pattern in the mornings. However, Wednesday’s morning trips are higher. At UC Berkeley, classes are often scheduled on a Tuesday-Thursday block or a Monday-Wednesday-Friday block. This may have impacted the AM peak volumes. All three days show a rise in volume near the end of the day.

Page 4 of 7
Figure 4: Total Trips Observed per Hour
Weather Information
As summarized in Figure 5, the weather conditions varied over the three observation days. In particular, there was minor precipitation on April 11.
Figure 5: Daily Weather Conditions for Observation Days Source: http://www.weather.com/weather/monthly/USCA0087
0
10
20
30
40
50
60
70
80 Tr
ips
Time
All Person-Trips
Tu, April 3
Th, April 5
W, April 11
Average
Page 5 of 7
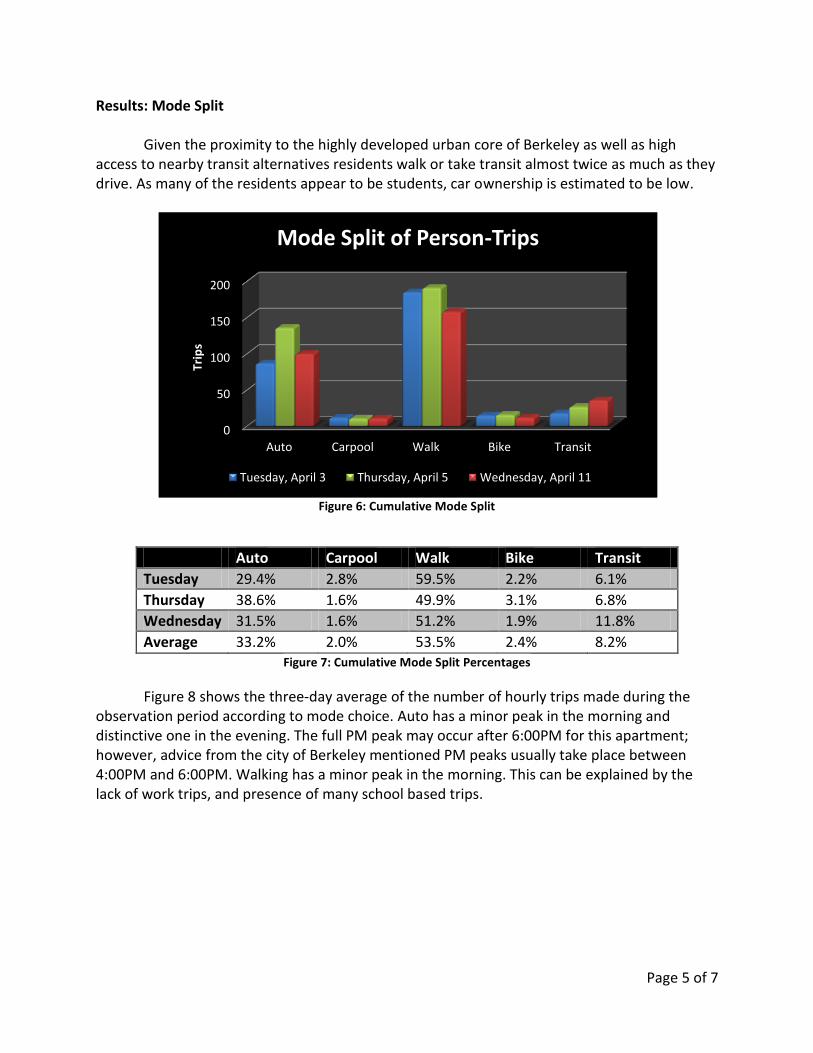
Results: Mode Split
Given the proximity to the highly developed urban core of Berkeley as well as high access to nearby transit alternatives residents walk or take transit almost twice as much as they drive. As many of the residents appear to be students, car ownership is estimated to be low.
Figure 6: Cumulative Mode Split
Auto Carpool Walk Bike Transit
Tuesday 29.4% 2.8% 59.5% 2.2% 6.1%
Thursday 38.6% 1.6% 49.9% 3.1% 6.8%
Wednesday 31.5% 1.6% 51.2% 1.9% 11.8%
Average 33.2% 2.0% 53.5% 2.4% 8.2% Figure 7: Cumulative Mode Split Percentages
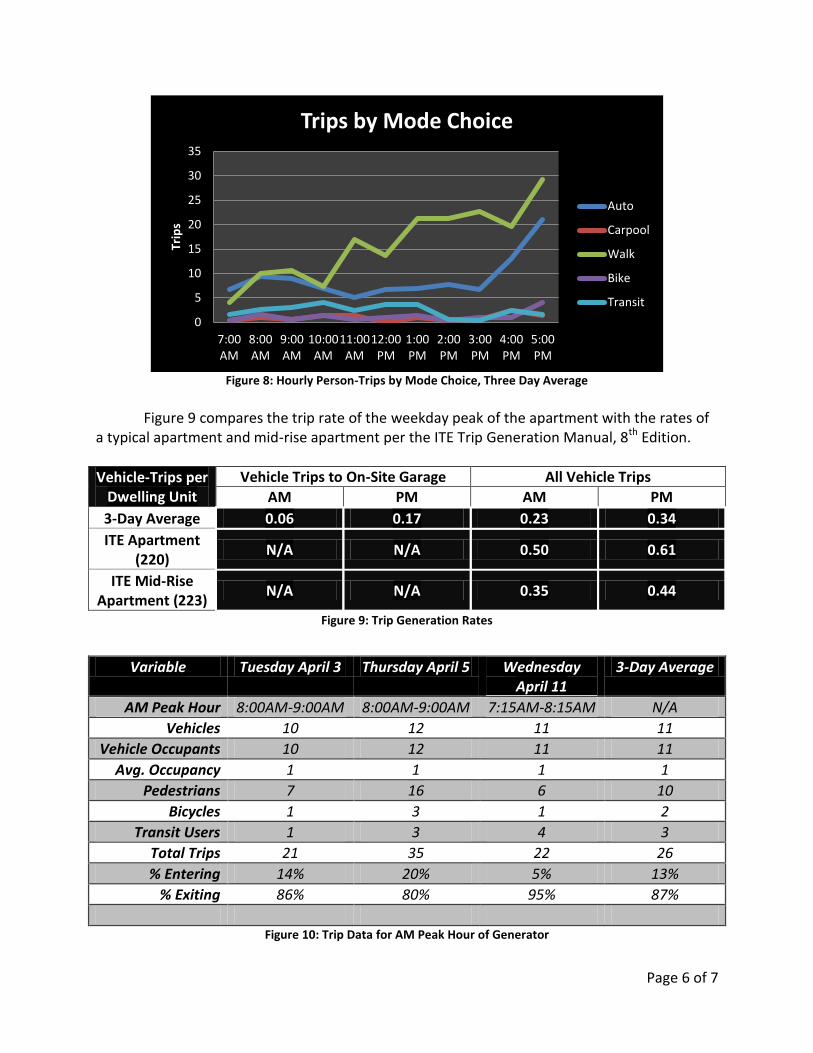
Figure 8 shows the three-day average of the number of hourly trips made during the observation period according to mode choice. Auto has a minor peak in the morning and distinctive one in the evening. The full PM peak may occur after 6:00PM for this apartment; however, advice from the city of Berkeley mentioned PM peaks usually take place between 4:00PM and 6:00PM. Walking has a minor peak in the morning. This can be explained by the lack of work trips, and presence of many school based trips.
0
50
100
150
200
Auto Carpool Walk Bike Transit
Trip
s
Mode Split of Person-Trips
Tuesday, April 3 Thursday, April 5 Wednesday, April 11
Page 6 of 7
Figure 8: Hourly Person-Trips by Mode Choice, Three Day Average
Figure 9 compares the trip rate of the weekday peak of the apartment with the rates of
a typical apartment and mid-rise apartment per the ITE Trip Generation Manual, 8th Edition.
Vehicle-Trips per Dwelling Unit
Vehicle Trips to On-Site Garage All Vehicle Trips
AM PM AM PM
3-Day Average 0.06 0.17 0.23 0.34
ITE Apartment (220)
N/A N/A 0.50 0.61
ITE Mid-Rise Apartment (223)
N/A N/A 0.35 0.44
Figure 9: Trip Generation Rates
Variable Tuesday April 3 Thursday April 5 Wednesday April 11
3-Day Average
AM Peak Hour 8:00AM-9:00AM 8:00AM-9:00AM 7:15AM-8:15AM N/A
Vehicles 10 12 11 11
Vehicle Occupants 10 12 11 11
Avg. Occupancy 1 1 1 1
Pedestrians 7 16 6 10
Bicycles 1 3 1 2
Transit Users 1 3 4 3
Total Trips 21 35 22 26
% Entering 14% 20% 5% 13%
% Exiting 86% 80% 95% 87%
Figure 10: Trip Data for AM Peak Hour of Generator
0
5
10
15
20
25
30
35
7:00 AM
8:00 AM
9:00 AM
10:00 AM
11:00 AM
12:00 PM
1:00 PM
2:00 PM
3:00 PM
4:00 PM
5:00 PM
Trip
s
Trips by Mode Choice
Auto
Carpool
Walk
Bike
Transit

Page 7 of 7
Variable Tuesday April 3 Thursday April 5 Wednesday April 11
3-Day Average
PM Peak Hour 5:00PM-6:00PM 5:00PM-6:00PM 5:00PM-6:00PM N/A
Vehicles 16 18 30 22
Vehicle Occupants 17 19 31 23
Avg. Occupancy 1.07 1.06 1.03 1.05
Pedestrians 25 33 31 30
Bicycles 5 6 1 4
Transit Users 4 1 1 2
Total Trips 51 58 63 58
% Entering 59% 62% 60% 60%
% Exiting 41% 38% 40% 40% Figure 11: Trip Data for PM Peak Hour of Generator
Results: Parking
While many residents cannot afford the $100 garage parking rates, management reports 70 registered vehicles. Residents also have a $30 on-street parking permit option.
Parking Rates Tuesday April 3 Thursday April 5 Wednesday April 11
On-Site 0.47 0.46 0.47
Off-Site N/A N/A N/A Figure 12: Parking Demand Per Day Per Dwelling Unit
Possible Sources of Error Unfortunately, we were unable to obtain permission from the apartment manager to survey the residents as the left or returned. As a result, the volunteers resorted to identifying the mode of travel taken visually. This may have produced some inaccuracies. Also volunteers would be unable to identify residents until they actually entered the building. This constraint may overestimate walking.

� ��������� �� �������1 ITE Land Use Code:
Source: Source No. (ITE use only):
Name of Development: Day of the Week:
City: State/Province: Zip/Postal Code: Day: Month: Year:
Country: Metropolitan Area:
Institute of Transportation Engineers
Trip Generation Data Form (Part 1)
1. For fast-food land use, please specify if hamburger- or nonhamburger-based.
2. Definitions for several independent variables can be found in the Trip Generation, Second Edition, User’s Guide ��������.
3. Please provide all pertinent information to describe the subject project, including the presence of bicycle/pedestrian facilities. To report bicycle/pedestrian volumes, please refer to Part 4 of this data form.
����������
Vehicle Occupancy (#): ______ A.M. ______ P.M. Percent by Transit: ______ A.M. % ______ P.M. % Percent by Carpool/Vanpool: ______ A.M. % ______ P.M. %
����������� �������������������������������� ���
At the time of this study, was there a TDM program (that may have impacted the trip generation characteristics of this site) underway?
� No
� Yes (If yes, please check appropriate box/boxes, describe the nature of the TDM program(s) and provide a source for any studies that may help quantify this impact. Attach additional sheets if necessary)
� (1) Transit Service � (5) Employer Support Measures � (9) Tolls and Congestion Pricing
� (2) Carpool Programs � (6) Preferential HOV Treatments � (10) Variable Work Hours/Compressed Work Weeks
� (3) Vanpool Programs � (7) Transit and Ridesharing Incentives � (11) Telecommuting
� (4) Bicycle/Pedestrian � (8) Parking Supply and Pricing � (12) Other _________________________________
Facilities and Site Management ____________________________________________
Improvements
Please Complete Form on Other Side
��!�� ���" �� ��#���� ����������������������������������������������������������������������������������������������� �����!� �� �������$�������3
� (1) CBD � (3) Suburban (Non-CBD) � (5) Rural � (2) Urban (Non-CBD) � (4) Suburban CBD � (6) Freeway Interchange Area (Rural) � (7) Not Given
Independent Variable: (include data for as many as possible) 2 Actual Estimated Actual Estimated
______ (1) Employees (#) � � ______ (9) Parking Spaces (% occupied: _______) � �
______ (2) Persons (#) � � ______ (10) Beds (% occupied: ________________) � �
______ (3) Total Units (#) (indicate unit:______________) � � ______ (11) Seats (#) � �
______ (4) Occupied Units (#) (indicate unit:__________) � � ______ (12) Servicing Positions/Vehicle Fueling � �
______ (5) Gross Floor Area (gross sq. ft.) � � Positions
(% of development occupied _______________) ______ (13) Shopping Center % Out-parcels/pads � �
______ (6) Net Rentable Area (sq. ft.) � � ______ (14) A.M. Peak Hour Volume of Adjacent Street Traffic � �
______ (7) Gross Leasable Area (sq. ft.) � � ______ (15) P.M. Peak Hour Volume of Adjacent Street Traffic � �
(% of development occupied _______________) � ______ (16) Other _____________________________ � �
______ (8) Total Acres (% developed: _______________) � �� ______ (17) Other _____________________________ � �
_____ 24-hour %
_____ 24-hour %
_____ 24-hour %
Employees by Shift:
First Shift: Time ______ Time ______ Employees (#) ______
Second Shift: Time ______ Time ______ Employees (#) ______
Third Shift: Time ______ Time ______ Employees (#) ______
Parking Cost on Site: Hourly _____ Daily _____
Start End
Start End
Start End
Mid-Rise Apartment 223
TuesdayNew Cal Apartments
Berkeley CA 94704 3 April 2012
United States San Francisco Bay Area
x
x
dwelling units
108
312
148 x148 dwelling units x
80
0
Bicycle Parking Spaces
Car Sharing Spaces
2.7
x
x
x
New Cal Apartments is a5-story apartment building thatprovides affordable housingand is catered toward thestudent population. Completedin 2010, this new developmentcaters to alternative modes oftransportation with its proximityto multiple transit lines anddense, commercial activity.On-site bicycle parking canaccommodate 80 bicycles.Lastly, the ground floor is hometo a grocery store.
1.07 1.1
11 5
1.5
x
Monthly: $100

Average Weekday (M-F) Saturday Sunday
Enter Exit Total Enter Exit Total Enter Exit Total
All Trucks All Trucks All Trucks All Trucks All Trucks All Trucks All Trucks All Trucks All Trucks
24-Hour VolumeA.M. Peak Hour of Adjacent1 Street Traffic (7 – 9)Time (ex.: 7:15 - 8:15):P.M. Peak Hour of Adjacent1 Street Traffic (4 – 6) Time:A.M. Peak Hour Generator 2
Time:P.M. Peak Hour Generator2 Time:Peak Hour Generator3
Time (Weekend):
Institute of Transportation Engineers
Trip Generation Data Form (Part 2)Summary of Driveway Volumes (All = All Vehicles Counted, Including Trucks; Trucks = Heavy Duty Trucks and Buses)
Survey conducted by: Name: _______________________________________________________________________________________________________
Organization: __________________________________________________________________________________________________
Address: _____________________________________________________________________________________________________
City/State/Zip: _________________________________________________________________________________________________
Telephone #:_____________________________ Fax #:_____________________________ E-mail:______________________________
Please return to: Institute of Transportation Engineers Technical Projects Division 1099 14th Street, NW, Suite 300 West
Washington, DC 20005-3438 USA
Telephone: +1 202-289-0222
Fax: +1 202-289-7722
ITE on the Web: www.ite.org
A.M. Period Enter Exit Total Mid-Day Period Enter Exit Total P.M. Period Enter Exit Total
All Trucks All Trucks All Trucks All Trucks All Trucks All Trucks All Trucks All Trucks All Trucks6:00-7:00 11:00-12:00 3:00-4:006:15-7:15 11:15-12:15 3:15-4:15 6:30-7:30 11:30-12:30 3:30-4:306:45-7:45 11:45-12:45 3:45-4:457:00-8:00 12:00-1:00 4:00-5:007:15-8:15 12:15-1:15 4:15-5:157:30-8:30 12:30-1:30 4:30-5:307:45-8:45 12:45-1:45 4:45-5:458:00-9:00 1:00-2:00 5:00-6:00
1. Highest hourly volume between 7 a.m. and 9 a.m. (4 p.m. and 6 p.m.). Please specify the peak hour.2. Highest hourly volume during the a.m. or p.m. period. Please specify the peak hour.3. Highest hourly volume during the entire day. Please specify the peak hour.Please refer to the Trip Generation User’s Guide for full definition of terms.
Hourly Driveway Volumes- Average Weekday (M-F)
�Check if Part 3, 4 and/or additional information is attached.
2 8 1 08:00-9:00
8 8 1 64:45-5:45
2 8 10
4:45-5:45
8:00-9:00
8 8 16
0 3 3 1 3 4
0 4 4 2 2 4
0 4 4 5 2 7
0 4 4 6 3 9
0 4 4 0 3 3 6 5 11
0 5 5 2 3 5 6 7 13
1 4 5 2 2 4 5 8 13
1 6 7 2 4 6 8 8 16
2 8 10 3 3 6 8 7 15
xNathan Chan and Thomas Wong, Project Coordinators
ITE Student Chapter, UC Berkeley
(510) 499-2610 [email protected]

A.M. Period Enter Exit Total P.M. Period Enter Exit Total
All Trucks All Trucks All Trucks All Trucks All Trucks All Trucks12:00-12:15 12:00-12:1512:15-12:30 12:15-12:3012:30-12:45 12:30-12:4512:45-1:00 12:45-1:001:00-1:15 1:00-1:151:15-1:30 1:15-1:301:30-1:45 1:30-1:451:45-2:00 1:45-2:002:00-2:15 2:00-2:152:15-2:30 2:15-2:302:30-2:45 2:30-2:452:45-3:00 2:45-3:00 3:00-3:15 3:00-3:153:15-3:30 3:15-3:303:30-3:45 3:30-3:45 3:45-4:00 3:45-4:004:00-4:15 4:00-4:154:15-4:30 4:15-4:304:30-4:45 4:30-4:454:45-5:00 4:45-5:005:00-5:15 5:00-5:155:15-5:30 5:15-5:305:30-5:45 5:30-5:455:45-6:00 5:45-6:006:00-6:15 6:00-6:156:15-6:30 6:15-6:306:30-6:45 6:30-6:456:45-7:00 6:45-7:007:00-7:15 7:00-7:157:15-7:30 7:15-7:307:30-7:45 7:30-7:457:45-8:00 7:45-8:008:00-8:15 8:00-8:158:15-8:30 8:15-8:308:30-8:45 8:30-8:458:45-9:00 8:45-9:009:00-9:15 9:00-9:159:15-9:30 9:15-9:309:30-9:45 9:30-9:459:45-10:00 9:45-10:0010:00-10:15 10:00-10:1510:15-10:30 10:15-10:3010:30-10:45 10:30-10:4510:45-11:00 10:45-11:0011:00-11:15 11:00-11:1511:15-11:30 11:15-11:3011:30-11:45 11:30-11:4511:45-12:00 11:45-12:00
Institute of Transportation Engineers
Trip Generation Data Form (Part 3)Name/Organization: City/State:
Telephone Number:
Detailed Driveway Volumes: Attach this sheet to Parts 1 and 2 if you are providing additional information.
Day of the week: (All = All Vehicles Counted, Including Trucks; Trucks = Heavy Duty Trucks and Buses)
ITE Student Chapter, UC Berkeley Berkeley, CA
(510) 499-2610
Tuesday
1 0 1
1 0 1
0 0 0
1 0 1
1 2 3
0 0 0
2 0 2
0 1 1
1 1 2
0 1 1
1 1 2
0 1 1
1 0 1
1 0 1
1 0 1
0 1 1
0 0 0
1 0 1
2 2 4
2 0 2
2 1 3
3 2 5
2 4 6
1 1 2
0 1 1
0 1 1
0 0 0
0 2 2
0 2 2
1 0 1
0 2 2
1 4 5
1 0 1
0 1 1
1 1 2
0 2 2
0 1 1
0 1 1
0 1 1
0 3 3
0 0 0
0 1 1
0 0 0
0 2 2

Average Weekday (M-F) Saturday Sunday
Enter Exit Total Enter Exit Total Enter Exit Total
24-Hour VolumeA.M. Peak Hour of Adjacent1 Street Traffic (7 – 9)Time (ex.: 7:15 - 8:15):P.M. Peak Hour of Adjacent1 Street Traffic (4 – 6) Time:A.M. Peak Hour Generator 2
Time:P.M. Peak Hour Generator2 Time:Peak Hour Generator3
Time (Weekend):
Institute of Transportation Engineers
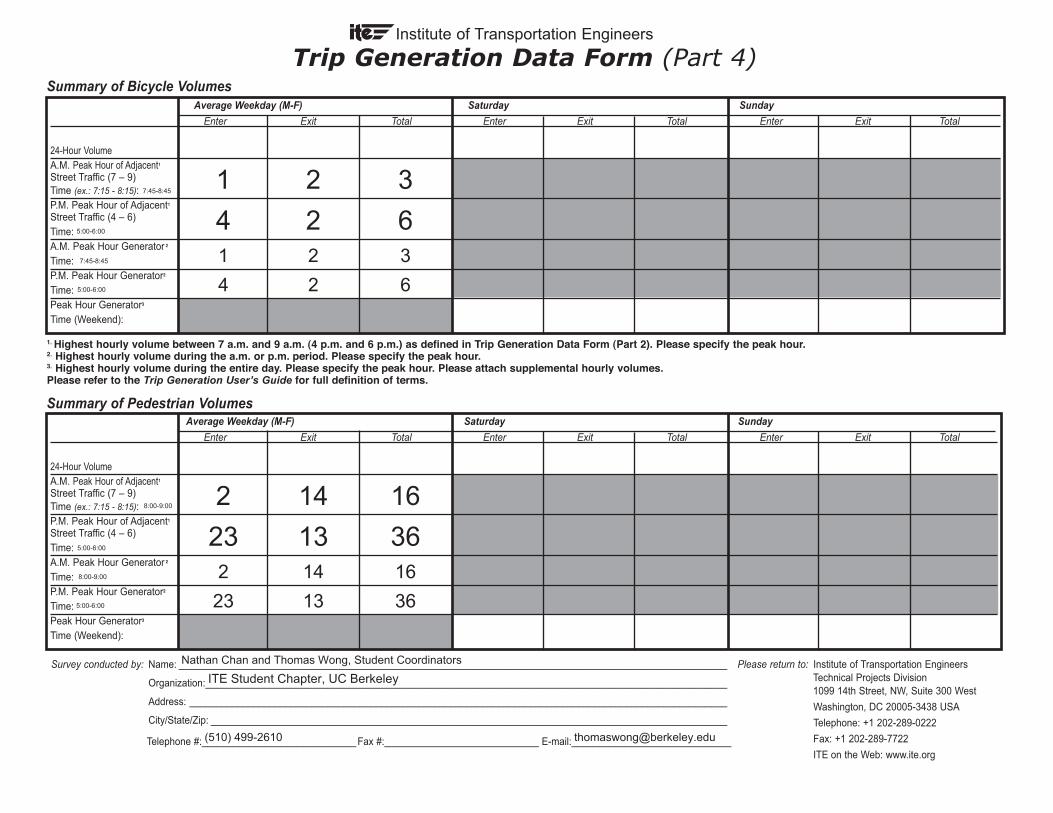
Trip Generation Data Form (Part 4)
Survey conducted by: Name: _______________________________________________________________________________________________________
Organization: __________________________________________________________________________________________________
Address: _____________________________________________________________________________________________________
City/State/Zip: _________________________________________________________________________________________________
Telephone #:_____________________________ Fax #:_____________________________ E-mail:______________________________
Please return to: Institute of Transportation Engineers Technical Projects Division 1099 14th Street, NW, Suite 300 West
Washington, DC 20005-3438 USA
Telephone: +1 202-289-0222
Fax: +1 202-289-7722
ITE on the Web: www.ite.org
1. Highest hourly volume between 7 a.m. and 9 a.m. (4 p.m. and 6 p.m.) as defined in Trip Generation Data Form (Part 2). Please specify the peak hour.2. Highest hourly volume during the a.m. or p.m. period. Please specify the peak hour.3. Highest hourly volume during the entire day. Please specify the peak hour. Please attach supplemental hourly volumes.Please refer to the Trip Generation User’s Guide for full definition of terms.
Summary of Pedestrian Volumes
Summary of Bicycle Volumes
Average Weekday (M-F) Saturday Sunday
Enter Exit Total Enter Exit Total Enter Exit Total
24-Hour VolumeA.M. Peak Hour of Adjacent1 Street Traffic (7 – 9)Time (ex.: 7:15 - 8:15):P.M. Peak Hour of Adjacent1 Street Traffic (4 – 6) Time:A.M. Peak Hour Generator 2
Time:P.M. Peak Hour Generator2 Time:Peak Hour Generator3
Time (Weekend):
0 1 18:00-9:00
5:00-6:00
8:00-9:00
5:00-6:00
7:30-8:30
5:00-6:00
4 5 90 1 1
4 5 9
0 10 10
8 17 257:45-8:45 0 10 10
5:00-6:00 8 17 25
Nathan Chan and Thomas Wong, Student Coordinators
ITE Student Chapter, UC Berkeley
(510) 499-2610 [email protected]
� ��������� �� �������1 ITE Land Use Code:
Source: Source No. (ITE use only):
Name of Development: Day of the Week:
City: State/Province: Zip/Postal Code: Day: Month: Year:
Country: Metropolitan Area:
Institute of Transportation Engineers
Trip Generation Data Form (Part 1)
1. For fast-food land use, please specify if hamburger- or nonhamburger-based.
2. Definitions for several independent variables can be found in the Trip Generation, Second Edition, User’s Guide ��������.
3. Please provide all pertinent information to describe the subject project, including the presence of bicycle/pedestrian facilities. To report bicycle/pedestrian volumes, please refer to Part 4 of this data form.
����������
Vehicle Occupancy (#): ______ A.M. ______ P.M. Percent by Transit: ______ A.M. % ______ P.M. % Percent by Carpool/Vanpool: ______ A.M. % ______ P.M. %
����������� �������������������������������� ���
At the time of this study, was there a TDM program (that may have impacted the trip generation characteristics of this site) underway?
� No
� Yes (If yes, please check appropriate box/boxes, describe the nature of the TDM program(s) and provide a source for any studies that may help quantify this impact. Attach additional sheets if necessary)
� (1) Transit Service � (5) Employer Support Measures � (9) Tolls and Congestion Pricing
� (2) Carpool Programs � (6) Preferential HOV Treatments � (10) Variable Work Hours/Compressed Work Weeks
� (3) Vanpool Programs � (7) Transit and Ridesharing Incentives � (11) Telecommuting
� (4) Bicycle/Pedestrian � (8) Parking Supply and Pricing � (12) Other _________________________________
Facilities and Site Management ____________________________________________
Improvements
Please Complete Form on Other Side
��!�� ���" �� ��#���� ����������������������������������������������������������������������������������������������� �����!� �� �������$�������3
� (1) CBD � (3) Suburban (Non-CBD) � (5) Rural � (2) Urban (Non-CBD) � (4) Suburban CBD � (6) Freeway Interchange Area (Rural) � (7) Not Given
Independent Variable: (include data for as many as possible) 2 Actual Estimated Actual Estimated
______ (1) Employees (#) � � ______ (9) Parking Spaces (% occupied: _______) � �
______ (2) Persons (#) � � ______ (10) Beds (% occupied: ________________) � �
______ (3) Total Units (#) (indicate unit:______________) � � ______ (11) Seats (#) � �
______ (4) Occupied Units (#) (indicate unit:__________) � � ______ (12) Servicing Positions/Vehicle Fueling � �
______ (5) Gross Floor Area (gross sq. ft.) � � Positions
(% of development occupied _______________) ______ (13) Shopping Center % Out-parcels/pads � �
______ (6) Net Rentable Area (sq. ft.) � � ______ (14) A.M. Peak Hour Volume of Adjacent Street Traffic � �
______ (7) Gross Leasable Area (sq. ft.) � � ______ (15) P.M. Peak Hour Volume of Adjacent Street Traffic � �
(% of development occupied _______________) � ______ (16) Other _____________________________ � �
______ (8) Total Acres (% developed: _______________) � �� ______ (17) Other _____________________________ � �
_____ 24-hour %
_____ 24-hour %
_____ 24-hour %
Employees by Shift:
First Shift: Time ______ Time ______ Employees (#) ______
Second Shift: Time ______ Time ______ Employees (#) ______
Third Shift: Time ______ Time ______ Employees (#) ______
Parking Cost on Site: Hourly _____ Daily _____
Start End
Start End
Start End
Mid-Rise Apartment 223
ThursdayNew Cal Apartments
Berkeley CA 94704 5 April 2012
United States San Francisco Bay Area
x
x
dwelling units
108
312
148 x148 dwelling units x
80
0
Bicycle Parking Spaces
Car Sharing Spaces
11
x
x
x
New Cal Apartments is a5-story apartment building thatprovides affordable housingand is catered toward thestudent population. Completedin 2010, this new developmentcaters to alternative modes oftransportation with its proximityto multiple transit lines anddense, commercial activity.On-site bicycle parking canaccommodate 80 bicycles.Lastly, the ground floor is hometo a grocery store.
1.1 1.1
12 1.9
11
x
Monthly: $100

Average Weekday (M-F) Saturday Sunday
Enter Exit Total Enter Exit Total Enter Exit Total
All Trucks All Trucks All Trucks All Trucks All Trucks All Trucks All Trucks All Trucks All Trucks
24-Hour VolumeA.M. Peak Hour of Adjacent1 Street Traffic (7 – 9)Time (ex.: 7:15 - 8:15):P.M. Peak Hour of Adjacent1 Street Traffic (4 – 6) Time:A.M. Peak Hour Generator 2
Time:P.M. Peak Hour Generator2 Time:Peak Hour Generator3
Time (Weekend):
Institute of Transportation Engineers
Trip Generation Data Form (Part 2)Summary of Driveway Volumes (All = All Vehicles Counted, Including Trucks; Trucks = Heavy Duty Trucks and Buses)
Survey conducted by: Name: _______________________________________________________________________________________________________
Organization: __________________________________________________________________________________________________
Address: _____________________________________________________________________________________________________
City/State/Zip: _________________________________________________________________________________________________
Telephone #:_____________________________ Fax #:_____________________________ E-mail:______________________________
Please return to: Institute of Transportation Engineers Technical Projects Division 1099 14th Street, NW, Suite 300 West
Washington, DC 20005-3438 USA
Telephone: +1 202-289-0222
Fax: +1 202-289-7722
ITE on the Web: www.ite.org
A.M. Period Enter Exit Total Mid-Day Period Enter Exit Total P.M. Period Enter Exit Total
All Trucks All Trucks All Trucks All Trucks All Trucks All Trucks All Trucks All Trucks All Trucks6:00-7:00 11:00-12:00 3:00-4:006:15-7:15 11:15-12:15 3:15-4:15 6:30-7:30 11:30-12:30 3:30-4:306:45-7:45 11:45-12:45 3:45-4:457:00-8:00 12:00-1:00 4:00-5:007:15-8:15 12:15-1:15 4:15-5:157:30-8:30 12:30-1:30 4:30-5:307:45-8:45 12:45-1:45 4:45-5:458:00-9:00 1:00-2:00 5:00-6:00
1. Highest hourly volume between 7 a.m. and 9 a.m. (4 p.m. and 6 p.m.). Please specify the peak hour.2. Highest hourly volume during the a.m. or p.m. period. Please specify the peak hour.3. Highest hourly volume during the entire day. Please specify the peak hour.Please refer to the Trip Generation User’s Guide for full definition of terms.
Hourly Driveway Volumes- Average Weekday (M-F)
�Check if Part 3, 4 and/or additional information is attached.
2 1 1 1 37:30-8:30
1 4 9 2 34:15-5:15
2 11 13
4:15-5:15
7:30-8:30
14 9 23
3 4 7 4 5 9
3 5 8 2 7 9
6 8 14 2 7 9
6 8 14 3 9 12
0 6 6 6 8 14 8 10 18
2 9 11 8 7 15 14 9 23
2 11 13 5 4 9 13 7 20
2 10 12 5 6 11 16 5 21
4 8 12 4 4 8 11 7 18
xNathan Chan and Thomas Wong, Project Coordinators
ITE Student Chapter, UC Berkeley
(510) 499-2610 [email protected]
A.M. Period Enter Exit Total P.M. Period Enter Exit Total
All Trucks All Trucks All Trucks All Trucks All Trucks All Trucks12:00-12:15 12:00-12:1512:15-12:30 12:15-12:3012:30-12:45 12:30-12:4512:45-1:00 12:45-1:001:00-1:15 1:00-1:151:15-1:30 1:15-1:301:30-1:45 1:30-1:451:45-2:00 1:45-2:002:00-2:15 2:00-2:152:15-2:30 2:15-2:302:30-2:45 2:30-2:452:45-3:00 2:45-3:00 3:00-3:15 3:00-3:153:15-3:30 3:15-3:303:30-3:45 3:30-3:45 3:45-4:00 3:45-4:004:00-4:15 4:00-4:154:15-4:30 4:15-4:304:30-4:45 4:30-4:454:45-5:00 4:45-5:005:00-5:15 5:00-5:155:15-5:30 5:15-5:305:30-5:45 5:30-5:455:45-6:00 5:45-6:006:00-6:15 6:00-6:156:15-6:30 6:15-6:306:30-6:45 6:30-6:456:45-7:00 6:45-7:007:00-7:15 7:00-7:157:15-7:30 7:15-7:307:30-7:45 7:30-7:457:45-8:00 7:45-8:008:00-8:15 8:00-8:158:15-8:30 8:15-8:308:30-8:45 8:30-8:458:45-9:00 8:45-9:009:00-9:15 9:00-9:159:15-9:30 9:15-9:309:30-9:45 9:30-9:459:45-10:00 9:45-10:0010:00-10:15 10:00-10:1510:15-10:30 10:15-10:3010:30-10:45 10:30-10:4510:45-11:00 10:45-11:0011:00-11:15 11:00-11:1511:15-11:30 11:15-11:3011:30-11:45 11:30-11:4511:45-12:00 11:45-12:00
Institute of Transportation Engineers
Trip Generation Data Form (Part 3)Name/Organization: City/State:
Telephone Number:
Detailed Driveway Volumes: Attach this sheet to Parts 1 and 2 if you are providing additional information.
Day of the week: (All = All Vehicles Counted, Including Trucks; Trucks = Heavy Duty Trucks and Buses)
ITE Student Chapter, UC Berkeley Berkeley, CA
(510) 499-2610
Thursday
1 2 3
3 3 6
1 1 2
1 2 3
3 1 4
0 0 0
1 3 4
0 0 0
0 1 1
1 4 5
2 1 3
2 0 2
2 1 3
1 2 3
0 1 1
1 1 2
0 3 3
1 2 3
1 3 4
6 3 9
6 2 8
0 0 0
4 1 5
1 4 5
0 1 1
0 0 0
0 2 2
0 3 3
2 4 6
0 2 2
0 1 1
2 1 3
0 2 2
5 6 11
2 0 2
0 3 3
1 1 2
1 3 4
0 1 1
3 1 4
1 1 2
0 0 0
1 1 2
1 2 3
Average Weekday (M-F) Saturday Sunday
Enter Exit Total Enter Exit Total Enter Exit Total
24-Hour VolumeA.M. Peak Hour of Adjacent1 Street Traffic (7 – 9)Time (ex.: 7:15 - 8:15):P.M. Peak Hour of Adjacent1 Street Traffic (4 – 6) Time:A.M. Peak Hour Generator 2
Time:P.M. Peak Hour Generator2 Time:Peak Hour Generator3
Time (Weekend):
Institute of Transportation Engineers
Trip Generation Data Form (Part 4)
Survey conducted by: Name: _______________________________________________________________________________________________________
Organization: __________________________________________________________________________________________________
Address: _____________________________________________________________________________________________________
City/State/Zip: _________________________________________________________________________________________________
Telephone #:_____________________________ Fax #:_____________________________ E-mail:______________________________
Please return to: Institute of Transportation Engineers Technical Projects Division 1099 14th Street, NW, Suite 300 West
Washington, DC 20005-3438 USA
Telephone: +1 202-289-0222
Fax: +1 202-289-7722
ITE on the Web: www.ite.org
1. Highest hourly volume between 7 a.m. and 9 a.m. (4 p.m. and 6 p.m.) as defined in Trip Generation Data Form (Part 2). Please specify the peak hour.2. Highest hourly volume during the a.m. or p.m. period. Please specify the peak hour.3. Highest hourly volume during the entire day. Please specify the peak hour. Please attach supplemental hourly volumes.Please refer to the Trip Generation User’s Guide for full definition of terms.
Summary of Pedestrian Volumes
Summary of Bicycle Volumes
Average Weekday (M-F) Saturday Sunday
Enter Exit Total Enter Exit Total Enter Exit Total
24-Hour VolumeA.M. Peak Hour of Adjacent1 Street Traffic (7 – 9)Time (ex.: 7:15 - 8:15):P.M. Peak Hour of Adjacent1 Street Traffic (4 – 6) Time:A.M. Peak Hour Generator 2
Time:P.M. Peak Hour Generator2 Time:Peak Hour Generator3
Time (Weekend):
1 2 37:45-8:45
5:00-6:00
7:45-8:45
5:00-6:00
8:00-9:00
5:00-6:00
4 2 61 2 3
4 2 6
2 14 16
23 13 368:00-9:00 2 14 16
5:00-6:00 23 13 36
Nathan Chan and Thomas Wong, Student Coordinators
ITE Student Chapter, UC Berkeley
(510) 499-2610 [email protected]

� ��������� �� �������1 ITE Land Use Code:
Source: Source No. (ITE use only):
Name of Development: Day of the Week:
City: State/Province: Zip/Postal Code: Day: Month: Year:
Country: Metropolitan Area:
Institute of Transportation Engineers
Trip Generation Data Form (Part 1)
1. For fast-food land use, please specify if hamburger- or nonhamburger-based.
2. Definitions for several independent variables can be found in the Trip Generation, Second Edition, User’s Guide ��������.
3. Please provide all pertinent information to describe the subject project, including the presence of bicycle/pedestrian facilities. To report bicycle/pedestrian volumes, please refer to Part 4 of this data form.
����������
Vehicle Occupancy (#): ______ A.M. ______ P.M. Percent by Transit: ______ A.M. % ______ P.M. % Percent by Carpool/Vanpool: ______ A.M. % ______ P.M. %
����������� �������������������������������� ���
At the time of this study, was there a TDM program (that may have impacted the trip generation characteristics of this site) underway?
� No
� Yes (If yes, please check appropriate box/boxes, describe the nature of the TDM program(s) and provide a source for any studies that may help quantify this impact. Attach additional sheets if necessary)
� (1) Transit Service � (5) Employer Support Measures � (9) Tolls and Congestion Pricing
� (2) Carpool Programs � (6) Preferential HOV Treatments � (10) Variable Work Hours/Compressed Work Weeks
� (3) Vanpool Programs � (7) Transit and Ridesharing Incentives � (11) Telecommuting
� (4) Bicycle/Pedestrian � (8) Parking Supply and Pricing � (12) Other _________________________________
Facilities and Site Management ____________________________________________
Improvements
Please Complete Form on Other Side
��!�� ���" �� ��#���� ����������������������������������������������������������������������������������������������� �����!� �� �������$�������3
� (1) CBD � (3) Suburban (Non-CBD) � (5) Rural � (2) Urban (Non-CBD) � (4) Suburban CBD � (6) Freeway Interchange Area (Rural) � (7) Not Given
Independent Variable: (include data for as many as possible) 2 Actual Estimated Actual Estimated
______ (1) Employees (#) � � ______ (9) Parking Spaces (% occupied: _______) � �
______ (2) Persons (#) � � ______ (10) Beds (% occupied: ________________) � �
______ (3) Total Units (#) (indicate unit:______________) � � ______ (11) Seats (#) � �
______ (4) Occupied Units (#) (indicate unit:__________) � � ______ (12) Servicing Positions/Vehicle Fueling � �
______ (5) Gross Floor Area (gross sq. ft.) � � Positions
(% of development occupied _______________) ______ (13) Shopping Center % Out-parcels/pads � �
______ (6) Net Rentable Area (sq. ft.) � � ______ (14) A.M. Peak Hour Volume of Adjacent Street Traffic � �
______ (7) Gross Leasable Area (sq. ft.) � � ______ (15) P.M. Peak Hour Volume of Adjacent Street Traffic � �
(% of development occupied _______________) � ______ (16) Other _____________________________ � �
______ (8) Total Acres (% developed: _______________) � �� ______ (17) Other _____________________________ � �
_____ 24-hour %
_____ 24-hour %
_____ 24-hour %
Employees by Shift:
First Shift: Time ______ Time ______ Employees (#) ______
Second Shift: Time ______ Time ______ Employees (#) ______
Third Shift: Time ______ Time ______ Employees (#) ______
Parking Cost on Site: Hourly _____ Daily _____
Start End
Start End
Start End
Mid-Rise Apartment 223
WednesdayNew Cal Apartments
Berkeley CA 94704 11 April 2012
United States San Francisco Bay Area
x
x
dwelling units
108
312
148 x148 dwelling units x
80
0
Bicycle Parking Spaces
Car Sharing Spaces
6.3
x
x
x
New Cal Apartments is a5-story apartment building thatprovides affordable housingand is catered toward thestudent population. Completedin 2010, this new developmentcaters to alternative modes oftransportation with its proximityto multiple transit lines anddense, commercial activity.On-site bicycle parking canaccommodate 80 bicycles.Lastly, the ground floor is hometo a grocery store.
1.1 1.07
40 6.2
7
x
Monthly: $100

Average Weekday (M-F) Saturday Sunday
Enter Exit Total Enter Exit Total Enter Exit Total
All Trucks All Trucks All Trucks All Trucks All Trucks All Trucks All Trucks All Trucks All Trucks
24-Hour VolumeA.M. Peak Hour of Adjacent1 Street Traffic (7 – 9)Time (ex.: 7:15 - 8:15):P.M. Peak Hour of Adjacent1 Street Traffic (4 – 6) Time:A.M. Peak Hour Generator 2
Time:P.M. Peak Hour Generator2 Time:Peak Hour Generator3
Time (Weekend):
Institute of Transportation Engineers
Trip Generation Data Form (Part 2)Summary of Driveway Volumes (All = All Vehicles Counted, Including Trucks; Trucks = Heavy Duty Trucks and Buses)
Survey conducted by: Name: _______________________________________________________________________________________________________
Organization: __________________________________________________________________________________________________
Address: _____________________________________________________________________________________________________
City/State/Zip: _________________________________________________________________________________________________
Telephone #:_____________________________ Fax #:_____________________________ E-mail:______________________________
Please return to: Institute of Transportation Engineers Technical Projects Division 1099 14th Street, NW, Suite 300 West
Washington, DC 20005-3438 USA
Telephone: +1 202-289-0222
Fax: +1 202-289-7722
ITE on the Web: www.ite.org
A.M. Period Enter Exit Total Mid-Day Period Enter Exit Total P.M. Period Enter Exit Total
All Trucks All Trucks All Trucks All Trucks All Trucks All Trucks All Trucks All Trucks All Trucks6:00-7:00 11:00-12:00 3:00-4:006:15-7:15 11:15-12:15 3:15-4:15 6:30-7:30 11:30-12:30 3:30-4:306:45-7:45 11:45-12:45 3:45-4:457:00-8:00 12:00-1:00 4:00-5:007:15-8:15 12:15-1:15 4:15-5:157:30-8:30 12:30-1:30 4:30-5:307:45-8:45 12:45-1:45 4:45-5:458:00-9:00 1:00-2:00 5:00-6:00
1. Highest hourly volume between 7 a.m. and 9 a.m. (4 p.m. and 6 p.m.). Please specify the peak hour.2. Highest hourly volume during the a.m. or p.m. period. Please specify the peak hour.3. Highest hourly volume during the entire day. Please specify the peak hour.Please refer to the Trip Generation User’s Guide for full definition of terms.
Hourly Driveway Volumes- Average Weekday (M-F)
�Check if Part 3, 4 and/or additional information is attached.
0 1 1 1 17:15-8:15
1 6 1 4 3 05:00-6:00
0 11 11
5:00-6:00
7:15-8:15
16 14 30
3 2 5 1 3 4
4 2 6 2 2 4
3 2 5 5 2 7
3 2 5 7 3 10
0 10 10 1 2 3 8 5 13
0 11 11 2 3 5 11 10 21
0 9 9 2 2 4 10 12 22
1 6 7 2 4 6 14 12 26
1 4 5 3 3 6 16 14 30
xNathan Chan and Thomas Wong, Project Coordinators
ITE Student Chapter, UC Berkeley
(510) 499-2610 [email protected]

A.M. Period Enter Exit Total P.M. Period Enter Exit Total
All Trucks All Trucks All Trucks All Trucks All Trucks All Trucks12:00-12:15 12:00-12:1512:15-12:30 12:15-12:3012:30-12:45 12:30-12:4512:45-1:00 12:45-1:001:00-1:15 1:00-1:151:15-1:30 1:15-1:301:30-1:45 1:30-1:451:45-2:00 1:45-2:002:00-2:15 2:00-2:152:15-2:30 2:15-2:302:30-2:45 2:30-2:452:45-3:00 2:45-3:00 3:00-3:15 3:00-3:153:15-3:30 3:15-3:303:30-3:45 3:30-3:45 3:45-4:00 3:45-4:004:00-4:15 4:00-4:154:15-4:30 4:15-4:304:30-4:45 4:30-4:454:45-5:00 4:45-5:005:00-5:15 5:00-5:155:15-5:30 5:15-5:305:30-5:45 5:30-5:455:45-6:00 5:45-6:006:00-6:15 6:00-6:156:15-6:30 6:15-6:306:30-6:45 6:30-6:456:45-7:00 6:45-7:007:00-7:15 7:00-7:157:15-7:30 7:15-7:307:30-7:45 7:30-7:457:45-8:00 7:45-8:008:00-8:15 8:00-8:158:15-8:30 8:15-8:308:30-8:45 8:30-8:458:45-9:00 8:45-9:009:00-9:15 9:00-9:159:15-9:30 9:15-9:309:30-9:45 9:30-9:459:45-10:00 9:45-10:0010:00-10:15 10:00-10:1510:15-10:30 10:15-10:3010:30-10:45 10:30-10:4510:45-11:00 10:45-11:0011:00-11:15 11:00-11:1511:15-11:30 11:15-11:3011:30-11:45 11:30-11:4511:45-12:00 11:45-12:00
Institute of Transportation Engineers
Trip Generation Data Form (Part 3)Name/Organization: City/State:
Telephone Number:
Detailed Driveway Volumes: Attach this sheet to Parts 1 and 2 if you are providing additional information.
Day of the week: (All = All Vehicles Counted, Including Trucks; Trucks = Heavy Duty Trucks and Buses)
ITE Student Chapter, UC Berkeley Berkeley, CA
(510) 499-2610
Wednesday
1 0 1
0 1 1
0 0 0
0 1 1
2 1 3
0 0 0
0 2 2
1 0 1
1 1 2
1 0 1
1 1 2
1 0 1
0 1 1
0 1 1
0 1 1
1 0 1
1 0 1
3 1 4
2 2 4
2 2 4
5 4 9
3 2 5
2 6 8
4 4 8
0 1 1
0 2 2
0 4 4
0 3 3
0 2 2
0 0 0
1 1 2
0 1 1
0 0 0
0 0 0
0 0 0
2 0 2
1 1 2
0 0 0
0 1 1
0 1 1
0 0 0
1 1 2
0 0 0
2 1 3

Average Weekday (M-F) Saturday Sunday
Enter Exit Total Enter Exit Total Enter Exit Total
24-Hour VolumeA.M. Peak Hour of Adjacent1 Street Traffic (7 – 9)Time (ex.: 7:15 - 8:15):P.M. Peak Hour of Adjacent1 Street Traffic (4 – 6) Time:A.M. Peak Hour Generator 2
Time:P.M. Peak Hour Generator2 Time:Peak Hour Generator3
Time (Weekend):
Institute of Transportation Engineers
Trip Generation Data Form (Part 4)
Survey conducted by: Name: _______________________________________________________________________________________________________
Organization: __________________________________________________________________________________________________
Address: _____________________________________________________________________________________________________
City/State/Zip: _________________________________________________________________________________________________
Telephone #:_____________________________ Fax #:_____________________________ E-mail:______________________________
Please return to: Institute of Transportation Engineers Technical Projects Division 1099 14th Street, NW, Suite 300 West
Washington, DC 20005-3438 USA
Telephone: +1 202-289-0222
Fax: +1 202-289-7722
ITE on the Web: www.ite.org
1. Highest hourly volume between 7 a.m. and 9 a.m. (4 p.m. and 6 p.m.) as defined in Trip Generation Data Form (Part 2). Please specify the peak hour.2. Highest hourly volume during the a.m. or p.m. period. Please specify the peak hour.3. Highest hourly volume during the entire day. Please specify the peak hour. Please attach supplemental hourly volumes.Please refer to the Trip Generation User’s Guide for full definition of terms.
Summary of Pedestrian Volumes
Summary of Bicycle Volumes
Average Weekday (M-F) Saturday Sunday
Enter Exit Total Enter Exit Total Enter Exit Total
24-Hour VolumeA.M. Peak Hour of Adjacent1 Street Traffic (7 – 9)Time (ex.: 7:15 - 8:15):P.M. Peak Hour of Adjacent1 Street Traffic (4 – 6) Time:A.M. Peak Hour Generator 2
Time:P.M. Peak Hour Generator2 Time:Peak Hour Generator3
Time (Weekend):
0 1 17:45-8:45
5:00-6:00
7:45-8:45
5:00-6:00
7:45-8:45
4:30-5:30
1 0 10 1 1
1 0 1
1 6 7
18 16 347:45-8:45 1 6 7
4:30-5:30 18 16 34
Nathan Chan and Thomas Wong, Student Coordinators
ITE Student Chapter, UC Berkeley
(510) 499-2610 [email protected]

Parking Demand Survey FormInstitute of Transportation Engineers(fill in all highlighted cells - * are required data)
Land Use Code* 223Name of Site New Cal ApartmentsBrief Description of Site
Transit* Yes Mid-Rise Apartment BuildingArea* City BerkeleyTMP* No State CA Country United StatesParking Price* $ Daily Rate $ Hourly Rate
Site Size* 148 Units* Dwelling Units Occupancy* 100%Site Size Units OccupancySite Size Units OccupancySite Size Units Occupancy
Number of Parking Spaces Provided at Site 108
Highest Observed Parking Demand for the following hours of the day (hour beginning)*Date 4/3/2012 4/5/2012 4/11/2012Day Tuesday Wednesday Thursday
12 Mid1:00 AM2:00 AM3:00 AM4:00 AM5:00 AM6:00 AM7:00 AM 71 71 718:00 AM 66 61 659:00 AM 60 55 61
10:00 AM 58 57 5711:00 AM 52 52 5612 Noon 47 50 551:00 PM 44 49 532:00 PM 44 49 513:00 PM 46 51 504:00 PM 44 49 495:00 PM 49 54 426:00 PM 48 55 477:00 PM8:00 PM9:00 PM
10:00 PM11:00 PM
Person Thomas Wong Organization ITE Student Chapter, UC BerkeleyPhone (510) 499-2610FaxEmail [email protected] data on the web at www.ite.org Comments to: [email protected] not entered on web site, please mail to:Institute of Transportation Engineers, 1627 Eye Street, NW Suite 600; Washington, DC 20006
Form version 1.4
Land Use