trends and patterns in public finace-9-7-13 -...
TRANSCRIPT

Trends and Patterns in Public Finance: Theoretical and
Empirical Aspect
DISCLAIMER: The opinions/assertions, expressed in the collection are the authors’ personal view. The Institute of Chartered Accountants of India does not bear any responsibility for them.
Committee on Public Finance
The Institute of Chartered Accountants of India (Set up by an Act of Parliament)
New Delhi

© THE INSTITUTE OF CHARTERED ACCOUNTANTS OF INDIA, NEW DELHI All rights reserved. No part of this publication may be reproduced, stored in a retrieval system, or transmitted, in any form, or by any means, electronic, mechanical, photocopying, recording otherwise, without the prior permission, in writing, from the publisher. First Edition : June, 2013 Committee/Department : Committee on Public Finance E-mail : [email protected], [email protected] Website : www.icai.org Price : ` 150/- ISBN No : 978-81-8441-638-1 Published by : Publication Department on behalf of the
Institute of Chartered Accountants of India, ICAI Bhawan, Post Box No. 7100, Indraprastha Marg, New Delhi-110002
Printed by : Sahitya Bhawan Publications, Hospital
Road, Agra- 282003 June/2013

Foreword I am immensely pleased that the Committee on Public Finance of the Institute of Chartered Accountants of India is coming up with its publication “Trends and Patterns in Public Finance: Theoretical & Empirical Aspect which would provide an overview of the trends and patterns in Public Finance and enrich the knowledge-base of both intellectuals, members and students. In the direction of ICAIs initiatives to be partner in Nation building, the Committee has left no stone unturned and has been continuously striving towards its goal of systematically analyzing, reviewing and making suggestions to the policy makers in the area of public finance. Public finance is the pillar on which our economy stands. In a steady manner the process of reforms is underway in India. It is important for the government machinery to have a systematic analysis of public finance of the economy and make suitable changes in line with emerging requirements. The macroeconomic environment of India demands constant efforts for building a framework that could provide for efficient adjustments between revenue and expenditure, adequate targets for government spending, imparting greater certainty, implementing such measures to raise the tax-GDP ratio, bringing reforms to yield better fiscal management, thereby mitigating key fiscal risks. Managing Public Finance is an essential part of governance and in this process, the committee on Public Finance is constantly sharing and shouldering responsibilities. I compliment the Chairman, Committee on Public Finance, CA. Anuj Goyal, Vice-Chairman, CA. G Sekar and other members of the Committee for their initiative in bringing out this publication. I am sure this publication would enrich the readers and be immensely helpful and beneficial to various stakeholders and members of the profession.
CA. Subodh K. Agrawal President, ICAI

iv

Preface Public Finance mainly deals with the financial health of the economy. To improve an economy financially, it is important to improve the financial transparency of a nation. For that, financial purview of an economy is needed through data on allocation of resources, distribution of income and macroeconomic stabilization. Collection of sufficient resources from the economy in an appropriate manner along with allocation and use of these resources efficiently and effectively constitute good financial management. Management of Public Finance has always been an important issue for the Indian Economy. The government tries hard for the maintenance of all fiscal tools so that smooth functioning of Public Finance could be achieved.
Taxation in India is well-developed with clearly demarcated authority between Central and State Governments and local bodies. The tax regime in India has undergone elaborate reforms over the last couple of decades in order to ensure rationality, simplicity and improve compliance.
Public expenditure plays an important role as a key operating fiscal policy instrument in order to achieve the goals of growth, equity and stability and yet maintaining the intermediate targets of deficit indicators to ensure the sustainability of public finances. The deterioration in the fiscal health of states has placed pressure on the development and social spending.
Public Debt also forms an important component of planning. It supplies the sufficient resources needed for the successful implementation of Five Year Plans and also contributes to the growth of financial markets. But it is unfortunate that due to excessive borrowing, Indian Government has not succeeded in producing a surplus budget since independence. Also, many issues have found their place viz., fiscal deficits, price instability, disequilibrium in Balance of Payments, inflation and others. Consistent measures like fiscal In India, reforms, Tax reforms, fiscal consolidation process, and stimulus packages have been undertaken to improve state of the economy.
The Committee on Public Finance has prepared a publication on “Trends and patterns in Public Finance: Theoretical and Empirical Aspect“. It provides coverage to all aspects of Public Finance and gives an insight into the conditionalities which have enabled the state of Public Finance as it is today.

vi
I would like to convey my sincere thanks to our Hon’ble President, ICAI, C.A. Subodh Kumar Agarwal and Hon’ble Vice-President, ICAI, C.A. K. Raghu for their constant support and cooperation to the Committee.
I would also like to thank Dr. Nikhil Saket, Secretary, Committee on Public Finance and the team of Committee on Public Finance for their efforts in bringing out the publication.
I am confident that the readers would find this publication immensely useful in expanding their knowledge and understanding of the subject.
CA. Anuj Goyal Chairman
Committee on Public Finance

Acknowledgement
The study on “Trends and Patterns in Public Finance-Theoretical and Empirical Aspect” is an attempt to review, analyze, assist, recommend and suggest measures in the areas of Policy assessment, planning and execution in public finance.
The Committee on Public Finance, would like to express their gratitude to many people who highlighted their views on Public Finance through this book; to all those who provided support, talked things over, read, wrote, offered comments, allowed us to quote their remarks and assisted in the editing, proofreading and design. We would like to extend our sincere thanks to all the officials of the Committee for their work.
The editors are indeed grateful to the contributors Govind Bhattacharya, Saibal Kar, Chandan Sharma, Harishankar Vidyarthi, Dr. Neeta Tapan, Dr. Bakshi Amit Kumar Sinha, CA Atanusasan Mukhopadhyay and Priyadarshi Dash for their papers/ articles that have been published in this volume.
CA. Anuj Goyal Chairman
Committee on Public Finance


Authors / Contributors 1 Govind Bhattacharya, Director-General (Eastern Region), Office of the
Comptroller and Auditor- General of India
2. Charan D. Wadhva, Honorary Research Professor, Centre for Policy Research
3. Saibal Kar, Institute for the Study of Labor (IZA), Bonn; Faculty of Economics, Centre for Studies in Social Sciences, Kolkata
4. Prof. Chandan Sharma, Assistant Professor, Indian Institute of Management, Lucknow, Noida Campus, India. Pin-226013
5. Harishankar Vidyarthi, Fellow, National Institute of Financial Management, Faridabad , Haryana
6. Dr. Neeta Tapan, Assistant Professor of Economics, Govt. Girls Post Graduate College, Ujjain
7. Dr. Bakshi Amit Kumar Sinha, Research Associate, Centre for Economic Policy and Public Finance (CEPPF), Asian Development Research Institute (ADRI), Patna
8. CA Attanusasan Mukhopadhyay, Municipal Finance Expert, Change Management Unit, Municipal Affairs Department, Govt. of West Bengal
9. Priyadarshi Dash, Research Associate RIS - Research and Information System for Developing Countries

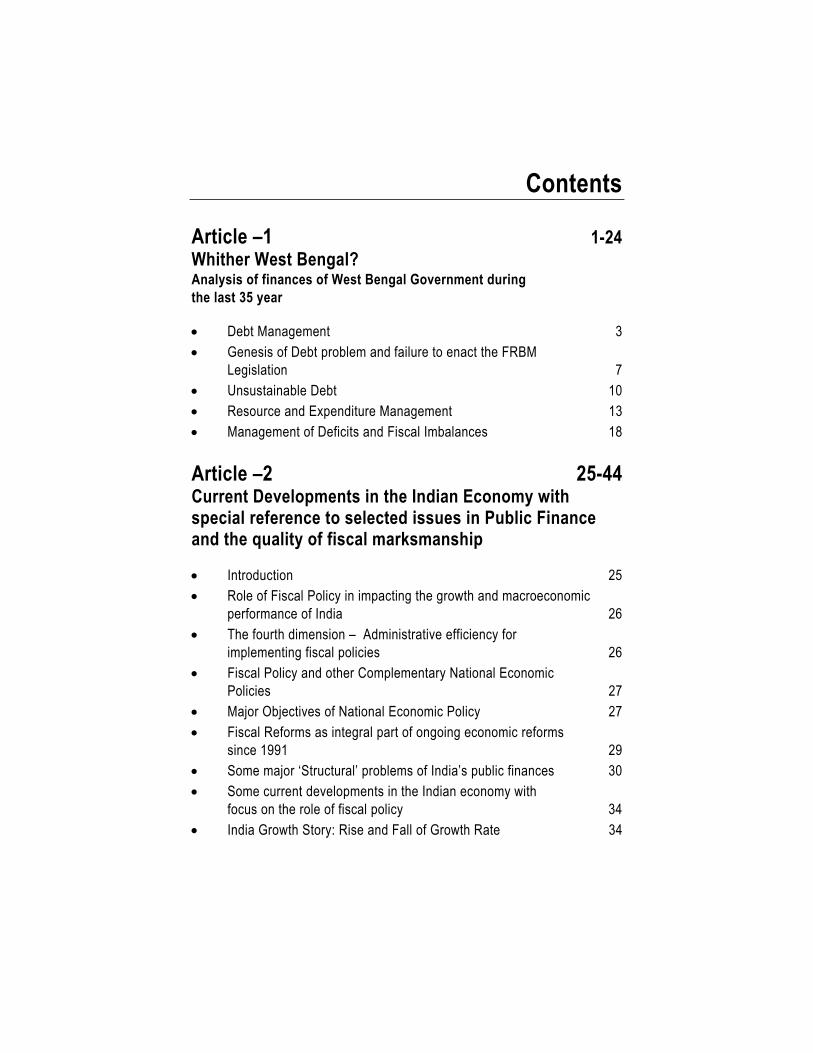
Contents
Article –1 1-24 Whither West Bengal? Analysis of finances of West Bengal Government during the last 35 year
• Debt Management 3 • Genesis of Debt problem and failure to enact the FRBM
Legislation 7 • Unsustainable Debt 10 • Resource and Expenditure Management 13 • Management of Deficits and Fiscal Imbalances 18
Article –2 25-44 Current Developments in the Indian Economy with special reference to selected issues in Public Finance and the quality of fiscal marksmanship
• Introduction 25 • Role of Fiscal Policy in impacting the growth and macroeconomic
performance of India 26 • The fourth dimension – Administrative efficiency for
implementing fiscal policies 26 • Fiscal Policy and other Complementary National Economic
Policies 27 • Major Objectives of National Economic Policy 27 • Fiscal Reforms as integral part of ongoing economic reforms
since 1991 29 • Some major ‘Structural’ problems of India’s public finances 30 • Some current developments in the Indian economy with
focus on the role of fiscal policy 34 • India Growth Story: Rise and Fall of Growth Rate 34

xii
• Analysis of Selected Post -2003 issues in India’s Public Finance 37 o The Fiscal Responsibility and Budget Management
(FRBM) Act 38 o The conceptual shift in budget making from
“Public Outlays” to “Public Outcomes” 40 o The proposed Goods and Services Tax (GST) 41
• Concluding Remarks 42 Article –3 45–64 Does Public Debt Affect Real Effective Exchange Rate in India? • Introduction 45 • Economic Crisis, Public Debt and India – A Broad Overview 47
o The Financial Crisis and Public Debt 49 o Combating the Crisis in Europe 50 o What is to be expected for India? 52
• Public Debt and the Real Effective Exchange Rate in India 54 • Concluding Remarks 59
Article –4 65–84 Forecasting Infrastructural Investment Need for India during the Twelve Five Year Plan • Introduction 65 • Data 68 • Econometric Model and Methodology 68
o Estimating the Demand Function 70 • Empirical results 72
o Results of Unit root and Cointegration tests 72 o Long run elasticities estimation using FMOLS 73 o Sector wise demand and funding projection 75
o Electricity 75 o Rail 76 o Road 77 o Telecommunication 78

xiii
• Conclusion and Policy Suggestions 82
Article –5 85–106 Urban Public Finance Structure-Creating Architectural Niches • Decentralisation and Urban Local Bodies 85 • Architecture of Urban Public Finance 87 • Different streams of Revenues 88 • Revenue Buoyancy 90 • Revenue Expenditure 91 • Revenue Balance 92 • Liquidity and Debt Profile 93 • Finance Commission and Fiscal Devolution 93 • Central Finance Commission 94 • The emergence of innovative Urban Fiscal structures 98 • Municipal Finances: Maladies and Remedies 100 • Reflections on Theory and Practice of Urban Public Finance 103 Article –6 107–122 Trends and Patterns of Public Expenditure in Bihar during Tenth and Eleventh Five Year Plans • Introduction 107 • Methodological Process of the Expenditure 108 • Expenditure Classification 108 • Plan and Non-Plan Expenditure 109 • Revenue and Capital Expenditure 112 • Development and Non-Development Expenditure 113 • Service-Wise Expenditure 116 • Salary and Non-Salary Expenditure 118 • Conclusion 120

xiv
Article –7 123-129 De facto Autonomy of the Third Tier of the Government Article –8 130-146 Fiscal Policy in Post-Recession Era: Challenges and New Directions • Introduction 130 • State of Global Fiscal Conditions 131 • Global Economic Recession, 2007-09 and Changing Theoretical
Perspectives on Fiscal Policy 137 • Fiscal Policy for Developing Countries 140 • Reviving Keynesianism: Sweet or Sour 141 • Conclusion 142

Abbreviations
ASSOCHAM Associated Chambers of Commerce and Industry of India ARV Annual Rental Value BoP Balance of Payments BRGF Backward Regions Grant Fund CAD Capital Account Deficit CAG Controller and Auditor General of India CII Confederation of Indian Industries CPI Consumer Price Index CR Capital Receipts CRAR Capital to Risk Weighted Asset Ratio CRR Cash Reserve Ratio CSIR Council of Scientific and Industrial Research CCF City Challenge Fund CSO Central Statistical Organisation CFC Central Finance Commission CVC Central Vigilance Commission DD Demand Draft DI Direct Investment ECB European Central Bank ECGC Export Credit and Guarantee Corporation EER Effective Exchange Rate EUR Euro EPW Economic and Political Weekly ECB European Central Bank EU European Union EFSF European Financial Stability Facility EXIM Bank Export Import Bank of India FCA Foreign Currency Assets FCCB Foreign Currency Convertible Bond FMOLS Fully Modified Ordinary Least Square FCNRD Foreign Currency Non-Repatriable Deposit

xvi
FDI Foreign Direct Investment FEMA Foreign Exchange Management Act FI Financial Institution FICCI Federation of Indian Chambers of Commerce and Industry FII Foreign Institutional Investor FRBM Fiscal Responsibility and Budget Management Act FOF Flow Of Funds FPI Foreign Portfolio Investment FER Foreign Exchange Reserve GDP Gross Domestic Product GDR Global Depository Receipt GFD Gross Fiscal Deficit GIC General Insurance Corporation GLS Generalized Least Squares GoI Government of India GSDP Gross State Domestic Product GPD Gross Primary Deficit G-Sec Government Securities HDFC Housing Development Finance Corporation HUDCO Housing & Urban Development Corporation IBRD International Bank for Reconstruction and Development IBS International Banking Statistics ICAR Indian Council of Agricultural Research ICICI Industrial Credit and Investment Corporation of India ICMR Indian Council of Medical Research IDBI Industrial Development Bank of India IFC International Finance Corporation ILO International Labour Organisation IFC(W) International Finance Corporation IFCI Industrial Finance Corporation of India IIBI Industrial Investment Bank of India IIP Index of Industrial Production IIP/InIP International Investment Position IMD India Millennium Deposits

xvii
IMF International Monetary Fund IN India INR Indian Rupee ISO International Standards Organization IT Information Technology IPO Initial Public Offering ICOR Incremental Capital –Output Ratio LAF Liquidity Adjustment Facility LIC Life Insurance Corporation of India LTRO Long Term Refinancing Operation M1 Narrow Money M3 Broad Money MCA Ministry of Company Affairs MIGA Multilateral Investment Guarantee Agency MIS Management Information System MoF Ministry of Finance MoUD Ministry of Urban Development MoUEPA Ministry of Urban Employment and Poverty Alleviation MSS Market Stabilisation Scheme NABARD National Bank for Agriculture and Rural Development NASSCOM National Association of Software and Services Companies NBFC Non Banking Financial Companies NEER Nominal Effective Exchange Rate NGO Non-Governmental Organization NHB National Housing Bank NPA Non-Performing Assets NPV Net Present Value NBFC Non Banking Financial Corporation NSC National Statistical Commission NURM National Urban Relief Fund OLS Ordinary Least Square ODA Official Development Assistance OECD Organisation for Economic Cooperation and Development OECO Organisaton for Economic Co-operation

xviii
OMO Open Market Operations PCI Planning Commission of India PDO Public Debt Office PF Provident Fund PIO Persons of Indian Origin PNB Punjab National bank PSE Public Sector Enterprises PUC Paid Up Capital QRR Quick Review Report REP Ricardian Equivalence Principle RBI Reserve Bank of India RD Revenue Deficit RE Revenue Expenditure REER Real Effective Exchange Rate RIDF Rural Infrastructure Development Fund RLB Rural Local Body RRB Regional Rural Bank RUF Revolving Underwriting Facility REER Real Effective Exchange Rate SBI State Bank of India SC Schedule Caste SGSY Swarnajayanthi Gram Swarrojgar Yojana SHGs Self-Help Groups SIDBI Small Industries Development Bank of India SJSRY Swarna Jayanti Shahari Rojgar Yojana SLR Statutory Liquidity Ratio SSI Small-Scale Industries ST Schedule Tribe SCARDB State Cooperative Agriculture and Rural Development Bank SDR Special Drawing Right SEBI Securities and Exchange Board of India SEBs State Electricity Boards SFC State Financial Corporation SFC State Finance Commission

xix
TBs Treasury Bills US United States ULB Urban Local Bodies USD US Dollars URIF Urban Relief Incentive Fund UTI Unit Trust of India VC Venture Capital WPI Wholesale Price Index YTM Yield to Maturity


Whither West Bengal? Analysis of finances of West Bengal Government
during the last 35 years Govind Bhattacharya∗
(I)
Every year during the Durga Puja time, the Howrah station overlooking the muddy waters of Hoogly turns into a vast sea of humanity setting off on their annual vacations to different corners of the country. This crowd always returns to the state after enjoying their vacation to settle back to the familiar routines of daily life. But for the last several years, there has been another crowd thronging the station in almost equal numbers in a different season – at the beginning of an academic year for the medical and engineering colleges in the country. This crowd comprises students and young professionals from the state filling the trains to Bangalore, Hyderabad and Chennai. They leave West Bengal not to return but to seek opportunities that have been absent in the State for quite some time. It was no different last year also, after the new Government had completed one year of rule in the State. These people are trying to escape from shrinking opportunities and stagnation of decades, from the slow invasion of political violence into their lives, from the gradual infiltration of all academic institutions in the state by the formidable party apparatus of CPM, now substituted by that of Trina Mool Congress (TMC), and from the staleness of rhetoric and emptiness of unfulfilled promises.
Drunk on unbridled power for 34 years, the arrogance of the Left Front Government’s leaders and their cadres had taken the state to the brink of an abyss. Even before the elections that threw them out, they were probably hoping what Lin Biao had hoped for Maoist China, “Even if heaven collapsed, Mao and his invincible thought could prop it up and mend the cracks.” But the cracks that were opening up with astonishing regularity in left-ruled West Bengal– Singur, Nandigram, Lalgar, Netai – proved too difficult to mend.
∗ The author is a senior member of the Indian Audit and Accounts Service, currently posted as Director General of, the International Training Centre of the Comptroller and Auditor General of India. The views expressed in the paper are his own.

Trends and Patterns in Public Finance: Theoretical and Empirical Aspect
2
History is but a heap of dust, but it always has an uncanny ability to repeat itself.
John Kenneth Galbraith had described the Indian economy as the ‘World’s greatest example of functioning anarchy’. But in West Bengal, the anarchy has long been non-functional and driving towards a steady decline, the unmistakable signs of which had appeared long before the new millennium had dawned upon the State. In 1980-81, West Bengal produced 9.8 per cent of the industrial output produced in India. In 1997-98, this share came down to 5.1 per cent and in 2009-10 it was only 4.32 per cent1. During the period from 1980-1998, the organised sector employment had actually declined in West Bengal; in particular, employment in the organised private sector had come down from 10.84 lakh to 7.99 lakh; in 2009-10, it was only 5.72 lakh. No doubt, the culture of gheraos and strikes had played their parts well in driving industry and capital away from this state, just as the intense politicization of its once-famed academic institutions was driving away its talents in later parts of the Left-Front’s rule. During the mid-1960s West Bengal was the second most industrialised state of India; by 1995-96, among all the major states of India, it was just ahead of UP in terms of the share of output from industry. And all this had happened in a period when the industrial growth rate in the country was accelerating: after the software boom and post 1991 reforms, the period that put Karnataka, Andhra Pradesh, and Delhi on the industrial map of India. “It would almost seem that West Bengal opted to step off the bus just as everyone else was getting on.”2 Till the end of Left Front era, and even after that, this decay continues unabated.
These signs of decay slowly metamorphosed into social unrest and political turmoil increasingly resembling a withering of the State in the true Marxist sense. The state polity became dominated by violence and its governance by corruption. Finances were in a shambles with the State struggling to pay the salaries of its staff. When the owners of fertile agricultural land, dispossessed by the state to facilitate setting up of industry and attract private capital into the capital-starved state, revolted, it tried to stifle all protest and bulldoze them into silence by using the might of a corrupt police
1 Figures cited in this paragraph are taken from the Annual Survey of Industries, 2011, CSO. 2 “Strategy for Economic Reform in West Bengal”, EPW Special Article, October 12, 2002 by Abhijit Banerjee et al.

Whither West Bengal?
3
force and an equally corrupt state machinery. When that backfired, the once all-powerful party looked confused, shaken and petrified, but did not forsake its arrogance which had become the hallmark of its rule. It was ‘party state’, where the arrogance of the leaders had reached such heights that they didn’t even think before displaying their outright contempt for the people who had elected them. After the 2008 Panchayat elections at which the Left Front had received a thorough and unprecedented drubbing, a left leader had explained it away as “a grave and momentary mistake that the people have committed.” When the CAG of India had reported that the State had faltered in implementation of the Sarva Shiksha Aviyan in 2007, the State Secretary of CPM had commented that the people who had written that report could not have ‘any grey matters in their heads’. A party-state brooks no dissent. It had turned the State into an instrument of coercion, and subjugated all the rights, dignity and welfare of the people to its own dated ideas of a state monopoly of all intellect and progress. As Julien Benda, French noveslist, had said in 1927, “Our age is the age of nationalisation of intellect in political hatreds.” Fortunately this was 2011, not 1927, but the ruling party was caught in a time warp where the clock of progress and flow of ideas had stopped fifty years ago.
(II)
Debt Management “When politics meets religion, the outcome is inquisition”, Albert Camus had said. And when politics meets economics, the outcome is disaster, and worse when that politics is backed by a dated mindset. The economic policies of the Left Front Government have truly brought the state to the brink of an abyss.
In October, 2005, the Reserve Bank of India gave a dire warning that the Left Front ruled State’s debt situation was the worst among all states.3 A study4 released by it had said that West Bengal’s outstanding debt was growing at a compounded annual rate of 20.2%, the highest among all the major states of India. Coupled with its low tax buoyancy, this fast growing debt was clearly unsustainable. In October, 2010, the RBI again warned the Union Finance Ministry that the West Bengal Government was facing a “severe overdraft crisis” and that its financial condition was so precarious that it was thinking of
3 Financial Express, Kolkata, Oct 27, 2005. 4 ‘A Study of Debt Sustainability at State Level in India’, by Indira Rajaraman, NIPFP, Shashank Bhide, NCAER and RK Pattnaik,RBI.

Trends and Patterns in Public Finance: Theoretical and Empirical Aspect
4
diverting Rs 600 crore of Central funds for drought relief for the purpose of payment of salaries to its staff.5 In November 2010, the Chief Secretary was summoned by the Union Finance Ministry and warned that that the state’s fiscal situation was ‘unsustainable’. Ways and Means Advances (WMA), used only as a last resort, had become the major source of sustenance for the State for the last few years. In 2010-11 alone, it has already approached the RBI on 38 occasions for special WMA, after exhausting the limit of Rs 545 crore for normal WMA.
The total outstanding debt liabilities of the State has mounted steeply from a somewhat manageable level of Rs 1441 crore, or 20% of the GSDP in 1977-78 to an astounding level of Rs 175,366 crore or 37% of its GSDP, at the end of 2010-11. This figure is the accumulated effect of past borrowings, growing at a steep annual compounded rate of 15.66% every year since 1977-78. But actually the rate of growth of outstanding debt had accelerated from 1998-99 onwards,and Debt:GSDP ratio had also started getting beyond control from that year on, reaching a peak of 46% in 2004-05 and stood at that level even in 2005-06. About 88 per cent of this outstanding debt at the end of 2010-11, amounting to Rs 151,125 crore, was due to the internal loans raised by the State from the market, and only 7% was due to the Central Government loans, the rest being due to the public account. The annual interest burden on this huge outstanding debt has increased from a modest Rs 73 crore in 1977-78 to Rs 13,817 crore in 2010-11. This figure is 59% of the State’s total revenue from its own resources and 21% of its total revenue expenditure. At the end of the left-front’s rule, these figures were respectively 67% and 23%; in other words, two-thirds of the State’s own revenues (excluding the Central grants and the State’s share of central taxes) was spent on meeting the interest charges alone. In 2002-03, interest payment alone consumed almost the whole of the state’s own revenue resources, tax and non-tax combined.6
5 Times of India, Kolkata, 23rd February, 2011 6 Table 1

Whither West Bengal?
5
But the sorry fact is that the State could not, or did not use the debt resources for creating income generating capital assets. Public debt assuredly is one of the most powerful agents of economic transformation and income generation, provided it is utilised for the creation of productive capital assets that generate income in course of time that can be used for debt repayments without putting the economy under undue stress. Since any borrowing by the Government of the day imposes a burden of repayment of principal plus an annual interest burden on future generations, it is imperative that the benefit of more productive capital assets created out of the borrowed funds be passed on to posterity. In case of West Bengal, it was only the burden without any of the intended benefits that has been passed on to posterity.
In 2010-11, a paltry 11% of the total borrowed funds could be utilized for the purpose of creation of productive capital assets after [paying off the debt service charges (installments of principal plus interest), But during 2006-07 to 2008-09, repayments had actually exceeded the total borrowing, which were not enough to discharge the state’s current debt service obligations. In 2006-07, the State had to pay an extra Rs 3240 crore out of its revenue towards debt-servicing; in 2008-09 it was an extra Rs 577 crore out of its own resources. For most of the Left Front rule, debt resources were mostly used to discharge the existing debt obligations, and the net accrual to the State exchequer on this account was insignificant.
0
20000
40000
60000
80000
100000
120000
140000
160000
180000
200000
77-78
81-82
82-83
87-88
92-93
93-94
94-95
95-96
96-97
97-98
98-99
99-00
00-01
01-02
02-03
03-04
04-05
05-06
06-07
07-08
08-09
09-10
10-11
Debt Burden of West Bengal (Rs Cr)
Total Debt Recd Repayment of Debt Outstanding Debt

Trends and Patterns in Public Finance: Theoretical and Empirical Aspect
6
0
5
10
15
20
25
30
35
40
45
50
Debt: GSDP Ratio of West Bengal (%)
0
2000
4000
6000
8000
10000
12000
14000
16000
77-78
81-82
82-83
87-88
92-93
93-94
94-95
95-96
96-97
97-98
98-99
99-00
00-01
01-02
02-03
03-04
04-05
05-06
06-07
07-08
08-09
09-10
10-11
Interest Burden (Rs Crore)
-10000
0
10000
20000
30000
40000
50000
77-78 82-83 92-93 94-95 96-97 98-99 00-01 02-03 04-05 06-07 08-09 10-11
Total Debt Received Vs Net Debt Utilsed (Rs Crore)
Total Debt Recd Net Debt Utilised

Whither West Bengal?
7
Ideally the revenue account of a State should show a surplus that can be used for making up the shortfall in the capital account which mainly comprises borrowings; but West Bengal could never generate any surplus in the revenue account. Paradoxically, its capital account was in surplus since 1992-93; but instead of using this to create more capital assets, it used these surplus amounts to finance the revenue expenditure. It was unproductive, as it was mostly used for the purpose of payment of salaries to its huge army of Government servants, and also to finance the populist schemes introduced in total disregard of financial considerations, sacrificing all fiscal and financial prudence at the alter of vote-bank politics. In the process, the future of the State was irrevocably mortgaged to the interests of short-term political gains. As a consequence, the capital outlay in the state remained one of the lowest in the country. Even Bihar had a capital outlay exceeding Rs 5000 crore in 2006-07 as compared to West Bengal’s Rs 2018 crore; in 2008-09, Bihar’s capital outlay of Rs 6436 crore was nearly twice that of West Bengal’s Rs 3705 crore. In 2010-11, Bihar’s capital outlay was Rs 9196 crore, more than four times that of West Bengal’s Rs 2226 crore. Among the major States of India, the per capita capital expenditure of West Bengal was the lowest.
Genesis of Debt problem and failure to enact the FRBM Legislation As noted earlier, till 1997-98, the state’s debt problem was manageable; its Debt GSDP ratio was 23% Abut 24% of the debt funds were still available to the State to spend on capital outlay. But the Fifth Pay Commission-engineered hikes of salary for Central and consequently the State Government employees threw the finances of the state completely out of gear. While it had to pay a much larger wage bill for its a million plus army of employees and a higher pension bill for its nearly four lakh pensioners, it made no effort to expand its own revenue base, and had to resort to large scale borrowings from the market at high rates of interest.

Trends and Patterns in Public Finance: Theoretical and Empirical Aspect
8
Not only West Bengal, but all other states in the country had to face this problem. But what the other states did, West Bengal could not do, for reasons of political expediency. The other states started bringing a semblance of fiscal discipline into their finances, by enacting the Fiscal Responsibility and Budget Management (FRBM) Acts. Substantial relief came from the recommendations of the Twelfth Finance Commission, under which a debt write-off scheme linked to the reduction of revenue deficit of States was introduced. Under the scheme, the repayments due from 2005-06 to 2009-10 on central loans contracted up-to 31st March 2004 were to be consolidated and considered eligible for write-off, the quantum of which was linked to the absolute amount by which the revenue deficit was reduced in each successive year during the Commission’s award period (2005-06 to 2010-11), provided the state had enacted an FRBM Act. The precondition was that the reduction in the revenue deficit must be cumulatively higher than the cumulative reduction attributable to the interest relief available. Another precondition was that the fiscal deficit of the State must be contained at least to the level of 2004-05. In effect, if the revenue deficit could be brought down to zero, the entire repayment during the period could be written off.
Twelfth Finance Commission’s formula did indeed help most of the states to lighten their debt burden. Most states took advantage of the formula and reduced their debt burden to manageable levels. The FRBM Act 2003 at the Centre also provided a target based framework for management of government finances. By 2009-10, as many as 26 out of 28 States had enacted Fiscal Responsibility Legislations (FRL) bringing in some semblance of fiscal discipline that was hitherto largely absent and this had resulted in
0
20
40
60
80
100
120
Interest Payments: Own RevenueInterest Payments: Revenue Expenditure

Whither West Bengal?
9
significant fiscal correction. But only two States failed to do so - West Bengal and Sikkim – and as a result, could not take advantage of the scheme to reduce their severe debt burden, which will continue to plague the finances of West Bengal in the foreseeable future. Relief that would have been available to West Bengal on this account was Rs 485 crore for each of the five years from 2005-2010.7
The Twelfth Finance Commission had further recommended that the Central loans to States contracted till March, 2004 and outstanding at the end of March 2005 should be consolidated and rescheduled for a fresh term of 20 years at 7.5 per cent only, again subject to the State enacting the fiscal responsibility act. If West Bengal had done this, it would have got a debt relief amounting to Rs 2735 crore during the award period of the Commission, Rs 1187 crore on account of repayment of principal and Rs 1548 crore on account of interest. It let go of this opportunity too to ease its enormous debt burden, because that would have restricted the Government’s license to indulge in populism and distribution of favour to select interest groups in order to get what it considered political and electoral gain.
The Thirteenth Finance Commission (2010-15) also prescribed certain modalities for reducing the debt burden of the States. The terms of the reference of the Thirteenth Finance Commission (TFC) required it to “review the State of Finance of the Union and the States keeping in view, in particular, the operation of the States’ Debt Consolidation and Relief Facility (DCRF) 2005-10”. DCRF was introduced by the Union Government on the recommendations of the 12th Finance Commission – providing for (i) Consolidation of central loans contracted till 31st March 2004 and outstanding as on 31st March 2005 for a fresh tenure of twenty years at 7.5% rate of interest and (ii) Debt waiver to states based on their fiscal performance as discussed in the preceding paragraphs.
Due to the tight financial circumstances following the global economic meltdown in 2009-2010 and 2010-11, the process of fiscal consolidation
7 In “West Bengal Government Finance: A Critical Look”, EPW, October 30, 2010, Debabrata Dutta argued that West Bengal Government’s budgetary position may not have been conducive for its refusal to opt for the FRBMA. Nothing could be farther from the truth. It was rather the case that the budgetary position had worsened because of lack of fiscal discipline. Besides, the delayed enactment by the same Government of the FRBMA later when the budgetary position had further worsened also negates the argument.

Trends and Patterns in Public Finance: Theoretical and Empirical Aspect
10
suffered setback across many states in India. TFC expected all states to eliminate their revenue deficits by 2011-12 and generate revenue surpluses by 2014-15. Most states have already eliminated their revenue deficit, only three general category states, Kerala, Punjab and West Bengal, still continue to generate revenue deficits. TFC was very particular about the enactment / amendment of FRBM acts by the States to lay down the required fiscal reform path prescribing the borrowing limits for individual states and enforcing fiscal correction; the state-specific grants recommended by the TFC would be released only after complying with the conditions stipulated in their respective FRBM Acts. It suggested further debt relief in respect of loans from National Small Savings Fund (NSSF), a part of the public account of the states, and for dues of central plan loans other than from the Ministry of Finance and outstanding as on 1st April, 2010 to be written off, both again being incumbent upon enactment of FRBM Acts laying down the roadmap for fiscal correction by the States. West Bengal did not comply again, predictably not to foreclose its options to indulge in populism in an election year. 8
Unsustainable Debt Can the State sustain its outstanding debt that exceeded Rs 175,000 crore and an interest obligation that rose to nearly Rs 14000 crore at the end of 2010-11? 88% of this outstanding debt amounting to Rs 155,125 crore was due to its internal market borrowings only. The outstanding internal debt generated an annual interest burden of Rs 12,300 crore, or 92% of the state’s total interest payments in 2009-10. More than half of this outstanding internal debt commands interest rates exceeding 10.5%, and about Rs 10,000 crore bears interest rate as high as 13.5%. About Rs 67,000 crore of the outstanding debt is in the form of various Government Bonds carrying interest rates higher than the market rates; of these, debt worth Rs 18,096 crore will mature within the next seven years, i.e. by 2016-17, and will have to be redeemed. The debt service payments on this account will therefore continue to grow exponentially and will continue to haunt the present government.
8 In July 2010 the FRBM Act was finally enacted by the West Bengal Government so as to enable them to avail the concessions under TFC recommendations, but no seriousness was shown in sticking to the fiscal and financial limits prescribed in it; these were ultimately not adhered to.

Whither West Bengal?
11
Debt sustainability is defined as the ability of a State to maintain a constant debt-GDP ratio over a period of time and reflects its ability to service its debt. The size and growth rate of the Debt-to-GDP Ratio assumes importance in this context as high debt ratios are costly and will eventually become unsustainable. Fiscal sustainability is also linked to the concept of solvency and liquidity, while solvency refers to the government’s ability to service its debt obligations without explicitly defaulting on them, liquidity refers to government’s ability to roll-over its maturing liabilities with its liquid assets and available financing. Vulnerability to such problems is related to structure of debt - short-term / long term or internal/ external.
Sustainability of debt thus refers to the sufficiency of current assets to meet current or committed obligations and the capacity to balance the cost of additional borrowings with returns from such borrowings. Borrowings are necessary to bridge the resource gap or fiscal deficit. Debt sustainability implies that the increase in fiscal deficit should be accompanied by an enhanced ability to service the additional debt burden. While calculating sustainability of debt, we are thus concerned with the inter-temporal budget constraint of the government and the change in public debt ratio over time. The long run debt sustainability condition implies the sufficiency of incremental non-debt receipts of the State to cover its incremental primary expenditure, i.e. Required Primary Surplus = Growth adjusted real interest rate on public debt* Net public debt.
A necessary condition for stability is that the rate of growth of GSDP should exceed the interest rate i.e. the cost of borrowed funds; Debt-GSDP ratio is then likely to be stable provided there is a sustained primary surplus (at least not a deficit in the primary account). This is known as the Solvency Condition. The stock of public debt could increase so long as it does not increase faster than the real interest rate. Given the rate spread (GSDP growth rate – interest rate) and quantum spread (debt stock multiplied by the rate spread), debt sustainability condition states that if quantum spread together with primary deficit is zero, debt-GSDP ratio would be stable or debt would be sustainable. On the other hand, if it is negative, the debt-GSDP ratio would continue to rise and in case it is positive, debt-GSDP ratio would eventually fall.
Except for only one year, 2005-06, the Solvency condition was not satisfied for West Bengal during the entire period from 1997-98 to 2010-11, even

Trends and Patterns in Public Finance: Theoretical and Empirical Aspect
12
though its quantum spread together with its primary deficit has been mostly positive.9 Debt-GSDP ratio started declining from 2005-06 after reaching a dangerous level of 45% in that year. But incremental non-debt receipts were hardly adequate to cover the incremental primary expenditure, as shown by the rising primary deficits after 2007-08; it has reached an alarming level of Rs 11647 crore in 2009-10 and stood at a still alarming level of Rs 5316 crore at the end of 2010-11. The debt–stock has also been growing at a rate much faster than the real interest rate, making the state’s outstanding debt clearly unsustainable.
34 years of left rule had thus brought the state to the brink of bankruptcy. Nothing perhaps was more responsible for this situation than the Left Front Government’s use of populist measures with reckless abandon. Subsidies and populist measures had been the order of the day ever since the Left Front took over10. Apart from subsidising the loss making State Public undertakings like the State Transport Corporation, it had also introduced a pension scheme with accident insurance benefit for 15 lakh transport workers.11 ‘Soon after the massive defeat of Left parties in the municipal elections, a “land gift scheme” was revived, under which every landless family was to be given up to five cottahs (about 3500 sq ft) of arable land, buying it at 25% more than the market price. Despite promises made to the Centre on containing the revenue expenditure by banning the creation of new posts, freezing of subsidies, limiting the rise in pension by withholding of additional DA installments for retired and serving employees, it announced a 70 per cent increase in the salaries of college and university teachers and created as many as 331 posts of teachers in government colleges. After the debacle in 2009 Parliamentary elections, the magnanimity of the Government has been on the rise. The government announced an urban employment scheme with an initial outlay of Rs 250 crore, besides providing subsidy of Rs 422 crore to sell rice and potato at Rs 2 a kg to BPL card-holders. It is not to reflect on the desirability or wisdom of these measures which were probably bringing relief to the needy, but at the same time, the government ought to have raised more taxes to finance these welfare measures. West Bengal’s own tax: GSDP ratio at 4% remains the lowest in the country among all major
9 Table 2 10 “Price of Populism: Fiscal Crisis in West Bengal” by Shri Bibekananda Ray, The Statesman, Kolkata, December 07, 2010. 11 During 2008-09 the total subsidy provided by the Government amounted to Rs 1256 crore compared to Rs 733 crore the year before.

Whither West Bengal?
13
States, even less than Bihar’s. It is less than half that of most states in India and hence there is plenty of scope for raising this ratio by raising tax collections.
(III)
Resource and Expenditure Management The finances of the state government are classified under two heads of accounts: revenue and capital. Revenue account is meant for running the day-to-day activities of the ministries and departments; receipts to this account come from various tax and non-tax sources as also from the Centre by way of grants and state’s share of the divisible pool of Central taxes under recommendations of the various Finance Commissions. The expenditure incurred from this account is mostly of maintenance nature. The capital account is meant for creation of capital assets in the economy capable of generating income and hence employment; receipts to this account are mostly from borrowings. Capital account thus creates future wealth for the economy and revenue account maintains it. One of the fundamental principles of sound financial management of government resources is to have a surplus in the revenue account; if not, at least a balanced revenue account so that the state’s revenue expenditure which does not result in any creation of wealth for the economy can be met out of the state’s own revenue resources, requiring no diversion of funds from the capital account.
The total revenue receipts of the state consist of state’s own tax and non-tax revenues plus its share of central taxes as well as central grants. The important point to note here is that in 1977-78, the state’s own tax revenues constituted about 70% of total tax revenue; this ratio has come down to only 57% in 2010-11. The total revenue of the State has increased but the increase was more due to increase in Central transfers - Central grants as well as State’s share of Central taxes - rather than due to increase in its own tax revenues, a dependence that was absent during the initial years of the Left Front rule. During the first decade of Left rule, the Government used to collect more than 60% of its total revenue from its own resources; toward the end of its rule, this share has now come down to 50%.12 The State had become more dependent on Central transfers while all the time accusing the Centre of step-motherly treatment to cover its own failure to expand its tax
12 Table 3

Trends and Patterns in Public Finance: Theoretical and Empirical Aspect
14
base. The less self-sufficient it became, the more noise it made about the perceived injustice and neglect by the Centre.
Before the Left Front had come to power, 23% of the capital receipts were invested on capital assets as capital outlay. Left Front’s first term saw it decline to 6%, but it was raised to 23% during its next term in the Office (1982-87). Thereafter capital outlay declined steadily till it had reached a pathetic 3% of its total capital receipts in 2002-03. The ratio stood at only 5% in 2010-11. The capital borrowings were actually used to finance the increasing revenue deficits and there could be no better recipe for financial disaster for any state.
Government expenditure can also be classified as developmental and non-developmental expenditure. Non-developmental expenditure is incurred for running the day-to-day administration of the state; it comprises the expenditure on General Services mostly on administration, not directly attributable to the state’s socio-economic development, for which the expenditure on social and economic services is more relevant, which, therefore, is said to constitute the development expenditure. The share of development expenditure in West Bengal remained around 40% of the total expenditure during the 34 years of Left Front rule. The share of general services has not only been the highest among the three services, it has also registered the fastest growth, especially from 1997-98 onwards. Of course, a large part of the growth is due to the steep increases in interest payments, which is the most important component of the expenditure on general services; but pension also consumed a huge amount of taxpayers’ money, growing nearly fourfold during the last decade alone (from Rs 2200 crore to Rs 8000 crore between 2001- and 2011. Between 1977 and 2011, the interest payment has grown from Rs 73 crore to Rs nearly Rs 14000 crore, or from one third to half the total revenue expenditure on general services. During the same period, expenditure on pension has grown from only Rs 12 crore to more than Rs 6500 crore, i.e. from 6% to nearly a quarter of the total non-developmental revenue expenditure. During the last decade alone, salary and pension expenditure together has been growing at a CAGR of 13.30%13. It amounted to around 7% of the GSDP of the state in 2001-02, and has come down gradually to only 4.5%, except in 2009-10 when there was a hike due to the payment of arrears as well as implementation of the State’s Fifth Pay Commission’s recommendations.
13 Table 4

Whither West Bengal?
15
0%
10%
20%
30%
40%
50%
60%
70%
80%
90%
100%
77-7882-8387-8892-9397-9802-0307-0809-1010-11
Revenue receipts of West Bengal (%)
Central Transfers State’s Own Revenue
0
10000
20000
30000
40000
50000
60000
70000
77-7882-8387-8892-9397-9802-0307-0809-1010-11
Revenue account of west Bengal (Rs Crore)
Revenue Expenditure Revenue ReceiptRevenue Deficit

Trends and Patterns in Public Finance: Theoretical and Empirical Aspect
16
Revenue Receipts of West Bengal (Rs Crore)
05000
100001500020000250003000035000400004500050000
77-78
82-83
87-88
92-93
97-98
02-03
07-08
09-10
10-11
Tax Revenue Non Tax Revenue Central Grants
Revenue Expenditure of West Bengal (Rs Crore)
0
5000
10000
15000
20000
25000
30000
35000
77-78
82-83
87-88
92-93
97-98
02-03
07-08
09-10
10-11
General Services Interest Payments
Social Services Economic Services

Whither West Bengal?
17
Capital Account of West Bengal Government (Rs Crore)
05000
100001500020000250003000035000400004500050000
77-78
82-83
87-88
92-93
97-98
02-03
07-08
09-10
10-11
Capital Receipts Capital Outlay
Committed Expenditure (Rs Crore)
0
5000
10000
15000
20000
25000
2005-06
2006-07
2007-08
2008-09
2009-10
2010-11
Salary Expenditure Pension Expenditure
Subsidy

Trends and Patterns in Public Finance: Theoretical and Empirical Aspect
18
(IV)
Management of Deficits and Fiscal Imbalances The net resource gap in the economy is reflected by the Gross Fiscal Deficit (GFD) which is to be bridged by borrowing. GFD is calculated as the difference between the total revenue receipts including grants from the Centre and non-debt capital receipts, and the total expenditure including loans net of recovery.GFD is a fairly good indicator of the state’s overall financial performance just as the GSDP, the Gross state Domestic Product is a fairly good proxy for the State’s economic development. It is financed by net borrowing by the state government, i.e. internal debt and Central loans net of repayments, net public account receipts, mainly against the small savings and provident fund balances as well by running down the cash balance of the state (difference between the opening and closing cash balances).
The Gross Fiscal Deficit of West Bengal has increased truly by leaps and bounds from a paltry Rs 189 crore on 1977-78 to a peak of 24,952 crore in 2009-10l. The GFD: GSDP ratio is taken as a measure of sustainability of the deficit.14 Till 1992-93, the Left Front Government managed to keep the GFD at a level well below 3% of GSDP, considered a safe limit, with occasional hiccups. But from 1993-94 onwards, the GFD:GSDP ratio has been allowed to rise freely, reaching a dangerous level of 8.62% in 1999-2000, from which it was brought down to 4.25% in 2010-11.
14 Table 5
0
5000
10000
15000
20000
25000
30000
77-78
82-83
87-88
92-93
97-98
02-03
07-08
08-09
09-10
10-11
Gross Fiscal Deficit of West Bengal (Rs Crore)

Whither West Bengal?
19
0.0
1.0
2.0
3.0
4.0
5.0
6.0
7.0
77-7882-8387-8892-9397-9802-0307-0808-0909-1010-11
GFD:GSDP Ratio (%)
-40%
-20%
0%
20%
40%
60%
80%
100%
77-78
82-83
87-88
92-93
97-98
02-03
07-08
08-09
09-10
10-11
Composition of GFD (%)
Net Lending Capital Outlay
Revenue Deficit

Trends and Patterns in Public Finance: Theoretical and Empirical Aspect
20
Economic distress and social turbulence are always closely correlated, and signs of it will be evident in the body politic, as evident in the complete alienation of small peasantry from the ruling dispensation. This author in a paper earlier published in EPW had shown that part of the alienation could have been caused by the systematic neglect of the outlying peripheral districts in government expenditure on the social services like education, health, sanitation, drinking water etc. It was shown that there were huge disparities in the social sector expenditure between districts, bulk of the of the Government expenditure having been incurred in Kolkata; e.g., while in Kolkata district, during 2007-08, the Government had spent Rs 329 per capita for drinking water supply, in Howrah and Hoogly districts, it spent only Rs 3.37 and Rs 3.51 respectively.15 It was obvious that such disparities will ultimately translate into popular anger against the Government. Democracy is all about equity, however thin its spread might be, and this veneer of equity generally dissolves popular anger. Popular anger was responsible for unseating the Left Front Government in no small measure.
The Left Front won seven elections since 1977, each time with thumping majority. In 1977, when it was first swept to power, it won 225 or 77% of the 15 Intra-State Disparity in Government Expenditure, Govind Bhatacharya, EPW, June 27, 2009; also Table 12.
-20%
0%
20%
40%
60%
80%
100%
77-78
82-83
87-88
92-93
97-98
02-03
07-08
08-09
09-10
10-11
Financing of the GFD (%)
Net Public AccountNet BorrowingNet Decrease in Cash Balance

Whither West Bengal?
21
total 294 seats. In the next three elections in 1982, 1987 and 1991, it increased its tally to 82% of the total seats. In the 1991 and 1996 elections, however, the tally dropped to 69% and 65% of the total seats, again to rise to 77%, or 227 seats in the 2006 elections.16 But its unprecedented political stability did not translate into economic strength. Rather, from being one of the richest states of India in 1960s, it has steadily slipped below most states. The fact that anti-incumbency did not show up in electoral results in all these years was perhaps due to the fact that despite the moderate economic growth, despite the crisis in organized industrial sector within the state, the Left Front could still build an image of promoting the cause of small and marginal peasants and small entrepreneurs.17 But post-Nandigram and Singur, even that façade was shattered.
Today in respect of almost all socio-economic parameters, West Bengal has slipped below most states. The old regime has now been replaced with a new one, but nothing has changed otherwise. To be fair, the new regime inherited an empty coffer and huge liabilities, with annual debt servicing payments including interest exceeding Rs 40000 crore a year. To bail the state out of this morass, a friendly Government at the Centre doled out a package of Rs 21,614 crore in August 2011, comprising Central grants of Rs 9240 crore and enhancement of the borrowing limit of the State to allow it to raise the remaining Rs 12374 crore as loan from the market which will further add to the State’s already huge outstanding debt liability. 18 A further grant of Rs 18908 crore was approved early this year, which included Rs 8750 crore under the Backward Regions Grant Fund (BRGF) for development of the backward areas in the state, especially in the Maoist-infested Jangal Mahal comprising West Midnapur, Purulia and Bankura districts, but the Government may be forced to divert these funds to pay the salaries to its staff. Also, the rest of the funds, Rs 10,158 crore, cannot be utilized unless the state makes a matching contribution of half this sum, and it has already asked for an advance of Rs 5300 crore to get going. Of late the State has also been asking for a moratorium on all debt service payments. But it must be understood that in a federal set up, with federal financial relations clearly defined in the Constitution and different states competing for Central grants, it is very difficult even for a friendly Centre to accommodate any particular state beyond a limit. The package given to West Bengal has already 16 http://eci.nic.in/eci_main/StatisticalReports/ElectionStatistics.asp. 17 “The Economy of West Bengal”, Ratan Khasnabis, EPW, December 27, 2008. 18 Economic Times, New Delhi, August 06, 2011.

Trends and Patterns in Public Finance: Theoretical and Empirical Aspect
22
triggered demands for similar largesse from other financially troubled states like Punjab and Kerala. Certainly, the kind of large scale financial accommodation that can bail the state out of this mess is beyond the capacity of any Central Government. In that situation, the only pragmatic option is for the State to curtail expenditure, expand tax base and increase revenue. It will lead to unpopular decisions that are certain to cause temporary hardship to the people, but if that is the price to pay for bringing in fiscal discipline and financial reforms, such decisions are unavoidable. But it is here that the Trinamool Government is displaying singular short-sightedness, guided by the populist policies of its maverick Chief Minister. Scandals like the Sharda have started rocking the Government, and all the ills of the Left rule – be it political violence, intolerance of even the mildest forms of dissent and criticism, politicization of academic campuses, crony capitalism, doling out public funds for buying votes, lawlessness – seem to have been inherited by it too- an inheritance it is showing no signs to let go of.
The State today is standing at a crossroads where hope seems to have all but abandoned it, and despair appears about to set in. If the Government fails to correct course, and it does not have infinite time to do that, the state could descend into a massive financial and developmental disaster that will inevitably bring increasing chaos and turmoil in its wake. It already looks set for a catastrophe, reminding one of Faiz Ahmed Faiz,
“Ye dagh dagh ujala, ye shab-gazida sahar,
Wo intezar tha ziska, ye wo sahar to nahi!”19
This stain-covered daybreak, this night-bitten dawn, this is not that long-looked-for break of the day!
19 Subh-e-Aazaadi, Faiz Ahmed Faiz, August, 1947, Translation by Victor Kiernan.

Annexure - Tables related to West Bengal Table 1: Debt Burden of West Bengal Government (Rs Crore)
1977-78
1982-83
1987-88
1992-93
1997-98
1999-2000
2002-03
2006-07
2007-08
2008-09
2009-10
2010-11
Debt Receipts Central Loans 168 891 642 937 3607 1470 2568 621 694 400 300 296 Internal Debt 489 993 390 2311 3455 14376 27843 10619 27503 24855 37532 43879 PF Small Savings 20 44 81 216 397 1069 1078 1195 1258 1430 1831 2385 Total Debt Received 677 1928 1113 3464 7459 16915 31489 12435 29454 26685 39663 46560 Interest payments 73 167 394 966 2410 4169 7667 10879 11384 12069 13305 13817 Total Debt Repayment 484 1382 703 2445 3285 8258 19182 3915 17444 15194 18090 27476 Net Debt Recd 110 355 -28 -49 1522 4221 3750 -3240 -312 -577 8269 5267 Net debt received as % of total borrowing
16 18 -3 -1 7 25 12 -26 -1 -2 21 11
Outstanding Debt 1441 3101 5147 9897 22230 37197 69883 112144 123218 134709 156282 175366 GSDP 7093 13049 25078 43290 97966 135376 168000 261682 299483 342141 398933 459156
1 Debt: GSDP 20 24 21 23 23 27 42 43 41 39 39 38 Interest Payments: Own Revenue Receipts
17 21 24 34 52 73 99 84 78 62 67 59
Interest Payments: Revenue Expenditure
10 10 13 17 21 21 33 32 30 23 23 21
1 GSDP for 2010-11 has been calculated by taking the average growth rate during the last 3 years; other figures of GSDP have been taken from the CSO website as on 2nd August 2011.

Trends and Patterns in Public Finance: Theoretical and Empirical Aspect
24
Table 2: Debt Sustainability Indicators 1997-98 1999-00 2001-02 2003-04 2005-06 2006-07 2007-08 2008-09 2009-10 2010-11
Weighted Interest Rate on Loans 10.45% 11.10% 10.85% 11.21% 9.15% 9.48% 9.04% 9.71% 9.88% 8.84% GSDP Growth 11.31% 10.62% 9.34% 12.65% 10.35% 13.65% 14.45% 14.24% 16.60% 15.10% Interest Rate Spread 0.86% -0.48% -1.51% 1.44% 1.20% 4.17% 5.41% 4.53% 6.72% 6.26% Outstanding Debt2 9897 37197 58466 81948 104505 122144 123218 134709 156282 175366 Primary Balance -1616 -7499 -5430 -3661 151 -553 -17 -1489 -11647 -5316 Quantum Spread 85 -179 -883 1180 1254 5093 6666 6102 10502 10976 Quantum Spread + Primary Deficit -1531 -7678 -6313 -2481 1405 4540 6649 4613 -1145 5660 Debt-GSDP ratio (%) 23 27 37 43 45 43 41 39 39 38 Net Availability of Borrowed Funds 1522 4221 4649 2854 -589 -3240 -312 -577 8289 5267
2 Includes outstanding balances of Public Debt on the Consolidated Fund and Small Savings and Provident Fund Accounts from the Public Account.

Current Developments in the Indian Economy with Special Reference to
Selected Issues in Public Finance and the Quality of Fiscal Marksmanship
Charan D. Wadhva∗
Introduction: The objective of this paper is to review the current developments in the Indian economy with special reference to selected issues in the area of Public Finance1. It is accordingly organized under two broad sections. The first section highlights the major current developments in the Indian economy with focus on the core issues of public finance having impact on the health of the economy. We pay special attention to the core issue of fiscal deficit. This section dwells on the pivotal role that ‘Fiscal Policy’ plays in shaping the outcomes on the performance and prospects for growth with macroeconomic stability. In this context, it has to be recognized at the outset that fiscal policy is only one of the three major instruments of national economic policy. For a complete analysis of the impact of economic policy, the impact of the other two components, namely, the ‘Monetary Policy’ and the ‘Exchange Rate Policy’ must also be simultaneously taken into account. However, since our primary focus in this paper is on the role played by the fiscal policy of the Union government, we will briefly attempt to assess the quality of the “Fiscal Marksmanship” displayed by the fiscal authority in India (namely, the Union Ministry of Finance) in recent years. For a complete picture of the fiscal deficit, we will also briefly refer to the most relevant “combined fiscal deficit of the central government and the state governments”. Fiscal deficit is here defined as the difference between the total income and total expenditure of the “government” from all sources. The second section of this paper specifically deals with selected issues in ‘Public Finance’ in the context of governance issues. We have chosen to
∗ Honorary Research Professor, Centre for Policy Research 1 Revised and updated version of the invited webcam presentation made by the author at the Insitutute of Chartered Accountants of India (ICAI) on May 14, 2013.

Trends and Patterns in Public Finance: Theoretical and Empirical Aspect
26
focus here on the accountability of the government in the performance of its selected fiscal policies to the citizens of India through its Parliament. Role of Fiscal Policy in impacting the growth and macroeconomic performance of India: We begin this section by recalling that in the standard textbook approach on Public Finance, there are three traditional divisions of ‘Public Finance’ and associated fiscal policies with each of these divisions. These are: 1. Taxation (and subsidies); 2. Public Expenditure; and 3. Public Debt (Domestic debt and the more onerous External debt). Through each of these three distinct divisions of the discipline of ‘Public Finance’, the relevant fiscal policies have their impact on the crucial macroeconomic parameters having a bearing on the current and the future health of the economy. These crucial parameters measuring the performance and the prospects for growth and macroeconomic stability form the bases for the up-gradation or down-gradation of the sovereign credit ratings of any economy by the well known international credit rating agencies. The fourth dimension – Administrative efficiency for implementing fiscal policies: In addition to the above three recognized divisions of public finance and associated fiscal policies, there is a fourth crucial dimension applicable to all these divisions dealing with the effectiveness of all fiscal policies. This relates to the “Administrative efficiency” reflected in the implementation of policies and procedures formulated for achieving their objectives. The commonly accepted guiding principles for a sound system of fiscal governance with transparency and accountability are: (i) Simplicity; (ii) Efficiency (in delivering results); and (ii) Equity (distributive justice). The key yardsticks for measuring the quality of fiscal governance for improving the all inclusive welfare of the people can be further identified as: (i) Ensuring maximum feasible achievement of the quantitative targets set by each policy initiative within pre-set time limit; (ii) Minimizing cost in the achievements of these targets; (iii) Conducting all government related activities with a system of verifiable transparency and accountability to the public; and (iv) the observance of professional ethics in dealing with people with zero tolerance for corruption and other “leakages” resulting in loss to the

Current Developments in the Indian Economy with Special Reference…
27
public exchequer and non-delivery or partial delivery of the benefits to the targeted beneficiaries2. This fourth dimension of governance of fiscal policies should be of special interest to the members of the Institute of Chartered Accountants of India (ICAI) which is engaged in providing its distinguished professional services to the society as an institute of national importance. ICAI needs to be complimented for including study of public finance in its core activities. It needs to play an active role in providing its inputs and feedback to the policy makers responsible for formulation of fiscal policy.
Fiscal Policy and other Complementary National Economic Policies: As briefly indicated in the introduction to this paper, any evaluation of fiscal policy for achieving national economic policy objectives has to simultaneously take into account the effects of two other complementary components of national economic policy, namely, the ‘Monetary Policy’ and the ‘Exchange Rate Policy’. In reality, there is a considerable degree of interdependence and some degree of conflict among the fiscal; monetary and exchange rate policies in simultaneously achieving the objectives of national economic policy. For example, tight monetary policy during inflationary times through raising interest rates puts limits on the capacity of the “Treasury” as the fiscal authority (in India’s case, the Union Ministry of Finance) to simultaneously stimulate growth rate of the economy. Similarly, excessive fiscal deficit limits the scope for inflation control by the monetary authority (Reserve Bank of India). However, having made this observation, we will focus here only on the role of the fiscal policy on economic growth and macroeconomic stability mainly at the level of the central government.
Major Objectives of National Economic Policy: The major multiple objectives of national economic policy (not always achievable simultaneously due to their internal conflict) include among others: (i) Accelerating the growth rate of the economy measured through Gross
Domestic Product (GDP).
2 The Economic Surveys of the Government of India appear to narrowly define the “Fiscal Marksmanship” in terms of meeting the quantitative targets set by the fiscal authority. See, Government of India, Economic Survey 2012-13, p. 57We would like to broaden this concept to include all the key yardsticks mentioned above.

Trends and Patterns in Public Finance: Theoretical and Empirical Aspect
28
(ii) Promoting “Inclusive Growth”3 which offers benefits of growth to all sections of the society through empowering the poorer and weaker sections of the society otherwise left out.
(iii) Reducing inequalities in the distribution of income, wealth and economic opportunities without any gender bias.
(iv) Improved governance for the welfare of the people by increasing “Gross Domestic Happiness”.
(v) Ensuring sustainable growth keeping in mind ecological balance (environment).
(vi) Countering business and economic cycles stimulating the economy in recessionary times and deflating the economy in overheated boom times.
(vii) Promoting full employment. (viii) Promoting Price Stability (controlling inflation at socially tolerable
levels); and (ix) Ensuring Balance of Payments at sustainable levels with relatively
stable exchange rate. It needs to be appreciated that fiscal policy has a vital role to play, directly and indirectly in varying degrees (and in conjunction with other economic policies) in the achievement of several of the above listed objectives of national economic policy. As is widely accepted by the economists, fiscal policy has a comparative advantage over monetary and exchange rate policies in the achievement of the objectives numbered (i) to (iii) and (vi) and (vii). It should also be noted that large fiscal deficits often spill over to raise the Current Account Deficit (CAD) worsening the CAD (as a proportion of GDP) through increased imports and make it more difficult for the Reserve Bank of India to reduce the CAD and restore exchange rate stability.
3 The concept of “Inclusive Growth” (though not new to the Indian planners) was formally proposed in the document on the Approach to the Eleventh Five Year Plan (2007-12) prepared by the Planning Commission and adopted as a guiding principle in the document on the Eleventh Five Year. See, Government of India, Planning Commission, The Eleventh Five Year Plan (2007-12), New Delhi, 2007.

Current Developments in the Indian Economy with Special Reference…
29
Fiscal Reforms as integral part of ongoing economic reforms since 1991: India launched more liberal market economy oriented economic reforms under the compulsions of unsustainable balance of payments in 1991. At that time, India faced serious twin deficits, namely, the excessive high fiscal deficit and the unsustainable high current account deficit with foreign exchange reserves at such a low level (less than 15 days of import finance) that India could not meet its external debt obligations. The combined fiscal deficit of the central government and the state governments had by 1990-91 reached near 10.0 per cent of the GDP, and was regarded as being at unsustainably high level. The high fiscal deficit had spilled into higher imports raising the Current Account deficit (CAD) to an uncomfortably high level at around 4.0 per cent of the GDP. Most economists agree that unsustainably high level of (combined for the central and the state governments) fiscal deficit as a proportion of GDP was one of the root causes of the unprecedented economic crisis faced by India in 1990-914. India had started resorting to increasing levels of “fiscal profligacy” in the decade of the 1980’s especially during the mid 1980’s. The resultant macroeconomic crisis was, therefore, in the making for a long time before climaxing in the most serious balance of payments crisis faced by the country in 1990-91. With the recognition of the damage that unsustainably high fiscal deficits cause in various ways in destabilizing the macroeconomic performance and weaken the prospects of returning to higher growth path,5 India has been undertaking fiscal reforms as an integral part of the ongoing incremental economic reforms since 1991. These reforms have covered all four areas of public finance mentioned above, namely, (i) Taxation (covering both direct and indirect taxes); (ii) Public Expenditure; (iii) Public debt; and (iv)
4 See, for example, Charan D. Wadhva, Economic Reforms in India and the Market Economy: Interface with the States, Bureaucracy, Business and Society, New Delhi, Allied Publishers, 1994; Shankar Acharya, India’s Economy: Some Issues and Answers, New Delhi, Academic Foundation, 2003 (p. 21); and Arvind Panagariya, India: Emerging Giant, New York: Oxford University Press, 2008 (p. 178). 5 See, Shankar Acharya, ‘Why Large Fiscal Deficits are Bad for us’, in his India’s Economy: Some Issues and Answers, ibid, Ch. 17.

Trends and Patterns in Public Finance: Theoretical and Empirical Aspect
30
Improving administrative efficiency in all the above-mentioned divisions of public finance, especially in taxation policies.6 In this section of the paper, we will largely focus on the single most crucial target of fiscal policy, namely, the fiscal deficit as a proportion of the GDP. Ideally, this should be estimated on the basis of the combined fiscal deficit (which equals net borrowings) of the central government and the state governments. We will make periodic references to this combined fiscal deficit as a percentage of the GDP whenever it reached a new peak. As our focus in this paper is on the central government finances, data on the “Fiscal Deficit” and the more worrisome “Revenue Deficit” (representing dis-saving by the central government) is presented in Table 1 from 2003-04 to 2012-13. We have already referred to the twin crises (the fiscal crisis and the Current Account Deficit (CAD) crisis) faced by India in 1990-91 that resulted in serious macroeconomic crisis and forced the government to launch economic reforms. Since growing CAD/GDP ratio partially reflects the spill- over effects of the fiscal deficit, we also present data on this parameter in Table 1 for the years 2007-08 to 2012-13 (Revised Estimates). The data provided in Table 1 will be used for reviewing the current developments in the Indian economy in the relevant sub-section that focuses on India’s growth story in its shining phase (roughly covering five years preceding the year 2008-09 (the year in which the global financial crisis occurred) and in its phase of serious decline in growth during the last two years (2011-12 and 2012-13) with the simultaneous re-emergence of the serious twin crises of the1990-91 period discussed above.
Some major ‘Structural’ problems of India’s public finances: The Indian public finances have been suffering from various structural problems for a long time. These problems are of systemic nature for which the government has so far been unable to find durable solutions. Before we list the existing structural problems, we must give credit to the central government for gathering sufficient political will to satisfactorily resolve one of the most serious structural problems of our public finances. This problem had the maximum potential for generating inflation in our economy facing supply side bottlenecks in raising output. This problem arose from the
6 For a historical review of the reforms undertaken by the government in all the four areas of public finance mentioned above, see all the annual Economic Surveys of the Government of India from 1991-92 to 2012-13.

Current Developments in the Indian Economy with Special Reference…
31
unsound practice of automatic monetization of the budget deficit of the central government without any defined upper limit (popularly known as “deficit financing”). The central government put an end to this practice completely with effect from April 1, 19994. This came through an agreement between the central government and the Reserve Bank of India (RBI) on replacing the earlier practice with a new system that provided for ways and means advances to be sought by the government from the RBI with pre-defined limits and some flexibility through negotiations for meeting the occasional liquidity needs of the government due to temporary mismatch between the government revenues and government expenditure from time to time.7 We list below some of the persistent major structural problems of India’s public finances with supporting evidence presented in Table 1. These problems resurface periodically in the Indian economy ringing alarm bells in the economy from time to time reflecting mismanagement of the economy. (i) India, as a matter of policy like most developing countries, has chosen
to run fiscal deficits each year. This decision has been justified by the government on the ground that in a capital-scarce country like India, capital account deficits component of the fiscal deficit at this stage of development would finance productive investments which will, in due course, and with due diligence yield higher income to the government and higher growth rate to the economy after some time. Unfortunately, as a norm, with very few exceptions, the central government has been a net dissaver in its fiscal operations in most of the years. The rate of return on total government investments on capital account has also been at too low and unsatisfactory a level to generate sufficient investible resources for financing future growth in the economy. Thus, the government has been facing a near “perpetual” resource crunch in financing public expenditure.
(ii) The Union government, especially since mid 1980’s, has been frequently and indiscriminately incurring higher revenue deficits reflecting government’s consumption expenditure. Unlike deficit on capital account, revenue deficit does not yield income in the future. Revenue deficit reflects “dissaving” by the government. Worse still, as Table 1 shows, revenue deficit of the central government has
7 See, C. Rangarajan, ‘Two Episodes in the Reform Process’, Chapter 3 in Shankar Acharya and Rakesh Mohan (editors), India’s Economy: Performance and Challenges, New Delhi: Oxford University Press, 2010.

Trends and Patterns in Public Finance: Theoretical and Empirical Aspect
32
constituted a major portion of the fiscal deficit in most years. For example, it was as high as 81.0 per cent of the fiscal deficit in 2009-10.
TABLE 1 Fiscal Deficit; Revenue Deficit; Current Account Deficit; and Tax/GDP
Ratio: Central Government
Year Fiscal Deficit/GD
P %
Revenue Deficit/GD
P %
Rev. Dfct. To Fisc. Dfct. %
Current A/c
Deficit/GDP %
GrossTax Rev./GDP
%
2003-04 4.3 3.5 79.7 2004-05 3.9 2.4 62.3 2005-06 4.0 2.5 63.0 2006-07 3.3 1.9 56.3 2007-08 2.5 1.1 41.4 -1.3 11.9 2008-09 6.0 4.5 75.2 -2.3 10.8 2009-10 6.5 5.2 81.0 -2.8 9.6 2010-11 4.8 3.2 67.5 -2.8 10.2 2011-12 (Prvl)
5.7 4.3 75.5 -4.2 9.9
2012-13 (RE)
5.1 3.5 68.2 -4.6 10.7
2013-14 (BE)
4.8
Source: Government of India, Economic Survey 2012-13, pp. 57, 2 and 61; Last row: Budget 2013-14. Notes: Prvl: Provisional; RE: Revised Estimates; BE: Budget Estimates) (iii) Some notable success was achieved by the government through
conscious efforts to achieve fiscal consolidation (reducing the fiscal deficit as also the revenue deficit) during the years 1992-93 to 1995-96 and again during the years 2004-05 to 2007-08 (through the implementation of the Fiscal Responsibility and Budget Management Act of 2003). This was made possible through deliberate reduction in some major subsidies and resorting to other cuts in public expenditure. However, this process could not be carried out after 1991. A hefty burden on the central government exchequer, and as a consequence

Current Developments in the Indian Economy with Special Reference…
33
on the state government’s, was imposed with the over-generous acceptance of the recommendations of the Fifth Pay Commission by the central government in 1997-98. The ballooning bill of subsidies provided by the central government, especially fuel subsidies due to its inability or unwillingness to fully pass on the increase in the cost of imported crude to the domestic consumers, and rising interest bill on public debt were the other prominent causes for raising the fiscal deficits and the revenue deficits since 1995-96. As a result, the combined fiscal deficit of the centre and the states hit a decadal peak of 9.9 per cent and the combined revenue deficits a corresponding peak of 6.6 per cent in 2001-02).8
(iv) Public expenditure by the central government during 2011-12 and 2012-13 grown at a higher rate compared to its income from all sources in low growth phase leading to an upward pressure on fiscal deficit. Despite the complete phasing out of fiscal stimulus in 2009-10, fast rising expenditure on fuel, fertilizers, and food subsidies and on social sector welfare schemes in the post 2009-10 period like the Mahatma Gandhi Rural Employment Guarantee Act- MNREGA) again (like 1990-91) raised fiscal deficit to 5.7 per cent during 2011-12, which is considered to be too high (Table 1).
(v) The fiscal health of the Indian economy also worsened in some years due to falling ratio of Gross Tax Revenue to the GDP. The tax/GDP ratio fell from a high of 11.9 per cent in 2007-08 to a low of 9.6 per cent in 2009-10. It has been rising since then but has so far not reached its highest level achieved in 2007-08 (See Table 1).
(vi) Many of these structural problems of India’s public finance, despite several fiscal reforms undertaken incrementally since 1991, have not been addressed by the policy makers from a long-term perspective. The fiscal authority has failed to ensure that India has a sound fiscal policy that will not ever after 1991 put the country into unsustainably high twin deficits, namely, fiscal deficit and the Current Account Deficit (CAD) – the latter partly rising due to higher fiscal deficits. We will discuss the impact of the re-emergence of these twin deficits on the Indian economy since 2011-12 in the next sub-section.
8 See, Shankar Acharya, India’s Economy: Some Issues and Answers, op. cit, p. 122.

Trends and Patterns in Public Finance: Theoretical and Empirical Aspect
34
Some current developments in the Indian economy with focus on the role of fiscal policy: We now briefly review some of the recent developments in India’s growth story and its macro-economic performance and analyze the impact of fiscal policy on these developments.
India Growth Story: Rise and Fall of Growth Rate: In recent years, India attracted world -wide attention as the fastest rising emerging economy after China among the BRICS countries (comprising Brazil, Russia, India, China and South Africa). India also became a more attractive destination for global foreign direct investment (FDI) after recording nearly 9.0 per cent annual growth rate during the years 2003-08. However, India’s growth rate started decelerating in the aftermath of the global financial and economic crisis. This crisis had originated from the U.S.A. after the bankruptcy of Lehman Brothers in September 2008 and worsened after the eruption of the Euro debt crisis. India recorded its lowest growth rate in a decade at 5.0 per cent in 2012-13. Its other key macro-economic indicators of performance have also worsened in the last two years. Table 2 presents the snapshot view of the growth story and the performance of selected key macroeconomic indicators since 2005-06.
Table 2 India: Selected key indicators of growth and macroeconomic
performance
Years
Growth rate %
(annual)
S/Y (%)
I/Y (%) Fgn.Inv/Y %
Inflation CPI-IW
(%)
Exch. Rate Rs/$
2005-06 9.5 2006-07 9.6 34.6 35.7 1.1 2007-08 9.3 36.8 38.1 1.3 6.2 40.26 2008-09 6.7 32.0 34.3 2.3 9.1 45.99 2009-10 8.6 33.8 36.5 2.8 12.4 47.44 2010-11 9.3 34.0 36.8 2.7 10.4 45.56 2011-12 6.2 30.8 35.0 N.A. 8.4 47.92 2012-13 5.0 N.A. N.A. N.A. 10.0 54.48

Current Developments in the Indian Economy with Special Reference…
35
Notes: Growth rate of GDP (real); S/Y: Savings/GDP; I/Y: Investment/GDP; CPI-IW: Consumer Price Index-Industrial Workers; Exchange Rate: Indian Rupees per one U.S. dollar; N.A.: Not Available Source: Government of India, Economic Survey 2012-13, p. 2 and other pages.
It is clear from Table 2 that the Indian economic growth rate (averaging 8.8 per cent per annum for the six year period 2005-06 to 2010-11) was a commendable achievement despite the economy bearing the adverse effects of the global economic crisis since September 2008. However, growth in the Indian economy slowed down considerably during 2011-12 and 2012-13. The growth rate sharply fell to 5.0 per cent In2012-13 which was the lowest in the last decade. Sectorally, the decline in the industrial growth rate to 0.7 per cent in 2012-13 (compared to 2.9 per cent in 2011-12) was the sharpest. The decline in India’s growth rate in the last two years was to some extent (due to lower exports and lower foreign investment inflows) attributable to the ongoing global slowdown accentuated by the Eurozone crisis.9 At the same time, inflation rate had persistently shot up to very high level. As Table 2 shows, India’s inflation rate (at consumer prices) was close to double digit levels (especially food inflation) in four out of the five years following the Lehman crisis. It is our contention that domestic factors including inadequate policy responses were primarily responsible for the sharp slowdown in the Indian growth rate during 2011-12 and 2012-13. Table 2 provides some supporting data for this assertion. Inflation eroded savings. The savings rate fell from a high of 36.8 per cent in 2007-08 to a low of 30.8 per cent in 2011-12. Investment rate also registered a sharp decline due to several factors which worsened the domestic investment climate for the corporate sector. The adverse investment climate was due in no small measure to the “policy paralysis” reflected in government’s delayed decisions on clearing new investment projects, especially in the industrial, mining, and the infrastructure sectors. No major new economic reforms were launched by the UPA-II coalition government. And the continuous emergence of various corruption scandals including the 2G telecom spectrum allocation and coal blocks allocation scams vitiated the investment climate further. In these 9 As per the World Economic Outlook, January 2013, the growth rate in the volume of world trade fell from 5.9 per cent in 2011 to 2.8 per cent in 2012. The growth rate of USA fell from 1.6 per cent in 2012 to 1.3 per cent in 2012 and that of the Euro Area from 1.4 per cent to minus 0.4 per cent in corresponding years. China too, still being export driven, experienced some reduction in its growth rate from 9.3 per cent in 2011 to 7.8 per cent in 2012.

Trends and Patterns in Public Finance: Theoretical and Empirical Aspect
36
circumstances, the top political leadership and the concerned bureaucrats were reluctant to take corrective decisions to substantially improve the investment climate. The more worrisome part of the Indian economic performance since 2011-12 related to the worsening of the twin deficits (see Table 1) and their adverse impact on macro-economic parameters (see Table 2). Beginning with 2008-09, the government decided to provide fiscal stimulus to counter adverse effects of the global financial crisis thereby sharply raising fiscal deficit. It was successful in this task to a large extent. Even after these stimulus packages were phased out, the government’s spending spree continued (in excess of its revenue collections) especially on social sector welfare schemes. As a result, fiscal deficit of the central government alone rose from 4.8 per cent in 2010-11 to 5.7 per cent in 2011-12. The combined fiscal deficit of the centre and the states is estimated to have risen to near 9.0 per cent in 2011-12. This level of combined deficit was considered unsustainable by the international credit rating agencies as it accentuated inflationary pressures and raised real rate of interest on loans for productive investment, thereby lowering growth prospects. Worse still, the second of the twin crises, namely the Current Account Deficit (CAD) reached an unsustainably high level of 6.7 per cent of the GDP at the end of December 2012. This was caused by higher costs of crude imports (partly reflecting spillover of fiscal deficit to CAD) and sharp increase in gold imports by Indians with their traditionally strong appetite for buying gold, and also the use of gold as an effective hedge against inflation. The only saving grace was the availability of sizeable foreign exchange reserves of near US $ 300 billion which acted as a safety valve within limits. The worsening CAD and the most recent volatile outflow of funds by the foreign institutional investors for profit-booking led to sharp depreciation in the exchange rate of the rupee. Indian Rupee crossed the Rupees 60 mark per one U.S. dollar in the market in late June 2013. Despite some quick action by the Reserve Bank of India to reduce the volatility of the exchange rate of the rupee having yielded some positive results, it will take some more time and additional policy measures to restore relative stability to the Indian Rupee. The Government of India finally started undertaking corrective action on its ongoing policy paralysis in September 2012. Several steps have been taken since then to effectively reduce the twin deficits and to improve the investment climate, including liberalizing investment rules relating to foreign

Current Developments in the Indian Economy with Special Reference…
37
direct investment and foreign institutional investors.10 The Finance Minister has effectively succeeded in reducing the centre’s fiscal deficit in 2012-13 to 5.1 per cent of GDP compared to the targeted level of 5.3 per cent. He has reiterated his firm commitment to reducing it further to 4.8 per cent level in 2013-14. However, there are serious doubts about achievement of this target given that general elections are due in 2014 and there will be political pressure to increase public expenditure on social welfare schemes. The CAD has fallen to around 5.0 per cent of GDP by June 2013 due to the new policy measures implemented by the Government. However, the journey to restore sustainable higher growth trajectory with macroeconomic stability is going to be longer and arduous. Fiscal policy (along with other policies including distinctly better governance) will have a pivotal role in reaching the destination of this journey. India needs new economic reforms and major changes in governance system to regain its economic strength to achieve its rightful place in the global economy. This major task will have to be left to the next government that would take office at the centre around May 2014.
II
Analysis of Selected Post -2003 issues in India’s Public Finance We now turn our focus to what we consider as the three most important developments in Indian public finances in the last decade. These are: 1. The Fiscal Responsibility and Budget Management (FRBM) Act; 2. The conceptual shift in budget making from “Public Outlays” to “Public
Outcomes”; and 3. The proposed Goods and Services Tax (GST). We present the highlights of these three landmark changes in the following sub-sections.
10 For an updated version of the new policy measures taken by the government to reduce the twin deficits and to rejuvenate the Indian economy, see the website of the Government of India, Ministry of Finance, New Delhi.

Trends and Patterns in Public Finance: Theoretical and Empirical Aspect
38
1. Fiscal Responsibility and Budget Management (FRBM) Act By 2003, the central government had taken serious note of the increasing risks posed by its uncomfortably high fiscal deficit and fast rising revenue deficits during the last few years. In recognition of the urgent need for reducing these fiscal deficits to manageable levels, the Government enacted the Fiscal Responsibility and Budget Management (FRBM) Act in 2003. Based on the recommendations of a Task Force appointed by it for this purpose, the FRBM Act laid down ambitious targets for reduction in fiscal deficit to 3.0 per cent of GDP and the revenue deficit to 0.0 per cent of GDP (its most desirable level) in the next five years.11 The government displayed its firmness in the implementation of the FRBM Act of 2003 during the period 2004-05 to 2007-08. As Table 2 shows, the serious efforts made by the government in implementing this Act yielded encouraging results. The fiscal deficit of the central government was brought down from 4.3 per cent of GDP in 2003-04 to a low of 2.5 per cent of GDP in 2007-08. More impressive was the attainment of reduction in the tougher revenue deficit from 3.5 per cent of GDP in 2003-04 to a low of 1.1 per cent of GDP in 2007-08. This remarkable achievement of the central government in the implementation of the FRBM Act, however, did not last beyond 2007-08. The government had to depart from this path beginning with the year 2008-09 for various reasons. Some of the reasons for departing from this path were driven by compulsions imposed by unfavourable external economic environment. But most of the reasons for departure from this path were based on compulsions of domestic political economy. In order to counter the adverse effects of the global financial crisis that had originated in U.S.A. around September 2008 and spread worldwide, the government (like most governments in the affected countries) launched fiscal stimulus packages to promote growth in the Indian economy. Around the same time, the government decided to substantially raise public expenditure on newly launched major social welfare schemes to promote inclusive growth. Prominent among them were: (i) the National Rural Employment Guarantee Scheme later rechristened as the Mahatma Gandhi National Rural Guarantee Act (MNREGA); and (ii) new schemes for the welfare of the minorities and
11 Government of India, Ministry of Finance, Report of the Task Force on Implementation of the Fiscal Responsibility and Budget Management Act, New Delhi: 2003.

Current Developments in the Indian Economy with Special Reference…
39
backward castes. MNREGA became the flagship program of the UPA-II government and was extended to various states with the cooperation of the concerned state governments. As a result of these new avenues for further public expenditure by the central government, as Table 2 shows, the fiscal deficit to GDP ratio again rose and reached a high of 6.0 per cent in 2008-09 and further to a higher level of 6.5 per cent in 2009-10. The corresponding revenue deficit to GDP ratio rose to a new high of 5.2 per cent in 2009-10. Despite the central government phasing out the fiscal stimulus at the end of 2009-10 (it had helped to reduce the fiscal deficit to GDP ratio to 4.8 per cent in 2010-11), the UPA-II government’s decision to further increase public spending on the social sector schemes raised the fiscal deficit to GDP ratio of the centre to a high of 5.7 per cent in 2011-12 with the corresponding revenue deficit to GDP ratio rising to 4.3 per cent. The falling ratio of tax revenue to GDP made the task of further fiscal consolidation more difficult. As Table 1 shows, the tax revenue to GDP ratio fell from a high of 11.9 per cent in 2007-08 to a low of 9.6 per cent I 2009-10 and could rise to only 10.7 per cent level in 2012-13 (still below the peak achieved in 2007-08.12 In order to improve its image in regard to better expenditure management, the central government proposed two amendments to the FRBM Act while presenting the budget for 2012-13.13 The first amendment introduced a new concept termed as “Effective Revenue Deficit” (ERD). The ERD was to be calculated by excluding grants made for the creation of capital assets. To that extent, the revised calculations would show lower revenue deficit. The calculations of ERD could involve some element of arbitrary “financial engineering”. This can happen as there is no certainty that the grants intended for the creation of capital assets would finally be fully spent for this purpose. The second amendment proposed a new presentation of “Medium Term Expenditure Framework” (MTEF) Statement. The MTEF provided for the innovative concept of rolling targets for expenditure which were intended to impart greater certainty and encourage prioritization of expenditure. This amendment also leaves room for arbitrary decisions by the government. Only future will tell how useful or arbitrary the implementation of these two new amendments will work out to be.
12 Government of India, Economic Survey 2012-13, Table 3.4, p. 61. 13 Ibid, p. 56.

Trends and Patterns in Public Finance: Theoretical and Empirical Aspect
40
The decisive actions taken by the new Finance Minister Mr. P. Chidambaram since September 2012 proved effective in containing fiscal deficit to GDP ratio at 5.1 per cent for 2012-13 (as per Revised Estimates) with corresponding reduction in revenue deficit to GDP at 3.5 per cent (Table 2). The target of fiscal deficit at 4.8 per cent of GDP set for 2013-14 appears to be more difficult to achieve. Since general elections are due in April 2014, the government may decide to substantially raise its expenditure on social welfare schemes (like the proposed big ticket Food Security Bill estimated to cost Rupees 1,25,000 crore). The ruling government is keen to quickly implement this bill through the ordinance route as it is expected to enlarge its vote bank in the elections due in 2014. The current phase of softening of global prices of oil (and other commodities) which weigh heavily on the import bill of India, and the increasing inflows of foreign investment has helped India reduce its high CAD to around 5.0 per cent of GDP by the end of June 20-13. However, the markets consider even this level of CAD (partially reflecting spill -over effect of high fiscal deficit) to be too high. This has led to steep depreciation in the exchange rate of the Indian Rupee during the last week of June 2013. The Reserve Bank of India has very little room for stabilizing the value of the rupee as the foreign exchange reserves are not sufficiently high. The faster depreciation of the Rupee would raise India’s import bill and raise the CAD to that extent and lead to “imported inflation”. This unfavourable development adds to the urgency of better fiscal management for achieving the objectives of growth with stabilization. 2. The shift from “Fiscal Outlays” to “Fiscal Outcomes”: A very major welcome shift in fiscal management was announced by the Union Finance Minister Mr. P. Chidambaram while presenting the budget for 2005-06. This related to the conceptual shift in the process of budget formulation from fiscal “Outlays” to fiscal “Outcomes”. This was to be institutionalized through the preparation of an “Outcomes Budget”. The guidelines for preparing the Outcome Budget by each concerned Ministry were formulated with the help of the Planning Commission. Another welcome feature of this new initiative was the space left by the policy makers of the Outcome Budget for possible participation by the civil society in this exercise. The first “Outcome Budget” was prepared for 2005-06 and presented on August 25, 2005. Outcome budgets are being prepared annually thereafter. The entire process of preparing “Outcome Budgets” is still not well-

Current Developments in the Indian Economy with Special Reference…
41
established through the adoption of standard procedures for this purpose to be followed by the concerned Ministries. Anand P. Gupta has critically examined the available “Outcome Budgets” (OB) and concluded that the “OB has failed”.14 The main reasons provided by Gupta for reaching this conclusion were: (i) No “explicit theory of change” has been put forward by the Government of India for adopting the OB; (ii) The guidelines for preparing outcome budgets providing a conceptual framework and a methodology for measuring performance based on selected parameters “do not go far enough” in ensuring the full achievement of their stated objectives; and (iii) There exist gaps in the “capacity” and the “mindset” reflecting lack of sufficient interest among the concerned bureaucrats in the preparation of the OB to the standards required for unbiased evaluation of the outcomes as compared to the original intentions of the government. Gupta sums up his research findings on this subject as follows: “Outcome budgeting has proved to be a much more different and challenging ballgame to what the GoI thought. It requires a change of mindset that has a lot to do with accountability as it is currently practised in India’s public entities”.15 For similar reasons, especially the aversion of the concerned bureaucrats to get their work critically evaluated, yet another noble initiative recently taken by the Union Ministry of Finance to set up an “Independent Evaluation Office” (IEO) has not succeeded in achieving its objectives. The government has reiterated its commitment to strengthen the IEO by selecting an expert of international repute as its head. The person selected for this top job is expected to assume office soon. 3. The Proposed Goods and Services Tax (GST): The system of indirect taxes in India under our federal structure is still very complex, despite several reforms undertaken in the post 1991 reforms era for moving towards a country-wide value added tax. The central government and the state governments under our Constitution still levy different types of indirect taxes at different rates. As a result, India is still not one single “common market”.
14 Anand P. Gupta, “Evaluation of governance: a study of the Government of India’s Outcome Budge”, Journal of Development Effectiveness, Vol. 2, No. 4, Dec. 2010 (Routledge), p. 571. 15 Ibid, p. 571. GoI stands for “Government of India”.

Trends and Patterns in Public Finance: Theoretical and Empirical Aspect
42
The proposed Goods and Services Tax (GST) is the single most important reform being discussed in the country which is expected to yield enormous potential benefits. It will, when implemented, transform the presently fragmented Indian market with multiplicity of taxes and their cascading effects to a truly functioning single common market. Economists have variously estimated that when fully implemented, the GST reform alone would have the potential to raise the country’s growth rate by 2.0 to 2.5 per cent. The proposal to replace the existing system of indirect taxes by the country-wide uniform “Goods and Services Tax” (GST) has been under discussion for the last seven years. It has been difficult to reach consensus between the central government and the state governments on the final shape of the GST legislation. Despite various amendments proposed by the concerned state governments due to their fears relating to loss of their sovereignty in levying indirect taxes and also about the loss of revenue for which they seek full compensation from the central government, and despite the recent acceptance by the central government of some of the demands of the state governments for providing due compensation, final agreement of the provisions of the GST is still proving to be elusive. Several new issues were raised as late as May 2013 by the representatives of various state governments for fresh study and satisfactory resolution acceptable to all concerned governments.16 Meanwhile, due to fast changing political developments in ruling coalition government in Bihar, the Chairman of the Committee of State Finance Ministers, Mr. Sushil Kumar Modi, the then Finance Minister and Deputy Chief Minister of Bihar has resigned from the said Committee in June 2013.. There appears to be very little chance of getting agreement among the state governments and the central government before a new government at the centre takes office after the general elections due around April 2014.
Concluding Remarks: Reforms in India’s public finance system have been an ongoing process in the post 1991 era of economic reforms. Several notable reforms have been undertaken in all areas of public finance, including direct and indirect taxes, public expenditure, and public debt management which are selectively highlighted in this paper. Yet, as stated above, the major structural problems confronting the fiscal authority have not yet been satisfactorily resolved. The
16 As reported in the Indian Express (New Delhi edition), May 20, 2013.

Current Developments in the Indian Economy with Special Reference…
43
quality of fiscal marksmanship for ensuring a sound system of public finances in India seen so far leaves much to be desired. The re-emergence of the twin deficits, the fiscal deficit and the current account deficit since 2011-12 at unsustainably high levels (with the CAD ringing shriller alarm bells) to sustainable levels are an indicator of the unsatisfactory quality of both fiscal marksmanship and macro-economic management. The present government has been taking several corrective measures since September 2012 for reducing the twin deficits and has achieved some degree of success on both these fronts by June 2013. However, the measures adopted so far have addressed only the short-term issues. They do not go far enough to rectify the longer term root causes of the twin crises with concomitant high rates of inflation. The policy decisions requiring longer term economic reforms both in fiscal and other national economic policies will have to be left to the next elected central government in 2014. References 1. Acharya, Shankar, India’s Economy: Some Issues and Answers, New Delhi:
Academic Foundation, 2003.
2. Acharya, Shankar, and Rakesh Mohan (eds.), India’s Economy: Performance and Challenges: Essays in Honour of Montek Singh Ahluwalia, New Delhi: Oxford University Press, 2010.
3. Government of India, Ministry of Finance, Report of the Task Force on the Implementation of the Fiscal Responsibility and Budget Management Act, New Delhi: 2003.
4. Government of India, Ministry of Finance, Economic Survey 2012-13, New Delhi: February 2013.
5. Government of India, Planning Commission, The Eleventh Five Year Plan, New Delhi: 2007.
6. Gupta, Anand P., “Evaluation of governance: a study of the Government of India’s Outcome Budget”, Journal of Development Effectiveness, Vol. 2, No. 4, Dec. 2010 (pp. 566-73).
7. International Monetary Fund, World Economic Outlook, January 2013, Washington D.C., 2013.
8. Panagariya, Arvind, India: The Emerging Giant, New York: Oxford University Press, 2008.

Trends and Patterns in Public Finance: Theoretical and Empirical Aspect
44
9. Wadhva, Charan D., Economic Reforms in India and the Market Economy: Interface with the States, Bureaucracy, Business and Society, New Delhi: Allied Publishers, 1994.

Does Public Debt Affect Real Effective Exchange Rate in India?
Saibal Kar∗
1. Introduction Time to time, interventions from the government have come in the form of monetary and fiscal policies – the two instruments that continue to be the mainstay of macroeconomic policies anywhere. The recent economic crisis too has witnessed a strong reaction of monetary and fiscal policies to support the fledgling North American and the European economies, despite the fact that there are certain fundamental differences in the nature of the crisis that happened before and the one that de-stabilized a large number of countries globally. As a consequence of the current crisis, the nominal interest rate in many developed countries reached historically low levels. Unconventional monetary policy measures were implemented, together with large fiscal stimulus packages causing a worsening of the fiscal imbalances. A legacy of the crisis so far has been large deficits and major increases in government debt levels across the world. A critical survey is available in Woodford (2011) where several interactions between monetary and fiscal policies are discussed in detail. A question that, however, received rather little attention even during this crisis, is the impact of growing public debt on the real exchange rates of a country vis-à-vis US dollar, or any other major currency as the case may be. This short paper attempts to provide an account of this interaction for the Indian economy over the last three decades. In this regard, we provide a number of other covariates that could also potentially explain the relationship over time. We show that public debt, defined as a sum of the internal debt and the external debt of a country contributes significantly to a falling rupee vis-à-vis US dollar. In other words, the depreciation of the Indian currency could be meaningfully related to the rising debt burden of the central government.
∗ Centre for Studies in Social Science, Calcutta and, Institute for the Study of Labor (IZA), Bonn Email:[email protected] Acknowledgements: Thanks are due to Meghna Dutta for excellent research assistance . The usual disclaimer applies.

Trends and Patterns in Public Finance: Theoretical and Empirical Aspect
46
Analytically speaking, the relationship between public debt and most other macroeconomic variables of interest is driven by the well-known Ricardian Equivalence principle. In the standard textbook way, we define ‘Ricardian Equivalence’ by changes in government debt, which will have no real effects on the economy, when accompanied by changes in lump-sum taxation. This suggests that in typical overlapping generations structures of macroeconomics, prevalence of Ricardian Equivalence Principle (hence, REP) leaves no effect on the real variables. The doctrine of REP has been popularized by the writers of the so-called 'new-classical' school, which states that the government's decision to reduce taxes and finance planned expenditures by issuing bonds should induce economic agents to save more. The taxpayers tend to save the entire amount equivalent to the value of the bond as well as the interest accumulated, as they foresee an increase in future taxes that would be required to retire the bond. This leaves the agents' consumption path unaltered1. In other words, if individuals plan to leave positive bequests to the next generation, then they are already at an interior optimum choosing between their present consumption and that of their descendents, which ultimately leaves their consumption path unchanged.
It is well known that this contradicts earlier conjecture, whereby the existence of budget deficits and bond-led deficit financing increases consumption and growth – the US example during the 1980s being particularly appealing. Therefore, it has remained a rather interesting question for some time, whether the principle of the Ricardian Equivalence holds at all, or perhaps more suitably as Romer (1996, p. 67) puts it, "the relevant question, however, is not whether it is exactly correct, but whether there are large departures from it".
The empirical validity of the REP as noted by Ricciuti (2003), depends heavily on the framework chosen for the analysis, such that, it is often rejected when a life-cycle framework is used while optimizing models generally validate the hypothesis.2 Nevertheless, the empirical validity of the REP has been widely investigated in the literature. These include studies by Kormendi (1983), Evans (1988) and Koray and Hill (1988) for USA, Koray and McMillin (1987) for Canada and a survey by Seater (1987), generally showing the prevalence of the REP. On the other hand, a household survey 1 See Barro (1974, 1976), Buchanan (1976), etc. 2 However, Dow (1994) argues against the REP (emphasizing a positive relationship between government debt and interest rate) even in an optimizing framework model, which contradicts the general conclusions drawn by Ricciuti (2003).

Does Public Debt Affect Real Effective Exchange Rate in India?
47
by Mukhopadhyay (1994, for households at Halifax in Canada), Reid (2004, for ten Canadian provinces over the years 1964 -1983) and more generally Akbostanci and Tunc (2002, for Canada as a whole) find evidence against the REP. Apart from these, Giorgini and Holden (2001, for Israel, Italy, Korea, Singapore, Tanzania, and UK), Kelly and Marvotas (2003, for Sri Lanka and 17 African countries), Johnson (1986) also found the non-existence of the REP. Such country-specific studies have even used cultural factors in determining whether REP holds for a particular country, as in Khan (1995), which finds the REP to hold for Japan but not for the United States. While a large body of literature engages itself with these questions, the impact on real Effective Exchange rate remains unanswered. We offer, as already discussed above, a brief review of the possible relation between these two variables. It is expected that if nothing alters in the real economy due to the presence of behavior central to the argument of REP, then consumption, at least, import, should not change either. One therefore, does not expect to see much impact of a change in the balance of trade on the real exchange rate when the public debt is also high.3 However, there can be a number of other factors, such as, the gross savings rate, the foreign exchange reserve, and the incremental capital-output ratio. Of course, there may be other important variables, which link the volume of public debt to the real effective exchange rate via complex macroeconomic interactions, but we presently put them aside to get a preliminary idea on the subject for India.
The rest of the paper is organized as follows: In section 2, I offer a broad overview of the current macroeconomic condition of India with special focus on the issue of public debt and the transmission patterns of the global economic and financial crisis. While I also discuss some of the internal policy choices and measures adopted in this section, the focus of the study is still on the interactions between public debt and real exchange rate, which is dealt with in section 3. Section 4 concludes with further discussion on the subject.
2. Economic Crisis, Public Debt and India – A Broad Overview In the post world war decades overshadowed by a long spell of cold war, most countries were essentially circumspect about action taken by other countries. However, once the IT revolution and the slow but unmistakable 3 We do not offer interaction terms in this exercise for the time being, but wish to entertain these in future.

Trends and Patterns in Public Finance: Theoretical and Empirical Aspect
48
wave of globalization swept across the nations from early 1980s on, it became quite impossible to insulate individual countries from various changes that followed considerable homogenization of economic and social conditions. This undoubtedly has had both favorable and adverse implications for countries all around and, in general, interactions between most countries would be increasingly difficult to strategize under the circumstances. There are too many independent players with incentives and disincentives nested in a complex mesh of activities. Available evidence suggests that countries that have so far fended off adverse impacts of globalization may not have done so by virtue of pre-meditated domestic planning, but may have benefited from the presence of many other idiosyncratic factors that could well generate other forms of crises at a different point in time. This situation is distinctly different from that in much more conservative, self-reliant, closed-door, non-integrated countries of yesteryears, which interacted with others mainly via international trade in commodities and through international political relations. However, since 2008, as even the most liberal of economists would agree, there has been a relentless supply of crises globally and that it has significantly outweighed the positive impacts of globalization. It is undoubtedly important to check five years hence, whether the end of the dark tunnel is at all visible or not, despite the fact that many countries that have suffered collateral damage in the blazing wildfire will not have the instruments to contain it independently. The damages caused by these crises meant huge loss of economic resources and activities. As the crisis took significant proportions it led to unemployment as high as 25% in many developed countries and lower growth and redistribution significantly. India, fortunately, has not been seriously affected by the ongoing crisis although very recently the macroeconomic calculations had to be readjusted to a growth rate of 5.6%, the lowest in a decade. This is, not surprisingly, blamed on the so-called Euro-zone crisis.
The newest in the series of crises is the European debt crisis. It represents Europe’s struggle to pay the debts it has built up in recent decades. Five of the region’s countries – Greece, Portugal, Ireland, Italy, and Spain – have, to varying degrees, failed to generate enough economic growth to make their ability to pay back bondholders the guarantee that publicly issued bonds directly carry. The five countries were seen as being the countries in imminent danger of a possible default. But surely, the global integration does not allow individual countries to operate in isolation any longer. Thus, the crisis has far-reaching consequences that extend beyond their borders to the

Does Public Debt Affect Real Effective Exchange Rate in India?
49
world as a whole. In fact, in October 2011, the head of the Bank of England referred to it as “the most serious financial crisis at least since the 1930s, if not ever.” Under the circumstances, it is probably important to enquire if India would be able to avoid spillover effects of this crisis completely. We will discuss some of the opinions and predictions of the highest authorities in the country on this issue preceded by a brief description of what constitutes the core of the crisis in Europe. The present discussion motivates the core question in this paper: Is there a connection between high public debt and the real exchange rate, which in turn may affect various economic activities internally and aggravate a situation of recession?
The Financial Crisis and Public Debt
The global economy has experienced slow growth since the U.S. financial crisis of 2008-2009, which has exposed the unsustainable fiscal policies of countries in Europe and around the globe. Greece, which spent extravagantly for years and failed to undertake fiscal reforms, was one of the first to feel the burden of weak economic growth. When growth slows down, the tax revenue falls, and the budget deficit soars to the extent that it pushes the entire economy to unstable water. In this regard, one must not forget that the macroeconomic condition of Greece, which is now part of a complex Monetary Union, depends heavily on the policies and advices of the European Central Bank. However, despite centralized monitoring authorities, the impact unavoidably spreads to other members, via capital and labor mobility, either afresh or that that has already been deployed. Whether by falsification of national accounts or by compulsion of generous re-distributive practices common in Europe, Greece’s debts were larger than the size of the nation’s entire economy, and the country could no longer hide the problem. Investors responded by demanding higher yields on Greece’s bonds, which raised the cost of the country’s debt burden and necessitated a series of bailouts by the European Union and European Central Bank (ECB). The markets also began driving up bond yields in the other heavily indebted countries in the region, anticipating problems similar to what occurred in Greece. As investors contemplate that the debtor could soon become insolvent (with some possibility that they might also bounce back to normalcy), the investments are driven into high-risk zones and must require high compensation. If the indebted countries turn around, then the investors make huge returns, but in case the countries falter the entire system takes a nosedive along with the investors – leading to a global crisis.
Characteristically speaking, this is somewhat different from the burst of the

Trends and Patterns in Public Finance: Theoretical and Empirical Aspect
50
real estate bubble. For example, Michele Boldrin of the University of Washington and the Federal Reserve Bank, St. Louis, USA comments that in the real estate crisis the transfer of monitoring responsibility from the public authorities to individual private banks was at the root of the crisis. The imprudent private banking system in the US as a whole failed miserably in checking the credentials of the borrowers and pushed loans where it did not belong in the first place. The real estate market was destined to suffer because people borrowed much more than they could ever pay back. In addition, financial engineering by big lenders such as Fannie Mae or Lehman Brothers spread the risk of holding unstable mortgages to many other subsidiaries and financial institutions globally. On a good state of nature, this financial jugglery to raise quick capital and continue with production and service in seamless manners could generate fortunes. On a bad spell of events, it leads to a global crisis where millions lose jobs and homes and wait for the governments to pull them out of misery.
Compared to the housing crisis, the European crisis is much bigger. This has to do with national governments of five different countries that acted much more irresponsibly despite the presence of a supra-national authority, the European Union. The major reason for the lack of monitoring, it is argued, lies in the lack of fiscal coordination between EU member countries. EU is after all a monetary and currency union with fiscal decisions still controlled exclusively by individual countries with intermittent cautions from the ECB to retain the fiscal deficit within manageable limits, such as 3-4% of the country’s GDP. The lack of fiscal prudence on the part of five major countries led to a vicious cycle. As country risks of investment go up, institutional and individual investors in publicly issued bonds demand higher yields and this translated into higher borrowing costs for the country in crisis. To meet debt servicing, the countries will need to borrow again in a short while and the entire mechanism may blow up within a visible time frame. Worse still, the effect of high borrowing cost by countries in distress will spill over as a contagion effect to other countries that are also in need of external and internal borrowing. So far, it is still about excessive public borrowing and the policies must, therefore, address the issue of optimal public borrowing at length.
Combating the Crisis in Europe
The European Union has taken action, but it has moved slowly since it requires the consent of all nations in the union. The primary course of action thus far has been a series of bailouts for Europe’s troubled economies. In

Does Public Debt Affect Real Effective Exchange Rate in India?
51
spring, 2010, the European Union and International Monetary Fund disbursed 110 billion euros (the equivalent of US$163 billion) to Greece. Greece required a second bailout in mid-2011, this time worth about $157 billion. On March 9, 2012, Greece and its creditors agreed to a debt restructuring that set the stage for another round of bailout funds. Ireland and Portugal also received bailouts, in November 2010 and May 2011, respectively. The Euro-zone member states also created the European Financial Stability Facility (EFSF) to provide emergency lending to countries in financial difficulty.
The European Central Bank had to be involved in the process simultaneously. It is expected in most such situations that the Central bank of a country, in this case the ECB for the whole of Europe, consented in purchasing government bonds via an announcement made in August 2011. In other words, it is still the backdoor policy to sustain fiscal stability of a region and bailout the worst hit countries by pledging guarantee and support on behalf of individual institutional and other investors. This may be a way out in the short-run, but does not guarantee that the countries will be normalized soon given that the debt-to-GDP ratio for these countries is more than 100%. In December 2011, the ECB made €489 ($639 billion) in credit available to the region’s troubled banks at ultra-low rates, then followed with a second round in February 2012. The name for this program was the Long Term Refinancing Operation, or LTRO. Numerous financial institutions had debt maturing in 2012, causing them to hold on to their reserves rather than extend loans. Slower loan growth, in turn, could weigh on economic growth and make the crisis worse. As a result, the ECB sought to boost the banks' balance sheets to help forestall this potential problem. The problems are manifold with such short-term approaches, typically, because these do not provide directions for turnaround, and there is no optimal bailout rule as yet established for countries varying in size significantly. Nevertheless, in 2012, President of the ECB Mr. Mario Draghi announced that the ECB would do "whatever it takes" to keep the Euro-zone together. In the same way as favorable budgetary announcements turn around the drooping share markets from time to time, the bond market also reacted favorably and investors started settling for lower yields during the second half of the year. While Mr. Draghi's statement did not solve the problem, it made investors more comfortable buying bonds of the region’s smaller nations. Lower yields, in turn, have bought time for the high-debt countries to address their broader issues. Unless the country really turns around based on such favorable investment climate, the central bank holding a large part of the country’s debt

Trends and Patterns in Public Finance: Theoretical and Empirical Aspect
52
will plunge in turn. Banks are required to keep a certain amount of assets on their balance sheets relative to the amount of debt they hold. If a country defaults on its debt, the value of its bonds will plunge. For banks, this could mean a sharp reduction in the amount of assets on their balance sheet – and possible insolvency. Due to the growing interconnectedness of the global financial system, a bank failure doesn’t happen in a vacuum. Instead, there is the possibility that a series of bank failures will spiral into a more destructive “contagion” or “domino effect.”
The tension created the possibility that one or more European countries would eventually abandon the euro (the region’s common currency). On the one hand, leaving the euro would allow a country to pursue its own independent policy rather than being subject to the common policy for the 17 nations using one currency. But on the other hand, it would be an event of unprecedented magnitude for the global economy and financial markets. This concern contributed to periodic weakness in the euro relative to other major global currencies during the crisis period. There is some indication that public debt, and huge debts, could systematically destabilize the currency and lead to a fall in its value vis-à-vis other important currencies.
What is to be expected for India?
The economic advisory wing of the Government of India notes that the Euro-zone crisis has been moving from one peripheral economy to the next, and more recently, has begun affecting the core economies in the Euro-zone. The EU accounts for close to 26 per cent of the world GDP (at market exchange rates) and the euro zone 19.4 per cent. The Euro area accounts for about 10 per cent of the global equity markets turnover and the euro accounts for 26 percent of the allocated global holding of reserves. Thus the significance of this crisis is not merely that it comes in the aftermath of the global crisis, but more importantly, it threatens the pace of recovery of the global economy especially because the EU and within that, the Euro zone is a significant market for the rest of the world.
In its “spillover” report on the effects of euro zone policies on other major economies, the IMF observed that an intensification of the euro area debt crisis, especially if stress were to spread to the core economies could have major global consequences. In particular, if the Euro area core economies were to be affected, banks throughout the euro zone immediately require more and higher quality capital. While capital raising and re-capitalizing bank is needed, the report observes that in the short run, this may lead to contraction of country-wise GDP and growth. It is inevitable that the

Does Public Debt Affect Real Effective Exchange Rate in India?
53
developed countries still reeling from the US Financial crisis, except a few OECD countries such as Canada, will share the greater burden of another crisis of the type discussed so far. However, the developing giants such as India and China would not be totally exempt for straightforward reasons. For both China and India, Europe and the Euro zone is the destination of a large share of exportable goods and services. India, in particular, suffered a drop of 25% in the last quarter, for some of the services it has been exporting to Europe and USA. The European Union alone accounts for as much as 20.2 per cent of India’s exports (in 2009-10) and 13.3 per cent of India’s imports. European Union countries imported roughly € 33.1 billion worth of Agriculture products, Fuel and mining products, machinery and transport equipment, chemicals, semi manufactured products textile and clothing products were exported from India in 2010. The EU exports to India amounted to €34.8 billion, majority of which comprised machinery, chemical products and semi manufactured items, contributing almost 2.6 percent of EU exports. Bilateral trade between the two has been growing on an average of 9.6 per cent during 2006-10. EU services exports to India during 2010 were to the tune of €9.8 billion and EU imports from India was €8.1 billion. That apart, the total FDI from EU during 2010 amounted to €3 billion while India also invested about €0.6 billion in the EU. All these statistics taken together offer a clear picture of how interconnected these markets are, and how much they could have grown in a few more years. This is undoubtedly threatened by the crisis and will take quite long to recuperate and get back on the observed growth path. This is not in sight at present. Since a slowdown in the Euro zone is likely to have a major adverse impact on India’s exports, India probably needs to look for markets elsewhere, although it is reasonable to assume that close replacements may be distant and infeasible. China, on the other hand, seems to be on the negotiating table with better bargaining terms simply because they retain large portions of the US treasury bills and other countrys’ sovereign debts. While this raises more fundamental questions about the criticality of financial trading with a country’s sovereign debt, it now seems sure, the situation will not get reversed within a reasonable time.
Apart from the bilateral and multilateral trade relations that India enjoys with the European countries, the financial inter-linkages between the countries are now under serious trouble. The global financial crisis directly bears testimony to the fact that the bank and non-bank financial systems played a crucial role in transmitting the crisis from the advanced economies to various parts of the world, including the emerging markets. In this regard, there is also an ongoing debate on how the foreign banks should operate in

Trends and Patterns in Public Finance: Theoretical and Empirical Aspect
54
developing and transition countries so that they do not easily transmit recession from the developed sources. Overall, therefore, it is expected that while India may not be severely hit by the crisis, it cannot completely bypass the negative effects of global slump, and should, therefore, re-consider its internal adjustments much more seriously than it is undertaking at this point. The following section provides a brief econometric exercise to comprehend much of the discussion above. Here, we investigate how the extent of the Public Debt in India determines the real effective exchange rate. In future, we wish to extend this to bilateral factors with a greater promise to explain the question at hand.
3. Public Debt and the Real Effective Exchange Rate in India This section begins by offering an analysis of the relationship between the Real Effective Exchange Rate and the Public Debt in India between 1980 and 2011, which includes the crisis years. Although we do not engage in the calculations of structural breaks, we presume that such breaks might exist in the post-1991 period. Nevertheless, it seems that one could conduct an analysis of the correlation between these two variables by using the well-known Hodrick-Prescott filter that allows a series to be de-trended for each time period, decomposing a series into the trend values as distinct from its cycles.
In further details, for studying the relations between public debt and real effective exchange rate, we identify fluctuations around trend for each data series by separating the trend of the series (or by de-trending) from the cyclical components through the Hodrick and Prescott (1980) filter (hereafter, the HP filter). For any given series , the HP filter separates the trend (growth) component, , of the series from the cyclical component, by minimizing the following loss function:
(1)
where, is known as a penalty parameter.
Thus, once the cyclical components of REER and Public Debt series are obtained from the solution of the optimization problem above, the contemporaneous correlations between these two series can be calculated. A positive (negative) contemporaneous correlation is taken to imply that the
ty
tτ tc
[ ]2
1
1
211
2 )()()(∑ ∑=
−
=−− −−−+−
T
t
T
ttttttt
gyMin
t
ττττλτ
λ
tc

Does Public Debt Affect Real Effective Exchange Rate in India?
55
REER is pro-cyclical (counter-cyclical) with the Public Debt series in India. In general, a variable is said to be pro-cyclical (counter-cyclical) with the movement of the cyclical component of the other variable, if the contemporaneous cross- correlation (cross correlation at time t=0) is positive (negative) in the statistically significant sense (Kydland and Prescott, 1990; Pallage and Robe, 2001; Alper, 2002). Pro-cyclicality (counter-cyclicality) in this context indicates the tendency of REER to move above trend, when the corresponding Public Debt variable is above (below) its respective trend.
Accordingly, using the HP filter on the REER and Public Debt for India and applying the penalty parameter =100 (suggested by HP for annual data; for quarterly data, =1600 is the standard choice), we isolate the trend from the cycles. The fluctuations around the trend for REER and Public Debt are shown in figures 1 and 2, respectively. Note again, that the test of pro-cyclicality or counter-cyclicality is in obtaining the correlation between the cyclical components of the variables and not the trends.
To evaluate the statistical significance of the correlation coefficients, the null hypothesis that the unknown population correlation, is equal to zero was tested against the two-sided alternative that , using the correlation coefficient r calculated from the relevant sample made up of 32 observations covering years 1980 to 2011. In deciding whether to reject or not to reject the null hypothesis, the critical t-value is determined according
to, , where n is the number of observations in each sample.
For our study on REER and public debt, with n=32 and using 99% confidence interval, the acceptable r is given by This amounts to
or, .
Note, however that the observed and lies outside the permissible range at 99% confidence interval. Therefore, the null hypothesis is safely rejected at 99%.
Similarly, at the 95% level of confidence with t=1.684 for n=32, . Clearly, the mandated value of the correlation coefficient
at 95% confidence interval should fall within the range [-0.293, +0.293]. Once again, since falls outside this range, we reject the null hypothesis safely. Both these exercises mean that there is non-zero, and in
λλ
ρ0: ≠ρAH
21
2
r
nrt
−−
=
.21
22
2
t
n
r
r −=
−
22
2
423.2
301=
−r
r 404.02 ±=r
778.0=r
293.02 ±=r
778.0=r

Trends and Patterns in Public Finance: Theoretical and Empirical Aspect
56
our case positive, correlation between the REER and Public Debt for India between 1980 and 2011. Moreover, the positive and statistically significant relation suggests that the relation is pro-cyclical – a rise in Public Debt raises REER. The reverse causality is intuitively not very appealing since it is unlikely that a rise in REER would influence governments to borrow more from domestic and foreign sources. For India, Table 1 (appendix) clearly shows that the share of internal borrowing is much larger, and on average approximately 75% of the total debt burden of the country. The REER is defined as the weighted average of a country's currency relative to an index or basket of other major currencies adjusted for the effects of inflation. The weights are determined by comparing the relative trade balances, in terms of one country's currency, with every other country within the index. In Table 1 REER increases steadily over time, meaning a fall in the value of INR against US$ and the basket of major currencies. Thus, the depreciation of INR is unlikely to cause a rise in fiscal deficit, unless it is outweighed by rise in oil subsidy, petroleum being the largest import component for India. The non-petroleum current account balance, at least, must respond negatively to rise in REER, meaning that more exports and less of imports should ideally improve the trade balance. Therefore, the reverse causality is unlikely in this case. The following proposition is based on what has been discussed above.
Proposition 1: REERt and Public Debtt for India were pro-cyclical between 1980 and 2011, with both cycles lying below the respective trend lines.

Does Public Debt Affect Real Effective Exchange Rate in India?
57
Figure 1. Total Debt of the Centre
Figure 2. Real Effective Exchange Rate
Source: Reserve Bank of India, Handbook of Statistics on the India Economy, various issues.
-2,000
-1,000
0
1,000
2,000
3,000
4,000
0
10,000
20,000
30,000
40,000
80 82 84 86 88 90 92 94 96 98 00 02 04 06 08 10
Total Debt_CenterTrendCycle
Hodrick-Prescott Filter (lambda=100)
-6
-4
-2
0
2
4
0
10
20
30
40
50
80 82 84 86 88 90 92 94 96 98 00 02 04 06 08 10
RE E R Trend Cy c le
Hodrick-Prescott Filter (lambda=100)

Trends
Next, wof impdecadeGoldfaj
where,Exchan
PD = PICOR Savingfollows
ICOR: of invecapitalwhich c
Foreignthe cecurrenccurrenc
Trade value opositiveof expoas a tra
Now, exercisappenddescribwhen saffect tthe riseHowevsugges
REER
s and Patterns
we develop a rportance as hes (see, for jn, 1995; Lin,
α = Constantnge Rate;
Public Debt; T= Incrementa
gs in the Econs:
The Incremstment to grow. ICOR therecapital is used
n Exchange Rentral bank acies. Holdingcy stable and
Balance: Baof exports ande balance of torts is higher tade deficit or a
using equatiose by r retainindix provides bed above. Tasavings rate ithe REER poe in public de
ver, the foreisting that a
PDR βα += 1
s in Public Fin
regression equhighlighted in
example, As1994, etc).
t; β = Paramet
TB = Trade Baal Capital Onomy. Of thes
mental Capitawth. The higheefore, is consd.
Reserves: Foreand monetary g such reservreduce the eff
lance of traded imports in anrade is knownthan that of ima trade gap.
on (2), we cong and or droa descriptive
able 3 provides excluded, thsitively and sbt and the traign exchangegreater stock
TBD ββ ++ 2
nance: Theore
58
uation to examthe relevant
scari and Ra
ters; ε = Error
alance; FER =utput Ratio; se, the follow
al-Output Rer the ICOR, tsidered a me
eign exchangeauthorities,
ves allow govefect of econom
e is the differn economy ovn as a trade su
mports; a negat
onduct an Opping some o
e statistics ofes a regressiohe public debignificantly (at
ade balance lee reserve affk of foreign
IFER ββ + 43
tical and Emp
mine if PD andliterature ov
ankin, 2013;
r term; REER
= Foreign ExcSavings = G
wing variables
Ratio (ICOR) the lower is thasure of the
e reserves areusually in d
ernments to kemic shocks.
rence betweever a certain purplus and occtive balance o
rdinary Leastf the variablesf the variable
on analysis, wt and the tradt 1% level). T
eads to currenfects the REexchange re
SaICOR β+ 5
pirical Aspect
d other variabler the last twEscude, 200
(2
= Real Effecti
change ReservGross Domes
are defined
is the rahe productivity
inefficiency w
e assets held different resereep the hom
en the monetaperiod of time.curs when val
of trade is know
t Square (OLs. Table 2 in tes defined a
which shows thde balance boThis implies thcy depreciatio
EER negativeeserve leads
iavings ε+
es wo 02;
2)
ve
ve; stic as
tio of
with
by rve me
ary A ue wn
LS) he nd
hat oth hat on. ely,
to

Does Public Debt Affect Real Effective Exchange Rate in India?
59
appreciation of the currency or at least stabilizes with 5% confidence level, statistically speaking. These are also the expected signs for such variables. The ICOR, although positive is non-significant.
In table 4, we show that dropping the foreign exchange variable does not appreciably change the impact of ICOR on the REER, suggesting that the growth of investment in the presence of large public debt and negative trade balances do not lead to appreciation of the domestic currency. The public debt and the trade balance, nevertheless continue to be positive and significant at 1% level of confidence.
Proposition 2: The public debt and the trade balance of a country are important determinants of the direction the REER takes over time. Rise in both variables lead to depreciation of the domestic currency.
4. Concluding Remarks
The preliminary set of results offered in this paper is an attempt to understand the relationship between the level of public debt in a country and the real effective exchange rate observed by the same. Available evidence in this regard is scant and therefore needs deeper investigation in the matter at length. In order to motivate the research question, we covered a large ground where the state of the financial crisis in Europe and its implications for India, with special emphasis on the level of public debt endured over time, has been discussed in detail. It was supplemented by a study of the cyclical behavior of public debt vis-à-vis real effective exchange rate for India between 1980 and 2011. The results showed that the two series are pro-cyclical, although both lie below the trend lines for the respective series. Further, we conducted a simple regression analysis to estimate if public debt and the trade balance of India along with the incremental capital-output ratio have significant impact on the real effective exchange rate. We observed that while the gross savings rate do not affect the REER significantly the two main determinants, namely, the trade balance and the public debt both cause currency depreciation. The current research leaves out many other intricate and interesting questions in this subject to be taken up in future attempts.
References Akbostanci, E. and G. I. Tunc (2002), Turkish Twin Deficits: An Error Correction Model of Trade Balance, ERC Working Papers in Economics 01/06, Economic Research Centre, Middle East Technical University, Ankara: Turkey.

Trends and Patterns in Public Finance: Theoretical and Empirical Aspect
60
Ascari, G and N. Rankin (2013), The effectiveness of government debt for demand management: Sensitivity to monetary policy rules, Journal of Economic Dynamics & Control, Article in Press. Barro, Robert J. (1974), Are Government Bonds Net Wealth?, Journal of Political Economy, 82, 1095-1117. - (1976), Reply to Feldstein and Buchanan, Journal of Political Economy, 84, 343-49. Buchanan, James M. (1976). Barro on the Ricardian Equivalence Theorem, Journal of Political Economy, 84, 337-42. Dow, J. P. Jr. (1994), Rates of Return and the supply of Government Assets, Journal of Macroeconomics, 16, 2, 281-93. Escudé, G. J. (2002), Lessons from Argentina’s recent experience: The mirage of Convertibility, unpublished paper presented to the XVI Meeting of the Latin American Network of Central Banks and Finance Ministries, April 16 and 17, 2002, Inter-American Development Bank, Washington D.C. Evans, P. (1988), Are Consumers Ricardian? Evidence for the United States, Journal of Political Economy, 96, 983-1004. Giorgini, G. and K. Holden (2001), Some Further International Evidence on Ricardian Equivalence: A VECM Approach, University of Arbertay Dundee, School of Social and Health Sciences, Division of Economics, Dundee: UK. --- (2003), Does the Ricardian Equivalence Proposition Hold in Less Developed Countries? International Review of Applied Economic, 17, 2, 209-21. Goldfajn, Ian (1995), On Public Debt and Exchange Rate, PhD Dissertation, MIT. Johnson, D. (1986), Are Government Bonds Net Wealth? Intertemporal Optimization and the Government Budget Constraint, Journal of Macroeconomics, 8, 4, 435-53. Kelly, R. and Marvotas, George (2003), Savings and Financial Sector Development: A Pane Cointegration Evidence from Africa, Working Paper No. 2003/12, United Nations University, WIDER: Finland. ---- (2003), Financial Sector Development – Futile or Fruitful? An Examination of the Determinants of Savings in Sri Lanka, Working Paper No. 2003/14, United Nations University, WIDER: Finland.

Does Public Debt Affect Real Effective Exchange Rate in India?
61
Khalid, A. M. (1996), Ricardian Equivalence: Empirical Evidence from Developing Economies, Journal of Development Economics, 51, 413-32. Khan, Mohabbat (1995), National Deficit: A View from Two Different Culture. A Case Study of Japan and the United States, Rivista Internazionale di Scienz Economiche e Commerciali, 32, 12, 929-43. Koray, F. and R. C. Hill (1988), Money, debt, and Economic Activity, Journal of Macroeconomics, 10, 3, 351-70. Koray, F. and W. D. McMillin (1987), The Ricardian Equivalence Hypothesis, Some Canadian Evidence, Economics Letters, 25, 1, 15-19. Kormendi, R. C. (1983), Government Debt, Government Spending, and Private Sector Behaviour, American Economic Review, 73, 994-1010. Lin, S (1994), Government Debt and the Real Exchange Rate in an Overlapping Generations Model, Journal of Economic Integration, 9, 1, 94-105. Mahambare, V. and V. N. Balasubramanyam (2000), Liberalisation and Savings in Developing Countries: The Case of India, Lancaster Management School Working Paper 2000/004, Lancaster: UK. Marjit, Sugata, Das, Pranab K. and Chattopadhyay, Siddhartha, (2004), Cotemporary Macroeconomic Events of India: Some Analytical Discussion, in S. Marjit (ed.) India Macroeconomics Annual – 2003-04, Centre for Studies in Social Sciences, Calcutta, India. Modigilani, Franco and A. Sterling (1990), Government Debt, Government Borrowing, and Private Sector Behaviour: A Further Comment, American Economic Review, 80, 600-03. Mukhopadhyay, A. K. (1994), Are Haligonians Ricardian? A Survey of the Households' Saving Response to the Government's Budget Deficits, Journal of Socio-Economics, 23, 4, 457-77. Reid, B. G. (2004), Government Budgets and Aggregate Consumption: Cross-sectional Evidence from Canadian Provincial Data, Journal of Macroeconomics, 11, 1, 121-32. Ricciuti, R. (2003), Assessing Ricardian Equivalence, Journal of Economic Surveys, 17, 1, 55-78. Romer, David, (1996), Advanced Macroeconomics, New York: McGraw Hill. Seater, J. J. (1987), Ricardian Equivalence, Journal of Economic Literature, 31, 142-90.

Trends and Patterns in Public Finance: Theoretical and Empirical Aspect
62
Woodford, M (2011), Simple analytics of the government expenditure multiplier, American Economic Journal: Macroeconomics, 3, 1, 1–35.
Appendix Table 1: Description of REER and Public Debt at the all-India Level
(in Rs. Billion) Year REER Internal
Debt of Centre
External Liabilities of Centre
Total Debt of Centre
Internal Debt/Total Debt (%)
1980 7.8629 308.64 134.79 443.43 69.60286855 1981 8.6585 356.53 175.77 532.3 66.9791471 1982 9.4551 469.39 202.14 671.53 69.89858979 1983 10.099 502.63 240.04 742.67 67.67878062 1984 11.363 585.37 266.38 851.75 68.72556501 1985 12.369 710.39 323.12 1033.51 68.73566777 1986 12.611 863.12 365.78 1228.9 70.23516966 1987 12.962 986.46 468.38 1454.84 67.80539441 1988 13.917 1144.98 541 1685.98 67.91183763 1989 16.226 1331.93 660.17 1992.1 66.86059937 1990 17.504 1540.04 663.14 2203.18 69.90077978 1991 22.742 1727.5 1096.77 2824.27 61.16624827 1992 25.918 1991 1209.79 3200.79 62.20339354 1993 30.493 2457.12 1277.98 3735.1 65.78458408 1994 31.374 2664.67 1425.14 4089.81 65.15388245 1995 32.427 3078.69 1483.98 4562.67 67.47562283 1996 35.433 3444.76 1495.64 4940.4 69.72633795 1997 36.313 3889.98 1614.18 5504.16 70.67345426 1998 41.259 4596.96 1779.34 6376.3 72.09447485 1999 43.055 7142.54 1867.91 9010.45 79.26951484 2000 44.942 8036.98 1899.9 9936.88 80.88031656 2001 47.186 9130.61 1996.39 11127 82.05814685 2002 48.61 10206.89 1960.67 12167.56 83.88608727 2003 46.583 11417.06 1841.77 13258.83 86.10910616 2004 45.316 12759.71 1911.82 14671.53 86.96918454

Does Public Debt Affect Real Effective Exchange Rate in India?
63
2005 44.1 13897.58 1940.7 15838.28 87.74677553 2006 45.307 15449.75 2011.99 17461.74 88.4777233 2007 41.349 17996.51 2100.86 20097.37 89.54659241 2008 43.505 20198.41 2640.62 22839.03 88.43812544 2009 48.405 23283.39 2493.06 25776.45 90.32814837 2010 45.726 26671.15 2715.7 29386.85 90.75879177 2011 46.67 32024.11 2933.77 34957.88 91.60770047 Average 30.6169 7527.026563 1366.834063 8893.860625 75.45901911 Source: Reserve Bank of India, various issues.
Table2: Descriptive Statistics of Dependent and Independent Variables
Variable No. of Observations
Mean Median Standard Deviation
REER 32 30.61689 33.93 15.06285 Total Public Debt 32 8893.861 4751.53 9378.451 Trade Balance 32 -1206.9 -182.14 2153.071 Foreign exchange reserve 32 3432.833 873.56 4845.406
ICOR 32 0.031544 0.030 0.013346 Savings Rate 31 5812.422 2892.65 6976.48
Table 3: Regression Analysis of REER on a set of variables excluding Savings Rate
Dependent Variable: Real effective exchange rate Independent variables Coefficient Std. Error Total Public Debt .004** .0004 Trade Balance .009** .0013 ICOR 104.6 76.53 Foreign Exchange Reserve -.002* .0009 Constant 8.12* 2.90 Note: ** significant at 1 percent. * significant at 5 percent.

Trends and Patterns in Public Finance: Theoretical and Empirical Aspect
64
Table 4: Regression Analysis of REER on a set of variables excluding foreign exchange reserve
Dependent Variable: Real effective exchange rate Independent variables Coefficient Std. Error Total Public Debt .005** .0008 Trade Balance .009** .0023 ICOR 94 77.18 Savings Rate -.002 .0013 Constant 9** 2.81
Note: ** significant at 1 percent.
Source: Tables 2, 3, 4: Own calculations.

Forecasting Infrastructural Investment Need for India during the Twelve Five
Year Plan Chandan Sharma*
and Harishankar Vidyarthi**
In this study we attempt to systemically project the demand and fund requirements for the Indian infrastructure sector for the twelfth Five-Year Plan. In the infrastructure sector, transportation (rail and road), electricity and telecommunication sectors are covered in this study. The analysis is carried out in two stages. In the first stage, long-run linkages between infrastructure variables and income are established by applying the cointegration method. Subsequently, infrastructure demand functions are estimated by using a Fully Ordinary Least Squares (OLS) (FMOLS) technique. In the second stage, by using the estimated infrastructure elasticity to income of variables and IMF’s projected income data, we project sector-wise demand and funding requirements. Results of the analysis indicate that in important sectors, the government (the Planning Commission) has seriously underestimated future demands. Our projection indicates that in our sectors of consideration, current spending is around 6 percent of GDP, which will increase to 7.7 percent of the country’s GDP. Based on these results, we propose the initiation of a set of reforms in the existing financing pattern of infrastructure in the country.
1. Introduction The growth of the Indian economy has slowed down from around nine percent to five percent in the recent years. To stimulate the growth momentum once again and to achieve the ambitious more than nine percent growth target during the twelfth plan (2012-2017), the government needs to
* Assistant Professor, Indian Institute of Management, Lucknow, Noida Campus, India, Pin: 226013, Email: [email protected]. (Corresponding Author) ** Fellow, National Institute of Financial Management, Faridabad, Haryana, India. E-mail: [email protected]

Trends and Patterns in Public Finance: Theoretical and Empirical Aspect
66
undertake some necessary policy initiatives in areas of manufacturing and infrastructure. Focus on the infrastructure development is crucial as it is needed for both consumption and production purposes. The standard literature, in which the issue is well-documented, has a conclusive view that a failure to respond (by increasing infrastructure availability) to demand will pose serious impediments to the achievement of the country’s economic growth objectives. To formulate policy to meet the future demand for infrastructure services, it is pertinent to estimate the extent of demand that would arise in the coming years. Therefore, we take up this issue in the present study and aim to systematically project the demand and investment requirements for India. This is important as with the exception of Sharma and Bhanumurthy (2011) no one has attempted this previously in the Indian context. Further, as the lack of infrastructure is widely identified as a major hindrance to sustained current high growth, policy makers have made conscious efforts to address this issue. Hence, the present study would be contextual and helpful in policy-making process.
Recognizing the infrastructure deficit as national concern, the Government of India has increased infrastructure investment gradually from 4.80 percent of GDP in 1999-2000 to 7.94 percent of GDP in 2010-11 and it is further expected to increase to 9.95 percent in 2016-17 (Indian infrastructure report 2011, pp385). In absolute terms, these investments increased from 1.23 lakhs crores in 1999-2000 to 4.60 lakh crores in 2010-11 and are expected to be 10.40 lakh crores in 2016-17. However, these estimates by the Planning Commission of India (PCI) are not very reliable as the basis of forecasting is not very robust in major infrastructure sectors like electricity, rail, road and telecommunications. For example, electricity, railways, roadways and telecom demands have been forecasted based on log linear model by using previous five year data for 11th five year plan and future growth rate has been assumed on anticipated growth of 10 percent annually.
To this end, the present study attempts to estimate the extent of demand for infrastructure services arising from the policy makers’ growth objectives. In our view, the estimates that the PCI has provided and the methodology used to derive these estimates raise several questions and appear to be debatable. Hence, this study is an attempt to provide a framework and to estimate what infrastructure levels will be required in the future, either as consumption goods or as inputs into the production function. This study does not try to deal with the issue of a socially optimal measure of the need for infrastructure services or infrastructure investment.

Forecasting Infrastructural Investment Need for India during …
67
There are numerous reasons necessitating a more rigorous exercise to empirically forecast infrastructure investment needs in India at present. First, the strong international and national evidence that shows the robust linkages between infrastructure and growth, productivity, equity and poverty in India (for instance, see Aschauer, 1989; Fedderke and Bogetiæ, 2009; Hulten et al., 2006; Mitra et al., 2002; Sharma and Sehgal, 2010). Second, recent debate suggests that one of the biggest obstacles facing Indian industry in its expansion path is the inadequacy of infrastructure facilities. The World Bank’s recent Enterprise Surveys also confirm that infrastructure in the country is inadequate and that domestic enterprises are paying a heavy price by losing competitiveness in the international market. Third, the PCI projections of infrastructure demand in plan documents are highly questionable, because of a question mark over how income elasticity of infrastructure variables estimation has been derived. Finally, recent trends suggest that the government has been devoting serious efforts to enhancing infrastructure services by liberalising related policies, investing directly in the sector and encouraging higher private sector participation. The negative effect of this expansion is in terms of higher fiscal deficit (e.g. see Narayan, 2006). Therefore, it becomes extremely relevant to accurately estimate infrastructure demand and investment requirements in order to achieve macroeconomic stability.
Thus, projection needs to be more robust, detailed and should provide realistic assessments for an economy like India, where infrastructure significantly impacts the economic growth. As shown in the recent related literature, demand-supply mismatch is increasing over time. Further, a robust projection of infrastructure needs could form a basis for national economic policies related to economic growth and development, poverty alleviations, manufacturing growth and urbanization. We provide a detailed projection of infrastructure needs and funds requirements at sectoral level for India for the year 2011 to 2017 for four major infrastructure sectors, whose demands are strongly associated with economic growth using the data for 1971 - 2010. For the analysis, we rely substantially on the IMF’s forecast for GDP growth in the Indian economy.
Against this background, this study is set to estimate the required level of infrastructure demand till 2017. As mentioned previously, Sharma and Bhanumurthy (2011) have estimated the infrastructure need for the country till 2014. This study is an extension of that study. For the analysis, the present study relies substantially on the IMF’s forecast for GDP growth in the Indian economy. Working group reports for the Eleventh Plan on the different

Trends and Patterns in Public Finance: Theoretical and Empirical Aspect
68
infrastructure sectors are also utilised in the forecasting procedure, mainly for pricing purposes. The approach of this study is somewhat similar to that used by Fay (1999) and Fay and Yepes (2003) and Bogetiæ and Fedderke (2006). However, we depart from the above-mentioned studies in terms of data use. These studies have used panel data for forecasting, while in this study we have utilised time-series data, which perhaps makes our estimate more consistent; thus, projections based on them will be reliable and useful from a policy standpoint.
The rest of this article is organized as follows: the second section presents the data and its sources to be used in the empirical analysis. Section three describes our empirical models of investigation, as well as the econometric issues related to the estimation. Section four provides estimates for these models and discusses sector-wise demand and funding projections. The last section concludes the discussion.
2. Data We use annual time series data over the period 1971 - 2010 of GDP as a proxy for national income (constant GDP in Rupees crores) and sectoral indicators of electricity, railways, roadways and telecommunications taken from world development indicators – 2012 and Economic Intelligence Services (EIS) database provided by CMIE based on information provided by various ministries and departments of Union ministries and states for forecasting the infrastructure needs of India.
The sectoral indicators used are electricity generation capacity in kilowatt, rail track lengths in kilometers, surfaced road networks in kilometers, and total telephone lines being planned for electricity, railways, roadways and telecommunications respectively based on the previous related literature (Fay and Yepes 2003, Kohli and Basil 2011, Sharma and Bhanumurthy 2011). The selection of the time horizon for the study depends on the maximum availability of data length. Forecasted GDP data up to year 2017 is taken from the World Economic Outlook (WEO- April 2012) database released by IMF.
3. Econometric Model and Methodology Following Fay (1999), Fay and Yepes (2003), Bogetic and Fedderke (2006), Bhattacharya (2010), and Sharma and Bhanumurthy (2011), we develop three stage econometric model to estimate future needs of infrastructure. In the first stage, individual demand functions for each infrastructure sector

Forecasting Infrastructural Investment Need for India during …
69
(namely, electricity, railways, roadways, and telecommunications) are estimated using annual data after logarithmic transformation using the fully modified ordinary least square (FMOLS) method to find the income elasticity of each infrastructure variable. In the second stage, we project the demand of individual infrastructure sectors from 2011 to 2017 using the estimated income elasticity of infrastructure variables and the forecasted GDP data taken from World economic outlook – 2012. In the final stage, we estimate the investment needs using the cost of infrastructure available in working group reports for 12th five year plan released by the Planning Commission. Since it is not possible to estimate every head of an infrastructure sector, we hypothesize that a leading indicator from each sector represents that particular sector. Specifically, electricity generation capacity is in kilowatt, surfaced road networks in kilometers, rail track length in kilometers, and gross subscribers of fixed and cellular lines represent electricity, railways, roadways and telecommunications, respectively. Details of these data series are presented in Table 1.
Table 1: Data Description and Source
Variable Unit Abbreviation Source Income (Y) Indian Rupees (in
Constant in crores) log Y WDI -
2012 Income, agriculture (Y
Indian Rupees (in Constant in crores)
log Y WDI - 2012
Income, manufacturing (Y
Indian Rupees (in Constant in crores)
log Y WDI - 2012
Income, services (Y Indian Rupees (in Constant in crores)
log Y WDI - 2012
Electricity (Elc) Megawatts (KWs) log Elc WDI Railways (Rail) Rail track lengths
(KMs) log rail CMIE-
ESI Roadways (Road) Surfaced road lengths
(KMs) log Road CMIE-
ESI Telecommunications (Telephone)
Total fixed line and mobile phone subscriptions
log Telephone CMIE-ESI

Trends and Patterns in Public Finance: Theoretical and Empirical Aspect
70
3.1. Estimating the Demand Function For estimating the demand function, the first step of this process involves a test for stationarity1 to know the order of integration of the variables. For this purpose, an the Augmented Dickey-Fuller (ADF) test and Phillips-Perron (PP) tests for unit roots has been carried out. The testing procedures are based on the null hypothesis that a unit root exists in the autoregressive representation of the series. Once the order of each variable is determined, we perform the cointegration analysis to determine whether the time series of these variables displays a stationary process in a linear combination. We have employed Johensen multivariate cointegration test (e.g. see Johansen, 1991; 1995) to establish the long-run relationship among the system variables. To estimate the income elasticity of infrastructure variables for India, the present study utilizes the time series data instead of panel data, which is a significant departure from the previous literatures. For instance, Fay (1999), Fay and Yepes (2003), Bogetic and Fedderke (2006) and Bhattacharya (2010) used cross-country data to project the infrastructure demand in panel data framework. Since there is possibility of a wide difference in income elasticity for each infrastructure variable among countries, we believe that using cross-country results for country specific forecasting is not reasonable. As we mainly focus on the Indian infrastructure needs and attempt to estimate projections with direct policy relevance for the country, we adopt a different approach and utilize a time series data approach. The Model We develop a model to estimate future demand for infrastructure, where infrastructure services are demanded both as consumption goods by individuals and as inputs into the production process by firms. On the
1 A stationary time series data is one whose statistical properties such as mean, variance, autocorrelation, etc. are all constant over time. A stationarized series is comparatively easy to predict. Another important reason for testing and trying to stationarize a time series data is to be able to obtain meaningful sample statistics such as means, variances, and correlations with other variables. The analysis based on such statistics is useful as descriptors of future behavior only if the series is stationary. For example, if the series is consistently increasing over time as in the case of non-stationarity of the data, the sample mean and variance will grow with the size of the sample, and mean and variance will be always underestimated. For this reason, the stationary test is required to be carried out and caution should be taken if non- data is used in regression models fitted (for details see Engle and Granger, 1987).

Forecasting Infrastructural Investment Need for India during …
71
consumption side, the amount of service demanded is a function of income and prices:
= f ( , ) (1)
Demand for a particular type of infrastructure service I by individual j is a function of j’s income , and the price of infrastructure service is . Aggregating over the population, national per capita demand of infrastructure service for consumption, will then be given as
= ∑ = F (Y, ) (2)
On the production side, each individual firm’s demand for infrastructure service I will be based on a profit maximization decision which yields the usual first order condition: = (3)
Where, is output of good i by the firm, and is the price of that good. Using Cobb –Douglas production function and aggregating over all firms, we can write:
= ∑ = ∑ (4)
The derived demand for any given infrastructure service is the sum of weighted individual firms’ demands. Equation 2 is however of limited usefulness for our analysis as we do not have firm level data. A reasonable proxy for firms’ aggregate demand for infrastructure is given by aggregate output. However, it is unlikely that the elasticity of demand for a particular infrastructure service, φ, is the same across sectors of the economy. Thus the weight attributable to a given firm’s demand depends on the sectoral composition of the economy. Also, as technology changes, φ may change. Finally, the weighted average of the relative price can be proxied by the real price of the infrastructure good , where w is the price level. The reduced form of equation 2 is then given as:
= F Y, , , ; A (5)
Where, Y is aggregate output, and are the share of GDP derived from agriculture and industry, and A is a term representing technology level. However, we couldn’t follow the above equation mainly because of three reasons. First, in the regression, a serious multi-collinearity problem is identified among these variables as the correlation among these variables is

Trends and Patterns in Public Finance: Theoretical and Empirical Aspect
72
very high. Second, the sectoral GDP projections are available neither in the case of agriculture nor industries from World economic outlook or any other reliable sources. Third, the data for price of infrastructure variables and technology levels are not available. Therefore, variables of sectoral shares are dropped from the model and only real income and infrastructure variables have been included for income elasticity estimation of infrastructure variables. Therefore, the final model becomes in the form of log I = f (log Y ) (6) where, log I and log Y denotes the logarithmic transformation of infrastructure stocks and income for time period t, respectively.
4. Empirical results 4.1. Results of Unit root and Cointegration tests Before going into demand function estimate, we examine the order of integration of the variables under consideration using the ADF and PP tests in order to avoid the problem of spurious regression due to non-stationary data. The unit root results reported in Table 2 show that all variables are non – stationary at levels but stationary at first difference. Thus, all the variables are integrated of order one i.e. I (1). After establishing the order of integration of all the variables, we employ the Johansen co-integration test to verify the long-run relationship between income i.e. Y and infrastructure variables. The results are reported in Table 3, which indicates that infrastructure and GDP are cointegrated in long run from the trace statistics and maximum eigenvalue statistics.
Table 2: Unit root test results
Tests Augmented Dickey-Fuller test
Phillips-Perron test Inferences
Variables↓ At levels
1st difference At levels
1st difference
log Y -1.1325 -7.7390** -1.1325 -8.5407** I(1) log Elc -1.2385 -4.5349** -0.7396 -4.5036** I(1) log Rail -6.5866 -4.1517** -2.1446 -10.4339** I(1) log Road -3.6827 -6.5866** -1.8910 -6.1932** I(1) Log Telephone 4.3353 -3.6827* 3.5282 -3.7443* I(1) Source: Author’s estimates. Note: * and ** shows statistically significant at 1 and 5 percent critical values, respectively.

Forecasting Infrastructural Investment Need for India during …
73
Table 3: Johansen cointegration test results
Model ↓ Null hypothesi
s
Eigenvalue Trace statistics
5% Critical values
Max Eigenvalue
5% Critical values
Elc H₀: r=0 0.3862 19.2628* 15.4947 18.5502* 14.2646 H₀: r≤1 0.0185 0.7125 3.8414 0.7125 3.8414
Rail H₀: r=0 0.3242 28.0612* 15.4947 14.8933* 14.2646 H₀: r≤1 0.2928 13.1678*
* 3.8414 13.1678*
* 3.8414
Road H₀: r=0 0.3459 20.1053* 15.4947 16.1319* 14.26460
H₀: r≤1 0.0992 3.9733** 3.8414 3.9733** 3.8414 Telephone
H₀: r=0 0.3737 17.8035* 15.4947 17.7821* 14.2646 H₀: r≤1 0.0005 0.0213 3.8414 0.0213 3.8414
Source: Author’s estimates. Note: *, ** and *** shows statistically significant at 1%, 5% and 10% respectively.
Model Elc---- The cointegration between log Y and log Electricity generation capacity
Model Road----The cointegration between log Y and log Road network
Model Rail----The cointegration between log Y and log Rail track length
Model Telephone----The cointegration between log Y and log Telephones
4.2. Long run elasticities estimation using FMOLS After establishing the presence of a long-run relationship between Y and infrastructure variables within the bivariate modeling, we initially attempt to employ OLS for estimation of the elasticity. However, we cannot deny the fact that the macroeconomic variables which are used in the model exhibit the problem of endogeneity and they are prone to unit root problem (as we have shown). Therefore, Fully Modified Ordinary Least Squares (FMOLS) method developed by Phillips and Hansen (1990) is used for the estimation. FMOLS corrects the OLS method with regard to endogeneity and serial correlation. The estimator is asymptotically unbiased and has fully efficient mixture normal asymptotics allowing for standard Wald tests using asymptotic Chi-square statistical inference. The FMOLS estimator employs preliminary estimates of the symmetric and one-sided long-run covariance

Trends and Patterns in Public Finance: Theoretical and Empirical Aspect
74
matrices of the residuals. Our estimation gives fairly good estimates of the models. 1) The electricity demand function Log electricity = 0.95651 + 1.09321 * log Y (7) (1.770059) (12.57111) = 0.931419, Adjusted = 0.929566 The sample period is 1971 to 2010 and t-values are in parentheses. 2) The Rail demand function Log Rail = 4.33035 + 0.092316 * log Y - 0.000298 * @ trend (8) (56.13151) (6.865716) (-0.934601) = 0.986244, Adjusted = 0.985480 The sample period is 1971 to 2010 and t-values are in parentheses. 3) The Road demand function Log Road = 1.61692 + 0.704936 * log Y (9) (7.87034) (21.32197) = 0.965463, Adjusted = 0.964529 The sample period is 1971 to 2010 and t-values are in parentheses. 4) The telecommunications demand function
Log Telephone = 0.732 + 0.937 * log Y - 0.02 *@ trend + 0.0016 *@ (10)
(0.09165) (0.68072) (-0.99867) (4.84824) = 0.995488, Adjusted = 0.995101 The sample period is 1971 to 2010 and t-values are in parentheses.
Table .4: Summary of the Estimated Elasticity
Model → Log electricity
Log Rail Log Road Log Telephone
C 0.9565 4.3303 1.6169 0.7322 Log Y 1.0932 0.0923 0.7049 0.9372 @Trend -0.000298 -0.0200 @Trend^2 0.0016

Forecasting Infrastructural Investment Need for India during …
75
4.3. Sector wise demand and funding projection Based on the estimated income elasticity of the indivisual infrastructure sectors, and World Economic outlook’s projected GDP data of India, we estimate the infrastructure needs of India for the period 2011-2017. We project the infrastructure development cost based on Planning Commission’s projection of eleventh and twelfth plan after adjusting for inflation since per unit cost of indivisual infrastructure sectors are not available. However, Kohli and Basil (2011) had forecasted the infrastructure fund requirement for Latin America based on price of infrastructure based in South Asia during the year 2004 but recent volatility of the Indian currency would make it unrealsitic after adjusting for inflation. Therefore, we relie on the Planning Commission’s projection for fund requirement calculation. The sector-wise demand projection and fund requirement are estimated as follows:
4.3.1 Electricity:
For the electricity sector, the estimated income elasticity is 1.093, which is marginally higher than that of Planning Commission’s assumed elasticity of 0.9 and 1 in case of generation planning and sensitivity, respectively. Comparing with Bogetic and Fedderke (2006), and Sharma and Bhanumurthy (2011) who estimated an elasticity of 1.42 and 1.45, respectively, our estimate seems to be moderate. The Planning Commission has estimated total capacity addition of 94285 MW for the period 2012-2017, whereas our estimates based on the estimated elasticity show India needs to add a total capacity of about 104192 MW. For 2011, total investment is expected to be Rs. 130836 crores which will increase to Rs. 258010 crores by 2017 (see Figure 1).

Trends and Patterns in Public Finance: Theoretical and Empirical Aspect
76
Figure 1: Electricity generation capacity (1971 - 2017)
Source: Author’s estimates.
Note: Projection period starts from year 2011.
4.3.2. Rail
For the railways, the income demand elasticity is estimated to be 0.0923, which comes very close to that of Fay and Yepes (2003). Based on the income elasticity, we have projected the demand for railway track, for the period 2011 to 2017. In 2011, the projected demand is around 511 km, which increases to 656.76 km in 2017. Perhaps relatively lesser expansion of railways particularly passenger rail infrastructure is driven mainly by the policy considerations (notably sustainability considerations) than by revealed consumer preferences. In term of funding, the expected investment requirement in 2011 is around Rs 102765 crores, which will increase up to Rs. 132062.85 crores. For 2012 to 2017, expected gross investment is estimated to be around Rs. 728996 crores, almost equal to the planning commission projection of about Rs. 719671 crores for 12th Plan (see Figure 2).
0
50000
100000
150000
200000
250000
300000
1971
1974
1977
1980
1983
1986
1989
1992
1995
1998
2001
2004
2007
2010
2013
2016

Forecasting Infrastructural Investment Need for India during …
77
Figure 2: Rail track lenght (1971 - 2017)
Source: Author’s estimates.
Note: Projection period starts from year 2011.
4.3.3 Road
Using the annual data for period 1971 to 2010, we estimate the income elasticity of road infrastructure of the magnitude of 0.7049. We have projected the demand for surfaced road with the estimated elasticities of income for the period 2011 to 2017. For 2011, surfaced road demand is 93521 k.m. which increased to 156160 km in the year 2017. In terms of the funding requirment, for 2011 it is estimated to be Rs. 122883 crores, which will increase to Rs. 205189 crores in 2017. Overall funding requirement as per our estimation for the period 2012 to 2017 is Rs. 1019686 crores at 2011-12 prices(see Figure 3).
70000
75000
80000
85000
90000
95000

Trends
Source
Note: P
4.3.4. T
In caseyear 19we havfor theand furmatchecellulaelevenyear 20Rs. 39requireFigure
s and Patterns
Figu
e: Author’s es
Projection per
Telecommuni
e of telecomm971 to 2010. Uve estimateed year 2011 torther demand es with Plannr subscribers’ th plan mid-te011 to 2017 a
9905 crores, wement for the
4).
s in Public Fin
ure 3: Total R
timates.
riod starts from
ications
unications, theUsing the estim the future de
o 2017. The pis increased
ning Commissbase of 1200
erm appraisal after adjusting which increase
period 2012 t
nance: Theore
78
Road Network (
m year 2011.
e estimated inmated elasticitmands of fixe
projected demup to 88.125 mion’s 12th pla0 million. Usinreport, we proinflation. The
ed to Rs. 7360to 2017 is aro
tical and Emp
(1971 - 2017)
ncome elasticitty and projected and cellularand for 2011 million by 201n projection o
ng the Planninoject the fund
e fund requirem08 crores in 2ound Rs. 3519
pirical Aspect
ty is 0.93 for ted GDP by IMr telephone lin
is 47.77 milli7. The estimaof the expectng commission
requirement fment for 20112017. Total fu916 crores (s
he MF,
es on
ate ed n’s for is nd ee

Forecasting Infrastructural Investment Need for India during …
79
Figure 4: Total Fixed and Cellular lines subscribers (1971 - 2017)
Source: Author’s estimates.
Note: Projection period starts from year 2011
A summary of our overall projections of infrastructure for the period 2011-2017 are presented in Table 5. Table 6 reports. The projection indicates that in 2011 Rs. 396390 crore is required to be invested in these sectors, which is 7.03% of the country GDP. This will increase to Rs. 668870.8 crore in 2017, which is around 7.66% of the current year’s GDP. Focusing on the sectoral share, it is evident that the electricity sector which needs 33% share in total projected investment of 2011, will require around 39% share in 2017. However, sectoral investment share is projected to be declining in Transportation sectors, i.e. Railways and Roads. Finally, the projection for the telecommunication sector indicates a marginal hike in the sectoral share (see Table 7).
0
200000000
400000000
600000000
800000000
1000000000
1200000000
1400000000
1971
1974
1977
1980
1983
1986
1989
1992
1995
1998
2001
2004
2007
2010
2013
2016

Table 5: Projection of Infrastructure Demand: 2011- 2017
Electricity Rail Road Telecommunications
Year Income elasticity
Projected yearly
demand in MW
Income elasticity
Projected yearly
demand in KMs
Income elasticity
Projected yearly
demand in KMs
Income elasticity
Projected yearly
demand subscribers
2010 159398.5** 87376** 2064176** 787280000** 2011 1.0932 170735.2 0.0923 87887.06 0.7049 2157697 0.9372 835000000 2012 1.0932 183569.9 0.0923 88428.59 0.7049 2260953 0.9372 889000000 2013 1.0932 198215.7 0.0923 89006.86 0.7049 2375697 0.9372 949000000 2014 1.0932 214617.9 0.0923 89608.53 0.7049 2500684 0.9372 1020000000 2015 1.0932 232734.4 0.0923 90227.47 0.7049 2634854 0.9372 1090000000 2016 1.0932 252570.7 0.0923 90855.67 0.7049 2777576 0.9372 1170000000 2017 1.0932 274926.8 0.0923 91512.44 0.7049 2933736 0.9372 1260000000
Source: Author’s estimates. Note: Projection period starts from year 2011. Note: ** shows the base value at the end of year 2010 to be used for demand projection.

Forecasting Infrastructural Investment Need for India during …
81
Table 6: Projection of infrastructure Investment: 2011- 2017
Year Electricity Rail Road Telecommunications
Gross investment Projection
GDP Infrastructure investment in % of GDP
2011 130836.6 102765.3 122883.4 39904.59 396390 5642507 7.03 2012 148124.7 108891.6 135674.9 44724.78 437416.1 6029470 7.25 2013 169026.1 116279.4 150769 50495.43 486570 6469139 7.52 2014 189296.9 120985.1 164228.6 55924.61 530435.2 6957300 7.62 2015 209081.5 124456.5 176294.8 61066.7 570899.5 7494126 7.62 2016 228930.6 126321.1 187530.3 66092.47 608874.5 8077169 7.54 2017 258010.7 132062.8 205189 73608.26 668870.8 8730450 7.66
Source: Author’s estimates.
Note: 1. Projection period starts from year 2011. 2. Results are in Rs. crore at 2011-12 price

Table 7: Sectoral Share in Projection of infrastructure Investment: 2011- 2017
Year Electricity Rail Road Telecommunications 2011 33.0070 25.9253 31.0006 10.0670 2012 33.8635 24.8942 31.0173 10.2247 2013 34.7382 23.8977 30.9860 10.3778 2014 35.6871 22.8086 30.9610 10.5431 2015 36.6231 21.8000 30.8801 10.6965 2016 37.5989 20.7466 30.7995 10.8548 2017 38.5740 19.7441 30.6769 11.0048
Source: Author’s estimates. Note: Projection period starts from year 2011.
5. Conclusion and Policy Suggestions We have attempted to systemically estimate the demand and fund requirements from 2011 to 2017 for the Indian infrastructure sectors, namely electricity, transportation (rail and roads) and telecommunications. The study is performed in three stages. In the first stage, a long-run linkage between infrastructure variables and income are established by applying the Johansen cointegration technique and then long-run infrastructure demand functions are estimated using fully modified least squares (FMOLS) method. In the next stage, the estimated income elasticity of infrastructure variables and projected income data taken from world economic outlook (WEO - April, 2012) issued by IMF, are used to forecast sector-wise demand. Finally, we estimate the fund requirements for the above sectors using the costs of infrastructure available in working group reports for 12th five year plan released by the Planning Commission.
The results of the analysis indicate that in important sectors like electricity, rail and telecommunications, the government has underestimated the future demand. The overall findings suggest an enormous investment requirement. In four infrastrure sectors taken up for consideration, our estimate indicates that investment required is between 7.03 to 7.66 percent of the national GDP. Furthermore, our estimate indicates that the electricity infrastructure development has the highest proportion in investment requirements followed by road, rail and telecommunications. Looking at the annual investment requirements, approximate infrastructure needs for the period 2012 to 2017 are around Rs. 3303065.95 crores at 2011-12 prices. However, these results must be taken with caution, because gross infrastructure investment

Forecasting Infrastructural Investment Need for India during …
83
requirement for the period 2011 -2017 covers only four sectors, namely electricity, transportation (rail and roads) and telecommunications; and our study has covered other sectors like water and sanitation etc.
To finance projected investment needs, the government has encouraged private sector participation through PPPs. But the extent of projects under PPPs (except in airports) appears to be negligible. Even the extent of FDI in infrastructure is insubstantial. This calls for a more concerted effort to boost investment in this sector. There is need for structural reforms in domestic financial markets that could help in mobilising long-term finances for infrastructure and achieve the target growth rate of the twelfth Five-Year Plan. On the foreign investment front, too, although many infrastructure sectors have been allowed FDI up to 100 per cent through the automatic route, there appear to be many bottlenecks that hinder actual FDI flows. This is evident from the World Bank’s ‘Doing Business Survey-2010’ that ranks India 133 (out of 183 countries), which is very low in comparison with other emerging market economies which compete for FDI, such as Brazil (129), Russia (120), China (89) and South Africa (34). Even within South Asia, India ranks lowest.
Keeping in mind the enormous projected requirements of infrastructure in the near future, there is an urgent need for policy liberalisation that could help improve the macroeconomic regime to attract more investment. For instance, encouraging the use of derivatives, liberalising investment guidelines for debt instruments, IPOs by infrastructure companies, developing the bond market in the country, allowing NBFCs to access infrastructure funds, funding from multilateral agencies, encouraging ECBs for investment in infrastructure and boosting PPP modes of financing.
References: Aschauer, D. A. (1989). Is public expenditure productive? Journal of monetary economics, 23(2), 177-200.
Bhattacharyay, B. N. (2009). Infrastructure development for ASEAN economic integration. ADBI working paper 138. Asian development Bank Institute. Tokyo.
Bhattacharyay, B. N. (2010). Estimating demand for infrastructure in energy, transport, telecommunications, water and sanitation in Asia and the Pacific: 2010-2020. ADBI working paper 248. Asian development Bank Institute. Tokyo.

Trends and Patterns in Public Finance: Theoretical and Empirical Aspect
84
Engle, Robert F. & C. W. J. Granger (1987). Co-integration and Error Correction: Representation, Estimation, and Testing, Econometrica, 55, 251–276.
Fay, M. (1999). Financing the Future: Infrastructure Needs in Latin America, 2000-05. Policy Research Working Paper 2545. The World Bank. Washington D.C.
Fay, M., & Yepes, T. (2003). Investing in Infrastructure: What is needed from 2000 to 2010?. Policy Research Working Paper 3102. The World Bank. Washington D.C.
Fedderke, J. W., & Bogetic, Z. (2006). Forecasting Investment Needs in South Africa's Electricity and Telecommunications Sectors. Policy Research Working Paper 3829. The World Bank. Washington D.C.
Fedderke, J. W., & Bogetic, Z. (2009). Infrastructure and growth in South Africa: Direct and indirect productivity impacts of 19 infrastructure measures. World Development, 37(9), 1522-1539.
Hulten, C. R., Bennathan, E., & Srinivasan, S. (2006). Infrastructure, externalities, and economic development: a study of the Indian manufacturing industry. The World Bank Economic Review, 20(2),
Kohli, H. A., & Basil, P. (2011). Requirements for Infrastructure Investment in Latin America Under Alternate Growth Scenarios 2011--2040. Global Journal of Emerging Market Economies, 3(1), 59-110.
Mitra, A., Varoudakis, A., & Veganzones-Varoudakis, M. A. (2002). Productivity and Technical Efficiency in Indian States Manufacturing: The Role of Infrastructure. Economic Development and Cultural Change, 50(2), 395-426.
Phillips, P. C., & Hansen, B. E. (1990). Statistical inference in instrumental variables regression with I (1) processes. The Review of Economic Studies, 57(1), 99-125.
Sharma, C., & Bhanumurthy, N. (2011). Estimating Infrastructural Investment Needs for India. Margin: The Journal of Applied Economic Research, 5(2), 221-243.
Sharma, C., & Sehgal, S. (2010). Impact of infrastructure on output, productivity and efficiency: evidence from the Indian manufacturing industry. Indian Growth and Development Review, 3(2), 100-121.

Urban Public Finance Structure-Creating Architectural Niches
Dr. Neeta Tapan∗ I
Decentralisation and Urban Local Bodies Closing years of the Twentieth Century were marked by two very significant and interrelated developments that largely led to paradigm shift in the approaches, concepts and thinking about the institutions of local self-government in India. First, globalisation, in which the nations across the globe were compelled to go for structural adjustments to enhance the national competitive abilities, global trade and foreign direct investments. The roles of cities became all the more important as they constitute the centres of economic activities and “engines of economic growth”. The second change of equally far-reaching importance was a new wave of decentralisation that swept the developed, the developing and the transitional economies especially in the eighties of the last century.
Decentralization for contributing to the formation of democratic local governance constituted a key objective of development assistance in the 1990s around the globe although the concept of decentralisation is quite old. The origins of the decentralisation theorem in the area of public economics was first introduced by Oates (1972) as a more efficient way of providing public service by a local government rather than a central government when all other parameters of service provision including quality, are constant. Being closer to the population to be served, a local government was seen to have been more efficient in procuring and delivering services to the local people. The other advantage of decentralisation was perceived as the fact that local governments could gauge the preferences of the populations and provide for them far more effectively than a remote central authority. The perception of the twin objectives of efficiency and effectiveness were followed by equity considerations. It is believed that by taking governance down to lower levels in decentralisation, we make decision-making ∗ Assistant Professor of Economics, Govt. Girls’ Post Graduate College (Centre for Excellence), Ujjain (Madhya Pradesh) [email protected]

Trends and Patterns in Public Finance: Theoretical and Empirical Aspect
86
participatory, inclusive and thus achieve the equity objective as well. Apart from the objectives of Efficiency, Effectiveness and Equity, a significant benefit perceived from decentralisation is that it fosters and promotes fiscal federalism as part of fiscal decentralisation. It is due to the entire range of benefits accruing from decentralisation that it has been so widely accepted that decentralisation would promote development, inculcate accountability, reduce corruption, prevent policy capture, and lead to more participative decision making.
Though decentralisation in India has been working for the last one hundred years and more, the economic reforms of the early 1990s and the passing of the 73rd and 74th Constitutional Amendments in 1992 (collectively “the amendments”) decentralized considerable functional and financial authority for the provision of social and economic services and the provision of infrastructure to sub-national governments. Until 1992, the Indian federation functioned as a two-tier governance system consisting of the Centre and the States. Formal Constitutional recognition for the third tier—the local government—came through the 73rd (rural local bodies) and 74th (urban local bodies) Constitutional amendments. The key provisions of the 74th Constitutional Amendment, which promote a comprehensive process of urban sector reform to empower the Urban Local Bodies (ULBs),
• require each state to revise its own municipal law to promote greater decentralization, resource mobilization, accounting reforms and the entry into private sector partnerships.
• authorize state legislatures to grant municipalities the authority to levy, collect and appropriate certain taxes and duties.
• include provisions related to shared tax collection by the state and state grants.
• provide for the establishment of funds at the ULB level to handle receipts and disbursements.
• have resulted in the development of a model municipal law that governs municipal corporations, municipalities and panchayats
The Model Municipal Law serves as a template for states to revise their municipal legal framework. Its key provisions include:
• a definition of core municipal functions, including water supply and sewerage;
• state oversight of municipal finances through SFC recommendations;

Urban Public Finance Structure-Creating Architectural Niches
87
• a form of administrative receivership for cities that default in the performance of their duties or their abuse of powers;
• a requirement that each state frame a ULB debt limitation policy;
• encouragement for ULBs to generate internal sources of revenue;
• establishment of a state municipal accounting manual, and state appointment of a municipal auditor;
• a requirement that ULBs prepare an annual balance sheet and appoint a municipal accounts committee;
• a requirement that ULBs prepare an inventory of properties and facilities;
• encouragement for ULBs to implement their own development plans ;
• authorization for private sector participation in the construction, financing and delivery of services (including revenue billing and collection).
II
Architecture of Urban Public Finance Public Finance is a specialised subject concerning public policy wherein principles of finance, policy and economics are often applied with respect to the finances of governments – primarily central (or, federal) and provincial (or, state) governments. Local Government Finance, a substream of public finance, pertains to the finances of local governments (in both rural and urban areas) in relation to the upper tiers of governments i.e., federal and state governments. Urban Local Government Finances have received lesser attention in public finance literature.
Decentralisation has brought institutions of urban self-government center stage; they are called upon to manage change brought about by increasing demographic growth within their jurisdiction. Urban Local Bodies (ULBs) are local self-governing institutions constituted by the state or central governments through a specific Act of Legislation. They are territorial and are characterized by fairly dense concentrations of population per square kilometer, and where majority of the citizens receive their incomes from non-agricultural or non-farm operations. They constitute the sub-national governance systems in all countries and attend to the day to day needs of a community such as roads, street lighting, water supply and sanitation,

Trends and Patterns in Public Finance: Theoretical and Empirical Aspect
88
schools and colleges, parks and recreation avenues, burial for the dead, public health, internal security and so on.
With the municipalities/municipal corporations acting as centres of government in urban areas, urban local government finance is also referred to, some times, as municipal finance in India. However, the performance (both physical and financial) of urban local governments may vary between the municipalities (of cities) and municipal corporations (of larger urban agglomerations) as well as amongst themselves. There are three broad categories of revenue flows to municipal bodies: tax revenues, non-tax revenues, and (revenue) grants from States. Tax revenues and grants form the two largest components, while non-tax revenues are usually lower. Tax revenues comprise both own taxes and share of State taxes as determined by the SFC and passed on through the subvention mechanism like SFC devolution. In general, their own tax revenues include octroi, property tax, advertisement tax, motor vehicle tax, entertainment tax, professional tax, etc., while non-tax sources are primarily user charges, fees, rent for municipal properties, fines and penalties, and so on.
ULBs in India have largely adopted the cash-based accounting system. This system, while being conservative on receipts (inflows), underestimates the level of expenses (liabilities). ULBs have also traditionally relied on State budgets for financial planning and control. Annually, local bodies prepare a statement of receipts and payments (cash basis), under the respective item heads in the budget, both for the revenue account and the capital account. The statement is usually audited by the State Audit Department. This audit is fairly limited in its scope, being in the nature of a transaction audit. Local governments entrusted with expenditure obligations are likely to fulfil them with greater commitment if they are also responsible for raising the revenues they spend, and a larger proportion of these expenses is met from their own revenues.
Different streams of Revenues: Principally, revenues for a local body come from assets and transactions within the revenue jurisdiction of the ULB. While some of them are taxes and duties, others arise out of provision of specific services by the ULB. Moreover, specific powers vest with states and central governments in some countries to levy and collect taxes and duties on transactions even if happening within the territorial jurisdiction of the ULB. Such taxes and duties are usually shared with the ULB based on specific understanding arrived through bilateral or institutional negotiations between the ULBs and the

Urban Public Finance Structure-Creating Architectural Niches
89
higher-level governments. In India, the State Finance Commissions look into this transfer mechanism and come up with awards periodically, say, once in five years. Broadly, therefore, the revenues can be classified into a) Own revenues, b) Transfers and assignments, and c) Grants for specific purposes allocated by the next level governments.
Transfers are determined through a formula based on weightages assigned for such parameters as inter ULB distribution of population, area of jurisdiction of the ULB, per capita efficiency in collection of own revenues etc. Usually considerations of equity and normative growth in revenues and expenditure are prime considerations in arriving at the transfer formula. A major chunk of the transferable kitty is apportioned to the state or other higher levels of government in consideration of common services to be performed at that level.
Assigned revenues arise out of transactions within the local jurisdiction of the ULBs where the levy and collection is done by the state agencies and apportioned to the respective ULBs after retaining a small collection charge. Stamp duty on registration of documents for property, lease and mortgages etc., entertainment taxes on cinema theatres and movie halls and such other type of levies come under this fold. The local body concerned can reap higher levels of such revenues as the general economic activity in their jurisdiction picks up especially when new colonies get good connectivity or a new industrial area or park is planned and executed and where large transactions happen in buying and selling landed property. Provision of good infrastructure in terms of roads, water supply and sanitation, internal security, street lighting and reasonably good facilities for entertainment attract new investments in industries, housing and other economic activities thereby providing a solid base for taxation.
Specific grants are sanctioned by the higher levels of governments for creation of specific infrastructure or as incentives for putting up and maintaining such infrastructure. ULBs obtain scheme specific grants as well as grants-in-aid from the State government to bridge (assessed) revenue shortfall. In addition, they also obtain Central grants-in-aid in accordance with the recommendations of the Central Finance Commission; these are meant to address the vertical imbalance between the Centre and the States and are routed through the State. Specific grants are usually part of a common programme and are based on normative allotments among all deserving ULBs. A case in point is the Mega-City programme launched by the Government of India covering million plus cities in India to upgrade and

Trends and Patterns in Public Finance: Theoretical and Empirical Aspect
90
create civic infrastructure. The ULB could obtain up to 50% as grants pro-rata to the funds invested by it in approved projects. This has been revamped to cover cities with half a million plus also recently under the Jawaharlal National Urban Renewal Mission. There are specific programmes launched by the state governments in India such as the Temple Town Improvement Scheme of the Government of Tamilnadu. The TNUDF provides grant support for project preparation and also administers grants for provision of services to weaker sections in the ULBs either as stand-alone schemes or as part of a larger project.
Own Revenues: This category of revenues lies properly in the domain of the Urban Local Body. These are sources of revenue identified in the enabling legislation of the respective state legislature, which the ULB can levy and appropriate in full to its general revenues. Levy and collection of such taxes or duties or charges need to be organized by the ULB consistent with its quantum and per capita spread keeping in mind such basic principles of taxation as equity, affordability, simplicity in design and ease of collection and administration. Examples are taxes on property, surcharge on property tax for water supply and sanitation (for ULBs in India it is part of property tax), education cess, library cess, taxes on objectionable trade, profession tax, cable TV license fees et. ULBs have substantial control over levy and collection of these revenue sources. Depending upon the paying capacity of the citizens, political will of the ULB governing body to levy taxes and periodically revise them to keep pace with inflation and increased level of services, as well as efficiency of the billing and collection system in the ULB, these revenues can be made a major source of funds for day-to-day maintenance and to implement new projects for quality service delivery with full consumer satisfaction.
Non-Tax Revenue or User Charges Last but the most important revenue source is the user charge collection for various civic services rendered, such as water charges, electricity consumption, transport charges where the transportation network is operated by the ULB, etc.. User charges should be adequate to cover operation and maintenance expenditure and to repay borrowed capital.
Revenue Buoyancy One of the important attributes of a source of revenue is its buoyancy. This is determined by the nature of levy, its coverage, quantum and periodicity as well as amenability for easy administration. It should ride on transactions that are dynamic and are set to grow in volume and value over a period of time. It

Urban Public Finance Structure-Creating Architectural Niches
91
should be possible to collect higher per capita revenue without proportionate increase in cost of administration. For example, in the case of stamp duty on registration, as property values increase due to intrinsic and external factors, each transaction generates higher quantum of revenue even without change in the duty rates. In fact, as values go up and as the tax rates come down even disproportionately, compliance rates go up and yield higher quantum of revenue per transaction. In the case of property taxes, zoning based on such parameters as commercial, residential, mixed residential, industrial and other combination of economic classification can capture the inherent taxation potential of different properties and thus contribute to buoyancy in revenues from this source. Tax buoyancy is also influenced by the efficiency of survey and assessment of the potential taxpayers and efficiency in billing and collection systems. New taxpayer identification, migration of existing taxpayers from one level of assessment to higher levels based on increased potential to pay as well as tracking and legal remedies against willful defaulters are other aspects of ensuring tax buoyancy.
Revenue Expenditure Regarding the functional domain of the urban local bodies, the 74th Amendment Act envisages that the State Governments may, by law, endow them with such powers and authority as may be necessary to enable them to function as institutions of self-government with respect to (i) preparation of plans for economic development and social justice; (ii) performance of functions and implementation of schemes as may be entrusted to them. Thus the role envisaged for the urban local bodies is much broader than that as providers of public services. However, the Constitution does not distinguish between the functional domain of the three categories of municipal bodies: Municipal Corporations, Municipal Councils and Nagar Panchayats. The Twelfth Schedule to Part IX of the Constitution of India (Article 243W) added through 74th Amendment Act provides an illustrative list of municipal functions which includes:
• Urban planning including town planning;
• Regulation of land use and construction of buildings;
• Planning for economic and social development;
• Roads and bridges;
• Water supply for domestic, industrial and commercial purposes;
• Public health, sanitation, conservancy and solid waste management;

Trends and Patterns in Public Finance: Theoretical and Empirical Aspect
92
• Fire services;
• Urban forestry, protection of environment and promotion of ecological aspects;
• Safeguarding the interests of weaker sections of society, including the handicapped and the mentally retarded;
• Slum improvement and upgradation;
• Urban poverty alleviation;
• Provision of urban amenities and facilities e.g. parks, gardens, and playgrounds;
• Promotion of cultural, educational and aesthetic aspects;
• Burials and burial grounds, cremation ghats/grounds, and electric crematoria;
• Cattle pounds, prevention of cruelty to animals;
• Vital statistics including registration of births and deaths;
• Public amenities including street lighting, parking lots, bus stops and public conveniences;
• Regulation of slaughter houses and tanneries.
Hence, broadly ULBs play a critical role in the delivery of social, economic and infrastructure services like public health, sanitation, primary education, water supply, and maintenance of road networks and many other services. A ULB’s primary responsibility lies in making adequate provision for these services, which it is required to provide under the relevant Act. Revenue expenditure side thus centres on the obligatory functions of the entity and the expenses incurred on the same. Therefore, it is imperative that the obligatory functions, as defined by the relevant Act, must necessarily be covered by adequate allocation of funds on an ongoing basis.
Revenue Balance ULB’s own revenue balance (total revenue receipts less State grants less revenue expenditure) helps to evaluate the strength of its own revenues in relation to its expense levels. The rapid pace of urbanisation in India over the last few decades has led to pressure increasing on ULBs to ensure adequacy of service for a burgeoning population and they seem to run in a revenue imbalance indicating a deficit often. However, the operating ratio (revenue

Urban Public Finance Structure-Creating Architectural Niches
93
expense/revenue receipts) is an indicator of the operating efficiency of the entity. An operating ratio above 1 while indicating operational weakness, may be viewed with less concern if discussions indicate that the service levels are very high, that adequate steps for building up own revenue streams are being taken, and that State support is forthcoming in terms of additional grants.
Liquidity and Debt Profile In the absence of bank-supported lines of credit, a local body’s liquidity is a function of its cash management, investment policies, flexibility in deferring certain expenditure, and the strength of its budgetary planning and control functions. The ULB’s revenue supported debt is analysed in terms of its tenure, repayment pattern, and interest rate sensitivity. The debt service coverage of ULBs can be understood through their own revenues [(Own revenue balance + interest)/(principal + interest obligation)].
Evidently, the finances of Urban Local Bodies (ULBs) have been assuming much greater importance with the urban areas increasingly becoming important in terms of not only population share but also economic wealth. An effective, efficient and responsive discharge of the devolved functions and management of change requires institutional and fiscal capacities in ample measure. On the contrary, the units of (ULBs) especially in the developing and transitional economies have been experiencing serious fiscal stress
III
Finance Commission and Fiscal Devolution A decentralised system of governance is susceptible to fiscal inequities largely owing to differential fiscal capacity and service needs. The central and the state governments try to equalize these through transfers. Before the 74th Amendment, transfers from the state governments to the ULBs were ad-hoc. The Constitution requires the SFCs to review the financial position of the ULBs and recommend to the Governor of the states the following:
• Principles for: - Distribution of net proceeds of taxes, duties, tolls and fees
leviable by the states and distribution of the proceeds from these between the states and the ULBs and also between the ULBs.
- Determination of taxes, duties, tolls, and fees that may be assigned to, or appropriated by the ULBs.

Trends and Patterns in Public Finance: Theoretical and Empirical Aspect
94
- Grants-in-aid to the ULBs from the consolidated fund of the states
• Measures needed to improve the financial position of the ULBs.
Thus, creation of Finance Commissions constitutes important mechanism for addressing the vertical and horizontal fiscal imbalances
Central Finance Commission In order to give transfers to the states for municipal sector, the Indian Constitution requires the Central Finance Commission (CFC) to suggest measures needed to augment the Consolidated Fund of states for supplementing the resources of the Panchayats and the municipalities in a state on the basis of the recommendations made by the Finance Commissions of states. Vertical fiscal imbalance connotes dependence on the revenue of higher levels of government; horizontal fiscal imbalance”, on the other hand, means uneven access to local public resources
Correcting fiscal inequities and fiscal inefficiencies arising from differentials in regional/fiscal capacities constitutes an important element of fiscal transfers. Central to the design of transfer system is the concern for equalization that should enable the ULBs with different resource capabilities and different needs to provide the same level of services with some standard tax rates across the various local government areas.
Eleventh Finance Commission (EFC) tried to do this by selecting a few key variables and assigning weights to them for allocation of grants to different states. Variables selected by the EFC and the weights assigned to them are presented in Table 1 below:
Table 1
Variables and Weights for Distribution of Grants to States as per EFC
Criterion Weight (per cent) (i) Population 40 (ii) Geographical area 10 (iii) Distance from highest per capita income 20 (iv) Index of decentralization 20 (v) Revenue effort 10

Urban Public Finance Structure-Creating Architectural Niches
95
The EFC wanted to give incentive to the states for effective implementation of decentralisation. Hence, it suggested construction of an Index of Decentralisation and assigned a weight of 20 percent to it in fiscal transfer to states. The Index of decentralisation included the following parameters:
1. Enactment/amendment of the state/municipal legislation
2. Intervention/restriction in the functioning of the ULBs
3. Assignment of functions to the ULBs by state legislation
4. Actual transfer of functions to the ULBs by way of rules, notification and orders
5. Assignment of powers of taxation to the ULBs
6. Extent of exercise of taxation powers
7. Constitution of SFCs and submission of action taken on their reports
8. Action taken on the major recommendations of the SFCs
9. Election to the ULBs
10. Constitution of District Planning Committees as per the provision in Article 243ZD.
It recommended an ad-hoc annual grant of Rs. 400 crores per annum for the ULBs (Rs. 2000 crores for five years). It also recommended that the grant would need to be used first for (i) maintenance of accounts, (ii) development of database about ULBs, and (iii) audit. The remaining amount of grants was to be used for maintenance of core functions.
The review of receipts and expenditure of municipalities is intended to reveal the financial health of local bodies and their capacity to meet growing fiscal requirements. The primary focus of such a review would be to assess the revenue gap between resources, which urban local bodies are in a position to generate by way of their own revenue raising efforts and what they need to fulfil their obligations. The nature and magnitude of the gap would determine the changes that may be needed in the devolution of resources from the state govt. to local bodies in terms of assignment of taxes, toll and fees, the revenue sharing arrangement between the state government and local bodies and the size and conditions of grants-in-aid to local bodies.

Trends and Patterns in Public Finance: Theoretical and Empirical Aspect
96
The Eleventh Finance Commission Report (June, 2000) provides, for the first time, a state-wise as well as consolidated overview of the finances of the local bodies for the period from 1990-91 to 1997-98. Based on these data Table 1 shows that for urban local bodies in 1997-98:
• Total expenditure was 10 per cent of GDP;
• Expenditure on core services was 66.9 per cent of the total expenditure;
• Own resources of urban local bodies were only 5 per cent of the total expenditure incurred by them; and
• There was a significant financing gap to the extent of 9.2 per cent of GDP.
Table 2. Finances of Urban Local Bodies
1990-91 1997-98 Rs. Crore % of GDP Rs. Crore % of GDP Urban Local Bodies (All levels)
Total Expenditure 24395 4.56 151308 10.00 Expenditure on Core Services
9988 1.87 101224 6.68
Other Expenditure 14407 2.69 50085 3.30 Total Revenue 3931 0.73 12179 0.80 Own Revenues 2736 0.51 7599 0.50 (i) Own Tax 1935 0.36 5892 0.39 (ii) Own-Non-Tax 801 0.15 2127 0.14 Other Revenues 1195 0.22 3608 0.30 Source: Report of Eleventh Finance Commission
Table 1 shows that the finance gap in the urban local bodies on the other hand is significant. This is mainly because while these institutions have the sole responsibility of providing core services in the urban areas they are administratively weak in realizing cost related user charges for these services. Also these institutions, therefore, increasingly depend on funds provided by the State government, which in most cases remain under severe financial constraint.

Urban Public Finance Structure-Creating Architectural Niches
97
Twelfth Finance Commission The variables selected by the EFC and the weights assigned to them are presented in the following table:
Table 3. Variables and Weights for Distribution of Grants to States as per TFC
Criterion Weight (per cent) (i) Population 40 (ii) Geographical area 10 (iii) Distance from highest per capita income 20 (iv) Index of deprivation 10 (v) Revenue effort 20 (a) with respect to own revenue of states (b) with respect to GSDP
10 10
Table 3 in comparison to table 1 shows that the TFC replaced the index of decentralisation of EFC by Index of Deprivation and assigned 10 percent weight for distribution of grants on the basis of backwardness and deprivation. The remaining 10 percent weight was added to the revenue effort, raising it up to 20%. The break up of this 20 percent equally emphasized the own revenue efforts and share in state grants.
The Twelfth Finance Commission (TFC) has recommended grants amounting to Rs. 25,000 crores payable during the period 2005-10 (Rs. 20,000 crores for panchayats and Rs. 5,000 crores for municipalities) to states for rural and urban local bodies. The inter-state allocation recommended by TFC for ULBs is as given in Table 4 below.
Table 4. Shares of States in Allocation (2005-10)
S. No. State Urban Local Bodies Per cent (Rs. Crore)
1 Andhra Pradesh 7.480 374.00 2 Arunachal Pradesh 0.060 3.00 3 Assam 1.100 55.00 4 Bihar 2.840 142.00 5 Chhattisgarh 1.760 88.00 6 Goa 0.240 12.00

Trends and Patterns in Public Finance: Theoretical and Empirical Aspect
98
7 Gujarat 8.280 414.00 8 Haryana 1.820 91.00 9 Himachal Pradesh 0.160 8.00 10 Jammu & Kashmir 0.760 38.00 11 Jharkhand 1.960 98.00 12 Karnataka 6.460 323.00 13 Kerala 2.980 149.00 14 Madhya Pradesh 7.220 361.00 15 Maharashtra 15.820 791.00 16 Manipur 0.180 9.00 17 Meghalaya 0.160 8.00 18 Mizoram 0.200 10.00 19 Nagaland 0.120 6.00 20 Orissa 2.080 104.00 21 Punjab 3.420 171.00 22 Rajasthan 4.400 220.00 23 Sikkim 0.020 1.00 24 Tamil Nadu 11.440 572.00 25 Tripura 0.160 8.00 26 Uttar Pradesh 10.340 517.00 27 Uttaranchal 0.680 34.00 28 West Bengal 7.860 393.00 Total 100.000 5000.00 Source: Report of the TFC
The Twelfth Finance Commission (TFC) recommended a sum of Rs. 5000 crores as transfers to the ULBs which, as compared to the transfers suggested by the EFC, is a quantum jump. It hoped that this substantial increase in transfers will provide a fillip to the finances of the ULBs for augmenting the level of municipal services in various states
IV
The emergence of innovative Urban Fiscal structures Over the years, the Central government has sponsored several infrastructure and urban investment schemes. Increasingly, grant funding has become

Urban Public Finance Structure-Creating Architectural Niches
99
conditional on the acceptance of certain reforms by the participating states and local governments. However, the effectiveness of past programmes has been somewhat hampered by the relatively small size of the funding commitments in relation to the needs, reluctance or tardiness on the part of state and local governments to submit to reforms (even those mandated by constitutional amendments), and the unintended administrative entanglements that result from having so many active programs competing with one another for the same local government audience. Other impediments include the fact that states have only recently begun to develop viable debt structures for the domestic bond market, while public partners have yet to establish how to use funding commitments as a means of leveraging matching private capital.
In spite of these limitations, the direction of recent infrastructure and urban development initiatives holds much promise, in that central government grants are tied to managerial and fiscal reforms at the state and local government level. Perhaps, the boldest of these “conditional infrastructure investment programmes” is the National Urban Renewal Mission (NURM), which was announced by central government towards the end of 2005. The NURM is a five-year, Rs 1,000 billion conditional infrastructure investment programme for select Indian cities. Eligible project areas include urban renewal, water, sewerage, solid waste, environmental improvement, street lighting, roads, urban transport and civic amenities. One submission of the NURM is to promote urban infrastructure and governance through the Ministry of Urban Development (MoUD). The other is to provide basic services to the urban poor through the Ministry of Urban Employment and Poverty Alleviation (MoUEPA). Mega cities, state capitals and cities that are important in terms of culture and tourism are eligible for assistance under the programme.
On the other hand, an Urban Reform Incentive Fund (“URIF”) was set up by the Government of India (GOI) in the Union Budget for 2002-03 to provide reform-linked assistance to the states, by amending the rent control act, repealing the urban land ceiling act, introducing duty reductions for land and property transactions, and improving the accounting systems and computerising land records. A City Challenge Fund (“CCF”) has been proposed to facilitate city-level reforms by funding the transition costs of developing municipal management and service delivery systems.
Recent debt issuances by a few Indian states are of great importance to the development and diversification of India’s domestic capital markets. In some

Trends and Patterns in Public Finance: Theoretical and Empirical Aspect
100
cases, they serve as useful precedents for creating and marketing bonds, illuminating the role of escrow funds for debt service, the mechanics necessary for full and timely debt service payment - as well as for the full utilization of bond trustee services - and the use of debt service reserves and other investor protections.
In others, these debt issuances illustrate how to lower default risk by the pooled financing of municipal loans without a state guarantee. Finally, they demonstrate that various types of public-public and public-private partnerships can be used to attract private capital for infrastructure projects. As prototypes for future state debt structures, they hold out the promise of sustainable infrastructure financing in India.
V
Municipal Finances: Maladies and Remedies Own Tax Revenues: A well-administered and stable source of own tax revenues is an advantage. Conceptually, the assignment of finance should follow functions. This, along with the need to have a strong link between revenue and expenditure decisions for reasons of accountability, requires that municipal bodies should have significant revenue powers. Reform will have to address both assigning new revenue sources and reform the existing ones. On the former, the property tax assigned to municipalities suffers from several infirmities. Apart from octroi, which is a major source of own tax revenue for local bodies in some States (but could face abolition), property tax is a dominant own tax revenue source. Across most municipal bodies, the Annual Rental Value (ARV) is the base over which property tax is charged. The very definition of this base constrains its potential to a large extent. Most Municipal Acts define the ARV as “gross annual rent of land and building at which they might reasonably be expected to let”. Since “reasonable expectation” is subjective (and in some cases capped by fair rent according to the prevailing “Rent Control Law”), the base of property tax as well as its potential remains depressed. This apart, irregular assessment and lack of periodic revision have led to wide gaps between the actual and the assessed base, while a weak administrative system has resulted in low collection efficiency for property tax. Also, many of the newly formed local bodies, owing to inadequate information systems, have not assessed the entire range of properties available under their jurisdiction. As a result of these factors, while property prices might demonstrate reasonable buoyancy depending on demand and supply, property taxes have not shown similar growth rates. Nevertheless, certain entities have been able to initiate reforms

Urban Public Finance Structure-Creating Architectural Niches
101
in the computation, assessment, use of GIS for 100% mapping and coverage of all properties, and improved collection mechanism, which have resulted in growth in property tax receipts.
While the long-term approach should be to remove the hindrances in the development of organised markets and look at reforms of all laws related to property transactions such as rent control acts and land ceiling acts and stamp duties, in the interim, it may be useful to have an area-based levy, differentiated by location and the quality of construction. This, however, would require periodic revisions. In many countries proceeds from the sale of land and buildings are an important source of financing urban infrastructure. However, in India, the state governments appropriate revenue by creating separate land and housing development agencies. It is necessary that the proceeds from the sale of land should be clearly earmarked for financing urban infrastructure. In view of the critical importance of property tax as a source of own revenues, the efforts made by the ULBs in administering property tax, their track record in revising property tax rates, and their collection efficiency to assess the likely improvement in this source of revenue in future do matter significantly.
Transfers Another major area of reform pertains to the states' transfer system. According to the Constitution the States are obliged to devolve a portion of the net proceeds of their taxes, duties, tolls and fees to the ULBs, on the basis of the recommendations of the State Finance Commissions (SFCs). While such devolutions form an important component of the total receipts of ULB, the fact that the SFCs’ prescriptions on the extent of transfer are recommendatory, and ultimately the extent of transfer is decided by the Legislature (which effectively means the State government). Thus, ULBs are reliant to a large extent on the State government for both their financial and operational autonomy. Although States cannot directly appropriate any surplus generated by a ULB, they can limit the ULB’s autonomy by setting terms for inter-governmental transfer, revenue and expenditure responsibility; allocating/ redistributing tax authority; and mandating spending.
On the other hand, the problems have been with both the adequacy and appropriateness of allocation. The state finance commissions, except in a few states, have been thoroughly unprofessional and have based their recommendations neither on principles nor on reliable information. Consequently, their recommendations have been largely unimplementable, leading to states adopting arbitrary and ad hoc forms of transfers. Nobody has bothered to collect reliable data on economic, demographic and fiscal

Trends and Patterns in Public Finance: Theoretical and Empirical Aspect
102
variables of municipal bodies. There is very little that the ULB as a single institution could do to get a larger share of the pie. Of late, ULBs have been demanding from the State Finance Commissions that consideration of origin and quantum of revenue and its collection efficiency should be given higher weights, and ULBs should be motivated to generate higher quantum of sharable revenues. This is also a battle the state governments fight every now and then with their central counterpart before the National Finance Commissions as far as taxes and duties collected by the Union Government from the respective state jurisdictions are concerned. Bringing professionalism into the SFCs is the key to reforming the state transfers.
Regular monitoring of the recommendations made by the SFC concerned and the extent of adherence to it in the existing devolution mechanism is essential. Of the total pool of SFC devolution (usually a percentage of the State government’s Non-Loan Government’s Own Revenue Receipts, or NLGORR), the manner in which inter se allocation among local bodies is decided should also be evaluated. A formula-based allocation mechanism, which provides incentives for an entity to improve its own revenue collection, is considered useful. TFC has taken a step in this direction (Table 3)
Moreover, planning for urban services takes priority and states should wake up to it. The Expert Group on decentralised planning has recommended bottom-up planning from wards and consolidation by the District Planning Committees. This would, however, require setting up a reliable management information system. It is ironical that in most states, there is no mechanism to collect basic information relating to municipal bodies. The urban departments in the states should take the initiative to collect basic information required for planning.
Non-Tax Revenues: This stream of revenues is traditionally the weakest on account of inadequate user charges, poor collection of rent on own properties, and generally lax administration, with the result that the available non-tax revenue sources are under-exploited. They should be collected periodically from the consumers through an efficient billing and collection system, which plugs leakages at various levels of management. Different streams of user charges should be accounted for separately in proper escrow arrangements so that cross-subsidy is avoided. Even if it is provided, the quantum and category of consumers enjoying the subsidy should be explicitly accounted for in the accounts of respective utilities. An associated requirement is easy to maintain and retrievable data on consumers, their consumption and billing and payment status.

Urban Public Finance Structure-Creating Architectural Niches
103
Scheme Specific Grants: The appropriateness of scheme-specific grants depends on the administering of the scheme and the commitment of the State government towards the scheme. Grants without end-use stipulations, in general, have limited utility and if inadequately monitored could end up being used to meet routine revenue expenditures Such grants increase dependence on the State government and their sustainability is usually not very high, given that they are not linked to any policy initiative. Also, considering the tendency of States to delay passing on Central grants to local bodies, the resulting uncertainty in the timeliness of release of such grants reflects negatively on the credit perspective. In general, grants can be viewed positively, provided they are devolved without delay, lead to capacity build up within the ULB, and their utilisation is adequately monitored both by the entity and by the State government.
Liquidity and Debt Profile In the absence of bank-supported lines of credit, the timeliness of State support assumes critical importance. It is important to note the manner in which the State government concerned extends its subventions and grants (including Central grants where the State is a pass through) both in terms of extent of support and the schedule of flow of these grants. Entities with low or negative own revenue balances, which incur debt on the strength of grant flows, are usually viewed negatively as the long-term sustainability of such grants may be an issue of concern. The soundness of liquidity and debt profile depends on whether the debt obligation can be adequately met out of an entity’s own revenues after it has met its obligatory expenses.
VI
Reflections on Theory and Practice of Urban Public Finance Devolution of sources of revenue, especially autonomous tax authority, largely determines the nature and the effectiveness of urban governance. However, the ULBs have a narrow tax authority and are subject to fiscal stress. It is well laid in public finances theory that the expenses matching with functions should also match revenues. The matching of revenues with expenses is an essential indicator of state of financial health of local governments and a necessary requirement in some of the countries. However, conceptually there exist potential mis-matches due to the design of the system such that there is devolution of responsibility but not equivalent revenue (which is known as vertical imbalance) and that there is variation in

Trends and Patterns in Public Finance: Theoretical and Empirical Aspect
104
the revenue generation capacity of respective local governments (which is known as horizontal imbalance).
It is a standard practice that most of the urban local governments in several countries rely upon tax revenues as a major source of income, within which they depend upon the reliable and stable taxes like the property tax universally, and, to some extent, on income tax, where it is levied and collected. Buoyant taxes like those on flow of goods and services do not provide a major income, whereas this tax together with income tax forms a major proportion of tax revenue of central/federal governments. Unlike the revenue sources, which present a good structure/ arrangement and sources, expenditure is not well-structured and varies over countries and time with the assignment of functions, which itself undergoes change. In fact, expenditure is an area, where the local governments have little control and lesser discipline. Federal/central governments of several countries tend to devolve the functions to lower tiers of governments but do little when it comes to finances. Fiscal imbalances that arise in several systems are on account of such one-sided devolution – devolution on expenditure side but non-devolution on income side.
Historically, the majority of Indian urban infrastructure projects undertaken by ULBs have been financed via subsidies from the central and state governments, direct debt issuance by the states, or borrowings by state corporations that are dependent on state government budgetary appropriations or guarantees. This reliance on external government funding for local infrastructure projects has done little to promote fiscal and administrative responsibility among the ULBs, but has, instead, contributed to the fiscal ills of the central and state governments. Many states have structural budget deficits and issue debt to cover both capital needs and operating deficits. A study conducted for the
The legislation (usually called as a “Municipality Act”) would define, among other things, a ULB’s constitution, its range of obligatory and discretionary functions, revenue raising powers, and the nature and extent of support it would receive from the State government. Also, this legislation can be altered only by the State legislature. Therefore, a ULB’s credit quality and the resulting governance depends on the larger macroeconomic environment prevailing in the State, which in turn is influenced by the policies of the State government.
The other problems which the constitutional arrangement creates are: first, many of the activities which should have been in the municipal domain

Urban Public Finance Structure-Creating Architectural Niches
105
continue with the states; second, even when functions are assigned, states continue to exercise their jurisdiction; third, independent agencies of state governments perform several functions in the local domain and finally the state can impose conditions on the municipal bodies in the exercise of their powers. Overlapping jurisdictions between various state departments, independent agencies and the urban local bodies have resulted in lack of clarity in the service domain and indulgence in a blame game for the failures.
The general principles to guide the assignment of revenue sources among the three levels of government is the Congruence Principle which states that the less mobile the tax base and the stronger the spatial concentration of the tax base and ownership, the lower should be the level of the governments to which those taxes should be assigned. Using the criteria of equity and efficiency, Musgrave (1984) suggested the following broad principles of revenue assignment:
(i) Taxes suitable for stabilization should be central;
(ii) Progressive redistributive taxes should be assigned to the central governments
(iii) Tax bases distributed highly unequally between jurisdictions should be centralised
(iv) Taxes on mobile factors of production are best handled centrally
(v) Residence-based taxes like sale of consumption goods to consumers and excises are suited to State governments
(vi) Taxes on completely immobile factors are best suited for local levels
(vii) Taxes of lower levels of governments should be cyclically stable
(viii) Benefit taxes and user charges are to be used appropriately at all levels
(ix) Resource taxes and VAT are appropriate for sharing between governments
These theoretical principles can certainly become the guiding principles of fiscal structure of municipal revenue.
Finally, Urban Local Bodies (ULBs) are increasingly coming under pressure of service delivery in India, but with the poor state of their finances, alternative models that are outside the traditional budgets assume importance. Public-Private Partnerships (PPPs) are one such important off-

Trends and Patterns in Public Finance: Theoretical and Empirical Aspect
106
budget model for ensuring service delivery and leveraging private finance wherever possible. The present environment creates an opportunity to improve the state of public finances and to engage the domestic capital market in the sustainable financing of urban infrastructure requirements. Much depends upon the political will at all levels of government to implement the initiatives that have now been taken. Against the backdrop of immediate and immense infrastructure needs, if public sector reforms are encouraged to progress, and if a public finance credit culture is able to develop in India, it could easily become an emerging market model for public finance.
References Eleventh Five Year Plan, New Delhi: Planning Commission, Government of India, 2002 ICRA Rating Services, ICRA Rating Feature, 2005
Musgrave, R. and P. Musgrave, Public Finance in Theory and Practice, McGrawhill, New York, 1989
Report of the Eleventh Finance Commission (Only Basic Data), GOI, New Delhi, June 2000
‘Report of the Twelfth Finance Commission (2005–10)’, Twelfth Finance Commission, Government of India, New Delhi, June 2006.

Trends and Patterns of Public Expenditure in Bihar during
Tenth and Eleventh Five Year Plans Dr. Bakshi Amit Kumar Sinha∗
Keywords: Bihar, Development, Finance, Expenditure, Plan, Revenue.
Abstract
This paper analyses the trends and patterns of public expenditure in Bihar from different angle viz. Plan & non-plan, revenue & capital, development & non-development and service-wise expenditure during the tenth five year plan period of 2002–2007 and eleventh five year plan period of 2007–2012. The total expenditure has grown by around 12.0 percent annually during tenth plan period and 17.4 percent during the eleventh plan. Analysis suggests that the expenditure on plan has increased 10 times in 2011-12 over 2002-03. Non-plan expenditure has also grown substantially by three times during the same period. Expenditure on capital account has accelerated its growth to almost double during the eleventh plan as compared to tenth plan. This study comes out with a result which highlights the sensitivity of debt repayment in recent years. 64.1 percent expenditure was accounted for by development purposes during eleventh plan compared to only 45.6 percent during tenth plan. This study also suggested the priority and dedication of the present government to social and economic development agenda. As a result, the state finance is doing well in respect of expenditure management.
1. Introduction Through public expenditure, the government influences production, consumption and distribution of the state directly or indirectly. It thus helps in the economic and social development of the society. The most important function of the government in a state or nation is proper expenditure management. The management of expenditure in different sectors is a key to success and prioritizes the agenda of the government or of the economy. ∗ Research Associate Centre for Economic Policy and Public Finance (CEPPF) Asian Development Research Institute (ADRI) Email: [email protected]

Trends and Patterns in Public Finance: Theoretical and Empirical Aspect
108
Expenditure pattern is an effective tool by which one can easily assess the situation of the state finances. The expenditure pattern of the government is a very robust tool to control inflation or deflation in an economy. Public expenditure is an important instrument of the fiscal system of a state or a nation. The size and pattern of the public spending has a great relevance in the growth process and in reduction of economic disparities. This paper analyses the trends and patterns of expenditure from different angles viz. plan & non-plan, revenue & capital, development & non-development and service wise expenditure.
2. Methodological Process of the Expenditure This paper analyses the trend of public expenditure in Bihar with the help of data relating to the tenth plan (2002–2007) and eleventh plan (2007–2012) and extends it through further classification of expenditures according to types. Expenditure may be classified plan and non-plan, revenue and capital, development and non-development, salary and non-salary and service-wise expenditure (general services, social services and economic services).
3. Expenditure Classification Public Expenditure, according to the type of accounts, is constituted by consolidated fund, contingency fund and public accounts. Consolidated Fund is constituted under Article 266 (1) of the Constitution of India. This is total expenditure of the government which is incurred from this fund and no amount can be withdrawn from the fund without authorization from the Legislative Assembly or Parliament. Expenditure incurred under the major head from 2011 to 7615 of the budget is accounted for under consolidated fund. Contingency fund has been set up by the Government of India under Article 267 of the Constitution. Contingency fund advances from the fund are made for the purposes of meeting unforeseen expenditure, which are fully recouped as soon as Legislative Assembly or Parliament authorises additional expenditure. The amounts drawn from the fund are recouped by taking a supplementary grant from the Legislature. Expenditure incurred under major head 8000 of the budget is accounted for under contingency fund. In the Public Account constituted under Article 266 (2) of the Constitution, the transactions relate to debt other than those included in the consolidated fund of India and its states. The transactions under debt, deposits and advances in this part are those in respect of which government incurs a liability to repay the money received or has a claim to recover the

Trends and Patterns of Public Expenditure in Bihar during Tenth and …
109
amounts paid. Expenditure incurred under major head from 8009 to 8793 of the budget is accounted under public accounts.
4. Plan and Non-Plan Expenditure The classification of expenditure into Plan and Non-Plan, although not enshrined in the Constitution, has evolved with the initiation of planning process. An expenditure incurred for some definite period is likely to be a plan expenditure and the recurring expenditure is likely to be a non-plan expenditure. Plan expenditure is spent on productive asset creation through centrally-sponsored programmes and flagship schemes, while “non-plan” refers to all other expenditure such as defence expenditure, subsidies, interest payment, expenditures on establishments and maintenance.
The composition of the expenditure on non-plan head has declined over the years. Non plan expenditure of the total expenditure was around 84.6 percent in 2002-03 which decreased to 61.8 percent in 2011-12. As a result, contribution of the plan expenditure has increased over the years from 15.4 percent to 38.2 percent during the same period. Average share of non-plan expenditure in total expenditure during tenth plan was around 80 percent which declined to 62 percent in the eleventh plan, while the share of plan expenditure has increased from 20 percent to 38 percent during the same time. Table 1 presents the share of plan and non-plan expenditure pattern from 2002-03 to 20011-12.
Table 1. Pattern of Plan and Non-Plan Expenditure in Bihar in Tenth and Eleventh Plan
(in percentage)
Total Expenditure Non Plan Plan Tenth Plan (2002-07)
2002-03 100.0 84.6 15.4 2003-04 100.0 87.6 12.4 2004-05 100.0 82.7 17.3 2005-06 100.0 78.3 21.7 2006-07 100.0 65.4 34.6 Average (2002-07) 100.0 79.7 20.3
Eleventh Plan (2007-12) 2007-08 100.0 65.3 34.7

Trends and Patterns in Public Finance: Theoretical and Empirical Aspect
110
2008-09 100.0 62.8 37.2 2009-10 100.0 62.2 37.8 2010-11 100.0 58.8 41.2 2011-12 100.0 61.8 38.2 Average (2007-12) 100.0 62.2 37.8
Table 2 explores the trend of non-plan and plan expenditure. Plan expenditure is further classified into – state plan, centrally sponsored schemes and central plan schemes. One can also see the growth trend of plan vis-à-vis non-plan expenditure during the tenth and eleventh five year plan period. There was almost 12 percent growth in total expenditure during the tenth plan period. If one notices the growth determinants of the expenditure as a whole, it appears that only 5 percent growth was accounted for by non –plan expenditure and a very high growth of 39.3 percent in the plan expenditure during 2002-07. There was a slight increase in non plan expenditure from Rs. 13124 crore to Rs. 17739 crore in the same period. As is seen, the non-plan expenditure showed the highest increase in year 2003-04 (Rs. 19704 crore) which was even higher than the Rs. 17739 crore of the year 2006-07. Plan expenditure had increased substantially from Rs. 2381 crore in 2002-03 to Rs. 9397 crore in 2006-07. The highest increase was recorded in the state plan expenditure which jumped from Rs. 2103 crore to Rs. 8459 core during the same period. Plan expenditure almost doubled in a single year of 2006-07. This higher increase in state plan expenditure resulted in boost to growth in the overall growth in expenditure of Bihar. Table 2 below presents the trends of expenditure under state plan, centrally sponsored schemes and central plan schemes.
Table 2: Trend of Plan and Non-Plan Expenditure in Bihar during Tenth and Eleventh Plan
(Rs. crore)
Total Expend-
iture
Non Plan
Plan State Plan
Centrally Sponsored
Scheme
Central Plan
Scheme Tenth Plan (2002-07) 2002-03 15505.5 13124.2 2381.4 2103.1 7.7 270.6 2003-04 22481.9 19704.2 2777.7 2487.0 0.0 290.7 2004-05 20058.0 16582.1 3475.9 3124.3 1.7 349.9 2005-06 22568.5 17669.8 4898.7 4379.7 5.6 513.4

Trends and Patterns of Public Expenditure in Bihar during Tenth and …
111
2006-07 27136.5 17739.3 9397.2 8459.2 19.2 918.8 CAGR (%)
11.9 5.1 39.3 39.8 614.8 35.2
Eleventh Plan (2007-12) 2007-08 31571.2 20625.5 10945.7 9700.3 23.0 1222.5 2008-09 37181.2 23366.7 13814.5 12335.9 102.9 1375.7 2009-10 42796.0 26601.9 16194.2 13998.0 140.0 2056.1 2010-11 50704.5 29794.0 20910.5 18426.5 126.3 2357.8 2011-12 60181.4 37173.6 23007.9 20321.8 108.2 2577.9 CAGR(%) 17.4 15.3 20.9 20.7 39.2 22.5 Source: Budget Documents, Department of Finance, Government of Bihar Note: CAGR (Compounded Annual Growth Rate)
During the eleventh plan period (2007-08 to 20011-12), expenditure of the state increased substantially at an annual rate of 17.4 percent. If one analyses the growth of total expenditure during the tenth and eleventh plan periods, a higher growth is discernible in the eleventh plan. This is because of pay revision of the government employees during the eleventh plan period (discussed latter). This is very clearly reflected in the non-plan expenditure growth. Thus, the pattern of growth of non-plan expenditure in the eleventh plan period has accelerated three times compared to decline in growth of plan expenditure by almost half compared to the tenth plan period. The plan expenditure increased in the terminal over the first year by around five times of the tenth plan period compared to only double the increase during the eleventh plan period. Determinant of the growth of expenditure during tenth plan was plan expenditure but in the eleventh plan period non-plan expenditure has also determined the growth. This growth pattern of plan and non-plan expenditure indicates that the health of state finances has been improving over the years and sustained a high growth of 15.2 percent during the entire period of tenth and eleventh plan. Growth in plan expenditure accounted for a high growth of 31.8 percent during this period compared to only nine percent growth in non-plan expenditure. It may be borne in mind that the non-plan expenditure includes the components of both development expenditure and capital expenditure. So, we cannot neglect the importance of non-plan expenditure. From the analysis of the trends and patterns of expenditure of plan vis-à-vis non-plan, one gets an idea of the health of state finances of Bihar and of the economy as well. Plan and non-plan expenditure is further classified into revenue and capital expenditure.

Trends and Patterns in Public Finance: Theoretical and Empirical Aspect
112
5. Revenue and Capital Expenditure
The Revenue-Capital classification has been incorporated since the inception of the budget. Article 112 (2) of the Constitution distinguishes only between ‘expenditure on revenue account’ and ‘other expenditure’. But in practice, ‘expenditure on revenue account’ has been taken to mean revenue expenditure. Similarly capital expenditure may not always be an investment. For example, injection of equity into loss making units, which is conceptually a subsidy, is treated as capital expenditure.
Revenue expenditure is incurred on operation of the different services of departments, interest payments, subsidies, and pensions. In other word, this type of expenditure does not generate any capital and assets. Capital expenditure includes expenditure which creates capital and assets. The accrual benefit of this expenditure is normally for a longer period of time.
Revenue expenditure under major head 2011 to 3046 of the budget document of plan as well as non-plan accounts and capital expenditure occurs under 4047 to 7615 of major head of the plan and non-plan budget.
A look at Table 3 reveals the revenue and capital expenditure trend and pattern. As discussed earlier, growth of total expenditure during the eleventh plan was more than the tenth plan period. The determinant of the growth during tenth plan was revenue expenditure which contributes to around 73 percent annually. The annual rate of growth during the tenth plan of revenue expenditure was 14.7 percent. The capital expenditure was growing with half a pace of revenue expenditure during this period. The share of capital expenditure to total expenditure during tenth plan period was only 27 percent.
Table 3: Trend and Pattern of Revenue vis-à-vis Capital Expenditure in Bihar
Total
Expenditure
Expenditure on (Rs. Share from Total Revenue Accounts
Capital Accounts
Revenue Expenditure
Capital Expenditure
Tenth Plan (2002-07) 2002-03 15505.5 12255.1 3250.4 79.0 21.0 2003-04 22481.9 12710.8 9771.1 56.5 43.5 2004-05 20058.0 14638.4 5419.6 73.0 27.0 2005-06 22568.5 17756.0 4812.5 78.7 21.3 2006-07 27136.5 20585.0 6551.4 75.9 24.1 CAGR (%) 11.9 14.7 7.2 72.6 27.4

Trends and Patterns of Public Expenditure in Bihar during Tenth and …
113
Eleventh Plan (2007-12) 2007-08 31571.2 23562.9 8008.3 74.6 25.4 2008-09 37181.3 28511.6 8669.7 76.7 23.3 2009-10 42796.0 32584.2 10211.9 76.1 23.9 2010-11 50704.5 38215.9 12488.6 75.4 24.6 2011-12 60181.4 46499.5 13681.6 77.4 22.6 CAGR (%) 17.3 18.0 15.3 76.0 24.0 Source: Budget Documents, Department of Finance, Government of Bihar Note: CAGR (Compounded Annual Growth Rate)
During the eleventh plan period, the pace of growth has been accounted for by both the fronts viz. revenue and capital. Revenue expenditure registered 18 percent growth as compared to 15.3 percent growth in capital expenditure during the eleventh plan. The pace of growth may be observed on account of capital expenditure rising from 7.2 percent in the tenth plan period to 15.3 percent in the eleventh plan period. The composition of revenue and capital expenditure during the tenth and eleventh plans is presented in Table 3. The share of revenue expenditure in eleventh plan has gone up by 3 percentage points compared to that in tenth plan. As a result, expenditure on capital and assets creation shows a cut by 3 percentage points during the eleventh five year plan. Share of revenue expenditure has gone up due to pay revision of the government employees during the eleventh plan period as discussed earlier. At the end of analysis of expenditure pattern of revenue vis-à-vis capital expenditure, there is a positive sign coming out with an increasing pattern of growth on capital expenditure resulting in creation of assets and capital in the state. Similarly, growth in revenue expenditure is also a good sign for state finance which creates direct and indirect income in the state. But the increase in the share of revenue expenditure is not good for the health of public finances in the state. Nonetheless, revenue expenditure also accounts for a larger part of development expenditure. The revenue and capital expenditures are further classified into development and non-development expenditure.
6. Development And Non-Development Expenditure One of the usual methods of presenting Government expenditure is to classify it into two categories, viz. development and non–development expenditure. Expenditure on debt services is separately shown and is not classified either as development or non–development expenditure. The functional classification development expenditure is broadly defined to include all items of expenditure that are designed directly to promote

Trends and Patterns in Public Finance: Theoretical and Empirical Aspect
114
economic development and social welfare. In this paper, while analyzing the development expenditure on revenue account, expenditure on budget heads under groups of social services and economic services is being treated as development expenditure. Non–development expenditure includes expenditures appearing under general services. It includes expenditure pertaining to the general services rendered by the government such as preservation of law and order and the maintenance of the general organs of the Government. Development expenditure under capital account includes capital outlay and non-development expenditure account includes loan and advances.
While analyzing the development and non-development expenditure, it is discerned that the composition of development expenditure is only 42.9 percent in 2002-03 and even less (31.5 percent) in 2003-04. The bulk of expenditure is accounted under non-development head. Repayment of public debt was also a major concern during the tenth plan period. The trend of repayment of public debt has been declining over the years. The growth of expenditure on account of development head was 26.7 percent during the tenth plan period which determined the growth of total expenditure. Non-development expenditure registered only 4.7 percent growth during the same period. The decline in the trend of growth (- 22 percent) was on account of repayment of public debt. As presented in Table 4, growth of expenditure has sustained across development and non development items. The growth of development expenditure accounts for 20.2 percent during the eleventh plan as compared to higher growth of 26.7 percent during the tenth plan period. As a result, development expenditure has been growing at a higher rate but the pace of growth declined has over the years. The situation is reversed in the case of non-plan expenditure. Non-plan expenditure has grown at the rate of 20.2 percent annually during the eleventh plan compared to only 4.7 percent during the tenth plan. The same trend may be noticed on repayment of public debt which grew at the rate of 15.4 percent during the eleventh plan as compared to negative growth (-22 percent) in the tenth plan.

Trends and Patterns of Public Expenditure in Bihar during Tenth and …
115
Table 4: Trend and Pattern of Development and Non-development Expenditure in Bihar
Expenditure on which: (Rs. crore) Share from Total Expenditure to: (%)
Total Expendit
ure
Development
Expenditure
Non-develop
ment Expend
iture
Public Debt
Development
Expenditure
Non-develop
ment Expend
iture
Public
Debt
Tenth Plan (2002-07) 2002-03 15505.5 6648.9 7321.3 1533.5 42.9 47.2 9.9 2003-04 22481.9 7080.8 9744.4 5653.0 31.5 43.3 25.1 2004-05 20058.0 8035.2 8931.3 3087.2 40.1 44.5 15.4 2005-06 22568.5 11312.9 10270.6 980.8 50.1 45.5 4.3 2006-07 27136.5 17149.1 8958.3 1025.0 63.2 33.0 3.8 CAGR (%)
11.9 26.7 4.7 -22.6 45.6 42.7 11.7
Eleventh Plan (2007-12) 2007-08 31571.2 20409.7 9524.7 1631.9 64.6 30.2 5.2 2008-09 37181.3 24414.5 11080.6 1682.3 65.7 29.8 4.5 2009-10 42796.0 27606.5 13099.1 1983.0 64.5 30.6 4.6 2010-11 50704.5 32121.6 16389.6 2190.0 63.4 32.3 4.3 2011-12 60080.0 37518.6 19635.8 2922.5 62.4 32.7 4.9 CAGR (%)
17.3 16.1 20.2 15.4 64.1 31.1 4.7
Source: Budget Documents, Department of Finance, Government of Bihar Note: CAGR (Compounded Annual Growth Rate)
Table 4 also presents a picture of the composition of development and non-development expenditure. It is revealed that the share of developmental expenditure has been increasing significantly over the years. During eleventh plan period, expenditure on development items contributed 64 percent as compared to 31 percent on non-development items. As a result, expenditure on developmental head is more than the non-developmental, with an increasing trend. Hence, the expenditure management on the degree of development and non-development, state finance is moving in the right direction and is well-guided. The development and non-development expenditure is further classified into service wise expenditure such as general services, social services and economic services.

Trends and Patterns in Public Finance: Theoretical and Empirical Aspect
116
7. Service-Wise Expenditure There are three types of services – general services, social services and economic services. The general services rendered by the Government include maintenance of law and order, defence of the country and the maintenance of the general organs of the Government. General services are accounted under major heads of 2011 to 2075 of revenue account and 4047 to 4070 of capital account. Social services include services meant for social development. The expenditure on social services includes education, sports, art and culture, public health and family welfare, water supply and sanitation, housing and urban development, information and broadcasting, welfare of scheduled castes and scheduled tribes and other backward classes, labour welfare, social welfare and nutrition and other social services. Major heads of the budget, from 2202 to 2251 of revenue expenditure, from 4202 to 4250 of the capital outlay, from 6215 to 6250 of loans and advances, account for expenditure on social services. Under economic services are included the activities and services meant for economic development. These are broadly divided into agriculture and allied activities, rural development and special areas programmes, irrigation and flood control, energy, industry and minerals, transport, communications, science, technology and environment, general economic services and secretariat economic services. Economic services are reported under major head 2401 to 3475 of revenue account, 4401 to 5475 of capital outlay and 6401 to 7615 of loan and advances. Grants-in-aid, contributions and public debt one not included in these services. The priority and agenda of the government reflects in the expenditure accounted in different services. General services alone accounted for 42.9 percent in 2002-03 fiscal. The share of expenditure on social and economic services was only 26.3 and 20.9 percent respectively for the same fiscal. Expenditure on repayment of public debt also had high share in total expenditure as earlier discussed. The share of general services (36.9 percent), social services (24.7 percent), economic services (24.7 percent) and public debt (11.7 percent) presents the picture of state finances during the tenth plan period. A combination of general services and public debt constituted 48.6 percent of expenditure in Bihar during this period. But the growth of expenditure across the services was very impressive. Social services grew at an average of 7.6 percent, while the highest growth of 23.0 percent accounted for economic services, followed by social services 22.2 percent. Public debt showed declining trend with an annual rate of (-) 22.6 percent.

Table 5: Expenditure on General, Social and Economic Services in Bihar
Expenditure on which: (Rs. crore) Share from Total Expenditure to: (%) Total
Expenditure General Services
Social Services
Economic Services
Public Debt
General Services
Social Services
Economic Services
Public Debt
Tenth Plan (2002-07) 2002-03 15505.5 6655.1 4081.7 3233.6 1533.5 42.9 26.3 20.9 9.9 2003-04 22481.9 7197.5 4224.8 5402.7 5653.0 32.0 18.8 24.0 25.1 2004-05 20058.0 7871.5 4941.9 4153.6 3087.2 39.2 24.6 20.7 15.4 2005-06 22568.5 8594.8 7189.9 5798.9 980.8 38.1 31.9 25.7 4.3 2006-07 27136.5 8798.0 8513.2 8796.1 1025.0 32.4 31.4 32.4 3.8 CAGR (%) 11.9 7.6 22.2 23.0 -22.6 36.9 26.6 24.7 11.7 Eleventh Plan (2007-12) 2007-08 31571.2 9474.5 10666.9 9792.9 1631.9 30.0 33.8 31.0 5.2 2008-09 37181.3 10736.2 12892.1 11866.7 1682.3 28.9 34.7 31.9 4.5 2009-10 42796.0 12476.8 14309.0 13919.8 1983.0 29.2 33.4 32.5 4.6 2010-11 50704.5 15682.7 16161.5 16667.1 2190.0 30.9 31.9 32.9 4.3 2011-12 60080.0 18337.8 19535.9 19380.7 2922.5 30.5 32.5 32.3 4.9 CAGR (%) 17.3 18.5 15.4 18.6 15.4 29.9 33.3 32.1 4.7 Source: Budget Documents, Department of Finance, Government of Bihar
Note: CAGR (Compounded Annual Growth Rate)

Trends and Patterns in Public Finance: Theoretical and Empirical Aspect
118
Table 5 illustrates the expenditure across the services in Bihar during the tenth plan vis-à-vis eleventh plan period. One may notice that the growth of each service is more than 15 percent. The highest growth (18.6 percent) was accounted for by economic services followed by general services (18.5 percent) and social services (15.4 percent). The government seems sensitive to the repayment of public debt. This is reflected from the annual growth of around 15.4 percent. The concern about the health of finance is reflected in the declining trend of growth of social services as well as economic services, which was the developmental part of the expenditure in the eleventh plan as compared to the tenth plan. There is increasing trend of growth in the general services during eleventh plan as compared to tenth plan. But the composition of economic and social services has been increasing over the years and is also reflected during the tenth and eleventh plan periods. The average expenditure on social services accounted for a high share of 33.3 percent followed by economic services of 32.1 percent and general services of 29.1 percent during eleventh plan period. The expenditure on repayment of public debt accounted for only 4.7 percent of the total expenditure during the same period. As an output, expenditure on different services indicates the priority and agenda of the government for social and economic services, which shows a lead in the developmental expenditure. Hence, the expenditure management of the grade of services, of state finance is going on a precise path and is well directed. For the analysis of expenditure in different approach, salary and non salary expenditure is also an important tool to assess the position of the state finances, specially to assess the pay revision effect.
8. Salary and Non-Salary Expenditure The analysis expenditure management is categorised into two groups, viz. salary and non-salary expenditure. In this paper, while analyzing the salary and non-salary expenditure, expenditure on pension is also included in the salary expenditure. The salary and pension constitute the two most important items of expenditure for the state. The trend of salary (including pension) and non-salary expenditure are represented in Table 6.

Table 6: Expenditure and Share of Salary, Pension and Non-salary Expenditure in Bihar
Expenditure on which: (Rs. crore) Share from Total Expenditure to: (%)
Total Expenditure
Expenditure on Salary
Expenditure on Pension
Expenditure on Non-salary
Expenditure on Salary
Expenditure on Pension
Expenditure on Non-salary
Tenth Plan (2002-07) 2002-03 15505.5 5073.1 2273.0 8159.5 32.7 14.7 52.6 2003-04 22481.9 5019.9 2049.0 15413.0 22.3 9.1 68.6 2004-05 20058.0 5005.4 2269.0 12783.6 25.0 11.3 63.7 2005-06 22568.5 5783.4 2325.0 14460.1 25.6 10.3 64.1 2006-07 27136.5 6016.2 2456.0 18664.3 22.2 9.1 68.8 CAGR (%)
11.9 4.9 2.9 17.2 25.6 10.9 63.6
Eleventh Plan (2007-12) 2007-08 31571.2 6469.5 2789.0 22312.7 20.5 8.8 70.7 2008-09 37181.3 7601.2 3479.0 26101.1 20.4 9.4 70.2 2009-10 42796.0 9658.8 4318.7 28818.6 22.6 10.1 67.3 2010-11 50704.5 10549.7 6143.9 34010.9 20.8 12.1 67.1 2011-12 60080.0 12185.0 7808.5 40086.6 20.3 13.0 66.7 CAGR (%)
17.3 17.3 30.1 15.4 20.9 10.7 68.4
Source: Budget Documents, Department of Finance, Government of Bihar
Note: CAGR (Compounded Annual Growth Rate)

The salary of state government employees alone accounted for 32.7 percent in addition to 14.7 percent of expenditure on pension which constituted nearly half of the expenditure in 2002-03. The expenditure other than on salary accounts was only 52 percent for the same year. The share of non-salary expenditure has been increasing over the years and reached up to 68 percent in the year 2006-07. The average share of salary including pension was 36.4 percent, and the rest of 63.6 percent was spent on other purposes during the tenth plan period. There has been a slow growth of salary (4.9 percent) and pension (2.9 percent) expenditure during the same period of time. A very high growth of 17.2 percent was registered on expenditure meant for non-salary purposes. As an output, the composition of non-salary expenditure increased from 52.6 percent in 2002-03 to 68.8 percent in 2006-07. Table 6 presents the detailed expenditure of salary, pension and non salaried expenditure for the period of 2002-03 to 2011-12. The analysis of the table reveals that the annual growth of salary expenditure was only 4.9 percent in the tenth plan, which increased four times and reached 17.3 percentage points during eleventh plan. The same trend may be obtained in the context of expenditure on pension which grew at an even faster rate of 30.1 percent in the eleventh plan compared to only 2.9 percent during the tenth plan. This growth has been justified and pushed by the recommendations of the Sixth Pay Commission. During 2007-08 to 2011-12, there had been substantial increases in expenditure on these accounts by almost Rs. 5700 crore for salary and Rs. 5000 crore for pension, which occurred due to pay revisions following the Pay Commission recommendation. It was made effective from April, 2007, with arrears disbursed in parts during 2008-09, 2009-10 and 2010-11. But in this period expenditure on other than salary account also sustained the annual growth rate of about 15.4 percent during eleventh plan period. The State government not only sustained the annual growth of non-salary expenditure but also increased the composition of the non-salary expenditure from 63.6 percent in the tenth plan to 68.4 percent in eleventh plan period.
9. Conclusion This paper analysed the expenditure pattern from several angles. Over all expenditure has grown by around 12 percent annually during the tenth plan period adding 5.4 percentage points during the eleventh plan period. This growth has been sustained by the state government, particularly after 2005. The high growth of 15.2 percent accounted for total expenditure in Bihar during a total period of tenth and eleventh five year plans. Analysis suggests

Trends and Patterns of Public Expenditure in Bihar during Tenth and …
121
that the expenditure on plan head has increased by 10 times in 2011-12 over 2002-03. Non-plan expenditure has also grown substantially which was around three times during the same period. Reflecting the status of public finance in respect of revenue and capital accounts, the expenditure on revenue accounts has been growing at 16.5 percent which includes Sixth Pay Commission hikes, and expenditure on capital item has been increasing at an annual growth rate of 12.7 percent. Expenditure on capital account has accelerated its growth to almost double during the eleventh plan as compared to the tenth plan. This study has also highlighted the sensitivity to debt repayment in recent years. The present government is very sincere about repayment of loans and advances, either to internal sources or to the central government. There is 64.1 percent expenditure accounting for development purposes during the eleventh plan, which was only 45.6 percent during the tenth plan. But the growth rate of development expenditure declined from 26.7 percent in the tenth plan to 16.1 percent in the eleventh plan. Even non-developmental expenditure has been growing at a faster rate of more than 20 percent annually during the eleventh plan. The expenditure pattern among the different services of general, social and economic sectors, and the higher share of general services (36.9 percent) in the tenth five year plan shifted to the most prioritised sectors of social services and economic services during the eleventh five year plan. This suggests the priority and dedication of the present government to social and economic development agenda. After implementation of the Sixth Pay Commission revision, the expenditure on salary and pension got a hike and grew by 21.5 percent annually. The non-salary expenditure also grew at more than 15 percent annually during the same period. As a result, the state finance is doing well in respect of expenditure management.
References Department of Commercial Tax, (2011-12), - ‘Annual Report’, Government of Bihar.
Department of Finance, (2013-14), - ‘Budget at a Glance’, Saraswati Press Ltd., (Government of West Bengal Enterprise) Kolkata – 700056.
Department of Finance, (2013-14), - ‘Revenue and Capital Receipts (Detailed)’, Saraswati Press Ltd., Government of West Bengal Enterprise, Kolkata – 700056.

Trends and Patterns in Public Finance: Theoretical and Empirical Aspect
122
Department of Finance, (February 2013), - ‘Economic Surveys – 2012-13’, Government of Bihar, Saraswati Press Ltd., Government of West Bengal Enterprise, Kolkata – 700056.
Dr. Vathsala Ramji, et al, (2001), - ‘A Study on Management of Public Expenditure by State Governments in India’, The Indian Institute of Economics;
G. S. Sahota, (1961), - ‘Indian Tax Structure and Economic Development’, Asia Publication House.
Planning Commission, (July, 2011), - ‘Report of the High Level Expert Committee on Efficient Management of Public Expenditure’, Government of India.
Raja J. Chelliah, (1971), - “Trend in Taxation in Developing Countries”, Staff Papers, Vol. XVIII.
Reserve Bank of India,- (2012)- ‘Handbook of Statistics on Indian Economy’, RBI.
Reserve Bank of India, (2013), - ‘State Finances A Study of Budgets’, RBI.

De facto Autonomy of the Third Tier of the Government
CA Atanusasan Mukhopadhyay1
Wide publicity to the concept of local governments as the third tier of government has already made an impact on the minds of common people through innumerable government and non-government documents and literature. List II (State List) included in the Seventh Schedule to the Constitution of India along with List I (Union List) and List III (Concurrent List) specifies the functions of the state governments as well as the functions of local governments. Panchayats and municipalities which form local governments are state subjects. Therefore, any legislation forming the structure of local governments can only be enacted at the state level. Till the 73rd and 74th constitutional amendments were effected, the states were the only sub-national units officially recognised by the Indian constitution. Before such amendments, local governments in India were organised not on the basis of any power or authority granted to them by law, but rather through executive decisions of the state governments which were free to extend or control their functional sphere. The 73rd and 74th amendments take away such options that state governments previously unquestionably enjoyed, and the amendments have definitely improved the constitutional authorities of the local governments. The question is, after the recognition of the local governments in the Constitution how much administrative self-sufficiency of the local governments particularly from the viewpoint of financial autonomy, is really ensured. Where the answer to this will come from will tell you about the de facto rather than the de jure state of affairs. In this article, our endeavour will be to find why it is presumed that local governments persistently suffer from inherent deficiency in providing good administration and using funds properly for public purposes. . It should be possible for the concerned ministries of union government, and Comptroller & Auditor General of India to strengthen the system of checks and balance in the third tier of government. We will consider why, once this is done, it should not be incumbent upon both state governments and the union government to
1 Municipal Finance Expert, Change Management Unit, Municipal Affairs Department, Govt. of West Bengal

Trends and Patterns in Public Finance: Theoretical and Empirical Aspect
124
bestow, after a certain period of time (which could be considered as transition period), full financial autonomy on the local governments. In fact, regular holding of election of the local bodies is now almost guaranteed by the 73rd and 74th constitutional amendments. Theoretically, greater functional responsibilities and financial powers have been devolved upon the local governments. Adequate representation to weaker sections and women in the local bodies as well as certain other constitutional obligations can no more be ignored. Yet, do such reforms mean administrative self-sufficiency of the local governments? The answer is generally in the negative, especially in the case of Panchayats. State representatives were never willing to allow much autonomy to the local governments. One will recall that the 64th Amendment Bill introduced in the Parliament in July 1989 to confer constitutional status on rural local governments, was defeated in the Rajya Sabha on the criticism that it did not take into consideration the states in the design of local government reforms. The 73rd and 74th constitutional amendments were ultimately introduced in Parliament in September 1991 in the form of two separate bills – the 72nd Amendment Bill for rural local bodies or Panchayats, and the 73rd Amendment Bill for municipalities. The amendments were officially enacted through the Constitution (73rd Amendment) Act 1992 (commonly referred to as the Panchayati Raj Act) and the Constitution (74th Amendment) Act 1992 (commonly referred to as the Nagarpalika Act). An additional List (Local Body List) was not even thought of in the backdrop of state governments’ undisputed supremacy, authority and control over the local governments. There was further action tantamount to twisting the knife. The Eleventh and the Twelfth Schedules specifying wide ranges of activities introduced as a result of the 73rd and 74th amendments respectively were made subject to operative restrictions in Article 243G and Article 243W. Both the articles empower States to endow Panchayats or Municipalities with such powers and authority as may be necessary to enable them to function as institutions of self-government. Devolution of certain powers and responsibilities (activities included in the Eleventh and Twelfth Schedules come within such powers and responsibilities) upon local governments is also the discretion of the state. What transpires from the above is that the constitutional recognition of the local governments speaks about certain democratic decentralisation which essentially does not amount to administrative decentralisation. Decentralisation, a buzzword in any contemporary discussion on empowering lower level functionaries, has different imports. In a World Bank group study

De facto Autonomy of the Third Tier of the Government
125
(website : http://www1.worldbank.org/publicsector/ decentralization/admin.htm), it is stated that decentralisation relaxes national control and creates the potential for more regional variation in civil service conditions. Decentralisation can improve “access to services, tailoring government actions to private needs, and increasing the opportunities for state-society interactions”. It talks about the need for civil service reform to support decentralisation. “Civil service reform – both capacity building and adjusting to decentralisation – addresses the first of these requirements.” One will perhaps read from the field level situation that the large scale exercises in capacity building and adjusting to decentralisation are far from being effectively conceived in the case of local governments. The sporadic and arbitrary activities taken up on the basis of negative observations made in the reports of 12th and 13th Finance commissions of Government of India, do not vouch for the sincerity of the states to strengthen the local governments. In the name of strengthening the third tier of the government, and that too with the liberal backing of the constitution, states have been authorized to decide how much should be devolved upon the local governments without there being a separate Local Body List. Moreover, there is no time-frame of the continuance of the present tendency on the part of the states not to part with the reins of power in favour of the local governments especially with reference to financial autonomy. Such retention of absolute authority by the states could be considered justified, had the retention been for a specified period. Then this could serve as a platform for nurturing different capacity-building exercises of the local government administrators. In pursuance of the recommendations of the Eleventh Finance Commission, Technical Guidance and Supervision/ Support (TGS) Entrustment to Comptroller & Auditor General of India (for details website : www.cag.gov.in/html/localbodies.htm may be visited) is an effective capacity building exercise to deal with incapacity of the persons involved in the administration of the local governments. In the public domain, ultimately almost every administrative decision involves spending of public funds. Naturally, efficiency in the handling of public funds leaves a long lasting impression on the minds of people as to whether the spenders of public funds are worth shouldering such responsibilities. But how do you judge this capability and what is the measure? In the context of public funds, appropriately structured inbuilt checks and balance system would monitor the spending and standardize the expected levels of efficiency. The reality is that not enough oppprtunities have been given to the local governments

Trends and Patterns in Public Finance: Theoretical and Empirical Aspect
126
through such standard measures to arrive at the standards achievable by them. Consequently, it is not justified to presume that local governments are not capable of providing pro-poor administration to the people and utilise funds properly for public purposes. Under the aegis of Comptroller & Auditor General of India, certain modules and manuals have been developed which, if properly implemented on time, could orient the spending of public funds at local government levels to the desirable directions. These are : 1. Auditing Standard for PRIs and ULBs 2. Guidelines for Certification audit of PRIs 3. Manual of Instructions for Audit of Panchayati Raj Institutions 4. Training Modules for PRI Accounts 5. National Municipal Accounting Manual 6. Training Module on Audit of Zilla Parishad and Panchayat Samiti 7. Training Module on Audit of Gram Panchayat 8. National Municipal Accounting Training Manual 9. List of codes functions, programmes and activities for PRIs 10. Simplified Accounting System for PRIs. Let us divide our discussion into two segments – Urban Local Body (ULB) and Rural Local Body (RLB), the two established components of local governments. For about a decade, enormous labour and thoughts have been devoted to capacity building of the concerned administrators of both Urban Local Body (ULB) and Rural Local Body (RLB). One of the important components of the reform programmes in the ULBs is the implementation of accrual-based double entry accounting. Also, under Jawaharlal Nehru National Urban Renewal Mission (JNNURM), adoption of modern double entry accrual-based system of accounting was one of the mandatory reforms at the level of ULBs and Parastatal Agencies. The National Municipal Accounts Manual is the model-design of accounts of the ULBs in relation to the migration from the traditional single entry accounting system to accrual-based double entry accounting system. Before the National Municipal Accounts Manual was published, a Task Force was set up by Govt. of India to recommend Budget and Accounting formats incorporating the positive features of the ULBs’ traditional system of Accounting and the Accrual system of Accounting.

De facto Autonomy of the Third Tier of the Government
127
Formats were related to determining the cost of important utilities and services from the Accounting system. The recommendations of the Task Force were — (i) to prepare Receipts and Payments Account, Income and Expenditure Account and Balance Sheet, (ii) to disclose significant Accounting Policies, (iii) to append Notes on Accounts in respect of specific items, unusual items, deviations from Accounting Policies, contingent Liabilities and commitments on Capital Account having a bearing on the results of working/ financial position in the Accounting period, (iv) to prepare cost sheets for Primary Schools, Hospitals, Water Supply, Street Lighting, Sewerage Disposal etc., and (v) to develop an Accounting Manual to manage the process of Transition from Cash based accounting to Accrual Accounting. Acareful reading will show that the recommendations of the Task Force were all for providing transparent administrative functions. The National Municipal Accounts Manual has, in fact, largely fulfilled these expectations. Budget or the Annual Financial Statement is another instrument which largely represents the administrative initiatives of the ULB. Revenue Incomes, Revenue Expenditure, Capital Receipts, and Capital Payments are the four major groups of financial transactions which act as bases of accounting as well as budgeting, and in relation to them the estimated receipts/incomes and payments/expenditure, financial plan, and the proposed expenditure and means of financing the same, are shown in the budget instrument. The National Municipal Accounts Manual mentions – “The objective of the budgeting system of an (sic) ULB is to arrive at a scientific basis for building linkage between the nature of receipt or payment with the functions / services or other Budget control centres. Budget shall reflect the principles and programmes of the ULB. Budget must also enable ULB in measuring and promoting accountability in respect of service delivery. Public expenditure must be spent in the most productive way. Decentralised planning with citizens’ participation facilitates achieving this objective.” The National Municipal Accounts Manual has, to ensure accounting and preparing of purposeful budget, prescribed a detailed codification structure. For general accounting, a 7 digit code has been prescribed in order to ensure flexibility to add new codes so as to enable the different states to define certain of its unique requirements. The code is structured into Major Head Code, Minor Head Code, and Detailed Head Code. Depending upon the requirements of a local body, the National Municipal Accounts Manual has also prescribed Secondary Account codes which would typically represent subsidiary ledgers and other analysis ledgers. Besides, function-wise, functionary-wise, field-wise and fund-wise classification of each financial

Trends and Patterns in Public Finance: Theoretical and Empirical Aspect
128
transaction, as prescribed in the codification structure of the said Manual secures the inbuilt checks and balance while dealing with finance of the ULB. Resource mobilization in the ULBs is possible through higher revenue generation. The new system of accounting serves as a good feedback process in this regard. Enhancements of revenue, saving through reduction of expenditure, improvement of service etc., are easily ascertainable from various MIS reports available from good Accounting software. In fact, there is enough scope for developing e-governance system in which the newly developed accrual-based double entry accounting system in the ULB, will play the most significant role. In the case of Rural Local Body (RLB), C&AG prescribed the accounts and budget formats for PRI originally in 2002. For their easy adoption by different states, there were endeavours to develop a simple and user-friendly but robust computerised accounting format for PRIs. Simplification and further simplification exercises followed, matching the capacity of the Gram Panchayat staff. After the intervention of members from the Ministry of Panchayati Raj, Govt. of India, Planning Commission, Ministry of Finance, representatives from Govt. of West Bengal, Uttar Pradesh, Andhra Pradesh, a representative each from Controller General of Accounts and the National Informatics Centre, formed a sub-committee for the purpose, that developed simplified accounting formats for PRIs by replacing the originally prescribed six-tier classification system by the three tier classification system. The simplified accounting formats along with list of Codes, Functions, Programmes and Activities for PRIs are now the accepted formats to switch over to the modified accrual system of accounting. Elaborate training in PRI Accounts has been organized including training of trainers in new budget and accounts formats for PRIs. Training has been imparted in the states of Andhra Pradesh, Assam, Bihar, Chhattisgarh, Goa, Gujarat, Himachal Pradesh, Haryana, Karnataka, Kerala, Maharashtra, Orissa, Tamil Nadu, Uttarakhand, Uttar Pradesh, Bihar and Kerala. There is also phase II training programme which are being conducted in Andhra Pradesh, Assam, Himachal Pradesh, Uttarakhand and Uttar Pradesh. It has been advocated that the system of outcome auditing should be gradually introduced. The term outcome auditing is closely linked to the term outcome budgeting. For ensuring outcome-based evaluation and variance analysis, the major shift will be on field-level activities rather than activities in financial terms. The administrative achievements will not be judged by the spending but by the results in the field-level activities. For the purpose, the

De facto Autonomy of the Third Tier of the Government
129
key indicators of performance in respect of a government scheme have to be decided and announced in advance. If the initiatives taken on the part of the C&AG and the respective ministries of Government of India see their proper impact in the administration, the checks and balance system will inevitably improve, and laxity in the activities will be removed. It is absolutely essential in this context that a time frame be prescribed by the Government of India to help make the transition to set right the administrative structure within a specified period of time. The Government of India Task force on decentralization (2001) defined decentralization in the context of panchayats, as an authority transferred from the state to the local governments, by which local governments will enjoy the prerogative of taking decisions on the planning and implementation of different activities. In fact, even after the two constitutional amendments and certain positive theoretical steps on the part of many state governments, effective empowerment of the local governments is far from what was expected in the Constitutional amendments. Local governments are presumed to be perennially incapable of delivering results, and they are not tested properly by sufficient delegation. Devolution of powers and responsibilities upon local governments including activities included in the Eleventh and Twelfth Schedules is significant in this discussion. And initiatives on the part of the C&AG and the respective ministries of Government of India are very much relevant to the context in that these will increase accountability of the concerned administrators, and help local bodies get suitably empowered administratively and financially to discharge their enhanced responsibility. These demand fixing a specific targeted time to successfully go through a gestation period and reach the milestone of devolution of sufficient autonomy to the local bodies.

Fiscal Policy in Post-Recession Era: Challenges and New Directions
Priyadarshi Dash1
1. Introduction From the famous ‘pump priming’ thesis of Keynes in the 1930s to the heyday of fiscal activism in the 1980s and to the distressed corrections (to a great extent, crisis-inspired) of fiscal excesses in the 1990s and 2000s, the field of macroeconomic policy – monetary, fiscal and interactions between the two – has become quite diverse and complex over time. In particular, substantial academic efforts have been devoted to explaining the underpinnings of fiscal policy orientations at different points of global economic evolution. Changes in fiscal policy have been largely manifested in contraction or rationalization of public expenditure resulting from withdrawal of governments all over the world from the ‘development state’ model and the increasing role of markets and private sectors in the mainstream economy. While a temporary cut in tax rate or spending is the conventional instrument of fiscal policy during normal course of the economy, the effectiveness of those conventional fiscal policy measures is doubtful in crisis situations. The escalating public debt and fiscal dislocations that occurred in the crisis months during 2007-09 underscores the need for revisiting the relevance and efficacy of fiscal policy instruments such as tax cut, fiscal stimulus, consumption taxes, investment incentives, etc. Against this backdrop, this paper is an attempt to synthesize the major viewpoints emerging from the ongoing discourse on the desirable properties of the so-called ‘new fiscal policy’.1 The second section presents trends in fiscal conditions of leading economies of the world and identifies the risks or vulnerabilities emanating from those patterns. The third section lists the fiscal policy measures adopted by the United States, advanced economies in Europe and the crisis-hit economies in other parts of the world. Building on that understanding, the section links the post-crisis debate to the normative aspects of fiscal policy and the effectiveness of fiscal policy instruments in the crisis periods. Section 4 discusses the distinct features of fiscal policy in developing countries from the perspective of optimality and efficiency in meeting the
1 The term ‘new fiscal policy’ is conveniently used here to distinguish fresh thinking on fiscal policy from the existing schools of thought on the subject.

Fiscal Policy in Post-Recession Era: Challenges and New Directions
131
development priorities. Section 5 extends this debate to the revival of Keynesianism and its fallouts. Last but not the least, Section 6 covers the main points emerging from the discussion and concludes.
2. State of Global Fiscal Conditions Fiscal situation in many countries of the world has remained gloomy for the past some years since late 2007 following the catastrophic slowdown in the global economy in the post-crisis period. It is alarming to note that the prospect of revenue growth is bleak in most parts of the world. Debt overhang and fiscal deficits in advanced economies would continue to create stress in major markets and thwart the fiscal adjustment process.2 Tax-GDP ratio for different income-based country groupings didn’t vary much during the period 2001-10. Although the average tax-GDP ratio for the world has gone down from 14.9 per cent during 2001-06 to 14.4 per cent during 2007-10, it has increased marginally for the low income, lower middle income, middle income and upper middle income group of countries during the same period from 10.4 per cent to 11.2 per cent, from 10.9 per cent to 11.8 per cent, from 12.4 per cent to 13.5 per cent, and from 12.8 per cent to 14 per cent respectively. Surprisingly, tax revenue as proportion of GDP fell sharply for the advanced economies in the crisis years from 2007 to 2009 whereas it stayed more or less constant (or registered modest increase) for the low and middle income economies (Table 1).
Table 1 Tax-GDP Ratio by Country Groups, 2001-10 (%)
Year
High Income
High Income: OECD
Low and Middle Income
Low Income
Lower Middle Income
Middle Income
Upper Middle Income
World
2001 16.3 16.3 - - 9.8 - - 15.5
2002 15.0 15.1 11.4 - 10.8 11.4 11.7 14.4
2003 15.0 15.1 11.8 9.9 11.1 11.8 12.0 14.4
2004 15.2 15.3 12.0 10.4 10.7 12.1 12.5 14.7
2005 15.2 15.3 12.8 10.7 11.1 12.9 13.4 14.8
2006 15.8 15.9 13.8 10.6 11.8 13.8 14.5 15.4
2007 16.0 16.1 13.9 10.7 12.3 14.0 14.5 15.6
2 IMF (2013a).

Trends and Patterns in Public Finance: Theoretical and Empirical Aspect
132
2008 15.2 15.2 13.9 11.4 12.1 13.9 14.4 14.9
2009 13.7 13.7 13.0 11.1 11.5 13.0 13.4 13.5
2010 14.1 14.1 13.2 11.6 11.5 13.2 13.6 13.8
Avg.
(2001-06)
15.4 15.5 12.4 10.4 10.9 12.4 12.8 14.9
Avg.
(2007-10)
14.8 14.8 13.5 11.2 11.8 13.5 14.0 14.4
Source: World Bank.
Unlike tax-GDP ratio, a wide divergence is observed between the expense-GDP ratios of the advanced economies and the low and middle income countries. For the world as a whole, the expense ratio rose marginally from 26.1 per cent during 2001-06 to 27.7 per cent during 2007-11. For the OECD and high income economies, the expense ratio increased from 27.2 per cent and 27.3 per cent during 2001-06 to 28.3 per cent and 28.4 per cent during 2007-11 respectively. Compared to high income countries, the expense ratio is quite low for the low and lower middle income countries. For instance, the average expense ratio for the lower middle income economies varied between 18 and 19 per cent in the 2000s (Table 2).
Table 2 Expense by Country Groups, 2001-10 (% of GDP)
Year
High Income
High Income: OECD
Lower Middle Income
World
2001 27.4 27.4 26.8 2002 27.8 27.9 18.5 26.2 2003 28.3 28.4 18.2 26.6 2004 28.0 28.1 17.5 26.3 2005 26.1 26.2 17.7 25.6 2006 25.7 25.8 18.4 25.3 2007 25.4 25.5 18.0 25.0 2008 26.8 26.8 19.4 26.3

Fiscal Policy in Post-Recession Era: Challenges and New Directions
133
2009 30.0 30.2 19.4 29.4 2010 29.9 30.1 19.0 29.2 2011 29.5 29.5 18.7 28.8 Avg.
(2001-06) 27.2 27.3 18.1 26.1
Avg. (2007-11)
28.3 28.4 18.9 27.7
Source: World Bank.
Looking at individual economies, it is apparently clear that the tax-GDP ratio for most of the sample economies considered in this study is relatively low and shows declining trends. Based on 2011 figures, the sample economies for which the tax-GDP ratio is found above 15 per cent include Korea, Malaysia, Russia, Brazil, Peru and Thailand. South Africa is the only country in this sample that has maintained a tax-GDP ratio of around 25 per cent throughout the 2000s. For the rest three countries such as India, Indonesia and Philippines, the ratio is comparatively low with values of 10.4 per cent, 11.8 per cent and 12.3 per cent respectively. For the same year, the expense ratio is found invariably higher for all the sample economies implying shortage of fiscal resources from the taxable sources (Table 3). Unless substantial non-tax revenues are mopped up, the governments in these countries which broadly represent the large developing countries in the world would continue to face the challenge of managing fiscal deficits in the medium term.3
Table 3 Public Finances of Select Developed and Developing Economies
Expense (% of GDP)
Year
Indi
a
Indo
nesia
Kore
a
Malay
sia
Philip
pine
sRu
ssia
Sout
h Af
rica
Braz
il
Peru
Thail
and
2000 15.2 - 16.6 16.5 16.3 - 27.9 21.7 17.9 - 2005 14.9 16.5 19.7 17.7 17.2 19.9 29.9 25.6 17.3 16.4 2006 15.0 17.8 20.5 17.7 16.8 19.5 30.1 27.2 16.4 16.1 3The sample countries are conveniently selected as a representative list of large developing countries/ emerging markets in the world. Even though IMF includes Korea in the developed economy category, we have considered it useful to include in this list of countries.

Trends and Patterns in Public Finance: Theoretical and Empirical Aspect
134
2007 15.0 17.2 20.1 18.1 16.6 23.0 30.4 26.8 17.2 17.6 2008 16.9 18.4 20.6 19.6 16.4 21.5 31.4 26.8 16.9 18.2 2009 16.6 15.7 21.8 21.7 17.8 31.1 33.7 26.3 17.4 19.7 2010 16.3 14.4 19.9 18.8 16.9 28.1 32.6 26.7 16.8 18.6 2011 15.3 15.8 20.4 20.4 15.7 25.7 32.7 26.3 16.8 20.6
Tax Revenue (% of GDP) 2000 8.7 - 15.4 13.7 12.8 - 24.0 14.0 12.2 - 2005 9.9 12.5 14.7 14.8 12.4 16.6 26.9 16.7 13.5 17.2 2006 11.0 12.3 15.2 14.5 13.7 16.6 28.4 16.5 15.0 16.7 2007 11.9 12.4 16.6 14.3 13.5 16.6 28.9 16.2 15.6 16.1 2008 10.8 13.0 16.3 14.7 13.6 15.8 28.1 15.9 15.7 16.4 2009 9.6 11.4 15.4 14.9 12.2 13.0 25.5 14.8 13.7 15.2 2010 10.1 10.9 15.1 13.8 12.1 13.4 25.9 14.6 14.8 16.0 2011 10.4 11.8 15.6 15.3 12.3 15.4 25.7 15.7 15.9 17.6
Source: World Bank.
The previous episodes of financial crises that occurred in different regions of the world attribute the severity of the crises to large and unhealthy accumulation of public debt. Many advanced economies including the United States have faced the serious burden of financing fiscal stimulus programmes in the post-crisis period which resulted in the escalating levels of public debt. Some developing countries also underwent sudden fiscal corrections either in the form of temporary curtailment of domestic consumption or rationalizing tax incentives and subsidies. Among the sample developing economies, the level of gross debt as proportion of GDP is found to be relatively high for India, Malaysia, Brazil and Thailand. Except for Russia, Peru and Indonesia, the other three economies such as Korea, Philippines and South Africa have high debt-GDP ratio varying between 30 and 40 per cent of GDP (Table 4). As widely discussed in literature, the fiscal health of a country could be better judged by examining the trends in government structural budget balance. Except for Korea, Russia and Peru, all other sample economies have large structural deficits to the extent of (-) 8.8 per cent for India, (-) 4.6 per cent for South Africa and (-) 4.2 per cent for Malaysia. Though not in terms of magnitude, structural budget balance has deteriorated significantly for most of the sample developing economies during the crisis years and thereafter (Table 4). Since structural budget balance excludes the effects of cyclical components of budget deficits and reflects fundamentals of the economy, the countries facing budget

Fiscal Policy in Post-Recession Era: Challenges and New Directions
135
imbalance need to undertake necessary actions aiming to control any unhealthy accumulation of structural budget imbalance.
Table 4 Debt and Structural Balance in Select Developed and
Developing Economies
Country 2000 2005 2006 2007 2008 2009 2010 2011 2012 General Government Gross Debt (% of GDP) India 72.7 82.0 78.4 75.0 73.3 75.0 68.5 66.4 66.8 Indonesia 95.1 46.3 39.0 35.1 33.2 28.6 26.8 24.4 24.0 Korea 18.0 28.6 31.1 30.6 30.1 33.8 33.4 34.2 33.7 Malaysia 35.3 42.7 41.5 41.2 41.2 52.8 53.7 54.5 55.5 Philippines 58.8 59.2 51.6 44.6 44.2 44.3 43.5 41.9 41.9 Russia 59.9 14.2 9.0 8.5 7.9 11.0 11.0 11.7 10.9 South Africa 43.3 34.7 32.6 28.3 27.8 31.3 35.8 39.6 42.3 Brazil 66.7 69.2 66.7 65.2 63.5 66.9 65.2 64.9 68.5 Peru 42.4 37.7 33.1 30.4 25.0 28.4 24.6 22.0 19.8 Thailand 57.8 47.4 42.0 38.3 37.3 45.2 42.6 41.7 44.3 General Government Structural Balance (% of Potential Output)
India -8.4 -7.3 -6.2 -6.5 -10.4 -
10.5 -9.6 -9.2 -8.8 Indonesia - 0.6 0.3 -1.1 -0.1 -1.7 -1.2 -0.7 -1.4 Korea 4.3 1.1 1.1 2.3 1.8 0.7 1.7 1.8 2.3 Malaysia -6.8 -3.0 -3.0 -3.4 -4.3 -5.0 -4.1 -3.5 -4.2 Philippines -3.7 -2.6 -1.4 -1.9 -1.6 -3.3 -3.5 -1.9 -2.4 Russia 2.3 8.1 8.2 6.1 3.9 -3.2 -1.8 2.0 0.5 South Africa -1.4 -0.2 0.3 -0.2 -2.2 -5.3 -4.8 -4.0 -4.6 Brazil -3.6 -3.3 -3.3 -3.0 -2.1 -2.7 -3.9 -3.0 -2.7 Peru -1.9 -0.7 0.2 1.5 0.9 -0.6 -0.8 0.8 1.4 Thailand -1.0 1.4 2.0 -0.1 -0.6 -2.1 -0.9 -0.8 -1.5 Source: IMF (2013a).
Developing countries are typically characterized by bigger role of governments in all spheres of economic activities. Government interventions in development

Trends and Patterns in Public Finance: Theoretical and Empirical Aspect
136
sector and financing social overheads are massive implying larger and regular allocation of public resources to meet these priorities. The estimated level of gross financing needs for the year 2013 and 2014 confirms the abovementioned feature of government finances in developing countries. Gross financing needs as proportion of GDP is substantially higher for Brazil (17.1%), India (12.7%), South Africa (12%), Malaysia (10.7%) and Thailand (8.2%).4 It is clear that all the sample economies except India have higher debt component in total financing needs whereas for India budget deficits account for 65 per cent of its total financing needs. In terms of budget deficits, India is followed by South Africa (4.8 %) and Malaysia (4%) (Table 5). While unsustainable level of budget deficits indicates worrying signals, higher exposure to public debt particularly in the form of government securities may have crowd out effects.
Table 5 Gross Financing Needs of Select Developing Economies, 2013-14
(% of GDP)
Country 2013 2014 Maturing
Debt Budget Deficit
Total Financing
Need
Maturing Debt
Budget Deficit
Total Financing
Need India 4.4 8.3 12.7 4.3 8.4 12.7 Indonesia 0.8 2.8 3.7 0.9 2.2 3.1 Korea 3.1 -2.4 0.7 3.1 -2.6 0.4 Malaysia 6.2 4.0 10.2 6.1 3.7 9.8 Philippines 6.7 0.8 7.5 6.9 0.9 7.8 Russia 1.2 0.3 1.6 1.1 1.0 2.1
South Africa 7.3 4.8 12.0 7.3 4.2 11.5 Brazil 15.9 1.2 17.1 15.4 1.7 17.2 Peru 2.2 -1.8 0.4 2.1 -1.6 0.5 Thailand 5.5 2.7 8.2 6.4 3.4 9.8
Source: IMF (2013b). Notes: Maturing debt largely refers to central government securities. For 2014 & 2015, it is assumed that short-term debt outstanding in 2013 and 2014 will be refinanced with new short-term debt that will mature in 2014 and 2015 respectively. Countries that are projected to have budget deficits in 2013 and 2014 are assumed to issue new debt based on the maturity structure of debt outstanding at the end of 2012.
4 Based on 2013 figures.

Fiscal Policy in Post-Recession Era: Challenges and New Directions
137
3. Global Economic Recession, 2007-09 and Changing Theoretical Perspectives on Fiscal Policy The global economic recession during 2007-09 is termed as a major crisis in the recent times comparable in magnitude to the Great Depression in the 1930s. The crisis has not only exposed the inherent vulnerabilities built-in into the current global economic and financial architecture but has also raised a number of pertinent questions for the thinkers and policymakers engaged in the field of economic policy and macroeconomic stabilization. While the United States remained the epicenter of the crisis, no country was spared from the downside risks associated with the perverse cycles of contraction and fractured recovery that prevailed over the period 2007-10. In this phase, the affected economies have adopted different combinations of fiscal and monetary policy measures to contain the mounting social costs arising from job losses, capital outflows and economic instability. These policy interventions primarily took the form of liquidity infusions into banks, temporary spending and tax cuts, liquidity provisions through swap lines, changes in central bank policy rates, and so on. The effectiveness of these measures in stimulating aggregate demand and restoring confidence in the financial markets has been mixed and varied. In order to develop a holistic view of the motives behind various fiscal policy measures implemented by the affected economies at various points of time during the crisis– and the post-crisis period and their relative efficacy in meeting the overall objective of fiscal stability, this paper has borrowed ideas and viewpoints that emerged from the papers by Afonso et al. (2010), Riet (2010), Romer (2012), Kollmann et al. (2012), Baldacci et al. (2013), IMF (2013), Aizenman (2011), Ahrens (2009), Truman (2009), Taylor (2010), Bevan (2010) and Kraay and Serven (2008). While no school of thought seems to provide a reasonably convincing single-dimension solution to help arrest the protracted recessionary tendencies in the global economy, this paper maintains a neutral stand on the alternative fiscal policy measures prescribed in these works and assesses the wider applicability of those policy actions for attaining higher and faster impact. A careful reading of past experience on the role of fiscal policy during crises does not suggest any radical departure in fiscal policy approaches from the conventional fiscal policies that are typically followed in normal times. What makes a difference in the crisis periods is the choice, sequence and timing of various fiscal policy instruments to correct fiscal imbalance in a country. The outcome of fiscal policy actions in crisis periods is very much contingent upon the scientific and timely diagnosis of fiscal positions of the affected countries. Early

Trends and Patterns in Public Finance: Theoretical and Empirical Aspect
138
detection of risk elements may discourage unhealthy accumulation of budget deficits and raise the probability of a stronger policy outcome of the crisis-related fiscal policy measures. In general, fiscal policy response to financial or economic crises is countercyclical in nature. This is again based on the simplistic reasoning that slowdown in any economy could be reversed through tax cuts or rise in government expenditure only. In other words, expansionary fiscal policy is the ideal response to economic contraction and vice versa. However, the use of countercyclical policies in response to crisis situations depends on certain initial conditions. Countries with high public debt levels and narrow fiscal base face severe constraints of implementing countercyclical fiscal policies and fiscal stimulus programmes.5 A common point that unequivocally emerges from the discourse on crisis management is that the post-crisis fiscal scheme should stress upon the composition of fiscal policy actions rather than relying on any single fiscal policy measure.6 Countries facing financial crises have two policy options: (1) relying on automatic stabilizers and (2) resorting to discretionary fiscal policy actions. The role of automatic stabilizers in correcting fiscal mess is often highlighted in the context of financial crises. IMF strongly favours the importance of automatic stabilizers as the first line of defence against further worsening of fiscal health of the crisis-hit economies.7 After examining the plethora of fiscal policy measures considered in the Euro Area after outbreak of the subprime crisis in 2008, Riet (2010) is of the view that the cost of accommodating the impact of automatic stabilizers and discretionary fiscal policies is huge during the economic crisis. Fiscal stimulus has been the most widely used and popular instrument of fiscal policy in crisis times (for that matter, in case of any economic downturn). The record of fiscal stimulus packages implemented from time to time in different affected countries in the past presents mixed results. For countries like China, fiscal stimulus packages have proved quite successful in reviving domestic demand whereas it has led to high inflation and unsustainable level of public debt-to-GDP ratio in Argentina in the mid-1990s. China has successfully implemented fiscal stimulus packages both during the East Asian financial crisis and the global financial crisis turned global economic recession spanning the three-year period of 2007-09. In view of the longer and uncertain recovery from the current global economic recession, many governments all over the world have resorted to national fiscal stimulus programmes of different sizes and targets. As per the data released by International Labour Organization (ILO), the 5 See Baldacci et al. (2013). 6 See Kraay and Serven (2008); Romer (2012); Riet (2010). 7 See IMF (2013a); IMF (2013b).

Fiscal Policy in Post-Recession Era: Challenges and New Directions
139
countries that adopted larger fiscal stimulus packages in the post-recession period include China followed by Saudi Arabia, Malaysia and the United States. Of those, the American Recovery and Reinvestment Act of 2009 and the European Recovery Plan of 2008 are two notable examples that are comprehensive and tailored to boost aggregate demand in the domestic economies in a big way. Besides the national stimulus packages, countries in the Euro Area had to opt for coordinated fiscal stimulus programmes also. Effective communication and sharing of resources between the US Fed, ECB, Bank of England and other central banks facilitated the smoother and efficient utilization of stimulus programmes. Very often, fiscal stimulus packages are criticized for not meeting the expected targets adequately. Among the factors that determine the success of any stimulus programme, a few need worth mention here. These include the initial debt condition prevailing in the concerned country, the size of fiscal space, the strength of automatic stabilizers-income taxes and transfer payments, etc., and related factors. The role of fiscal space appears to be highly important in the context of stimulus packages. Countries like Germany and China have relatively large fiscal space due to trade surpluses, hence better positioned to formulate ambitious stimulus packages. The same may not hold good for the emerging markets and developing countries. Emerging markets having limited safety nets with fiscal space are likely to benefit more from pursuing crisis-related aggressive fiscal stimulus packages.8 In addition to favourable initial conditions, fiscal stimulus packages need to be timely, targeted and temporary so as to generate a stronger impact on local economic activities.9 Further, fiscal stimulus programmes could generate positive spillovers for the neighbouring countries and the trade partners. The stimulus in the first country could boost demand in other countries provided parallel actions are undertaken in the other countries. In the absence of that, such programmes may discourage the first country economically, financially and politically to take it in the right spirit.10
8 See Aizenman (2011). 9 Riet (2010) justifies these three pre-conditions for stimulus programmes on the following grounds. Since most fiscal policy decisions undergo several legislative processes and involves implementation lags, a timely conception of these prgrammes is desirable. Stimulus packages targeted to certain specific categories of beneficiaries (say, liquidity or credit constrained households and firms) may be more effective than targeting all the sectors/segments in one go. As political decisions are hard to reverse, the very nature of stimulus packages should be temporary with policy objectives clearly spelled out. 10 For a discussion, see Truman (2009).

Trends and Patterns in Public Finance: Theoretical and Empirical Aspect
140
4. Fiscal Policy for Developing Countries Is there anything distinct about fiscal policies in the developing countries? Yes, it is because of the existence of significant differences in the level of overall economic development, shallow financial sector, poor institutions, underdeveloped or semi-developed capital markets, low tax base and compliance, heavy burden of social sector financing, and so on. Unlike the advanced economies, a typical developing economy faces shortage of tax revenues and high establishment costs in meeting competing demands for funds for development purposes. As mentioned in Jha (2007), fiscal stance in these economies is very often pro-cyclical and tax revenues are volatile. On the other hand, the outcome of fiscal policies is determined by pressures from the regulatory and exchange rate regimes. Regardless of the alternative discourses on efficacy of fiscal policy in growth and development, Moreno-Dodson (2013) presents an optimistic scenario that visualizes fiscal policy as catalysts to growth in developing countries and has stronger effect than in the developed economies. In the context of crisis management, fiscal policy response in developing countries may not be radically different from that in advanced economies. However, the ability and freedom to implement discretionary fiscal policies and stimulus policies may be constrained by low resource base, unpredictable role of automatic stabilizers and poor institutional adaptability to manage crises. Since the standard policy response to financial crises include a set of monetary and fiscal policy measures, the impact of fiscal policy actions may be effective jointly with monetary policy actions. Although government spending is considered as most appropriate form of fiscal policy intervention in the crisis times, it has not really proved different from the outcome in normal course of the economy.11 In some cases, large diversified and phased-in fiscal stimulus programmes are preferred to loosely defined stimulus schemes.12 The relative effectiveness of tax-based or income-based policies is context-specific and controversial. In some cases, expenditure-based policies are quite successful and more durable than tax increases and decreases.13 Likewise, whether expansionary fiscal policy works better than contractionanry fiscal policies or not is not very clear from the available empirical evidences.14 With
11 See Afonmso (2010). 12 See Auerbach et al. (2010). 13 See Purfield (2003). 14 Gravelle et al. ( 2013) observes that spending cuts could be contractionary also.

Fiscal Policy in Post-Recession Era: Challenges and New Directions
141
regard to openness, fiscal policies during recessions could be more effective in closed economies than in open economies but with a small fiscal multiplier.15 Another strand of thought finds flaws in the target of fiscal policy parameters. Fiscal should ideally target labour demand gap rather than simply focusing on output gap only.16 As mentioned above, there is stiff opposition to the debt-financed fiscal policy schemes for economic recessions. In the absence of strong prior fiscal position, such policies could turn out to be more distorting and wasteful for developing countries.17
5. Revival of ‘Keynesianism’ in Post-Crisis Macroeconomic Management: Sweet or Sour In lay person’s understanding, a crisis is a blessing in disguise. It helps one understand the mistakes of the past and creates opportunities for exploring ways and means to avoid its recurrence in the future. The global economic recession during 2007-09 that featured several distinct phases of economic crises marks a ‘dark phase’ in global economic history.18 In the first phase of the crisis policymakers were busy correcting dislocations in the sub-prime mortgage markets. There was hardly any room for fiscal policy in that phase. The focus was more on restructuring toxic assets through bank recapitalizations and deleveraging of firms having exposure to sub-prime assets. It was only in the next phase when most of the leading economies of the world faced severe contraction in economic activities, that some serious thinking was directed towards fiscal policy. Therein comes the role of countercyclical fiscal policy suggesting fiscal expansion to stimulate domestic demand and raise the prospects of employment creation in the subsequent periods. In the quest for finding appropriate fiscal response to the rapidly deteriorating global economy in the late 2008 and early 2009, there was a silent revival of Keynesianism in the minds of the policymakers. The policy imperative that dominated the design of fiscal policy in the post-crisis period was the immediate revival of aggregate demand to the equilibrium level so as to ensure faster reversal of the employment to the pre-crisis level. Even though the positive impact of monetary easing was strong enough to restore confidence in the
15 See Arestis and Swayer (2003). 16 See Tcherneva (2011). 17 See Taylor (2010). 18 Truman (2009) interprets the global economic recession during 2007-09 not as a single crisis but rather as a combination of several crises beginning with sub-prime mortgage crisis, followed by rising unemployment problem in the United States and Europe, and a precipitous fall in global economic activities in subsequent periods.

Trends and Patterns in Public Finance: Theoretical and Empirical Aspect
142
financial markets, it had negligible or slow impact on generating employment and income. Although there was no official reference to Keynesianism in the post-crisis fiscal policy plan in the United States and elsewhere, the intent behind the stimulus plan presents adherence to the Keynesian principles of government interventions to stimulate demand in the economy. Whether it is appropriate to relate the Keynesian traditions of macroeconomic policy to the current fiscal policy strategies or not, the underlying theoretical superstructure of Keynesian economics provides the best answer to short-run economic stabilization in countries facing segmented and protracted recovery from the global economic recession.19 The recourse to Keynesian traditions of fiscal policy strategies has not been free from criticism. As the fiscal stimulus programmes are carved out of the public resources available with the national exchequers, the idea of taxing people for generating future stream of income and employment seems to have invited severe criticism from the private players and financial markets. To one school of thought, fiscal stimulus plans will lead to higher debt accumulation, increase interest rates, crowd out private investment, and may perpetuate inflationary tendencies if not targeted properly.20 Amidst the growing criticism for debt-financed stimulus programmes, the Keynesian approaches on demand management and stabilization is held supreme over other schools of economic thought in formulating crisis-related fiscal policy actions. Government spending must increase to offset the destabilizing patterns in fiscal policy parameters such as output, interest rate, labour, saving and investment.21
6. Conclusion There has been a serious overhauling in fiscal policy orientations especially after the financial crises of the 1990s and most importantly after the devastating consequences of the global economic recession during the three-year period from 2007 to 2009. In response, the affected economies have undertaken several variants of monetary and fiscal policies either under distress or as conscious response to movements in the fundamentals. Despite extraordinary
19 See Lavoile (2010) for a brief understanding on the Keynesian economics and the challenges posed by the competing schools of thought such as Monetarism, New Classical economics, and so on. Dash (2012) presents the possible ways in which injections of surplus reserves in infrastructure and other development projects could generate multiplier effects on income and employment in a regional context. 20 See Brannon (2009). 21 Feldstein (2009) provides scholarly views the pros and cons of the Keynesian policy prescriptions in event of financial crises.

Fiscal Policy in Post-Recession Era: Challenges and New Directions
143
response to the fiscal stimulus and monetary easing policies implemented in a good number of crisis-hit economies including the United States, the global fiscal situation would remain gloomy and uncertain in the near future. Notably, the continued accumulation of public debt in the advanced economies is of serious concern for the rest of the world. Given the slow and protracted recovery, the downside risks would remain elevated and may take heavy toll on the poorest nations of the world in terms of high unemployment, low investment and uncertain growth prospects. With regard to the choice of fiscal policy actions during crisis periods, there is no universal understanding as such on the sequence, timing, and composition of various instruments of fiscal policy. The relative effectiveness of tax- or expenditure-based policies would largely depend on the country-initial conditions and the interactions between the effects of monetary policy and automatic stabilizers. In restricted cases that are characterized by low fiscal space and unfavourable initial conditions in the form of large public debt and/or inadequate access to foreign capital, the outcome of the crisis-related fiscal policy measures may turn out to be sub-optimal. In addition, the performance of fiscal stimulus programmes may improve considerably only if the automatic stabilizers, parallel and coordinated stimulus plans by the neighbouring countries and the trading partners, and a well-articulated, timely, targeted and temporary nature of the stimulus plan are put properly in place. There is need to formulate clear fiscal exit and consolidation strategies as soon as the symptoms of revival from the wear and tear associated with the crisis become visible. Even though the development backlog is heavy for most of the developing countries, the nature and composition of fiscal policy actions during crisis periods may not be completely different from the policies conceived in the advanced economies, at least in the short run. As regards the normative foundations of fiscal policy, the theoretical paradigm of the solutions to economic crises is a very delicate subject. The time has come to compare and assess the relevance of various strands of mainstream thinking on fiscal policies that are in vogue now. If not entirely in principle, the magic of certain Keynesian postulates may appear very likely in the context of post-recession economic revival in the years to come.
References Afonso, Antonio., Hans Peter Gruner and Christina Kolerus. 2010. Fiscal Policy and Growth: Do Financial Crises Make a Difference. Working Paper Series No. 1217, June.

Trends and Patterns in Public Finance: Theoretical and Empirical Aspect
144
Ahrens, Steffen. 2009. Fiscal Responses to the Financial Crisis. KIEL Policy Brief No. 11, Kiel Institute for the World Economy. Aizenman, Joshua and Yothin Jinjarak. 2011. The Role of Fiscal Policy in Response to the Financial Crisis. Background Paper for the World Economic Situation and Prospects 2011. Ait-Sahalia, Yacine., Jochen Andritzky., Andreas Jobst., Sylwia Nowak and Natalia Tamirisa. 2012. Market Response to Policy Initiatives During the Global Financial Crisis. Journal of International Economics. Vol. 87, pp. 162-177. Arestis, Philip and Malcolm sawyer. 2003. Reinventing Fiscal Policy. Journal of Post Keynesian Economics. Vol. 26. No. 1, pp. 3-25. Auerbach, Alan J., William G. Gale and Benjamin H. Harris. 2010. Activist Fiscal policy. The Journal of Economic Perspectives. Vol. 24. No. 4, pp. 141-163. Baldacci, Emanuele., Sanjeev Gupta and Carlos Mulas-Granados. 2013. How Effective is Fiscal Policy Response in Financial Crises. Brahmbhatt, Milan and Otaviano Canuto. 2013. Fiscal Policy for Growth and Development in Blanca Moreno-Dodson (Ed.). Is Fiscal Policy the Answer? A Developing Country Perspective. The World Bank, Washington, D.C. Brannon, Ike. 2009. The Troubling Return of Keynesianism. Tax and Budget Bulletin No. 52, Cato Institute, January. Dash, Priyadarshi. 2013. Book Review: Praveen Jha (Ed.). Progressive Fiscal Policy In India. South Asia Economic Journal (Forthcoming). Dash, Priyadarshi. 2012. Reserve Management in Asia: Changing Contours and Challenges. RIS Policy Brief No. 53, Research and Information System for Developing Countries, New Delhi. Feldstein, Martin. 2009. Rethinking of the Role of Fiscal Policy. Prepared for Presentation at the 2009 Meeting of the American Economic Association. Gravelle, Jane G and Thomas L. Hungerford. 2013. Can Contractionary Fiscal Policy Be Expansionary? Congressional Research Service Report for Congress, 7-5700. IMF. 2013a. World Economic Outlook, April. IMF. 2013b. Fiscal Monitor, April. IMF. 2012. World Economic Outlook, October. Jha, Raghbendra. 2007. Fiscal Policy in Developing Countries: A Synoptic View. ASARC Working Paper No. 01.

Fiscal Policy in Post-Recession Era: Challenges and New Directions
145
Kollmann, Robert., Werner Roeger and Jan In’t Veld. 2012. Fiscal Policy in a Financial Crisis: Standard Policy vs. Bank Rescue Measures. ECARES Working Paper No. 006. Lavoie, Marc. 2010. Are We All Keynesians. Brazilian Journal of Political Economy. Vol. 30. No.2, pp. 189-200. Mohanty, M.S. 2012. Fiscal Policy, Public Debt and Monetary Policy in the EMEs: An Overview in BIS (2012). Fiscal Policy, Public Debt and Monetary Policy in Emerging Market Economies. BIS Papers No. 67, October. Montoro, Carlos., Elod Takats and James Yetman. Is Monetary Policy Constrained by Fiscal Policy in BIS (2012). Fiscal Policy, Public Debt and Monetary Policy in Emerging Market Economies. BIS Papers No. 67, October. Neto, Alcino F. Camara and Matias Vernengo. 2004-05. Fiscal Policy and the Washington Consensus: A Post Keynesian Perspective. Journal of Post-Keynesian Economics. Vol. 27. No. 2, pp. 333-343. Pelagidis, Theodore and Evangelia Desli. 2004. Deficits, Growth, and the Current Slowdown: What Role for Fiscal Policy? Journal of Post Keynesian Economics. Vol. 26. No. 3, pp. 461-469. Purfield, Catriona. 2003. Fiscal Adjustment in Transition: Evidence from the 1990s. Emerging Markets Finance & Trade. Vol. 39. No.1, pp. 43-62. Riet, Ad Van. 2010. Euro Area Fiscal Policies and the Crisis. Occasional Paper Series No. 109. European Central Bank, April. Romer, Christina D. 2012. Fiscal Policy in the Crisis: Lessons and Policy Implications. University of California. Berkely, April. Taylor, John B. 2010. Getting Back on Track: Macroeconomic Policy Lessons from the Financial Crisis. Federal Reserve Bank of St. Louis Review. May/June, pp. 165-176. Taylor, John B. 2000. Reassessing Discretionary Fiscal Policy. The Journal of Economic Perspectives. Vol. 14. No. 3, pp. 21-36. Tcherneva, Pavlina R. 2011. Fiscal Policy Effectiveness: Lessons from the Great Recession. Working Paper No. 649. Levy Economics Institute, January. Truman, Edward M. 2009. Policy Responses to the Global Financial Crisis. Remarks Presented at the Ninth International Seminar on “Policy Challenges for the Financial Sector Emerging from the Crisis: Building a Stronger International Financial System”, Board of Governors of the Federal Reserve System, World Bank and International Monetary Fund, June 3. World Bank, World Development Indicators Online (www.worldbank.org).