business patterns and trends: national summary
TRANSCRIPT

BUSINESS PATTERNS AND TRENDS: NATIONAL SUMMARY
Beata Bajaj, G. Thomas Kingsley, and Kathryn L.S. Pettit Prepared by the Urban Institute for DataPlace™ - August 2005
This brief was written by the Urban Institute to support www.DataPlace.org, and is licensed under Creative Commons.

2
BUSINESS PATTERNS AND TRENDS: NATIONAL SUMMARY
One of the most authoritative sources of information on trends in America’s economy for geographies below the national level is the County Business Patterns series maintained by the U.S. Bureau of the Census. For nearly four decades, this series has provided annual data on business establishments, employment, and payrolls for the nation as well as all U.S. counties and states. A more recent series developed by the Census Bureau, ZIP Business Patterns (ZBP), provides similar data from the same sources by ZIP code area. Key indicators from the Business Patterns series are now available for ZIP codes, cities, counties, and larger geographic entities on the Fannie Mae Foundation’s DataPlace Web site. The DataPlace Business Patterns data, which currently span the 1998-2002 period, will be updated annually. Inclusion of Business Patterns data on DataPlace enables users to learn about the changing spatial patterns of economic activity in their own cities and regions. They can easily construct maps, tables, and charts for particular indicators and geographic areas they have selected. This brief provides an informational backdrop for DataPlace users. By examining national levels and trends for the Business Patterns indicators, the contents should help them better interpret local data. In addition, the brief presents Business Patterns data for geographic groupings that have not been readily available before. First, it contrasts nonmetropolitan areas with metropolitan areas and compares the latter’s central-city and suburban components. Second, it compares conditions in ZIP code areas with varying levels of poverty. For the nation as a whole, and for these different geographic groupings, this brief presents data on trends in employment and business establishment growth for two contrasting periods: 1998-2000, the peak of the U.S. economic boom of the late 1990s, and 2000-2002, a period when the economy had cooled significantly. It also looks at trends by size of establishment and by broad industry groupings. Finally, the data are used to examine trends in the availability of residential services establishments across ZIP codes. We selected 11 detailed industry categories whose establishments typically serve surrounding residential neighborhoods (e.g., drugstores, dentist offices, and dry cleaners/laundries) rather than city- or metropolitanwide markets. Then, for the various geographic groupings, we present data on the number of such establishments per 100,000 population in 2002 and changes in the number of such establishments since 2000.

3
Methodology and Cautions in Interpretation Although Business Patterns data on DataPlace offer many benefits, certain complexities warrant explanation. Most important, the coverage of the Business Patterns series, while broad, does not encompass all types of economic activity. Specifically, the series excludes data on self-employed workers, employees of private households, and most wage and salary employees in agriculture, railroad transportation, and government. Also, like all official data, it excludes any nonreported work (e.g., from the underground economy). The impact of these exclusions may differ by area of the country. For example, Business Patterns data considerably under-report total employment in the Washington, D.C., area, where the federal government is a major employer. Annex A more fully describes the Business Patterns data series and its coverage of industries and employment. Four additional points about this series are important to note: (1) The Census Bureau suppresses data on employment for some geographies where its rules indicate a risk of disclosing confidential information; (2) DataPlace does not link all ZIP codes identified by ZBP to their exact geographic location; (3) ZIP code definitions change frequently and do not always conform to municipal boundaries; and (4) DataPlace relates Decennial Census data for 2000 to all years of the ZBP data. Annex B explains each of these issues more fully. Although together they are not likely to have a sizable impact on data summaries — such as those reported in this brief — they can have important implications when analyzing data by individual ZIP codes or by small cities and counties.
National Analysis1
Total Employment and Establishments2 Between 1998 and 2000, the total number of U.S. jobs in categories covered by the Business Patterns series increased from 108.1 million to 114.1 million, an average annual growth rate of 2.7 percent (Table 1). The trend then took a turn for the worse, however. Between 2000 and 2002, employment slowly declined at an average annual rate of -0.7 percent, bringing total employment down to 112.4 million jobs in 2002. Interestingly, trends in the total number of U.S. establishments did not follow the same pattern. Rather, the U.S. total grew at a steady average annual rate of 0.9 percent, from 6.9 million establishments in 1998 to 7.1 million in 2000 and to 7.2 million in 2002.
1 Data in this section are derived from County Business Patterns rather than aggregates of ZIP code data from ZBP. 2 See “Data Content” in Annex A for definitions of employment and establishments used in the Business Patterns series.

4
Because total employment fell from 2000 to 2002, the average number of employees per establishment declined over that period. Table 1. TOTAL EMPLOYMENT AND ESTABLISHMENTS: 1998 to 2002
Employment (millions)
Employment/1,000
Population
Establishments
(millions)
Establishments /1,000
Population
1998 108.1 384 6.9 25 2000 114.1 405 7.1 25 2002 112.4 399 7.2 26 % growth/yr 1998-2000 2.7 0.9 % growth/yr 2000-2002 (0.7) 0.9
In 2002, these employment and establishment figures for the nation translated, on average, into nearly 400 jobs and 26 establishments per 1,000 people.
Employment and Establishments by Business Size In 2002, 5.3 million establishments in the United States (nearly three-quarters of the total) were small businesses with fewer than 10 employees (Table 2). Slightly larger establishments with 10 to 49 employees accounted for the next largest share (21 percent). The remaining 5 percent of establishments had 50 or more employees. Establishments with 50 or more employees, however, were responsible for providing the majority of U.S. jobs (60 percent). By comparison, the smallest establishments (fewer than 10 employees) accounted for a fairly small, although not insignificant, share of all jobs (about 15 percent). Between 2000 and 2002, employment was on the rise in small establishments (Figure 1). The loss of jobs in larger establishments caused the overall net decline in employment over this period.

5
Table 2. EMPLOYMENT AND ESTABLISHMENTS BY ESTABLISHMENT SIZE: 2002
Employment Establishments Establishment Size Group
Total (millions)
Percent of Total
Total (millions)
Percent of Total
1-9 employees 15.8 14 5.3 73 10-49 employees 31.2 28 1.5 21 50-99 employees 14.5 13 0.2 3 100-499 employees 28.1 25 0.1 2 500+ employees 22.8 20 0.02 0 Total 112.4 100 7.2 100
Figure 1. Change in Employment by Establishment Size, 2000-2002
-3 -2.5 -2 -1.5 -1 -0.5 0 0.5 1 1.5
1-9 employees
10-49 employees
50-99 employees
100-499 employees
500+ employees
Total
Average Annual Percentage Change in Employment, 2000-2002
Establishments by Industry In 2002, nearly 60 percent of all establishments in the United States were concentrated in two service-oriented groups of industries: the information, finance, and professional services group (including finance, insurance, and real estate; information, professional, scientific, and technical services; management of enterprises; and administrative and support and waste management services), and the “other services” group (educational services, health care and social assistance, arts and recreation; accommodation and

6
food services; and other services except public administration) (Figure 2).3 Wholesale and retail trade industries accounted for an additional 22 percent of all establishments; utilities, construction, and transportation together accounted for another 13 percent. The remaining 5 percent fell primarily into manufacturing, as well as into forestry, fishing, agriculture support, and mining. The information, finance, and professional services group experienced the highest average rate of annual growth between 2000 and 2002, with the number of establishments increasing by about 2.5 percent per year. The trade group experienced the slowest expansion (less than 0.1 percent annual growth), and on average, the number of manufacturing establishments decreased by about 1.5 percent annually in that two-year period. The remaining three sectors fell somewhere in between, growing by less than 1 percent annually.
Figure 2. Establishments by Industry Sector, 2002
Agriculture, forestry, mining
1%
Manufacturing5%
Utilities, construct.,
transp.13%
Trade22%
Info., finance, professional
29%
Other services30%
3 The information, finance, and professional services group includes North American Industry Classification System (NAICS) codes 51 through 56, while the other services group includes codes 61, 62, 71, 72, 81, and 95. Annex A provides a complete list of NAICS industrial sectors covered by the Business Patterns series.

7
Analysis by Metropolitan Area Status
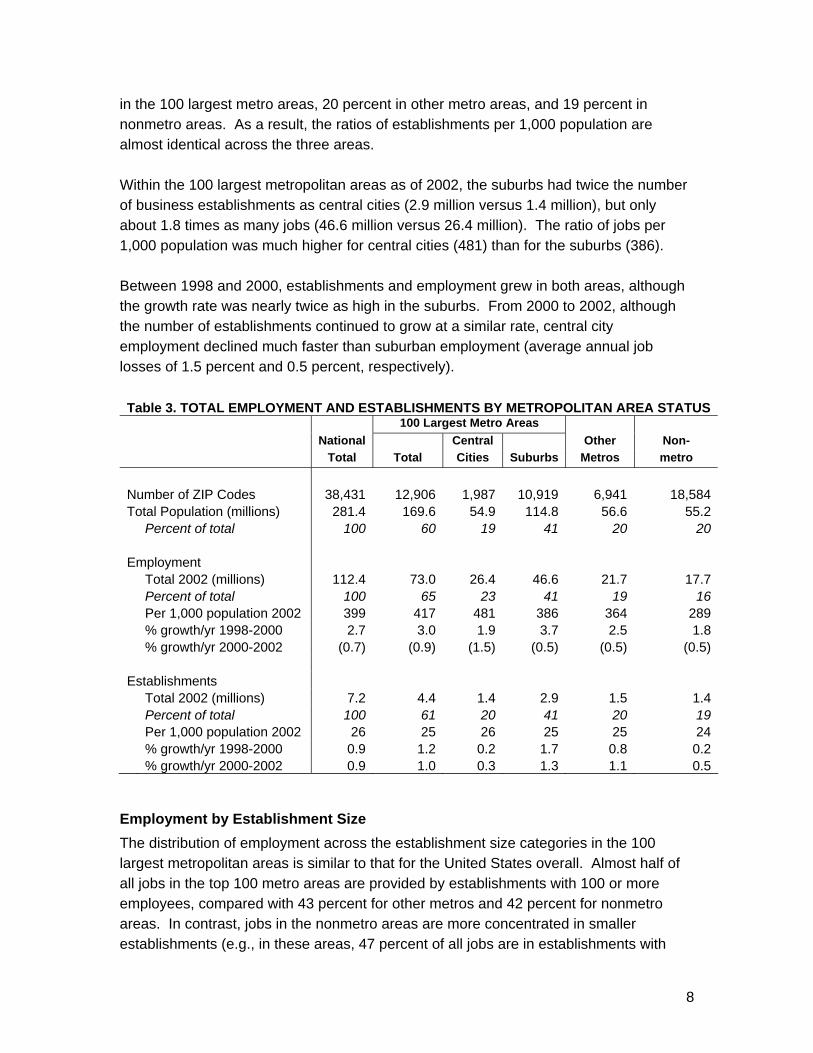
Total Employment and Establishments In this section, we classify ZIP codes according to their metropolitan area status, and then analyze the Business Patterns indicators for these groupings. We distinguish between the 100 largest metropolitan areas, other metros, and nonmetro areas. 4 Within the 100 largest metro areas group, we further assign ZIP codes to central cities or suburbs. 5 In 2002, 65 percent of national employment was concentrated in the 100 largest metro areas (Table 3), which is not very surprising given that about 60 percent of the U.S. population lives in these areas. The remaining 232 metro areas accounted for an additional 19 percent of national employment and the nonmetro areas for 16 percent. The 73 million jobs in the 100 largest metro areas translate into about 417 jobs per 1,000 population, a higher number than the national average of 399 jobs per 1,000 population. Each of the other metro areas falls just short of the national average, with 364 jobs per 1,000 people. In nonmetro areas, substantially fewer jobs are available: 289 per 1,000 people. The 100 largest metropolitan areas experienced the highest average annual rate of job growth between 1998 and 2000 (3.0 percent), but also the highest rate of job loss between 2000 and 2002 (about 0.9 percent). By comparison, the other metro areas saw average job growth of 2.5 percent per year in those initial two years, and only about half as big a rate of job loss (0.5 percent) between 2000 and 2002. Similarly, as was the case for the entire United States between 2000 and 2002, each of these areas experienced small increases in the number of establishments, despite declines in employment during that period. The distribution of establishments among these three types of areas resembles that of the population, with about 60 percent of all establishments in the United States located
4 The 1999 OMB metro definitions were used to define metro areas both in this brief and in DataPlace. We selected the largest 100 Primary Metropolitan Statistical Areas (PMSAs) and Metropolitan Statistical Areas (MSAs) based on their 1990 populations. We excluded suburban PMSAs that did not have large central cities within their own boundaries. The Bureau of the Census recognizes several individual municipalities as “Central Cities” in many metropolitan areas. For this analysis, we generally accept only the predominant city as the Central City (e.g., Chicago in the Chicago PMSA). In seven cases, however, we classified two municipalities together as making up the Central City: Anaheim/Santa Ana, Calif.; Fort Lauderdale/Hollywood, Fla.; Greensboro/Winston Salem, N.C.; Greenville/Spartanburg, S.C.; Minneapolis/St. Paul, Minn.; Tampa/St. Petersburg, Fla.; and West Palm Beach/Boca Raton, Fla. 5 ZIP code areas that overlapped a central city boundary were assigned in their entirety to the central city category if 50 percent or more of their population fell within the bounds of the primary city of the metropolitan area; otherwise, they were assigned to the suburbs.
8
in the 100 largest metro areas, 20 percent in other metro areas, and 19 percent in nonmetro areas. As a result, the ratios of establishments per 1,000 population are almost identical across the three areas. Within the 100 largest metropolitan areas as of 2002, the suburbs had twice the number of business establishments as central cities (2.9 million versus 1.4 million), but only about 1.8 times as many jobs (46.6 million versus 26.4 million). The ratio of jobs per 1,000 population was much higher for central cities (481) than for the suburbs (386). Between 1998 and 2000, establishments and employment grew in both areas, although the growth rate was nearly twice as high in the suburbs. From 2000 to 2002, although the number of establishments continued to grow at a similar rate, central city employment declined much faster than suburban employment (average annual job losses of 1.5 percent and 0.5 percent, respectively). Table 3. TOTAL EMPLOYMENT AND ESTABLISHMENTS BY METROPOLITAN AREA STATUS 100 Largest Metro Areas National Central Other Non- Total Total Cities Suburbs Metros metro Number of ZIP Codes 38,431 12,906 1,987 10,919 6,941 18,584 Total Population (millions) 281.4 169.6 54.9 114.8 56.6 55.2 Percent of total 100 60 19 41 20 20 Employment Total 2002 (millions) 112.4 73.0 26.4 46.6 21.7 17.7 Percent of total 100 65 23 41 19 16 Per 1,000 population 2002 399 417 481 386 364 289 % growth/yr 1998-2000 2.7 3.0 1.9 3.7 2.5 1.8 % growth/yr 2000-2002 (0.7) (0.9) (1.5) (0.5) (0.5) (0.5) Establishments Total 2002 (millions) 7.2 4.4 1.4 2.9 1.5 1.4 Percent of total 100 61 20 41 20 19 Per 1,000 population 2002 26 25 26 25 25 24 % growth/yr 1998-2000 0.9 1.2 0.2 1.7 0.8 0.2 % growth/yr 2000-2002 0.9 1.0 0.3 1.3 1.1 0.5
Employment by Establishment Size The distribution of employment across the establishment size categories in the 100 largest metropolitan areas is similar to that for the United States overall. Almost half of all jobs in the top 100 metro areas are provided by establishments with 100 or more employees, compared with 43 percent for other metros and 42 percent for nonmetro areas. In contrast, jobs in the nonmetro areas are more concentrated in smaller establishments (e.g., in these areas, 47 percent of all jobs are in establishments with

9
fewer than 50 employees, compared with only 36 percent of jobs in the central cities of the large metros). Across all types of areas, as shown on the table, large establishments consistently suffered the highest job loss rates between 2000 and 2002, with the highest being the 3.8 percent annual decline for the 100-499 employee category in the central cities of the larger metros (compared with a -2.4 percent rate for the suburbs in that category). In contrast, in almost all locations, establishments with fewer than 50 employees registered gains, albeit modest ones. The highest positive rate was 1.5 percent for the 10-49 employee category in the suburbs of the larger metros. Table 4. EMPLOYMENT BY ESTABLISHMENT SIZE AND METROPOLITAN AREA STATUS 100 Largest Metro Areas National Central Other Non- Total Total Cities Suburbs Metros metro Percent of employment by establishment size, 2002 1-9 employees 14 13 11 14 15 18 10-49 employees 28 27 25 27 29 29 50-99 employees 13 13 13 13 13 12 100-499 employees 25 26 26 26 24 23 500+ employees 20 22 25 20 19 19 Total 100 100 100 100 100 100 Change in employment (%/yr), 2000-2002 1-9 employees 1.0 1.0 0.3 1.3 1.1 0.8 10-49 employees 0.9 0.9 (0.2) 1.5 1.1 0.6 50-99 employees (0.4) (0.5) (1.4) 0.0 0.1 (1.0) 100-499 employees (2.8) (2.9) (3.8) (2.4) (2.3) (2.9) 500+ employees (1.6) (1.8) (1.2) (2.3) (2.3) 0.3 Total (0.7) (0.9) (1.5) (0.5) (0.5) (0.5)
Establishments by Industry In metro areas, proportionately more establishments are in the information, finance, and professional services industries (32 percent of establishments in the 100 largest metros and 27 percent in the other metros) than in the nonmetro areas (22 percent). The two services categories together now account for two-thirds of all establishments in the large metro central cities (versus only 54 percent in nonmetropolitan areas). Between 2000 and 2002, all locations lost manufacturing establishments; the loss was particularly severe in the central cities of the large metros (-3.1 percent per year, compared with an overall rate of -1.4 percent). While the central cities also experienced losses in three other industry groups, almost all other areas saw increases in all nonmanufacturing industries. Information, financial, and professional services was the leader everywhere, with establishments growing 2.9 percent annually in the suburbs of

10
both the large metros and the other metros overall (compared with a low of +1.2 percent for the large metro central cities). Table 5. ESTABLISHMENTS BY INDUSTRY AND METROPOLITAN AREA STATUS 100 Largest Metro Areas National Central Other Non- Total Total Cities Suburbs Metros metro Percent of establishments by sector, 2002
Agriculture, forestry, mining 1 0 0 0 1 2
Manufacturing 5 5 4 5 5 5
Utilities, construct., transp. 13 12 8 13 14 16
Trade 22 21 21 21 22 23
Info., finance, professional 29 32 34 31 27 22
Other services 31 31 33 30 32 32 Total 100 100 100 100 100 100 Change in establishments (%/yr), 2000-2002
Agriculture, forestry, mining 0.6 0.5 (1.5) 1.3 0.5 0.7
Manufacturing (1.4) (2.0) (3.1) (1.6) (0.8) (0.2)
Utilities, construct., transp. 0.4 0.4 (0.1) 0.5 0.6 0.2
Trade 0.1 0.2 (0.4) 0.5 0.2 (0.5)
Info., finance, professional 2.5 2.3 1.2 2.9 2.9 2.3
Other services 0.7 0.9 0.4 1.1 0.7 0.3 Total 0.9 1.0 0.3 1.3 1.1 0.5
Analysis by Poverty Level
Total Employment and Establishments by Poverty Level For community development practitioners, it is particularly important to be able to track changes in employment and business establishments in low-income neighborhoods as well as for the local economy overall. To provide national context for such analysis, we have classified all ZIP-code areas according to their poverty levels as reported in the 2000 Census: high poverty = poverty rate of 20 percent or more; medium = 11-20 percent; and low = 10 percent or less.6
6 A poverty rate of 30 or 40 percent is customarily used to demarcate high-poverty census tracts. However, ZIP codes encompass much larger territories and rarely have poverty rates that high. We estimate that a 20 percent poverty rate is a more appropriate threshold for isolating high-poverty areas at the ZIP code level.

11
Table 6 shows that, as of 2002, about half of all establishments and jobs were located in low-poverty areas.7 Even though almost three times as many jobs were available in the low-poverty areas as in the high-poverty areas, the ratio of jobs to population was almost the same (390 jobs per 1,000 people). The low-poverty areas experienced the fastest job growth rate between 1998 and 2000 (3.7 percent per year, compared with 1.2 percent in high-poverty areas). Employment remained stable in the low-poverty areas from 2000 to 2002, whereas the high-poverty areas lost jobs at an annual rate of 1.5 percent over that period. The high-poverty areas also lost establishments between 1998 and 2000. Although this trend reversed over the next two years, the high-poverty areas experienced a much slower establishment growth rate than the medium- or low-poverty areas. Table 6. TOTAL EMPLOYMENT AND ESTABLISHMENTS BY POVERTY LEVEL Poverty Level National High Medium Low Total (>20%) (11-20%) (0-10%) Number of ZIP Codes 38,431 5,567 11,371 14,841 Total Population (millions) 281.4 48.2 95.4 137.7 Employment Total 2002 (millions) 112.4 18.8 34.6 53.5 Percent of total 100 17 31 48 Per 1,000 Population 2002 399 390 363 389 % growth/yr 1998-2000 2.7 1.2 1.9 3.7 % growth/yr 2000-2002 (0.7) (1.5) (1.3) (0.0) Establishments Total 2002 (million) 7.2 1.1 2.3 3.7 Percent of total 100 15 32 51 Per 1,000 population 2002 26 22 24 27 % growth/yr 1998-2000 0.9 (0.5) 0.1 1.6 % growth/yr 2000-2002 0.9 0.2 0.9 1.8
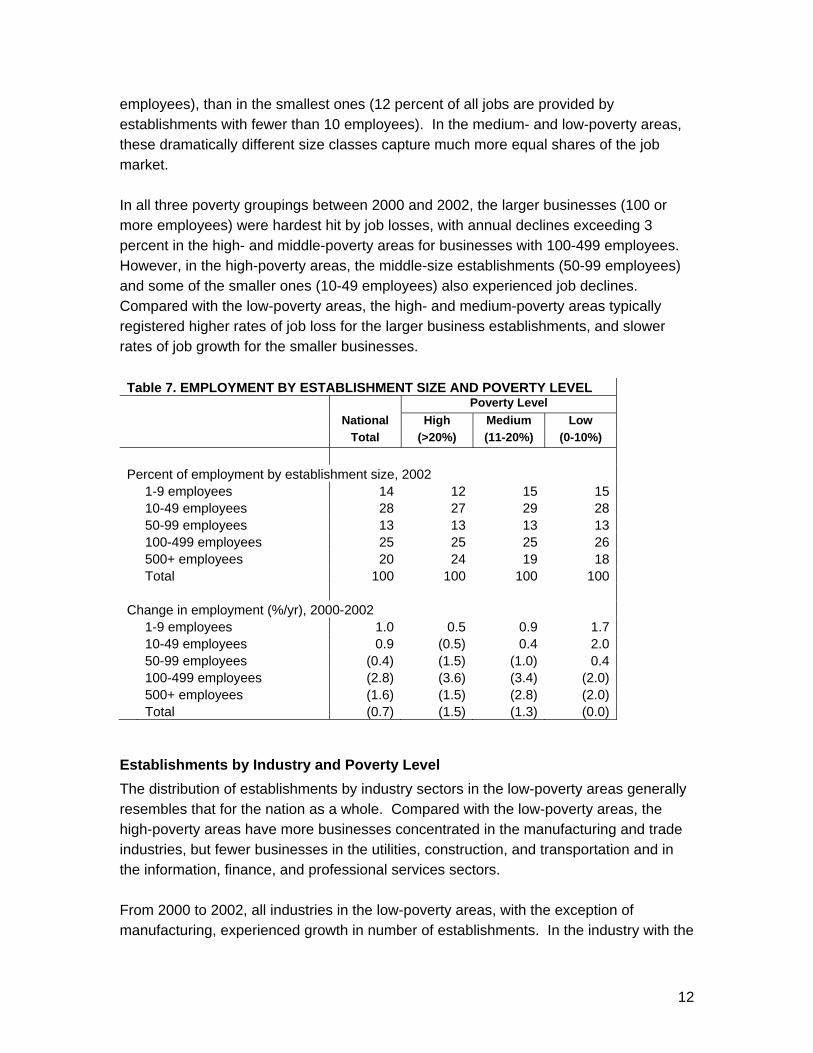
Employment by Establishment Size and Poverty Level The distribution of employment across businesses of various sizes is generally similar in the different poverty categories, but some important variations are worth noting (Table 7). In high-poverty areas, considerably more jobs are concentrated in the largest establishments (24 percent of all jobs are provided by establishments with 500 or more 7 ZIP codes in the poverty-level categories do not add to the national total because data are not displayed for those ZIP codes for which we were unable to determine the poverty rate (see discussion in Annex B). Nationally, such ZIP codes account for about 5 percent of total employment and 3 percent of all establishments.
12
employees), than in the smallest ones (12 percent of all jobs are provided by establishments with fewer than 10 employees). In the medium- and low-poverty areas, these dramatically different size classes capture much more equal shares of the job market. In all three poverty groupings between 2000 and 2002, the larger businesses (100 or more employees) were hardest hit by job losses, with annual declines exceeding 3 percent in the high- and middle-poverty areas for businesses with 100-499 employees. However, in the high-poverty areas, the middle-size establishments (50-99 employees) and some of the smaller ones (10-49 employees) also experienced job declines. Compared with the low-poverty areas, the high- and medium-poverty areas typically registered higher rates of job loss for the larger business establishments, and slower rates of job growth for the smaller businesses. Table 7. EMPLOYMENT BY ESTABLISHMENT SIZE AND POVERTY LEVEL Poverty Level National High Medium Low Total (>20%) (11-20%) (0-10%) Percent of employment by establishment size, 2002 1-9 employees 14 12 15 15 10-49 employees 28 27 29 28 50-99 employees 13 13 13 13 100-499 employees 25 25 25 26 500+ employees 20 24 19 18 Total 100 100 100 100 Change in employment (%/yr), 2000-2002 1-9 employees 1.0 0.5 0.9 1.7 10-49 employees 0.9 (0.5) 0.4 2.0 50-99 employees (0.4) (1.5) (1.0) 0.4 100-499 employees (2.8) (3.6) (3.4) (2.0) 500+ employees (1.6) (1.5) (2.8) (2.0) Total (0.7) (1.5) (1.3) (0.0)
Establishments by Industry and Poverty Level The distribution of establishments by industry sectors in the low-poverty areas generally resembles that for the nation as a whole. Compared with the low-poverty areas, the high-poverty areas have more businesses concentrated in the manufacturing and trade industries, but fewer businesses in the utilities, construction, and transportation and in the information, finance, and professional services sectors. From 2000 to 2002, all industries in the low-poverty areas, with the exception of manufacturing, experienced growth in number of establishments. In the industry with the

13
highest percentage share of the establishments in the low-poverty areas (the information, finance, and professional services sector), the number of establishments grew at an annual rate of 3.4 percent. At the same time, in the medium- and high-poverty areas, more industry sectors experienced a decline in establishments. Moreover, the ones that experienced growth expanded at a much slower rate than their counterparts in the low-poverty areas. Table 8. ESTABLISHMENTS BY INDUSTRY AND POVERTY LEVEL Poverty Level National High Medium Low Total (>20%) (11-20%) (0-10%) Percent of establishments by sector, 2002 Agriculture, forestry, mining 1 1 1 0 Manufacturing 5 6 5 4 Utilities, construct., transp. 13 9 13 14 Trade 22 24 23 21 Info., finance, professional 29 27 26 31 Other services 31 33 33 30 Total 100 100 100 100 Change in establishments (%/yr), 2000-2002 Agriculture, forestry, mining 0.6 0.3 0.3 2.1 Manufacturing (1.4) (2.4) (0.9) (1.0) Utilities, construct., transp. 0.4 (0.4) 0.8 1.6 Trade 0.1 (0.5) (0.1) 0.7 Info., finance, professional 2.5 1.3 2.6 3.4 Other services 0.7 0.4 0.7 1.3 Total 0.9 0.2 0.9 1.8
Residential Versus Business ZIP Code Areas In all regions, economic activity tends to be more concentrated in some sub-areas than in others, and the spatial pattern of employment density is normally quite different than the spatial pattern of residential density. In this section, we examine whether the economic structure and trends in “business ZIP code areas” (central business districts and other areas with high business concentrations) differed markedly from those in “residential ZIP code areas.” To do so, we defined the business ZIP codes to be those with ratios of employment to population in the top quartile of the distribution (340 or more in 2002). By this definition, the business ZIP codes had, on average, 679 jobs per 1,000 population, and the remaining areas — the residential ZIP codes — had an average of only 183 jobs per 1,000 population.

14
Table 9 presents the key indicators for both types of ZIP code areas. As would be expected, the business areas, which make up only one quarter of the ZIP codes, account for much higher shares of all establishments (six of 10) and jobs (seven of 10). In terms of growth trends, the differences are not pronounced. Employment in both types of areas grew at a similar rate from 1998 to 2000 and declined from 2000 to 2002 (although at a somewhat faster rate in the business areas). In contrast, differences in business- and residential-area employment trends were quite sharp in the central cities and high-poverty areas. In both cases, and for both periods, trends were much more favorable for the residential areas than for the business areas. For example, between 2000 and 2002, the employment loss rate for business ZIP codes was 2.5 times that for residential areas in central cities and more than 10 times the rate for residential ZIP codes in high-poverty areas.

15
Figure 3. Establishments per Capita (2002) in Selected Residential Services Sectors by Metropolitan Area Status
for Residential ZIP Code Areas
0 10 20 30 40 50 60
Grocery and supermarketstores
Social assistance services
Convenience stores
Drug stores
Dry cleaners/laundries
Other food and drinkingestab.
Off ices of physicians
Full-service Restaurants
Commercial banks
Off ices of dentists
Personal care services
Establishments per 100,000 population, 2002
Central Cities
SuburbsOther Metros
Non- metro
Figure 3 illustrates that business and residential areas also differed markedly with respect to establishment size. In all business areas, 49 percent of the jobs are in establishments with 100 employees or more, compared with only 32 percent of the jobs in the residential areas; 21 percent of residential area jobs are in establishments with fewer than 10 employees, compared with only 12 percent of the jobs in the business areas. These basic relationships hold in central cities and high-poverty areas. In terms of the distribution of establishments by industry sector, the two types of areas also differ significantly. First, business ZIP codes have a higher share of all establishments in the information, finance, and professional services group (32 percent versus 24 percent overall, with even more pronounced gaps evident for central cities and high-poverty areas). Alternatively, residential ZIP codes have higher concentrations in other services and in utilities, construction, and transportation. These differences

16
between business and residential ZIP codes hold in central cities and high-poverty areas, again in a more pronounced form. The share of all establishments in trade is similar for the two types of areas overall; residential ZIP codes, however, have a greater share of establishments in this industry group in central cities and high-poverty areas. Table 9. EMPLOYMENT AND ESTABLISHMENTS IN RESIDENTIAL AND BUSINESS ZIP CODE AREAS Total Central Cities High Poverty
Resident. Business Resident. Business Resident. Business
Number of ZIP Codes 23,870 7,956 977 1,002 4,304 1,263 Employment Total 2002 (millions) 31.0 75.9 6.0 20.3 5.5 13.3 Per 1,000 population 2002 183 679 175 974 168 855 % growth/yr 1998-2000 2.51 2.70 3.43 1.43 2.56 0.61 % growth/yr 2000-2002 (0.43) (0.84) (0.70) (1.75) (0.20) (2.08) Establishments Total 2002 (millions) 2.9 4.1 0.5 1.0 0.4 0.6 Per 1,000 population 2002 17 37 14 46 13 40 % growth/yr 1998-2000 0.93 0.63 1.70 (0.50) 0.86 (1.35) % growth/yr 2000-2002 1.34 1.17 1.45 (0.23) 1.78 (0.86) Percent of establishments by sector, 2002 Agriculture, forestry, mining 1 0 0 0 1 1 Manufacturing 5 5 5 4 6 5 Utilities, construct., transp. 16 10 11 7 12 8 Trade 21 22 23 20 26 22 Info., finance, professional 24 32 25 38 20 33 Other services 32 31 37 31 35 32 Total 100 100 100 100 100 100
Analysis for Residential Services Establishments
Residential Services Establishments Residential services establishments typically serve surrounding residential neighborhoods, rather than larger city- or metropolitanwide markets. According to widespread perceptions, a comparative lack of such establishments in low-income neighborhoods presents an additional burden to our nation’s poor. Because of environmental factors (e.g., high crime rates) as well as perceived deficits in purchasing power, many private businesses are thought to avoid locating in low-income neighborhoods. Fewer services near people’s homes can force families to travel longer distances to obtain competitively priced services or pay higher prices to obtain them nearby (if they are available at all). Despite this concern, little direct research is

17
available on this topic,8 particularly research that examines conditions for an array of different services. Data for the 11 residential services categories are shown in Tables 10 and 11.9 In the rest of this section, we report on the extent of residential service establishments only in the residential ZIP-code areas as defined earlier (to avoid any distortion from the business areas’ relatively low residential populations). Nationwide, the ratios of establishments to population vary widely across these categories. In 2002, there were 56 establishments per 100,000 population in the other food and drinking establishments group, 49 in the full-service restaurants, and 41 in the physicians’ offices groups, compared with only about 11 convenience stores and dry cleaners/laundries (Table 10).10 These groups’ growth trends also differed markedly. Social assistance services and convenience stores experienced very high average annual growth rates of 8.3 percent and 8.1 percent, respectively. Commercial banks and food and drinking establishments (other than full-time restaurants) also saw relatively strong average annual growth of 4.6 percent and 2.3 percent, respectively. At the other end of the spectrum, grocery/supermarkets and dry cleaners/laundries experienced annual average declines in establishments of 3.8 percent and 0.7 percent, respectively.
8 Noteworthy contributions to date include Richard D. Bingham and Zhongcai Zhang, “Poverty and Economic Morphology of Ohio Central-City Neighborhoods” (Urban Affairs Review, 32(6): 766-6, 1997), Diane Gibson, “Neighborhood Effects in Store Location: A Theoretical and Empirical Analysis of the Availability of Grocery Stores in Chicago” (Ph.D. diss. University of Chicago, 1999), Daniel Immergluck, “Neighborhoods, Race and Capital: The Effects of Residential Change on Commercial Investment Patterns” (Urban Affairs Review, 34(3): 397-411, 1999), and Amy Helling and David S. Sawicki, “Race and Residential Accessibility to Shopping and Services (Housing Policy Debate, 14(1 and 2): 69-101, 2003). 9 The NAICS codes that define these categories are groceries/supermarkets, 445110; convenience stores, 445120; drugstores, 446110; commercial banks, 522110; offices of physicians, all codes starting with 6211; offices of dentists, all codes starting with 6212; social assistance services, all starting with 6241; full-service restaurants, 722110; other food services (cafeterias, snack bars, mobile food services), all codes starting with 72221 and 722330; personal care services (barber shops, beauty salons), all codes starting with 8121; and dry cleaners/laundries, all codes starting with 8123. 10 Note that in this analysis densities of residential services establishments are expressed per 100,000 population not per 1,000 population, the base used elsewhere in this brief. The larger population base is used because there are substantially fewer residential service establishments than all types of establishments.

18
Table 10. ESTABLISHMENTS IN SELECTED RESIDENTIAL SERVICES SECTORS No. of Establishments Establishments/100,000 population, 2002 Change Total 2002 (%/year), Central High Low (thousands) 2000-2002 Total Cites Poverty Poverty Groceries/supermarkets 35.3 (3.82) 21 28 30 16 Social assistance services 20.4 8.26 12 15 17 9 Convenience stores 18.6 8.13 11 10 12 9 Drugstores 20.0 0.22 12 12 13 10 Dry cleaners/laundries 19.4 (0.71) 11 16 12 11 Other food and drinking estab. 94.9 2.27 56 56 50 58 Offices of physicians 69.9 2.06 41 45 35 44 Full-service restaurants 83.1 1.08 49 40 36 52 Commercial banks 33.5 4.55 20 10 14 21 Offices of dentists 47.8 0.54 28 28 17 35 Personal care services 41.0 1.13 24 24 13 32 Note: Includes only establishments located in residential ZIP codes.
Residential Services by Metropolitan Status and Poverty Level Figure 4 reports the numbers of establishments per 100,000 population for the central cities and suburbs of the 100 largest metro areas, along with other metro areas and nonmetropolitan areas. None of these areas has consistently higher establishments per capita across the residential services categories. The numbers are highest in the central cities for three of the services (groceries/supermarkets, social assistance services, and dry cleaners/laundries), while the suburbs come out on top for four (physicians offices, dentists offices, personal care services, and other food and drinking establishments). Nonmetropolitan areas have the highest ratio of establishments per 100,000 residents for four other services (convenience stores, drugstores, full-service restaurants, and commercial banks). There was no service for which the smaller metro areas had the highest ratio. As to rates of change in establishments from 2000 to 2002, the general patterns already discussed held up in most of the different metropolitan groupings (Table 11). Convenience stores and social assistance services experienced rapid growth in all types of areas, and the numbers of drugstores, dry cleaners/laundries, and groceries/supermarkets either declined or grew very slowly in all areas. Some notable differences in residential services establishment growth rates across area types were evident, however. In the 100 largest metro areas, three resident services sectors grew at least twice as fast in the suburbs than the central cities: offices of physicians and dentists and commercial banks. In contrast, the services that were

19
declining overall (groceries/supermarkets, dry cleaners/laundries) performed better in the central cities than the suburbs. Table 11. CHANGE IN ESTABLISHMENTS IN SELECTED RESIDENTIAL SERVICES SECTORS By Metro Location By Poverty Level 100 Largest Metros Central Other Non- High Medium Low
Cities
Suburbs
Metros metros (>20%) (11-20%) (0-10%)
Change (%/year), 2000-2002 Groceries/supermarkets 1.22 (4.72) (5.96) (6.03) (1.28) (4.34) (5.16)
Social assistance services 7.43 8.05 7.37 9.93 9.18 8.67 7.20
Convenience stores 8.05 6.81 8.67 9.80 9.56 9.88 5.88 Drugstores 0.36 0.69 (0.26) (0.25) 0.66 0.03 0.15 Dry cleaners/laundries 0.98 (0.79) (2.79) (1.48) 1.24 (0.57) (1.61)
Other food and drinking estab. 2.40 3.07 1.39 1.20 2.22 2.11 2.39
Offices of physicians 0.95 2.61 0.32 4.08 2.21 1.46 2.41 Full-service restaurants 1.73 0.95 0.88 1.01 0.95 1.34 0.93 Commercial banks 1.95 4.75 4.15 5.35 3.36 4.68 4.78 Offices of dentists 0.13 1.20 (0.89) 0.74 (0.26) (0.01) 1.00 Personal care services 1.56 1.49 0.99 (0.64) 0.25 0.25 1.68 Note: Table only includes establishments located in residential ZIP codes.

20
Figure 4. Establishments per Capita (2002) in Selected Residential Services Sectors by Metropolitan Area Status
for Residential ZIP Code Areas
0 10 20 30 40 50 60
Grocery and supermarketstores
Social assistance services
Convenience stores
Drug stores
Dry cleaners/laundries
Other food and drinkingestab.
Off ices of physicians
Full-service Restaurants
Commercial banks
Off ices of dentists
Personal care services
Establishments per 100,000 population, 2002
Central Cities
SuburbsOther Metros
Non- metro
Higher-poverty neighborhoods are often assumed to suffer deficits in residential services. Figure 5 supports this assumption for a number of services, particularly dentists’ offices and personal care services. For these two service categories, the number of establishments per 100,000 population in low-poverty areas is at least double that in the high-poverty areas. Commercial banks and full-service restaurants have the next largest differential — 1.5 times the number of establishments per 100,000 population in the low- versus the high-poverty areas. Other services for which low-poverty areas maintain an edge, albeit by a smaller margin, are physician’s offices and other food and drinking establishments.

21
Figure 5. Establishments per Capita (2002)in Selected Residential Services Sectors by Poverty Level
for Residential ZIP Code Areas
0 10 20 30 40 50 60
Grocery and supermarketstores
Social assistance services
Convenience stores
Drug stores
Dry cleaners/laundries
Other food and drinkingestab.
Offices of physicians
Full-service Restaurants
Commercial banks
Offices of dentists
Personal care services
Establishments per 100,000 population, 2002
High (>20%)
Medium (11-20%)
Low (0-10%)
Contrary to common perceptions, however, five of our 11 service categories, on average, have greater per capita densities in the high-poverty ZIP codes than in the low-poverty areas. Dry cleaners/laundries, drugstores, and convenience stores have slightly higher densities in high-poverty areas, and social assistance services and groceries/supermarkets are much more likely to be found in these areas. These particular services are more abundant in high-poverty neighborhoods for a number of reasons. For example, social service establishments are concentrated in high-poverty areas because most of their clients reside in such areas. Laundromats are also more common in low-income neighborhoods because many poor families do not have their own laundry facilities. In terms of groceries and convenience stores, low-income neighborhoods are known for having many small “mom-and-pop” stores, whereas larger chain supermarkets often serve suburban consumers.11
11 Although low-income neighborhoods tend to have more grocery and convenience stores per 100,000 population, residents are likely to pay higher prices than suburban residents for a narrower choice of goods. Corroborating evidence for this view is provided in “The High Cost of

22
Interestingly, the number of services establishments with higher per capita densities in high-poverty areas also grew more rapidly in those areas between 2000 and 2002. For example, as shown in Table 11, the number of convenience stores grew by 9.6 percent per year in high-poverty ZIP-code areas (versus 5.9 percent in low-poverty areas), and the number of social assistance establishments grew at a 9.2 percent annual rate in high-poverty areas (versus 7.2 percent in low-poverty areas). Service categories that were not growing rapidly overall also experienced better performance in high- versus low-poverty areas. For example, in high-poverty areas, drugstores grew at a 0.7 percent annual rate (versus 0.2 percent in low-poverty areas), and the number of groceries/supermarket establishments declined by 1.3 percent per year (versus a much higher 5.2 percent annual rate in low-poverty areas). Conclusions This brief presents data on business patterns and trends at the national level that, while useful for making comparisons, confirm the findings of other research rather than advancing them. The particular strength of this analysis is its more detailed data comparisons for smaller geographies not typically available from other national sources, including comparisons of (1) central cities to suburbs, (2) areas with differing levels of poverty, and (3) areas that have high versus low concentrations of business activity. The analysis reveals several key parameters of continuing metropolitan decentralization. First, it shows that while the central cities of large metro areas gained employment in the late 1990s, they did so more slowly than other areas, and they lost jobs comparatively more rapidly in the early 2000s. Part of the explanation lies in the fact that the cities have a higher share of their total jobs in the largest establishments, which underperformed smaller businesses throughout this period. The cities did retain a larger share of establishments in the nation’s key growth sector (information, finance, and professional services) than did suburban and nonmetropolitan areas, but this relative advantage has declined. The analysis also shows the extent to which high-poverty areas have generally underperformed low-poverty areas in terms of job and establishment growth. The types of establishments that have been losing employment fastest over this decade (e.g., large
Being Poor: Another Perspective on Helping Low-Income Families Get By and Get Ahead” (in Kids Count Data Book, 2003, Baltimore Md.: Annie E. Casey Foundation, 2003), and in Matthew Fellowes and Bruce Katz, The Price is Wrong: Getting the Market Right for Working Families in Philadelphia (Washington D.C.: The Brookings Institution, 2005).

23
establishments and manufacturing industries) are concentrated more heavily in the high- versus the low-poverty ZIP codes. Interestingly, however, not all residential services sectors are more prevalent (per capita) in the lower poverty areas. High-poverty residential ZIP codes have more establishments per capita in such categories as convenience stores and social service agencies; however, they are clearly on the low side for such categories as doctors and dentists offices, restaurants, and commercial banks. To be sure, these general findings mask considerable differences among individual cities and ZIP codes. In fact, as noted earlier in this brief, the most important benefit of the findings will likely be their use as an information backdrop for DataPlace users interested in comparing city or ZIP code trends with the nation’s. Users will also likely be interested in comparing their ZIP code data with other that for other areas, such as that for central city ZIP codes or other high-poverty ZIP codes. For all the indicators noted here, DataPlace can provide such comparisons, which may prove to be of greatest value in local planning.
About This Report Sponsored by the Fannie Mae Foundation in partnership with the National Neighborhood Indicators Partnership, this publication is one of a series of companion guidebooks and analytic briefs to DataPlace™, a Web site providing neighborhood-level data and learning materials to support well-informed policy and programs in the housing and community development fields. Acknowledgments The authors thank the Fannie Mae Foundation for the opportunity to complete this analysis and promote the use of the Business Patterns data files. We also are grateful to Patrick Simmons of the Fannie Mae Foundation for his thoughtful review of early drafts. Finally, we appreciate the editorial contributions of Elizabeth Miranda of the Fannie Mae Foundation.

24
Annex A
Content and Coverage of Business Patterns Data12
The U.S. Census Bureau’s Business Patterns series is produced annually and provides sub-national economic data by industry. The series is useful for studying the economic activity of small areas, analyzing economic changes over time, and benchmarking statistical series, surveys, and databases between economic censuses. The Business Patterns series covers most of the country’s economic activity, but excludes data on self-employed individuals, employees of private households, railroad employees, agricultural production employees, and most government employees. Industry Sector Coverage Industry sector classifications of Business Patterns data are currently based primarily on the North American Industry Classification System (NAICS).13 The 1998-2002 Business Patterns series includes the NAICS sectors listed below. (Groupings of NAICS sectors used in DataPlace are described in the body of this brief.) Sector Description 11 Forestry, Fishing, Hunting, and Agriculture Support 21 Mining 22 Utilities 23 Construction 31-33 Manufacturing 42 Wholesale Trade 44-45 Retail Trade 48-49 Transportation and Warehousing 51 Information 52 Finance and Insurance 53 Real Estate and Rental and Leasing 54 Professional, Scientific, and Technical Services 55 Management of Companies and Enterprises 56 Administrative and Support and Waste Management and Remediation Services 61 Educational Services 62 Health Care and Social Assistance 71 Arts, Entertainment, and Recreation 72 Accommodation and Food Services 81 Other Services (except Public Administration) 95 Auxiliaries (except corporate, subsidiary, and regional management) 99 Unclassified
12 Descriptions of the Business Patterns series, data content, and industrial sector coverage are based closely on U.S. Census Bureau, County Business Patterns: United States: 2002, CBP/02-1, issued November 2004. 13 NAICS, the official industrial classification system of the United States, is used to group establishments that apply the same or similar processes to produce goods or services.

25
The 1998-2002 Business Patterns data exclude the following NAICS industries: crop and animal production (NAICS 111, 112); rail transportation (NAICS 482); National Postal Service (NAICS 491); pension, health, welfare, and vacation funds (NAICS 525110, 525120, 525190); trusts, estates, and agency accounts (NAICS 525920); private households (NAICS 814); and public administration (NAICS 92). The Business Patterns data also exclude governmental establishments, except for wholesale liquor establishments (NAICS 4228), retail liquor stores (NAICS 44531), federally chartered savings institutions (NAICS 522120), federally chartered credit unions (NAICS 522130), and hospitals (NAICS 622). Additional descriptions of NAICS sectors are provided in the manual North American Industry Classification System: United States, 1997. Information on ordering this manual is available at http://www.census.gov/epcd/www/naics.html. Data Content The Business Patterns series provides information on number of establishments, employment, and payroll; DataPlace extracts indicators based only on the first two of these categories. An establishment is a single physical location at which business is conducted or services or industrial operations are performed. It is not necessarily identical with a company or enterprise, which may consist of one or more establishments. When two or more activities are carried on at a single location under a single ownership, all activities are generally grouped together as a single establishment. The entire establishment is classified on the basis of its major activity and all data are included in that classification. Establishment counts in the Business Patterns series represent the number of locations with paid employees at any time during the year. The Business Patterns series also provides data on paid employment for full- and part-time employees, including salaried officers and corporate executives on payroll in the pay period including March 12. Employees on paid sick leave, holidays, and vacations are included; proprietors and partners of unincorporated businesses are excluded. Employment Coverage As noted above, the Business Patterns data cover most of the nation’s economy, but they do not represent all industrial sectors or all types of economic activity. A comparison with employment data reported in the Bureau of Labor Statistics’ Current Employment Statistics (CES) program is illustrative, as the CES provides one of the broadest measures of employment in the United States. As of March 2002, the CES reported U.S. employment of 129.7 million. For the same period, the Business Patterns series reported total employment of 112.4 million, 87 percent of the CES figure. As also noted previously, coverage of the Business Patterns data can vary substantially from place to place, depending on the composition of the local industrial base. Coverage

26
is likely to be particularly low in areas with large numbers of government employees, who for the most part are not included in Business Patterns data. An extreme example of such an area is the District of Columbia, where County Business Patterns reported employment of 419,000 in 2002, 63 percent of District employment recorded in the CES for the same period.

27
Annex B
Methodology and Cautions in Interpretation As noted in the text, several technical issues about our processing of ZIP Business Patterns (ZBP) data in DataPlace warrant explanation. Each of these issues is discussed briefly below. For a more complete understanding of the way the business patterns source data series is developed, see www.census.gov/epcd/cbp/view/cbpview. Full metadata on the methodology for preparing the files for DataPlace are available at http://www.dataplace.org. (1) The Census Bureau suppresses data on employment for geographies where its rules indicate risk of disclosing confidential data. While County Business Patterns (CBP) and ZBP provide a full count of the number of business establishments by area, the Census Bureau suppresses data on total employment in counties, and more frequently ZIP codes, where confidential data may be at risk of being disclosed. For example, if a ZIP code area has one very large establishment and only a few other small firms, publishing accurate data on total employment could give competitors a fairly good idea of that establishment’s employment level. In the DataPlace files affected by such suppression (10 to 15 percent of all ZBP ZIP codes, depending on the year), we have entered an imputed value for employment (calculated by multiplying the number of establishments in each size category by the national average number of employees per establishment in that category). The imputation procedure has very little effect on aggregate employment estimates. For example, the sum of employment in all ZIP codes in the 2000 DataPlace file (including the imputed values) is less than 1 percent below the separately published CBP national total for that year. However, the imputation procedure could result in significant errors in total employment estimates for individual counties and ZIP codes affected by data suppression. (2) DataPlace does not link all ZIP codes identified by ZBP to their exact geographic location. To understand this point, one must first understand more about ZIP code geography. Because ZIP codes are merely postal routes (i.e., collections of addresses), they do not have official boundary lines comparable to those for other recognized territorial subdivisions in the United States (e.g., census tracts or congressional districts). Because ZIP codes are used to tabulate data from many sources, the Bureau of the Census drew boundaries for them nationwide in 2000, creating a set of ZIP Code Tabulation Areas (ZCTAs). These polygons best approximated ZIP codes at that time).

28
Because we were interested in relating several 2000 Census indicators to the business patterns data, we used ZCTAs as the basis for building the ZIP code–level files for DataPlace. To place the ZBP data in this framework, we first matched the ZBP five-digit ZIP codes with the ZCTA codes. Direct matches occurred in a substantial majority of cases (about 80 percent). We then used mapping software to try to identify the locations of ZBP ZIP codes that did not initially match the ZCTA codes — mostly ZIP codes that encompass very small areas with particularly intense postal activity. Sometimes such ZIP codes are assigned to individual buildings (e.g., the headquarters of a federal agency) or building complexes (e.g., a university). In 4 percent of these cases, we successfully located these types of ZIP codes within the physical boundaries of a ZCTA and added the relevant ZBP data into the data already assigned to the surrounding ZCTA. For the remaining 96 percent of nonmatching ZIP codes (i.e., 17 percent of all ZIP codes with ZBP data), we were unable to make assignments using mapping software. Fortunately, these unassigned ZIP codes tend to have small employment levels. Three-quarters of them contain less than 40 jobs, and in total, they account for only 4 percent of all establishments and 2 percent of all employment. Data from the ZIP codes without ZCTA matches are included in the counts but are excluded from the per capita numbers in this brief (since the per capita figures require 2000 Census population data, available only for ZCTAs). Moreover, data for ZIP codes without ZCTA matches will not display on any map or table built with DataPlace, which uses ZCTA boundaries as the master file for ZIP code–level data. These small ZIP code areas are not likely to be of great interest to community development analysts. Nonetheless, it is important to note that DataPlace will report “Not Available” should users attempt to access data for these particular ZIP codes. (3) ZIP code definitions change frequently and do not always conform to municipal boundaries. An additional complexity is that the Postal Service frequently adds, deletes, and modifies ZIP codes. For example, when we add up establishments and employment for a particular metro area, the list of ZIP codes changes modestly from year to year, even though we are likely to be dealing with the same basic territory. For both this analysis and the DataPlace files, we did not identify boundary changes over time. A typical change occurs when a large ZIP code in a high-growth suburban fringe area is divided into two or more smaller ZIP codes. In rare cases, ZIP codes can be reassigned to a different location altogether. Such reassignments have a minimal impact on our analysis: 95 percent of the ZIP codes (representing more than 99 percent of establishments and employment) reported data for all the years shown in the tables. Still, these changes can create difficulties. Where such redefinitions have occurred in individual ZIP codes, it would not be accurate to compare changes in ZBP data over

29
time. Any user requiring detailed information on a specific ZIP code area should confirm the history of the area’s boundary before making decisions based on the data. Also, ZIP code boundaries sometimes overlap county and municipal boundaries. To match ZIP codes to counties, we used a 1999 crosswalk produced by the U.S. Census Bureau (http://www.census.gov/geo/www/tiger/zip1999.html). For most of the country, once a ZIP code was assigned to a county, we could then assign it to a metropolitan area, since metropolitan areas are normally defined as aggregates of counties. The exception was New England, where metropolitan areas are defined as aggregates of towns. For New England, mapping software had to be used to assign ZIP codes to metropolitan areas. For simplicity, central cities in the large metros category include any ZIP code with more than half its population inside the city boundary. To calculate totals for individual municipalities in DataPlace, however, we thought a more refined method was justified. This method involved allocating a share of a ZCTA’s employment and establishments to a municipality based on its share of population in the municipality. Both methods relied on a crosswalk obtained from the Geographic Correspondence Engine from the Missouri Census Data Center (http://mcdc2.missouri.edu/websas/geocorr2k.html). (4) DataPlace relates Decennial Census data from 2000 to all years of the Business Patterns data. Finally, it is important to note that DataPlace does not include annual population or poverty-level updates. As a result, 2000 Census data are used for all years to create per capita indicators and classify ZIP codes into poverty categories. On aggregate, we believe that this limitation does not affect our conclusions. However, it may affect the conclusions of DataPlace users examining particular areas with rapidly changing populations or household incomes.

30
References Bingham, Richard D. and Zhongcai Zhang. 1997. “Poverty and Economic Morphology of
Ohio Central-City Neighborhoods” (Urban Affairs Review, 32(6): 766-6. Fellowes, Matthew and Bruce Katz. 2005. The Price is Wrong: Getting the Market Right
for Working Families in Philadelphia. Washington D.C.: The Brookings Institution.
Gibson, Diane. 1999. “Neighborhood Effects in Store Location: A Theoretical and
Empirical Analysis of the Availability of Grocery Stores in Chicago.” Ph.D. dissertation, University of Chicago.
Helling, Amy and David S. Sawicki. 2003. “Race and Residential Accessibility to
Shopping and Services.” Housing Policy Debate, 14(1 and 2): 69-101. Immergluck, Daniel. 1999. “Neighborhoods, Race and Capital: The Effects of
Residential Change on Commercial Investment Patterns.” Urban Affairs Review, 34(3): 397-411.
Kids Count Data Book. 2003. Baltimore Md.: Annie E. Casey Foundation.