translating lift into dollar value & tracking revenue in optimizely
TRANSCRIPT

Optimizely 2014 ©
Translating “Lift” Into Dollar Value & Tracking Revenue in
Optimizely
December 2014

Optimizely 2014 ©
Agenda
•Why Translate Lift Into Dollar Value?
•How To Track Revenue In Optimizely

Why Translate Lift Into Dollar Value?
Optimizely 2014 ©
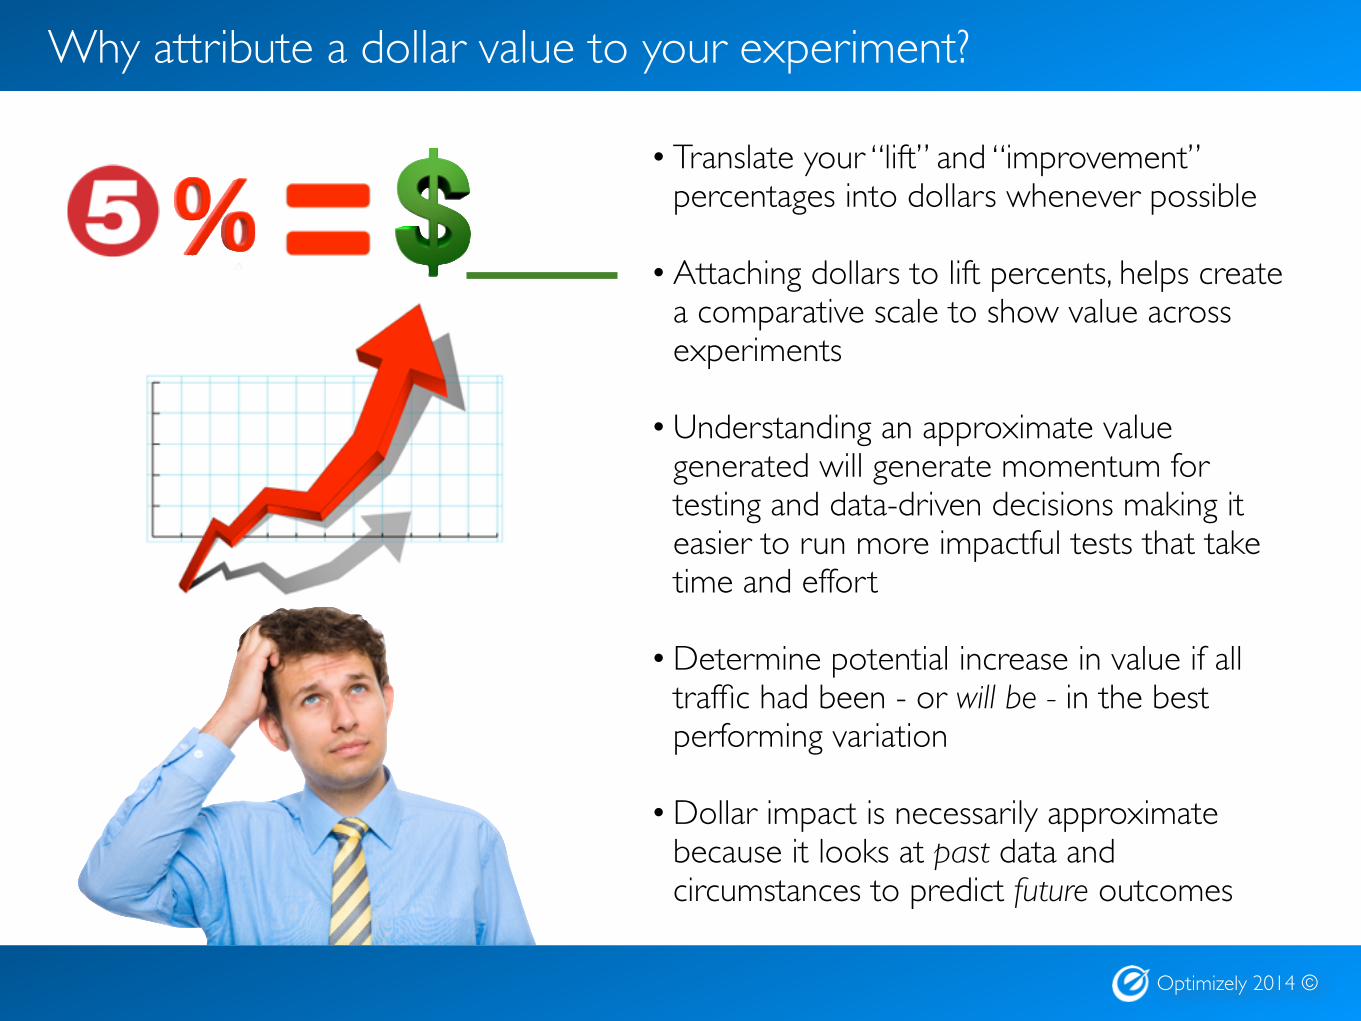
Why attribute a dollar value to your experiment?
• Translate your “lift” and “improvement” percentages into dollars whenever possible
• Attaching dollars to lift percents, helps create a comparative scale to show value across experiments
• Understanding an approximate value generated will generate momentum for testing and data-driven decisions making it easier to run more impactful tests that take time and effort
• Determine potential increase in value if all traffic had been - or will be - in the best performing variation
• Dollar impact is necessarily approximate because it looks at past data and circumstances to predict future outcomes

Optimizely 2014 ©
How can you attribute dollar value to your experiment?
Formula (RPV of winning variation x total visitors tested) - (RPV of original x total visitors tested) / (Percent of traffic in experiment) = Increase in value if winning variation was served to everyone during tested time period
Example Original RPV $1, Winning Variation RPV $2, 100 total visitors tested (and evenly split) which was only 50% of possible traffic. [($2 x 100) - ($1 x 100)] / .5 = $200
Projected Value During the TestThis formula shows the real value that would have been generated if all possible visitors had been shown the winning variation throughout the duration of the test.
Value Generated During Test
Formula (RPV of winning variation x visitors in winning variation) - (RPV of original x visitors in original variation) = Additional Revenue from Test
Example Original RPV $0.75, Winning Variation RPV $1, 100 total visitors tested (and evenly split).($1 x 50) - ($0.75 x 50) = $12.50
This formula shows the actual value generated by showing some visitors what turned out to be the winning variation.
Note: This formula would be applied to all variations that performed better than the original. Similarly, if some variations performed worse than the original, that would need to be subtracted.
• Choose a method that makes the most sense for your business
• Consider the likely duration your winning variation will be implemented for (a few weeks for a sale banner, months for a product promotion, a year or more for layout changes)
Most Narrow Estimation Most Broad Estimation
Projected Incremental ValueThis method assumes that all factors (onsite and offsite) that affected user behavior remain constant. This is never the case. But this method is a popular way to roughly understand how much better off you are likely to by implementing the winning variation.
Formula (RPV of winning variation x expected traffic numbers over a given period) - (RPV of original x expected traffic numbers over same period) = Projected Increase in value if winning variation is served to everyone
Example Original RPV $1, Winning Variation RPV $1.50, 100,000 total visitors per quarter.[($1.50 x 100,000) - ($1 x 100,000)] = $50,000 additional revenue per quarter

Optimizely 2014 ©
Real World Examples
“Each email address that was submitted through our splash page ended up donating an average of $21 during the length of the campaign. The additional 2,880,000 email addresses on our email list translated into an additional $60 million in donations.” - Dan Siroker as the Director of Analytics for the 2008 Obama Campaign
“Email is still the golden goose of fundraising…We’re seeing each email valued at anywhere between $7-8 in future revenue.” - Ryan Meerstein, Senior Political Analyst for Testing and Optimization for the Romney 2012 Campaign

How To Track Revenue
Tracking Revenue
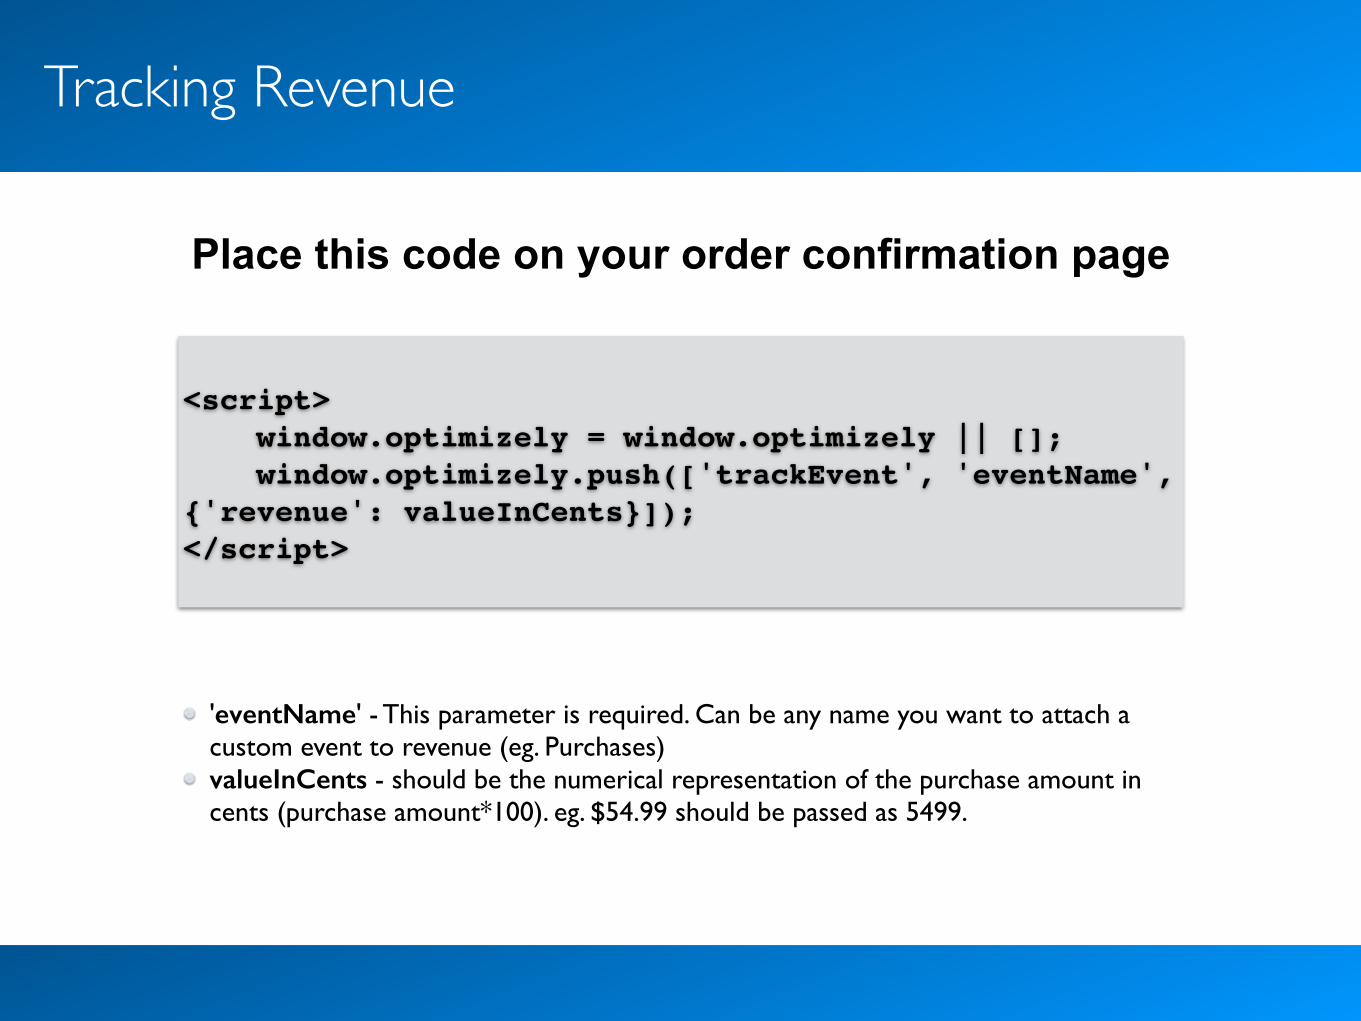
Place this code on your order confirmation page
<script> window.optimizely = window.optimizely || []; window.optimizely.push(['trackEvent', 'eventName', {'revenue': valueInCents}]);</script>
'eventName' - This parameter is required. Can be any name you want to attach a custom event to revenue (eg. Purchases)valueInCents - should be the numerical representation of the purchase amount in cents (purchase amount*100). eg. $54.99 should be passed as 5499.

Revenue Example
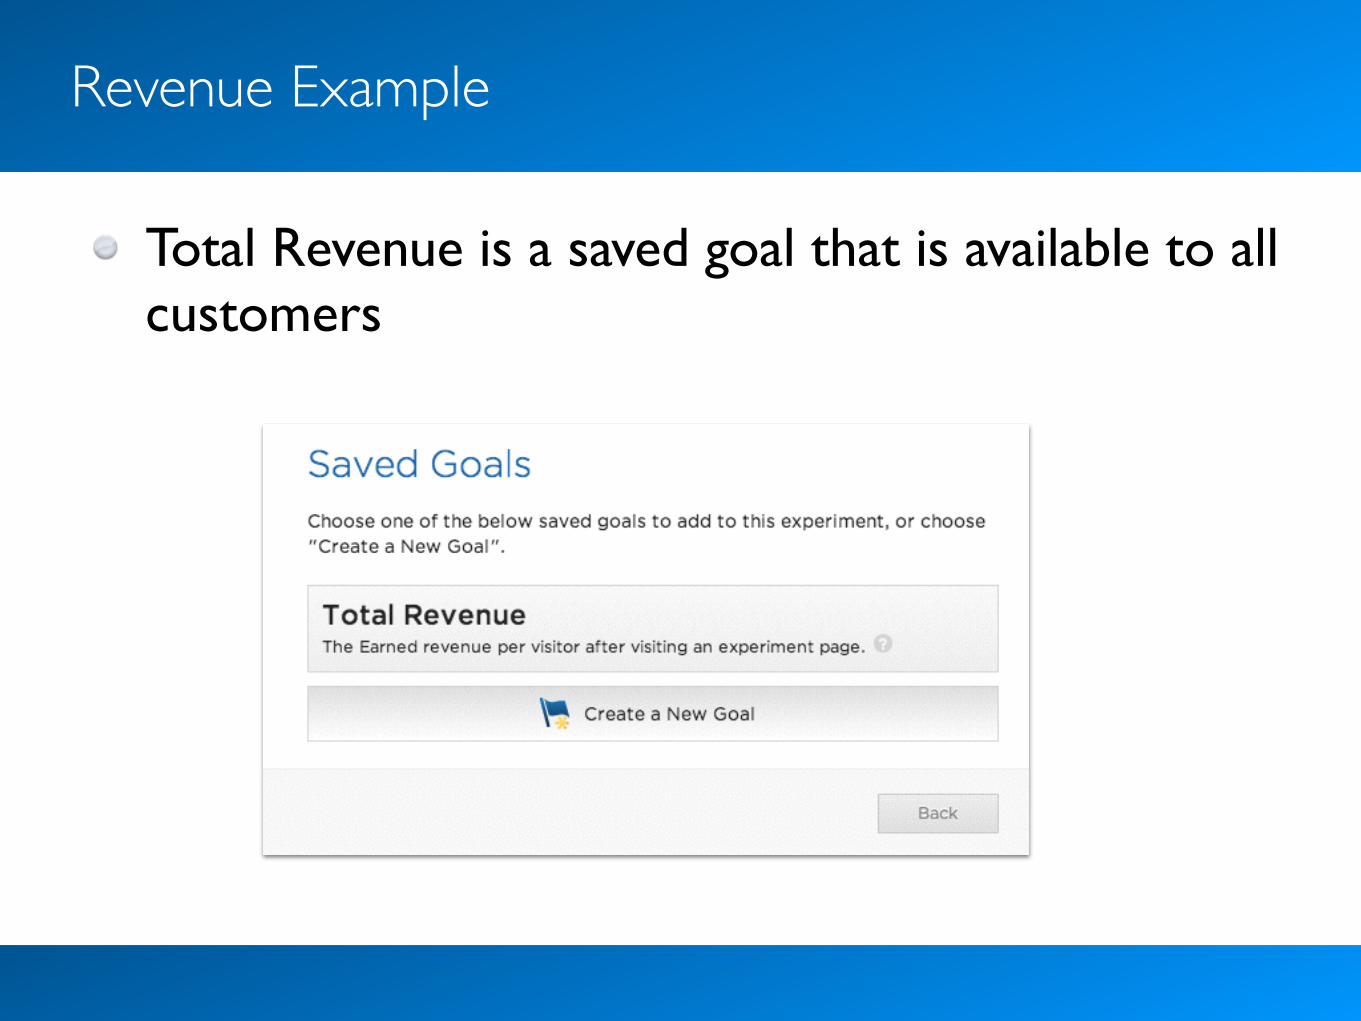
Revenue Example
Total Revenue is a saved goal that is available to all customers

Best Practices
Track revenue after a successful purchase confirmationDon’t trigger revenue based on a button click Verify all revenue is being tracked correctly by sending the order number over as the custom eventConvert all currency before sending to OptimizelyDe-duplicate orders
Best Practices
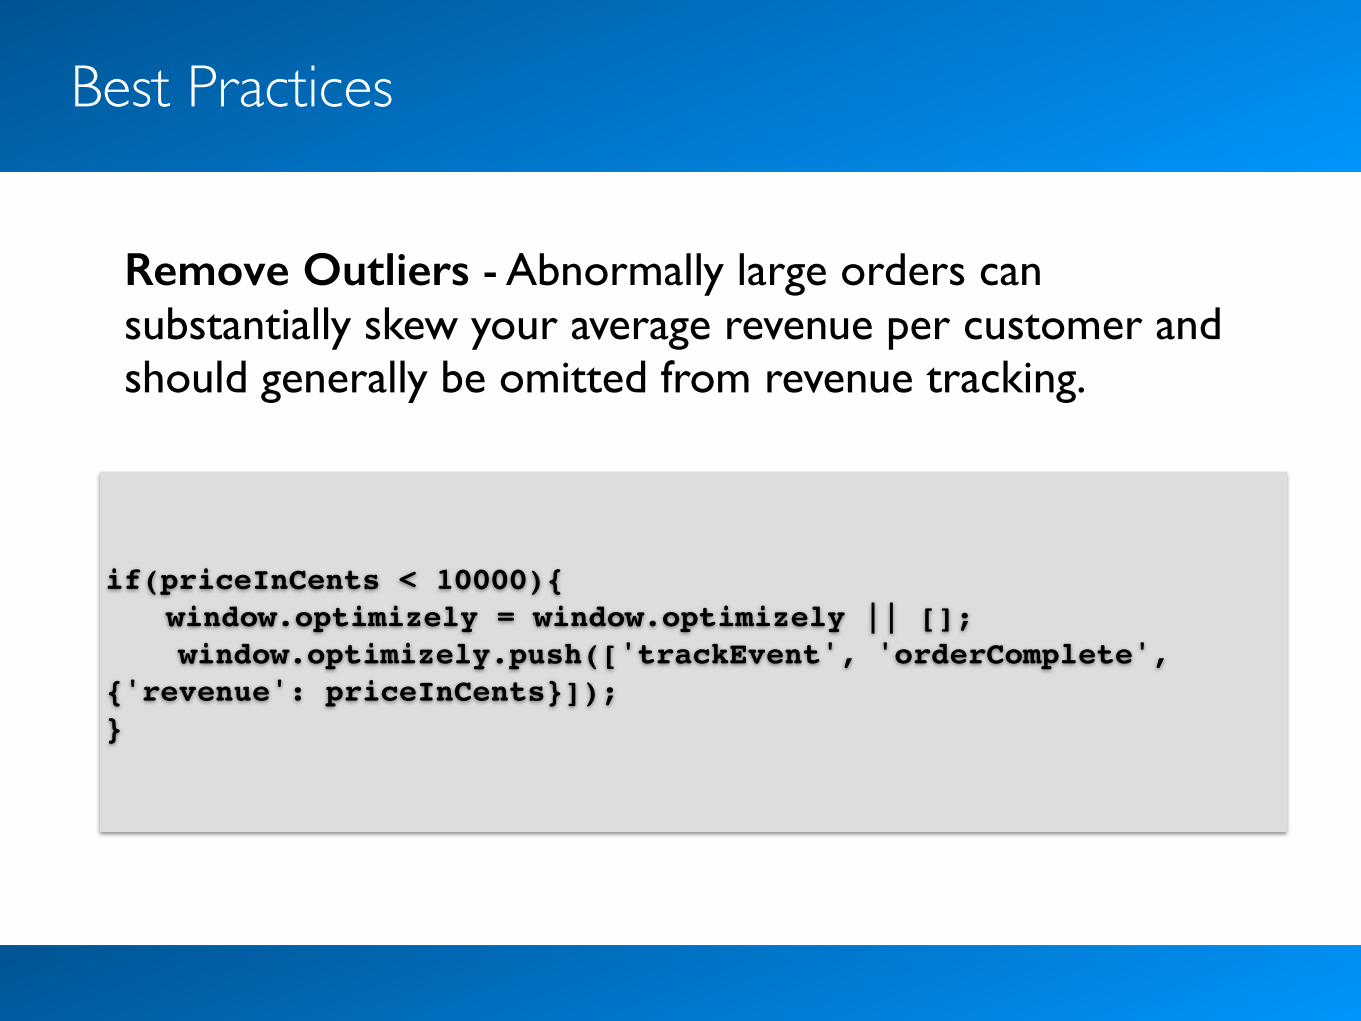
if(priceInCents < 10000){window.optimizely = window.optimizely || [];
window.optimizely.push(['trackEvent', 'orderComplete', {'revenue': priceInCents}]);}
Remove Outliers - Abnormally large orders can substantially skew your average revenue per customer and should generally be omitted from revenue tracking.

More Information
More information about revenue and more advanced revenue tracking can be found on Optiverse:
https://help.optimizely.com/hc/en-us/articles/200039865

Thank You!