transcriptome profile of liver at different physiological
TRANSCRIPT
RESEARCH ARTICLE Open Access
Transcriptome profile of liver at differentphysiological stages reveals potential modefor lipid metabolism in laying hensHong Li1†, Taian Wang1†, Chunlin Xu1, Dandan Wang1, Junxiao Ren1, Yanmin Li1, Yadong Tian1,2, Yanbin Wang1,2,Yuping Jiao1,4, Xiangtao Kang1,2,3* and Xiaojun Liu1,2,3*
Abstract
Background: Liver is an important metabolic organ that plays a critical role in lipid synthesis, degradation,and transport; however, the molecular regulatory mechanisms of lipid metabolism remain unclear in chicken.In this study, RNA-Seq technology was used to investigate differences in expression profiles of hepatic lipidmetabolism-related genes and associated pathways between juvenile and laying hens. The study aimed tobroaden the understanding of liver lipid metabolism in chicken, and thereby to help improve layingperformance in the poultry industry.
Results: RNA-Seq analysis was carried out on total RNA harvested from the liver of juvenile (n = 3) and laying(n = 3) hens. Compared with juvenile hens, 2567 differentially expressed genes (1082 up-regulated and 1485down-regulated) with P ≤ 0.05 were obtained in laying hens, and 960 of these genes were significantlydifferentially expressed (SDE) at a false discovery rate (FDR) of ≤0.05 and fold-change ≥2 or ≤0.5. In addition,most of the 198 SDE novel genes (91 up-regulated and 107 down-regulated) were discovered highly expressed,and 332 SDE isoforms were identified. Gene ontology (GO) enrichment and KEGG (Kyoto Encyclopedia of Genesand Genomes) pathway analysis showed that the SDE genes were most enrichment in steroid biosynthesis,PPAR signaling pathway, biosynthesis of unsaturated fatty acids, glycerophospholipid metabolism, three aminoacid pathways, and pyruvate metabolism (P ≤ 0.05). The top significantly enriched GO terms among the SDEgenes included lipid biosynthesis, cholesterol and sterol metabolic, and oxidation reduction, indicating thatprincipal lipogenesis occurred in the liver of laying hens.
Conclusions: This study suggests that the majority of changes at the transcriptome level in laying hen liverwere closely related to fat metabolism. Some of the SDE uncharacterized novel genes and alternative splicingisoforms that were detected might also take part in lipid metabolism, although this needs further investigation.This study provides valuable information about the expression profiles of mRNAs from chicken liver, and in-depthfunctional investigations of these mRNAs could provide new insights into the molecular networks of lipid metabolismin chicken liver.
Keywords: RNA-Seq, Laying hens, Liver, Fat metabolism, Function analysis
* Correspondence: [email protected]; [email protected]†Equal contributors1College of Animal Science and Veterinary Medicine, Henan AgriculturalUniversity, Zhengzhou 450002, ChinaFull list of author information is available at the end of the article
© 2015 Li et al. Open Access This article is distributed under the terms of the Creative Commons Attribution 4.0 InternationalLicense (http://creativecommons.org/licenses/by/4.0/), which permits unrestricted use, distribution, and reproduction in anymedium, provided you give appropriate credit to the original author(s) and the source, provide a link to the CreativeCommons license, and indicate if changes were made. The Creative Commons Public Domain Dedication waiver (http://creativecommons.org/publicdomain/zero/1.0/) applies to the data made available in this article, unless otherwise stated.
Li et al. BMC Genomics (2015) 16:763 DOI 10.1186/s12864-015-1943-0
BackgroundLiver is the main metabolic organ where more than70 % of the de novo synthesis of fatty acids occurs inchicken [1–3]. Especially, the liver plays an importantrole in lipid synthesis, degradation, and transport pro-cesses. During the hen laying cycle, hydrophobic lipidsincluding triacylglycerols, cholesteryl esters, cholesteryesters, and free fatty acids are synthesized in the liverand assembled to form egg-yolk precursors such as very-low density lipoprotein (VLDL) and vitellogeninparticles. The particles are then secreted into the circula-tion and transferred to the developing oocyte to meetthe requirements for embryo growth and development[4–7]. The molecular regulatory mechanisms of thesecrucial physiological processes have been investigatedextensively since the 1970s, and thus are reasonably wellunderstood [8–11].It is generally agreed that the physiological processes
for lipids synthesis, secretion, and transfer in the liver oflaying hens are regulated tightly by estrogen. Estrogenregulates the transcription of target genes containingconsensus estrogen response elements through the es-trogen receptors (ERs) ERα, ERβ, and G protein-coupledreceptor (GPR30) [12–14]. The different receptors playdistinct roles in gene regulation [13]. Previous studieshave revealed that estrogen physiological functions couldbe mediated by different receptors in various species [15,16]. However, the specific nuclear receptor subtype thatmediates the production of yolk precursors in chickenliver is unclear [17].Although most of the genes and their products in-
volved in hepatic lipid metabolism are highly similar inpoultry and mammalian species, the functions of someof these genes and their products are considered to beslightly different in poultry compared with their func-tions in mammals [4, 18–20]. For instance, a recentstudy on lysophosphatidylglycerol acyltransferase 1(LPGAT1) indicated that LPGAT1 may play an import-ant role in lipid synthesis in mice [21] rather than inpoultry. Moreover, it has been suggested that poultryspecies may have lost some of the genes related to lipidmetabolism during the evolutionary process [22]. There-fore, the range of genes and their products involved inhepatic lipid metabolism in laying hen remains to befully elucidated [23].How VLDL particles are assembled and secreted in
chicken liver is still not fully understood. In mammals, ithas been well documented that microsomal triglyceridetransfer protein (MTTP) assists in lipoprotein assemblyto form low-density lipoprotein [21, 24–28]. The forma-tion of VLDL particles in avian species is tightly regu-lated by estrogen, and a previous study demonstratedthat the up-regulation of MTTP in liver was notrequired for increased VLDL assembly during the laying
period in chicken [29]. Therefore, understanding thesynthesis, formation, and transport of yolk precursors inthe liver of laying hens is important.In recent years, the study of gene regulation and inter-
actions has broadened considerably because of advancesin genomics, epigenomics, and bioinformatics, as well aswith the development of next generation sequencing.RNA-Seq is a novel gene expression profiling technologybased on high-throughput sequencing [30]. Comparedwith other large-scale gene expression profiling methods,RNA-Seq is superior in detecting mRNA expression indifferent tissues or at different development stages in asingle assay, which can help reveal novel genes andsplice variants [31].In this study, expression profiles of hepatic lipid
metabolism-related genes and associated pathways wereinvestigated between juvenile and laying hens (two dif-ferent physiological stages) using RNA-Seq technology.Because lipogenesis is known to be highly stimulated inthe liver of sexually mature hens and to eliminate genesthat may be unrelated to lipid metabolism, liver expres-sion profiles were compared between juvenile hens andlaying hens. Bioinformatics tools were used to analyzethe major differentially expressed genes and pathways.The present study provides an overview of the genesrelated to lipid metabolism that play a significant roleduring embryonic development by synthesizing compo-nents of the egg yolk.
MethodsAnimals and liver tissue samples preparationAll animal experiments were performed in accordancewith the protocol approved by the Institutional AnimalCare and Use Committee (IACUC) of Henan AgriculturalUniversity. The experimental animals used in this studywere one strain of the Chinese domestic breed laying hens(Lushi green shell chicken).All the chickens were raised in cages under the same
environment with ad libitum conditions. Six hens wereselected randomly from two different physiologicalstages, juvenile hens and laying hens. The three juvenilehens were slaughtered when they were 20 weeks old(L20), and the three laying hens were slaughtered whenthey were 30 weeks old (L30). Liver tissue samples wereharvested immediately. The collected samples were im-mediately snap-frozen in liquid nitrogen and stored at−80 °C for further use.
RNA extractionTotal RNA was extracted from the chicken liver tissuesusing TRIzol® reagents following the manufacturer’smanual (Invitrogen, Carlsbad, CA). Degradation andcontamination of the total RNA was detected on 1 %agarose gels. The purity of the total RNA was assessed
Li et al. BMC Genomics (2015) 16:763 Page 2 of 13
using a NanoPhotometer® spectrophotometer (IMPLEN,CA). The integrity was estimated using a RNA Nano6000 Assay Kit with the Agilent Bioanalyzer 2100 system(Agilent technologies, Santa Clara, CA). The RNA con-centration was checked with a Qubit® RNA Assay Kit ina Qubit® 2.0 flurometer (Life Technologies, CA). The28S/18S ratio of the qualified RNA ranged from 1.8 to2.0 and the RNA integrity values ranged from 8.0 to10.0. RNA samples were stored at −80 °C for furtheranalysis.
RNA-Seq library construction and sequencingSix mRNA libraries were constructed, one for each ofthe samples (L20-1, L20-2, L20-3 and L30-1, L30-2,L30-3). A total of 3 μg RNA per sample was preparedfor mRNA sequencing using the TruSeq RNA SamplePrep Kit v2 (Illumina) according to the manufacturer’sprotocol. Briefly, the mRNA was isolated from thetotal RNA using oligo (dT) beads with two rounds ofoligo-dT purification. Following the rRNA depletion step,the purified RNA was fragmented with the Ribo-ZerorRNA Removal Kits (Epicentre). First-strand cDNA syn-thesis was performed using the Invitrogen random hex-amer primers and Superscript II reverse transcriptase(Invitrogen). The second-strand was synthesized usingInvitrogen DNA polymerase 1 (Invitrogen). End repairand poly-adenylation were performed, and the mRNAswere ligated to adapters before PCR amplification. Theenriched cDNA templates that were 100 nucleotides (nt)long were purified and used for further analysis. The li-braries were qualified using a Qubit® 2.0 Fluorometer(Invitrogen) and Qubit dsDNA HS Assay Kit (Invitrogen).The purity and size of the libraries were checked on anAgilent 2100 Bioanalyzer (Agilent Technologies). Theadapter-ligated cDNA fragment libraries were run onan Illumina GAIIx analyzer to complete the clustergeneration and primer hybridization. Then the IlluminaPE flow cell (v3-HS) carrying clusters were sequencedwith paired-end 2 × 100 nt multiplex on an IlluminaHiSeq 2500 platform following the manufacturer’s instruc-tion (Illumina).
Transcriptome sequencing data processing andannotationAfter the sequencing was completed, image data wasoutputted and transformed into raw reads and storedwith a FASTQ format. The obtained raw reads werecleaned using the FASTX-Toolkit (version: 0.0.13) [32].Reads with adapter, low quality at 3′ end, containingfuzzy N bases, rRNA, sequences shorter than 20 nt andlow quality with Q <20 were removed. The resultantclean reads from each sample library were used for thedownstream analyses. The clean reads were mapped to thechicken genome assembly (galGal4), which we downloaded
from Ensembl [33], using the spliced mapping algorithm inTopHat2 (version: 2.0.9) [34]. We used TopHat2 as themapping tool because it can generate a database of splicejunctions based on Ensemble annotations of galGal4 andthus can produce a better mapping result than other non-splice mapping tools.
Transcript identification and alternative splicing analysisWe used the reference annotation-based transcript(RABT) assembly method in Cufflink (version: 2.1.1)[35] to construct and identify both known and noveltranscripts from the TopHat2 alignment results. TheAStalavist software (version: 3.2) [36, 37] cancharacterize alternative splicing (AS) for whole tran-scriptome data from reference annotated transcripts. Weused AStalavist to estimate AS events within andbetween groups. The differentially expressed isoformswere estimated by Cufflink.
Quantification of differential mRNA expression levelsThe expression levels of the mapped genes were esti-mated from the transcriptome sequencing data basedon the number of raw reads. HTSeq (version: 0.6.1)[38] was used to count the numbers of reads mappedto each gene. The reads for each gene were normal-ized by using fragments per kilo base of exon modelper million mapped reads (FPKM). The quantificationand differential analyses were conducted according tothe Cufflink (version: 2.1.1) program. The criterianormalization formula is as follows:
FPKM ¼ transcription readstranscription length� total mapped reads in run� 109
The Cuffdiff was used to analyze the differential ex-pression genes. In our study, the false discovery rate(FDR) was used to determine the threshold of the P-value in multiple tests and analyses. Genes were identi-fied as differentially expressed (DE) genes when P ≤ 0.05.DE genes with fold changes ≥2 or ≤0.5 (FDR ≤0.05) wereidentified as significantly differentially expressed (SDE)genes [39].
Quantitative real time PCR (qRT-PCR)To confirm the repeatability and accuracy of the RNA-Seqgene expression data obtained from the chicken liver li-braries, qRT-PCR was carried out on 12 randomly selectedDE genes that were prepared from the total RNA. ThePrimeScript™ RT Reagent kit with gDNA Eraser (TaKaRa,Dalian, China) was used to synthesize the first-strandcDNA. The qRT-PCRs were performed on a LightCycler®96 Real-Time PCR system (Roche Applied Science) ina 20-μl reaction volume containing 2 μL cDNA, 10 μL
Li et al. BMC Genomics (2015) 16:763 Page 3 of 13
2 × SYBR®Premix Ex Taq™ II (TliRNaseH Plus) (TaKaRa),0.5 μL each of forward and reverse primers (10 μM), and7 μL deionized water. The β-actin gene was used as thereference gene, and all the qRT-PCR gene-specific primerswere designed using the Oligo 6.0 software [40]. The pri-mer sequences are presented in Additional file 1: Table S1.The qPCR amplification procedure was as follows: 95 °Cfor 3 min, 40 cycles of 95 °C for 12 s, 61 °C for 40 s, 72 °Cfor 30 s, and an extension for 10 min at 72 °C. All the re-actions were run with three replicates, and the relativegene expression levels were analyzed using the compara-tive CT method (also referred to as the 2-△△CT method)[41]. In this study, the Wilcox rank sum test was used.The statistical analyses were performed with R for win-dows version 3.2.0 [42], with the test conducted as a one-sided tail test and a significance level of P ≤ 0.05. Thevalues are presented as mean ± standard error.
Functional annotation analysesFunctional enrichment of the SDE genes was analyzedusing the web-based tools in DAVID [43] to identifyenriched gene ontology (GO) terms and KyotoEncyclopedia of Genes and Genomes (KEGG) pathways,group functionally related genes, and cluster the annota-tion terms with a retained of EASE scores 0.1 [44, 45].The P-value was calculated as
P ¼ 1−Xm−1
i¼0
Mi
� �N−Mn−i
� �
Nn
� �
where N is the total number of genes in the genome, nis the total number of SDE genes, M is the number of
genes annotated with a certain GO term, and m is thenumber of SDE genes annotated with the same certainGO term. Only the GO terms and KEGG pathways withP ≤ 0.05 were taken into account as significantlyenriched among the SDE genes [46].
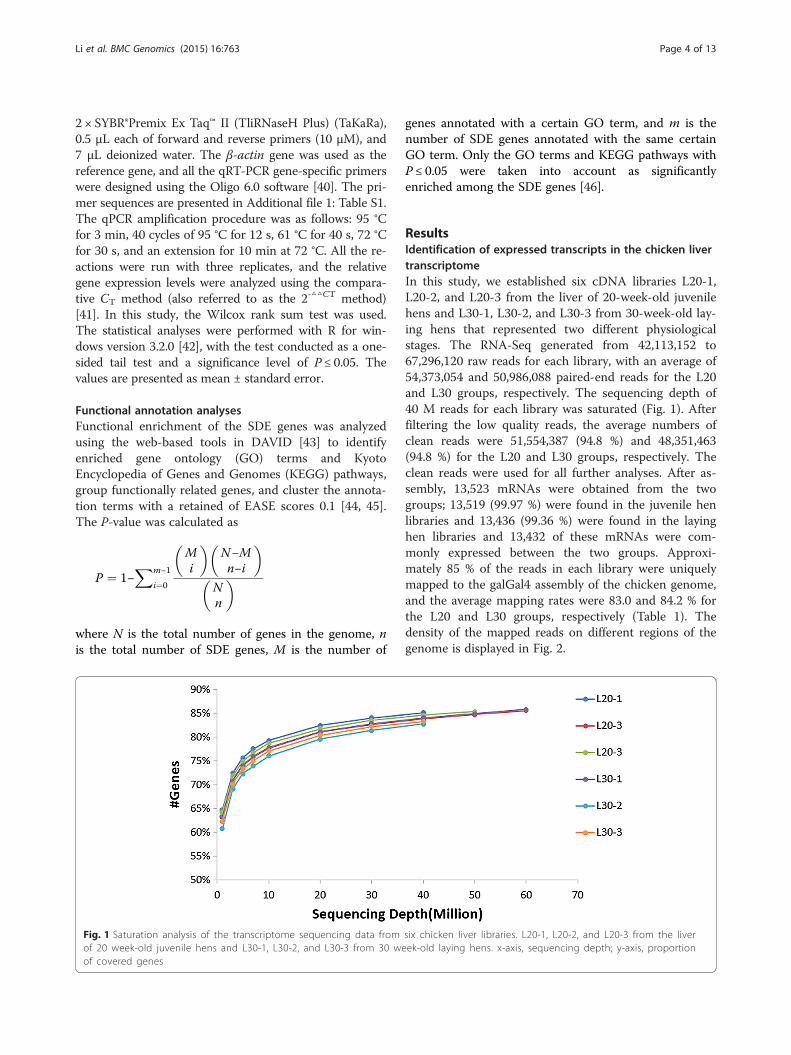
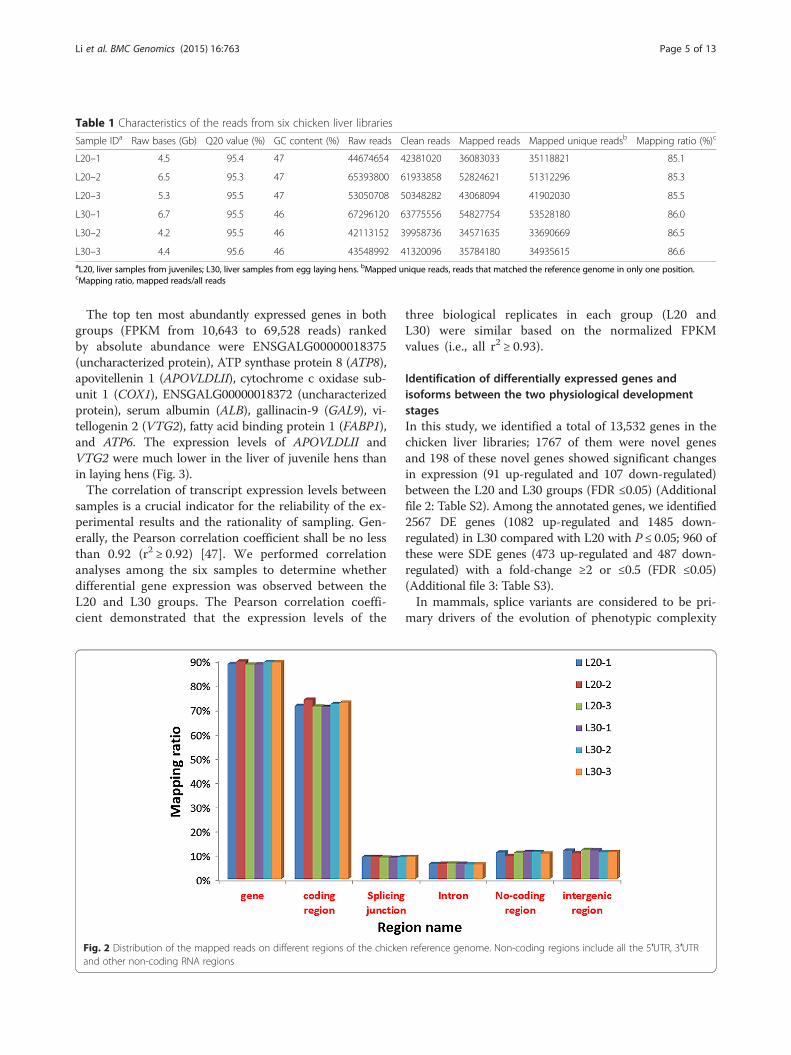
ResultsIdentification of expressed transcripts in the chicken livertranscriptomeIn this study, we established six cDNA libraries L20-1,L20-2, and L20-3 from the liver of 20-week-old juvenilehens and L30-1, L30-2, and L30-3 from 30-week-old lay-ing hens that represented two different physiologicalstages. The RNA-Seq generated from 42,113,152 to67,296,120 raw reads for each library, with an average of54,373,054 and 50,986,088 paired-end reads for the L20and L30 groups, respectively. The sequencing depth of40 M reads for each library was saturated (Fig. 1). Afterfiltering the low quality reads, the average numbers ofclean reads were 51,554,387 (94.8 %) and 48,351,463(94.8 %) for the L20 and L30 groups, respectively. Theclean reads were used for all further analyses. After as-sembly, 13,523 mRNAs were obtained from the twogroups; 13,519 (99.97 %) were found in the juvenile henlibraries and 13,436 (99.36 %) were found in the layinghen libraries and 13,432 of these mRNAs were com-monly expressed between the two groups. Approxi-mately 85 % of the reads in each library were uniquelymapped to the galGal4 assembly of the chicken genome,and the average mapping rates were 83.0 and 84.2 % forthe L20 and L30 groups, respectively (Table 1). Thedensity of the mapped reads on different regions of thegenome is displayed in Fig. 2.
Fig. 1 Saturation analysis of the transcriptome sequencing data from six chicken liver libraries. L20-1, L20-2, and L20-3 from the liverof 20 week-old juvenile hens and L30-1, L30-2, and L30-3 from 30 week-old laying hens. x-axis, sequencing depth; y-axis, proportionof covered genes
Li et al. BMC Genomics (2015) 16:763 Page 4 of 13
The top ten most abundantly expressed genes in bothgroups (FPKM from 10,643 to 69,528 reads) rankedby absolute abundance were ENSGALG00000018375(uncharacterized protein), ATP synthase protein 8 (ATP8),apovitellenin 1 (APOVLDLII), cytochrome c oxidase sub-unit 1 (COX1), ENSGALG00000018372 (uncharacterizedprotein), serum albumin (ALB), gallinacin-9 (GAL9), vi-tellogenin 2 (VTG2), fatty acid binding protein 1 (FABP1),and ATP6. The expression levels of APOVLDLII andVTG2 were much lower in the liver of juvenile hens thanin laying hens (Fig. 3).The correlation of transcript expression levels between
samples is a crucial indicator for the reliability of the ex-perimental results and the rationality of sampling. Gen-erally, the Pearson correlation coefficient shall be no lessthan 0.92 (r2 ≥ 0.92) [47]. We performed correlationanalyses among the six samples to determine whetherdifferential gene expression was observed between theL20 and L30 groups. The Pearson correlation coeffi-cient demonstrated that the expression levels of the
three biological replicates in each group (L20 andL30) were similar based on the normalized FPKMvalues (i.e., all r2 ≥ 0.93).
Identification of differentially expressed genes andisoforms between the two physiological developmentstagesIn this study, we identified a total of 13,532 genes in thechicken liver libraries; 1767 of them were novel genesand 198 of these novel genes showed significant changesin expression (91 up-regulated and 107 down-regulated)between the L20 and L30 groups (FDR ≤0.05) (Additionalfile 2: Table S2). Among the annotated genes, we identified2567 DE genes (1082 up-regulated and 1485 down-regulated) in L30 compared with L20 with P ≤ 0.05; 960 ofthese were SDE genes (473 up-regulated and 487 down-regulated) with a fold-change ≥2 or ≤0.5 (FDR ≤0.05)(Additional file 3: Table S3).In mammals, splice variants are considered to be pri-
mary drivers of the evolution of phenotypic complexity
Table 1 Characteristics of the reads from six chicken liver libraries
Sample IDa Raw bases (Gb) Q20 value (%) GC content (%) Raw reads Clean reads Mapped reads Mapped unique readsb Mapping ratio (%)c
L20–1 4.5 95.4 47 44674654 42381020 36083033 35118821 85.1
L20–2 6.5 95.3 47 65393800 61933858 52824621 51312296 85.3
L20–3 5.3 95.5 47 53050708 50348282 43068094 41902030 85.5
L30–1 6.7 95.5 46 67296120 63775556 54827754 53528180 86.0
L30–2 4.2 95.5 46 42113152 39958736 34571635 33690669 86.5
L30–3 4.4 95.6 46 43548992 41320096 35784180 34935615 86.6aL20, liver samples from juveniles; L30, liver samples from egg laying hens. bMapped unique reads, reads that matched the reference genome in only one position.cMapping ratio, mapped reads/all reads
Fig. 2 Distribution of the mapped reads on different regions of the chicken reference genome. Non-coding regions include all the 5′UTR, 3′UTRand other non-coding RNA regions
Li et al. BMC Genomics (2015) 16:763 Page 5 of 13

[48–50]. We detected a total 14,212 splice variants inboth groups. A total of 332 DE isoforms (115 down-regulated and 217 up-regulated; FDR ≤0.05) were de-tected in L30 compared with L20, and 287 (86.4 %)of them were annotated (Additional file 4: Table S4).The chromosomal position of each transcript was ob-tained by aligning the sequence to the chicken refer-ence genome. The analysis detected six differentsplice patterns in the chicken liver transcriptomedata, namely skipped exon (SE), alternative 5′ splicingsite (A5SS), alternative 3′ splicing site (A3SS),retained intron (RI), mutually exclusive exon (MEX),and complex. Four of these splice patterns, skippedexon, alternative 5′ and 3′splicing sites, and retainedintron were the major splicing patterns found in ourstudy, representing 96.5 % of the total AS events; mu-tually exclusive exon and complex were rare eventsand accounted for only 3.5 % of the AS events (Fig. 4).The average number of alternative transcripts per
chromosome was 721, and chromosomes 16 (93 tran-scripts) and W (eight transcripts) had the smallest num-bers of alternative transcripts.
Real-time PCR validation of differential genes expressionTo confirm the accuracy of the RNA-Seq transcriptomedata, 12 genes were selected randomly including foursignificantly up-regulated genes, three significantlydown-regulated genes, and five genes with no significantdifferential expression. The expression levels of the se-lected genes were quantified using qRT-PCR, and the re-sults were consistent with the findings obtained byRNA-Seq (Table 2). The results suggest that the RNA-Seq reliably identified DE mRNAs and revealed novelgenes in the chicken liver transcriptome.
Functional analysis of differentially expressed genesTo better understand the regulation network of lipidsynthesis and transport during egg production, we ana-lyzed the functional distribution of the DE genes in theliver of laying hens liver compared with the liver of ju-venile hens.We detected 960 SDE genes in L30 compared with
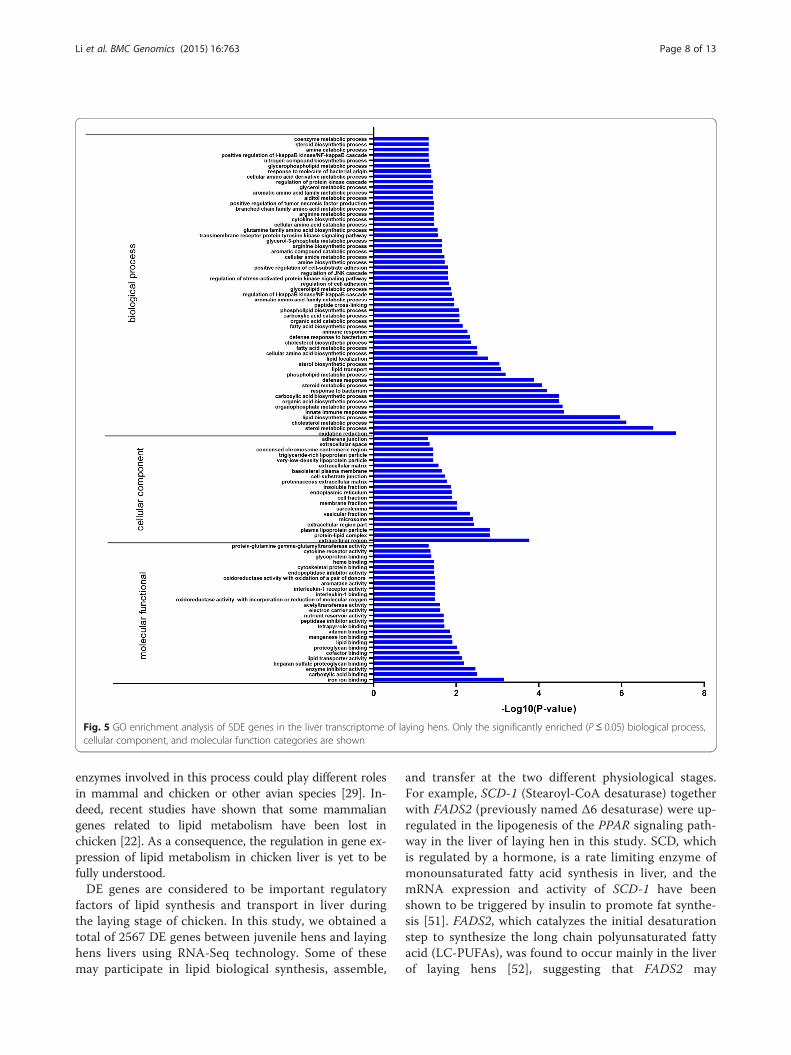
L20 and clustered them based on the GO and KEGGpathway analyses. The percentages of the SDE genes in-volved in the GO biological process, molecular function,and cellular component categories were 46.4, 50.7, and30.7 %, respectively. We obtained a total of 113 clustersbased on the GO functional annotation of the SDE genes(Additional file 5: Table S5). The cluster with the highestscore was most enrichment in sterol, cholesterol, andsteroid metabolic and biosynthetic processes, lipid me-tabolism, lipid localization, protein-lipid complex, plasmalipoprotein particle, VLDL particle, and triglyceride-richlipoprotein particle (Table 3). Thus, the GO term enrich-ment analysis showed that the SDE genes were signifi-cantly enriched in oxidation reduction, sterol andcholesterol metabolic processes, and lipid biosyntheticprocesses (Fig. 5). SDE genes enriched in terms related to
Fig. 4 Distribution of alternative splicing isoforms in liver libraries from juvenile and laying hens
Fig. 3 Top ten most abundantly expressed mRNAs in liver librariesfrom juvenile and laying hens. FPKM values of up to 10,000 genesare shown
Li et al. BMC Genomics (2015) 16:763 Page 6 of 13
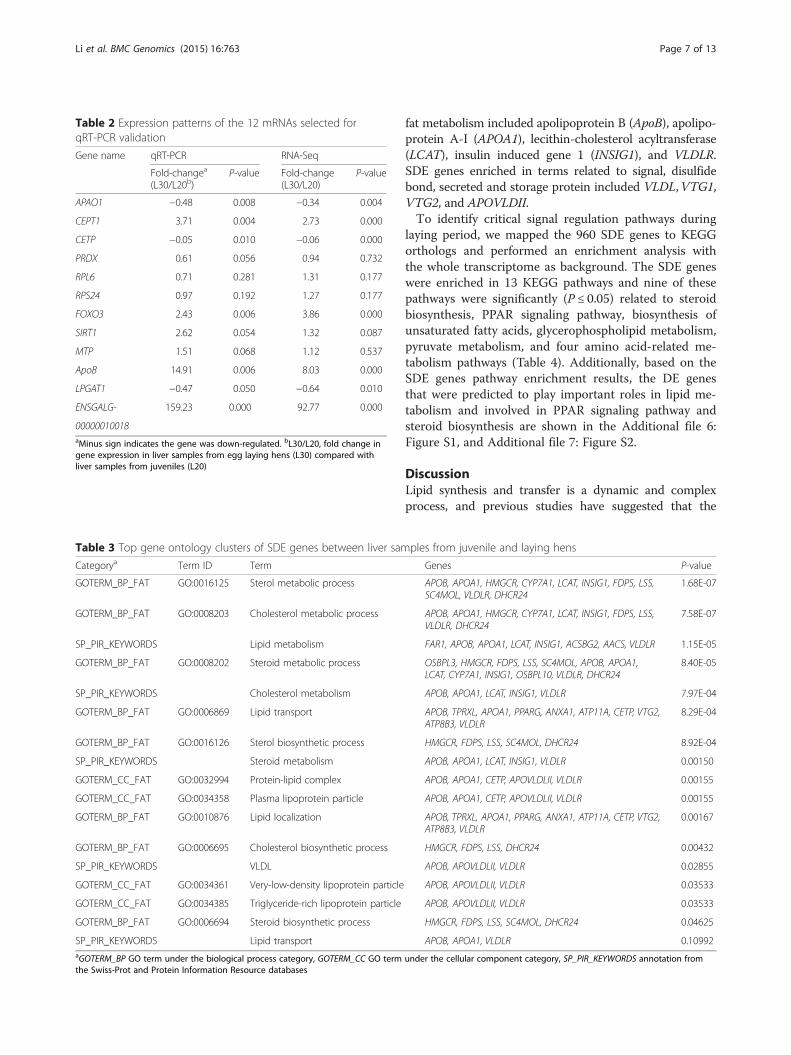
fat metabolism included apolipoprotein B (ApoB), apolipo-protein A-I (APOA1), lecithin-cholesterol acyltransferase(LCAT), insulin induced gene 1 (INSIG1), and VLDLR.SDE genes enriched in terms related to signal, disulfidebond, secreted and storage protein included VLDL,VTG1,VTG2, and APOVLDII.To identify critical signal regulation pathways during
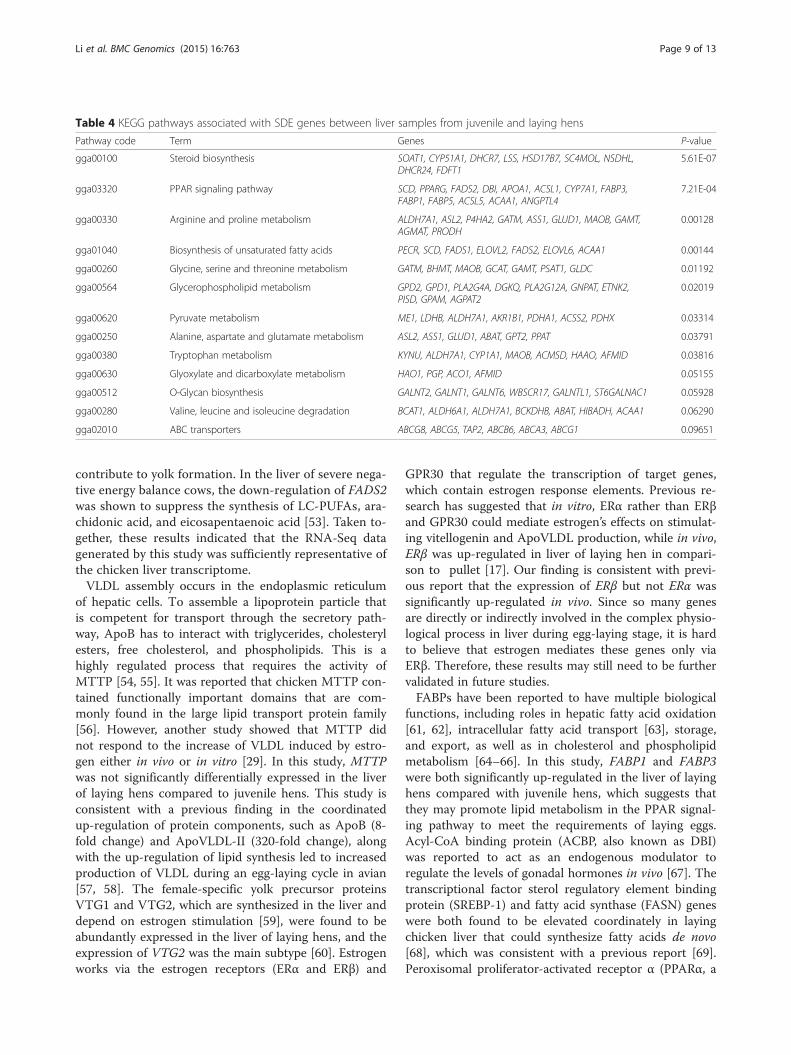
laying period, we mapped the 960 SDE genes to KEGGorthologs and performed an enrichment analysis withthe whole transcriptome as background. The SDE geneswere enriched in 13 KEGG pathways and nine of thesepathways were significantly (P ≤ 0.05) related to steroidbiosynthesis, PPAR signaling pathway, biosynthesis ofunsaturated fatty acids, glycerophospholipid metabolism,pyruvate metabolism, and four amino acid-related me-tabolism pathways (Table 4). Additionally, based on theSDE genes pathway enrichment results, the DE genesthat were predicted to play important roles in lipid me-tabolism and involved in PPAR signaling pathway andsteroid biosynthesis are shown in the Additional file 6:Figure S1, and Additional file 7: Figure S2.
DiscussionLipid synthesis and transfer is a dynamic and complexprocess, and previous studies have suggested that the
Table 2 Expression patterns of the 12 mRNAs selected forqRT-PCR validation
Gene name qRT-PCR RNA-Seq
Fold-changea
(L30/L20b)P-value Fold-change
(L30/L20)P-value
APAO1 −0.48 0.008 −0.34 0.004
CEPT1 3.71 0.004 2.73 0.000
CETP −0.05 0.010 −0.06 0.000
PRDX 0.61 0.056 0.94 0.732
RPL6 0.71 0.281 1.31 0.177
RPS24 0.97 0.192 1.27 0.177
FOXO3 2.43 0.006 3.86 0.000
SIRT1 2.62 0.054 1.32 0.087
MTP 1.51 0.068 1.12 0.537
ApoB 14.91 0.006 8.03 0.000
LPGAT1 −0.47 0.050 −0.64 0.010
ENSGALG- 159.23 0.000 92.77 0.000
00000010018aMinus sign indicates the gene was down-regulated. bL30/L20, fold change ingene expression in liver samples from egg laying hens (L30) compared withliver samples from juveniles (L20)
Table 3 Top gene ontology clusters of SDE genes between liver samples from juvenile and laying hens
Categorya Term ID Term Genes P-value
GOTERM_BP_FAT GO:0016125 Sterol metabolic process APOB, APOA1, HMGCR, CYP7A1, LCAT, INSIG1, FDPS, LSS,SC4MOL, VLDLR, DHCR24
1.68E-07
GOTERM_BP_FAT GO:0008203 Cholesterol metabolic process APOB, APOA1, HMGCR, CYP7A1, LCAT, INSIG1, FDPS, LSS,VLDLR, DHCR24
7.58E-07
SP_PIR_KEYWORDS Lipid metabolism FAR1, APOB, APOA1, LCAT, INSIG1, ACSBG2, AACS, VLDLR 1.15E-05
GOTERM_BP_FAT GO:0008202 Steroid metabolic process OSBPL3, HMGCR, FDPS, LSS, SC4MOL, APOB, APOA1,LCAT, CYP7A1, INSIG1, OSBPL10, VLDLR, DHCR24
8.40E-05
SP_PIR_KEYWORDS Cholesterol metabolism APOB, APOA1, LCAT, INSIG1, VLDLR 7.97E-04
GOTERM_BP_FAT GO:0006869 Lipid transport APOB, TPRXL, APOA1, PPARG, ANXA1, ATP11A, CETP, VTG2,ATP8B3, VLDLR
8.29E-04
GOTERM_BP_FAT GO:0016126 Sterol biosynthetic process HMGCR, FDPS, LSS, SC4MOL, DHCR24 8.92E-04
SP_PIR_KEYWORDS Steroid metabolism APOB, APOA1, LCAT, INSIG1, VLDLR 0.00150
GOTERM_CC_FAT GO:0032994 Protein-lipid complex APOB, APOA1, CETP, APOVLDLII, VLDLR 0.00155
GOTERM_CC_FAT GO:0034358 Plasma lipoprotein particle APOB, APOA1, CETP, APOVLDLII, VLDLR 0.00155
GOTERM_BP_FAT GO:0010876 Lipid localization APOB, TPRXL, APOA1, PPARG, ANXA1, ATP11A, CETP, VTG2,ATP8B3, VLDLR
0.00167
GOTERM_BP_FAT GO:0006695 Cholesterol biosynthetic process HMGCR, FDPS, LSS, DHCR24 0.00432
SP_PIR_KEYWORDS VLDL APOB, APOVLDLII, VLDLR 0.02855
GOTERM_CC_FAT GO:0034361 Very-low-density lipoprotein particle APOB, APOVLDLII, VLDLR 0.03533
GOTERM_CC_FAT GO:0034385 Triglyceride-rich lipoprotein particle APOB, APOVLDLII, VLDLR 0.03533
GOTERM_BP_FAT GO:0006694 Steroid biosynthetic process HMGCR, FDPS, LSS, SC4MOL, DHCR24 0.04625
SP_PIR_KEYWORDS Lipid transport APOB, APOA1, VLDLR 0.10992aGOTERM_BP GO term under the biological process category, GOTERM_CC GO term under the cellular component category, SP_PIR_KEYWORDS annotation fromthe Swiss-Prot and Protein Information Resource databases
Li et al. BMC Genomics (2015) 16:763 Page 7 of 13
enzymes involved in this process could play different rolesin mammal and chicken or other avian species [29]. In-deed, recent studies have shown that some mammaliangenes related to lipid metabolism have been lost inchicken [22]. As a consequence, the regulation in gene ex-pression of lipid metabolism in chicken liver is yet to befully understood.DE genes are considered to be important regulatory
factors of lipid synthesis and transport in liver duringthe laying stage of chicken. In this study, we obtained atotal of 2567 DE genes between juvenile hens and layinghens livers using RNA-Seq technology. Some of thesemay participate in lipid biological synthesis, assemble,
and transfer at the two different physiological stages.For example, SCD-1 (Stearoyl-CoA desaturase) togetherwith FADS2 (previously named Δ6 desaturase) were up-regulated in the lipogenesis of the PPAR signaling path-way in the liver of laying hen in this study. SCD, whichis regulated by a hormone, is a rate limiting enzyme ofmonounsaturated fatty acid synthesis in liver, and themRNA expression and activity of SCD-1 have beenshown to be triggered by insulin to promote fat synthe-sis [51]. FADS2, which catalyzes the initial desaturationstep to synthesize the long chain polyunsaturated fattyacid (LC-PUFAs), was found to occur mainly in the liverof laying hens [52], suggesting that FADS2 may
Fig. 5 GO enrichment analysis of SDE genes in the liver transcriptome of laying hens. Only the significantly enriched (P ≤ 0.05) biological process,cellular component, and molecular function categories are shown
Li et al. BMC Genomics (2015) 16:763 Page 8 of 13
contribute to yolk formation. In the liver of severe nega-tive energy balance cows, the down-regulation of FADS2was shown to suppress the synthesis of LC-PUFAs, ara-chidonic acid, and eicosapentaenoic acid [53]. Taken to-gether, these results indicated that the RNA-Seq datagenerated by this study was sufficiently representative ofthe chicken liver transcriptome.VLDL assembly occurs in the endoplasmic reticulum
of hepatic cells. To assemble a lipoprotein particle thatis competent for transport through the secretory path-way, ApoB has to interact with triglycerides, cholesterylesters, free cholesterol, and phospholipids. This is ahighly regulated process that requires the activity ofMTTP [54, 55]. It was reported that chicken MTTP con-tained functionally important domains that are com-monly found in the large lipid transport protein family[56]. However, another study showed that MTTP didnot respond to the increase of VLDL induced by estro-gen either in vivo or in vitro [29]. In this study, MTTPwas not significantly differentially expressed in the liverof laying hens compared to juvenile hens. This study isconsistent with a previous finding in the coordinatedup-regulation of protein components, such as ApoB (8-fold change) and ApoVLDL-II (320-fold change), alongwith the up-regulation of lipid synthesis led to increasedproduction of VLDL during an egg-laying cycle in avian[57, 58]. The female-specific yolk precursor proteinsVTG1 and VTG2, which are synthesized in the liver anddepend on estrogen stimulation [59], were found to beabundantly expressed in the liver of laying hens, and theexpression of VTG2 was the main subtype [60]. Estrogenworks via the estrogen receptors (ERα and ERβ) and
GPR30 that regulate the transcription of target genes,which contain estrogen response elements. Previous re-search has suggested that in vitro, ERα rather than ERβand GPR30 could mediate estrogen’s effects on stimulat-ing vitellogenin and ApoVLDL production, while in vivo,ERβ was up-regulated in liver of laying hen in compari-son to pullet [17]. Our finding is consistent with previ-ous report that the expression of ERβ but not ERα wassignificantly up-regulated in vivo. Since so many genesare directly or indirectly involved in the complex physio-logical process in liver during egg-laying stage, it is hardto believe that estrogen mediates these genes only viaERβ. Therefore, these results may still need to be furthervalidated in future studies.FABPs have been reported to have multiple biological
functions, including roles in hepatic fatty acid oxidation[61, 62], intracellular fatty acid transport [63], storage,and export, as well as in cholesterol and phospholipidmetabolism [64–66]. In this study, FABP1 and FABP3were both significantly up-regulated in the liver of layinghens compared with juvenile hens, which suggests thatthey may promote lipid metabolism in the PPAR signal-ing pathway to meet the requirements of laying eggs.Acyl-CoA binding protein (ACBP, also known as DBI)was reported to act as an endogenous modulator toregulate the levels of gonadal hormones in vivo [67]. Thetranscriptional factor sterol regulatory element bindingprotein (SREBP-1) and fatty acid synthase (FASN) geneswere both found to be elevated coordinately in layingchicken liver that could synthesize fatty acids de novo[68], which was consistent with a previous report [69].Peroxisomal proliferator-activated receptor α (PPARα, a
Table 4 KEGG pathways associated with SDE genes between liver samples from juvenile and laying hens
Pathway code Term Genes P-value
gga00100 Steroid biosynthesis SOAT1, CYP51A1, DHCR7, LSS, HSD17B7, SC4MOL, NSDHL,DHCR24, FDFT1
5.61E-07
gga03320 PPAR signaling pathway SCD, PPARG, FADS2, DBI, APOA1, ACSL1, CYP7A1, FABP3,FABP1, FABP5, ACSL5, ACAA1, ANGPTL4
7.21E-04
gga00330 Arginine and proline metabolism ALDH7A1, ASL2, P4HA2, GATM, ASS1, GLUD1, MAOB, GAMT,AGMAT, PRODH
0.00128
gga01040 Biosynthesis of unsaturated fatty acids PECR, SCD, FADS1, ELOVL2, FADS2, ELOVL6, ACAA1 0.00144
gga00260 Glycine, serine and threonine metabolism GATM, BHMT, MAOB, GCAT, GAMT, PSAT1, GLDC 0.01192
gga00564 Glycerophospholipid metabolism GPD2, GPD1, PLA2G4A, DGKQ, PLA2G12A, GNPAT, ETNK2,PISD, GPAM, AGPAT2
0.02019
gga00620 Pyruvate metabolism ME1, LDHB, ALDH7A1, AKR1B1, PDHA1, ACSS2, PDHX 0.03314
gga00250 Alanine, aspartate and glutamate metabolism ASL2, ASS1, GLUD1, ABAT, GPT2, PPAT 0.03791
gga00380 Tryptophan metabolism KYNU, ALDH7A1, CYP1A1, MAOB, ACMSD, HAAO, AFMID 0.03816
gga00630 Glyoxylate and dicarboxylate metabolism HAO1, PGP, ACO1, AFMID 0.05155
gga00512 O-Glycan biosynthesis GALNT2, GALNT1, GALNT6, WBSCR17, GALNTL1, ST6GALNAC1 0.05928
gga00280 Valine, leucine and isoleucine degradation BCAT1, ALDH6A1, ALDH7A1, BCKDHB, ABAT, HIBADH, ACAA1 0.06290
gga02010 ABC transporters ABCG8, ABCG5, TAP2, ABCB6, ABCA3, ABCG1 0.09651
Li et al. BMC Genomics (2015) 16:763 Page 9 of 13
transcriptional factor) controls the expression of fattyacid oxidative metabolism by modulating the expressionof peroxisomal acyl-CoA oxidase and mitochondrial car-nitine palmitoyltransferase [70], and it has been reportedto be highly expressed in rodent liver [71] and swine adi-pose tissue [72]. However, in the present study, PPARαwas suppressed in the laying hen liver, suggesting thatadipose tissue may oxidize sizeable quantities of fattyacids in avian species, and perhaps also in other mam-malian species.LPGAT1 belongs to a large group of acyltransferases
and is a member of the lysophosphatidic acid acyltrans-ferase family. LPGAT1 promotes hepatic lipogenesis inmice [21] and also may be involved in triacylglycerolsynthesis and secretion in liver [73]. However, in thisstudy we found that LPGAT1 was down-regulated in lay-ing hens liver. In addition, in a related study we showedthat down-regulated LPGAT1 was induced by estrogenboth in vivo and in vitro (data not shown). All these re-sults suggested that LPGAT1 may have different expres-sion patterns in mammals and avian related to specificfunctions in regulating fatty acid synthesis. Furthermore,LPGAT1 may have multiple subcellular localizations,and could therefore potentially have multiple functionsin different cells or within the same cells [74].In mammals, lipogenesis is known to occur in liver,
adipose tissue, and mammary gland, whereas, in avianspecies, it occurs mainly in avian liver [71]. During theegg laying stage, fat synthesis in chicken liver is espe-cially active [75]. The GO annotation cluster analyses(Additional file 5: Table S5) showed that the SDE geneswere involved mainly in lipid biosynthesis, transport andlocalization, sterol and cholesterol metabolism, as wellas in immune response and some other processes. Inpoultry, the ovary cannot synthesize lipids; therefore,liver lipoproteins are transferred in the plasma and de-posited into the oocytes to form the egg yolk in layinghens. Therefore, lipid synthesis in chicken liver and lipo-protein transfer plays a crucial role on the egg produc-tion performance of hens. Some of the SDE genes thatare not be involved in lipid metabolism may instead con-tribute to liver homeostasis in response to the dramaticincrease in lipogenesis and protein biosynthesis in theliver of hens at the laying stage.Alternative splicing of pre-mRNA plays an import-
ant role in regulating gene expression in higher eu-karyotes. A previous report indicated that 40–60 % ofhuman genes have alternative splicing isoforms, al-though some variants exist only in relatively lowabundance [76]. It has been shown that proteins withdifferent functions can be produced by a diverse arrayof mRNAs derived from a single pre-mRNA, suggest-ing that alternative splicing is a crucial mechanismfor regulating life [77]. The three alternative splicing
isoforms α, δ, and γ of the PPAR gene were detectedin our transcriptomic data, isoform γ was significantlydown-regulated in L30 compared with L20, while iso-forms α and δ were not differentially expressed. Ithas been shown that PPARα and PPARγ may play sig-nificant roles in glucose and lipid metabolism in theearly life stage of mouse [78]. Moreover, the DE novelgenes detected in this study may provide importantinformation about liver lipid metabolism in chicken.For example, a significantly up-regulated novel geneENSGALG00000014190 with four alternative splicingisoforms was observed in our transcriptome sequen-cing data. This gene was predicated to encode a pro-tein of 357 amino acids that could take part in thelipid metabolic process (UniProt: F1NXW6), whichrequires confirmation. Another up-regulated novelgene ENSGALG00000023444 with three isoforms wasalso observed, but its isoforms and function need tobe investigated further.Lipid metabolism is controlled by multiple pathways
and influenced by multiple genes. These pathways in-clude the PPAR signaling pathway, steroid biosynthesis,steroid hormone biosynthesis, and biosynthesis of unsat-urated fatty acids [79]. In our KEGG analysis, the PPARsignaling pathway, which is essential for lipid metabol-ism, showed one of the most significant associationswith the SDE genes in the livers of laying hens. EighteenDE genes involved in the PPAR pathway (Additionalfile 6: Figure S1); 11 were up-regulated and sevenwere down-regulated. In the PPAR pathway, a cyto-chrome P450 (CYP7A1) catalyzes the rate limiting stepof conversion of cholesterol into bile acids. CYP7A1 isalso involved in the KEGG Bile secretion pathway, andwas reported to be up-regulated in severe negative en-ergy balance cows [53]. The altered expression patternsof hepatic genes in the PPAR signaling pathway could playa role in regulating the lipid metabolism. In addition, atotal nine DE genes (Additional file 7: Figure S2) which allwere SDE ones were found to be involved in the steroidbiosynthesis pathway and all of them were up-regulatedexcept sterol O-acyltransferase (SOAT1, esterification tofatty acids), which suggests that this pathway was quite ac-tive in steroid hormone synthesis. SOATs (SOAT1 andSOAT2) are known to synthesize cholesterol fatty acid es-ters using fatty acids released from membrane phospho-lipids [80].During the laying stage, gene expression is highly stim-
ulated in liver to support the metabolic changes associ-ated with the development of the reproductive organs.In the present study, we identified 960 SDE genes with afold change ≥2 or ≤0.5 (FDR ≤0.05) in the livers of layinghens compared with juvenile hens. Although species-specific differences should be considered when compar-ing chicken with mammalian systems, the current
Li et al. BMC Genomics (2015) 16:763 Page 10 of 13

findings appear to be consistent with conservation oflipid metabolism and adipogenesis processes in chickenand mammal. The chicken liver transcriptome reportedhere could greatly broaden our understanding of theregulation and networks of gene expression related toliver lipid metabolism in hens at different physiologicalstages. Our results will serve as important resource forrevealing the mechanism of lipid metabolism duringegg-laying stage.
ConclusionsThis study generated transcriptomic data using RNA-Seq technology that will help to expand our understand-ing of the molecular repertoire of lipid metabolism-related genes at different physiological stages in chicken.Differences in expressed genes were found between thejuvenile and egg laying stages, including highly expressednovel genes, splice isoforms, and pathways. These find-ings will be a valuable resource for biological investiga-tions of liver lipid metabolism-related genes in chicken,and may also provide clues for understanding the mo-lecular mechanisms in other poultry and mammalianspecies.
Accession numbersThe raw sequencing data, mapped data, and data forvisualization of the RNA-Seq analyses of the chickenliver transcriptome data at different physiologicalstages have been deposited in the Gene ExpressionOmnibus (GEO) at the National Center for BiotechnologyInformation (NCBI) under accession number GSE70010.
Additional files
Additional file 1: Table S1. Primers used for qRT-PCR in this study.(DOCX 15 kb)
Additional file 2: Table S2. SDE novel hepatic genes between twodifferent physiological stages (juvenile and egg laying hens). (XLSX 29 kb)
Additional file 3: Table S3. SDE hepatic genes between two differentphysiological stages (juvenile and egg laying hens). (XLSX 110 kb)
Additional file 4: Table S4. SDE hepatic isoforms between twodifferent physiological stages (juvenile and egg laying hens). (XLSX 37 kb)
Additional file 5: Table S5. Gene ontology annotation clusters of SDEhepatic genes between juvenile and egg laying hens. (XLSX 112 kb)
Additional file 6: Figure S1. Changes in hepatic gene expression inthe PPAR signaling pathway between juvenile and laying hens. Greenboxes indicate down-regulated DE genes detected by RNA-Seq; redboxes indicate up-regulated DE genes. (TIFF 9842 kb)
Additional file 7: Figure S2. Changes in hepatic gene expression inthe steroid biosynthesis pathway between juvenile and laying hens.Green boxes indicate down-regulated DE genes detected by RNA-Seq;red boxes indicate up-regulated DE genes. (TIFF 9843 kb)
Competing interestsThe authors declare that they have no competing interests.
Authors’ contributionsHL performed the data analysis and drafted the manuscript. TW contributedto the bioinformatics analysis of the sequencing data, and performed theRNA-related experiments. CX participated in the GO analysis and designedthe primers. DW performed the pathway analysis. JR and YL participated insample collection and conducted the qRT-PCR. YT, YW, and YJ participated inthe gene function analysis. XK participated in the design of the experiment andthe discussion. XL conceived the study, participated in the experiment design,and helped to draft the manuscript. All authors read and approved the finalmanuscript.
Authors’ informationNot applicable.
Availability of data and materialsNot applicable.
AcknowledgmentsThis research was supported by the Earmarked Fund for Modern Agro-Industry Technology Research System (no. CARS-41-K04), the Program forInnovation Research Team of Ministry of Education (IRT1236), and theInternational Cooperation Project of Henan, China (144300510044).
Author details1College of Animal Science and Veterinary Medicine, Henan AgriculturalUniversity, Zhengzhou 450002, China. 2Henan Innovative EngineeringResearch Center of Poultry Germplasm Resource, Zhengzhou 450002, China.3International Joint Research Laboratory for Poultry Breeding of Henan,Henan Agricultural University, Zhengzhou 450002, China. 4Institute of AnimalHusbandry and Veterinary Medicine, Henan Academy of AgriculturalSciences, Zhengzhou 450002, China.
Received: 27 May 2015 Accepted: 21 September 2015
References1. O’hea E, Leveille G. Lipogenesis in isolated adipose tissue of the domestic
chick (Gallus domesticus). Comp Biochem Physiol. 1968;26(1):111–20.2. Leveille GA, O’Hea EK, Chakrabarty K. In vivo lipogenesis in the domestic
chicken. Exp Biol Med. 1968;128(2):398–401.3. Wang X, Yang L, Wang H, Shao F, Yu J, Jiang H, et al. Growth Hormone-
Regulated mRNAs and miRNAs in Chicken Hepatocytes. PLoS One.2014;9(11):e112896.
4. Wiskocil R, Bensky P, Dower W, Goldberger RF, Gordon JI, Deeley RG.Coordinate regulation of two estrogen-dependent genes in avian liver.Proc Natl Acad Sci U S A. 1980;77(8):4474–8.
5. Walzem RL, Hansen RJ, Williams DL, Hamilton RL. Estrogen induction ofVLDLy assembly in egg-laying hens. J Nutr. 1999;129(2S Suppl):467S–72S.
6. Brady L, Romsos DR, Leveille GA. In vivo estimation of fatty acid synthesis inthe chicken (Gallus domesticus) utilizing 3H2O. Comp Biochem Physiol B.1976;54(3):403–7.
7. Nikolay B, Plieschnig JA, Subik D, Schneider JD, Schneider WJ, Hermann M. Anovel estrogen-regulated avian apolipoprotein. Biochimie. 2013;95(12):2445–53.
8. Schneider WJ. Yolk precursor transport in the laying hen. Curr Opin Lipidol.1995;6(2):92–6.
9. Bujo H, Hermann M, Lindstedt KA, Nimpf J, Schneider WJ. Low densitylipoprotein receptor gene family members mediate yolk deposition. J Nutr.1997;127 Suppl 5:801S–4S.
10. Schneider WJ. Low density lipoprotein receptor relatives in chickenovarian follicle and oocyte development. Cytogenet Genome Res.2007;117(1–4):248–55.
11. Schneider WJ. Receptor-mediated mechanisms in ovarian follicle andoocyte development. Gen Comp Endocrinol. 2009;163(1–2):18–23.
12. Kumar V, Chambon P. The estrogen receptor binds tightly to its responsiveelement as a ligand-induced homodimer. Cell. 1988;55(1):145–56.
13. Paech K, Webb P, Kuiper GG, Nilsson S, Gustafsson J, Kushner PJ, et al.Differential ligand activation of estrogen receptors ERalpha and ERbeta atAP1 sites. Science. 1997;277(5331):1508–10.
14. Pache JC, Burton DW, Deftos LJ, Hastings RH. A carboxyl leucine-rich regionof parathyroid hormone-related protein is critical for nuclear export.Endocrinology. 2006;147(2):990–8.
Li et al. BMC Genomics (2015) 16:763 Page 11 of 13
15. Menuet A, Anglade I, Flouriot G, Pakdel F, Kah O. Tissue-specific expressionof two structurally different estrogen receptor alpha isoforms along thefemale reproductive axis of an oviparous species, the rainbow trout.Biol Reprod. 2001;65(5):1548–57.
16. Leanos-Castaneda O, Van Der Kraak G. Functional characterization of estrogenreceptor subtypes, ERalpha and ERbeta, mediating vitellogenin production inthe liver of rainbow trout. Toxicol Appl Pharmacol. 2007;224(2):116–25.
17. Li J, Leghari IH, He B, Zeng W, Mi Y, Zhang C. Estrogen stimulatesexpression of chicken hepatic vitellogenin II and very low-densityapolipoprotein II through ER-alpha. Theriogenology. 2014;82(3):517–24.
18. Kirchgessner TG, Heinzmann C, Svenson KL, Gordon DA, Nicosia M,Lebherz HG, et al. Regulation of chicken apolipoprotein B: cloning, tissuedistribution, and estrogen induction of mRNA. Gene. 1987;59(2–3):241–51.
19. Hermier D, Catheline D, Legrand P. Relationship between hepatic fatty aciddesaturation and lipid secretion in the estrogenized chicken. Comp BiochemPhysiol A Physiol. 1996;115(3):259–64.
20. Mason TM. The role of factors that regulate the synthesis and secretion ofvery-low-density lipoprotein by hepatocytes. Crit Rev Clin Lab Sci.1998;35(6):461–87.
21. Soh J, Iqbal J, Queiroz J, Fernandez-Hernando C, Hussain MM. MicroRNA-30creduces hyperlipidemia and atherosclerosis in mice by decreasing lipidsynthesis and lipoprotein secretion. Nat Med. 2013;19(7):892–900.
22. Dakovic N, Terezol M, Pitel F, Maillard V, Elis S, Leroux S, et al. The loss ofadipokine genes in the chicken genome and implications for insulinmetabolism. Mol Biol Evol. 2014;31(10):2637–46.
23. Riegler B, Besenboeck C, Bauer R, Nimpf J, Schneider WJ. Enzymes involvedin hepatic acylglycerol metabolism in the chicken. Biochem Biophys ResCommun. 2011;406(2):257–61.
24. Hussain MM, Rava P, Pan X, Dai K, Dougan SK, Iqbal J, et al. Microsomaltriglyceride transfer protein in plasma and cellular lipid metabolism.Curr Opin Lipidol. 2008;19(3):277–84.
25. Hussain MM, Iqbal J, Anwar K, Rava P, Dai K. Microsomal triglyceride transferprotein. a multifunctional protein. Front Biosci. 2003;8:s500–506.
26. Hussain MM, Rava P, Walsh M, Rana M, Iqbal J. Multiple functions ofmicrosomal triglyceride transfer protein. Nutr Metab (Lond). 2012;9:14.
27. Berriot-Varoqueaux N, Aggerbeck LP, Samson-Bouma M, Wetterau JR. Therole of the microsomal triglygeride transfer protein in abetalipoproteinemia.Annu Rev Nutr. 2000;20:663–97.
28. Rustaeus S, Lindberg K, Stillemark P, Claesson C, Asp L, Larsson T, et al.Assembly of very low density lipoprotein: a two-step process ofapolipoprotein B core lipidation. J Nutr. 1999;129(Suppl 2S):463S–6S.
29. Ivessa NE, Rehberg E, Kienzle B, Seif F, Hermann R, Hermann M, et al.Molecular cloning, expression, and hormonal regulation of the chickenmicrosomal triglyceride transfer protein. Gene. 2013;523(1):1–9.
30. Wang Z, Gerstein M, Snyder M. RNA-Seq: a revolutionary tool fortranscriptomics. Nat Rev Genet. 2009;10(1):57–63.
31. Trapnell C, Roberts A, Goff L, Pertea G, Kim D, Kelley DR, et al. Differentialgene and transcript expression analysis of RNA-seq experiments withTopHat and Cufflinks. Nat Protoc. 2012;7(3):562–78.
32. FASTX-Toolkit T: http://hannonlab.cshl.edu/fastx_toolkit/index.html.Accessed 26 Jun 2015.
33. Ensemble Galgal4:ftp://ftp.ensembl.org/pub/release-75/fasta/gallus_gallus/dna/Gallus_gallus.Galgal4.75.dna.toplevel.fa.gz. Accessed 26 Jun 2015.
34. Kim D, Pertea G, Trapnell C, Pimentel H, Kelley R, Salzberg SL. TopHat2:accurate alignment of transcriptomes in the presence of insertions,deletions and gene fusions. Genome Biol. 2013;14(4):R36.
35. Kong L, Zhang Y, Ye ZQ, Liu XQ, Zhao SQ, Wei L, et al. CPC: assess theprotein-coding potential of transcripts using sequence features and supportvector machine. Nucleic Acids Res. 2007;35(Web Server issue):W345–349.
36. Foissac S, Sammeth M. ASTALAVISTA: dynamic and flexible analysis ofalternative splicing events in custom gene datasets. Nucleic Acids Res.2007;35(Web Server issue):W297–299.
37. Sammeth M. Complete alternative splicing events are bubbles in splicinggraphs. J Comput Biol. 2009;16(8):1117–40.
38. Anders S, Pyl PT, Huber W. HTSeq—a Python framework to work withhigh-throughput sequencing data. Bioinformatics. 2015;31(2):166–9.
39. Chen C, Deng B, Qiao M, Zheng R, Chai J, Ding Y, et al. Solexa sequencingidentification of conserved and novel microRNAs in backfat of Large Whiteand Chinese Meishan pigs. PLoS One. 2012;7(2):e31426.
40. Rchlik W. OLIGO 7 Primer Analysis Software. Methods Mol Biol.2007;402:35–60.
41. Schmittgen TD, Livak KJ. Analyzing real-time PCR data by the comparativeCT method. Nat Protoc. 2008;3(6):1101–8.
42. Gentleman RR. In: Team RDC, editor. A language and environment for statisticalcomputing. Vienna, Austria: R Foundation for Statistical Computing; 2008.
43. Dennis Jr G, Sherman BT, Hosack DA, Yang J, Gao W, Lane HC, et al.DAVID: database for annotation, visualization, and integrated discovery.Genome Biol. 2003;4(5):3.
44. Huang DW, Sherman BT, Lempicki RA. Bioinformatics enrichment tools:paths toward the comprehensive functional analysis of large gene lists.Nucleic Acids Res. 2009;37(1):1–13.
45. Chen R, Zhang F, Song L, Shu Y, Lin Y, Dong L, et al. Transcriptome profilingreveals that the SM22α-regulated molecular pathways contribute to vascularpathology. J Mol Cell Cardiol. 2014;72:263–72.
46. Han W, Zou J, Wang K, Su Y, Zhu Y, Song C, et al. High-ThroughputSequencing Reveals Hypothalamic MicroRNAs as Novel Partners Involved inTiming the Rapid Development of Chicken (Gallus gallus) Gonads. PLoS One.2015;10(6):e0129738.
47. Kang X, Liu G, Liu Y, Xu Q, Zhang M, Fang M. Transcriptome profile atdifferent physiological stages reveals potential mode for curly fleece inChinese tan sheep. PLoS One. 2013;8(8):e71763.
48. Lander ES, Linton LM, Birren B, Nusbaum C, Zody MC, Baldwin J, et al.Initial sequencing and analysis of the human genome. Nature.2001;409(6822):860–921.
49. Johnson JM, Castle J, Garrett-Engele P, Kan Z, Loerch PM, Armour CD, et al.Genome-wide survey of human alternative pre-mRNA splicing with exonjunction microarrays. Science. 2003;302(5653):2141–4.
50. Wang ET, Sandberg R, Luo S, Khrebtukova I, Zhang L, Mayr C, et al.Alternative isoform regulation in human tissue transcriptomes. Nature.2008;456(7221):470–6.
51. Lefevre P, Diot C, Legrand P, Douaire M. Hormonal regulation ofstearoyl coenzyme-A desaturase 1 activity and gene expression inprimary cultures of chicken hepatocytes. Arch Biochem Biophys.1999;368(2):329–37.
52. Jacobi SK, Lin X, Corl BA, Hess HA, Harrell RJ, Odle J. Dietaryarachidonate differentially alters desaturase-elongase pathway fluxand gene expression in liver and intestine of suckling pigs. J Nutr.2011;141(4):548–53.
53. McCabe M, Waters S, Morris D, Kenny D, Lynn D, Creevey C. RNA-seqanalysis of differential gene expression in liver from lactating dairy cowsdivergent in negative energy balance. BMC Genomics. 2012;13(1):193.
54. Gordon DA, Jamil H. Progress towards understanding the role ofmicrosomal triglyceride transfer protein in apolipoprotein-B lipoproteinassembly. Biochim Biophys Acta. 2000;1486(1):72–83.
55. Gordon DA, Wetterau JR, Gregg RE. Microsomal triglyceride transfer protein:a protein complex required for the assembly of lipoprotein particles.Trends Cell Biol. 1995;5(8):317–21.
56. Rava P, Hussain MM. Acquisition of triacylglycerol transfer activity bymicrosomal triglyceride transfer protein during evolution. Biochemistry.2007;46(43):12263–74.
57. Capony F, Williams DL. Apolipoprotein B of avian very low density lipoprotein:characteristics of its regulation in nonstimulated and estrogen-stimulatedrooster. Biochemistry. 1980;19(10):2219–26.
58. Chan L, Jackson R, O’malley B, Means A. Synthesis of very low densitylipoproteins in the cockerel. Effects of estrogen. J Clin Invest.1976;58(2):368–79.
59. Deeley RG, Gordon JI, Burns AT, Mullinix KP, Binastein M, Goldberger RF.Primary activation of the vitellogenin gene in the rooster. J Biol Chem.1977;252(22):8310–9.
60. Evans MI, Silva R, Burch J. Isolation of chicken vitellogenin I and III cDNAsand the developmental regulation of five estrogen-responsive genes in theembryonic liver. Genes Dev. 1988;2(1):116–24.
61. Veerkamp J. Fatty acid-binding protein and its relation to fatty acidoxidation. Mol Cell Biol. 1993;123:101–6.
62. Kaikaus RM, Sui Z, Lysenko N, Wu NY, de Montellano PO, Ockner R, et al.Regulation of pathways of extramitochondrial fatty acid oxidation and liverfatty acid-binding protein by long-chain monocarboxylic fatty acids inhepatocytes. Effect of inhibition of carnitine palmitoyltransferase I. J BiolChem. 1993;268(36):26866–71.
63. Woodford J, Behnke W, Schroeder F. Liver fatty acid binding proteinenhances sterol transfer by membrane interaction. Mol Cell Biochem.1995;152(1):51–62.
Li et al. BMC Genomics (2015) 16:763 Page 12 of 13

64. Jefferson J, Powell D, Rymaszewski Z, Kukowska-Latallo J, Lowe J,Schroeder F. Altered membrane structure in transfected mouse L-cellfibroblasts expressing rat liver fatty acid-binding protein. J Biol Chem.1990;265(19):11062–8.
65. Martin GG, Danneberg H, Kumar LS, Atshaves BP, Erol E, Bader M, et al.Decreased liver fatty acid binding capacity and altered liver lipid distributionin mice lacking the liver fatty acid-binding protein gene. J Biol Chem.2003;278(24):21429–38.
66. Atshaves BP, McIntosh AM, Lyuksyutova OI, Zipfel W, Webb WW,Schroeder F. Liver fatty acid-binding protein gene ablation inhibitsbranched-chain fatty acid metabolism in cultured primary hepatocytes.J Biol Chem. 2004;279(30):30954–65.
67. Dong E, Matsumoto K, Watanabe H. Diazepam binding inhibitor (DBI) reducestestosterone and estradiol levels in vivo. Life Sci. 2002;70(11):1317–23.
68. Gondret F, Ferré P, Dugail I. ADD-1/SREBP-1 is a major determinant of tissuedifferential lipogenic capacity in mammalian and avian species. J Lipid Res.2001;42(1):106–13.
69. Hillgartner FB, Salati LM, Goodridge AG. Physiological and molecularmechanisms involved in nutritional regulation of fatty acid synthesis.Physiol Rev. 1995;75(1):47–76.
70. Ferré P. The biology of peroxisome proliferator-activated receptorsrelationship with lipid metabolism and insulin sensitivity. Diabetes. 2004;53suppl 1:S43–50.
71. Bergen WG, Mersmann HJ. Comparative aspects of lipid metabolism:impact on contemporary research and use of animal models. J Nutr.2005;135(11):2499–502.
72. Ding S, Schinckel A, Weber T, Mersmann H. Expression of porcinetranscription factors and genes related to fatty acid metabolism in differenttissues and genetic populations. J Anim Sci. 2000;78(8):2127–34.
73. Hiramine Y, Emoto H, Takasuga S, Hiramatsu R. Novel acyl-coenzyme A:monoacylglycerol acyltransferase plays an important role in hepatictriacylglycerol secretion. J Lipid Res. 2010;51(6):1424–31.
74. Traurig MT, Orczewska JI, Ortiz DJ, Bian L, Marinelarena AM, Kobes S, et al.Evidence for a role of LPGAT1 in influencing BMI and percent body fat inNative Americans. Obesity. 2013;21(1):193–202.
75. Klasing K. Nutritional modulation of resistance to infectious diseases.Poult Sci. 1998;77(8):1119–25.
76. Wang N-Y, Lai H-C, Au L-C. Methods for enrichment of a mRNA isoformwith specific alternative splicing. Anal Biochem. 2006;359(2):189–93.
77. Schwerk C, Schulze-Osthoff K. Regulation of apoptosis by alternative pre-mRNAsplicing. Mol Cell. 2005;19(1):1–13.
78. Zheng J, Xiao X, Zhang Q, Yu M, Xu J, Wang Z. Maternal protein restrictioninduces early-onset glucose intolerance and alters hepatic genes expressionin the peroxisome proliferator-activated receptor pathway in offspring.J Diabetes Investig. 2015;6(3):269–79.
79. Fatima A, Waters S, O’Boyle P, Seoighe C, Morris DG. Alterations in hepaticmiRNA expression during negative energy balance in postpartum dairycattle. BMC Genomics. 2014;15(1):28.
80. Cases S, Novak S, Zheng Y-W, Myers HM, Lear SR, Sande E, et al. ACAT-2, asecond mammalian acyl-CoA: cholesterol acyltransferase its cloning,expression, and characterization. J Biol Chem. 1998;273(41):26755–64.
Submit your next manuscript to BioMed Centraland take full advantage of:
• Convenient online submission
• Thorough peer review
• No space constraints or color figure charges
• Immediate publication on acceptance
• Inclusion in PubMed, CAS, Scopus and Google Scholar
• Research which is freely available for redistribution
Submit your manuscript at www.biomedcentral.com/submit
Li et al. BMC Genomics (2015) 16:763 Page 13 of 13