linking the salt transcriptome with physiological ... · genes were found, whereas increases...
TRANSCRIPT
Linking the Salt Transcriptome with PhysiologicalResponses of a Salt-Resistant Populus Species as aStrategy to Identify Genes Important forStress Acclimation1[W][OA]
Monika Brinker, Mikael Brosche, Basia Vinocur, Atef Abo-Ogiala, Payam Fayyaz, Dennis Janz,Eric A. Ottow, Andreas D. Cullmann, Joachim Saborowski, Jaakko Kangasjarvi,Arie Altman, and Andrea Polle*
Busgen-Institut, Forstbotanik und Baumphysiologie (M. Brinker, A.A.-O., P.F., D.J., E.A.O., A.P.), and Busgen-Institut, Okoinformatik, Biometrie, und Waldwachstum (A.D.C., J.S.), Georg-August Universitat Gottingen,37077 Goettingen, Germany; Plant Biology, Department of Biological and Environmental Sciences, Universityof Helsinki, 00014 Helsinki, Finland (M. Brosche, J.K.); Evogene, Ltd., Rehovot 76121, Israel (B.V.); and RobertH. Smith Institute of Plant Sciences and Genetics in Agriculture, Hebrew University of Jerusalem, Rehovot76100, Israel (A.A.)
To investigate early salt acclimation mechanisms in a salt-tolerant poplar species (Populus euphratica), the kinetics ofmolecular, metabolic, and physiological changes during a 24-h salt exposure were measured. Three distinct phases of saltstress were identified by analyses of the osmotic pressure and the shoot water potential: dehydration, salt accumulation, andosmotic restoration associated with ionic stress. The duration and intensity of these phases differed between leaves androots. Transcriptome analysis using P. euphratica-specific microarrays revealed clusters of coexpressed genes in these phases,with only 3% overlapping salt-responsive genes in leaves and roots. Acclimation of cellular metabolism to high saltconcentrations involved remodeling of amino acid and protein biosynthesis and increased expression of molecularchaperones (dehydrins, osmotin). Leaves suffered initially from dehydration, which resulted in changes in transcript levelsof mitochondrial and photosynthetic genes, indicating adjustment of energy metabolism. Initially, decreases in stress-relatedgenes were found, whereas increases occurred only when leaves had restored the osmotic balance by salt accumulation.Comparative in silico analysis of the poplar stress regulon with Arabidopsis (Arabidopsis thaliana) orthologs was used as astrategy to reduce the number of candidate genes for functional analysis. Analysis of Arabidopsis knockout lines identified alipocalin-like gene (AtTIL) and a gene encoding a protein with previously unknown functions (AtSIS) to play roles in salttolerance. In conclusion, by dissecting the stress transcriptome of tolerant species, novel genes important for salt endurancecan be identified.
Excess sodium in soil is a widespread and commonstress in natural and agricultural ecosystems (FAO,2008). High salt concentrations decrease the osmoticpotential of the soil solution, thereby lowering theavailability of water to plants. Therefore, salinitycauses dehydration stress, at least in nonacclimatedplants. Furthermore, sodium competes with other
cations, thereby affecting plant nutrition and ion ho-meostasis (Zhu, 2003; Munns and Tester, 2008; Shabalaand Cuin, 2008). Since most plant species have onlyvery limited capacities to cope with excess sodium,productivity on saline soil is strongly diminished andplant growth may even become impossible. Globally,salinity is an important environmental problem, be-cause the total area of salt-affected soils, including salineand sodic soils of currently about 831 million ha, iscontinually increasing (Martinez-Beltran and Manzur,2005).
The elucidation of salt tolerance mechanisms, there-fore, is an important issue and has attracted consider-able interest in recent years (Munns, 2005; Vinocur andAltman, 2005; Yamaguchi and Blumwald, 2005; Maet al., 2006; Munns and Tester, 2008; Chen and Polle,2010). Comparative analysis of transcriptional profilesof Arabidopsis (Arabidopsis thaliana) and salt cress(Thellungiella halophila) suggested that salt-sensitiveand salt-tolerant species have a common set of saltresponses whose regulation differs (Taji et al., 2004).
1 This work was supported by the Deutsche Forschungsgemein-schaft (grant no. FOR 496, Poplar Research Group, Germany), by theEuropean communities (ESTABLISH grant no. QLK5–CT–2000–01377), by the Finnish Centre of Excellence (program 2000–2005),and by governmental scholarships to P.F. (Iran) and A.A.-O. (Egypt).
* Corresponding author; e-mail [email protected] author responsible for distribution of materials integral to the
findings presented in this article in accordance with the policydescribed in the Instructions for Authors (www.plantphysiol.org) is:Andrea Polle ([email protected]).
[W] The online version of this article contains Web-only data.[OA] Open Access articles can be viewed online without a sub-
scription.www.plantphysiol.org/cgi/doi/10.1104/pp.110.164152
Plant Physiology�, December 2010, Vol. 154, pp. 1697–1709, www.plantphysiol.org � 2010 American Society of Plant Biologists 1697 www.plantphysiol.orgon June 5, 2020 - Published by Downloaded from
Copyright © 2010 American Society of Plant Biologists. All rights reserved.
Upon sudden salt exposure, both species activatedgenes involved in ribosomal functions, photosynthesis,cell growth, osmolyte production, and transport activ-ities (Gong et al., 2005), whereas in salt-acclimatedT. halophila plants, only a few genes were differentiallyregulated (Wong et al., 2006).
An intriguing question is how trees, which have along life span and, therefore, must be able to cope withexcess salt for extended periods of time, adapt to highsalinity. Populus euphratica is a model for salt tolerancein trees (Chen and Polle, 2010). It withstands sodiumconcentrations up to 450 mM in nutrient solution(Watanabe et al., 2001). It accumulates high sodiumconcentrations in leaves, which develop succulenceafter long-term exposure (Ottow et al., 2005). In apreceding study, a small microarray with 315 cDNAsof transcripts obtained by suppression subtractivehybridization from P. euphratica was used to analyzesalt responses, but clear tissues-specific patterns werenot found (Gu et al., 2004). Brosche et al. (2005)constructed P. euphratica EST-based microarrays con-taining 7,342 different ESTs corresponding to about6,300 different genes. The ESTs were captured from 17different cDNA libraries of different tissues (roots,leaves, stems) from stress-exposed trees (drought, salt,flooding, cold, ozone). Using microarrays with thiscollection of stress-responsive genes, Brosche et al.(2005) found that leaves of mature desert-grown P.euphratica trees acclimated to high salinity show only afew differentially expressed genes compared with tap-watered control trees. Salt-acclimated Euphrat poplarsshow less gene regulation than salt-sensitive poplarspecies (Ding et al., 2010), probably because trans-porters important to control excessive salt accumula-tion and the flavonoid/phenylpropanoid pathway,which may counteract negative salt effects by control-ling reactive oxygen species, are constitutively up-regulated in the tolerant poplar species (Janz et al.,2010). However, it is still unclear which early molec-ular responses are required to adjust the metabolism tolife at a new level of osmotic balance and ionic stress.
To obtain insights into the initial events taking placein response to exposure to high salinity in a salt-tolerant tree species, we exposed P. euphratica to saltstress and followed early changes in gene expression,metabolic profiles, and physiological responses to Na+
accumulation and changes in plant water relations.The kinetics of salt accumulation and osmotic adjust-ment differed between roots and leaves displaying aphase of initial dehydration stress, followed by os-motic adjustment and finally a new level of “high-salinity” homeostasis. These different stages wereassociated with distinct clusters of coexpressed genes.Comparative in silico analysis with Arabidopsis or-thologs was used as a strategy to reduce the number ofcandidate genes for functional analysis. Using Arabi-dopsis knockout lines, a lipocalin-like gene (AtTIL)and a gene encoding a protein with previously un-known functions (AtSIS) were shown to play roles insalt tolerance.
RESULTS
The Kinetics of Sodium Accumulation and Recovery ofWater Potential Show Distinct Phases in Roots and
Leaves of P. euphratica
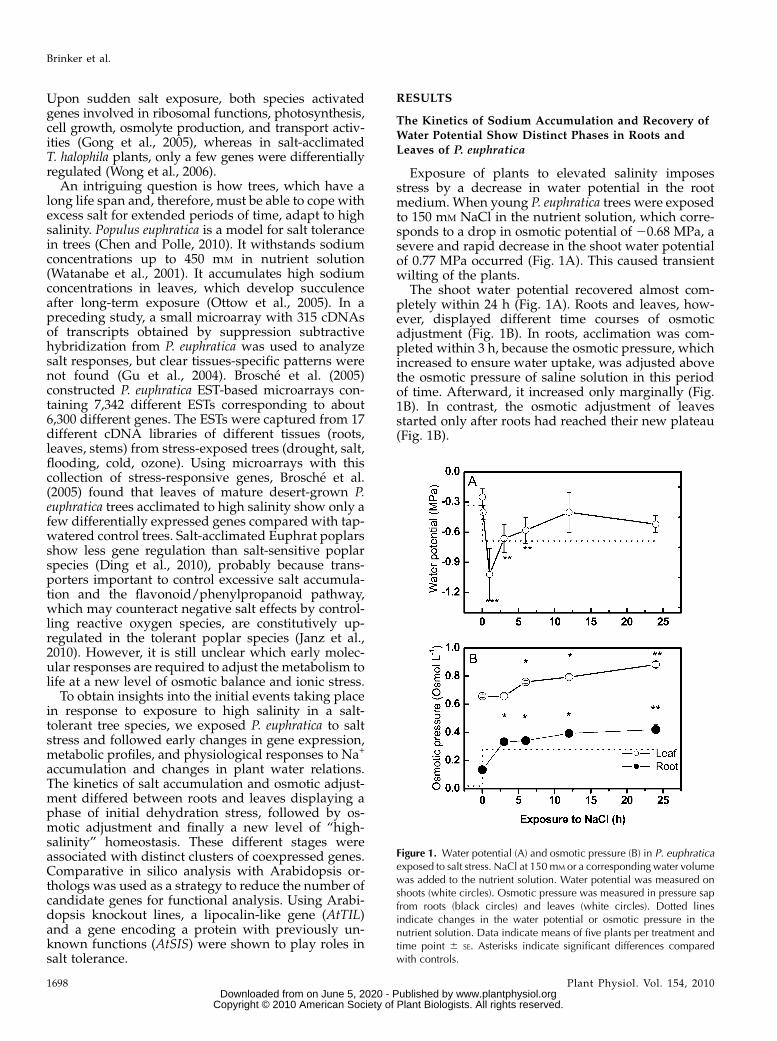
Exposure of plants to elevated salinity imposesstress by a decrease in water potential in the rootmedium. When young P. euphratica trees were exposedto 150 mM NaCl in the nutrient solution, which corre-sponds to a drop in osmotic potential of 20.68 MPa, asevere and rapid decrease in the shoot water potentialof 0.77 MPa occurred (Fig. 1A). This caused transientwilting of the plants.
The shoot water potential recovered almost com-pletely within 24 h (Fig. 1A). Roots and leaves, how-ever, displayed different time courses of osmoticadjustment (Fig. 1B). In roots, acclimation was com-pleted within 3 h, because the osmotic pressure, whichincreased to ensure water uptake, was adjusted abovethe osmotic pressure of saline solution in this periodof time. Afterward, it increased only marginally (Fig.1B). In contrast, the osmotic adjustment of leavesstarted only after roots had reached their new plateau(Fig. 1B).
Figure 1. Water potential (A) and osmotic pressure (B) in P. euphraticaexposed to salt stress. NaCl at 150mM or a corresponding water volumewas added to the nutrient solution. Water potential was measured onshoots (white circles). Osmotic pressure was measured in pressure sapfrom roots (black circles) and leaves (white circles). Dotted linesindicate changes in the water potential or osmotic pressure in thenutrient solution. Data indicate means of five plants per treatment andtime point 6 SE. Asterisks indicate significant differences comparedwith controls.
Brinker et al.
1698 Plant Physiol. Vol. 154, 2010 www.plantphysiol.orgon June 5, 2020 - Published by Downloaded from
Copyright © 2010 American Society of Plant Biologists. All rights reserved.

Since changes in osmotic potential are the result ofchanges in solute concentrations in plant tissues, wedetermined profiles of nutrient elements and organicmetabolites. In roots, salt exposure caused 28-foldincreases in Na+ concentrations within 12 h and si-multaneously about 2-fold decreases in major cations(Ca2+, K+, and Mg2+; Fig. 2, A and B). Afterward,elevated Na+ and decreased cation levels were main-tained in roots (Fig. 2, A and B). In leaves, an about 30-fold increase in Na+ was also observed; however,accumulation started with a delay of about 6 h com-pared with roots and reached levels similar to those ofroots after 24 h of sodium exposure (Fig. 2A), whereasthe major cations in leaves remained unaffected (Fig.2B). Other nutrient elements, such as phosphorus (P)and sulfur (S), were neither influenced in roots nor inleaves of salt-stressed poplar [means across all timepoints and controls and salt-exposed plants: P(roots) =6.50 6 0.27 mg g21 dry weight, S(roots) = 4.45 6 0.06 mgg21 dry weight, P(leaves) = 7.12 6 0.10 mg g21 dryweight, S(leaves) = 7.97 6 0.05 mg g21 dry weight].Differences between sodium uptake by roots and
leaves affected the overall pattern of cation accumu-lation, leading to earlier but less pronounced increasesin total cation concentrations in roots compared withleaves (Fig. 2C). The changes in water contents weresmall,23.2% and21.2% in leaves (control, 85.4%) androots (control, 94.9%), respectively.Metabolite profiling was conducted for soluble car-
bohydrates, sugar alcohols, organic acids, and aminoacids in leaves and did not show significant changesfor most compounds analyzed (Supplemental TableS1). Exceptions were Asn, whose levels were de-creased after 12 h, and Val and Ile, which showedsignificant increases after 24 h of salt exposure (Fig. 3).However, the estimated concentrations of Val and Ileof 7.4 and 3.3 mg g21 dry weight contributed only0.03% and 0.01%, respectively, to the osmotic potentialimposed by sodium. Thus, the changes of these aminoacids were too low to affect the total osmotic potentialof leaves significantly. Other compounds such as Thrand citric acid showed only transient changes after 12and 3 h, respectively. Overall, osmotic recovery in P.euphratica was thus mainly achieved by sodium accu-mulation.
Transcriptional Profiling Reveals Groups of
Coregulated Genes
As changes in the ion balance were completed inroots (0–12 h) before adjustment in leaves started (12–24h), we took advantage of these distinct phases to dissecttranscriptional responses related to water deficit and/or high sodium concentrations in leaves and roots,respectively. We used previously developed microar-rays containing ESTs of about 6,340 genes from P.euphratica (Brosche et al., 2005). To identify tightlystress-responsive genes, stringent settings of statisticalanalysis of microarrays (SAM; D = 0.189–0.269) wereapplied to obtain low false discovery rates (0–0.1).
Using these criteria, we identified 56 and 48 ESTs inleaves and roots, respectively, which showed signifi-cant changes of transcript levels in response to salinity(Supplemental Table S2). These numbers correspondto 0.9% and 0.8% of all ESTs present on the array.About 22% and 41% of these transcripts in leaves androots, respectively, did not show homology with genesof known functions. Only three genes (dehydrin [Dhn1protein; AJ774829], osmotin-like protein [AJ779386],Suc synthase [AJ778233, AJ778234]) responded withsignificant changes in transcript abundance in both
Figure 2. Salt-induced changes in element concentrations in leavesand roots of P. euphratica. Element concentrations of leaves (whitesymbols) or roots (black symbols) after salt treatment (150 mM) weredivided by mean concentrations of controls (S/C). A, Sodium. B,Magnesium (triangles), potassium (circles), and calcium (squares). C,Change in cation concentrations (mM). Data indicate means of 15plants6 SE. Different letters indicate significant differences at P# 0.05,with Greek letters for roots and Roman letters for leaves. Control plantscontained the following ion concentrations (mg g21 dry mass 6 SE) inroots: sodium, 1.43 6 0.37; potassium, 1.00 6 0.11; calcium, 1.03 60.07; and magnesium, 0.96 6 0.05. Control plants contained thefollowing ion concentrations (mg g21 dry mass6 SE) in leaves: sodium,0.16 6 0.01; potassium, 37.85 6 0.98; calcium, 14.4 6 0.91; andmagnesium, 5.75 6 0.32.
Linking the Poplar Salt Transcriptome with Physiology
Plant Physiol. Vol. 154, 2010 1699 www.plantphysiol.orgon June 5, 2020 - Published by Downloaded from
Copyright © 2010 American Society of Plant Biologists. All rights reserved.

roots and leaves, respectively. Therefore, the totalnumber of stress-responsive ESTs was 101, corre-sponding to 1.7% of the ESTs on the array. The totalnumber of unique salt-responsive genes was evenlower, because some of the identified transcripts (e.g.those for Rubisco activase, PsbA, and ribosomal RNA)were represented by multiple ESTs on the array (Sup-plemental Table S2).
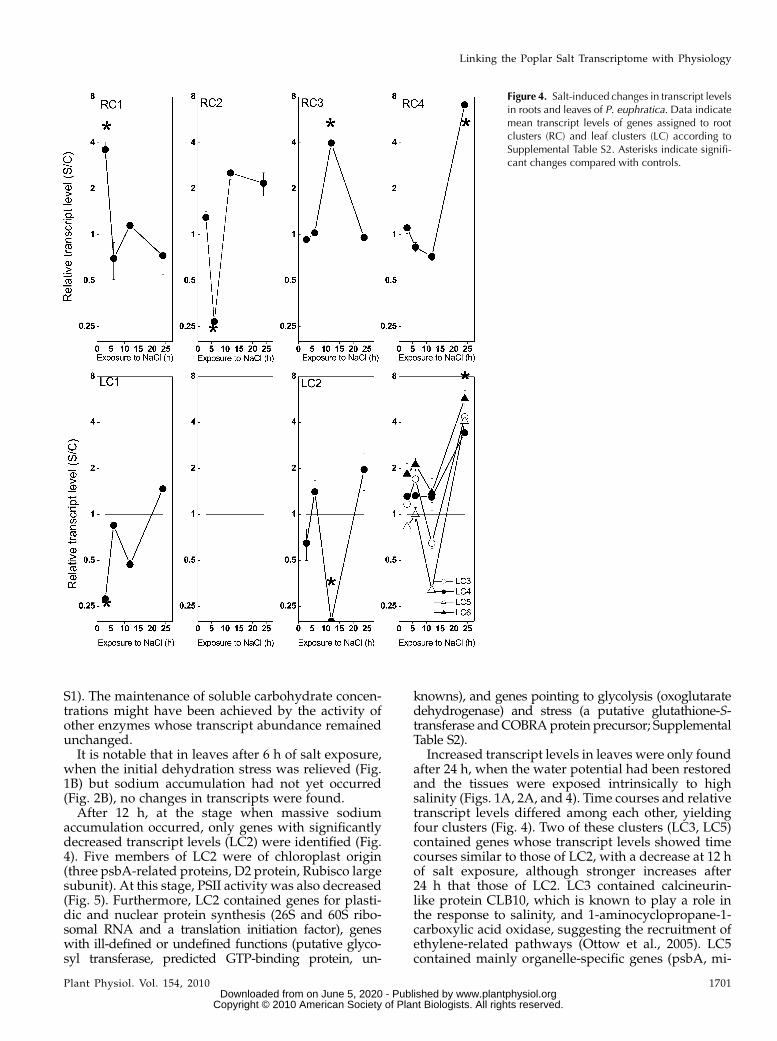
At a given time point, all responsive genes hadeither only increased or decreased expression. Forsome selected genes, the response was confirmed byquantitative real-time PCR (Supplemental Table S3).Cluster analysis based on the transcript levels acrossall time points revealed groups of coexpressed genes(Fig. 4). In roots, four clusters were obtained, one foreach time point (Fig. 4, RC1–RC4; for genes included ineach cluster, see Supplemental Table S2). In leaves, sixclusters were obtained, because transcriptional re-sponses after 24 h of salt exposure were more diversethan at other time points (Fig. 4).
Root Genes Responsive to Different Phases of Osmotic
Stress and Recovery
We exploited the different phases of salinity stress(Figs. 1 and 2) to assign genes forming transcriptionalclusters to different physiological stages: dehydrationstress, osmotic adjustment, and homeostasis associ-ated with high tissue salt concentrations.
Root cluster 1 (RC1) was associated with the initialdehydration phase. This cluster was small, containingonly two members both of the dehydrin family (Fig. 4;Supplemental Table S2).
RC2, which characterized the major phase of os-motic readjustment of roots, was formed by a group ofgenes with decreased transcript levels (Fig. 4) andcontained three putative aquaporins. Furthermore,several genes involved in protein metabolism and
genes that may play roles in stress sensing and signaltransduction (a putative Gly-rich RNA-binding pro-tein, a homolog to a metallothionein MT1a, and a Sucsynthase; Supplemental Table S2) were also found.
Genes forming RC3 were associated with a physio-logical stage in which osmotic recovery of the rootswas accomplished but in which most likely metabolicadjustment to the new ionic relationships was stillongoing (Fig. 2A). This cluster contained the highestproportion of genes with unknown functions or no hitin the databases (74%). The remaining transcriptsindicated cell wall changes (polygalacturonase-likeprotein), stress and stress signaling (a cyclophilin, aputative PR protein, and a putative Ser/Thr kinase),the involvement of glycolysis (malate dehydrogenase),and remodeling of protein metabolism (tRNA for Glnsynthase, Ser hydroxymethyltransferase, and a pro-teasome AAA-ATPase subunit; Supplemental TableS2). However, salt-induced changes in protein contentwere not found (Supplemental Fig. S2).
RC4 contained only two genes, both belonging to theosmotin family (Fig. 4; Supplemental Table S2). Thedifferent time courses of dehydrins (RC1) and osmo-tins (RC4) suggest that dehydrins are important for theprimary adaptation processes in roots, whereas osmo-tins seem to be required in the homeostatic phase tomaintain cell functions at low osmotic potentials andhigh ionic stress.
Leaf Genes Responsive to Different Phases of OsmoticStress and Recovery
In leaves, a higher number of genes (leaf cluster1 [LC1]) were responsive to the initial phase of dehy-dration stress than in roots (Supplemental Table S2).This was remarkable because at this early time point,leaves were not yet exposed to elevated sodium con-centrations (Fig. 2A) but the plants showed wilting,which recovered during the further time course ofsodium exposure. LC1 was composed of six tran-scripts representing Rubisco activase and one of a Clpprotease (heat shock protein) with putative chloroplastlocalization (Supplemental Table S2). This suggests amassive influence of the initial dehydration phase onchloroplast metabolism. To corroborate this assump-tion, we determined PSII activity by measuring chlo-rophyll fluorescence. However, at this early time point,PSII activity was not yet affected (Fig. 5), althoughphotosynthetic CO2 assimilation and stomatal conduc-tance were decreased (Wang et al., 2007). Furthermore,LC1 contained mitochondrial catalase, cytochromeP450 monooxygenase, and glyoxalate oxidase (Sup-plemental Table S2). Decreased transcript abundanceof these genes suggests compromised mitochondrialhydrogen peroxide metabolism and the formation ofmethylglyoxalates, which are generated as toxic oxi-dative side products of glycolysis. Suc synthase tran-scripts were also decreased. However, correlations oftranscriptional changes of this gene with carbohydrateconcentrations were not found (Supplemental Table
Figure 3. Salt-induced changes in amino acids in leaves of P. euphra-tica. Data indicate means 6 SE (n = 5). Asterisks indicate significantchanges compared with controls.
Brinker et al.
1700 Plant Physiol. Vol. 154, 2010 www.plantphysiol.orgon June 5, 2020 - Published by Downloaded from
Copyright © 2010 American Society of Plant Biologists. All rights reserved.
S1). The maintenance of soluble carbohydrate concen-trations might have been achieved by the activity ofother enzymes whose transcript abundance remainedunchanged.It is notable that in leaves after 6 h of salt exposure,
when the initial dehydration stress was relieved (Fig.1B) but sodium accumulation had not yet occurred(Fig. 2B), no changes in transcripts were found.After 12 h, at the stage when massive sodium
accumulation occurred, only genes with significantlydecreased transcript levels (LC2) were identified (Fig.4). Five members of LC2 were of chloroplast origin(three psbA-related proteins, D2 protein, Rubisco largesubunit). At this stage, PSII activity was also decreased(Fig. 5). Furthermore, LC2 contained genes for plasti-dic and nuclear protein synthesis (26S and 60S ribo-somal RNA and a translation initiation factor), geneswith ill-defined or undefined functions (putative glyco-syl transferase, predicted GTP-binding protein, un-
knowns), and genes pointing to glycolysis (oxoglutaratedehydrogenase) and stress (a putative glutathione-S-transferase andCOBRAprotein precursor; SupplementalTable S2).
Increased transcript levels in leaves were only foundafter 24 h, when the water potential had been restoredand the tissues were exposed intrinsically to highsalinity (Figs. 1A, 2A, and 4). Time courses and relativetranscript levels differed among each other, yieldingfour clusters (Fig. 4). Two of these clusters (LC3, LC5)contained genes whose transcript levels showed timecourses similar to those of LC2, with a decrease at 12 hof salt exposure, although stronger increases after24 h that those of LC2. LC3 contained calcineurin-like protein CLB10, which is known to play a role inthe response to salinity, and 1-aminocyclopropane-1-carboxylic acid oxidase, suggesting the recruitment ofethylene-related pathways (Ottow et al., 2005). LC5contained mainly organelle-specific genes (psbA, mi-
Figure 4. Salt-induced changes in transcript levelsin roots and leaves of P. euphratica. Data indicatemean transcript levels of genes assigned to rootclusters (RC) and leaf clusters (LC) according toSupplemental Table S2. Asterisks indicate signifi-cant changes compared with controls.
Linking the Poplar Salt Transcriptome with Physiology
Plant Physiol. Vol. 154, 2010 1701 www.plantphysiol.orgon June 5, 2020 - Published by Downloaded from
Copyright © 2010 American Society of Plant Biologists. All rights reserved.
tochondrial ATPase) and the osmotin-like protein thatalso had increased expression in roots.
In contrast to LC3 and LC5, transcript levels of genesin clusters LC4 and LC6 did not change during theinitial phases of salt exposure, suggesting that thesegroups must be specific for acclimation to high cellularsolute concentrations. Relative transcript levels of LC6were higher than those of LC4, but otherwise nodifferences between these two clusters were found.LC4 was composed of a GA-responsive gene (GASA3),a dehydrin-like protein, an aldehyde dehydrogenase,a homeodomain transcription factor with homology toATHB-7, a lipocalin-like protein, two metallothioneins(MT2a, MT3), and genes with unknown functions. LC6contained genes for a putative Kunitz trypsin inhibi-tor, Asn synthase, GA-responsive protein, and a me-tallothionein MTa-like protein. Among all clusters,LC4 and LC6 were characterized by the highest abun-dance of stress-related genes and transcription factors.Since osmotic recovery was almost accomplished atthis stage (Fig. 1A), these genes must play roles in theadaptation to high salinity or in maintaining cellularmetabolism at a new level of osmotic pressure.
Identification of Novel Salt-Resistant Genes by
Comparative Analysis of Arabidopsis Orthologs ofP. euphratica Genes and Functional Characterizationof Knockout Mutants
To investigate the significance of the stress-respon-sive genes identified by transcriptional profiling in P.euphratica in a wider context, we BLASTed the poplarESTs against The Arabidopsis Information Resourcedatabase to extract Arabidopsis genes with significanthomology. For the leaf set, 39 significant matches,and for the root set, 27 significant matches with Arabi-dopsis genes were obtained (Supplemental Table S2).Some of these genes were retrieved in both tissues and
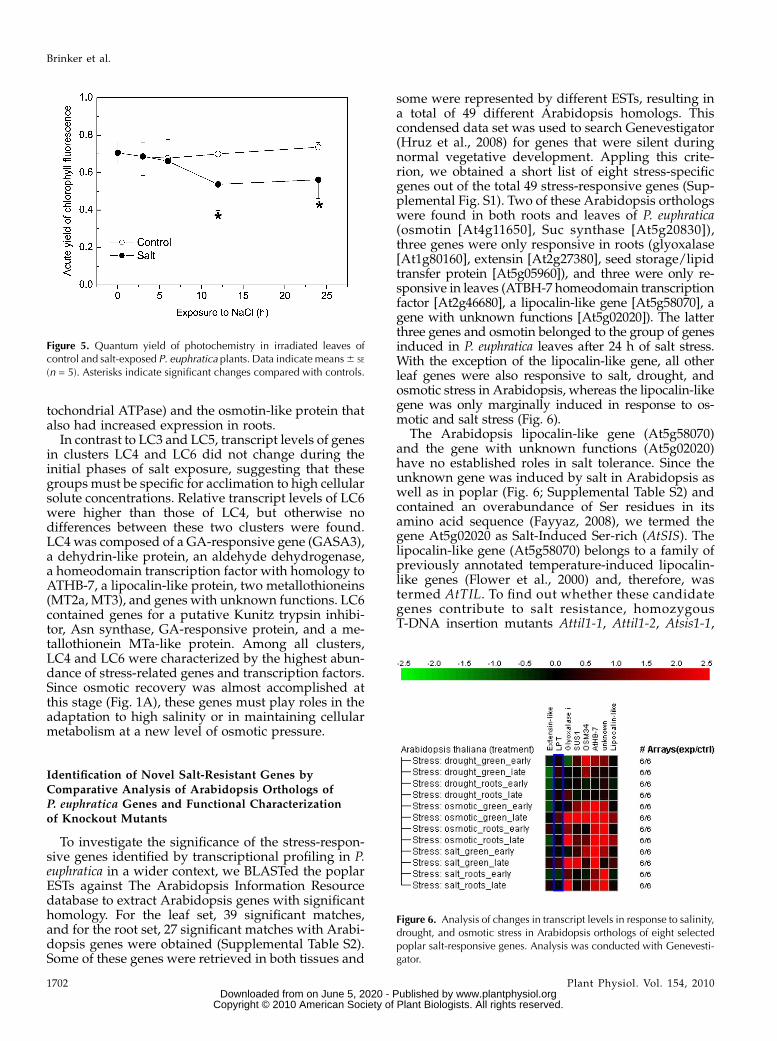
some were represented by different ESTs, resulting ina total of 49 different Arabidopsis homologs. Thiscondensed data set was used to search Genevestigator(Hruz et al., 2008) for genes that were silent duringnormal vegetative development. Appling this crite-rion, we obtained a short list of eight stress-specificgenes out of the total 49 stress-responsive genes (Sup-plemental Fig. S1). Two of these Arabidopsis orthologswere found in both roots and leaves of P. euphratica(osmotin [At4g11650], Suc synthase [At5g20830]),three genes were only responsive in roots (glyoxalase[At1g80160], extensin [At2g27380], seed storage/lipidtransfer protein [At5g05960]), and three were only re-sponsive in leaves (ATBH-7 homeodomain transcriptionfactor [At2g46680], a lipocalin-like gene [At5g58070], agene with unknown functions [At5g02020]). The latterthree genes and osmotin belonged to the group of genesinduced in P. euphratica leaves after 24 h of salt stress.With the exception of the lipocalin-like gene, all otherleaf genes were also responsive to salt, drought, andosmotic stress in Arabidopsis, whereas the lipocalin-likegene was only marginally induced in response to os-motic and salt stress (Fig. 6).
The Arabidopsis lipocalin-like gene (At5g58070)and the gene with unknown functions (At5g02020)have no established roles in salt tolerance. Since theunknown gene was induced by salt in Arabidopsis aswell as in poplar (Fig. 6; Supplemental Table S2) andcontained an overabundance of Ser residues in itsamino acid sequence (Fayyaz, 2008), we termed thegene At5g02020 as Salt-Induced Ser-rich (AtSIS). Thelipocalin-like gene (At5g58070) belongs to a family ofpreviously annotated temperature-induced lipocalin-like genes (Flower et al., 2000) and, therefore, wastermed AtTIL. To find out whether these candidategenes contribute to salt resistance, homozygousT-DNA insertion mutants Attil1-1, Attil1-2, Atsis1-1,
Figure 5. Quantum yield of photochemistry in irradiated leaves ofcontrol and salt-exposed P. euphratica plants. Data indicate means6 SE
(n = 5). Asterisks indicate significant changes compared with controls.
Figure 6. Analysis of changes in transcript levels in response to salinity,drought, and osmotic stress in Arabidopsis orthologs of eight selectedpoplar salt-responsive genes. Analysis was conducted with Genevesti-gator.
Brinker et al.
1702 Plant Physiol. Vol. 154, 2010 www.plantphysiol.orgon June 5, 2020 - Published by Downloaded from
Copyright © 2010 American Society of Plant Biologists. All rights reserved.

and Atsis1-2 were isolated and exposed to salinitystress. Growth assays in soil supplemented with in-creasing NaCl concentrations revealed a significantlyhigher sensitivity of leaf expansion of Attil1-1 andAttil1-2 to excess salt than that of the wild type (Fig. 7).Atsis1-1 and Atsis1-2 showed intermediate behavior(Fig. 7). All knockout mutants produced significantlyless biomass under salt stress than the wild type,showing that these genes play roles in salt tolerance(Fig. 7).
DISCUSSION
Different Transcriptional Timetables of Salt Responsesin Roots and Leaves Accommodate Different
Physiological Needs
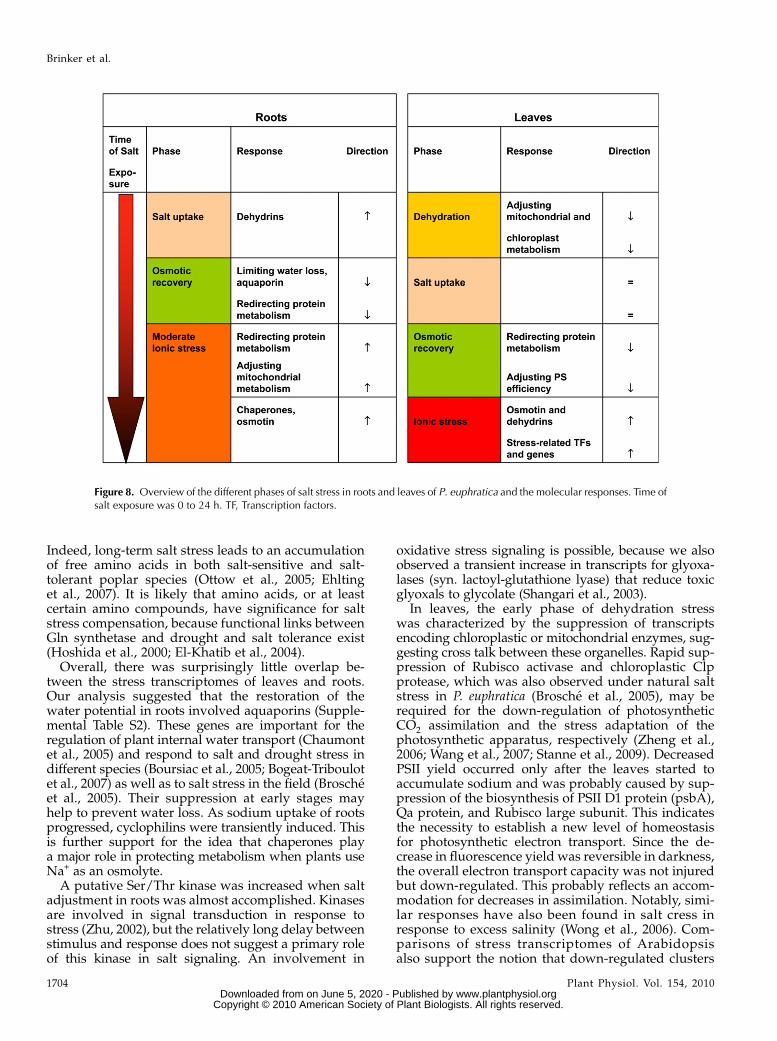
In this study, we dissected the physiological re-sponses of the salt-tolerant Euphrat poplar into dis-tinct phases and showed that these phases werecharacterized by suppression or activation of clustersof coregulated genes. The major events have beencompiled in an overview (Fig. 8). By these kineticanalyses, we gained insights into the molecular re-sponses of salt-acclimation processes associated withan initial dehydration phase in leaves, subsequent saltaccumulation, and finally restored osmotic homeosta-sis at a new level of ionic stress. The timing of adaptiveresponses differed in aboveground and belowgroundplant tissues, because transport through the stemdelays salt accumulation in leaves compared withroots. Furthermore, our study highlights importantdifferences between poplar roots and leaves regardingearly salt effects, with little overlap of the genesinvolved (three of 101). Differences between early
and late transcriptional responses as well as betweenroots and leaves have also been reported for Arabi-dopsis (Ma et al., 2006). However, in those previousstudies, the link to physiological differences in thetissues was lacking. Our study shows that ionic stressis immediately high in roots. In contrast, leaves sufferinitially from dehydration stress by water loss but notfrom shifts in the ion balance. With continued sodiumuptake, roots can avoid excessive ion accumulation bycompensatory decreases in other cations. The existingleaves must accumulate sodium on top of the cationsalready present, thereby experiencing the strongestionic stress (Fig. 2C).
Notably, only two genes, osmotins and dehydrins,were commonly induced in roots and leaves, albeitwith different time courses. This finding points tofunctional differences of chaperones in stress acclima-tion of Euphrat poplar. Dehydrins that occur immedi-ately in roots but only late in leaves have been shownto maintain a highly disordered status under highsolute concentrations where globular proteins wouldcollapse (Mouillon et al., 2006). They may also act asprotein cryoprotectants (Hara et al., 2001; Seki et al.,2002) and contribute to protection from drought stress(Rinne et al., 1999; Wang et al., 2004). The time coursesobserved here suggest a protective function of dehy-drins against ionic disorders (Mouillon et al., 2008),whereas the delayed activation of osmotins, anotherclass of well-known stress-activated genes (Shinozakiand Yamaguchi-Shinozaki, 2007), indicates that theseproteins must be involved in helping the plant to copewith life at a new level of cellular homeostasis.
Surprisingly, Suc synthase was also salt responsive inboth roots and leaves, but its transcript levels decreasedunder stress (Gu et al., 2004; Bogeat-Triboulot et al., 2007;this study). In contrast, its homolog AtSUS1 increasesunder stress (Ma et al., 2006). AtSUS1 also respondsto elevated carbohydrate concentrations (Bieniawskaet al., 2007). However, our metabolite profiling did notprovide evidence for strong redirecting of carbohydratemetabolism during salt stress. As PeSUS1was decreasedin the early stage of leaf dehydration stress, it may beresponsive to changes in cell turgor that lead to phys-iological increases in solutes.
Stress Acclimation Involves a Redirection of ProteinMetabolism in Roots and Leaves But Different
Stress Pathways
Although there was little overlap between stress-responsive genes in roots and leaves, both tissuesshowed similar patterns of regulation of pathwaysinvolved in protein and amino acid metabolism. Whentissues were exposed to an increment in sodium (6 h inroots, 12 h in leaves), decreased transcript abundanceof genes for protein biosynthesis suggested that thismetabolic path was transiently suppressed in bothroots and leaves. The recovery correlated with in-creased transcript abundance for genes involved inamino acid biosynthesis (12 h in roots, 24 h in leaves).
Figure 7. Performance of Arabidopsis T-DNA insertion lines Attil1-1,Attil1-2, Atsis1-1, and Atsis1-2 in response to salinity. Plants weregrown in soil and exposed to increasing concentrations of NaCl (25, 50,and 250 mM). Rosette leaf area and biomass were determined 20 d afterstarting salt exposure (n = 7–10; values are means6 SE). WT, Wild type.
Linking the Poplar Salt Transcriptome with Physiology
Plant Physiol. Vol. 154, 2010 1703 www.plantphysiol.orgon June 5, 2020 - Published by Downloaded from
Copyright © 2010 American Society of Plant Biologists. All rights reserved.
Indeed, long-term salt stress leads to an accumulationof free amino acids in both salt-sensitive and salt-tolerant poplar species (Ottow et al., 2005; Ehltinget al., 2007). It is likely that amino acids, or at leastcertain amino compounds, have significance for saltstress compensation, because functional links betweenGln synthetase and drought and salt tolerance exist(Hoshida et al., 2000; El-Khatib et al., 2004).
Overall, there was surprisingly little overlap be-tween the stress transcriptomes of leaves and roots.Our analysis suggested that the restoration of thewater potential in roots involved aquaporins (Supple-mental Table S2). These genes are important for theregulation of plant internal water transport (Chaumontet al., 2005) and respond to salt and drought stress indifferent species (Boursiac et al., 2005; Bogeat-Triboulotet al., 2007) as well as to salt stress in the field (Broscheet al., 2005). Their suppression at early stages mayhelp to prevent water loss. As sodium uptake of rootsprogressed, cyclophilins were transiently induced. Thisis further support for the idea that chaperones playa major role in protecting metabolism when plants useNa+ as an osmolyte.
A putative Ser/Thr kinase was increased when saltadjustment in roots was almost accomplished. Kinasesare involved in signal transduction in response tostress (Zhu, 2002), but the relatively long delay betweenstimulus and response does not suggest a primary roleof this kinase in salt signaling. An involvement in
oxidative stress signaling is possible, because we alsoobserved a transient increase in transcripts for glyoxa-lases (syn. lactoyl-glutathione lyase) that reduce toxicglyoxals to glycolate (Shangari et al., 2003).
In leaves, the early phase of dehydration stresswas characterized by the suppression of transcriptsencoding chloroplastic or mitochondrial enzymes, sug-gesting cross talk between these organelles. Rapid sup-pression of Rubisco activase and chloroplastic Clpprotease, which was also observed under natural saltstress in P. euphratica (Brosche et al., 2005), may berequired for the down-regulation of photosyntheticCO2 assimilation and the stress adaptation of thephotosynthetic apparatus, respectively (Zheng et al.,2006; Wang et al., 2007; Stanne et al., 2009). DecreasedPSII yield occurred only after the leaves started toaccumulate sodium and was probably caused by sup-pression of the biosynthesis of PSII D1 protein (psbA),Qa protein, and Rubisco large subunit. This indicatesthe necessity to establish a new level of homeostasisfor photosynthetic electron transport. Since the de-crease in fluorescence yield was reversible in darkness,the overall electron transport capacity was not injuredbut down-regulated. This probably reflects an accom-modation for decreases in assimilation. Notably, simi-lar responses have also been found in salt cress inresponse to excess salinity (Wong et al., 2006). Com-parisons of stress transcriptomes of Arabidopsisalso support the notion that down-regulated clusters
Figure 8. Overview of the different phases of salt stress in roots and leaves of P. euphratica and the molecular responses. Time ofsalt exposure was 0 to 24 h. TF, Transcription factors.
Brinker et al.
1704 Plant Physiol. Vol. 154, 2010 www.plantphysiol.orgon June 5, 2020 - Published by Downloaded from
Copyright © 2010 American Society of Plant Biologists. All rights reserved.
mainly contain genes for developmental processes andmetabolic adjustment (Ma and Bohnert, 2007).In contrast to roots, sodium accumulation activated
some of the well-known stress and signal transductionpathways in leaves, including transcripts for calcineu-rin B-like protein and 1-aminocyclopropane carboxyl-ate oxidase, pointing to the involvement of calciumand ethylene. Salt exposure generally leads to in-creased abscisic acid levels, but in Euphrat poplarmore rapidly than in salt-sensitive poplar species(Chen et al., 2001; Luo et al., 2009). Here, activationof a putative homeodomain transcription factor (ho-molog to ATHB-7) and aldehyde dehydrogenase wasobserved, which are known to be regulated by abscisicacid and to be responsive to salinity and drought(Soderman et al., 1996; Seki et al., 2002; Olsson et al.,2004; Sunkar et al., 2003; Kotchoni et al., 2006). The lateresponse of these genes, which occurred only when theleaves were exposed to a high salt level, suggests thatthey are necessary to afford tissue protection fromexcessive ion accumulation or high osmotic pressure.Notably, transcript levels of aldehyde dehydrogenase,osmotin, metallothioneins, as well as an unknowngene (AJ773239) were also salt affected under fieldconditions (Brosche et al., 2005). The late responseobserved here indicates that they are not involved inthe primary recognition and signaling of salt stress. Asmetallothioneins, GA-responsive genes, and severalgenes with unknown functions were present in thesame regulon together with well-established stress-regulated genes, they are likely candidates for medi-ating salt stress protection.
Lipocalin-Like TIL and Ser-Rich Salt-Induced SIS Are
Required for Salt Endurance
Transcriptional profiling of salt-tolerant speciesholds the promise of revealing candidate genes in-volved in stress adaptation. In our study, about 25% ofthe salt-responsive genes had unknown functions and,furthermore, about 10% had no significant hit withGenBank, suggesting that we do not yet fully under-stand the molecular events taking place to adjust themetabolism to excess salt and that P. euphratica con-tains a number of unique salt-responsive genes. By insilico analysis, we identified eight Arabidopsis ortho-logs among the salt-responsive genes of Euphrat pop-lar that were silent during most stages of vegetativeplant development, but some of them were activatedduring seed formation or germination (SupplementalFig. S1). This suggests a role of these genes in osmoticadaptation. However, not all of the eight Arabidopsisgenes showed the same responses to salt, drought, orosmotic stress as poplar genes, pointing to differencesin stress regulation. Comparative analysis of salt cressand Arabidopsis transcriptomes also supported theidea that the regulation of some key genes may bedifferent in salt-tolerant and salt-sensitive species(Gong et al., 2005; Wong et al., 2006), and our studyis strong experimental evidence for this suggestion.
In our study, differences in regulation betweenpoplar and Arabidopsis were particularly obviousfor genes encoding a putative lipocalin-like protein(TIL), a lipid transfer protein, and SUS1. We found thelipocalin-like protein particularly intriguing, becauseit was not regulated in salt-stressed or osmoticallystressed Arabidopsis (Kilian et al., 2007), whereasother members of this gene family are stress responsive,especially under low temperatures (Frenette Charronet al., 2005). Lipocalins are most likely localized in theplasmamembrane (Kawamura and Uemura, 2003), bindsmall hydrophobic ligands, act as transporters, andprotect plants from oxidative stress (Frenette Charronet al., 2002; Charron et al., 2008).We used loss-of-functionmutants of Arabidopsis to test the involvement ofTIL and SIS, a salt-regulated unknown gene in salt toler-ance. Data mining showed that SIS expression wastypically regulated by salt treatment (Kilian et al., 2007;Luo et al., 2009). We show that suppression of its ex-pression renders Arabidopsis knockout mutants moresalt susceptible. Attil mutants were also more salt sus-ceptible than the wild type, although this gene was notidentified in previous salt screens. Our results indicatethat both AtTIL and AtSIS play roles in salt tolerance,probably by increasing the protection of membranes.
CONCLUSION
In this study, we report the molecular timetable ofthe early salt transcriptome of the salt-tolerant Euphratpoplar. Molecular chaperones, especially dehydrinsand osmotin, which help the cell to keep their proteinsin an active status, appear to be key factors for copingwith elevated salinity and ionic stress. Together withSuc synthase, these two chaperones were the onlyoverlapping salt-responsive genes in roots and leaves.Adjustment of cellular metabolism involved remodel-ing of protein and amino acid biosynthesis in both rootsand leaves, albeit employing different genes. In roots,decreases in aquaporins occurred, which might havelimited water loss. In leaves, flexible down-regulationand well-orchestrated adjustment of energy metabo-lism involving mitochondrial and photosynthetic geneswere among the initial responses to salinity and not, asone might have expected, up-regulation of typical stress-related enzymes. Induction of known stress-associatedgenes occurred only at late stages in leaves, when leaveshad accumulated excessive sodium concentrations.Roots and leaves perceived physiologically differentstress situations, and accommodation obviously re-quired the activation of different stress transcriptomes.
To identify the stress-specific genes within the salttranscriptome, theArabidopsis orthologs of poplar geneswere used for in silico analyses to extract genes that weresilent during vegetative development. This strategyresulted in eight candidates (Suc synthase, osmotin, gly-oxalase, extensin, seed storage/lipid transfer protein,homeodomain transcription factor AtHB-7, a lipocalin-like gene [TIL], and a gene with unknown functions
Linking the Poplar Salt Transcriptome with Physiology
Plant Physiol. Vol. 154, 2010 1705 www.plantphysiol.orgon June 5, 2020 - Published by Downloaded from
Copyright © 2010 American Society of Plant Biologists. All rights reserved.

[SIS]), among which the lipocalin-like protein (TIL) wasunique because it did not show early responses to salt orosmotic stress in Arabidopsis and SIS was unique be-cause it was found in all salt experiments analyzed.Knockout mutants of Arabidopsis for TIL or SIS showedsalt-sensitive phenotypes. In conclusion, the stress regu-lon of the salt-tolerant Euphrat poplar contains genespreviously not known for functions in salt tolerance,such as TIL and SIS. In a wider context, these findingsimply that salt-susceptible plants harbor genes importantfor salt tolerance that cannot be identified by conven-tional salt screens relying on differential gene expressionbut by comparison of sensitive and tolerant species.
MATERIALS AND METHODS
Plant Material
Populus euphratica (clone B2 from the Ein Avdat Valley in Israel; Hebrew
University of Jerusalem) was multiplied by micropropagation (Leple et al.,
1992). Rooted plantlets were transferred to aerated hydroculture with Long
Ashton nutrient solution (Hewitt and Smith, 1975) and grown for 3.5 months
at 22�C, 150 mmol m22 s21 photosynthetically active radiation, with a photo-
period of 16 h of light. After reaching an average height of 0.83 6 0.02 m, the
medium was supplemented with 150 mM NaCl. Roots and leaves of six plants
per treatment were harvested after 0, 3, 6, 12, and 24 h of salt stress and of
nonstress treatment for controls. Plants were removed from the nutrient
solution, immersed for 10 s with the roots in distilled water, and divided into
roots and shoots. Root and leaf tissues were immediately frozen in liquid
nitrogen. During the experimental phase, light was continuously supplied to
avoid interference of light/dark transitions. The experiment was performed
three times corresponding to three biological replications.
Ecophysiological Measurements
Chlorophyll fluorescence was measured by a pulse-modulated MINI-PAM
(Walz) on adult leaves of stressed plants and controls under ambient light
(Maxwell and Johnson, 2000) and used to calculate the actual yield of
photochemistry: Flight = (Fm# 2 Fo#)/Fm#. A separate set of plants was
used to measure the fluorescence of dark-adapted leaves to determine the
maximum yield of photochemistry: Fdark = (Fm – Fo)/Fm.
Water potential was determined on 30-cm-long main shoots of plants
(measured from the apex) at the indicated time points using a Scholander
pressure chamber (Scholander et al., 1965; Cochard et al., 2001).
To determine osmotic pressure, leaves and roots that had been shock
frozen in liquid nitrogen and stored at 280�C were thawed, and pressure sap
was gained with a home-built pressing device. The sap was kept on ice and
centrifuged (5 min, 5,000g), and the osmolality (osmol kg21) of the supernatant
was determined in a Cryo-osmometer (Osmomat 030; Ganotec). To convert
differences in water potential into osmotic pressure, the following equation
was used: 1 osmol = 0.00832 3 Tabs MPa, where Tabs = 293.15 K.
Element Analysis
Plant tissues were dried at 70�C and subsequently digested by using the
nitric acid pressure system according to Heinrichs et al. (1986). Quantification
of elements was carried out by inductively coupled plasma-optical emission
spectrometry (Spectro Analytical Instruments) at l = 559 nm.
To determine cation solute concentrations, the measured concentrations of
Na+, K+, Ca2+, and Mg2+ were summed up and expressed on the basis of the
water content of the tissue (mM). The water content was determined as
follows: (fresh mass – dry mass)/dry mass (mL g21).
Analysis of Leaf Metabolites by Gas
Chromatography-Mass Spectrometry
The extraction protocol was modified from Roessner-Tunali et al. (2003).
Briefly, frozen leaf tissue powder (100 mg dry mass) was extracted in 1.4 mL of
80% (v/v) aqueous methanol in a 2.0-mL microcentrifuge tube for 2 h by
shaking (200 rpm) at ambient temperature. A total of 120 mL of ribitol (0.2 mg
mL21 water) was added as an internal standard prior to incubation. The
mixture was extracted for 15 min at 70�C. The extract was vigorously mixed
with 1,500 mL of water and subsequently centrifuged for 15 min at 4,000 rpm.
Aliquots of the methanol/water supernatant (150 mL) were dried in vacuum
overnight. The dry residue was modified for gas chromatography-mass
spectrometry analysis according to Fiehn et al. (2000). Residues after reduction
were redissolved and derivatized for 90 min at 37�C (in 60 mL of 30 mg mL21
methoxyamine hydrochloride in pyridine) followed by a 30-min treatment
with 120 mL of N-methyl-N-[trimethylsilyl]trifluoroacetamide at 37�C. A
total of 10 mL of a retention time standard mixture (0.029% [v/v] n-dodecane,
n-pentadecane, n-nonadecane, n-docosane, n-octacosane, n-dotracontane, and
n-hexatriacontane dissolved in pyridine) was added before trimethylsilyla-
tion. Sample volumes of 1 mL were then injected onto the gas chromatograph
column on a splitless mode.
The gas chromatography-mass spectrometry system was composed of a
Pal autosampler (Ophir Analytic), a TRACE GC 2000 gas chromatograph, and
a TRACE DSQ quadrupole mass spectrometer (Bargal Analytics). The mass
spectrometer was tuned according to the manufacturer’s recommendations.
Gas chromatography was performed on a 30-m Rtx_5Sil MS column with
0.25-mm film thickness (Restek). The injection temperature was set at 230�C,the interface at 250�C, and the ion source adjusted to 200�C. Helium was used
as the carrier gas at a flow rate of 1 mL min21. The analysis was performed
under the following temperature program: 5 min of isothermal heating at
70�C, followed by a 5�C min21 oven temperature ramp to 350�C, and a final
5-min heating at 330�C. The system was then temperature equilibrated for
1 min at 70�C before injection of the next sample. Mass spectra were recorded
at two scans per second with a scanning range of 50 to 600 mass-to-charge
ratio. Both chromatograms and mass spectra were evaluated using the
XCALIBUR version 1.3 program (ThermoFinnigan). A retention time and
mass spectral library for automatic peak quantification of metabolite deriv-
atives was implemented within the XCALIBUR method format. Substances
were identified by comparison with authentic standards, as described by
Roessner-Tunali et al. (2003).
Identified peak areas were normalized based on the internal standard and
dry weight and analyzed statistically with the Tukey multiple comparison
algorithm (P = 0.05) incorporated into the JMP statistical software (Statistics
and Graphics Guide: Version 3; SAS Institute).
Statistical Analyses of Physiological Data
Data are shown as means 6 SE. Six plants were analyzed per time point.
Statistical analysis (ANOVA) was performed using Statgraphics (Centurion
XV). Significant differences at P# 0.05 were obtained after ANOVA by a least
significant difference test. Asterisks in figures are as follows: * P# 0.05, ** P#
0.01, *** P # 0.001.
Microarray Analyses
RNA was isolated from P. euphratica leaves or roots using the method
described by Chang et al. (1993). RNA samples from three biological
replicates were used; each of the independent biological samples consisted
of leaves or roots from six plants. To avoid bias in the microarray evaluation
as a consequence of dye-related differences in labeling efficiency and/or
differences in recording fluorescence signals, dye labeling for each paired
sample was reversed in two individual hybridizations on microarrays
containing 7,662 different Populus ESTs, among them 6,320 ESTs from P.
euphratica. The EST libraries were constructed from different tissues and
stressed plants and used to produce microarrays on glass slides as described
by Brosche et al. (2005). A total of six hybridizations per time point were
obtained. The complete protocols for probe labeling and hybridization,
normalized data, and raw data files are available from the ArrayExpress
database (www.ebi.ac.uk/arrayexpress/) under the accessions of E-MEXP-
2095. By the use of P. euphratica arrays, problems that may arise by low
hybridization efficiencies caused by sequence divergence are avoided (Janz
et al., 2010).
Images were analyzed in GenePixPro 5.1 (Axon Instruments). Visually bad
spots or areas on the array and low-intensity spots were excluded. Low-
intensity spots were determined as spots where less than 55% of the pixels had
intensity above the background + 1 SD in either channel. Slides with hybrid-
ized microarrays were scanned sequentially for Cy3- and Cy5-labeled probes.
Brinker et al.
1706 Plant Physiol. Vol. 154, 2010 www.plantphysiol.orgon June 5, 2020 - Published by Downloaded from
Copyright © 2010 American Society of Plant Biologists. All rights reserved.
Raw expression data were normalized for sources of systematic variation
using a normalization model based on Wolfinger et al. (2001), which is a
modified version of the global ANOVA model of Kerr and Churchill (2001).
The log2-transformed raw data are represented by y and subjected to the
normalization model ygijk = m + Ti + Aj + Dk + (TA)ij + (DA)ij + «gijk, where m
represents an overall mean value, T the fixed treatment effect, A the random
array effect, D the fixed dye effect, TA the random interaction effect of arrays
and treatments,DA the random interaction effect of arrays and dyes, and « the
residual stochastic error. Normalization was carried out using SAS. For each
gene g, the empirical residuals calculated by subtraction of the fitted effects
from the observed ygijk were used as normalized data in the subsequent
significance analysis with SAM (Tusher et al., 2001). The SAM algorithm was
obtained as a Microsoft Excel Add-in from http://www-stat.stanford.edu/
~tibs/SAM/. It uses the false discovery rate and q value method presented by
Storey (2002).
SAM was used with the option “paired data,” the D value was chosen as
the false discovery rate became 0, and the limit of fold change was set to 3. The
fold changes in gene expression between the control and salt-treated samples
for each harvesting time point were estimated after normalization as the ratio
of the mean signal intensities.
Six arrays were used for each time point (except for root after 12 h, where
two technical replicates were missing) and probed with samples of the three
biological replications.
The normalization method described above led to homogenous array
means of log2-transformed raw data, and not all effects in the normalization
model could be tested because of missing degrees of freedom. Therefore, the
simpler normalization model ygijk = m + Ti + Aj +Dk + «gijkwas tested. In this
case, all effects were significant at the 5% error level, but array means were no
longer homogenous after normalization. The sets of genes recognized as
significant by the SAM algorithm for the normalization model with interac-
tions were very similar to those based on the simpler normalization model.
They differed negligibly in the number of significant genes, and they always
were subsets of each other. Therefore, we always refer to the results based on
the normalization model.
Expression Analysis by Quantitative Real-Time PCR
The transcript levels of five genes, which showed significant changes in
response to salt stress in the microarray experiments, were confirmed by
quantitative real-time PCR. RNA was isolated according to the protocol of
Chang et al. (1993). DNA was removed with DNase I (Fermentas), and first-
strand cDNA was reverse transcribed from 5 mg of RNA using reverse
transcriptase (Fermentas) according to the manufacturer’s recommendations.
Gene-specific primers were designed by using the Primer3 software (Rozen
and Skaletsky, 2000). The relative transcript abundance was detected by the
iCycler using iQ SYBR Green Supermix (Bio-Rad). The tubulin amplicon was
used as an internal control for normalization.
Analysis of Arabidopsis T-DNA Insertion Lines
Arabidopsis (Arabidopsis thaliana) lines with T-DNA insertions in the genes
At5g58070.1 (Salk_136775 = Attil1-1, SALK_150259 = Attil1-2) and At5g02020
(Salk_146631 = Atsis1-1, Salk_064028 = Atsis1-2) were obtained from the
Nottingham Arabidopsis Stock Center. Seeds of the segregating T3 generation
were sown on half-strength Murashige and Skoog medium supplemented
with 50 mg mL21 kanamycin as the selectable marker. DNA of kanamycin-
resistant plants was isolated with the DNeasy Kit (Qiagen) according to the
protocol of the manufacturer. Homozygous lines were identified by PCR
analysis using gene-specific primers (RP-TIL, LPTIL, RP-SIS, LP-SIS) and the
left border primer LBa1 (Supplemental Table S4). PCR was performed with a
5-min initial denaturation step at 94�C and 40 cycles of 30 s at 94�C, 30 s at
55�C, and 2 min at 72�C. PCR analysis revealed the T-DNA insertion into each
target gene. Using the gene-specific primers exp_RP and exp_LP did not result
in a PCR product, indicating that the selected lines Attil1-1, Attil1-2, Atsis1-1,
and Atsis2-1 were homozygous for the T-DNA insertion.
To test salt responses of soil-grown plants, Arabidopsis wild-type and
T-DNA lines were germinated for 10 d on water-agar (16 h of light at 150 mmol
m22 s21 photosynthetically active radiation, 25�C, 60% relative air humidity).
Uniform seedlings were planted into soil (T25 Feinerde; Fruhstorfer Erde)
and grown in a climatized cabinet under short-day conditions (8 h light at
115 mmol m22 s21 photosynthetically active radiation/16 h of darkness, 20�Cair temperature, 60% relative air humidity). After 10 d, the plants were
gradually exposed to NaCl (50 mM for 5 d, 100 mM for 5 d, and 200 mM
subsequently) and harvested after 10 d of exposure to 200 mM NaCl.
Supplemental Data
The following materials are available in the online version of this article.
Supplemental Figure S1. Genevestigator analyses (development, anat-
omy) of orthologs in Arabidopsis of P. euphratica salt-responsive genes in
roots and leaves, respectively.
Supplemental Figure S2. Changes in protein content in response to salt in
leaves and roots of P. euphratica.
Supplemental Table S1. Changes in metabolites in response to salt ex-
posure.
Supplemental Table S2. Genes with significantly changed transcript
abundance in salt-exposed compared with control roots of poplar.
Supplemental Table S3. Comparison of quantitative real-time PCR of
selected genes with their fold changes on the microarrays, and primers
used for quantitative real-time PCR.
Supplemental Table S4. Primers used for the analysis of Arabidopsis
T-DNA insertion mutants of TIL and SIS.
ACKNOWLEDGMENTS
C. Kettner, S. Elend, and T. Klein (Laboratory for Radioisotopes) provided
excellent technical assistance.
Received August 6, 2010; accepted October 16, 2010; published October 19,
2010.
LITERATURE CITED
Bieniawska Z, Paul Barratt DH, Garlick AP, Thole V, Kruger NJ, Martin
C, Zrenner R, Smith AM (2007) Analysis of the sucrose synthase gene
family in Arabidopsis. Plant J 49: 810–828
Bogeat-Triboulot MB, Brosche M, Renaut J, Jouve L, Le Thiec D, Fayyaz P,
Vinocur B, Witters E, Laukens K, Teichmann T, et al (2007) Gradual soil
water depletion results in reversible changes of gene expression, protein
profiles, ecophysiology, and growth performance in Populus euphratica, a
poplar growing in arid regions. Plant Physiol 143: 876–892
Boursiac Y, Chen S, Luu DT, Sorieul M, van den Dries N, Maurel C (2005)
Early effects of salinity on water transport in Arabidopsis roots: molecular
and cellular features of aquaporin expression. Plant Physiol 139: 790–805
Brosche M, Vinocur B, Alatalo ER, Lamminmaki A, Teichmann T, Ottow
EA, Djilianov D, Afif D, Bogeat-Triboulot MB, Altman A, et al (2005)
Gene expression and metabolite profiling of Populus euphratica growing
in the Negev desert. Genome Biol 6: R101
Chang S, Purear J, Cairney J (1993) A simple and efficient method for
isolating RNA from pine trees. Plant Mol Biol Rep 11: 113–116
Charron JB, Ouellet F, Houde M, Sarhan F (2008) The plant apolipoprotein
D ortholog protects Arabidopsis against oxidative stress. BMC Plant
Biol 8: 86
Chaumont F, Moshelion M, Daniels MJ (2005) Regulation of plant
aquaporin activity. Biol Cell 97: 749–764
Chen SL, Li J, Wang S, Huttermann A, Altman A (2001) Salt nutrient
uptake and transport, and ABA of Populus euphratica, a hybrid in
response to increasing soil NaCl. Trees (Berl) 15: 186–194
Chen SL, Polle A (2010) Salinity tolerance of Populus. Plant Biol (Stuttg) 12:
317–333
Cochard H, Forestier S, Ameglio T (2001) A new validation of the
Scholander pressure chamber technique based on stem diameter vari-
ations. J Exp Bot 52: 1361–1365
Ding MQ, Hou PC, Shen X, Wang MJ, Deng SR, Sun J, Xiao F, Wang RG,
Zhou XY, Lu CF, et al (2010) Salt-induced expression of genes related to
Na+/K+ and ROS homeostasis in leaves of salt-resistant and salt-sensi-
tive poplar species. Plant Mol Biol 73: 251–269
Ehlting B, Dluzniewska P, Dietrich H, Selle A, Teuber M, Hansch R,
Linking the Poplar Salt Transcriptome with Physiology
Plant Physiol. Vol. 154, 2010 1707 www.plantphysiol.orgon June 5, 2020 - Published by Downloaded from
Copyright © 2010 American Society of Plant Biologists. All rights reserved.
Nehls U, Polle A, Schnitzler JP, Rennenberg H, et al (2007) Interaction
of nitrogen nutrition and salinity in grey poplar (Populus tremula3 alba).
Plant Cell Environ 30: 796–811
El-Khatib RT, Hamerlynck EP, Gallardo F, Kirby EG (2004) Transgenic
poplar characterized by ectopic expression of a pine cytosolic glutamine
synthetase gene exhibits enhanced tolerance to water stress. Tree
Physiol 24: 729–736
FAO (2008) FAO Land and Plant Nutrition Management Service. http://
www.fao.org/ag/agl/agll/spush (October 29, 2010)
Fayyaz P (2008) Effects of salt stress on ecophysiological and molecular charac-
teristics of Populus euphratica Oliv., Populus x canescens (Aiton) Sm. and
Arabidopsis thaliana L. PhD thesis. Cuivillier Verlag, Goettingen, Germany
Fiehn O, Kopka J, Dormann P, Altmann T, Trethewey RN, Willmitzer L
(2000) Metabolite profiling for plant functional genomics. Nat Biotech-
nol 18: 1157–1161
Flower DR, North AC, Sansom CE (2000) The lipocalin protein family:
structural and sequence overview. Biochim Biophys Acta 1482: 9–24
Frenette Charron JB, Breton G, Badawi M, Sarhan F (2002) Molecular and
structural analyses of a novel temperature stress-induced lipocalin from
wheat and Arabidopsis. FEBS Lett 517: 129–132
Frenette Charron JB, Ouellet F, Pelletier M, Danyluk J, Chauve C, Sarhan
F (2005) Identification, expression, and evolutionary analyses of plant
lipocalins. Plant Physiol 139: 2017–2028
Gong QQ, Li PH, Ma SS, Indu Rupassara S, Bohnert HJ (2005) Salinity
stress adaptation competence in the extremophile Thellungiella halophila
in comparison with its relative Arabidopsis thaliana. Plant J 44: 826–839
Gu R, Fonseca S, Puskas LG, Hackler L Jr, Zvara A, Dudits D, Pais MS
(2004) Transcript identification and profiling during salt stress and
recovery of Populus euphratica. Tree Physiol 24: 265–276
Hara M, Terashima S, Fukaya T, Kuboi T (2001) Characterization and
cryoprotective activity of cold-responsive dehydrin from Citrus unshiu.
Plant Physiol 158: 1333–1339
Heinrichs H, Brumsack HJ, Loftfield N, Konig N (1986) Verbessertes
Druckaufschlussystem fur biologische und anorganische Materialien. Z
Pflanzenernaehr Bodenkd 149: 350–353
Hewitt EJ, Smith TA (1975) Plant Mineral Nutrition. English Universities
Press, London
Hoshida H, Tanaka Y, Hibino T, Hayashi Y, Tanaka A, Takabe T, Takabe T
(2000) Enhanced tolerance to salt stress in transgenic rice that over-
expresses chloroplast glutamine synthetase. Plant Mol Biol 43: 103–111
Hruz T, Laule O, Szabo G, Wessendorp F, Bleuler S, Oertle L, Widmayer P,
Gruissem W, Zimmermann P (2008) Genevestigator V3: a reference
expression database for the meta-analysis of transcriptomes. Adv
Bioinformatics 2008: 420747
Janz D, Behnke K, Schnitzler J-P, Kanawati B, Schmitt-Kopplin P, Polle A
(2010) Pathway analysis of the transcriptome and metabolome of salt
sensitive and tolerant poplar species reveals evolutionary adaption of
stress tolerance mechanisms. BMC Plant Biol 10: 150
Kawamura Y, Uemura M (2003) Mass spectrometric approach for identi-
fying putative plasma membrane proteins of Arabidopsis leaves associ-
ated with cold acclimation. Plant J 36: 141–154
Kerr MK, Churchill GA (2001) Statistical design and the analysis of gene
expression microarray data. Genet Res 77: 123–128
Kilian J, Whitehead D, Horak J, Wanke D, Weinl S, Batistic O, D’Angelo
C, Bornberg-Bauer E, Kudla J, Harter K (2007) The AtGenExpress
global stress expression data set: protocols, evaluation and model data
analysis of UV-B light, drought and cold stress responses. Plant J 50:
347–363
Kotchoni SO, Kuhns C, Ditzer A, Kirch HH, Bartels D (2006) Over-
expression of different aldehyde dehydrogenase genes in Arabidopsis
thaliana confers tolerance to abiotic stress and protects plants against
lipid peroxidation and oxidative stress. Plant Cell Environ 29: 1033–1048
Leple JC, Brasiliero A, Michel MF, Delmotte F, Jouanin L (1992) Trans-
genic poplars: expression of chimeric genes using four different con-
structs. Plant Cell Rep 11: 137–141
Luo ZB, Janz D, Jiang XN, Gobel C, Wildhagen H, Tan YP, Rennenberg H,
Feussner I, Polle A (2009) Upgrading root physiology for stress toler-
ance by ectomycorrhizas: insights from metabolite and transcriptional
profiling into reprogramming for stress anticipation. Plant Physiol 151:
1902–1917
Ma S, Bohnert HJ (2007) Integration of Arabidopsis thaliana stress-related
transcript profiles, promoter structures, and cell-specific expression.
Genome Biol 8: R49
Ma S, Gong Q, Bohnert HJ (2006) Dissecting salt stress pathways. J Exp Bot
57: 1097–1107
Martinez-Beltran J, Manzur CL (2005) Overview of salinity problems in
the world and FAO strategies to address the problem. In Proceedings of
the International Salinity Forum. Riverside Publishing, Riverside, CA,
pp 311–315
Maxwell K, Johnson GN (2000) Chlorophyll fluorescence: a practical
guide. J Exp Bot 51: 659–668
Mouillon JM, Eriksson SK, Harryson P (2008) Mimicking the plant cell
interior under water stress by macromolecular crowding: Disordered
dehydrin proteins are highly resistant to structural collapse. Plant
Physiol 148: 1925–1937
Mouillon JM, Gustafsson P, Harryson P (2006) Structural investigation
of disordered stress proteins: comparison of full-length dehydrins
with isolated peptides of their conserved segments. Plant Physiol 141:
638–650
Munns R (2005) Genes and salt tolerance: bringing them together. New
Phytol 167: 645–663
Munns R, Tester M (2008) Mechanisms of salinity tolerance. Annu Rev
Plant Biol 59: 651–681
Olsson ASB, Engstrom P, Soderman E (2004) The homeobox genes
ATHB12 and ATHB7 encode potential regulators of growth in response
to water deficit in Arabidopsis. Plant Mol Biol 55: 663–677
Ottow EA, Brinker M, Teichmann T, Fritz E, Kaiser W, Brosche M,
Kangasjarvi J, Jiang X, Polle A (2005) Populus euphratica displays
apoplastic sodium accumulation, osmotic adjustment by decreases in
calcium and soluble carbohydrates, and develops leaf succulence under
salt stress. Plant Physiol 139: 1762–1772
Rinne PL, Kaikuranta PL, van der Plas LH, van der Schoot C (1999)
Dehydrins in cold-acclimated apices of birch (Betula pubescens Ehrh.):
production, localization and potential role in rescuing enzyme function
during dehydration. Planta 209: 377–388
Roessner-Tunali U, Hegemann B, Lytovchenko A, Carrari F, Bruedigam C,
Granot D, Fernie AR (2003) Metabolic profiling of transgenic tomato
plants overexpressing hexokinase reveals that the influence of hexose
phosphorylation diminishes during fruit development. Plant Physiol
133: 84–99
Rozen S, Skaletsky H (2000) Primer3 on the WWW for general users and
for biologist programmers. In S Krawetz, S Misener, eds, Bioinformatics
Methods and Protocols: Methods in Molecular Biology. Humana Press,
Totowa, NJ, pp 365–386
Scholander PF, Bradstreet ED, Hemmingsen EA, Hammel HT (1965) Sap
pressure in vascular plants: negative hydrostatic pressure can be mea-
sured in plants. Science 148: 339–346
Seki M, Narusaka M, Ishida J, Nanjo T, Fujita M, Oono Y, Kamiya A,
Nakajima M, Enju A, Sakurai T, et al (2002) Monitoring the expression
profiles of 7000 Arabidopsis genes under drought, cold and high-salinity
stresses using a full-length cDNA microarray. Plant J 31: 279–292
Shabala S, Cuin TA (2008) Potassium transport and plant salt tolerance.
Physiol Plant 133: 651–669
Shangari N, Bruce WR, Poon R, O’Brien PJ (2003) Toxicity of glyoxals: role
of oxidative stress, metabolic detoxification and thiamine deficiency.
Biochem Soc Trans 31: 1390–1393
Shinozaki K, Yamaguchi-Shinozaki K (2007) Gene networks involved in
drought stress response and tolerance. J Exp Bot 58: 221–227
Soderman E, Mattsson J, Engstrom P (1996) The Arabidopsis homeobox
gene ATHB-7 is induced by water deficit and by abscisic acid. Plant J 10:
375–381
Stanne TM, Sjogren LLE, Koussevitzky S, Clarke AK (2009) Identification
of new protein substrates for the chloroplast ATP-dependent Clp
protease supports its constitutive role in Arabidopsis. Biochem J 417:
257–268
Storey JD (2002) A direct approach to false discovery rates. J R Stat Soc B 64:
479–498
Sunkar R, Bartels D, Kirch HH (2003) Overexpression of a stress-inducible
aldehyde dehydrogenase gene from Arabidopsis thaliana in transgenic
plants improves stress tolerance. Plant J 35: 452–464
Taji T, Seki M, Satou M, Sakurai T, Kobayashi M, Ishiyama K, Narusaka
Y, Narusaka M, Zhu JK, Shinozaki K (2004) Comparative genomics
in salt tolerance between Arabidopsis and Arabidopsis-related halo-
phyte salt cress using Arabidopsis microarray. Plant Physiol 135:
1697–1709
Tusher VG, Tibshirani R, Chu G (2001) Significance analysis of micro-
Brinker et al.
1708 Plant Physiol. Vol. 154, 2010 www.plantphysiol.orgon June 5, 2020 - Published by Downloaded from
Copyright © 2010 American Society of Plant Biologists. All rights reserved.
arrays applied to the ionizing radiation response. Proc Natl Acad Sci
USA 98: 5116–5121
Vinocur B, Altman A (2005) Recent advances in engineering plant toler-
ance to abiotic stress: achievements and limitations. Curr Opin Bio-
technol 16: 1–10
Wang R, Chen S, Deng L, Fritz E, Huttermann A, Polle A (2007) Leaf
photosynthesis, fluorescence response to salinity and the relevance to
chloroplast salt compartmentation and anti-oxidative stress in two
poplars. Trees (Berl) 21: 581–591
WangW, Vinocur B, Shoseyov O, Altman A (2004) Role of plant heat-shock
proteins and molecular chaperones in the abiotic stress response. Trends
Plant Sci 9: 244–252
Watanabe S, Katsumi K, Yuji I, Sasaki S (2001) Effects of saline and
osmotic stress on proline and sugar accumulation in Populus euphratica
in vitro. Plant Cell Tissue Organ Cult 63: 199–206
Wolfinger RD, Gibson G, Wolfinger ED, Bennett L, Hamadeh H, Bushel
P, Afshari C, Paules RS (2001) Assessing gene significance from
cDNA microarray expression data via mixed models. J Comput Biol 8:
625–637
Wong CE, Li Y, Labbe A, Guevara D, Nuin P, Whitty B, Diaz C, Golding
GB, Gray GR, Weretilnyk EA, et al (2006) Transcriptional profiling
implicates novel interactions between abiotic stress and hormonal
responses in Thellungiella, a close relative of Arabidopsis. Plant Physiol
140: 1437–1450
Yamaguchi T, Blumwald E (2005) Developing salt-tolerant crop plants:
challenges and opportunities. Trends Plant Sci 10: 615–620
Zheng B, MacDonald TM, Sutinen S, Hurry V, Clarke AK (2006) A
nuclear-encoded ClpP subunit of the chloroplast ATP-dependent Clp
protease is essential for early development in Arabidopsis thaliana. Planta
224: 1103–1115
Zhu JK (2002) Salt and drought stress signal transduction in plants. Annu
Rev Plant Biol 53: 247–273
Zhu JK (2003) Regulation of ion homeostasis under salt stress. Curr Opin
Plant Biol 6: 441–445
Linking the Poplar Salt Transcriptome with Physiology
Plant Physiol. Vol. 154, 2010 1709 www.plantphysiol.orgon June 5, 2020 - Published by Downloaded from
Copyright © 2010 American Society of Plant Biologists. All rights reserved.