training manual for energy ef ciency financing in india
TRANSCRIPT
BUREAU OF ENERGY EFFICIENCY(Ministry of Power, Government of India)
Training Manual
for Energy Efciency
Financing in India
June 2015

DISCLAIMERBEE and USAID PACE-D TA Program disclaim liability for any personal injury, property, or other damages of any nature whatsoever, whether special, indirect, consequential, or compensatory, directly or indirectly resulting from the publication, use of, application, or reliance on this document.
© Copyright to Bureau of Energy Ef�ciency
This manual is for Capacity Building of Banks and Financial Institutions For Energy Ef�ciency Project Financing and it is prepared by USAID PACE-D TA Program and submitted to Bureau of Energy Ef�ciency.
BUREAU OF ENERGY EFFICIENCY(Ministry of Power, Government of India)
FOREWORDThe Bureau of Energy Ef�ciency (BEE) has been engaged in several initiatives to design and implement energy ef�ciency programs, including �nance being made available for energy ef�ciency projects. As part of this initiative, BEE is working on launching two focal �nancial instruments: Partial Risk Guarantee Fund for Energy Ef�ciency (PRGFEE) and Venture Capital Fund for Energy Ef�ciency (VCFEE). Both mechanisms aim to facilitate and accelerate the �nancing of energy ef�ciency projects.
One of the key barriers to energy ef�ciency �nancing in India is lack of awareness amongst banks and �nancial institutions on appraising risks and bene�ts of energy ef�ciency projects due to which loan of�cers typically refrain from giving loans against the promise of future energy savings. There is a critical need for loan of�cers and risk managers to have knowledge of characteristics and business models of energy ef�ciency projects, implementation models of energy saving companies, security structures, etc. which would enable them to assess energy ef�ciency projects in a more realistic manner.
In this context, BEE, with support from the USAID PACE-D Technical Assistance Program, has developed a training manual for energy ef�ciency �nancing. This manual aims at introducing the banks and �nancial institutions to the key issues involved in the appraisal and assessment of energy ef�ciency projects. This manual is planned to be disseminated widely amongst banks and �nancial institutions, and will be distributed at the various energy ef�ciency �nancing training programs that are organized.
I thank all the experts who have contributed to this compilation. I also thank the USAID PACE-D Technical Assistance Program for developing the training manual.
I hope the manual will facilitate knowledge sharing between stakeholders and scale up �nancing of energy ef�ciency projects in India.
Ajay MathurDirector GeneralBureau of Energy Ef�ciency

ACKNO WLE D GE ME NTS
This report was prepared under the Partnership to Advance Clean Energy-Deployment (PACE-D) Technical Assistance Program, which is funded by the United States Agency for International Development (USAID).
The PACE-D Technical Assistance Program team would particularly like to thank Dr. Ajay Mathur, Director General, Bureau of Energy (BEE) and Mr. Sanjay Seth, Energy Economist & Of�ciating Secretary, BEE for their valuable inputs.
The report substantially bene�tted from the overall guidance and technical inputs provided by the Energy Ef�ciency Financing Platform (EEFP) team comprising Ms. Vineeta Kanwal (Assistant EnergyEconomist) and Mr. Pranav Khanna (Project Engineer).
USAID Program ManagersMr. Anurag MishraMs. Apurva Chaturvedi
Technical TeamMr. Nithyanandam Yuvaraj Dinesh BabuDr. Bhaskar NatarajanMs. Sujatha Ramasamy
Editorial TeamMs. Kavita KaurMs. Anita KhullerMr. Rahul Kumar

Table of Contents
Part 11. Introduction to Energy Ef�ciency .............................................................................................. 2
2. Studies on Market Potential for Energy Ef�ciency .................................................................. 3
3. Barriers to Energy Ef�ciency ...................................................................................................... 5
4. National Mission for Enhanced Energy Ef�ciency and Energy Ef�ciency Financing
Platform...................................................................................................................................... 8
5. Policy Initiatives from BEE .......................................................................................................10
6. Next Steps for Achieving the Potential ...................................................................................12
7. Characteristics of Energy Ef�ciency Projects ..........................................................................13
8. Perform, Achieve and Trade (PAT) Scheme ...............................................................................14
9. Energy Services Market in India ...............................................................................................19
10. Structure of Energy Service performance Contract .............................................................. 23
Part 211. Introduction to Energy Ef�ciency Projects Appraisal ............................................................. 26
12. Considerations in Project Appraisal ......................................................................................... 28
13. Technical Appraisal .................................................................................................................. 29
14. Technical Risk Assessment and Mitigation ............................................................................. 31
15. Financial Appraisal .................................................................................................................. 33
16. Case Study 1: Financial Analysis of Energy Ef�ciency Project – ESCO Involved ............. 36
17. Loan Security Considerations................................................................................................... 41
18. Establishing Energy Ef�ciency Business Units ........................................................................ 43
Part 319. Introduction to Measurement and Veri�cation (M&V) .......................................................... 48
20. M&V Report Template .............................................................................................................. 53
ACRONYMS ................................................................................................................................ 62
List of Figures & Tables
Figure 1 : Role of energy ef�ciency in economic development .................................................... 2Figure 2 : NPC energy saving study-methodology ...................................................................... 3Figure 3 : Distribution of projects by technologies ....................................................................... 4Figure 4 : Barriers to energy ef�ciency ......................................................................................... 5Figure 5 : NMEEE initiatives .......................................................................................................... 8Figure 6 : EEFP features ................................................................................................................. 9Figure 7 : Energy ef�ciency �nancing examples in India ............................................................ 11Figure 8 : Typical energy ef�ciency project ................................................................................ 17Figure 9 : Energy services business models ................................................................................. 19Figure 10 : Shared savings model ........................................................................................ 20Figure 11 : Guaranteed savings model .......................................................................................... 21Figure 12 : Deemed energy savings model .................................................................................. 21Figure 13 : Outsourced energy model ........................................................................... 22Figure 14 : Key elements of M&V plan .......................................................................................... 49Figure 15 : Energy savings ............................................................................................................. 49
Table 1 : Sector-wise energy consumption and energy saving targets under PAT Cycle-I (2012-2015) ................................................................................................ 14Table 2 : Savings achieved in EPCOS project ............................................................................. 18Table 3 : Project details ........................................................................................................... 18 Table 4 : Key technical appraisal ............................................................................................... 29Table 5 : Some proven technologies deployed across industries ............................................ 29 Table 6 : Key elements in �nancial appraisal ............................................................................ 33Table 7 : Simple payback period of generic-type energy ef�ciency projects ....................... 34Table 8 : Assumptions in transformer replacement project ................................................... 36 Table 9 : Baseline consumption ................................................................................................ 37Table 10 : Net savings after project implementation ............................................................... 37 Table 11 : Cash �ow .................................................................................................................... 37Table 12 : Cash �ow when host implements the project ......................................................... 38Table 13 : Cost bene�t analysis when host implements the project .......................................... 39 Table 14 : Cash �ow when ESCO implements project ................................................................ 39Table 15 : Cost bene�t analysis when host implements the project ....................................... 40Table 16 : Parameters in M&V .................................................................................................. 51 Table 17 : Baseline and post implementation of energy ef�ciency measure in Jayashree Division ........................................................................................................................ 60Table 18 : Monitoring parameters of energy ef�ciency measure in Jayashree Division ........... 60Table 19 : Baseline and project information for PSPD, ITC Limited ........................................ 61Table 20 : Monitoring parameters of PSPD, ITC Limited Project ............................................. 61
Market Opportunity and
Business Models for
Energy Efciency
Projects
Part 1

1. Introduction to Energy Efciency
1.1 Background Energy ef�ciency is recognized as the most cost-effective solution to meet the rapid growth in energy demand. Energy ef�ciency enhances energy security while moving towards reducing the energy supply/demand gap. Since there are savings in energy consumption, which otherwise would have been generated from fossil fuel-based generation, energy ef�ciency also plays a vital role in mitigating climate change. Thus, energy ef�ciency paves the way for economic development without compromising on present needs.
2 Training Manual for Energy Ef�ciency Financing in India
Energy Ef�ciency Most Cost-EffectiveSolution
EnhancingEf�ciencySecurity
Reducing theEnergy
Demand-Supply GapMitigating
Climate Impacts
EconomicDevelopment
WithoutCompromising
Figure 1: Role of energy ef�ciency in economic development
2. Studies on Market Potential for Energy
Efciency
12.1 World Bank StudyA study by the World Bank for three countries, viz. India, China and Brazil, indicates that these countries have high potential for energy ef�ciency projects with energy savings potential of around 50 billion kWh, for which investment potential is to the tune of INR 14,000 crores.
2 A study done by the Confederation of Indian Industry (CII)/Indian Renewable Energy Development Agency (IREDA) indicates that estimated annual savings potential is around INR 3,750 crores and investment potential for energy ef�ciency is about INR 8,250 crores in India.
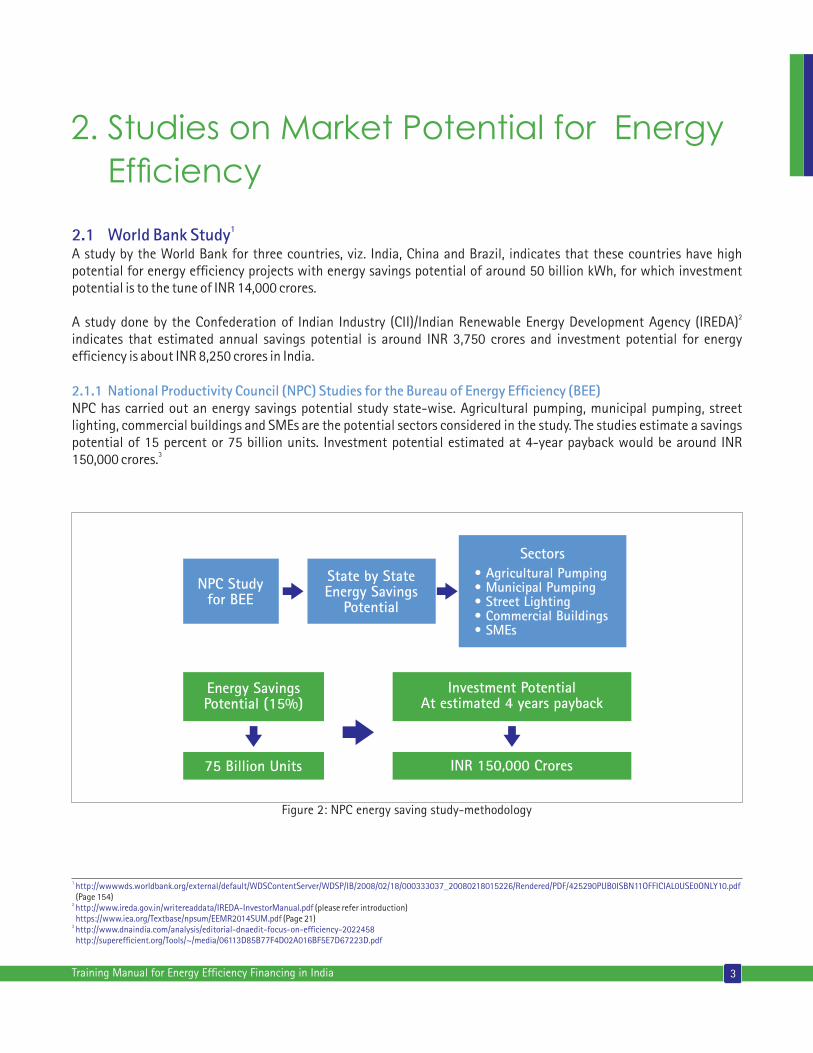
2.1.1 National Productivity Council (NPC) Studies for the Bureau of Energy Ef�ciency (BEE)NPC has carried out an energy savings potential study state-wise. Agricultural pumping, municipal pumping, street lighting, commercial buildings and SMEs are the potential sectors considered in the study. The studies estimate a savings potential of 15 percent or 75 billion units. Investment potential estimated at 4-year payback would be around INR
3150,000 crores.
3Training Manual for Energy Ef�ciency Financing in India
NPC Studyfor BEE
State by StateEnergy Savings
Potential
Sectors• Agricultural Pumping• Municipal Pumping• Street Lighting• Commercial Buildings• SMEs
Energy SavingsPotential (15%)
Investment PotentialAt estimated 4 years payback
INR 150,000 Crores75 Billion Units
1 http://wwwwds.worldbank.org/external/default/WDSContentServer/WDSP/IB/2008/02/18/000333037_20080218015226/Rendered/PDF/425290PUB0ISBN11OFFICIAL0USE0ONLY10.pdf (Page 154)2 http://www.ireda.gov.in/writereaddata/IREDA-InvestorManual.pdf (please refer introduction) (Page 21) https://www.iea.org/Textbase/npsum/EEMR2014SUM.pdf3 http://www.dnaindia.com/analysis/editorial-dnaedit-focus-on-ef�ciency-2022458 http://superef�cient.org/Tools/~/media/06113D85B77F4D02A016BF5E7D67223D.pdf
Figure 2: NPC energy saving study-methodology
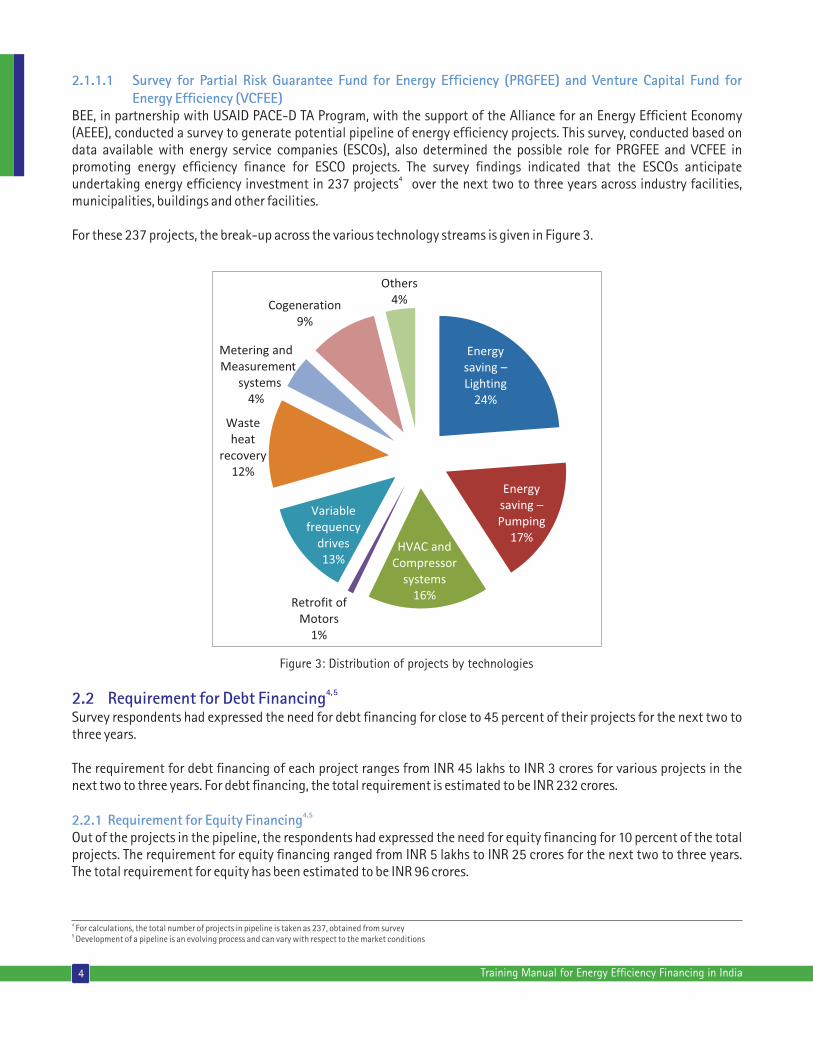
2.1.1.1 Survey for Partial Risk Guarantee Fund for Energy Ef�ciency (PRGFEE) and Venture Capital Fund for Energy Ef�ciency (VCFEE) BEE, in partnership with USAID PACE-D TA Program, with the support of the Alliance for an Energy Ef�cient Economy (AEEE), conducted a survey to generate potential pipeline of energy ef�ciency projects. This survey, conducted based on data available with energy service companies (ESCOs), also determined the possible role for PRGFEE and VCFEE in promoting energy ef�ciency �nance for ESCO projects. The survey �ndings indicated that the ESCOs anticipate
4undertaking energy ef�ciency investment in 237 projects over the next two to three years across industry facilities, municipalities, buildings and other facilities.
For these 237 projects, the break-up across the various technology streams is given in Figure 3.
4 Training Manual for Energy Ef�ciency Financing in India
Figure 3: Distribution of projects by technologies
4, 52.2 Requirement for Debt FinancingSurvey respondents had expressed the need for debt �nancing for close to 45 percent of their projects for the next two to three years.
The requirement for debt �nancing of each project ranges from INR 45 lakhs to INR 3 crores for various projects in the next two to three years. For debt �nancing, the total requirement is estimated to be INR 232 crores.
4, 52.2.1 Requirement for Equity FinancingOut of the projects in the pipeline, the respondents had expressed the need for equity �nancing for 10 percent of the total projects. The requirement for equity �nancing ranged from INR 5 lakhs to INR 25 crores for the next two to three years. The total requirement for equity has been estimated to be INR 96 crores.
4 For calculations, the total number of projects in pipeline is taken as 237, obtained from survey5 Development of a pipeline is an evolving process and can vary with respect to the market conditions
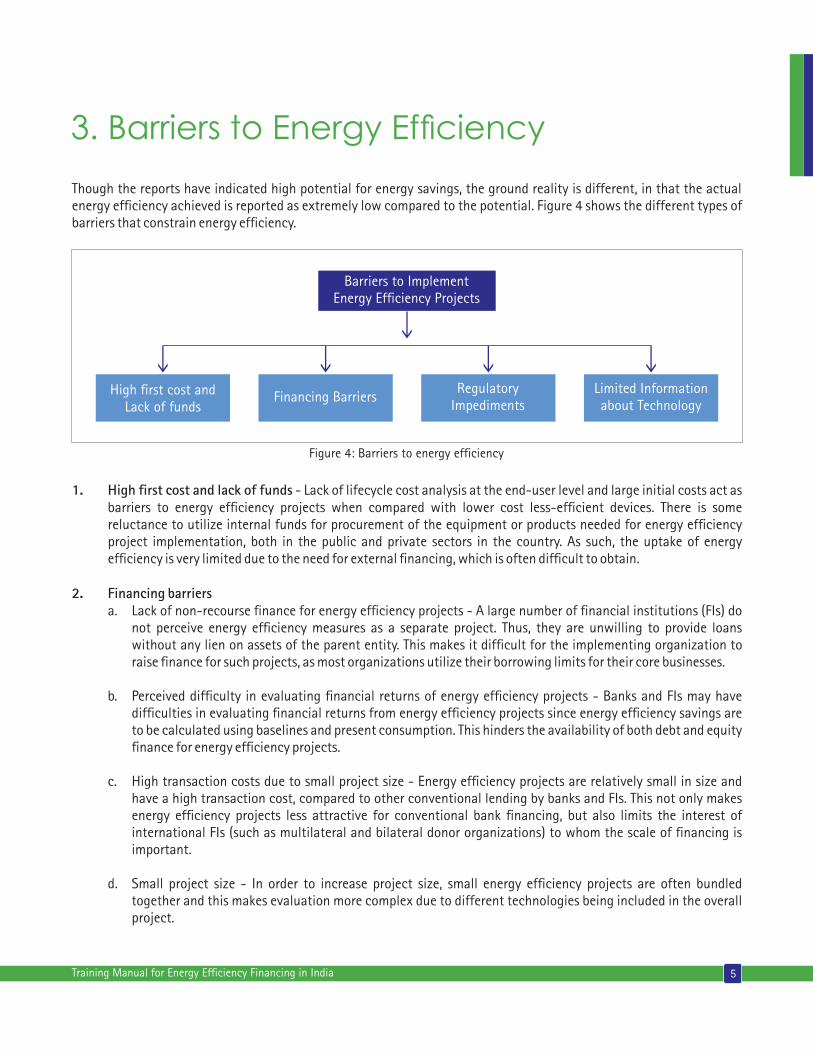
Though the reports have indicated high potential for energy savings, the ground reality is different, in that the actual energy ef�ciency achieved is reported as extremely low compared to the potential. Figure 4 shows the different types of barriers that constrain energy ef�ciency.
5Training Manual for Energy Ef�ciency Financing in India
3. Barriers to Energy Efciency
Barriers to ImplementEnergy Ef�ciency Projects
High �rst cost andLack of funds
Financing Barriers Regulatory
Impediments Limited Informationabout Technology
Figure 4: Barriers to energy ef�ciency
1. High �rst cost and lack of funds - Lack of lifecycle cost analysis at the end-user level and large initial costs act as barriers to energy ef�ciency projects when compared with lower cost less-ef�cient devices. There is some reluctance to utilize internal funds for procurement of the equipment or products needed for energy ef�ciency project implementation, both in the public and private sectors in the country. As such, the uptake of energy ef�ciency is very limited due to the need for external �nancing, which is often dif�cult to obtain.
2. Financing barriers a. Lack of non-recourse �nance for energy ef�ciency projects - A large number of �nancial institutions (FIs) do not perceive energy ef�ciency measures as a separate project. Thus, they are unwilling to provide loans without any lien on assets of the parent entity. This makes it dif�cult for the implementing organization to raise �nance for such projects, as most organizations utilize their borrowing limits for their core businesses.
b. Perceived dif�culty in evaluating �nancial returns of energy ef�ciency projects - Banks and FIs may have dif�culties in evaluating �nancial returns from energy ef�ciency projects since energy ef�ciency savings are to be calculated using baselines and present consumption. This hinders the availability of both debt and equity �nance for energy ef�ciency projects.
c. High transaction costs due to small project size - Energy ef�ciency projects are relatively small in size and have a high transaction cost, compared to other conventional lending by banks and FIs. This not only makes energy ef�ciency projects less attractive for conventional bank �nancing, but also limits the interest of international FIs (such as multilateral and bilateral donor organizations) to whom the scale of �nancing is important.
d. Small project size - In order to increase project size, small energy ef�ciency projects are often bundled together and this makes evaluation more complex due to different technologies being included in the overall project.
6 Training Manual for Energy Ef�ciency Financing in India
e. High project development costs (“soft costs”) - Soft costs such as project preparatory costs and pre-�nancing costs such as detailed project report (DPR), feasibility report, consultant, measurement and veri�cation (M&V) of energy ef�ciency projects are high when compared to their investment scale.
f. Dif�culties in collateralizing project assets - Since energy ef�ciency projects are mostly not standalone and are integrated with main operations of industry, collateralizing project assets becomes more dif�cult.
g. Limited appraisal experience - Bankers/FIs have very limited experience in appraising energy ef�ciency projects and assigning credit risk ratings.
h. Poor creditworthiness of borrowers - In some cases, due to absence of track records on loan applicants or non payment of existing outstanding debts which means poor creditworthiness of borrowers, project funding has not been taken forward.
I. No standard contracts/agreements - Due to non-availability of standard contract agreements for energy ef�ciency projects, unlike for renewable energy projects wherein power sale agreements are generally based on tariff policies, most bankers/FIs �nd it dif�cult to approve energy ef�ciency projects.
j. Limited availability of formal M&V approaches - Though there are internationally structured and accepted M&V approaches, the concept of adapting these protocols to the Indian context with associated reduced costs of M&V is a missing link.
k. Getting new bankers poses procedural constraints - Some part of existing cash �ows may be already pledged to existing bankers, and hence if a new banker has to �nance an energy ef�ciency project, there are procedural issues that come in the way.
3. Policy and institutional barriers: Procurement generally prescribes lowest cost selection criteria. There are institutional dif�culties in procuring high ef�ciency equipment at higher costs. The Government of India has created an institutional structure for promotion and implementation of energy ef�ciency bodies such as BEE at the national level and State Designated Agencies at the state level. These institutions generally assist in pilot projects and leave the scaling up to state agencies. Policy incentives at the central and state levels have been reported as a constraint in increasing energy ef�ciency activities.
4. Technological barrier: There is limited information available to consumers on performance of various technologies for energy ef�ciency. While equipment suppliers are adopting measures to meet this gap, there is still more to be done.
Some of the options to overcome barriers for investment in energy ef�ciency projects are discussed below.
• Using proven technologies - Installation of proven technologies would result in lesser failures and thereby, lesser technical and �nancial risks.• Project bundling - Bundling small projects to increase project size would minimize risk in terms of investment and operation.• Customized �nancial products - Project proponents can opt for customized �nancial products, as these would be structured to each investor type and thereby risks in terms of interest and repayment will be minimized.• Rigorous project appraisal - Complete and rigorous project appraisal by FIs/Banks at the application stage level will minimize the risk in interest payment and repayment. • Innovative ways to collateralize projects - Bankers/FIs can come up with innovative methods to collateralize projects in order to minimize risk in terms of payment surety and guarantee.
7Training Manual for Energy Ef�ciency Financing in India
• Standard contracts and agreements - Documents such as standard contracts between the supplier and host, host and ESCO, and standard loan agreements for projects considering scenarios such as full collateralization, 50 percent collateralization and nil collateralization, are required as reference material for bankers/FIs to approve energy ef�ciency project loans.• Formal third party M&V - Formal third party M&V could assure investors regarding energy savings and thereby improving cash �ows.
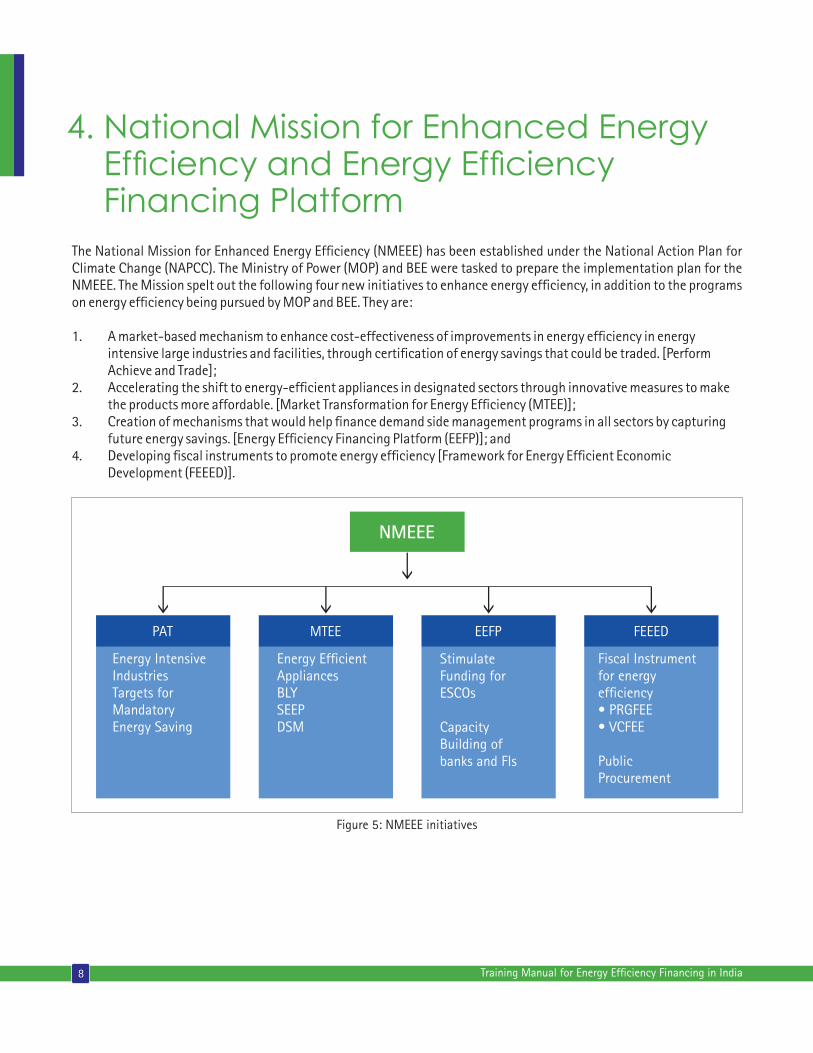
4. National Mission for Enhanced Energy Efciency and Energy Efciency Financing Platform
The National Mission for Enhanced Energy Ef�ciency (NMEEE) has been established under the National Action Plan for Climate Change (NAPCC). The Ministry of Power (MOP) and BEE were tasked to prepare the implementation plan for the NMEEE. The Mission spelt out the following four new initiatives to enhance energy ef�ciency, in addition to the programs on energy ef�ciency being pursued by MOP and BEE. They are:
1. A market-based mechanism to enhance cost-effectiveness of improvements in energy ef�ciency in energy intensive large industries and facilities, through certi�cation of energy savings that could be traded. [Perform Achieve and Trade]; 2. Accelerating the shift to energy-ef�cient appliances in designated sectors through innovative measures to make the products more affordable. [Market Transformation for Energy Ef�ciency (MTEE)]; 3. Creation of mechanisms that would help �nance demand side management programs in all sectors by capturing future energy savings. [Energy Ef�ciency Financing Platform (EEFP)]; and4. Developing �scal instruments to promote energy ef�ciency [Framework for Energy Ef�cient Economic Development (FEEED)].
8 Training Manual for Energy Ef�ciency Financing in India
Figure 5: NMEEE initiatives
NMEEE
PAT MTEE EEFP FEEED
Energy IntensiveIndustriesTargets forMandatoryEnergy Saving
Energy Ef�cientAppliancesBLYSEEPDSM
StimulateFunding forESCOs
CapacityBuilding ofbanks and FIs
Fiscal Instrumentfor energyef�ciency• PRGFEE• VCFEE
PublicProcurement

9Training Manual for Energy Ef�ciency Financing in India
Figure 6: EEFP Features
Under the Framework for Energy Ef�cient Economic Development (FEEED), BEE proposes to launch two �scal instruments to promote energy ef�ciency - the Partial Risk Guarantee Fund for Energy Ef�ciency (PRGFEE) and Venture Capital Fund for Energy Ef�ciency (VCFEE).
BEE has undertaken the following measures, in addition to those related to implementing demonstration projects in government buildings, in order to stimulate the market.
• Putting in place a government-supported standard methodology that covers the entire project chain from audit to performance measurement and veri�cation • Designing a standard performance contract • Designing appropriate �nancial mechanisms to fund projects • Implementing projects and evaluating their impact • Building capacity in ESCOs and project owners
In an effort to facilitate EEFP, BEE has signed memorandum of understanding (MOU) with with PTC India Ltd., SIDBI and HSBC Bank. PTC India Ltd. has commenced �nancing of several building energy ef�ciency projects such as in Rashtrapati Bhavan Estate, ESIC Hospitals at Rohini and East Delhi, AIIMS, Safdarjung Hospital. Similarly, SIDBI has taken up project preparation of energy ef�ciency projects in 25 SME clusters, which will then be offered �nancing.
4.1 Energy Ef�ciency Financing Platform (EEFP)NMEEE’s third initiative is the Energy Ef�ciency Financing Platform (EEFP), which allows for the creation of mechanisms that would help �nance demand side management programs in all sectors by capturing future energy savings. EEFP will have these components as given in Figure 6.
BEE has been engaged in several initiatives to enhance the identi�cation and successful implementation of energy ef�ciency projects, including �nance being made available for such projects. Some of the initiatives are:
• Perform, Achieve and Trade (PAT): This is a market-based mechanism to enhance cost effectiveness of improvements in energy ef�ciency in energy-intensive large industries and facilities, through certi�cation on energy savings that could be traded. Ø Targets for improvements in energy ef�ciency are set under Section 14 of the Energy Conservation Act, 2001 in a manner that re�ects fuel usage and the economic effort involved. The Government, in March 2007, noti�ed units in nine industrial sectors, namely aluminium, cement, chlor-alkali, fertilizers, iron and steel, pulp and paper, railways, textiles and thermal power plants, as Designated Consumers (DCs).
• Partial Risk Guarantee Fund for Energy Ef�ciency (PRGFEE): This is a risk-sharing mechanism to provide commercial banks with a partial coverage of risk involved in extending loans for energy ef�ciency projects.
• Venture Capital Fund for Energy Ef�ciency (VCFEE): Established by the BEE, this is one of the �nancial instruments under the Framework for Energy Ef�cient Economic Development of NMEEE. The VCFEE provides risk capital support to energy ef�ciency investments in new technologies, goods and services.
• Energy audits of Buildings, Municipalities and SMEs: As a part of the Energy Ef�ciency Financing Platform, BEE also carried out investment grade energy audits of buildings, municipalities and SMEs with a view to build a bouquet of projects for investors to take up for implementation.
• Performance Contracting-based Demonstration projects: BEE, via its accreditation process, encourages the adoption of more energy ef�ciency projects through ESCOs. ESCOs generally act as project developers for a wide range of tasks and assume the technical and performance risks associated with the project.
• SME Program with SIDBI: BEE has signed a MOU with SIDBI in order to provide �nancial support for implementation of the technologies identi�ed in the MSME project DPRs assessed by BEE. Thus this collaboration would promote energy ef�ciency project �nancing.
Please refer to for more details.http://beeindia.in/index.php
In addition to the above, Energy Ef�ciency Services Ltd. (EESL) has been established to build markets for ESCOs in the country. EESL has already made substantial headway in identi�cation and implementation of energy ef�ciency projects in partnership with some utilities and municipalities.
5. Policy Initiatives from BEE
10 Training Manual for Energy Ef�ciency Financing in India
11Training Manual for Energy Ef�ciency Financing in India
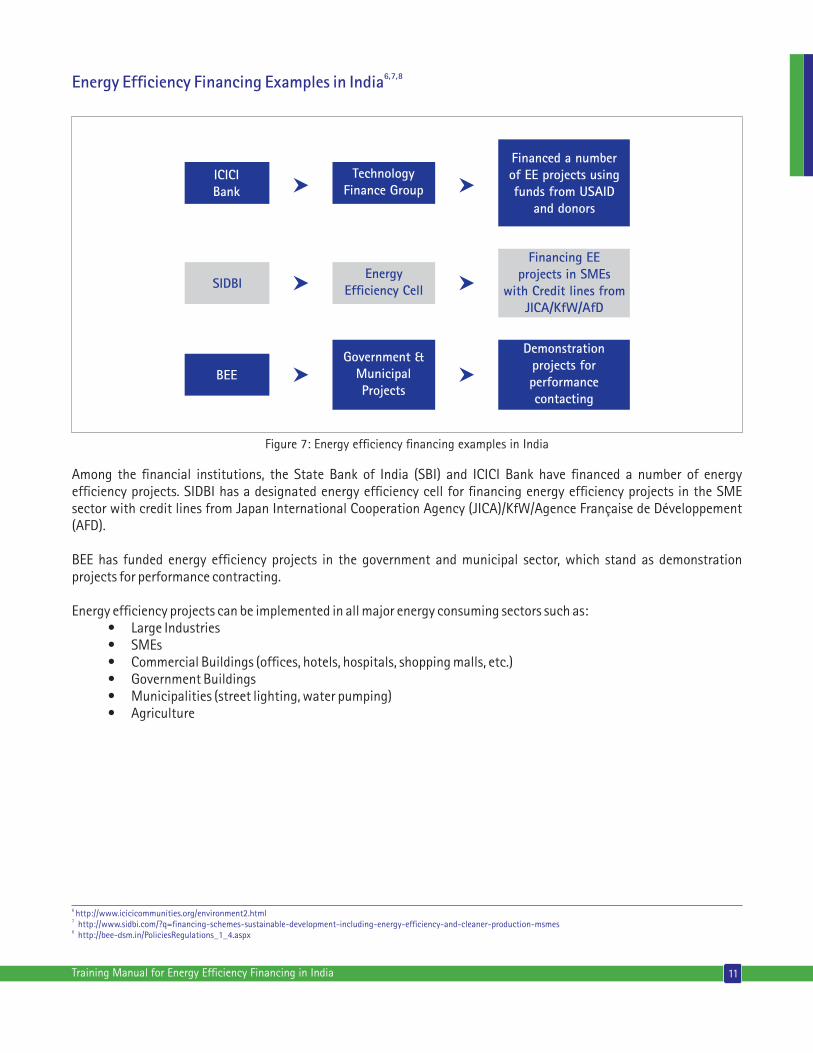
6, 7, 8Energy Ef�ciency Financing Examples in India
TechnologyFinance Group
Government &MunicipalProjects
ICICIBank
Financed a numberof EE projects usingfunds from USAID
and donors
BEE
Demonstrationprojects forperformancecontacting
EnergyEf�ciency Cell
Financing EEprojects in SMEs
with Credit lines fromJICA/KfW/AfD
SIDBI
Figure 7: Energy ef�ciency �nancing examples in India
Among the �nancial institutions, the State Bank of India (SBI) and ICICI Bank have �nanced a number of energy ef�ciency projects. SIDBI has a designated energy ef�ciency cell for �nancing energy ef�ciency projects in the SME sector with credit lines from Japan International Cooperation Agency (JICA)/KfW/Agence Française de Développement (AFD).
BEE has funded energy ef�ciency projects in the government and municipal sector, which stand as demonstration projects for performance contracting.
Energy ef�ciency projects can be implemented in all major energy consuming sectors such as: • Large Industries • SMEs • Commercial Buildings (of�ces, hotels, hospitals, shopping malls, etc.) • Government Buildings • Municipalities (street lighting, water pumping) • Agriculture
6 http://www.icicicommunities.org/environment2.html7 http://www.sidbi.com/?q=�nancing-schemes-sustainable-development-including-energy-ef�ciency-and-cleaner-production-msmes8 http://bee-dsm.in/PoliciesRegulations_1_4.aspx
Access to �nance has been identi�ed as one of the key constraints in energy ef�ciency project implementation. There is action required from different stakeholders for working towards steps that could lead to realization of bene�ts from energy ef�ciency.
• Management commitment to energy ef�ciency �nancing as a business line– Banks/FIs strategically allocate or devise business line in the form of credit line to �nance energy ef�ciency projects. Energy ef�ciency �nancing must be recognized as a full-�edged business opportunity with clearly identi�ed resources for meeting targets.
• Identi�cation of target markets– Banks/FIs, through their research cells, can evaluate market potential with respect to technology types, industry type and region to understand target market for �nancing energy ef�ciency projects.
• Establishment of energy ef�ciency unit or cell – To �nance energy ef�ciency projects, Banks/FIs need to establish energy ef�ciency units or cells comprising personnel with relevant background, to assess project technology know-how and savings, a �nance expert to assess pay-back period, debt-service coverage ratio, etc.
• Understanding of energy ef�ciency �nancing and ESCO business models– Banks/FIs need to build their capacity to understand different ESCO business models in energy ef�ciency �nancing. This can be achieved by interaction with ESCOs, industries and others who have implemented energy ef�ciency projects.
• Identi�cation of available government and donor incentive programs– Banks/FIs can identify government programs such as donor incentive programs, subsidies, etc., and can link with the energy ef�ciency �nance products, to accelerate energy ef�ciency �nance and thereby deployment.
• Development of customized �nancial products– Customized �nancial products or tailor-made type products applicable to different types of customer such as small, medium and large scale enterprises, will actually increase energy ef�ciency project �nancing.
• Training and capacity building of loan of�cers and risk managers– Loan of�cers/managers and risk of�cers should undergo training and capacity building for smooth energy ef�ciency project appraisal and loan sanction. Loan of�cers and risk managers should be trained in all existing loan products of their banks and in the market, should have knowledge of different business models, agreement structures, project types and technology types.
• Establishment of relationships with ESCOs and other energy service providers– Banks/FIs should have regular interaction and discussions in forums with ESCOS and other energy service providers to understand ESCO expectations, energy markets and pricing, updates on technology and power sector, success and failure stories, etc. Simultaneously, ESCOs will get an opportunity to understand bank/FI terms and regulations, capacity and limitations in �nancing energy ef�ciency projects. This relationship building can smoothen energy ef�ciency project �nancing and thereby deployment.
6. Next Steps for Achieving the Potential
12 Training Manual for Energy Ef�ciency Financing in India

13Training Manual for Energy Ef�ciency Financing in India
7. Characteristics of Energy Efciency
Projects
Energy ef�ciency projects have certain characteristics that have key bearings on their implementation. They are:
• Energy ef�ciency projects range from simple and direct retro�ts of devices, to complex process changes through technology upgradation. • Energy ef�ciency activities such as retro�ts can be completed in short time frames of 1-6 months. • Energy ef�ciency activities can be achieved through well-established maintenance and standard operational practices. • Energy ef�ciency project activities are modular in nature and can be added on as the demand for them increases across all consumer sectors. • There already exists a wide range of energy-ef�cient technologies, most of them with substantial experience in successful implementation, internationally as well as in India . • Energy ef�ciency projects are relatively small in project size, and cost less than INR 100 lakhs. • Most energy ef�ciency projects have short payback periods, generally one to three years. • The risk of failure of energy ef�ciency projects, through well-established technologies, is low.
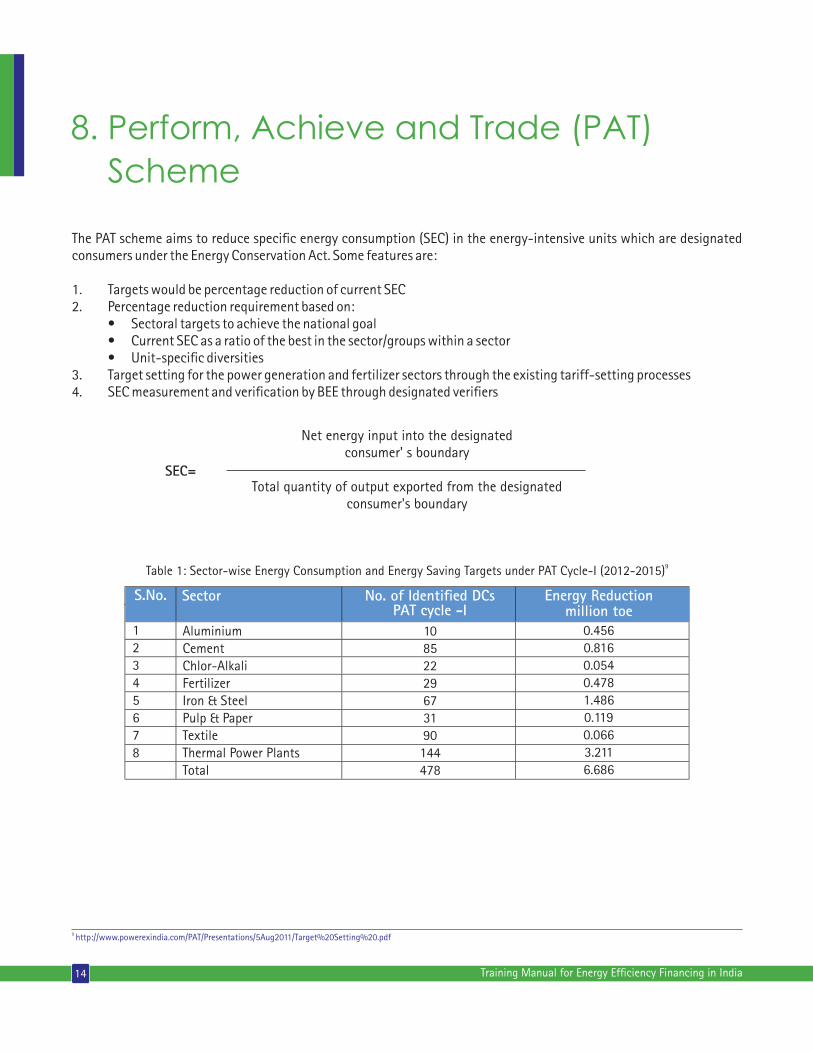
The PAT scheme aims to reduce speci�c energy consumption (SEC) in the energy-intensive units which are designated consumers under the Energy Conservation Act. Some features are:
1. Targets would be percentage reduction of current SEC2. Percentage reduction requirement based on: • Sectoral targets to achieve the national goal • Current SEC as a ratio of the best in the sector/groups within a sector • Unit-speci�c diversities3. Target setting for the power generation and fertilizer sectors through the existing tariff-setting processes4. SEC measurement and veri�cation by BEE through designated veri�ers
8. Perform, Achieve and Trade (PAT)
Scheme
14 Training Manual for Energy Ef�ciency Financing in India
Net energy input into the designatedconsumer' s boundary
Total quantity of output exported from the designatedconsumer's boundary
SEC=
9Table 1: Sector-wise Energy Consumption and Energy Saving Targets under PAT Cycle-I (2012-2015)
S.No. Sector No. of Identi�ed DCs PAT cycle -I
Energy Reduction million toe
12345678
AluminiumCementChlor-AlkaliFertilizerIron & SteelPulp & PaperTextileThermal Power PlantsTotal
10852229673190144478
0.4560.8160.0540.4781.4860.1190.0663.2116.686
9 http://www.powerexindia.com/PAT/Presentations/5Aug2011/Target%20Setting%20.pdf

15Training Manual for Energy Ef�ciency Financing in India
8.1 Some of the energy ef�ciency measures generally deployed in industries are listed below: • Replacement of inef�cient industrial technologies with energy saving technologies and equipment, such as more ef�cient industrial boilers, kilns, and heat exchange systems. • Recovery and utilization of by-product gas, waste heat in industries such as iron and steel, chlor alkali, and pulp and paper. • Installation of highly ef�cient mechanical and electrical equipment, including lighting, motors, chillers, refrigeration units, pumps, heating and ventilation equipment, etc. • Industrial system optimization to reduce energy use.
8.2 Examples of Energy Ef�ciency Projects in Cement Industry • Improve kiln combustion ef�ciency by reducing the false air ingress at the preheater section and reducing marginally the sintering level of clinker • Optimize the air �ow to the grate cooler and reduce the vent air losses • Utilize cooler vent air as primary air to the kiln burner • Improve insulation at preheaters, ducts and kiln internally • Replace the air-cooled turbulators with refractory-lined turbulators • Generate electricity from the waste heat of pH exhaust and cooler vent streams • Install variable frequency drives for fans in the production processes
8.3 Examples of Energy Ef�ciency in BuildingsEnergy ef�ciency in residential, commercial, and government buildings includes: • Lighting • HVAC (heating, ventilation, and air conditioning) • Building envelope (insulation for roof-tops, walls, windows, doors) • Renewable energy in buildings (roof-top solar PV, solar water heaters, and ground source heat pumps)
8.4 Examples of Energy Ef�ciency in Municipalities • Water Pumping s Leak detection s Ef�cient pumping systems s Operational optimization
• Street Lighting s Ef�cient lighting s Controls s Solar systems
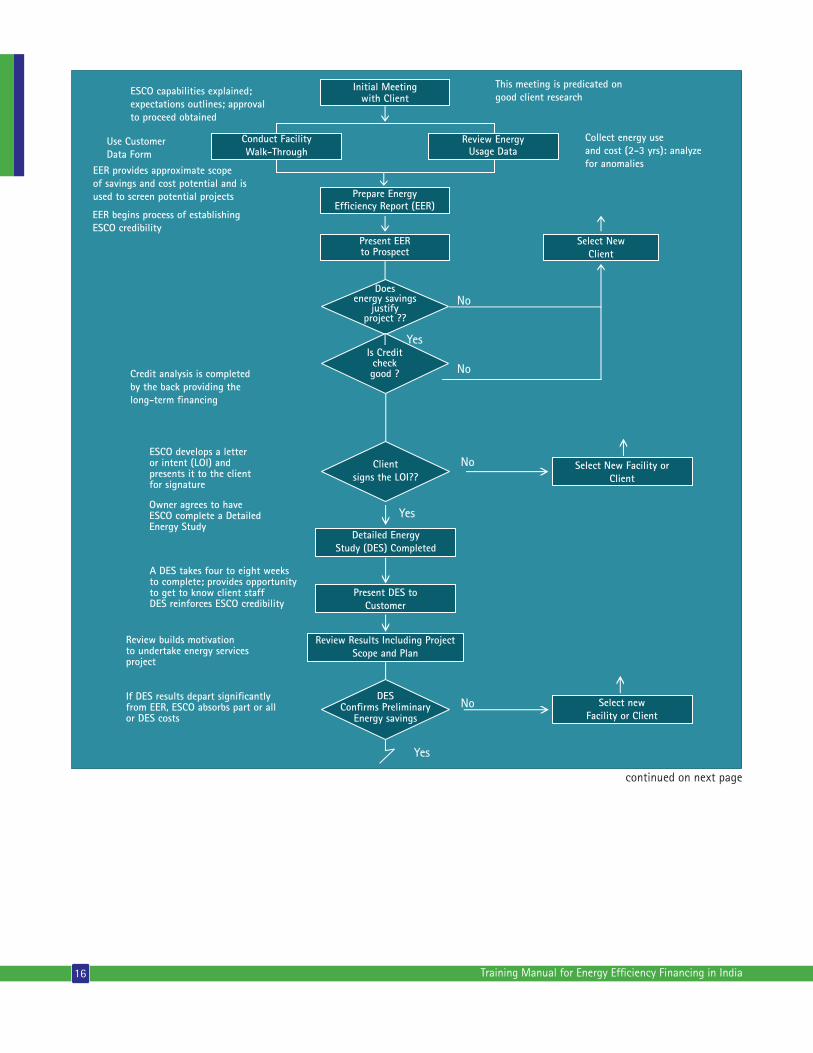
16 Training Manual for Energy Ef�ciency Financing in India
Select New Facility orClient
Yes
No
No
Yes
Client signs the LOI??
Detailed EnergyStudy (DES) Completed
Present DES toCustomer
Review Results Including ProjectScope and Plan
DESCon�rms Preliminary
Energy savingsSelect new
Facility or Client
ESCO develops a letteror intent (LOI) andpresents it to the clientfor signature
Owner agrees to haveESCO complete a Detailed Energy Study
A DES takes four to eight weeksto complete; provides opportunityto get to know client staffDES reinforces ESCO credibility
Review builds motivationto undertake energy servicesproject
If DES results depart signi�cantly from EER, ESCO absorbs part or allor DES costs
Use CustomerData Form
ESCO capabilities explained;expectations outlines; approvalto proceed obtained
EER begins process of establishingESCO credibility
EER provides approximate scopeof savings and cost potential and isused to screen potential projects
This meeting is predicated ongood client research
Collect energy useand cost (2-3 yrs): analyzefor anomalies
Credit analysis is completedby the back providing thelong-term �nancing
No
No
Yes
Initial Meetingwith Client
Review EnergyUsage Data
Conduct FacilityWalk-Through
Prepare EnergyEf�ciency Report (EER)
Present EERto Prospect
Doesenergy savings
justifyproject ??
Is Creditcheckgood ?
Select NewClient
continued on next page
No
No
Yes
Yes
CustomerAcceptsResults
Draft Energy Services PerformanceContract (ESPC) is developed
Clientand ESCOSign ESPC
ProjectImplementation
Final mix of measures selected;Financial modeling used to helpprice the ESPC and optimize pro�tand cash �ow for selected measures
Client pays for100% of DES
17Training Manual for Energy Ef�ciency Financing in India
8.5 Illustrative Project Examples
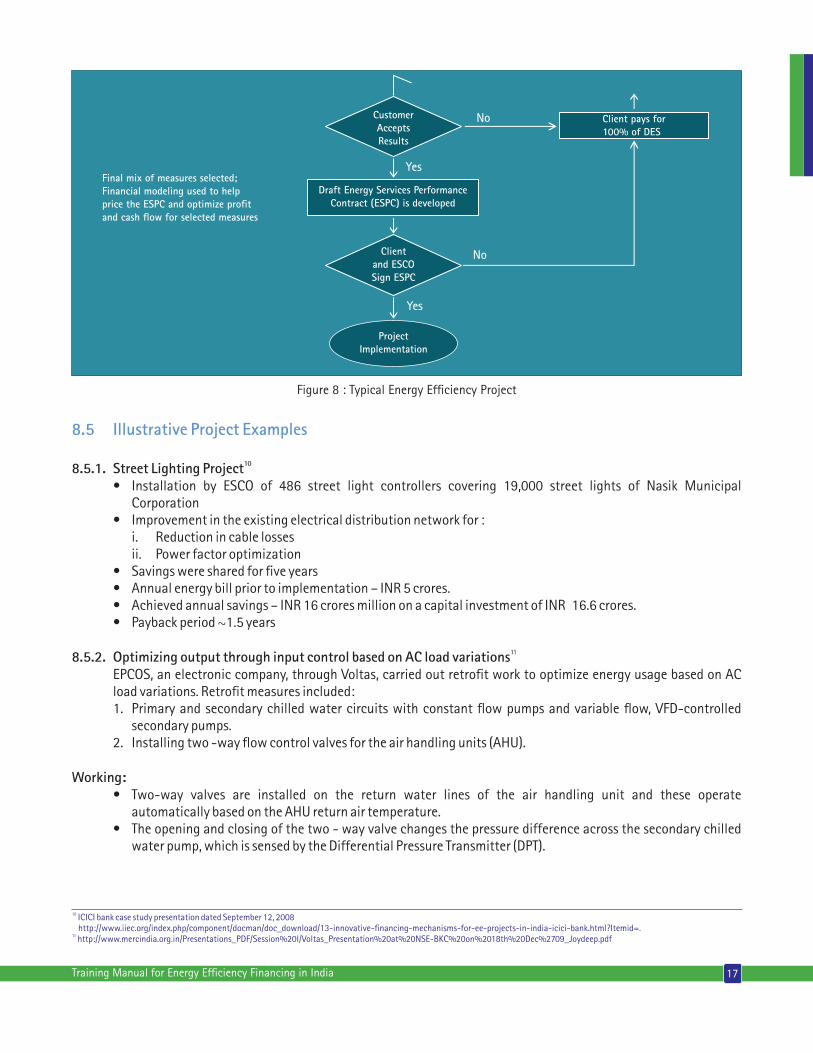
108.5.1. Street Lighting Project • Installation by ESCO of 486 street light controllers covering 19,000 street lights of Nasik Municipal Corporation • Improvement in the existing electrical distribution network for : i. Reduction in cable losses ii. Power factor optimization • Savings were shared for �ve years • Annual energy bill prior to implementation – INR 5 crores. • Achieved annual savings – INR 16 crores million on a capital investment of INR 16.6 crores. • Payback period ~1.5 years
11 8.5.2. Optimizing output through input control based on AC load variations EPCOS, an electronic company, through Voltas, carried out retro�t work to optimize energy usage based on AC load variations. Retro�t measures included: 1. Primary and secondary chilled water circuits with constant �ow pumps and variable �ow, VFD-controlled secondary pumps. 2. Installing two -way �ow control valves for the air handling units (AHU).
Working: • Two-way valves are installed on the return water lines of the air handling unit and these operate automatically based on the AHU return air temperature. • The opening and closing of the two - way valve changes the pressure difference across the secondary chilled water pump, which is sensed by the Differential Pressure Transmitter (DPT).
10 ICICI bank case study presentation dated September 12, 2008 http://www.iiec.org/index.php/component/docman/doc_download/13-innovative-�nancing-mechanisms-for-ee-projects-in-india-icici-bank.html?Itemid=.11 http://www.mercindia.org.in/Presentations_PDF/Session%20I/Voltas_Presentation%20at%20NSE-BKC%20on%2018th%20Dec%2709_Joydeep.pdf
Figure 8 : Typical Energy Ef�ciency Project
8.5.3. Food processing unit energy ef�ciency project funded by SIDBI (green�eld) The company decided to set up a new unit for the manufacture of Herbal Food & Beverage Ingredients (chicory powder and liquid chicory) with an installed capacity of 1,200 MTPA. Raw material: Chicory roots, washed, sliced and dried.
For the manufacture of chicory, the company decided to employ a process called agglomeration. This involves extraction of separate natural �bres from chicory root (enzyming process) and production of chicory granules with low density through special drying. The small pieces of chicory arriving at the factory would pass through the vertical extractor in running hot water and this would result in the production of extracted liquid.
This is treated with speci�c biotechnological enzymes and the puri�cation takes place in a 35 ft tall pre engineered building, which would host a series of Reverse Osmosis (RO) and De-Mineralization (DM) units, compressors, and as well as boiling, evaporating and chilling units. The puri�ed product would then be evaporated to form liquid chicory, and this would further be evaporated in special spray drying machines to form coffee granules and coffee powder
In view of the above, the company approached SIDBI in order to avail a loan for setting up the plant that would be equipped with the latest energy ef�cient technology. The total project cost was around INR 6 crores (term loan from SIDBI for INR 3.8 crores and INR 0.2 crores as sub-debt).
18 Training Manual for Energy Ef�ciency Financing in India
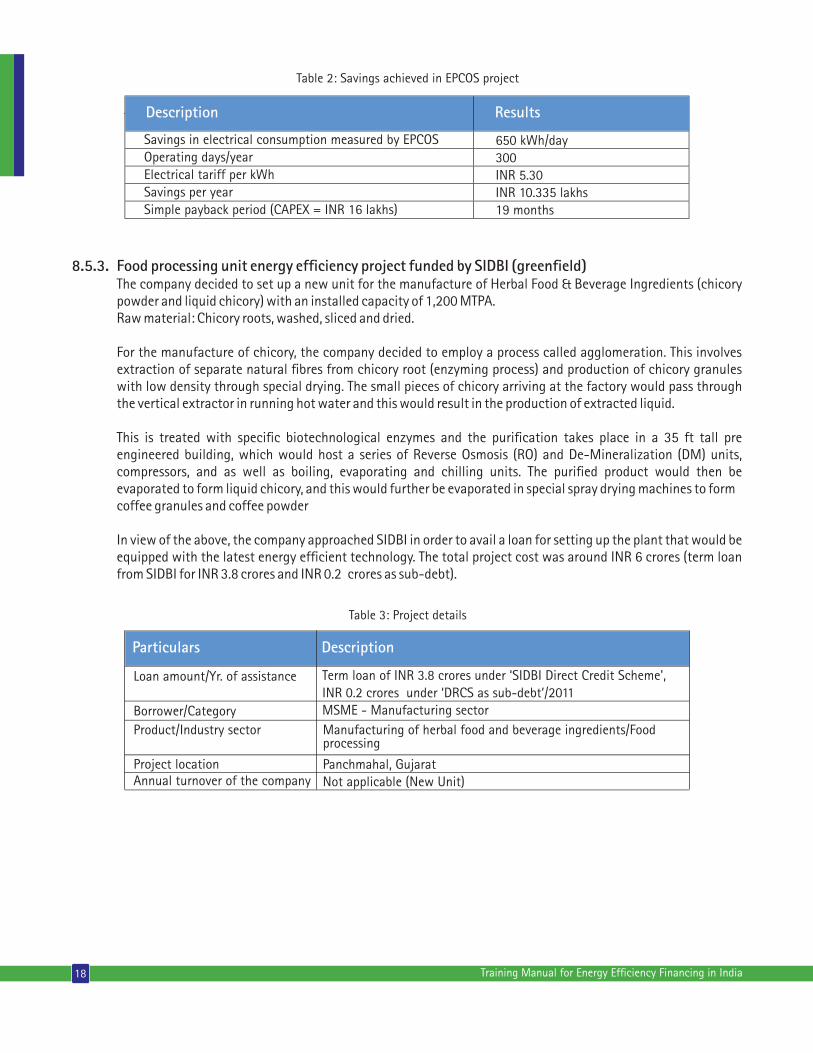
Description
Savings in electrical consumption measured by EPCOSOperating days/yearElectrical tariff per kWhSavings per yearSimple payback period (CAPEX = INR 16 lakhs)
650 kWh/day300INR 5.30INR 10.335 lakhs19 months
Results
Table 2: Savings achieved in EPCOS project
Particulars
Loan amount/Yr. of assistance
Borrower/CategoryProduct/Industry sector
Project locationAnnual turnover of the company
Term loan of INR 3.8 crores under ‘SIDBI Direct Credit Scheme',INR 0.2 crores under ‘DRCS as sub-debt’/2011MSME - Manufacturing sector Manufacturing of herbal food and beverage ingredients/Foodprocessing
Panchmahal, GujaratNot applicable (New Unit)
Description
Table 3: Project details
19Training Manual for Energy Ef�ciency Financing in India
9. Energy Services Market in India
Offering the complete range of energy services has been suggested as the solution to increasing the pace of adoption and implementation of energy ef�ciency projects in the country. ESCOs have made signi�cant contributions to the growth of energy ef�ciency business globally. Under the ESCO model, ESCOs provide a range of services, including energy analysis, design, installation, �nancing, and maintenance of the energy management and other technologies. ESCOs may also offer business and �nancing models under which customers effectively pay for the energy services from a portion of actual energy savings achieved. ESCOs receive payments based on demonstrable results (that satisfy the performance guarantees provided by the ESCO). In most ESCO models, a large part of the project risks are assumed by the ESCO.
Besides ESCOs, there are other energy service providers who provide a partial range of specialist services to industries and commercial establishments. These are:
• Energy auditors certi�ed by BEE can also provide services for implementation of energy ef�ciency projects • Equipment manufacturers and vendors can also provide ESCO services • Engineering �rms also extend their capabilities to provide performance contracting services • Contract energy management companies also provide ESCO services to implement energy ef�ciency projects
The growth rate of the ESCO market in India has been very slow. The ESCOs face several constraints in their operations, in obtaining �nances, besides facing credibility issues with clients. BEE has come forward with an empanelment scheme for ESCOs to promote energy ef�ciency through credible ESCOs. BEE has empanelled 125 ESCOs following a due process. An explanation of the different business models follows.
Host implementation: Many energy ef�ciency projects are implemented by the host itself based on recommendations by energy auditors for retro�ts or change of energy-using equipment. Financial commitments are made by the project host based on energy audit output. Some audit models also include a “success fee” for the auditor upon achievement of energy cost savings.
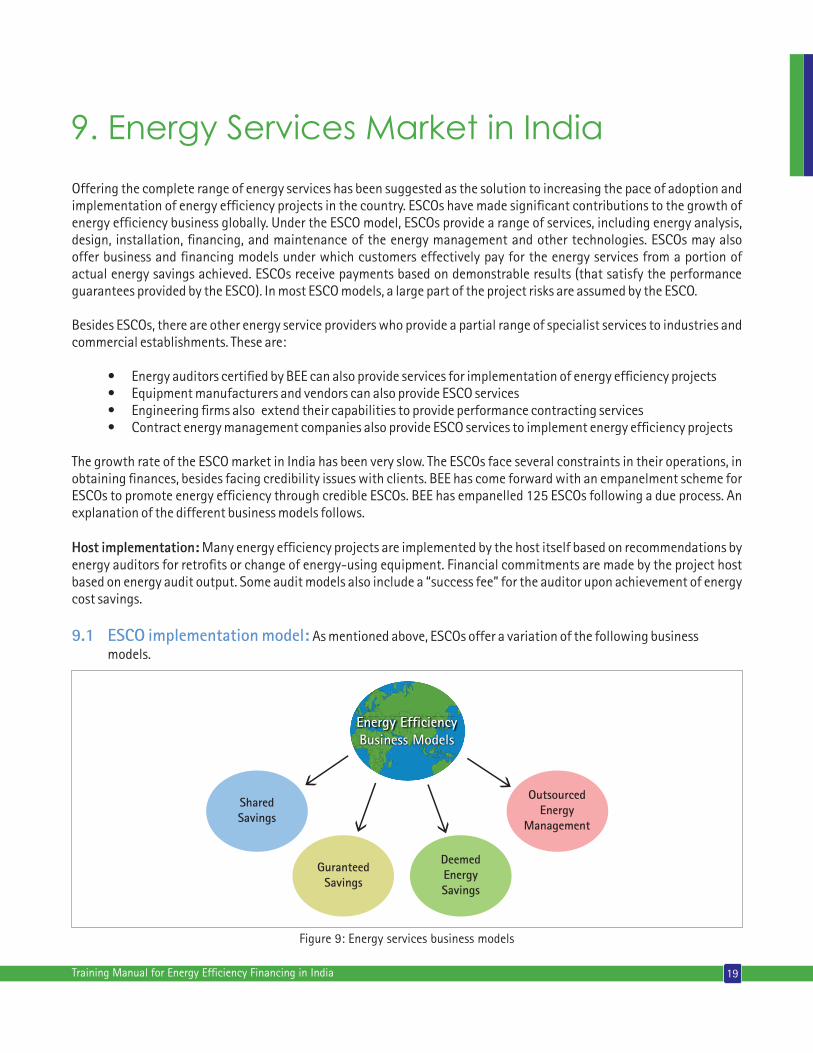
9.1 ESCO implementation model: As mentioned above, ESCOs offer a variation of the following business models.
SharedSavings
GuranteedSavings
DeemedEnergySavings
OutsourcedEnergy
Management
Energy Ef�ciency Business Models
Figure 9: Energy services business models
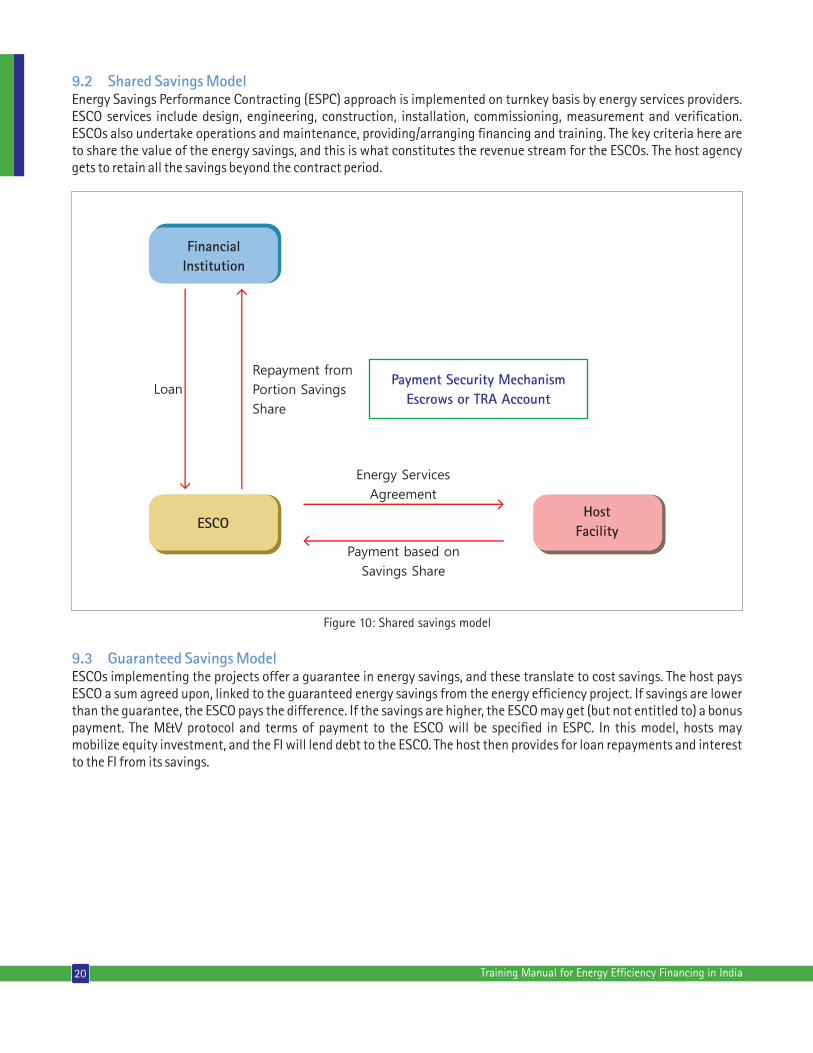
9.2 Shared Savings ModelEnergy Savings Performance Contracting (ESPC) approach is implemented on turnkey basis by energy services providers. ESCO services include design, engineering, construction, installation, commissioning, measurement and veri�cation. ESCOs also undertake operations and maintenance, providing/arranging �nancing and training. The key criteria here are to share the value of the energy savings, and this is what constitutes the revenue stream for the ESCOs. The host agency gets to retain all the savings beyond the contract period.
20 Training Manual for Energy Ef�ciency Financing in India
FinancialInstitution
ESCOHost
Facility
Loan
Repayment from
Portion Savings
Share
Energy Services
Agreement
Payment based on
Savings Share
Payment Security MechanismEscrows or TRA Account
Figure 10: Shared savings model
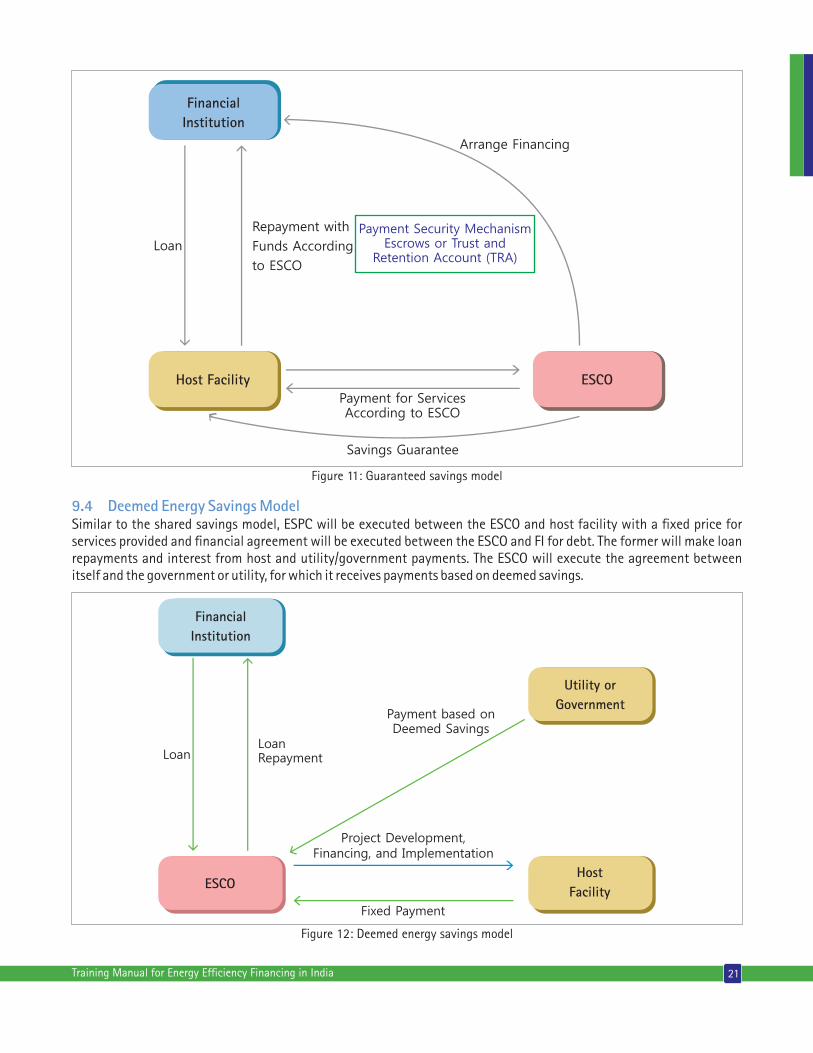
9.3 Guaranteed Savings ModelESCOs implementing the projects offer a guarantee in energy savings, and these translate to cost savings. The host pays ESCO a sum agreed upon, linked to the guaranteed energy savings from the energy ef�ciency project. If savings are lower than the guarantee, the ESCO pays the difference. If the savings are higher, the ESCO may get (but not entitled to) a bonus payment. The M&V protocol and terms of payment to the ESCO will be speci�ed in ESPC. In this model, hosts may mobilize equity investment, and the FI will lend debt to the ESCO. The host then provides for loan repayments and interest to the FI from its savings.
21Training Manual for Energy Ef�ciency Financing in India
Figure 11: Guaranteed savings model
9.4 Deemed Energy Savings ModelSimilar to the shared savings model, ESPC will be executed between the ESCO and host facility with a �xed price for services provided and �nancial agreement will be executed between the ESCO and FI for debt. The former will make loan repayments and interest from host and utility/government payments. The ESCO will execute the agreement between itself and the government or utility, for which it receives payments based on deemed savings.
FinancialInstitution
ESCOHost
Facility
LoanLoanRepayment
Project Development, Financing, and Implementation
Fixed Payment
Utility or Government
Payment based onDeemed Savings
Figure 12: Deemed energy savings model
FinancialInstitution
Host Facility ESCO
Loan
Repayment with
Funds According
to ESCO
Savings Guarantee
Payment for ServicesAccording to ESCO
Arrange Financing
Payment Security MechanismEscrows or Trust and
Retention Account (TRA)
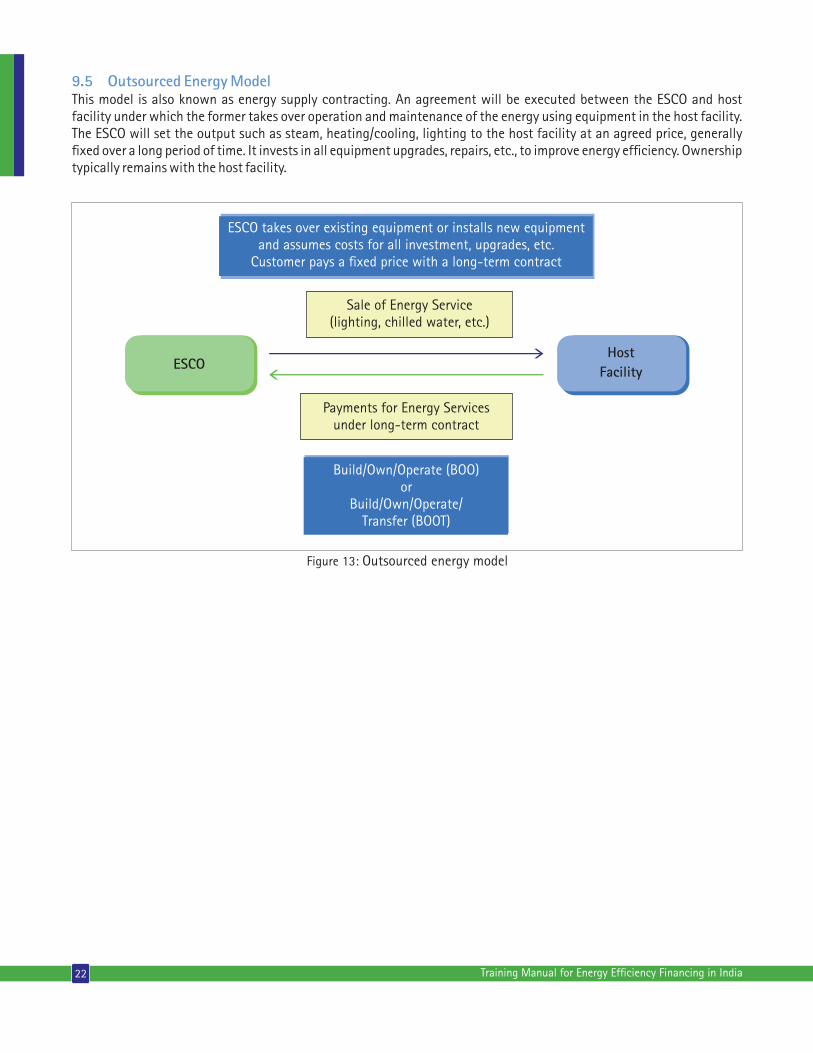
9.5 Outsourced Energy ModelThis model is also known as energy supply contracting. An agreement will be executed between the ESCO and host facility under which the former takes over operation and maintenance of the energy using equipment in the host facility. The ESCO will set the output such as steam, heating/cooling, lighting to the host facility at an agreed price, generally �xed over a long period of time. It invests in all equipment upgrades, repairs, etc., to improve energy ef�ciency. Ownership typically remains with the host facility.
22 Training Manual for Energy Ef�ciency Financing in India
Figure 13: Outsourced energy model
ESCO takes over existing equipment or installs new equipment and assumes costs for all investment, upgrades, etc.
Customer pays a �xed price with a long-term contract
Sale of Energy Service(lighting, chilled water, etc.)
Payments for Energy Services under long-term contract
ESCOHost
Facility
Build/Own/Operate (BOO)or
Build/Own/Operate/Transfer (BOOT)
23Training Manual for Energy Ef�ciency Financing in India
10. Structure of Energy Service Performance Contract
The following are the key components of the energy service performance contract (ESPC):
• Recitals – indicative listing of events/actions• De�nitions – meaning of terminologies• Covenants – agreements• Term – period• Scope of Work – a formal agreement document that speci�es all the details of a contract between a service provider (vendor) and the customer. It clearly documents the project requirements, milestones, deliverables, end products, documents and reports that are expected to be provided by the vendor• Facilities – project site or site(s)• Construction – action of building or implementing • Operation and Maintenance – refers to project operation and maintenance• Financing and ownership of assets – �nancing (debt/equity) details and ownership details• Energy Savings – terms related to energy savings• Billing and payment – details on billing of energy/heat savings and payment• Transfer of �nanced assets – Terms on transferring assets and settlement between ESCO and host after loan repayment period• Force Majeure, Events of Default & Termination: unforeseeable circumstances that prevent someone from ful�lling a contract. Also on terms on events that trigger default and way out rules for termination• Dispute Resolution – processes briefed to resolve disputes between parties• Insurance – an arrangement by which a company or the state undertakes to provide a guarantee of compensation for speci�ed loss, damage, in return for payment of a speci�ed premium• Technical Matters – related to technical process on savings, equipment, warranty, etc.,• Measurement and Veri�cation process and steps should be mentioned in ESPC

Project Appraisal:
Technical and Financial
Part 2
11. Introduction to Energy Efciency Projects Appraisal
Energy ef�ciency �nancing has been identi�ed as a key constraint in achieving the potential of energy ef�ciency.BEE, under the NMEEE, has framed the EEFP for identi�cation of schemes that would assist end-users and the nation in getting the bene�ts from reduced energy consumption.
Certain key considerations are essential for increasing �nancing for energy ef�ciency projects. These include:
Strengthening technical competenciesEnd-users, service providers, and FIs need to strengthen their competencies on understanding bene�ts of energy ef�ciency, knowledge of energy ef�ciency technologies, and the process of carrying out analysis to establish �nancial viability. With rapid advancement of technologies, there is a need to keep updated on the developments and to be able to identify the role for these technologies in their facilities.
Evolving technical appraisal techniques for energy ef�ciency projectsWhile conventional �nancial calculations are to be carried out to ensure that debt servicing can be satis�ed, there is a need for evolving speci�c technical appraisal methods for different types of energy ef�ciency projects. For instance, energy savings have to be calculated using a before and after scenario, and variations in energy consumption can occur if there is a change in the basic consumption parameters.
Adopting the cash �ow approach for �nancingTraditional �nancing has been based on balance sheet approach, where the strength of the borrower’s balance sheet is crucial to lending decisions, and is not so much dependent on the internal rate of return (IRR) or payback of the project per se.
Adapting �nancing mechanisms to energy ef�ciency business modelsEnergy ef�ciency projects are implemented either using internal resources, or through borrowing from FIs. Energy ef�ciency projects can also be implemented through the ESCO model, either through the guaranteed performance or energy shared savings models. In the second instance, there is an agreement between the client and ESCO on realization of energy savings, and resultant cost savings. This needs to be clearly understood, before analysis can begin.
Devising sound payment and security structuresFIs insist on security for their loans; their fundamental principle is to get adequate security for them to recover their loans, in case there is a default.
Standardizing energy services agreementsThe ESCO model has been claimed as having the potential to change the market for energy ef�ciency projects. However, there has been limited progress, mainly due to the inherent risks in this model, primary being the agreements between the client and the ESCO that links payments to energy savings achieved.
26 Training Manual for Energy Ef�ciency Financing in India
27Training Manual for Energy Ef�ciency Financing in India
11.1 General framework in project appraisal for energy ef�ciency projectsFis have their own well-established process for appraising projects. They have enormous experience in �nancing the traditional way – through assessing balance sheets, potential increase in cash �ows, and calculations on increased pro�tability due to the project being implemented. The projects are generally manufacturing or retail level projects that relate to establishment of new units, expansion in existing units, and modernizing plant and equipment. Energy ef�ciency is not a category with which the FIs are familiar with.
The appraisal process comprises the following.
a) Promoter appraisal: The promoter could be host or facility owner or ESCO. The �nancial strength of the promoter is of prime importance, considering that personal guarantees are a normal requirement in most �nancing agreements. If ESCO is the project promoter, then the promoter of ESCO will be appraised.
b) Technical appraisal: The technical feasibility of the project is to be assessed. Factors in this step include the use of the same or similar technologies by others in the industry, publicly available information on customer certi�cates, and test reports by reputed laboratories and standards institutions. Also relevant is the appropriateness of the technologies being installed for the customer’s enterprise.
c) Financial appraisal: Ultimately, the FI has to recover the loans in the enterprise. Thus, calculations are carried out to establish the impact of the present �nancing on overall enterprise operations, on increase in revenues, possible reductions in costs, and the overall impact on bottom-line. Important parameters such as debt service coverage ratio (DSCR), internal rate of return (IRR) and payback are calculated for different scenarios. Based on the various numbers, FIs then assign a credit rating score to the borrower for the speci�c loan, and a �nal decision is made on go-/no-go for �nancing the enterprise, and of course the interest rate for the loan.
d) Environmental appraisal: All projects require an environmental impact assessment (EIA) to ensure that the activities do not impose negative impacts due to various discharges in the atmosphere, or into existing waste streams. Mitigation measures have to be identi�ed and they should con�rm that the existing standards for various environment parameters are not exceeded by the current activity.
e) ESCO appraisal: If the project is being implemented through an ESCO, then there is perhaps a need for assessing the capability of the ESCO to be able to implement the project. The revenue sharing agreements would also come under review, since this is what will ensure that cost savings occur and revenue streams will increase due to the project. In addition, the promoter of the ESCO will be separately appraised.
Risk identi�cation, assessment and mitigationThe various calculations undertaken to establish cost savings, IRR and other �nancial parameters, need to be re-done for different scenarios, to determine their impact on the technical and �nancial parameters. In case some of the risks identi�ed have a signi�cantly negative impact on the project viability, there is a need to address these risks through appropriate mitigation measures. Scenarios could include a drop in savings, delays in commissioning, and other such factors.
12. Considerations in Project Appraisal
28 Training Manual for Energy Ef�ciency Financing in India
Project appraisal has a number of components, primary being technical and �nancial appraisal of the project, appraisal of the promoter and their contribution to the �nancing share, risk assessments, and other such aspects.
Who is the Borrower - Project Host or ESCO?The project can be implemented either through the host enterprise themselves, or through the ESCO. In the case of the latter, there would be certain additional documentation requirement, in addition to the balance sheet and income expenditure statements. The additional documentation relate to experience of the ESCO on implementation capabilities, and �nancial security mechanisms.
What is the structure of payment obligation? There are different structures for payment obligations. These could be: • Fixed, pre-established • Variable, performance-based
If performance-based, what is the method for measuring/calculating performance/savings? • Measurement & veri�cation procedures • Changes to the “baseline” • Energy price risks • Other factors in�uencing savings
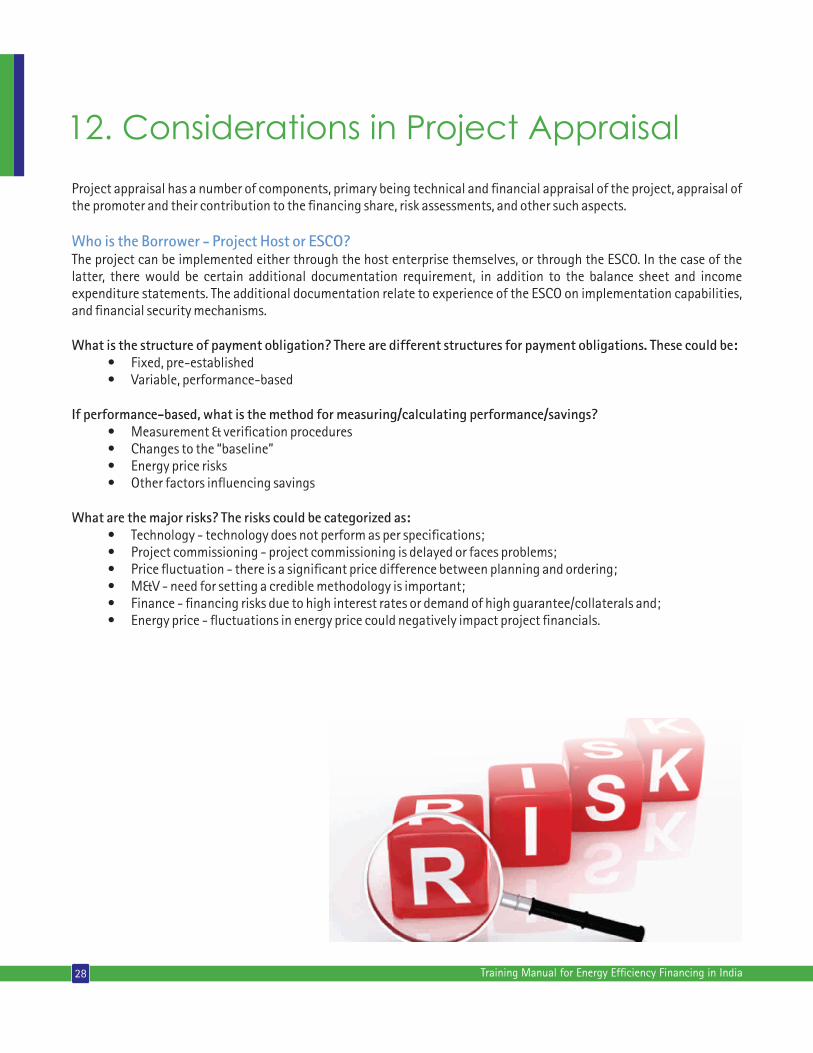
What are the major risks? The risks could be categorized as: • Technology - technology does not perform as per speci�cations; • Project commissioning - project commissioning is delayed or faces problems; • Price �uctuation - there is a signi�cant price difference between planning and ordering; • M&V - need for setting a credible methodology is important; • Finance - �nancing risks due to high interest rates or demand of high guarantee/collaterals and; • Energy price - �uctuations in energy price could negatively impact project �nancials.
29Training Manual for Energy Ef�ciency Financing in India
13. Technical Appraisal
This is the �rst step in the overall assessment process. Some of the key questions to be assessed are:
Are the technologies/products proven?Under this head, an evaluation of the products and technologies are assessed in terms of the credibility of the technologies, number of suppliers, purchaser experiences, reliability of the technologies, and availability of after-sales service facilities, among others.
Who has developed the savings estimates?It is important to assess the method of savings calculation procedures, including if there has been any independent veri�cation of the savings. Also, it is important to note if there are any user certi�cates on the savings realized. One of the key issues is: are the savings estimates realistic?
Are there any factors that may impact the savings?There are a number of factors that could impact the actual savings. These generally include variations in load factors, changes in production patterns, and variations in fuel supply composition, apart from supply �uctuations. An analysis is to be carried out for these risks and uncertainties as it impacts on the savings estimates and project implementation plan.
Table 4: Key technical appraisal
Source
DPR or Investment Grade Audit Report • Project technical details• Baseline energy consumption parameters• Procedure for measurement of savings• Project economics
To refer
• Energy ef�ciency of the technology widely known – e.g. international or national certi�ed• Supplier track record• Auditor recommendation of similar technologies in the past
Technology/Equipment
• Ease of operating and maintaining the equipment• Any specialized training required on O&M of energy ef�ciency equipment
Operations and Maintenance
Table 5: Some proven technologies deployed across industries
Industry
Aluminium • Variable frequency drive for spent liquor pump feeding to evaporator • Thermo-compressor and recover �ash steam from pure condensate tank in evaporator section • Seal pot system for condensate recovery optimize excess O in kiln2
by continuous monitoring • Replace old horizontal stud soderberg (hss) cells with modern point feeder prebake cells
Energy ef�ciency measures
30 Training Manual for Energy Ef�ciency Financing in India
Caustic Chloride Industry • Variable frequency drive (VFD) with close feedback control in order to avoid valve throttling• Replace steam ejector with water ring vacuum pump for brine dechlorination• Installation of thermo compressor and utilize �ash steam in the I-Effect heat exchanger• Install commercial cogeneration system for caustic chlorine industry• Conversion of mercury cell-based plant to membrane cell-based plant
Cement Industry • Installation of high ef�ciency dynamic separator for raw mill• Replacement of the air-life with bucket elevator for raw-meal transport to the silo• Replacement of existing cyclones with low pressure drop cyclones• Install a high level control system for kiln operation• Variable speed �uid coupling for cooler ID fan and replacement with lower capacity motor• Replacement of existing cooler I grate with high ef�ciency cooler system• Installation of low primary air burner in place of existing conventional burners
Copper Smelter • Reduction of idle running hours of feed conveyors by automation• Installation of correct size pump for slag granulation pump/cooling tower pump• Utilize the heat of smelter furnace exhaust gases to preheat the blower air• Install waste heat recovery system for anode furnace exhaust and utilize to preheat combustion air• Installation of variable speed drive for smelting furnace induced draught fan• Installation of variable �uid coupling for convertor plant ID fan• Installation of variable frequency drive for lime recirculation at scrubber exhaust system of anode furnace burners
Ceramic Industry • Installation of automatic interlock between the brushing dust collection blowers and the glazing lines• Operating the Vertical Shaft Kiln (VSK) exhaust fan with damper control and avoid air in�ltration• Improve combustion ef�ciency of VSK by optimizing excess air levels• Arresting air in�ltration in spray drier system• Replacement of LPG with diesel �ring in the spry drier• Reducing of idle operation of hydraulic press pump by installing suitable interlocks

31Training Manual for Energy Ef�ciency Financing in India
14. Technical Risk Assessment and Mitigation
14.1 Risk Assessment and MitigationFour types of risks are associated with energy ef�ciency project implementation: 1. Technical Risk 2. Financial Risk 3. Commissioning Risk 4. Performance Risk
1. Technical Risk: Technical risks are due to the following: 1. Imported technologies with unproven expertise in the country for operation and management 2. Relatively new technology 3. Seasonal variation – such as for biomass cogeneration
2. Financial Risk: 1. Details on �nancial risk are mentioned in the “Financial Appraisal” section
3. Commissioning Risk: 1. Lack of project management, limited or no construction and commissioning experience 2. Delay in acquiring licenses and approvals to implement energy ef�ciency projects 4. Performance Risk: 1. Lack of training in M&V 2. Lack of resource for executing M&V
14.2 Risk Mitigation 1. Assessing and Mitigation of Technical Risk a) Con�rm that the products, equipment and/or technologies are well-established and proven; review industrial benchmark and existing benchmark for the technology adopted b) Review and assess prior experience of the implementing organizations with the technologies, equipment and products being proposed c) Verify credentials of the energy auditors who have prepared the audit reports and technical estimates of savings d) Assure that project meets the appropriate design standards speci�cations e) Obtain client references, where appropriate, for similar project implementations f) Use of contractors that guarantee their performance and offer �xed prices
2. Assessing and Mitigation of Commissioning Risk a) Verify experience of project management and construction management organizations and individuals deployed in O&M b) Assure that suf�cient time has been allocated for permits and licenses c) Verify ESCO’s track record in implementing projects on time d) Use lump-sum contracts with penalty clauses for failure to meet committed deadlines
32 Training Manual for Energy Ef�ciency Financing in India
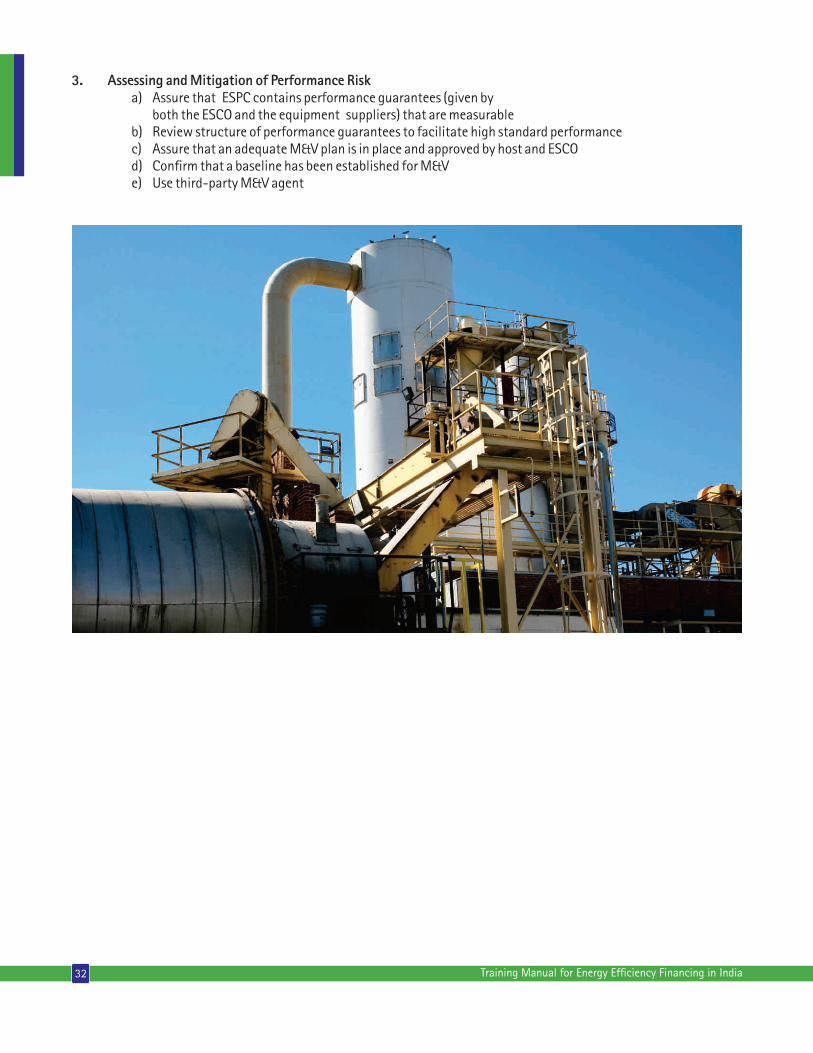
3. Assessing and Mitigation of Performance Risk a) Assure that ESPC contains performance guarantees (given by both the ESCO and the equipment suppliers) that are measurable b) Review structure of performance guarantees to facilitate high standard performance c) Assure that an adequate M&V plan is in place and approved by host and ESCO d) Con�rm that a baseline has been established for M&V e) Use third-party M&V agent
33Training Manual for Energy Ef�ciency Financing in India
15. Financial Appraisal
After the technical appraisal, this is the next step that will lead to a credit rating according to the internal processes of the FI. Financial appraisal should be exhaustive for the project per se, following which the overall �nancials of the enterprise are assessed. This appraisal of the project should include an assessment of:
• Project development costs • Project capital costs • Operating and maintenance costs • Energy cost savings • Other cost savings • Escalation factors • Financial structure • Promoter (Facility owner/ESCO) equity investment • Sharing of savings between host and ESCO
Based on the above costing, various standard calculations are undertaken to arrive at simple payback, discounted payback, �nancial IRR, DSCR and other such ratios. The FI then, using internal criteria for risk assessment and credit rating, assigns overall scores and recommends the project for �nancing with appropriate interest rates and other conditionalities.
Table 6: Key elements in �nancial appraisal
Key Element in Appraisal Description
Does the borrower plan clearly de�ne �nancial parameters like: • Source of Equity • IRR • NPV - Net Present Value• Cash �ow • DSCR (average and minimum) • Debt-equity Ratio • Payback Period • Interest Coverage Ratio
Does the proposal clearly de�ne various projects costs required fordecision making:• Development Costs• O&M Costs • Capital Costs • Energy Cost Savings
Do the �nancial parameters allow for �nancing the project as perbank/FI guidelines?
Project Costs
Financial Returns
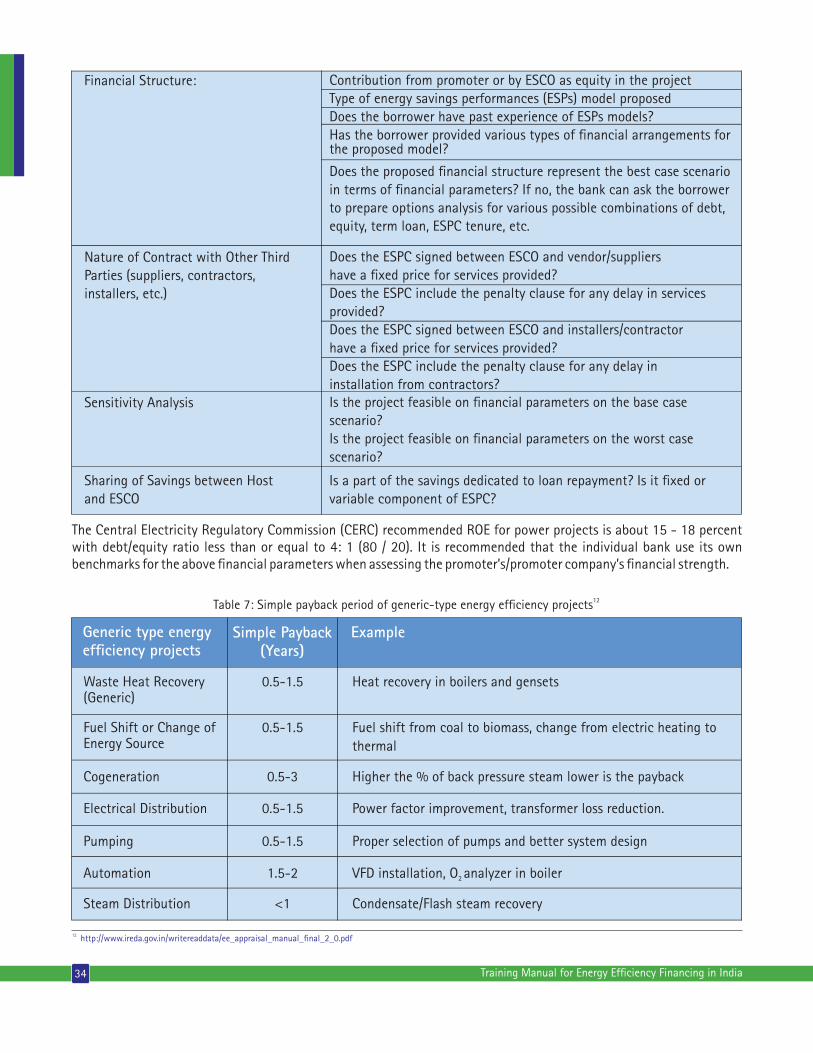
34 Training Manual for Energy Ef�ciency Financing in India
Contribution from promoter or by ESCO as equity in the project Type of energy savings performances (ESPs) model proposedDoes the borrower have past experience of ESPs models? Has the borrower provided various types of �nancial arrangements forthe proposed model?
Does the proposed �nancial structure represent the best case scenario in terms of �nancial parameters? If no, the bank can ask the borrower to prepare options analysis for various possible combinations of debt, equity, term loan, ESPC tenure, etc.
Financial Structure:
Does the ESPC signed between ESCO and vendor/suppliers have a �xed price for services provided?Does the ESPC include the penalty clause for any delay in servicesprovided? Does the ESPC signed between ESCO and installers/contractor have a �xed price for services provided? Does the ESPC include the penalty clause for any delay in installation from contractors?
Is a part of the savings dedicated to loan repayment? Is it �xed orvariable component of ESPC?
Nature of Contract with Other ThirdParties (suppliers, contractors,installers, etc.)
Is the project feasible on �nancial parameters on the base casescenario?Is the project feasible on �nancial parameters on the worst casescenario?
Sensitivity Analysis
Sharing of Savings between Hostand ESCO
The Central Electricity Regulatory Commission (CERC) recommended ROE for power projects is about 15 - 18 percent with debt/equity ratio less than or equal to 4: 1 (80 / 20). It is recommended that the individual bank use its own benchmarks for the above �nancial parameters when assessing the promoter’s/promoter company’s �nancial strength.
12Table 7: Simple payback period of generic-type energy ef�ciency projects
Generic type energyef�ciency projects
Simple Payback(Years)
Example
Waste Heat Recovery(Generic)
Fuel Shift or Change of Energy Source
Cogeneration
Electrical Distribution
Pumping
Automation
Steam Distribution
Heat recovery in boilers and gensets
Fuel shift from coal to biomass, change from electric heating to thermal
Higher the % of back pressure steam lower is the payback
Power factor improvement, transformer loss reduction.
Proper selection of pumps and better system design
VFD installation, O analyzer in boiler2
Condensate/Flash steam recovery
0.5-1.5
0.5-1.5
0.5-3
0.5-1.5
0.5-1.5
1.5-2
<1
12 http://www.ireda.gov.in/writereaddata/ee_appraisal_manual_�nal_2_0.pdf

Compressors
Energy Ef�cient Motors
Lighting
Change from reciprocating to screw or centrifugal chiller, matching of demand and generation parameters
Induction motors in commercial buildings and manufacturing facilities
Fixing LED in street lighting; industries; and government, commercial and residential buildings
0.5-2
0.25-1
0.5-2
(Source: IREDA Manual)
35Training Manual for Energy Ef�ciency Financing in India
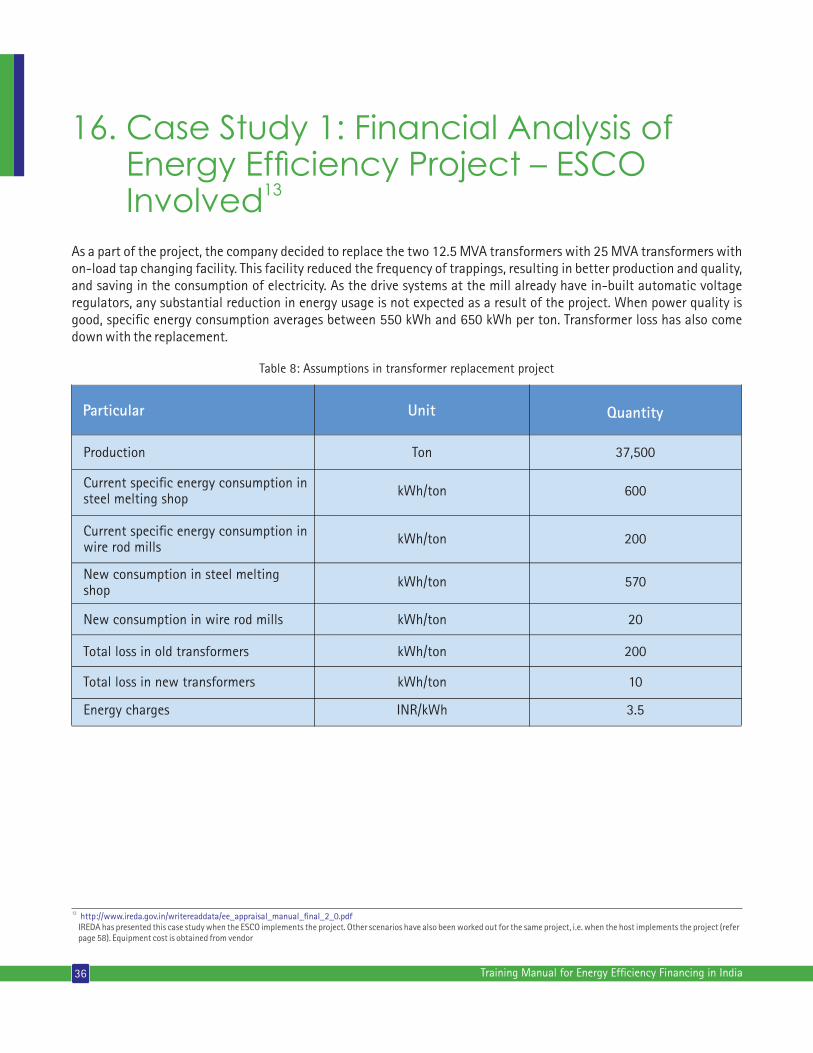
16. Case Study 1: Financial Analysis of Energy Efciency Project – ESCO
13 Involved
As a part of the project, the company decided to replace the two 12.5 MVA transformers with 25 MVA transformers with on-load tap changing facility. This facility reduced the frequency of trappings, resulting in better production and quality, and saving in the consumption of electricity. As the drive systems at the mill already have in-built automatic voltage regulators, any substantial reduction in energy usage is not expected as a result of the project. When power quality is good, speci�c energy consumption averages between 550 kWh and 650 kWh per ton. Transformer loss has also come down with the replacement.
Table 8: Assumptions in transformer replacement project
Particular Unit
Production
Current speci�c energy consumption in steel melting shop
Current speci�c energy consumption in wire rod mills
New consumption in steel melting shop
New consumption in wire rod mills
Total loss in old transformers
Total loss in new transformers
Energy charges
Ton
kWh/ton
kWh/ton
kWh/ton
kWh/ton
kWh/ton
kWh/ton
INR/kWh
Quantity
37,500
600
200
570
200
20
10
3.5
13 http://www.ireda.gov.in/writereaddata/ee_appraisal_manual_�nal_2_0.pdf IREDA has presented this case study when the ESCO implements the project. Other scenarios have also been worked out for the same project, i.e. when the host implements the project (refer page 58). Equipment cost is obtained from vendor
36 Training Manual for Energy Ef�ciency Financing in India
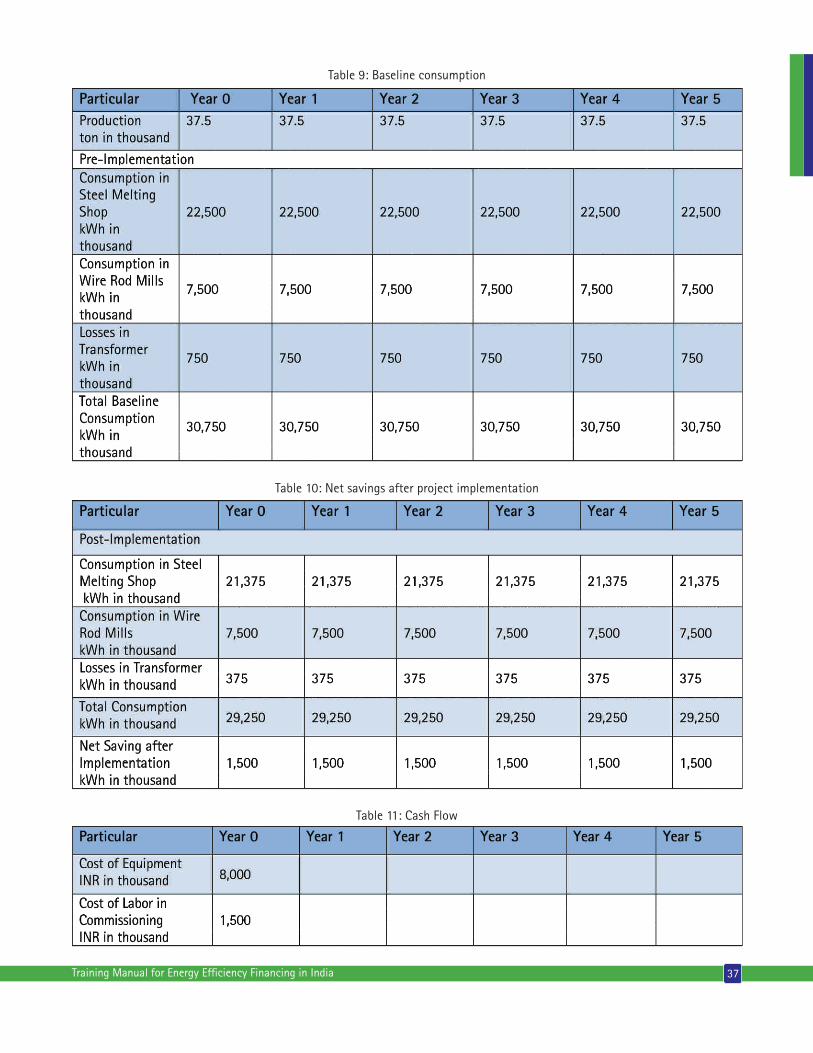
Table 9: Baseline consumption
37Training Manual for Energy Ef�ciency Financing in India
Table 10: Net savings after project implementation
Table 11: Cash Flow
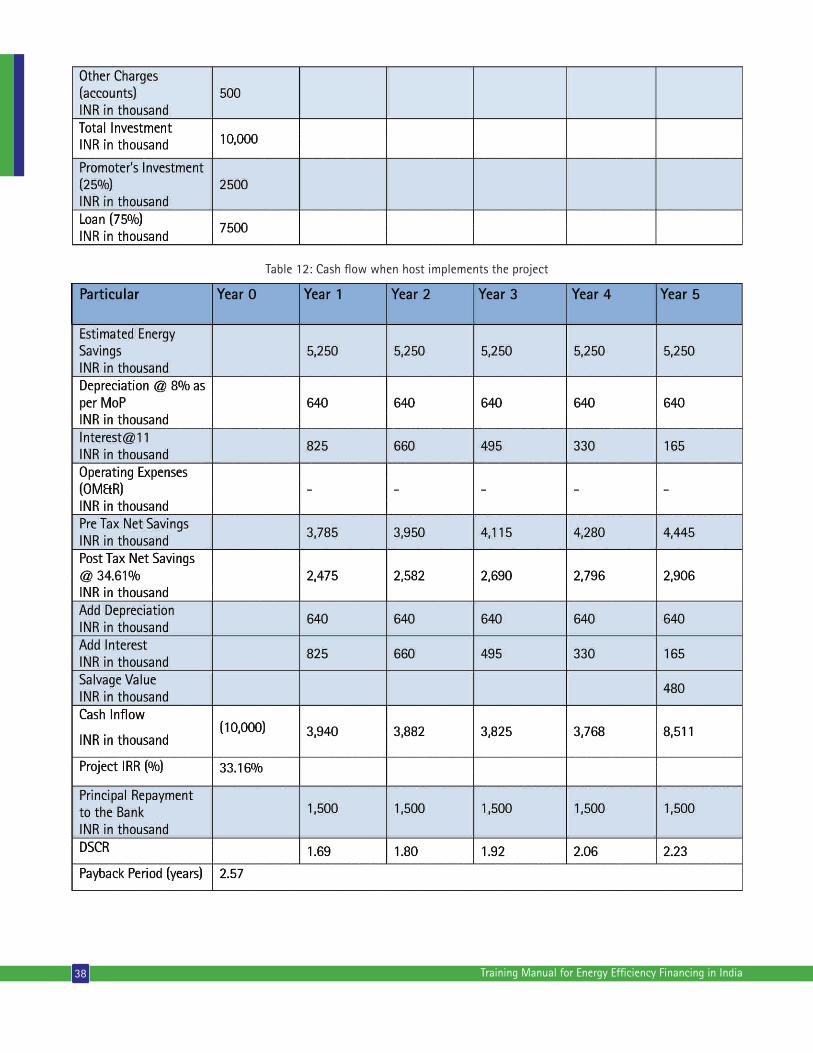
Table 12: Cash �ow when host implements the project
38 Training Manual for Energy Ef�ciency Financing in India
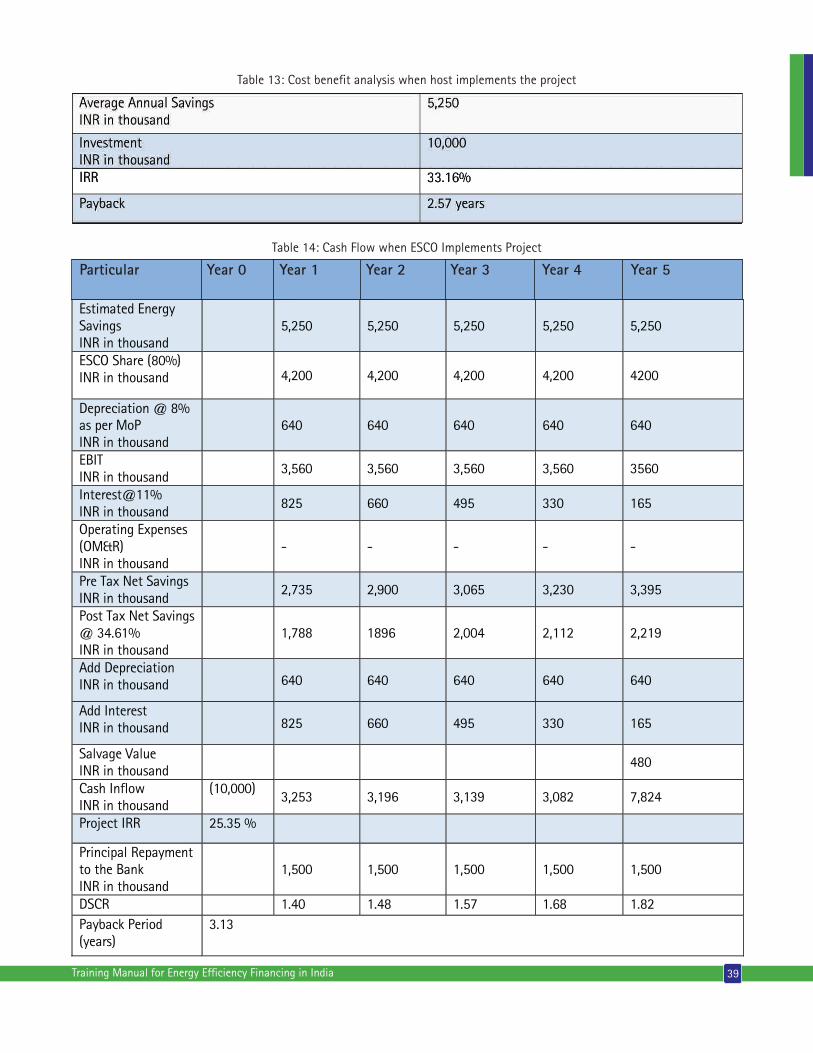
Table 13: Cost bene�t analysis when host implements the project
Table 14: Cash Flow when ESCO Implements Project
39Training Manual for Energy Ef�ciency Financing in India
Estimated Energy Savings INR in thousand
5,250 5,250 5,250 5,250 5,250
ESCO Share (80%) INR in thousand
4,200 4,200 4,200 4,200 4200
Depreciation @ 8% as per MoP INR in thousand
640 640 640 640 640
EBIT INR in thousand
3,560 3,560 3,560 3,560 3560
Interest@11% INR in thousand
825 660 495 330 165
Operating Expenses (OM&R) INR in thousand
- - - - -
Pre Tax Net Savings INR in thousand
2,735 2,900 3,065 3,230 3,395
Post Tax Net Savings @ 34.61% INR in thousand
1,788 1896 2,004 2,112 2,219
Add Depreciation INR in thousand
640 640 640 640 640
Add Interest INR in thousand 825 660 495 330 165
Salvage Value INR in thousand
480
Cash Inflow INR in thousand
(10,000) 3,253 3,196 3,139 3,082 7,824
Project IRR 25.35 %
Principal Repayment to the Bank INR in thousand
1,500 1,500 1,500 1,500 1,500
DSCR 1.40 1.48 1.57 1.68 1.82 Payback Period (years)
3.13
�
Particular Year 0 Year 1 Year 2 Year 5Year 3 Year 4
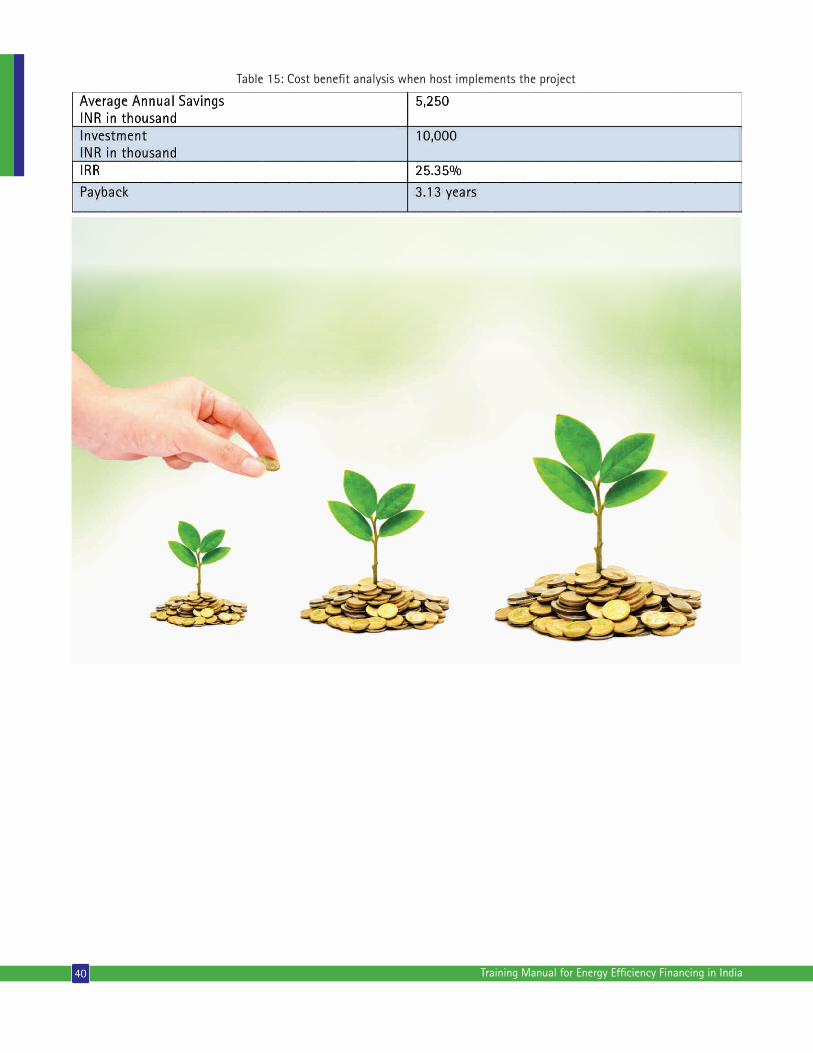
Table 15: Cost bene�t analysis when host implements the project
40 Training Manual for Energy Ef�ciency Financing in India
17. Loan Security Considerations
FIs have a number of considerations before the loan is approved and disbursed. For energy ef�ciency, some of the considerations are given below.
Most energy ef�ciency equipment has low collateral value- Unless the energy ef�ciency project relates to major refurbishments, or modernization, most energy ef�ciency projects are about replacing different equipment, such as motors, compressors, VFDs, etc., which have low collateral value. Recovering the loan through acquiring and sale of the asset may not yield much in terms of recoveries.
Equipment cost typically is 60-65 percent of total project cost- Of the total project cost, the soft costs of commissioning, M&V and other costs constitute about 30-40 percent. Thus, collateral from equipment costs alone will not be adequate for recovering the loan, in case of default.
Equipment generally uneconomical to remove and use elsewhere- The equipment, if taken out of the enterprise, is generally not accepted by any other enterprise for use, and has very little re-sale or recovery value.
Generally, FIs move towards taking �rst charge on the project equipment, and if the value of the equipment as assessed falls short of the security amount, then additional security is taken from other assets which are not mortgaged to any other loan. This is because, the total value of the equipment is not just the cost of the equipment, but also includes commissioning and other costs, for which the loan is taken. FIs normally take 60-75 percent of the total cost of the equipment, including commissioning and other costs for security purposes.
17.1 Loan Security-ESCO as BorrowerWhen the loan is given to the ESCO, there is additional documentation that may be required for ensuring that there is a continuous in�ow of revenues from the energy savings sharing agreements, and that there is no delay or default in the payments from the client in whose premises the equipment is installed. Copies of the revenue sharing agreements are crucial to this step. Also important are the clauses that relate to how defaults in payment will be sorted out and the legal or other remedies that are planned for.
FIs have standard procedures to establish if the borrower is or will have reasonable cash �ows to repay the debt that is given. This includes security on the equipment, looking at future cash �ow streams and considering escrow accounts into which cash �ows will �ow in as �rst charge on revenues and other such documentation. Taking additional protection from credit guarantee schemes is an added way to ensure defaults are covered, at least in part.
In energy ef�ciency project �nancing, M&V becomes very crucial in establishing savings and thus the revenue streams that are expected. Also required are clear-cut mechanisms for resolving disputes and defaults in payments, which are generally taken through arbitration, and if not successful, then of course, the much avoidable litigation.
17.2 Strengthening Financial Capacity of Borrowers • Are they well-capitalized? It is essential to have analysis of the balance sheet of the borrower to understand whether the company is equipped enough to bear capital expenses even during drastic circumstances. • Do they have parental company support or private equity/external investors on board? If the present project application is �nancially not stable, is there any possibility to bring external investors or to have support from parental company or private equity?
41Training Manual for Energy Ef�ciency Financing in India
• Do they have well de�ned cash in�ow sources? Analysis on cash �ows is important to understand revenue pattern of the company. • What is their �nancial capacity to meet time delays and cost overruns? This is to understand the company’s preparedness in case of time delays in commissioning and cost overruns during project construction phase. • Is the �nancial plan adequate to address both project and working capital needs? It is important to understand the company’s �nancial plan, and whether the current practice can address both project and working capital requirements. • How can the lender minimize recourse to non-project assets & personal guarantees?
17.3 Devise Payment and Security StructuresPayment and security structures should be devised to address the following: • To securitize or escrow cash in�ows to service debt. • To ensure suitable tri-partite contractual protection for performance and payments through ESPC. • Lender should ensure ESPC or tri-partite contractual protection is in place for performance and payments. • Follow best practices from equivalent bank asset products (e.g. rental securitization, power projects). • Take risk coverage from partial risk guarantee facilities available in India such as PRGFEE, PRSF, etc.
42 Training Manual for Energy Ef�ciency Financing in India
18. Establishing Energy Efciency Business Units18.1 Functions of an Energy Ef�ciency Business Unit • Identify the target market characteristics: To identify market characteristics, potential study of energy ef�ciency market with technologies currently in demand, etc.
• De�ne typical project characteristics: Typical project characteristics for each technology type should be de�ned for smooth facilitation of loan applications.
• Develop innovative �nancial products for the market: To identify and develop �nancial products to promote energy ef�ciency projects based on technology.
• Facilitate the development of a pipeline of attractive projects with creditworthy customers: To generate pipeline of projects with technologies that are currently in demand with creditworthy customers will accelerate penetration of energy ef�ciency projects.
• Design and implement a plan for marketing, project investment preparation, and market aggregation: To have concept paper and implementation plan ready for marketing, investment, etc., will increase investment in energy ef�ciency projects.
• Develop project appraisal guidelines and procedures: Development of project appraisal guidelines and procedures to evaluate energy ef�ciency loan applications and standardization will reduce time consumption in evaluation, which will accelerate investment in energy ef�ciency projects.
• To provide technical assistance to loan of�cers by organizing workshops, seminars, etc.
18.2 For Developing Financial ProductsCredit characteristics such as deal size, economics and security package should be considered. It is also important to de�ne loan offer(s) based on term, pricing, and required security structure, with guarantee. In addition, it is critical to analyze required parameters such as size of project, equity proportion and legal documents to develop and customize �nancial products for energy ef�ciency projects.
18.3 Customizing Financial ProductsCustomized �nancial products can be considered for development for different technology streams since the energy savings characteristics are quite different for each technology stream.
• Waste heat recovery and cogeneration • Lighting, cooling and controls for buildings (particularly hotels, hospitals and shopping malls) • Motors, pumps, etc. in industrial facilities • Street lighting • Municipal pumping
43Training Manual for Energy Ef�ciency Financing in India
• Off-grid renewable energy projects • Fuel substitution in industry • Outsourced energy management
18.4 Working with ESCOs • Establish relationships with quali�ed and BEE-accredited ESCOs and equipment vendors. • To assess capabilities and experience based on services/products offered; business methods, target end-user market and customer pro�le, reference projects & current pipeline. This will enable loan of�cers to understand �nancing needs and capital demand. • Select initial companies and projects to prepare for investment: provide �nance structuring assistance and plan for further scale up. • Structure multi-project �nance facilities to reduce transaction costs.
18.5 Vendor Finance ProgramsEstablish relationship with equipment vendor(s) or manufacturer(s): Vendor offers deal pipeline to lender/lessor. Financing of projects can be marketed at point of equipment sale. Since vendor is aware of clientele, end-user credit screening and analysis process can be facilitated by vendor on behalf of lender. Vendors can help process loan/lease transaction and absorb some transaction costs. Vendor may act as lessor and match primary lease with assignment or sale/lease back with bank.
18.6 Establishing Credit Line with ESCOsEstablishing credit line with ESCOs to extend credit facility for �nancing current and future projects. This will provide an opportunity to revolve credit line based on signed contracts with customers. Drawdown conditions based on expected project costs and cash �ows can be worked out with ESCOs. Lenders can also seek suggestions from ESCOs on specifying project economic parameters such as project size, debt/equity ratio, debt service coverage, sharing of savings, etc. Security could be combination of ESCO balance sheet, parent organization, and project cash �ows.
For Master Loan Terms, the following procedures should be structured: • Standard origination procedures • Lender evaluates and approves end-user credit • Standard sub-loan documentation • Recourse to ESCO and to ESCO parent (if applicable) • Construction �nance; disbursement procedures • Pricing and fees
For Security Requirements, the following procedures should be structured: 1. To assign values for project assets, contract rights and revenues 2. To analyze project �ow of funds; escrow account and prioritize payments 3. To analyze debt service reserve considerations 4. To understand other recourse and collateral end-user credit standards 5. To check cross default provisions between projects
18.7 Environmental and Legal AppraisalThis is an important component of the appraisal process. At this stage, steps are taken to assess if there is any negative impact of the project implementation, including any discharges to the environment in the form of solid wastes and liquid wastes. Any issues relating to disposal of the waste materials of existing technologies are also to be considered. It is possible that the present technology may end up as second-hand equipment with another enterprise. Under the head ‘legal’, all necessary documentation that has to be submitted to various government agencies such as pollution control departments; Ministry of Environment, Forest and Climate Change, state governments; etc., are to be attached.
44 Training Manual for Energy Ef�ciency Financing in India

18.8 Financial Risk Assessment and MitigationRisk assessment and strategies for risk mitigation are important components of the �nancial appraisal process. Between the times the audit is carried out and the DPR prepared, and when equipment is ordered after following a tendering process, there are changes in the operating environment, which need to be taken into account before the energy ef�ciency �nancing is taken and the project actually goes through implementation. The risk assessment process should cover whether:
• Technical risk of the equipment or technology can be integrated with the other systems and can deliver output in a reliable manner; • Performance risk, when the technology does not deliver what was promised in terms of energy savings; • Commissioning risk- problems in commissioning the equipment could include integrating the equipment with the rest of the equipment; and • Financial risk in terms of changes in equipment prices/energy prices not impacting the �nancials of the project negatively.
In addition, risk assessment should cover: • Creditworthiness of both the host and the ESCO • Examine the ESPC and ensure that it has adequate assurance for cash �ows that will be used to repay the loan • Establish payment security mechanisms such as escrow account or trust and retention account (TRA) • Verify ESCO’s track record in implementing projects on time
In conclusion, the project appraisal is what decides the overall credit rating of the project, which in turn decides the interest rate for the loan, and thus the �nancial feasibility of the project. It is important that all relevant factors are given due consideration, and that the borrower submits all documentation in support of the energy ef�ciency project that is to be �nanced.
45Training Manual for Energy Ef�ciency Financing in India


Measurement and
Verication: International
Best Practices & Case
Studies
Part 3

19. Introduction to Measurement and Verication (M&V)19.1 Measurement and Veri�cation (M&V)M&V is the key activity based on which the host agency can determine if the energy ef�ciency project has resulted in any reduction in energy savings, thereby leading to cost savings as well. The M&V methodology has to be provided in the ESPC through a mutually accepted procedure, which should also be acceptable to the bank, if there is project �nance involved. The elements of the M&V activity are as follows.
Responsible agency for M&V: M&V can be carried out by the project host, ESCO or third party. However, independent M&V studies by third parties are usually preferred by FIs and government agencies for reporting on results on energy ef�ciency and cost savings of the energy ef�ciency project. M&V is carried out as per a previously agreed methodology, which is speci�ed in the ESPC.
Cost of M&V: The costs of M&V depend on the energy ef�ciency technologies and measures to be implemented, and the approach and methodology to be utilized. M&V costs usually vary between 5 to 10 percent of project investments. Ultimately, there is a trade-off between accuracy of the M&V and cost of M&V.
Who pays for M&V: If the project host implements the energy ef�ciency project on its own, with internal accruals, then the host agency would engage a third party to conduct M&V. The host directly pays the M&V costs.
If the project is implemented through the ESCO route, there are two options available: • The ESCO can contract the M&V agency and also pay for the M&V costs and submit the report to the host. • The host can also contract with the M&V agency and inform the ESCO regarding this engagement and seek the ESCO’s cooperation in providing all assistance to the M&V agency. • If the ESCO conducts or engages a third party to conduct M&V, the M&V costs are part of the ESCO’s costs. • In either case, the M&V costs are an integral element of the project cost and an allowance needs to be made in the project budget and �nancing plan for these costs. • While the M&V is speci�ed in the ESPC between the ESCO and host, the lender needs to understand and approve the M&V approach and costs.
48 Training Manual for Energy Ef�ciency Financing in India
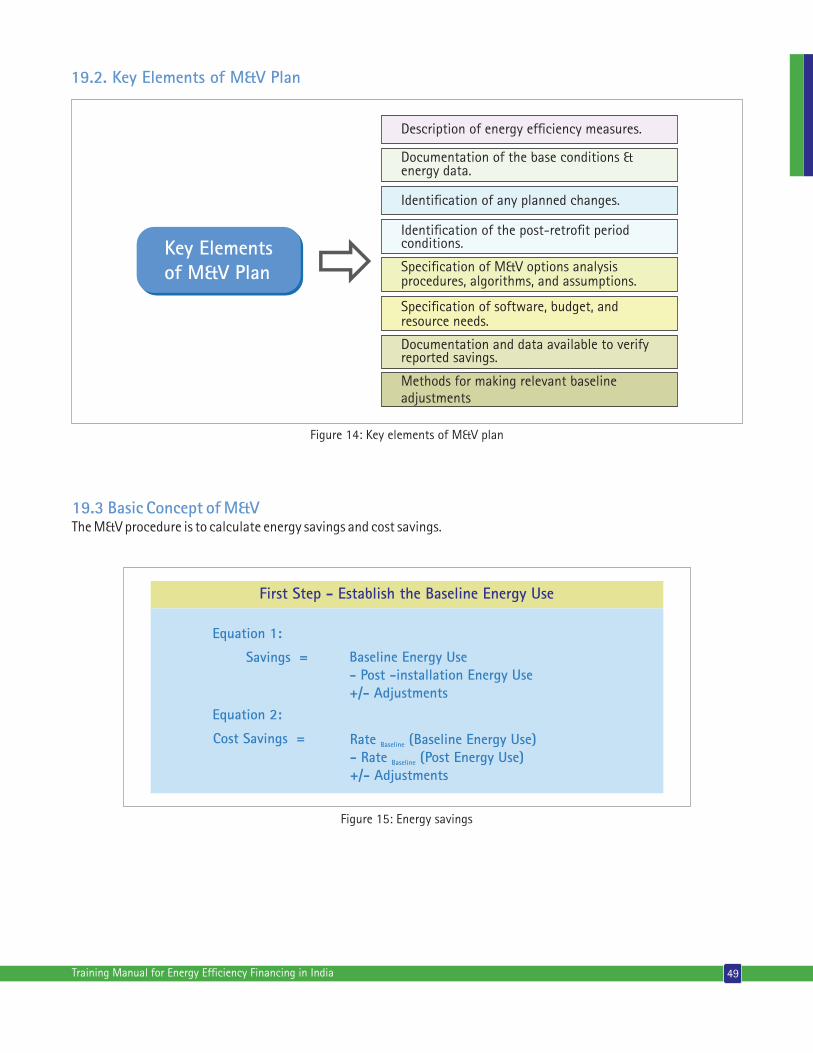
49Training Manual for Energy Ef�ciency Financing in India
19.2. Key Elements of M&V Plan
Description of energy ef�ciency measures.
Documentation of the base conditions &energy data.
Identi�cation of any planned changes.
Identi�cation of the post-retro�t periodconditions.
Speci�cation of M&V options analysisprocedures, algorithms, and assumptions.
Speci�cation of software, budget, andresource needs.
Documentation and data available to verifyreported savings.
Methods for making relevant baselineadjustments
Key Elementsof M&V Plan ð
Figure 14: Key elements of M&V plan
19.3 Basic Concept of M&VThe M&V procedure is to calculate energy savings and cost savings.
First Step - Establish the Baseline Energy Use
Equation 1:
Savings =
Equation 2:
Cost Savings =
Baseline Energy Use- Post -installation Energy Use+/- Adjustments
Rate (Baseline Energy Use)Baseline
- Rate (Post Energy Use)Baseline
+/- Adjustments
Figure 15: Energy savings
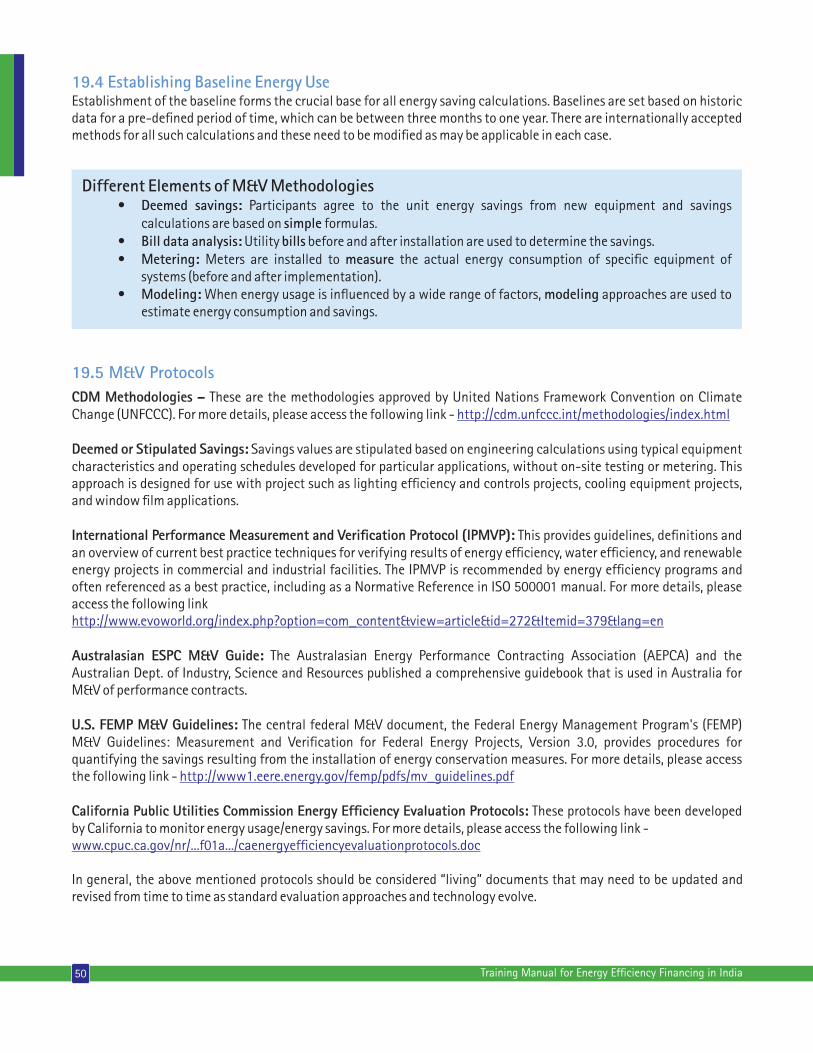
19.4 Establishing Baseline Energy UseEstablishment of the baseline forms the crucial base for all energy saving calculations. Baselines are set based on historic data for a pre-de�ned period of time, which can be between three months to one year. There are internationally accepted methods for all such calculations and these need to be modi�ed as may be applicable in each case.
50 Training Manual for Energy Ef�ciency Financing in India
Different Elements of M&V Methodologies • Deemed savings: Participants agree to the unit energy savings from new equipment and savings calculations are based on simple formulas. • Bill data analysis: Utility bills before and after installation are used to determine the savings. • Metering: Meters are installed to measure the actual energy consumption of speci�c equipment of systems (before and after implementation). • Modeling: When energy usage is in�uenced by a wide range of factors, modeling approaches are used to estimate energy consumption and savings.
19.5 M&V ProtocolsCDM Methodologies – These are the methodologies approved by United Nations Framework Convention on Climate Change (UNFCCC). For more details, please access the following link - http://cdm.unfccc.int/methodologies/index.html
Deemed or Stipulated Savings: Savings values are stipulated based on engineering calculations using typical equipment characteristics and operating schedules developed for particular applications, without on-site testing or metering. This approach is designed for use with project such as lighting ef�ciency and controls projects, cooling equipment projects, and window �lm applications.
International Performance Measurement and Veri�cation Protocol (IPMVP): This provides guidelines, de�nitions and an overview of current best practice techniques for verifying results of energy ef�ciency, water ef�ciency, and renewable energy projects in commercial and industrial facilities. The IPMVP is recommended by energy ef�ciency programs and often referenced as a best practice, including as a Normative Reference in ISO 500001 manual. For more details, please access the following link http://www.evoworld.org/index.php?option=com_content&view=article&id=272&Itemid=379&lang=en
Australasian ESPC M&V Guide: The Australasian Energy Performance Contracting Association (AEPCA) and the Australian Dept. of Industry, Science and Resources published a comprehensive guidebook that is used in Australia for M&V of performance contracts.
U.S. FEMP M&V Guidelines: The central federal M&V document, the Federal Energy Management Program's (FEMP) M&V Guidelines: Measurement and Veri�cation for Federal Energy Projects, Version 3.0, provides procedures for quantifying the savings resulting from the installation of energy conservation measures. For more details, please access the following link - http://www1.eere.energy.gov/femp/pdfs/mv_guidelines.pdf
California Public Utilities Commission Energy Ef�ciency Evaluation Protocols: These protocols have been developed by California to monitor energy usage/energy savings. For more details, please access the following link - www.cpuc.ca.gov/nr/...f01a.../caenergyef�ciencyevaluationprotocols.doc
In general, the above mentioned protocols should be considered “living” documents that may need to be updated and revised from time to time as standard evaluation approaches and technology evolve.
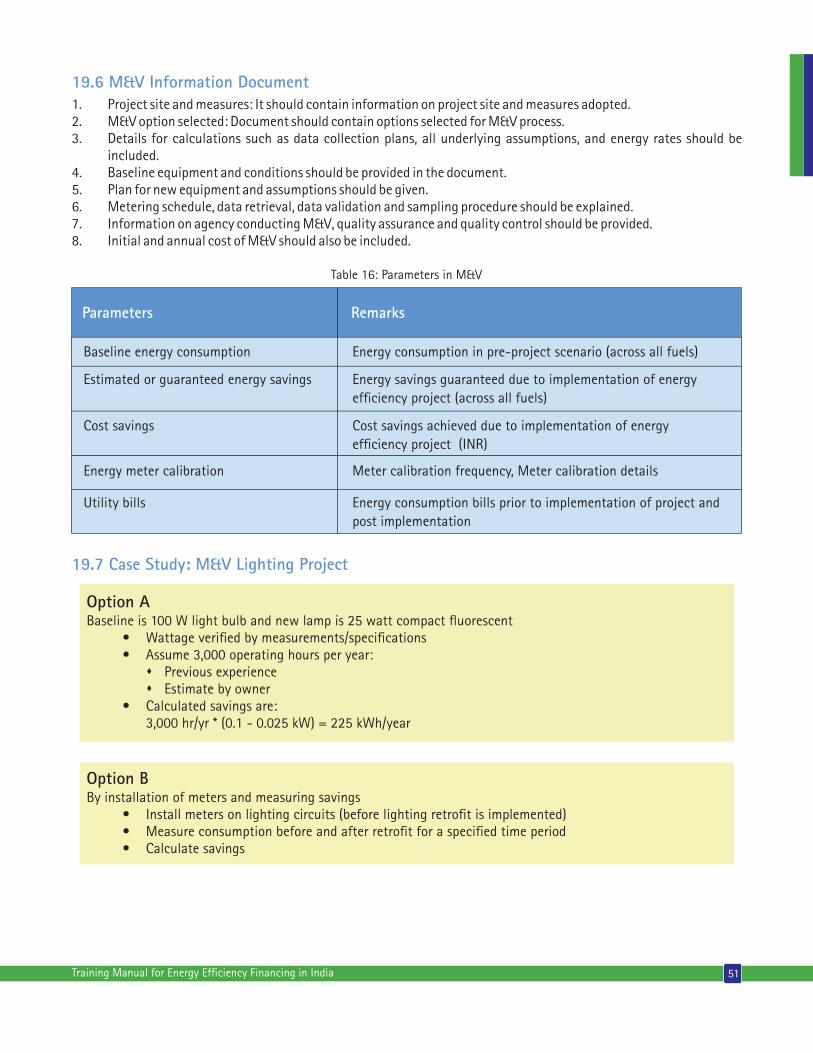
19.6 M&V Information Document1. Project site and measures: It should contain information on project site and measures adopted.2. M&V option selected: Document should contain options selected for M&V process.3. Details for calculations such as data collection plans, all underlying assumptions, and energy rates should be included.4. Baseline equipment and conditions should be provided in the document.5. Plan for new equipment and assumptions should be given.6. Metering schedule, data retrieval, data validation and sampling procedure should be explained.7. Information on agency conducting M&V, quality assurance and quality control should be provided. 8. Initial and annual cost of M&V should also be included.
Baseline energy consumption
Estimated or guaranteed energy savings
Cost savings
Energy meter calibration
Utility bills
Energy consumption in pre-project scenario (across all fuels)
Energy savings guaranteed due to implementation of energy ef�ciency project (across all fuels)
Cost savings achieved due to implementation of energy ef�ciency project (INR)
Meter calibration frequency, Meter calibration details
Energy consumption bills prior to implementation of project and post implementation
Parameters Remarks
Table 16: Parameters in M&V
19.7 Case Study: M&V Lighting Project
Option ABaseline is 100 W light bulb and new lamp is 25 watt compact �uorescent • Wattage veri�ed by measurements/speci�cations • Assume 3,000 operating hours per year: s Previous experience s Estimate by owner • Calculated savings are: 3,000 hr/yr * (0.1 - 0.025 kW) = 225 kWh/year
Option BBy installation of meters and measuring savings • Install meters on lighting circuits (before lighting retro�t is implemented) • Measure consumption before and after retro�t for a speci�ed time period • Calculate savings
51Training Manual for Energy Ef�ciency Financing in India

Option CBased on utility bills before and after installation: • Used when lighting is the dominant load • Document baseline utility bill • Obtain post-installation utility bills • Calculate energy savings based on difference between baseline utility bills and retro�t installation bills
19.8 Common M&V Issues • Factors affecting saving performance such as predictability, measurability, weather, occupancy, equipment intensity, ability of energy ef�ciency measures to deliver savings, implementation effectiveness, occupant operator cooperation, and equipment deterioration/life. • Evaluating savings uncertainty – instrumentation, modeling and sampling errors; planned and unplanned changes. • Minimum energy standards – to achieve minimum energy standards by smaller �rms and start-up organizations would be dif�cult. • Energy prices – �uctuation in energy price is an issue in M&V. • Credible third-party veri�cation is crucial for M&V – any third party issues should be resolved and corresponding clauses should be brought out in the M&V document for smooth processes. • Baseline adjustments should be carried out based on acceptable protocols.
52 Training Manual for Energy Ef�ciency Financing in India

20. M&V Report Template
53Training Manual for Energy Ef�ciency Financing in India
M&V Report Outline[Note: All content called for in this outline is required (if applicable),
except items noted as optional.]
Contract #/Delivery Order #/Task #: (include as appropriate)Performance Period Dates Covered: to dd/mm/yyyy dd/mm/yyyyContract year #: yyyy-yyyy
1. Executive Summary (not more than one page)
1.1 Project Background 1.1.1 Provide an overview of project background, including: • Contract #/Delivery Order #/Task #/Modi�cation # (as appropriate) • Dates of relevant delivery order modi�cations • Performance period dates covered • Project acceptance date
1.2 Brief Project and Energy Conservation Measures (ECM) Descriptions 1.2.1 Provide an overview of what was done and how savings are generated. 1.2.2 Note any changes in project scope between the Final Proposal (including any relevant delivery order modi�cations) and as-built conditions as recorded in post-installation report.
1.3 Summary of Proposed and Veri�ed Energy and Cost Savings 1.3.1 Compare veri�ed savings for Performance Year # to Guaranteed Cost Savings for Year #. State whether guarantee is ful�lled for year. If not, provide detailed explanation. 1.3.2 De�ne performance period. 1.3.3 Summarize information in Table 1 and Table 2.
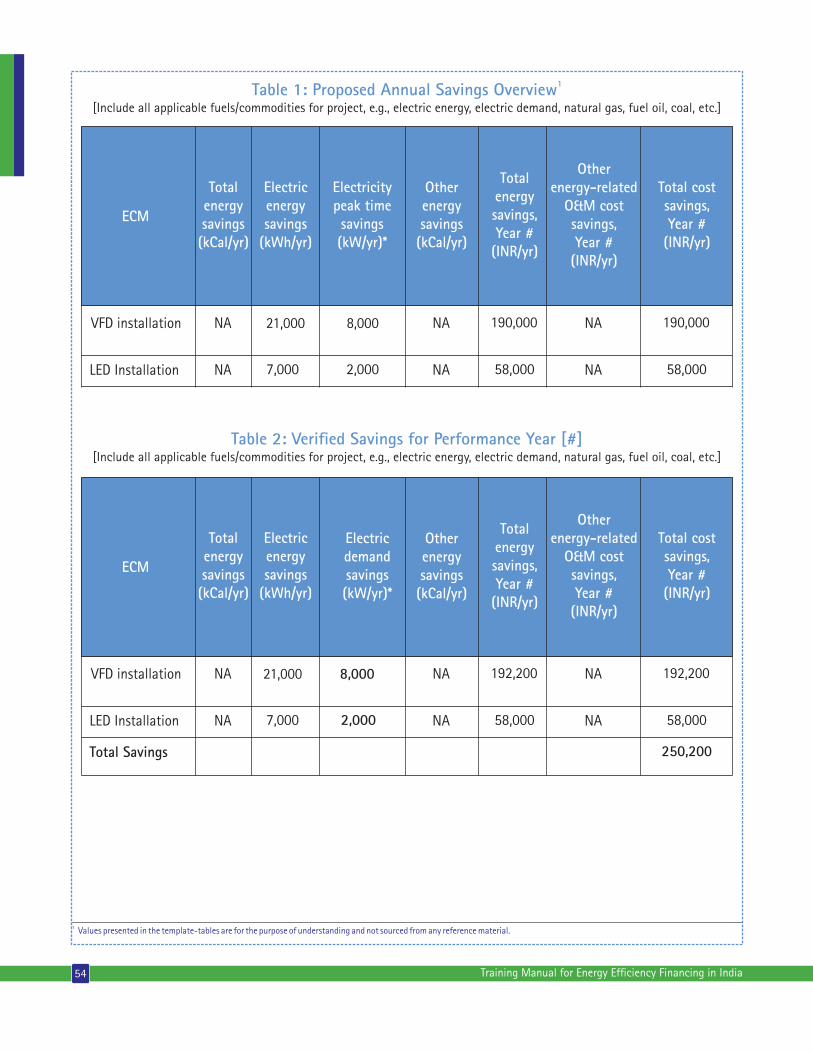
ECM
Totalenergysavings(kCal/yr)
Otherenergysavings(kCal/yr)
Electricenergysavings
(kWh/yr)
Totalenergysavings,Year #(INR/yr)
Electricitypeak timesavings(kW/yr)*
Otherenergy-related
O&M costsavings,Year #(INR/yr)
Total costsavings,Year #(INR/yr)
VFD installation NA 21,000 8,000 NA 190,000 NA 190,000
LED Installation NA 7,000 2,000 NA 58,000 NA 58,000
1Table 1: Proposed Annual Savings Overview[Include all applicable fuels/commodities for project, e.g., electric energy, electric demand, natural gas, fuel oil, coal, etc.]
Table 2: Veri�ed Savings for Performance Year [#][Include all applicable fuels/commodities for project, e.g., electric energy, electric demand, natural gas, fuel oil, coal, etc.]
ECM
Totalenergysavings(kCal/yr)
Other energysavings(kCal/yr)
Electricenergysavings
(kWh/yr)
Totalenergysavings,Year #(INR/yr)
Electricdemandsavings(kW/yr)*
Otherenergy-related
O&M costsavings,Year #(INR/yr)
Total costsavings,Year #(INR/yr)
VFD installation NA 21,000 8,000 NA 192,200 NA 192,200
LED Installation NA 7,000 2,000 NA 58,000 NA 58,000
Total Savings 250,200
1 Values presented in the template-tables are for the purpose of understanding and not sourced from any reference material.
54 Training Manual for Energy Ef�ciency Financing in India

1.4 Savings Adjustments • Provide summary of any energy and/or cost savings adjustments required.
1.5 Performance and O&M Issues • Note impact of operating de�ciencies or enhancements on generation of savings. • Note impact of maintenance de�ciencies on generation of savings. • Detail any de�ciencies that need to be addressed by ESCO or host.
1.6 Energy (thermal, electricity, fuel) and O&M Rate Data • Detail energy and fuel used to calculate cost savings for this period. • Provide performance period rate adjustment factors for energy, and O&M cost savings, if used. • Report actual energy and fuel rates at site for same period (optional).
1.7 Veri�ed Savings to Date • Summarize information in Table 3.
55Training Manual for Energy Ef�ciency Financing in India

Tabl
e 3:
Ver
i�ed
Sav
ings
for
Per
form
ance
Per
iod
to D
ate
[Incl
ude
all a
pplic
able
fuel
s/co
mm
oditi
es fo
r pro
ject
, e.g
., el
ectr
ic e
nerg
y, el
ectr
ic d
eman
d, n
atur
al g
as, f
uel o
il, c
oal,
etc.
]
Year
#To
tal
ener
gy s
avin
gs(k
Cal/y
r)
Elec
tric
ener
gysa
ving
s(k
Wh/
yr)
Elec
tric
dem
and
savi
ngs
(kW
/yr)
*
Nat
ural
gas
savi
ngs
(kCa
l/yr)
Oth
eren
ergy
savi
ngs
(kCa
l/yr)
Tota
len
ergy
savi
ngs
(INR/
yr)
Oth
eren
ergy
-re
late
dO
&M
cos
tsa
ving
s(IN
R/yr
)
Tota
l cos
tsa
ving
s(IN
R/yr
)
Guar
ante
edco
stsa
ving
sfo
r ye
ar
Year
1(J
an-D
ec)
Year
2(J
an-J
une)
Tota
lsa
ving
s
28,1
00
14,0
50
10,2
00
5,10
0
NA
NA
NA
NA
250,
200
125,
100
NA
NA
250,
200
125,
100
375,
300
248,
000
124,
000
372,
000
56 Training Manual for Energy Ef�ciency Financing in India
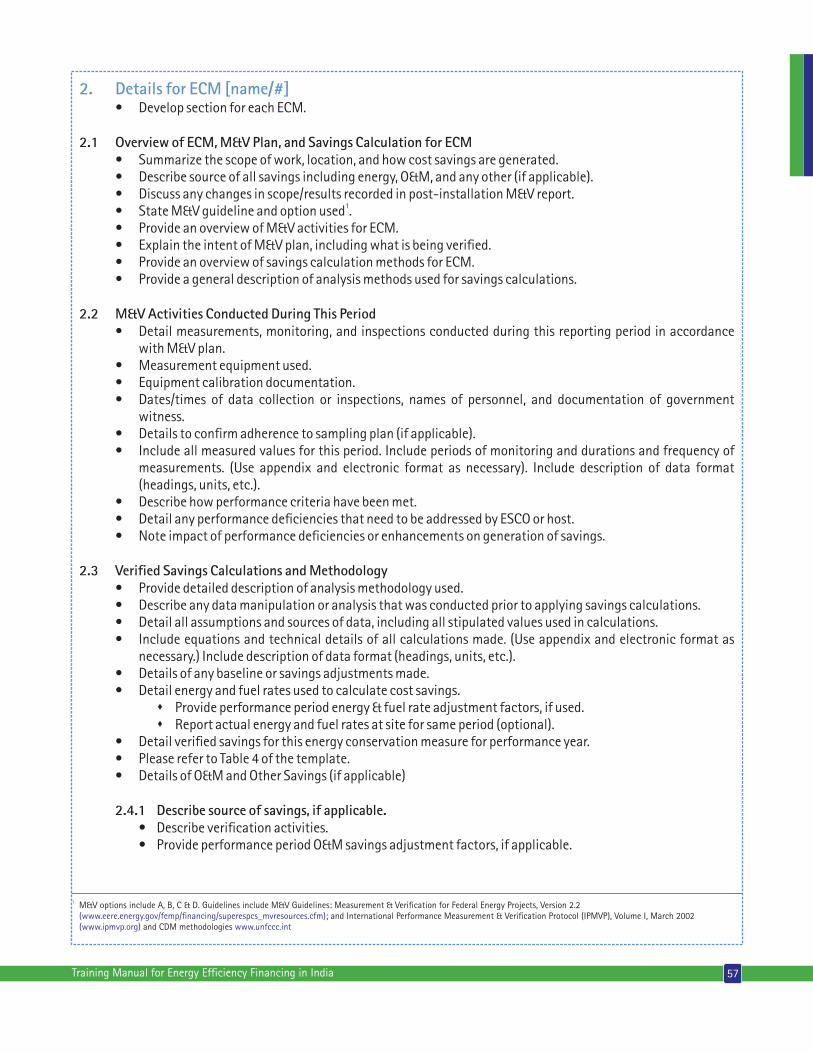
2. Details for ECM [name/#] • Develop section for each ECM.
2.1 Overview of ECM, M&V Plan, and Savings Calculation for ECM • Summarize the scope of work, location, and how cost savings are generated. • Describe source of all savings including energy, O&M, and any other (if applicable). • Discuss any changes in scope/results recorded in post-installation M&V report.
1 • State M&V guideline and option used . • Provide an overview of M&V activities for ECM. • Explain the intent of M&V plan, including what is being veri�ed. • Provide an overview of savings calculation methods for ECM. • Provide a general description of analysis methods used for savings calculations.
2.2 M&V Activities Conducted During This Period • Detail measurements, monitoring, and inspections conducted during this reporting period in accordance with M&V plan. • Measurement equipment used. • Equipment calibration documentation. • Dates/times of data collection or inspections, names of personnel, and documentation of government witness. • Details to con�rm adherence to sampling plan (if applicable). • Include all measured values for this period. Include periods of monitoring and durations and frequency of measurements. (Use appendix and electronic format as necessary). Include description of data format (headings, units, etc.). • Describe how performance criteria have been met. • Detail any performance de�ciencies that need to be addressed by ESCO or host. • Note impact of performance de�ciencies or enhancements on generation of savings.
2.3 Veri�ed Savings Calculations and Methodology • Provide detailed description of analysis methodology used. • Describe any data manipulation or analysis that was conducted prior to applying savings calculations. • Detail all assumptions and sources of data, including all stipulated values used in calculations. • Include equations and technical details of all calculations made. (Use appendix and electronic format as necessary.) Include description of data format (headings, units, etc.). • Details of any baseline or savings adjustments made. • Detail energy and fuel rates used to calculate cost savings. s Provide performance period energy & fuel rate adjustment factors, if used. s Report actual energy and fuel rates at site for same period (optional). • Detail veri�ed savings for this energy conservation measure for performance year. • Please refer to Table 4 of the template. • Details of O&M and Other Savings (if applicable)
2.4.1 Describe source of savings, if applicable. • Describe veri�cation activities. • Provide performance period O&M savings adjustment factors, if applicable.
1 M&V options include A, B, C & D. Guidelines include M&V Guidelines: Measurement & Veri�cation for Federal Energy Projects, Version 2.2 (www.eere.energy.gov/femp/�nancing/superespcs_mvresources.cfm); and International Performance Measurement & Veri�cation Protocol (IPMVP), Volume I, March 2002 (www.ipmvp.org) www.unfccc.intand CDM methodologies
57Training Manual for Energy Ef�ciency Financing in India

58 Training Manual for Energy Ef�ciency Financing in India
Tabl
e 4:
Ver
i�ed
Ann
ual S
avin
gs f
or E
CM f
or P
erfo
rman
ce Y
ear
#[In
clud
e al
l app
licab
le fu
els/
com
mod
ities
for p
roje
ct, e
.g.,
elec
tric
ene
rgy,
elec
tric
dem
and,
nat
ural
gas
, fue
l oil,
coa
l, et
c.]

2.5 O&M and Other Activities 2.5.1 Operating requirements: • State organization(s) responsible for equipment operations. If appropriate, detail how responsibilities are shared. • Summarize key operating procedures and any related veri�cation activities. • Detail any de�ciencies that need to be addressed by ESCO or host. • Note impact of operating de�ciencies or enhancements on generation of savings.
2.5.2 Preventive maintenance requirements: • State organization(s) responsible for performing maintenance. If appropriate, detail how responsibilities are shared. • Veri�cation of scheduled maintenance items completed by ESCO or host. • Detail any de�ciencies that need to be addressed by ESCO or host. • Note impact of maintenance de�ciencies on generation of savings.
2.5.3 Repair and replacement requirements: • State organization(s) responsible for repair and replacement. If appropriate, detail how responsibilities are shared. • Summary of activities conducted this period by ESCO or host. • Detail any de�ciencies that need to be addressed by ESCO or host. • Note impact of equipment de�ciencies on generation of savings.
59Training Manual for Energy Ef�ciency Financing in India
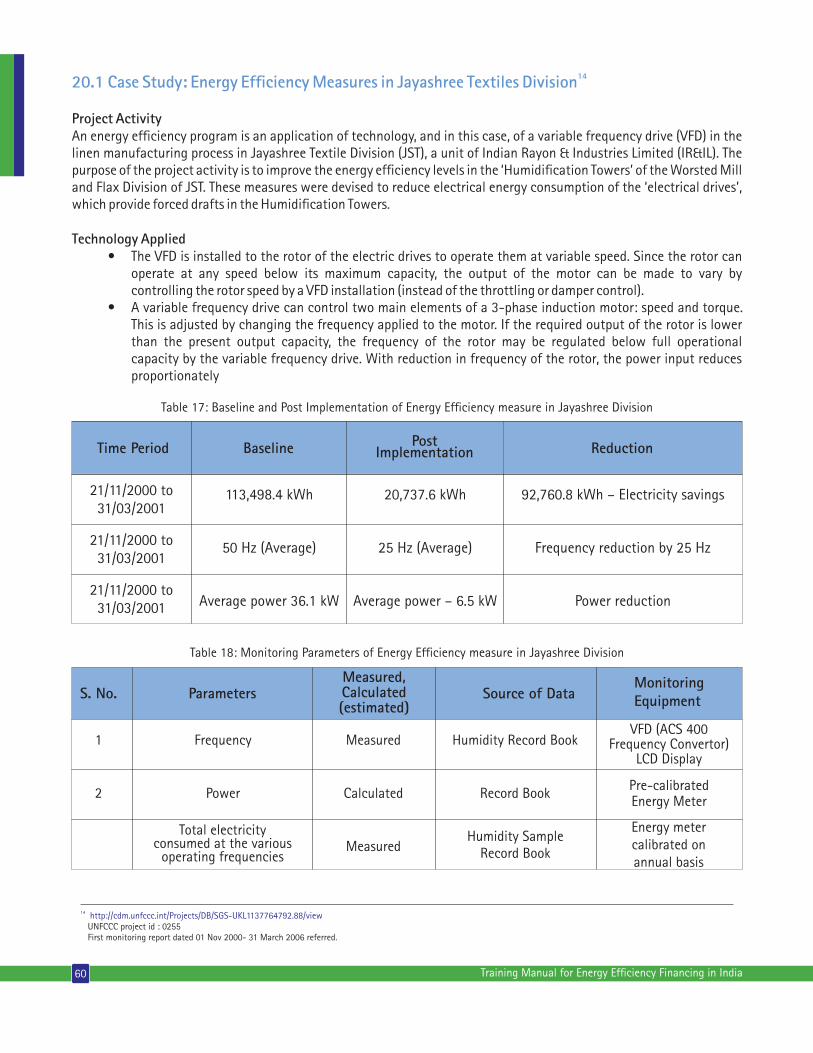
Table 17: Baseline and Post Implementation of Energy Ef�ciency measure in Jayashree Division
21/11/2000 to31/03/2001
21/11/2000 to31/03/2001
21/11/2000 to31/03/2001
113,498.4 kWh
50 Hz (Average)
Average power 36.1 kW
20,737.6 kWh
25 Hz (Average)
Average power – 6.5 kW
92,760.8 kWh – Electricity savings
Frequency reduction by 25 Hz
Power reduction
Time Period PostImplementationBaseline Reduction
Table 18: Monitoring Parameters of Energy Ef�ciency measure in Jayashree Division
Frequency
Power
Total electricityconsumed at the various
operating frequencies
S. No.Measured,Calculated(estimated)
Parameters Source of Data
1
2
MonitoringEquipment
Measured
Calculated
Measured
Humidity Record Book
Record Book
Humidity SampleRecord Book
VFD (ACS 400Frequency Convertor)
LCD Display
Pre-calibratedEnergy Meter
Energy metercalibrated onannual basis
60 Training Manual for Energy Ef�ciency Financing in India
1420.1 Case Study: Energy Ef�ciency Measures in Jayashree Textiles Division
Project ActivityAn energy ef�ciency program is an application of technology, and in this case, of a variable frequency drive (VFD) in the linen manufacturing process in Jayashree Textile Division (JST), a unit of Indian Rayon & Industries Limited (IR&IL). The purpose of the project activity is to improve the energy ef�ciency levels in the ‘Humidi�cation Towers’ of the Worsted Mill and Flax Division of JST. These measures were devised to reduce electrical energy consumption of the ‘electrical drives’, which provide forced drafts in the Humidi�cation Towers.
Technology Applied • The VFD is installed to the rotor of the electric drives to operate them at variable speed. Since the rotor can operate at any speed below its maximum capacity, the output of the motor can be made to vary by controlling the rotor speed by a VFD installation (instead of the throttling or damper control). • A variable frequency drive can control two main elements of a 3-phase induction motor: speed and torque. This is adjusted by changing the frequency applied to the motor. If the required output of the rotor is lower than the present output capacity, the frequency of the rotor may be regulated below full operational capacity by the variable frequency drive. With reduction in frequency of the rotor, the power input reduces proportionately
14 http://cdm.unfccc.int/Projects/DB/SGS-UKL1137764792.88/view UNFCCC project id : 0255 First monitoring report dated 01 Nov 2000- 31 March 2006 referred.
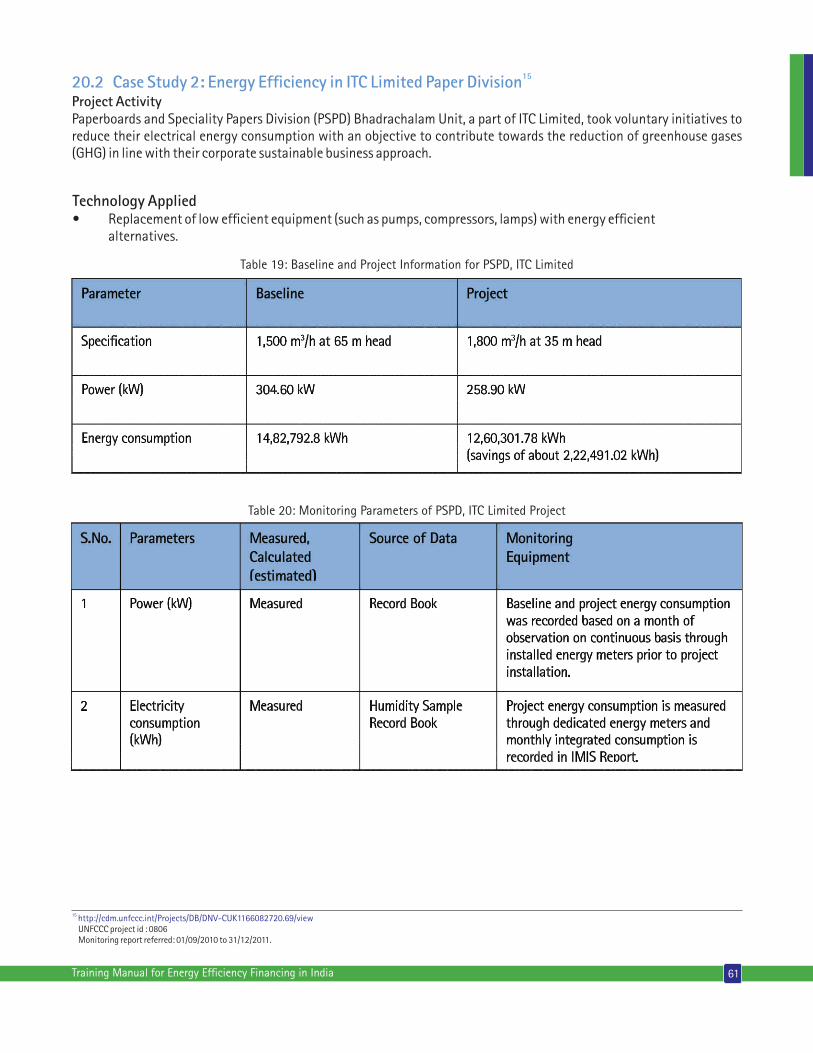
Technology Applied• Replacement of low ef�cient equipment (such as pumps, compressors, lamps) with energy ef�cient alternatives.
Table 20: Monitoring Parameters of PSPD, ITC Limited Project
61Training Manual for Energy Ef�ciency Financing in India
15 20.2 Case Study 2: Energy Ef�ciency in ITC Limited Paper DivisionProject ActivityPaperboards and Speciality Papers Division (PSPD) Bhadrachalam Unit, a part of ITC Limited, took voluntary initiatives to reduce their electrical energy consumption with an objective to contribute towards the reduction of greenhouse gases (GHG) in line with their corporate sustainable business approach.
15 http://cdm.unfccc.int/Projects/DB/DNV-CUK1166082720.69/view UNFCCC project id : 0806 Monitoring report referred: 01/09/2010 to 31/12/2011.
Table 19: Baseline and Project Information for PSPD, ITC Limited
ACRONYMS
62 Training Manual for Energy Ef�ciency Financing in India
Acronym Definition
AEEE Alliance for an Energy Efficient Economy AFD Agence Française de Développement AHU air handling unit AIIMS All India Institute of Medical Sciences BEE Bureau of Energy Efficiency CDM Clean Development Mechanism CII Confederation of Indian Industry DCs designated consumers DM demineralization DPR detailed project report DPT differential pressure transmitter DRCs Default Review Committees DSCR debt service coverage ratio ECM energy conservation measures EEFP Energy Efficiency Financing Platform EESL Energy Efficiency Services Limited EEMs energy efficiency measures ESA energy savings agreement ESCO’s energy service companies ESIC Employees’ State Insurance Corporation ESPC Energy Savings Performance Contracting ESPA Energy Services Performance Agreement ESP energy savings performance FEEED Framework for Energy Efficiency Economic Development FIs financial institutions FEMP Federal Energy Management Program GHG greenhouse gas(es) GPM Gross Profit Margin HVAC heating, ventilation and air-conditioning ID induced draft ICICI Bank Industrial Credit and Investment Corporation of India Bank INR Indian Rupee IPMVP International Performance Measurement and Verification Protocol IRR internal rate of return IREDA Indian Renewable Energy Development Agency Limited
�
63Training Manual for Energy Ef�ciency Financing in India
IR&IL Indian Rayon and Industries Limited JICA Japan International Cooperation Agency JST Jayashree Textile KfW Kreditanstalt Für Wiederaufbau kWh kilo watt hour M&V measurement and verification MFI microfinance organization MOP Ministry of Power MOU Memorandum of Understanding MOEF Ministry of Environment and Forests MSME Micro Small and Medium Enterprise MTEE Market Transformation for Energy Efficiency MTPA million tonnes per annum MVA Mega Volt Ampere NAPCC National Action Plan for Climate Change NMEEE National Mission for Enhanced Energy Efficiency NPC National Productivity Council NPV net present value O&M operation and maintenance OM&R operation, maintenance and repair PAT Perform, Achieve and Trade PRGFEE Partial Risk Guarantee Fund for Energy Efficiency PSPD Paperboards and Speciality Papers Division PV photovoltaic RO reverse osmosis ROE return on equity SBI State Bank of India SEC specific energy consumption SECI Solar Energy Corporation of India SIDBI Small Industries Development Bank of India SMEs small and medium enterprises TRA trust and retention account UNFCCC United Nations Framework Convention on Climate Change USAID United States Agency for International Development VFD variable frequency drive VCFEE Venture Capital Fund for Energy Efficiency VSK vertical shaft kiln
�

Notes

Notes

Notes
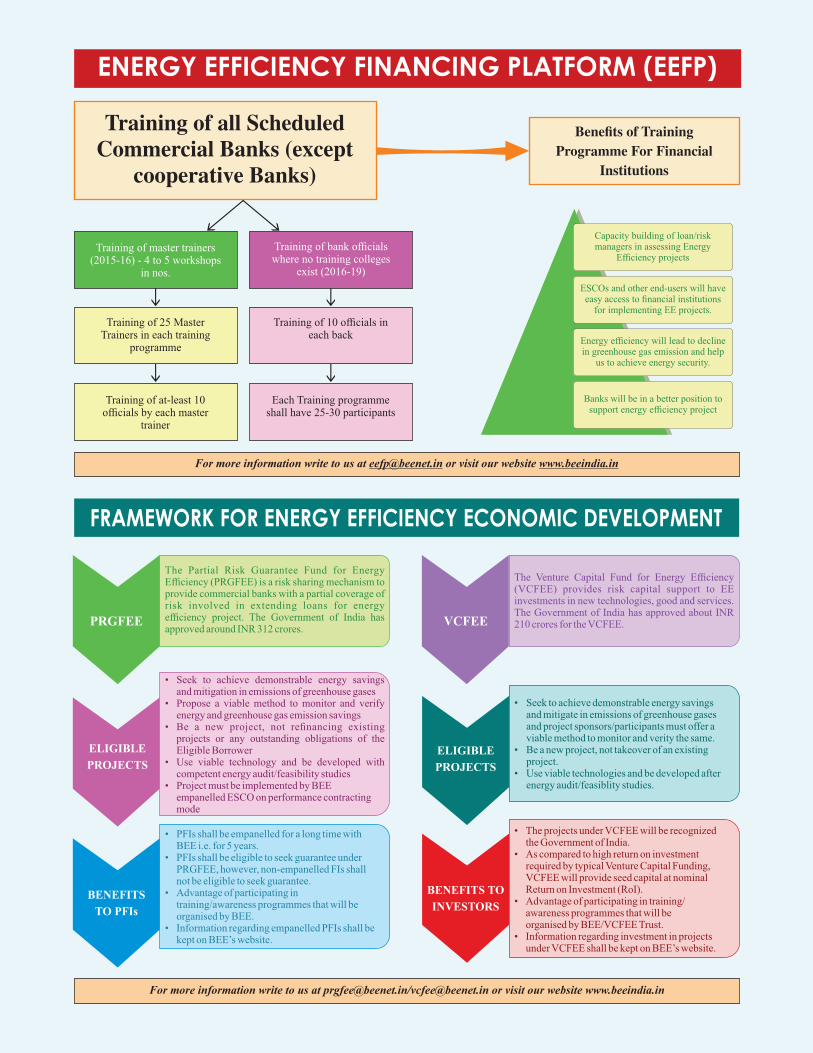
ENERGY EFFICIENCY FINANCING PLATFORM (EEFP)
Training of all ScheduledCommercial Banks (except
cooperative Banks)
Benefits of TrainingProgramme For Financial
Institutions
Training of master trainers(2015-16) - 4 to 5 workshops
in nos.
Training of bank officialswhere no training colleges
exist (2016-19)
Training of 25 MasterTrainers in each training
programme
Training of 10 officials ineach back
Training of at-least 10officials by each master
trainer
Each Training programmeshall have 25-30 participants
For more information write to us at [email protected] or visit our website www.beeindia.in
FRAMEWORK FOR ENERGY EFFICIENCY ECONOMIC DEVELOPMENT
Capacity building of loan/riskmanagers in assessing Energy
Efficiency projects
ESCOs and other end-users will haveeasy access to financial institutions
for implementing EE projects.
Energy efficiency will lead to declinein greenhouse gas emission and help
us to achieve energy security.
Banks will be in a better position tosupport energy efficiency project
PRGFEE VCFEE
ELIGIBLE
PROJECTS
BENEFITS
TO PFIs
BENEFITS TO
INVESTORS
The Partial Risk Guarantee Fund for Energy Efficiency (PRGFEE) is a risk sharing mechanism to provide commercial banks with a partial coverage of risk involved in extending loans for energy efficiency project. The Government of India has approved around INR 312 crores.
The Venture Capital Fund for Energy Efficiency (VCFEE) provides risk capital support to EE investments in new technologies, good and services. The Government of India has approved about INR 210 crores for the VCFEE.
• Seek to achieve demonstrable energy savings and mitigation in emissions of greenhouse gases• Propose a viable method to monitor and verify energy and greenhouse gas emission savings• Be a new project, not refinancing existing projects or any outstanding obligations of the Eligible Borrower• Use viable technology and be developed with competent energy audit/feasibility studies• Project must be implemented by BEE empanelled ESCO on performance contracting mode
• Seek to achieve demonstrable energy savings and mitigate in emissions of greenhouse gases and project sponsors/participants must offer a viable method to monitor and verity the same.• Be a new project, not takeover of an existing project.• Use viable technologies and be developed after energy audit/feasiblity studies.
• PFIs shall be empanelled for a long time with BEE i.e. for 5 years.• PFIs shall be eligible to seek guarantee under PRGFEE, however, non-empanelled FIs shall not be eligible to seek guarantee.• Advantage of participating in training/awareness programmes that will be organised by BEE.• Information regarding empanelled PFIs shall be kept on BEE’s website.
• The projects under VCFEE will be recognized the Government of India.• As compared to high return on investment required by typical Venture Capital Funding, VCFEE will provide seed capital at nominal Return on Investment (RoI).• Advantage of participating in training/ awareness programmes that will be organised by BEE/VCFEE Trust.• Information regarding investment in projects under VCFEE shall be kept on BEE’s website.
ELIGIBLE
PROJECTS
For more information write to us at [email protected]/[email protected] or visit our website www.beeindia.in

BUREAU OF ENERGY EFFICIENCY(Ministry of Power, Government of India)
4th Floor, Sewa Bhawan, Sector 1, R. K. Puram, New Delhi - 110066Phone: +91 11 26179699, Fax : +91 11 26178352
Email: [email protected], Web: www.beeindia.in