traffic operation of bicycle traffic
TRANSCRIPT
TRANSPORTATION RESEARCH RECORD 1320 65
Traffic Operation of Bicycle Traffic
HEIN BOTMA AND HANS p APENDRECHT
Knowledge has been provided about one-directional traffic streams of bicycles and mopeds on cycle paths. This knowledge is useful for the perfection of the geometric design of bicycle facilities. Data on bicycle traffic were collected on rather heavily used paths at four locations in built-up areas and one in a rural area. A special developed system of sensors was used to measure times of passage, speeds, and lateral positions of the vehicles at a path cross section. Speeds of bicycles and mopeds had the same magnitude at the different town locations. They were of the same magnitude as measured 10 years ago. Only a weak relation was found between the rate of flow in platoons and mean speed. The distribution of the lateral positions was used to investigate the influence of the geometrics of the path's cross section. The average length of passing maneuvers and the percentiles of the lateral positions during passing were determined. On the narrow path, the length of the passing maneuver is shorter than that on the wider paths. Also, lateral clearance between paired cyclists is less on narrower than on wider paths. Paired cyclists keep less lateral distance to each other than do passers. As a function of volume, the frequency of passings conforms to the theory that describes free flow conditions. However, in absolute terms, the number of passings detected was lower. Estimated values of path capacities derived from the headway distribution are much larger than those mentioned in the literature.
Knowledge about traffic operation of bicycle traffic is not advanced. For instance, Chapter 14 of the Highway Capacity Manual of 1985 about bicycles consists of only four pages. Still, bicycle traffic is or can become an important transportation mode in many areas. In the Netherlands, the contribution of bicycle traffic to the modal split in medium-sized cities (50,000 to 200,000 inhabitants) during rush hours is 40 percent of total internal vehicle trips and is still slowly increasing.
In a Dutch study (1) that investigated the possibilities of promoting bicycle traffic by means of special facilities, a maximum contribution to the modal split of 55 percent was found. Despite this high contribution to mobility, little attention has been paid to fundamental research on traffic operation of bicycle traffic needed to base bicycle infrastructural designs and bicycle-promoting actions on a more scientific understanding. This study is a contribution towards this better understanding.
To describe the situation in the Netherlands, some data about car and bicycle ownership from the Dutch Statistical Bureau CBS (2) are presented in Table 1, which indicates
• Growing car and motorbike ownership, • Decreasing and then stabilizing moped ownership, and • Increasing and then stabilizing bicycle ownership.
Department of Transportation Planning and Highway Engineering, Faculty of Civil Engineering, Delft University of Technology, P.O. Box 5048, 2600 GA DELFT, the Netherlands.
The results of a study of bicycle traffic in one direction on a bicycle path accessible for bicycles and mopeds are described. In the Netherlands, mopeds are authorized to use such a path. In general, the proportion of mopeds is limited, but because of their higher speed the influence on bicycle path operation and on traffic safety can be substantial. Consequently, moped traffic was included in this study.
The study is based on experimental data collected at a path cross section at five different locations.
RESEARCH GOALS AND METHODS
In the Netherlands, bicycle paths are used by two types of vehicles: bicycles and mopeds. Mopeds can be described as light motorbikes and compared to bicycles have more mass and a higher speed. The official speed limit for mopeds is 30 km/hr inside built-up areas and 40 km/hr outside. However, there is little enforcement and these speed limits are not much respected.
Differences in speed between the two vehicle types and between vehicles of the same type lead to passing demand. As long as volume is low and the width of the path sufficient, the demand for passings can be easily satisfied. With increasing volume, it becomes more difficult to carry out the passings at any desired moment. The quality of operation decreases. In order to get a quantitative insight into this phenomenon, the passing demand and the passing possibilities must be studied. Passing possibilities depend on the space needed for passings and on the space available.
It is evident that lateral behavior is an important aspect of passing. So speeds, lateral positions, and lateral position during passing maneuvers were studied.
The quality of traffic operation and its relation to volume were also investigated at a macroscopic level. The questions to be answered are: What is the relation between mean speed and volume? and What is the capacity of a path in relation to its width?
Method
It was decided to collect the data from ordinary bicycle traffic and not to use test persons.
To get data on speeds and lateral positions, it is sufficient to make measurements at one cross section. Characteristics of the average shape of a passing maneuver could also be deduced from these local data.
In order to get sufficient interaction between path users, it was needed to select high-volume locations. To rule out interaction between effects of volume and path characteristics, locations were selected with more or less ideal geometric char-
66 TRANSPORTATION RESEARCH RECORD 1320
TABLE 1 DATA ON VEHICLE OWNERSHIP IN THE NETHERLANDS
1975 1980
population 13.600 14.100
passenger cars 3.399 4.515
motorbikes 68 103
mopeds 650 814
bicycles 8.600 10.580
acteristics (no curves and grades and a smooth pavement) and with no discontinuities immediately downstream or upstream. In fact , the only geometric characteristics varied were the width of the path and the height of the curb.
Measuring Device
The measuring device used was a specially designed mat in which several strings of tape switches were installed . Two strings at a longitudinal distance of 30 cm with switches of 50-cm length were used to measure moments of passage and speeds; a string with 16 switches of 15.6 cm was used to measure the lateral position more precisely.
To check the functioning of the device , a video registration of the bicycle traffic was made . A few samples of this registration were analyzed in detail to determine some parameters used in the analysis.
The mat had a maximum thickness of only 8 mm in the middle and had no perceivable influence on cyclists' behavior. It was visible but not obtrusive. The video camera and the van with the registration equipment were rigged in such a way that they were not visible for passing cyclists.
Data Collection
It proved to be difficult to find locations with the required geometric and volume characteristics. In particular, a location where the capacity of the path was reached could not be found . Eventually four locations inside a town were selected: one had a width of only 180 cm; three had widths of around 250 cm. In order to investigate high volumes, one exceptional location was added. It was at a cross section of a 3-m-wide bicycle path, which at the time was part of the route of a long-
1985 1986 1987 1988
14.450 14.530 14.620 14.710
4.901 4.950 5.118 5.251
128 127 131 135
534 564 516 516
11. 179 11. 517 11. 441 11. 695
distance tour (23U km) for amateur cyclists. No mopeds were present in this case and speeds could be expected to be higher than those of ordinary bicycle traffic.
In the discussion of the results of the study , the five locations mentioned are indicated by T-Narrow, Tl-Wide, T2-Wide, T3-Wide, and Tour.
ANALYSIS AND RESULTS
Volumes and Vehicle Composition
From an earlier investigation, it was known that bicycles and mopeds could be discriminated by speed and that a reasonable limit was 30 km/hr. That means a detected two-wheeled vehicle was registered to be a bicycle (bic) when its speed was less than 30 km/hr; otherwise it was registered as a moped (mop). Few bicycles have speeds higher than this limit and even less mopeds have speeds that are lower. The inevitable error was considered to be acceptable .
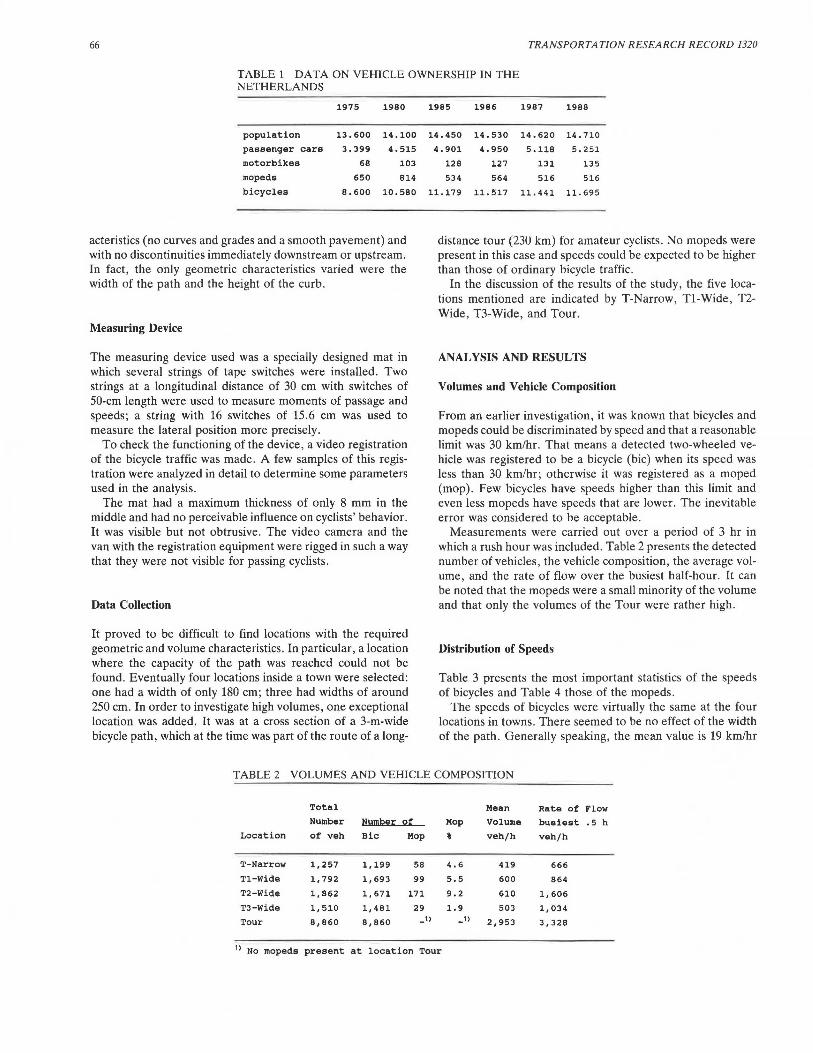
Measurements were carried out over a period of 3 hr in which a rush hour was included . Table 2 presents the detected number of vehicles, the vehicle composition, the average volume, and the rate of flow over the busiest half-hour. It can be noted that the mopeds were a small minority of the volume and that only the volumes of the Tour were rather high.
Distribution of Speeds
Table 3 presents the most important statistics of the speeds of bicycles and Table 4 those of the mopeds .
The speeds of bicycles were virtually the same at the four locations in towns . There seemed to be no effect of the width of the path. Generally speaking, the mean value is 19 km/hr
TABLE 2 VOLUMES AND VEHICLE COMPOSITION
Total Mean Rate of Flow Number Hl.lmb~i: 21: Mop Volume busiest .5 h
Location of veh Bic Mop ' veh/h veh/h
T-Narrow 1,257 1,199 58 4.6 419 666
Tl-Wide 1,792 1,693 99 5.5 600 864
T2-Wide 1,862 1,671 171 9.2 610 1,606
T3-Wide 1,510 1,481 29 1.9 503 1,034
Tour 8,860 8,860 _1) _ 1)
2,953 3,328
1> No mopeds present at location Tour

Botma and Papendrecht 67
TABLE 3 STATISTICS OF BICYCLE SPEEDS
Path ll12!i!!i!Q
Width Mean St. dev. 85 %
Location cm Number km/h km/h % km/h
T-Narrow 180 1,199 19.6 3.4 17 22.8
Tl-Wide 240 1,693 19.0 3. 1 14 22.3
T2-Wide 250 1,691 19.0 2.9 15 21. 8
TJ-Wide 270 1,481 18.9 2.5 13 21. 4
Tour 300 8,860 24.9 3. 2 13 28.4
TABLE 4 STATISTICS OF MOPED SPEEDS
Path
Width
Location cm Number
T-Narrow 180 58
Tl-Wide 240 95
T2-Wide 250 171
TJ-Wide 270 29
and the standard deviation around 3 km/hr. The speeds at the Tour are definitely higher, as was expected. A simple test indicated that the speeds were normally distributed.
The speeds of mopeds seemed to be influenced a little by the width of the path. The overall mean speed was around 38 km/hr and the standard deviation was about 5 km/hr.
An earlier study (3) carried out in 1979, with measurements at a comparable location, indicated approximately the same values of speeds of bicycles (a mean of 19.2 km/hr) and mopeds (a mean of 36.6 km/hr). Consequently, it can be concluded that speeds have not changed appreciably during the last 10 years.
Relation Between Mean Speed and Volume
A level of service (LOS) for bicycle traffic may be defined by using the mean speed as a criterion for the quality of the flow, as was done for motor vehicles in the HCM of 1960. This approach is feasible only when the mean speed varies with volume. In order to investigate this relation, it is necessary to differentiate between bicycles and mopeds. Both the volumes of bicycles and mopeds can affect the mean speeds of bicycles and the mean speed of mopeds.
For the analysis with linear regression, 5-min values were calculated for the following:
•Rates of flow of bicycles and mopeds; and •Mean speeds of bicycles and of mopeds.
Mean speeds of both vehicle types were then related to both rates of flow. Some relations were statistically significant but only one was considered to be of any relevance; on the narrow path of 180-cm width a higher volume of bicycles leads to a lower mean speed of mopeds. Volumes had at most a minor effect on speeds for the range of volumes that could be observed (50 to 1,500 bic/hr).
llR!i!!i!d
Mean St. !;'!ey. 85 %
km/h km/h % km/h
36.9 4.4 12 42.5
38.2 4.7 12 43.7
39.9 4.9 12 45.0
39.7 7.4 19 47.1
Relation Between Mean Speed of Bicycles and Volume on a Smaller Time Scale
Closer inspection of the pattern of arrival within 5-min periods indicated that large gaps between vehicles occurred. This was an incentive to investigate a possible relation between rate of flow and mean speed using smaller intervals than the 5-min intervals, by which the vehicle population was split up before.
Groups of at least 10 bicycles were selected with headways of less than 5 sec, except for the first one. Such a group was defined as a platoon although it was realized that the word platoon for such a group would have a slightly different meaning than the word platoon used when describing a stream of cars. Bicycles with a headway of, say, 4 sec are still much freer in maneuvering than cars in the same situation, due to their greater lateral freedom.
A similar analysis was not possible for the detected mopeds because from a statistical point of view their number was too small to yield reliable results. In addition, on the narrow path only three platoons could be detected that fulfilled the conditions-too small a number for proper analysis. The analysis results for the three other town locations were sufficiently similar to allow the combination of the data to a single population. Their analysis led to Equation 1, which describes the mean speed U (km/hr) as a function of volume Q (bic/hr):
u = 20.8 - 6.8 x 10- 4Q
R2 = 0.20 N = 66
where
R2 = explained variance, and N = number of observations.
(1)
The standard errors of the first and second coefficients, which were 3 and 25 percent, respectively, indicated their statistical significance.
68
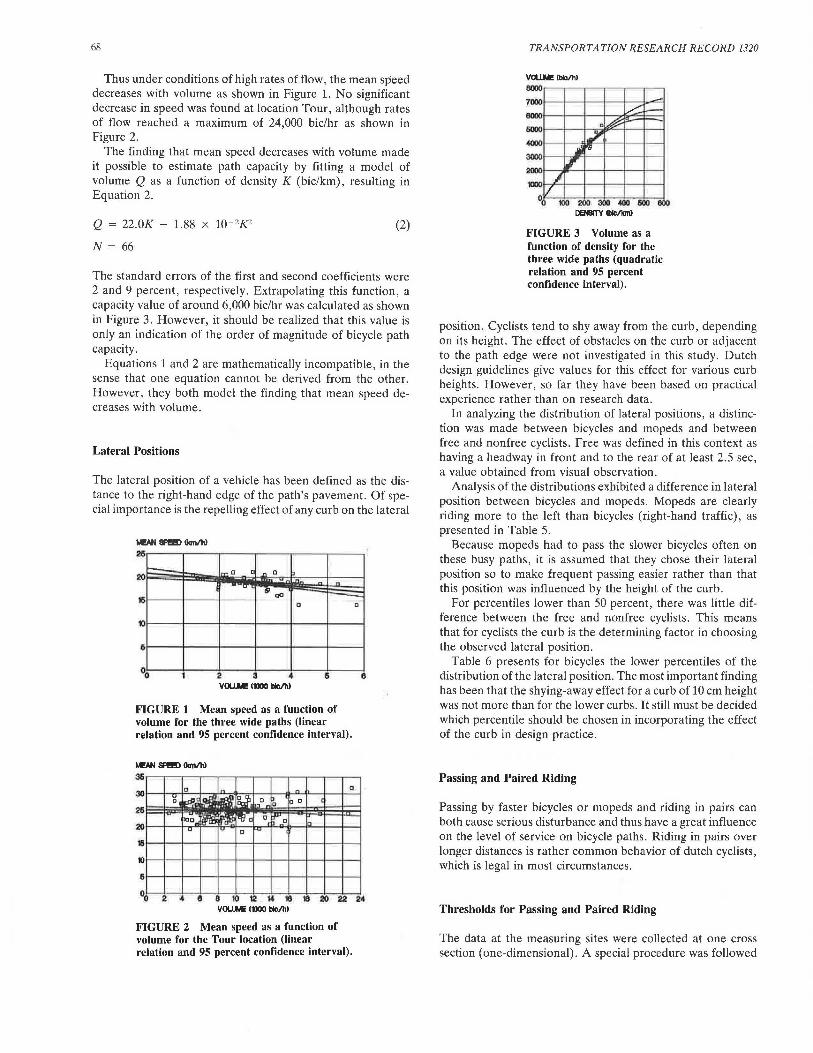
Thus under conditions of high rates of flow, the mean speed decreases with volume as shown in Figure 1. No significant decrease in speed was found at location Tour, although rates of flow reached a maximum of 24,000 bic/hr as shown in Figure 2.
The finding that mean speed decreases with volume made it possible to estimate path capacity by fitting a model of volume Q as a function of density K (bic/km), resulting in Equation 2.
Q = 22.0K - 1.88 x 10- 2K2
N = 66
(2)
The standard errors of the first and second coefficients were 2 and 9 percent, respectively. Extrapolating this function, a capacity value of around 6,000 bic/hr was calculated as shown in Figure 3. However, it should be realized that this value is only an indication of the order of magnitude of bicycle path capacity.
Equations 1 and 2 are mathematically incompatible, in the sense that one equation cannot be derived from the other. However, they both model the finding that mean speed decreases with volume.
Lateral Positions
The lateral position of a vehicle has been defined as the distance to the right-hand edge of the path's pavement. Of special importance is the repelling effect of any curb on the lateral
-- 1-a I a b ~
w 20 . -., - " iS> ca -~ .......
1ti 0
6
0 0 2 3 4 6
VOUM! 11000 ~/hl
FIGURE 1 Mean speed as a function of volume for the three wide paths (linear relation and 95 percent confidence interval).
t.eAN SPl!!D CJan/h)
36
30
26
20
16
t)
6
" 0
D • 0 u
1'&Ji f'IS'o
0
- 0
hn° - ~ D 0 c
0 -_o ...,
0
e
% 2 4 8 8 W ~ M M M 20 ~ ~ VOUM! ltlOO ~/hi
FIGURE 2 Mean speed as a function of volume for the Tour location (linear relation and 95 percent confidence interval).
TRANSPORTATION RESEARCH RECORD 1320
VOLi.Mi! lblo/hJ 8000
7000
8000
6000
4000
3000
2000
1000
0
ol""'9
,,,)', ii 'rJ
I,/' .I
v 100 200 ~ JO ..
-~ ~
JO 600 e Kl DENSITY lblc/kml
FIGURE 3 Volume as a function of density for the three wide paths (quadratic relation and 95 percent confidence interval).
position. Cyclists tend to shy away from the curb, depending on its height. The effect of obstacles on the curb or adjacent to the path edge were not investigated in this study. Dutch design guidelines give values for this effect for various curb heights. However, so far they have been based on practical experience rather than on research data.
In analyzing the distribution of lateral positions, a distinction was made between bicycles and mopeds and between free and nonfree cyclists. Pree was defined in this context as having a headway in front and to the rear of at least 2.5 sec, a value obtained from visual observation.
Analysis of the distributions exhibited a difference in lateral position between bicycles and mopeds. Mopeds are clearly riding more to the left than bicycles (right-hand traffic), as presented in Table 5.
Because mopeds had to pass the slower bicycles often on these busy paths, it is assumed that they chose their lateral position so to make frequent passing easier rather than that this position was influenced by the height of the curb .
For percentiles lower than 50 percent, there was little difference between the free and nonfree cyclists. This means that for cyclists the curb is the determining factor in choosing lhe observed lateral position.
Table 6 presents for bicycles the lower percentiles of the distribution of the lateral position. The most important finding has been that the shying-away effect for a curb of 10 cm height was not more than for the lower curbs. It still must be decided which percentile should be chosen in incorporating the effect of the curb in design practice.
Passing and Paired Riding
Passing by faster bicycles or mopeds and riding in pairs can both cause serious disturbance and thus have a great influence on the level of service on bicycle paths. Riding in pairs over longer distances is rather common behavior of dutch cyclists, which is legal in most circumstances.
Thresholds for Passing and Paired Riding
The data at the measuring sites were collected at one cross section (one-dimensional). A special procedure was followed

Botma and Papendrecht 69
TABLE 5 SO-PERCENTILE LATERAL POSITIONS (cm) OF BICYCLES AND MOPEDS
Location Width Bicycle Moped Difference
T-Narrow 180 70 97 27
Tl-Wide 240 83 166 83
T2-Wide 250 74 115 41
T3-Wide 270 84 134 50
TABLE 6 EFFECT OF CURB HEIGHT ON LATERAL POSITIONS OF BICYCLES (cm)
curb
Location Width Height
T-Narrow 180 5
Tl-Wide 240 10
T2-Wide 250 3
T3-Wide 270 0
Tour 300 0
in order to describe the two-dimensional passing maneuvers using the cross section data as a base. The procedure is described in the following paragraphs.
First, the thresholds for passing and for paired riding have been determined. From video pictures, 50 passing and 50 paired riding situations were selected and the thresholds calculated as a low percentile . The results were as follows:
• Passing takes place if the difference in speed between vehicles is more than 50 cm/sec (1.8 km/hr). For practical reasons, a second threshold was introduced, viz., the passing maneuver had to occur within a distance of 50 m from the measuring site.
• Paired riding occurs when the speed difference is less than 50 cm/sec and the headway is less than 0.125 sec.
With these thresholds, all bicycles that would pass within a certain distance from the measuring site could be determined by calculating the intersection of trajectories. This was indicated as the passing point, under the assumption that the speeds of the passing and the passed vehicles would be constant during the entire passing maneuver and equal to the speed observed at the measuring site. Passing maneuvers were only selected for further analysis if the value of the distance between the passing point and the measuring site was less than 50 m.
Shape of the Passing Maneuver
To determine the shape of the passing maneuver , the data of the three locations in town with the wide bicycle paths were combined. Of all the passing maneuvers that met the thresholds, the known data were as follows:
• Individual speeds and speed differences between passing and passed bicycles at the measuring site,
:iilli'.iM !i!U:!i!!<t
Guide- f1m;;ent il!i:s
lines p-1 p-5 p-10
25 31 41 47
50 32 42 49
25 20 34 41
25 21 38 47
25 28 41 51
• Individual lateral positions of passing and passed bicycles at the measuring site and consequently also the differences in lateral position, and
• Distances from measuring site to passing point.
In the second step, the section from - 50 to + 50 m was divided into 33 subsections of 3 m each. The difference in lateral position between passing and passed bicycles was determined in these 33 subsections. These differences varied between - 120 and + 225 cm.
The distributions of the lateral positions at each subsection were compared on equality with the first subsection at - 48 m from the measuring site with the help of the KolmogorovSmirnov test. The first subsections exhibited no significant differences. The passing maneuver appears to start at 27 m before the passing point, where the first significant difference was found, compared to the undisturbed first subsection, and to end 30 m beyond the passing point. In Figure 4, the 85-, 50-, and 15-percentile values are plotted, describing the shape of the passing maneuver. In Table 7, characteristic values of the passing maneuver for different widths of bicycle paths are presented .
The procedure applied to the data of the narrow path (1.80 m wide) was identical to that for the wide path. However,
FIGURE 4 Shape of passing maneuver at wide bicycle paths.

70 TRANSPORTATION RESEARCH RECORD 1320
TABLE 7 CHARACTERISTICS OF PASSING MANEUVERS
Path
Width
No. of No. of
Passings Subsect.
Average
Number/
Subsect.
Pass.man.related Average
to Passing Point Passing
Start End Timen
2.40 m 1,178
1.80 Ill 192
33(x3m)
15(x6m)
36
13
-27 m -12 m
+30 m 11 s
+12 m 4.Ci s
1> based upon average speed of bicycles.
the size of the sample and therefore the number of passing maneuvers was considerably smaller. The length of the subsections was therefore chosen at 6 m, which yielded a larger number of observations per subsection, necessary for a reliable distribution, but resulted in a less accurate determination of the shape of the maneuver.
Finally, the shape of the passing maneuver indicated in Figure 4 is determined by the passing bicycle. The passed bicycle keeps a straight path during the passing maneuver.
Paired Riding
On the wide bicycle path, 450 pairs of bicycles were analyzed. Tht: impurlanl findings wt:it: Lhal lhe1t: was 110 influence of speed on the relative lateral positions of the two bicycles in a pair, nor on the lateral position of the pair as such. The difference in lateral position of paired bicycles is clearly smaller than when passing, an average 65 cm for paired bicycles instead of 90 cm for passing bicycles (see Figure 5).
Frequency of Passing Maneuvers
Theoretically, the number of passing bicycles can be calculated, assuming that bicycles don't impede each other anywhere and that the space distribution of speeds is normal, with the equation [see, e.g., OECD (4)]:
n = XT(V 2/U 2)Sl(TI)112
where
n = number of passings, X = length of road section, T = length of time period,
l'RACTION UI ,,,-
r I 0.8
I / I I
I I I I
I ~"' / /
0.0 0 2S
~I/
ISO 715 100
v /
/
1215 1IO 1711 LA TBW. POllT10N lcml
FIGURE 5 Distribution of difference in lateral position of paired (left curve) and passing (right curve) riders.
(3)
2!111
V = volume of bicycles (bic/hr), U = space mean speed (km/hr), and S = standard deviation of speed (km/hr).
The number of passings and the volume per 10-min period were determined. With these data, several regression models were applied. The model with the best fit was
n = 3.0 x 10⁻⁴ V2 (4)
R 2 = 0.94 N = 73
The standard error of the coefficient was 2.6 percent. To determine the frequency of passing maneuvers, all lo
cations were first treated separately. The outcome of the models scarcely differed, so when applying the mot.lei lhe liala uf all four town locations were combined (see Figure 6). The number of passings derived from the model is smaller than the theoretical number based on perfect disorder. The coefficient in the theoretical model with correction for the threshold value becomes 4.2 x 10⁻⁴ instead of 3.0 x 10⁻⁴
• Obviously there is dependency and order in the bicycle stream.
Frequency of Paired Riding
The relation between frequency of paired riding and volume was analyzed with the same method applied for passing frequency. It was found that the number of paired bicycles is a function of volume. However, the measure of dependence differed with location. Paired riding is clearly dependent on the type of cyclist. For instance, children going to school ride more often in pairs than adults going to work.
PA819m pit 100 m trld por h tlOO~~~~~~~~~
FIGURE 6 Number of passings as a function of volume on wide bicycle paths (quadratic relation and 95 percent confidence interval).
Botma and Papendrecht
Estimation of Capacity Based on Headways
Earlier, the capacity was roughly estimated by extrapolating a relation between volume and density. In this section, the capacity is estimated using a decomposition of the flow into two types of cyclists: free and nonfree. The other assumptions of this method are as follows:
• With increasing volume, more and more cyclists are obliged to follow a bicycle in front . At capacity everybody is nonfree.
• The distribution of the headways of nonfree cyclists at volumes under capacity is the same as at capacity.
• The method of dividing the cyclists into the two categories of free and nonfree is functioning correctly.
This method has been applied to car traffic at a two-lane road (5). Details of the decomposition method are given by Wasielewski ( 6); the method for estimating the parameters of the model was improved by Groeneboom (7).
For bicycle traffic, an adjusted definition of headway is required because a stream of bicycles cannot be allocated to well-defined lanes. Two paired bicycles riding next to each other would exhibit a small headway, yet the cyclists would not feel restrained in their movements.
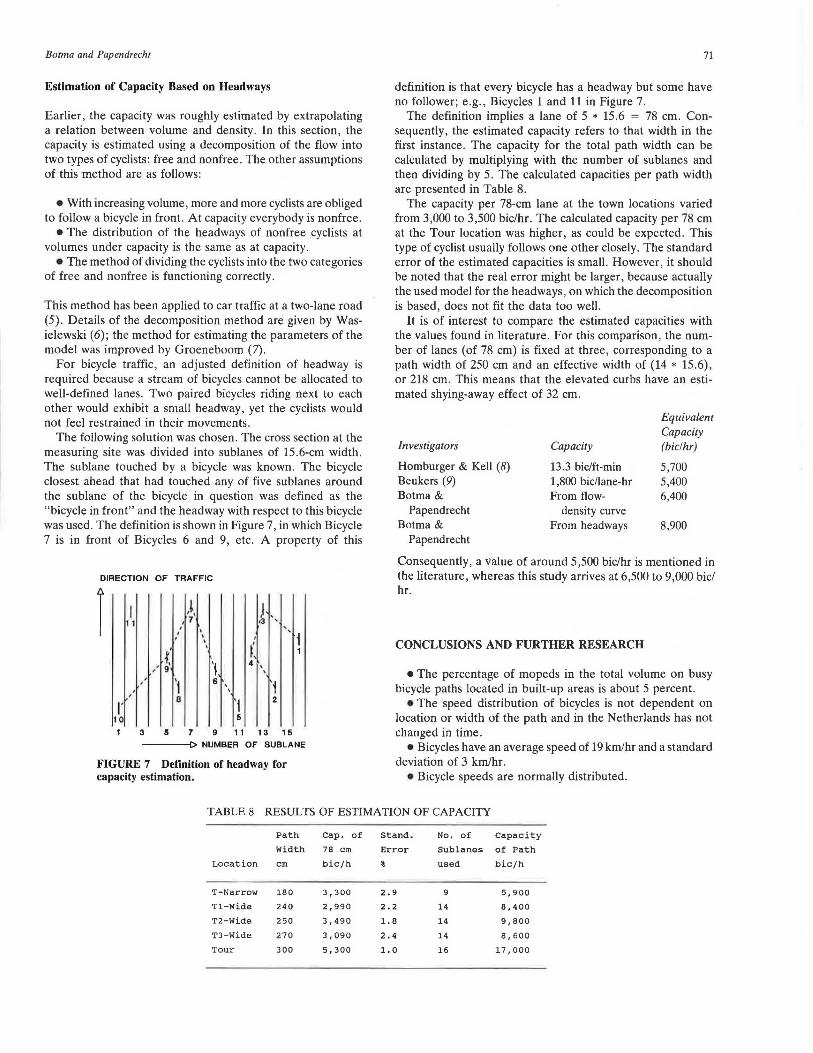
The following solution was chosen. The cross section at the measuring site was divided into sublanes of 15.6-cm width . The sublane touched by a bicycle was known. The bicycle closest ahead that had touched any of five sublanes around the sublane of the bicycle in question was defined as the "bicycle in front" and the headway with respect to this bicycle was used. The definition is shown in Figure 7, in which Bicycle 7 is in front of Bicycles 6 and 9, etc. A property of this
DIRECTION OF TRAFFIC
r ,~, ,I, 11 1"3 '
I
' ' ' ' ' ' ' ' ( ' I
'i 4 ' ,' 9 '
I I
'1 6 ' I ' ' 8 'I 2
I' 10 5
3 5 7 9 11 13 15
----[> NUMBER OF SUBLANE
FIGURE 7 Definition of headway for capacity estimation.
71
definition is that every bicycle has a headway but some have no follower; e.g., Bicycles 1and11 in Figure 7.
The definition implies a lane of 5 * 15.6 = 78 cm. Consequently, the estimated capacity refers to that width in the first instance. The capacity for the total path width can be calculated by multiplying with the number of sublanes and then dividing by 5. The calculated capacities per path width are presented in Table 8.
The capacity per 78-cm lane at the town locations varied from 3,000 to 3,500 bic/hr. The calculated capacity per 78 cm at the Tour location was higher, as could be expected. This type of cyclist usually follows one other closely. The standard error of the estimated capacities is small. However, it should be noted that the real error might be larger, because actually the used model for the headways, on which the decomposition is based, does not fit the data too well.
It is of interest to compare the estimated capacities with the values found in literature. For this comparison, the number of lanes (of 78 cm) is fixed at three, corresponding to a path width of 250 cm and an effective width of (14 * 15.6), or 218 cm. This means that the elevated curbs have an estimated shying-away effect of 32 cm.
Investigators
Homburger & Kell (8) Beukers (9) Botma &
Papendrecht Botma &
Papendrecht
Capacity
13.3 bic/ft-min 1,800 bic/lane-hr From flow-
density curve From headways
Equivalent Capacity (bic/hr)
5,700 5,400 6,400
8,900
Consequently, a value of around 5,500 bic/hr is mentioned in the literature, whereas this study arrives at 6,500 to 9,000 bic/ hr.
CONCLUSIONS AND FURTHER RESEARCH
• The percentage of mopeds in the total volume on busy bicycle paths located in built-up areas is about 5 percent .
• The speed distribution of bicycles is not dependent on location or width of the path and in the Netherlands has not changed in time.
• Bicycles have an average speed of 19 km/hr and a standard deviation of 3 km/hr.
• Bicycle speeds are normally distributed.
TABLE 8 RESULTS OF ESTIMATION OF CAPACITY
Path Cap. of stand- No. Of Capacity
Width 78 cm Error Sub lanes of Path
Location cm bic/h t used bic/h
T-Narrow 180 3,300 2.9 9 5,900
Tl-Wide 240 2,990 2.2 14 8,400
T2-Wide 250 3,490 1. 8 14 9,800
T3-Wide 270 3,090 2.4 14 8,600
Tour 300 5,300 1. 0 16 17,000

72
• Speeds of mopeds are slightly influenced by path width . •The overall mean speed of mopeds is 38 km/hr; the stan
dard deviation is 5 km/hr. •No systematic effect of volumes on mean speeds of bi
cycles or mopeds has been found. • Only on the narrow bicycle path, higher volumes of bi
cycles reduced the average speed of mopeds. • On the basis of the analysis of groups with small head
ways, there is a small decrease of average speed with volume. The estimated capacity determined by extrapolation is 6,500 bic/hr.
• Even at the Tour ride with values of volumes in groups of 23 ,000 bic/hr, still no influence was found on the average speed.
• The lateral position of mopeds is clearly more to the left than that of bicycles. It is determined more by the passing maneuver than by the height of the curb.
• The height of the curb does not influence the lateral position of bicycles. No difference in effect between curb heights of 5 and 10 cm was found, as indicated in the Dutch design guidelines.
• The length of a passing maneuver of bicycles on a wide path is 57 m; the passing time is 11 sec. At the passing point, the average lateral distance between vehicles is 100 cm.
• On a narrow path, the length of a passing maneuver is 24 m and the passing time is 4 sec. At the passing point, the average lateral distance between vehicles is 75 cm.
•On a wide path, the average lateral distance between paired bicycles is 65 cm, which is 25 cm less than between passing bicycles.
• The frequency of passing maneuvers is proportional to the volume squared. However, the actual frequency is less than the number derived from a lheorelit.:al model based 011
perfect disorder, which suggests some dependency between cyclists .
• The estimated capacity of a bicycle path of 2.50 m, based on decomposition in free and nonfree cyclists, leads to a value of around 9,000 bic/hr. That is higher than the capacity values mentioned in the literature of around 5 ,500 bic/hr.
Further research is planned to develop criteria to indicate the level of service on a bicycle path. From this study, it has become clear that mean speed is unsuited as a quality-of-flow
TRANSPORTATION RESEARCH RECORD 1320
indicator, because mean speed is constant over a large volume range .
The planned research should develop a quality-of-flow indicator related to the degree of freedom to maneuver and the possibility to make unrestricted passing maneuvers. This will be done most likely by the development of a simulation model based on the findings in this study.
ACKNOWLEDGMENTS
The study described in this paper was sponsored by the Netherlands Ministry of Transport and Public Works, more specifically, the Transportation and Traffic Engineering Division of Rijkswaterstaat. We wish to thank the sponsor for his permission to publish these results.
REFERENCES
1. P. H. L. Bovy and M. J . P. F. Gommers. Mobility and Use of Means of Transportation in Middle Sized Cities: Some Recent Figures. (In Dutch.) In Proc., Colloquium Vervoersplanologisch Speurwerk, E. J. Verroen, ed., Delft, C.V.S., Netherlands, 1987.
2. Statistisch Zakboek 1984 and 1990. (In Dutch.) Central Bureau for Statistics CBS , Staatsuitgeverij, The Hague , Netherlands.
3. J . de Vries. The Relation Between Speed and Volume for Bicycle Traffic. (In Dutch.) Transportation Research Laboratory, TU Delft, Netherlands, 1979.
4. Speed Limits Outside Built-Up Areas. Organization of Economic Cooperation and Development, Paris, 1972.
5. H. Botma, J. H. Papendrecht, and D. Westland. Validation of Capacity Estimators Based on the Decomposition of the Distribution of Headways. Transportation Research Laboratory, TU Delft, Netherlands, 1980.
6. P. Wasielewski. Car-Following Headways on Freeways Interpreted by the Semi-Poisson Headway Distribution. Transportation Science, Vol. 13, No . 1, 1979, pp. 36-55.
7. P. Groeneboom. Research on Time Headways on2 x2-Lane Freeways. (In Dutch.) Centrum voor Wiskunde en Informatica, Amsterdam, Netherlands, 1984.
8. W. S. Homburger and J . K. Kell. Fundamentals of Traffic Engineering. Institute of Transportation Studies, Berkeley, Calif., 1988.
9. B. Beukers. Bicycles and Mopeds as Alternative Modes of Transportation. Proc., 13th International Study Week in Traffic Engineering and Safety, Montreux, Sept. 1978.
Publication of this paper sponsored by Committee on Traffic Flow Theory and Characteristics.