classification of bicycle traffic patterns in five north american cities
TRANSCRIPT

Miranda-Moreno, Nosal, Schneider, Proulx 1
Classification of bicycle traffic patterns in five North American Cities
Luis F. Miranda-Moreno (corresponding author) Assistant Professor
Department of Civil Engineering and Applied Mechanics McGill University
Macdonald Engineering Building 817 Sherbrooke Street West, Montréal, QC H3A 2K6 CANADA
Phone: 514-398-6589 E-mail: [email protected]
Thomas Nosal Research Assistant
Department of Civil Engineering and Applied Mechanics McGill University
Macdonald Engineering Building 817 Sherbrooke Street West, Montréal, QC H3A 2K6 CANADA
Phone: 514-398-6589 E-mail: [email protected]
Robert J. Schneider Post-Doctoral Researcher
Safe Transportation Research and Education Center (SafeTREC) University of California, Berkeley
2614 Dwight Way #7374, Berkeley, CA 94720-7374 Phone: 510-642-0566
E-mail: [email protected]
Frank Proulx Graduate Student Researcher
Safe Transportation Research and Education Center (SafeTREC) University of California, Berkeley
2614 Dwight Way #7374, Berkeley, CA 94720-7374 Phone: 510-642-0566
E-mail: [email protected]
Paper prepared for presentation at the 92nd Annual Meeting of the Transportation Research Board, January 2013
Word count @ 5,500 (text) + 9*250(tables and figures) = 7750 words
TRB 2013 Annual Meeting Paper revised from original submittal.

Miranda-Moreno, Nosal, Schneider, Proulx 2
ABSTRACT
This paper analyses bicycle ridership patterns using a unique database of automated bicycle
counts from approximately 40 locations in five North American cities and along the Route Verte
in Quebec. The cities involved in this study are Montreal, Ottawa, Portland, San Francisco, and
Vancouver. Count data show that the bicycle volume patterns at each location can be classified
as utilitarian, mixed utilitarian, recreational and mixed recreational. Study locations classified
into each of these categories are found to have consistent hourly and weekly traffic patterns,
despite important differences between these cities in terms of factors such as weather, size, and
urban form. Expansion factors for each location type are presented by hour and day of the week.
There were differences in seasonal patterns of bicycle activity between the study locations, so
different monthly expansion factors are presented for each city. Finally, some traffic volume
characteristics are presented for comparison purposes.
TRB 2013 Annual Meeting Paper revised from original submittal.

Miranda-Moreno, Nosal, Schneider, Proulx 3
1. INTRODUCTION
As bicycle usage and networks grow in size and complexity, there is a need to monitor and
evaluate the characteristics of bicycle ridership at different locations over time. A full
understanding of temporal cyclist ridership patterns can help municipalities:
(i) Monitor the evolution of bicycle ridership on specific facilities (e.g., bicycle lanes or
cycle tracks) or along corridors. Municipalities are often interested in quantifying the
attractiveness of the bicycle infrastructure and how ridership is evolving over time.
(ii) Evaluate the impact of new bicycle infrastructure, programs or policies to encourage
cycling.
(iii) Collect data for traffic safety studies to identify design characteristics that can pose safety
issues.
(iv) Identify current ridership patterns and predict future demand. This can help with
operating and maintaining bicycle facilities. Knowing the distribution of hourly traffic
can be useful for timing traffic signals, assigning traffic patrols to certain times of day,
and scheduling maintenance work.
(v) Generate expansion factors to extrapolate manual short-term counts into average annual
daily traffic as is typically done for motor vehicle traffic. This is useful for a broad range
of studies that require estimate of cyclist exposure in locations that lack permanent data
collection.
(vi) Prioritize funding for new facilities based on predicted demand.
In response to these and other bicycle data needs, several North American cities and bicycle
organizations have installed automated data collection technologies to collect continuous counts
in specific locations. Despite the increase in data collection efforts in the last years, there is still
little published work on the analysis of bicycle ridership patterns in North America. Practical
experience and very few studies suggest that bicycle ridership patterns might vary across cities
and location types. For example, urban areas may have typical commuting patterns with distinct
morning and afternoon peaks or cold-climate cities may have lower ridership during winter
months. However, previous research on these patterns has been limited (1, 2).
TRB 2013 Annual Meeting Paper revised from original submittal.

Miranda-Moreno, Nosal, Schneider, Proulx 4
According to their use and ridership characteristics, bicycle facilities are often classified
as either utilitarian (which includes any cycling not done mainly for fitness and/or recreation but
as a means of transport) or recreational (leisure, social and/or fitness activities). This
classification may be overly simplistic, given that in most cases ridership is composed of a mix
of users with utilitarian and recreational purposes, independent of facility design. For instance,
cycle tracks can be mainly utilitarian during the week but also be heavily used on the weekend
for recreational purposes, as has been documented in previous works (1,2). Multiuse paths serve
recreational bicyclists but are also used for trips to work, school, and many other utilitarian
purposes (3). Bicycle volumes may also exhibit different types of patterns based on the
characteristics of a location rather than the specific facility type.
Classification is necessary for the generation of expansion factors for different types of
facilities, as has been done for many years in freeways and rural roads (4 - 7). Expansion factors
are critical for extrapolating short-term counts into average annual daily traffic which are useful
in different applications in transportation such as bicycle safety, demand analysis and pollution
exposure (8 - 10). Classification will also help for carrying on comparative analysis across
facilities as well as monitoring and detecting bicycle demand changes over time (11, 12). The
justification of bicycle infrastructure is always easier when performance towards goals is
demonstrated, in particular when funding is questioned (13, 14). Being able to have a point of
references (e.g., average annual daily traffic) from similar facilities in other cities can help
municipalities to fix their goals and evaluate their performance.
In this regard, the objectives of this paper are three-fold:
- Analyze bicycle traffic patterns using a unique database containing automatic hourly
counts from locations in five North American cities (San Francisco, Portland, Montreal,
Vancouver and Ottawa) and along the Route Verte, a bicycle facility network spanning
the Canadian province of Quebec.
- Present a general classification scheme for bicycle traffic patterns according to automated
count data.
- Calculate expansion factors based on location type and region, and a set of simple
performance measures for comparative analysis. Permanent locations with similar traffic
patterns are grouped together and expansion factors are generated for expanding short-
duration counts.
TRB 2013 Annual Meeting Paper revised from original submittal.

Miranda-Moreno, Nosal, Schneider, Proulx 5
By including different cities with a variety of bicycle facilities and location characteristics (such
as weather, urban environment, and size), this paper is expected to reach more generalized
conclusions for the cycling conditions in North America. This paper shows that bicycle traffic
patterns can be classified into four groups: primarily utilitarian, mixed-utilitarian, mixed-
recreational, and primarily recreational.
2. STUDY LOCATIONS AND DATA
This section introduces the urban areas (cities) where locations are located. This is followed by a
description of the data.
2.1 Description of Study Areas
This study utilizes a unique cyclist-count database from a large set of automatic counting stations
in five North American cities, as well as along the Route Verte in Quebec, operated by Velo
Quebec (VQ). There are four locations in Montreal (refereed as Mon1-Mon4), two in Ottawa
(denoted as Ott1-Ott2), one in Portland (refereed as Port), eight in San Francisco(denoted as
SF1-SF8), six in Vancouver (Van1-Van6), and sixteen along the Route Verte, in cities and towns
from Montreal to Quebec City (refereed as VQ1-VQ16). The locations chosen for this study
have some of the most extensive sets of automated bicycle count data in North America General
characteristics of the cities and the Route Verte are described below, and Table 1 presents a brief
description of each specific counter location involved in the analysis.
Montreal: Montreal experiences warm, often humid, summers, as well as cold, snowy winters.
Average daily high temperatures range from 27°C in July to -9°C in January. Montreal receives
roughly 980mm of precipitation per year, 220 mm of which is snow. Several of its bicycle
facilities have been in use since the 1970’s, and Montreal has recently constructed several new
bicycle lanes and physically separated cycle-tracks. For these, as well as many km of multiuse
paths in and around the city, Montreal has received accolades as a cycling city. (15)
Ottawa: Like Montreal, Ottawa experiences hot, humid summers and cold, snowy winters.
Ottawa experiences similar temperatures to Montreal, and Ottawa receives 944 mm of
precipitation per year, 212 mm of which is snow. (15) Although Ottawa has only recently begun
TRB 2013 Annual Meeting Paper revised from original submittal.

Miranda-Moreno, Nosal, Schneider, Proulx 6
to construct bicycle facilities, it now boasts an expanding network of cycle tracks and bicycle
lanes.
Portland: Portland is characterized by a temperate climate, with mild, wet winters and dry
summers. Average high temperatures range from 8°C in January to 26°C in July. Rainfall
averages 950 mm per year in downtown Portland (17). Portland's bridges act as feeders to carry
commuters and students from neighborhoods east of the Willamette River into the downtown
area and beyond, with the Hawthorne bridge carrying more bicycle traffic than any other bridge
in the city. Portland was described by one researcher (16) to be “the American city that comes
closest to implementing a truly comprehensive, well-integrated, long-term package of
infrastructure, programs, and policies to promote cycling.”
San Francisco: San Francisco is known for mild temperatures year-round, hilly topography, and
frequent fog. Average high temperatures range from 14°C in December to 22°C in September in
downtown, with average annual precipitation of 600 mm (17). San Francisco has the lowest rate
of precipitation and the highest winter temperatures of the locations under study. Bicycle
infrastructure in San Francisco currently includes roughly 37 km of separated bicycle paths and
72 km of on-street bicycle lanes (18). These facilities, as well as designated bicycle routes
without any dedicated bicycle lanes, serve most of the spatially constrained city.
Vancouver: Vancouver has a temperate climate that is similar to Portland’s. Located in the
region with the warmest winters in Canada, Vancouver has high temperatures ranging from 6°C
in January to 22°C in July. Also like Portland, Vancouver experiences rainy winters and
relatively dry summers, averaging 1155 total mm of precipitation per year. (15) Vancouver has a
network of bicycle facilities that serve downtown, residential neighborhoods and recreational
destinations in and out of the city. In recent years, Vancouver has implemented bicycle-oriented
traffic calming measures and constructed new bicycle facilities.
Route Verte (“Green Route”): The Route Verte is an extensive bicycle network spanning
Quebec, made up of over 4, 900 km of bikeways. This vast bicycle route, considered the most
extensive in North America, includes a variety of facilities, such as multiuse paths, designated
shared roadways, and paved shoulders. All Route Verte counting stations analyzed in this study
are located on pathways in suburban or rural areas. (19) The climate in each location is much like
that of Montreal and Ottawa (15).
TRB 2013 Annual Meeting Paper revised from original submittal.

Miranda-Moreno, Nosal, Schneider, Proulx 7
Table 1. Bicycle Counter Locations
Region Facility Location Facility Type Average
Daily Volume1
# Observations (Days)2
Montreal
Mon1 Maisonneuve at Peel Cycle Track 2200 183
Mon2 Maisonneuve at Berri Cycle Track 4324 191
Mon3 Brebeuf at Rachel Cycle Track 3736 228
Mon4 Berri at Maisonneuve Cycle Track 3735 197
Ottawa Ott1 Ottawa River Path Multiuse Path 1637 240
Ott2 Colonel By Pathway Multiuse Path 832 240
Portland Port Hawthorne Bridge Separated Bikeway 4869 244
San Francisco
SF1 Northpoint at Polk Paired Bicycle Lanes 421 322
SF2 Polk at Grove Unidirectional Bicycle Lane 404 328
SF3 Potrero at 23rd St. Paired Bicycle Lanes 259 147
SF4 Valencia at 14th St. Paired Bicycle Lanes 2475 182
SF5 Seventh Ave. at Kirkham Paired Bicycle Lanes 156 482 SF6 Panhandle at Masonic Multiuse Path in Park 3452 175
SF7 Lake at Arguello Paired Bicycle Lanes 188 172 SF8 Arguello at Lake Paired Bicycle Lanes 511 172
Vancouver
Van1 Cambie St. Bridge Separated Bikeway 3004 335
Van2 CV Greenway at Rupert Bicycle Path 336 383
Van3 CV Greenway at Victoria Bicycle Path 990 332
Van4 Ontario at 11th St. On-Street Bicycle
Boulevard 543 345
Van5 Burrard St. Bridge Bicycle Lane Separated Path 805 344
Van6 Canada Line Bridge Bike/Ped Bridge 788 332
Velo Quebec
Route Verte
VQ1 Métabéchouan, QC Asphalt Bicycle Path 232 492
VQ2 Duschesnay, QC Gravel Bicycle Path 154 500
VQ3 Québec, QC Asphalt Bicycle Path 1015 457
VQ4 Lennoxville, QC Gravel Bicycle Path 207 458
VQ5 Lévis, QC Asphalt Bicycle Path 1034 444 VQ6 Cabano, QC Gravel Bicycle Path 144 466
VQ7 St-Jean-sur-Richelieu, QC
Asphalt Bicycle Path 200 518
VQ8 Longueuil, QC Asphalt Bicycle Path 413 223 VQ9 Cushing, QC Asphalt Bicycle Path 112 361
VQ10 Laval, QC Asphalt Bicycle Path 590 492
VQ11 Granby, QC Asphalt Bicycle Path 267 492
VQ12 Mont-Rolland, QC Gravel Bicycle Path 359 448
VQ13 Trois Rivières, QC Asphalt Bicycle Path 542 442 VQ14 Victoriaville, QC Asphalt Bicycle Path 62 382 VQ15 Gatineau, QC Asphalt Bicycle Path 34 496 VQ16 Blainville, QC Asphalt Bicycle Path 135 399
1 Average daily volume during study months (April to Novmber)
2 Observation days are only during study months (April to November)
TRB 2013 Annual Meeting Paper revised from original submittal.
Miranda-Moreno, Nosal, Schneider, Proulx 8
2.2 Cyclist Count Data Collection
The data for the 37 permanent locations consist of disaggregated automatic hourly bicycle counts
collected with automatic inductive loop detectors embedded in the pavement of bicycle facilities.
Past studies have shown that this equipment achieves high levels of accuracy (96% and more)
(20, 21) The data were collected by the municipal planning departments of the cities under
study, as well as by Velo Quebec (VQ), a non-profit cycling advocacy and research organization.
All data were collected between 2008 and 2011, and each facility had at least one season of data.
Some bicycle facilities in Montreal, Ottawa, and along the Route Verte are not maintained during
winter, so in order to be consistent, this analysis only incorporated data from April through
November (inclusive).
Before analysis, each dataset was reviewed thoroughly to identify missing values, which
can be caused by routine maintenance, counter malfunction, construction, or other factors. In
addition, an effort was made to identify extreme values. For instance, large bicycle races or
group rides on the Route Verte result in days with abnormally large total counts. Days with
missing data or extreme values were excluded from the analysis of bicycle traffic patterns. Note
that despite the high levels of accuracy, in-pavement loops do not count bicyclists with 100%
accuracy. While the count data presented here are not adjusted for undercounting, the counter
technology used at all locations in this study is similar and comparisons between sites are
assumed to be consistent. However, if future validation studies show that accuracy varies by
location, time, activity level, or other factors, some of the patterns identified in the analysis
should be adjusted slightly.
TRB 2013 Annual Meeting Paper revised from original submittal.

Miranda-Moreno, Nosal, Schneider, Proulx 9
3. METHOD OF ANALYSIS OF TRAFFIC PATTERNS
3.1 Definition of standardized indices
The bicycle traffic patterns are analyzed using hourly and daily indices, which express the
average cyclist count for a given hour, day or month as a percentage of the seasonal daily
average (equations 1-5). Because they are standardized with respect to the seasonal average, the
indices facilitate comparisons of temporal profiles across facilities that exhibit different absolute
ridership levels. In the vehicular traffic literature, these indices are typically referred to as
expansion factors, and they can also be used to convert brief manual cyclist counts into overall
yearly averages, as explained later.
Standardized Hourly, Daily, and Monthly Indices
�� = (�̅�/ ��) (1)
�� = (�̅�/ ��) (2)
�� = (�̅�/ ��) (3)
Where:
Ih, Id, Im = standardized hourly, daily and monthly indices, respectfully.
�̅�, �̅�, �̅� = seasonal (from April to November) averages for a given hour h, day of the week d, or month m, respectively.
��� = average daily volume (ADV) over a biking season or year.
Traffic Distribution Indices
Traffic distribution indices are used to quickly summarize the distribution of bicycle traffic
throughout the day, week or year, and are defined in equations 4 – 5.
���/�� = (�̅��/�̅��) (4)
Where:
���/��= relative index of weekend vs. weekday cycling traffic (WWI).
�̅��, �̅��= seasonal average daily weekend and weekday traffic, respectively.
���/��� =��
��
�����
(5)
Where:
TRB 2013 Annual Meeting Paper revised from original submittal.

Miranda-Moreno, Nosal, Schneider, Proulx 10
���/���= relative index of morning (hours 7:00 to 9:00) to midday (hours 11:00 to 13:00) cycling traffic (AMI).
���� = ∑ ��
����
����� = ∑ ��
!��
3.2 Classification of Bicycle Traffic Patterns
The bicycle traffic patterns were classified using the following procedure.
1. Identification of locations with utilitarian and recreational patterns.
The hourly, daily and monthly indices were computed for each counter location using
equations 1 and 2. The values for each facility were plotted to graphically portray the
hourly and daily profiles. Locations with either standard utilitarian or recreational
traffic patterns were identified. For instance, typical utilitarian patterns consist of two
peak traffic periods on weekdays (during the AM and PM commuting hours) and a
higher proportion of traffic during the week than on the weekend. Standard
recreational patterns consist of one midday or PM peak traffic period on weekdays,
and a higher proportion of traffic on weekends than during the week. This has been
documented in recent bicycle studies (1, 2, 22). These patterns again are similar to
those in highways (4, 6). The locations without typical utilitarian or recreational
patterns were identified as mixed facilities.
2. Determination of confidence intervals (CI) for utilitarian and recreational groups.
Using the data from the locations with standard utilitarian and recreational patterns,
95% confidence intervals were constructed using the mean and standard deviation of
each hourly and daily index across all facilities in each group. For instance, the lower
(LL) and upper limits (UL) for the hourly profile were estimated as �̅� ±
1.96('� √)⁄ ), where h ranges from 0 to 23. The CI’s were then superimposed on the
hourly and daily profiles and used to validate the initial classifications made in step 1.
An iterative process was used to refine the CI’s and groups; if a location’s hourly and
daily profiles did not fit within the upper and lower limits of the CI for utilitarian or
recreational locations, that location was moved to the mixed category and the CI’s
were recalculated with the remaining locations. This was repeated until all facilities
remaining in the utilitarian or recreational groups fit within the respective CI’s.
TRB 2013 Annual Meeting Paper revised from original submittal.

Miranda-Moreno, Nosal, Schneider, Proulx 11
3. Classification of mixed facilities.
The patterns of the facilities that had been classified to the mixed category as an
outcome of the previous step are further analyzed in this step. Many of these locations
still exhibit similar patterns to the utilitarian or recreational locations, despite not
fitting completely into either. For instance, certain locations did not exhibit higher
ridership during the week than on the weekend, but still exhibited AM and PM
commuting peaks. Other locations also did not exhibit higher ridership during the
week than on the weekend, but exhibited one weekday peak, like recreational
facilities. CI’s were constructed for these two subgroups and again, the upper and
lower CI limits was then used to identify those locations with uncommon patterns. If
the patterns of a location fell within the defined CIs, it was classified as either
“mixed-utilitarian” or “mixed-recreational”. If not, the location was classified as an
outlier with an anomalous classification. Locations that do not fall in any of these
four categories were excluded from the calculation of the expansion factors.
The procedure outlined above is illustrated in Figure 1 for the utilitarian and mixed utilitarian
classifications. The same procedure was applied to arrive at the recreational and mixed
recreational classifications.
TRB 2013 Annual Meeting Paper revised from original submittal.

Miranda-Moreno, Nosal, Schneider, Proulx 12
Fig. 1. Classification of the city counting locations
TRB 2013 Annual Meeting Paper revised from original submittal.

Miranda-Moreno, Nosal, Schneider, Proulx 13
4. RESULTS
This section provides the results of the location classification using the procedure described
above. In addition to a discussion of the bicycle traffic classifications in the five study cities and
the Route Verte, this section presents expansion factors for use in practice.
4.1 Traffic ridership analysis at city locations
Following the procedure defined in Section 3 and illustrated in Figure 1, the bicycle traffic
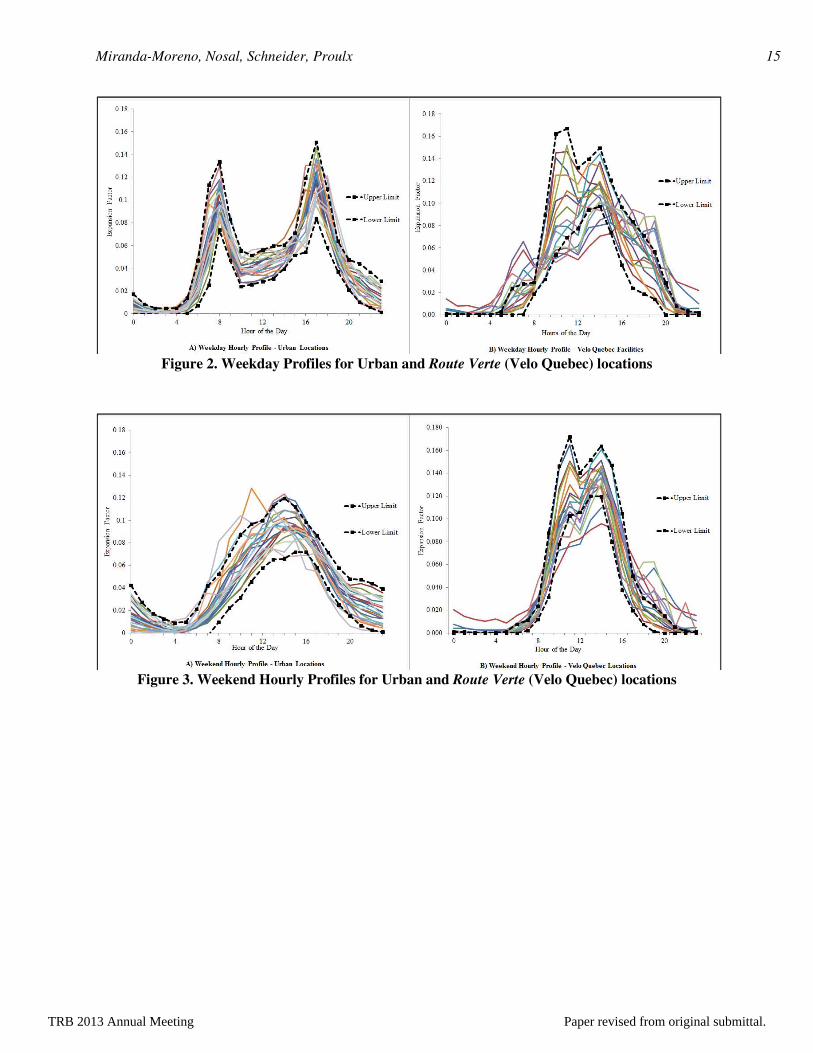
patterns were calculated for each count location. Figures 2 and 3 show the average hourly
profiles across 24 hours for the city and Route Verte locations during weekdays and weekends,
respectively. Figure 4 shows the daily profiles over the week for both city and Route Verte
locations.
With few exceptions, most of the locations in the five urban areas exhibit two very
pronounced peaks during the AM and PM commute times on workdays (Figure 2a). In addition,
they have higher ridership during the workweek than on the weekend (Figure 4a). Locations
with such patterns are classified as “primarily utilitarian”. To validate the correct classification of
each of these facilities, hourly and daily CIs were also estimated as illustrated in Figure 2 - 4.
As explained in the previous section, facilities that do not fall within CIs were grouped as
locations with mixed patterns. The temporal profiles of these locations are reproduced separately
in Figure 5, along with the mean profiles of the primarily utilitarian facilities, for clarity. With
the exception of SF8, these locations maintain relatively consistent ridership throughout the
week. However, all of the hourly profiles of these locations still exhibit two distinct peaks during
the workweek. This suggests that although the bicycle traffic on the weekend is as high as on the
weekdays, these locations are still used heavily during the commuting hours, with two rush-peak
periods. These facilities are labeled “mixed-utilitarian”.
The anomalous counter is SF8, which is located on the border of Presidio National Park,
en route to the Golden Gate Bridge. Due to high tourist traffic to the bridge and park, SF8’s daily
profile is very similar to that of a recreational location. However, due to commuting traffic
during the week, it still exhibits two distinct peaks during the workweek, with slightly higher
noontime traffic. SF8 also exhibits a very recreational weekend hourly profile, with greater use
TRB 2013 Annual Meeting Paper revised from original submittal.

Miranda-Moreno, Nosal, Schneider, Proulx 14
occurring in the morning than the utilitarian average. Although this location is clearly mixed-use,
it is not included in the mixed-utilitarian category for the sake of preserving consistency.
4.2 Traffic ridership analysis at Route Verte locations
With some exceptions, most of the suburban and rural count locations along the Route Verte
exhibit only one midday or PM peak on both workdays and weekends (Figures 2b and 3b), as
well as lower ridership during the workweek than on the weekend (Figure 4b). Locations
exhibiting these patterns were classified as “primarily recreational”, as discussed in the
methodology section. Again, following the procedure defined in 3.2, locations that deviated from
typical recreational patterns were singled out. For clarity their traffic patterns are presented in
Figure 6. Like the mixed-utilitarian locations, these also maintain relatively consistent ridership
throughout the seven days of the week. However, although some may have a small AM peak, the
hourly profiles do not exhibit two distinct peaks commuting peaks. This suggests that although
they may be relatively mixed-use, they are still used more heavily for recreational purposes.
These facilities are labeled “mixed-recreational”.
It should be noted that the mixed recreational locations have greater variability than the
mixed-utilitarian category. Figures 6a and 6b present the profiles of MR locations that exhibit
higher WWI values (ranging from 1.34 to 1.51), while Figures 6c and 6d display the profiles of
the MR locations that exhibit lower WWI values (0.96 to 1.20). The MR locations with higher
WWI values more closely resemble primarily recreational facilities. However, those with lower
WWI values appear more irregular. Although they do not exhibit two distinct peaks like the PU
or MU facilities, they tend to exhibit an AM peak, suggesting more mixed use. It is possible that
the variations in temporal profiles across mixed-recreational locations can be explained by the
locations characteristics, such as the surrounding land use, density, its proximity to attractions,
town centers, and so on. For instance, two locations may be experiencing roughly the same
proportion of recreational and utilitarian use, but because one is closer to a town, it may get used
more during the week, whereas the more remote locations are visited only for longer rids on the
weekend. More specific categories that include such characteristics might be necessary. Until
this can be investigated with GIS based land-use characteristics, the recreational category was
made to contain only those facilities with very high WMI values.
TRB 2013 Annual Meeting Paper revised from original submittal.
Miranda-Moreno, Nosal, Schneider, Proulx 15
Figure 2. Weekday Profiles for Urban and Route Verte (Velo Quebec) locations
Figure 3. Weekend Hourly Profiles for Urban and Route Verte (Velo Quebec) locations
TRB 2013 Annual Meeting Paper revised from original submittal.

Miranda-Moreno, Nosal, Schneider, Proulx 16
Figure 4. Daily Profiles for Urban and Route Verte (Velo Quebec) locations
Figure 5. Mixed Utilitarian Daily and Hourly Profiles
TRB 2013 Annual Meeting Paper revised from original submittal.

Miranda-Moreno, Nosal, Schneider, Proulx 17
Figure 6. Traffic Profiles for Mixed Recreational Facilities
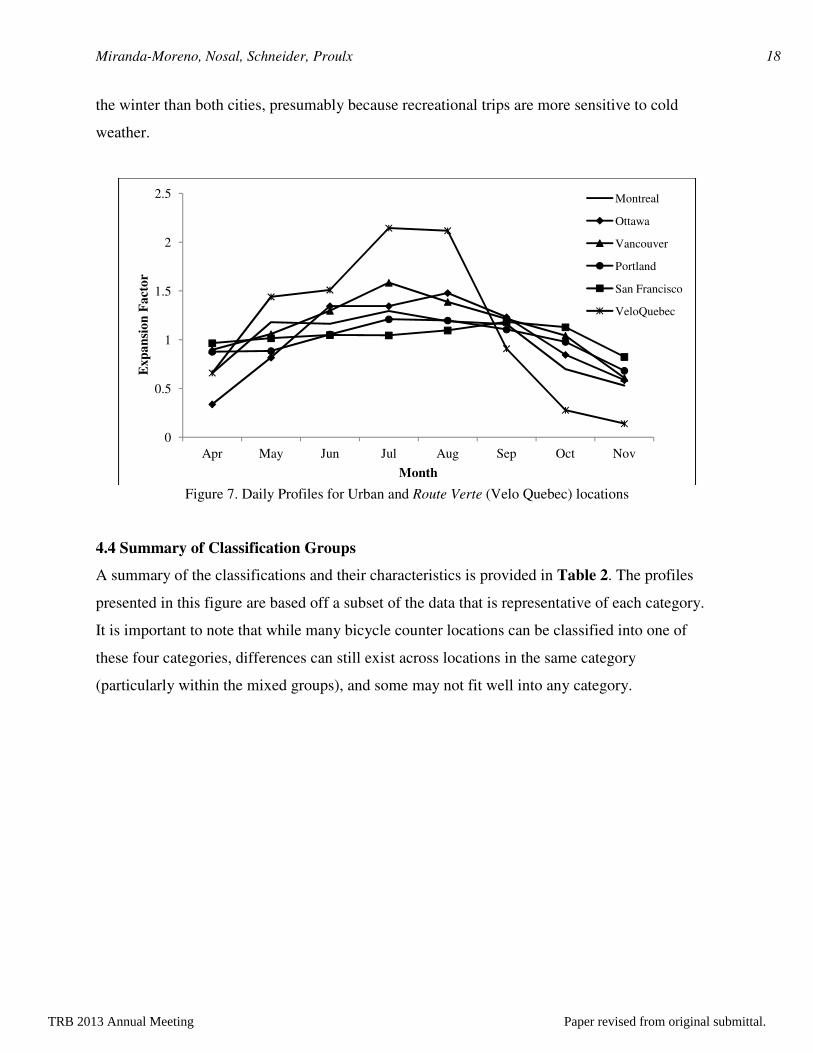
4.3 Seasonal (monthly) Patterns across Regions and Classifications
As seen before, hourly and daily patterns presented in Figures 2 – 4 appear relatively consistent
across regions; i.e. primarily utilitarian locations in Vancouver exhibit very similar hourly
profiles to those of primarily utilitarian facilities in Montreal. However, monthly patterns vary
considerably across both classifications and regions (Figure 7). For example, when examining
seasonal data from April through November, Vancouver’s utilitarian facilities retain higher
ridership in November than both Montreal and Ottawa, suggesting that because Vancouver has
warmer winters, more of its utilitarian cyclists ride year-round. However, the Velo Quebec
facilities, which share a climate similar to that of Montreal and Ottawa, retain far less ridership in
TRB 2013 Annual Meeting Paper revised from original submittal.
Miranda-Moreno, Nosal, Schneider, Proulx 18
the winter than both cities, presumably because recreational trips are more sensitive to cold
weather.
Figure 7. Daily Profiles for Urban and Route Verte (Velo Quebec) locations
4.4 Summary of Classification Groups
A summary of the classifications and their characteristics is provided in Table 2. The profiles
presented in this figure are based off a subset of the data that is representative of each category.
It is important to note that while many bicycle counter locations can be classified into one of
these four categories, differences can still exist across locations in the same category
(particularly within the mixed groups), and some may not fit well into any category.
0
0.5
1
1.5
2
2.5
Apr May Jun Jul Aug Sep Oct Nov
Exp
ansi
on F
acto
r
Month
Montreal
Ottawa
Vancouver
Portland
San Francisco
VeloQuebec
TRB 2013 Annual Meeting Paper revised from original submittal.

Miranda-Moreno, Nosal, Schneider, Proulx
Table Hourly Profiles
Type Weekday
Pri
mar
ily U
tilit
aria
n
At the hourly level, these exhibit two distinct weekday peaks, much like automobile commuter patterns. Utilitarian facilities have their highest ridership during the workweek and drop off considerably on the weekend. The weekend profile builds smoothly to a single PM peak. Seasonal
Mix
ed –
Uti
litar
ian
Mixed-utilitarian locations are often in urban areas but they may pass or connect to park/recreational areas.hourly level, they still exhibit two distinct peaks, but the ridership between the peaks may be slightly higher than on primarily utilitarian locations. They maintain a consistent level of ridership throughout the week, due to their dual commuter and recreational use. The weekly profile may still exhibit slightly higher ridership during the week.They may maintain lower ridership than the primarily utili
Mix
ed-R
ecre
atio
nal
Mixed-recreational locations are typically in parks or serve recreational areas while also connecting residential areas to commercial areas. They tend to maintain a consistent level of daily ridership throughout the week. However, unlike mixed-utilitarian, their hourly profiles do not exhibit two distinct commuting peaks. Still, their AM ridership during the workweek may be slightly higher than primarily rridership on the weekend. Ridership on these
Pri
mar
ily R
ecre
atio
nal
Primarily recreational locations are typicallyridership on the weekend than during the week. The workweek hourly profile closely resembles the weekend profile, which increases steeply to and decreases steeply from a midwell. The decrease in ridership due to winter is most significant
1. The pictured profiles are the mean values of the facilities belonging to each classification
0.00
0.05
0.10
0.15
0 4 8 12 16 20
0.00
0.05
0.10
0.15
0 4 8 12 16 20
0
0.05
0.1
0.15
0 4 8 12 16 20
Moreno, Nosal, Schneider, Proulx
Table 2. Summary of Bicycle Classifications Hourly Profiles1 Daily Profile
Weekend
exhibit two distinct weekday peaks, much like automobile commuter patterns. Utilitarian facilities have their highest ridership during the workweek and drop off considerably on the weekend. The weekend profile builds smoothly to a single PM peak. Seasonally, they maintain higher ridership in the winter than rec. facilities.
are often in urban areas but they may pass or connect to park/recreational areas.hourly level, they still exhibit two distinct peaks, but the ridership between the peaks may be slightly higher than on
. They maintain a consistent level of ridership throughout the week, due to their dual commuter and recreational use. The weekly profile may still exhibit slightly higher ridership during the week.They may maintain lower ridership than the primarily utilitarian locations.
are typically in parks or serve recreational areas while also connecting residential areas to maintain a consistent level of daily ridership throughout the week. However, unlike
utilitarian, their hourly profiles do not exhibit two distinct commuting peaks. Still, their AM ridership during the workweek may be slightly higher than primarily recreational locations. The daily profile may exhibit slightly higher ridership on the weekend. Ridership on these locations decreases more significanlty than U or MU facilities.
are typically in parks or serve recreational areas. They exhibit considerably higher ridership on the weekend than during the week. The workweek hourly profile closely resembles the weekend profile, which increases steeply to and decreases steeply from a mid-day plateau. A slight dip around noon may be present as well. The decrease in ridership due to winter is most significant at recreational locations.
The pictured profiles are the mean values of the facilities belonging to each classification
0.0
0.5
1.0
1.5
Sat
0.00
0.05
0.10
0.15
0 4 8 12 16 20
0.0
0.5
1.0
1.5
Sat
0.00
0.05
0.10
0.15
0 4 8 12 16 20
0
0.5
1
1.5
Sat
0
0.05
0.1
0.15
0 4 8 12 16 20
0
0.5
1
1.5
Sat
19
Daily Profile1
exhibit two distinct weekday peaks, much like automobile commuter patterns. Utilitarian facilities have their highest ridership during the workweek and drop off considerably on the weekend. The weekend
ly, they maintain higher ridership in the winter than rec. facilities.
are often in urban areas but they may pass or connect to park/recreational areas. At the hourly level, they still exhibit two distinct peaks, but the ridership between the peaks may be slightly higher than on
. They maintain a consistent level of ridership throughout the week, due to their dual commuter and recreational use. The weekly profile may still exhibit slightly higher ridership during the week.They
are typically in parks or serve recreational areas while also connecting residential areas to maintain a consistent level of daily ridership throughout the week. However, unlike
utilitarian, their hourly profiles do not exhibit two distinct commuting peaks. Still, their AM ridership during the . The daily profile may exhibit slightly higher
decreases more significanlty than U or MU facilities.
in parks or serve recreational areas. They exhibit considerably higher ridership on the weekend than during the week. The workweek hourly profile closely resembles the weekend profile,
A slight dip around noon may be present as
Sat Mon Wed Fri
Sat Mon Wed Fri
Sat Mon Wed Fri
Sat Mon Wed Fri
TRB 2013 Annual Meeting Paper revised from original submittal.

Miranda-Moreno, Nosal, Schneider, Proulx 20
4.5 Expansion factors for extrapolating manual counts For their use in practice, hourly and daily level expansion factors for the four classifications are
computed for the four types of facility locations. Expansion factors were calculated using the
traditional approach, as done for highways (7):
1) Aggregate hourly volumes into daily totals and calculate the overall average daily
volume.
2) Calculate average daily total for each day of the week and for each month of the year.
Then divide each daily average by the overall average to obtain the daily expansion
factors. Similarly, divide the monthly average by the overall average to obtain monthly
expansion factors.
3) Calculate average hourly totals for each hour of the day. Compute hourly expansion
factors by dividing each hourly average by the overall average.
The estimated hourly and daily expansion factors for each facility type are presented in Table 3.
These values correspond to the graphical profiles presented in Table 2. While these values are
representative of each category, individual facility locations may exhibit slightly different
behavior, while still conforming to the overall patterns of a given classification. Because
monthly expansion factors vary so heavily across regions, in addition to across classifications,
general monthly expansion factors for the four classifications are not feasible. Monthly
expansion factors must be specific to a given climate and classification. Therefore, monthly
expansion factors for the utilitarian facilities in each city, as well for the recreational Velo
Quebec facilities, are presented in Table 4.
Note that the expansion factors are most applicable to primarily utilitarian and primarily
recreational locations, as these exhibit the greatest consistency. Great care must be taken to
ensure that the factors are applied only to locations that exhibit the same patterns as the
classification group being utilized. Mixed locations will require the greatest care, in particular
mixed recreational.
TRB 2013 Annual Meeting Paper revised from original submittal.

Miranda-Moreno, Nosal, Schneider, Proulx 21
Table 3. Hourly and Daily Expansion Factors by Classification Hourly and daily factors Hour Utilitarian Mixed
Utilitarian Mixed
Recreational Recreational
Hourly Expansion Factors by
Classification
0 0.023 0.006 0.007 0.000 1 0.015 0.003 0.005 0.000 2 0.009 0.002 0.004 0.000 3 0.007 0.001 0.004 0.000 4 0.004 0.003 0.006 0.000 5 0.004 0.008 0.012 0.002 6 0.008 0.032 0.028 0.011 7 0.014 0.074 0.040 0.015
8 0.026 0.089 0.039 0.026
9 0.042 0.051 0.047 0.064 10 0.055 0.037 0.065 0.114 11 0.067 0.041 0.065 0.118 12 0.076 0.043 0.060 0.104 13 0.088 0.047 0.086 0.111 14 0.095 0.052 0.093 0.119 15 0.094 0.069 0.081 0.093 16 0.086 0.098 0.076 0.067 17 0.075 0.122 0.070 0.051 18 0.057 0.087 0.064 0.045 19 0.043 0.053 0.063 0.037 20 0.035 0.036 0.036 0.016 21 0.031 0.024 0.018 0.004 22 0.026 0.015 0.014 0.001
23 0.023 0.011 0.010 0.001 Daily Expansion Factors by Classification
Day Utilitarian Mixed Utilitarian
Mixed Recreational Recreational
Sat 0.71 1.00 1.02 1.35 Sun 0.66 0.89 1.18 1.41 Mon 1.05 0.94 1.00 0.82 Tue 1.18 1.04 1.03 0.89 Wed 1.21 1.12 0.95 0.84 Thu 1.13 1.02 0.85 0.72
Fri 1.06 0.99 0.97 0.97
TRB 2013 Annual Meeting Paper revised from original submittal.

Miranda-Moreno, Nosal, Schneider, Proulx 22
Table 4. Monthly Expansion Factors by Region and Classification
Utilitarian
Month Ottawa Montreal Vancouver San Francisco Portland Vélo Québec
Apr 0.34 0.66 0.71 0.96 0.88 0.66
May 0.82 1.18 0.90 1.02 0.88 1.44
Jun 1.34 1.16 1.06 1.05 1.05 1.51
Jul 1.34 1.29 1.30 1.05 1.21 2.15
Aug 1.48 1.19 1.58 1.10 1.20 2.12
Sep 1.23 1.16 1.39 1.18 1.11 0.91
Oct 0.85 0.70 1.21 1.13 0.98 0.28
Nov 0.59 0.53 1.04 0.82 0.68 0.14
4.6 Comparison of Bicycle Volume Patterns
In addition to the indices that were calculated for the classification, the average daily volume
(ADV) was also computed for each facilities. These values are reported in Table 5, along with
the relative indices of weekend vs. weekday (WWI), and the relative indices of AM to midday
cycling (AMI).
From these comparisons, we can see that the traffic intensity can vary considerably
between counting locations of the same type. For instance, the 2 top locations (Mont2 in
Montreal and Port) present daily volumes that are 10 times higher than counting locations in San
Francisco. Much less variability is observed in the recreational group, which present overall very
low traffic intensity. Despite the large differences in volumes, there are consistent temporal
patterns across these facilities and cities. The results of our classification can be evaluated based
also the WWI and AMI indexes. Note that among facility groups, these indexes are very similar
across facilities of the same group – this shows the heterogeneity of traffic patterns within
locations of the same group.
Note that these simple indices can be also generated to monitor the evolution and
performance of facility facilities and bicycle usage in general.
TRB 2013 Annual Meeting Paper revised from original submittal.

Miranda-Moreno, Nosal, Schneider, Proulx 23
Table 5. Comparison of Bicycle Volume Patterns at Study Locations
Type Study
Location AADT WWI AMI
The Utilitarian
Port 4869 0.54 1.68
Mon2 4021 0.56 1.26
Mon3 3553 0.65 1.66
Mon4 3267 0.72 1.63
SF4 2475 0.71 1.77
Mon1 2200 0.56 1.62
Ott1 1637 0.67 2.52
Van3 990 0.61 2.05
Van5 805 0.56 2.97
Van6 788 0.72 2.17
Van4 543 0.53 2.93
SF1 421 0.77 2.62
SF2 404 0.72 1.30
SF3 259 0.65 1.53
SF5 156 0.82 1.82
Mean
0.65 1.97
Mixed Utilitarian
SF6 3452 1.08 1.62
Van1 3004 0.84 1.76
Ott2 832 0.85 1.16
SF8 511 1.59 1.47
Van2 336 1.1 2.17
SF7 188 1.01 1.70
Mean 1.08 1.64
Mixed recreational
VQ5 1034 1.25 0.48
VQ3 1015 1.51 0.35
VQ10 590 1.20 0.85
VQ13 542 1.08 0.63
VQ8 413 1.14 0.88
VQ1 232 1.47 0.32
VQ7 200 0.96 0.71
VQ6 144 1.34 0.32
VQ16 135 1.47 0.44
VQ14 62 1.20 0.53
VQ15 34 1.20 0.44
Mean
1.26 0.54
Recreational
VQ12 359 2.13 0.24
VQ11 267 1.81 0.33
VQ4 207 1.77 0.32
VQ2 154 1.88 0.27
VQ9 112 2.26 0.26
Mean
1.97 0.28
TRB 2013 Annual Meeting Paper revised from original submittal.

Miranda-Moreno, Nosal, Schneider, Proulx 24
5. CONCLUSIONS AND FUTURE WORK
This paper studies the temporal bicycle traffic patterns at 37 automatic counting locations along
bicycle facilities in Montreal, Ottawa, Portland, San Francisco, and Vancouver, as well as
suburban/rural facilities along the Route Verte in Quebec, Canada. Based on the proposed
classification procedure, this study shows that most of the study locations can be classified into
one of four groups: primarily utilitarian, mixed-utilitarian, mixed-recreational, and primarily
recreational. Locations with primarily utilitarian patterns have typical weekday morning and
afternoon commute peaks and a single peak during weekends. These patterns are very similar to
those observed in motor-vehicle traffic in urban arterials and highways. Mixed-utilitarian
locations exhibit two distinct commute peaks at the hourly level, but the ridership between the
peaks may be slightly higher than at primarily utilitarian locations. They also maintain a
consistent level of ridership throughout the week – i.e. daily volumes on weekends are as high as
on weekdays. Recreational locations exhibit their highest proportion of traffic volumes around
midday during both weekdays and weekends. Moreover, they exhibit higher ridership on the
weekend than during the week. Finally, mixed-recreational locations exhibit a consistent level of
ridership throughout the week, like mixed-utilitarian facilities. However, they do not exhibit two
distinct commuting peaks during the workweek. As bicycle facilities become more recreational
in nature, the AM portion of the weekend hourly profile increases, whereas utilitarian facilities
build to a gradual PM peak.
Within each of the four classifications, relative hourly and daily traffic patterns appear to
be relatively consistent across regions. However, locale climate appears to have a considerable
effect on the monthly profiles across cities. Utilitarian facilities in a city with colder weather
retain lower ridership in the winter than those in warmer cities. However, different classifications
appear to respond differently across seasons. Recreational locations retain far less ridership in
winter than utilitarian ones.
The consistency of temporal profiles across locations in the same classification suggests
that general expansion factors can be applied to some bike facility locations. This paper reports
expansion factors for each type of bicycle traffic classification. The expansion factors are
expected to be useful for practitioners and researchers to extrapolate manual counts, a common
need in planning and safety studies. In addition, several indices were developed to compare
TRB 2013 Annual Meeting Paper revised from original submittal.

Miranda-Moreno, Nosal, Schneider, Proulx 25
overall bicycle volumes and patterns of bicycling activity across locations. These measures can
be used for comparative studies.
Future studies should explore more detailed measures of the built environment in the
vicinity of count locations. It is likely that some of the variations in bicycle volume patterns
within each general category are associated with being located near a central business district,
commercial zones, parks, or tourist destinations. This will help to further refine the comparison
of bicycle ridership patterns across different built environment characteristics. In addition, winter
data should be analyzed in a variety of locations to determine year-round bicycle volume
patterns. Finally, changes in overall bicycle volumes and bicycle volume patterns over time can
be investigated with a similar, rich database of continuous counts from locations throughout
North America.
ACKNOWLEDGEMENTS We acknowledge the financial support of the Natural Sciences and Engineering ResearchCouncil of Canada (NSERC), Fonds Québécois de la Recherche sur la Nature et les Technologies (FQRNT) and Canadian Foundation for Innovation (CFI) for providing funds as operating and equipment grants. We would also like to thank the Departments of Transportation of Montreal, Ottawa, Vancouver, Portland and San Francisco as well as Vélo Québec for providing data. We would like also to thank Jean-Francois Rheault from Eco-counter Inc. for all the technical support. All remaining errors and the views expressed in this research are, however, solely ours.
TRB 2013 Annual Meeting Paper revised from original submittal.
Miranda-Moreno, Nosal, Schneider, Proulx 26
References
1. Miranda-Moreno, L. and T. Nosal. Weather or not to cycle; whether or not cyclist ridership has grown: a look at weather’s impact on cycling facilities and temporal trends in an urban environment. In Transportation Research Record: Journal of the Transportation Research Board, No. 2300, Transportation Research Board of the National Academies, Washington, D.C., 2011
2. Thomas, T., R. Jaarsma, and B. Tutert. "Exploring temporal fluctuations of daily cycling demand on Dutch cycle paths: the influence of weather on cycling. Transportation. 2012, pp. 1-22
3. Jones, M.G., S. Ryan, J. Donlan, L. Ledbetter, L. Arnold, and D. Ragland. Seamless Travel: Measuring Bicycle and Pedestrian Activity in San Diego County and its Relationship to Land Use, Transportation, Safety, and Facility Type, Prepared by Alta Planning & Design and UC Berkeley Safe Transportation Research & Education Center, California Department of Transportation Task Order 6117, 2010.
4. Hallenbeck, M., and B. Smith. Vehicle Volume Distributions by Classification. Publication FHWA-PL-97-025. FHWA, U.S. Department of Transportation, 1997.
5. Robichaud, K., and M. Gordon. Assessment of Data-Collection Techniques for Highway Agencies. In Transportation Research Record: Journal of the Transportation Research Board, No. 1855, Transportation Research Board of the National Academies, Washington, D.C., 2003, 129-135
6. Mannering, F.L., W. Kilareski, and S.S. Washburn. Principles of Highway and Traffic Engineering, Fourth Edition, Wiley, 2008.
7. PIARC Technical Commitee on Road Safety. (2003). Traffic Count. In Road Safety
Manual. Route2Market: 2003; pp 510-524
8. Nosal, T.; Miranda-Moreno, L. Cycle Tracks, Bicycle Lanes, and On-street Cycling in Montreal, Canada: Preliminary Comparison of Cyclist Injury Risk. Presented at Transportation Research Board Conference . Washington, DC. 2012
9. Miranda-Moreno, L., J. Strauss, P. Morency. Exposure Measures and Injury Frequency Models for Analysis of Cyclist Safety at Signalized Intersections. Presented at 90th Annual Meeting of the Transportation Research Board,Washington, D.C., 2011.
10. Richardson, A.J. Estimating Bicycle Usage on a National Cycle Network. In Transportation Research Record: Journal of the Transportation Research Board, No. 1982, Transportation Research Board of the National Academies, Washington, D.C., 2006, pp. 166-173.
TRB 2013 Annual Meeting Paper revised from original submittal.
Miranda-Moreno, Nosal, Schneider, Proulx 27
11. Lumsdon, L., P. Downward, A. Cope. Monitoring of cycle tourism on long distance trails: the North Sea Cycle Route. Journal of Transport Geography, Vol. 12, Issue 1, 2004, pp. 13-22.
12. Merom, D., A. Bauman, P. Vita, G. Close. An environmental intervention to promote walking and cycling – the impact of a newly constructed rail trail in Western Sydney. Preventative Medicine. Vol. 36, Issue 2, 2003, pp. 235-242.
13. Guide for the Development of Bicycle Facilities, Fourth Ed. American Association of State Highway and Transportation Officials, Washington, D.C., 2012.
14. Lieswyn, J., A. Wilke, S. Taylor. Automatic Cycle Counting Program Development in Hamilton. Presented at IPENZ Transportation Group Conference, Auckland, 2011
15. Canadian Climate Normals 1971-2000. Environment Canda. http://www.climate.weatheroffice.gc.ca/climate_normals/index_e.html? Accessed July 2011.
16. Pucher, J., and R. Buehler. Analysis of Bicycling Trends and Policies in Large North American Cities: Lessons for New York. Prepared for the Research and Innovative Technology Administration, United States Department of Transportation, Washington, D.C. 2011
17. Climatography of the United States No. 20 1971-2000. National Oceanic and Atmospheric Administration, National Environmental Satellite, Data and Information Service. http://cdo.ncdc.noaa.gov/climatenormals/clim20/or/356751.pdf Accessed July 2011.
18. San Francisco Municipal Transportation Agency. San Francisco Bicycle Plan. June 26, 2009. http://www.sfmta.com/cms/bproj/documents/San_Francisco_Bicycle_Plan_June_26_2009_002.pdf. Accessed July 2012.
19. La Route Verte. Velo Quebec. http://www.routeverte.com/rv/index2010_e.php Accessed July 2011
20. Nordback, K. and B. N. Janson. Automated Bicycle Counts. In Transportation Research Record: Journal of the Transportation Research Board, No. 2190, Transportation Research Board of the National Academies, Washington, D.C., 2010, pp. 11-18
21. Nordback, K.; Piatowski, D.; Janson, B.; Marshall, W.; Krizek, K.; Main, D. Using Inductive Loops to Count Bicycles in Mixed Traffic. Journal of Transportation of the Institute of Transportation Engineers, Vol. 2, 2011, pp. 39-57
22. Nosal, T. and L. Miranda-Moreno. Cycling and Weather: a multi-city and multi-facility study in North America. Presented at 91st Annual Meeting of the Transportation Research Board,Washington, D.C., 2012.
TRB 2013 Annual Meeting Paper revised from original submittal.