tr al a b nkofn c enigria december 2013b.pdf · maturity structure of bank deposits and credits ......
TRANSCRIPT

LARTNEC
LARTNEC
KN AB KN AB OF OF NNIIGGEERRIIAA
CBN FINANCIAL STABILITY REPORT DECEMBER 2013
ii
... ... ... ... ... ... ... ... 1
Global Economic and Financial Developments ... ... ... 1
Output ... ... ... ... ... ... 1
Inflation ... ... ... ... ... ... 3
Oil prices ... ... ... ... ... ... 4
Monetary Policy Rates ... ... ... ... ... 4
Domestic Developments ... ... ... ... ... 5
Output ... ... ... ... ... ... 5
Inflation ... ... ... ... ... ... 7
Interest Rates ... ... ... ... ... 7
Fiscal Operations ... ... ... ... ... 8
Money and Credit ... ... ... ... ... ... 11
Aggregate Credit to the Economy ... ... ... 11
Claims on the Federal Government ... ... 12
Claims on the Private Sector ... ... ... 12
Consumer Credit ... ... ... ... 12
Sectoral Classification of Private Sector Credit ... ... 13
Reserve Money ... ... ... ... ... ... 14
Maturity Structure of Bank Deposits and Credits ... ... 14
Market Structure of the Banking Industry ... ... 15
Implementation of the 2010 Banking Model ... ... ... 16
Non-Interest (Islamic) Banking ... ... ... ... ... 16
Cross-border Collaboration ... ... ... ... ... 16
Memoranda of Understanding (MoUs) ... ... ... 17
Colleges of Supervisors ... ... ... ... ... 17
Cross-border Examination ... ... ... ... 17
Nigerian Sustainable Banking Principles ... ... ... 18
Other Financial Institutions (OFIs) ... ... ... ... 18
Development Finance Institutions (DFIs) ... ... 18
Primary Mortgage Banks ... ... ... ... 19
Page
List of Tables ... ... ... ... ... ... ... ... ... v
List of Figures ... ... ... ... ... ... ... ... ... vi
Box ... ... ... ... ... ... ... ... ... ... vii
List of Abbreviations ... ... ... ... ... ... ... ... viii
Financial Stability ... ... ... ... ... ... ... ... x
Governor’s Statement ... ... ... ... ... ... ... xi
Executive Summary ... ... ... ... ... ... ... ... xii
1 MACROECONOMIC DEVELOPMENTS AND FINANCIAL SYSTEM
STABILITY
1.1
1.1.1
1.1.2
1.1.3
1.1.4
1.2
1.2.1
1.2.2
1.2.3
1.2.4
2 DEVELOPMENTS IN THE FINANCIAL SYSTEM ... ... ... 11
2.1
2.1.1
2.1.1.1
2.1.1.2
2.1.1.3
2.1.2
2.1.3
2.1.4
2.1.5
2.2
2.3
2.4
2.4.1
2.4.2
2.4.3
2.4.4
2.5
2.5.1
2.5.2

CBN FINANCIAL STABILITY REPORT DECEMBER 2013
iii
Guidelines on Mortgage Brokerage ... ... 20
Microfinance Banks ... ... ... ... ... 20
Finance Companies ... ... ... ... ... 20
Financial Inclusion ... ... ... ... ... ... 21
Financial Literacy ... ... ... ... ... 21
Financial Markets ... ... ... ... ... ... 22
The Money Market ... ... ... ... ... 22
The Foreign Exchange Market ... ... ... 23
The Capital Market ... ... ... ... ... 24
The Ten-Year Blueprint Committees ... ... 24
Minimum Capital Requirements for Capital Market
Operators ... ... ... ... ... 24
Financial Markets Dealers Quotations
Over-the-Counter Plc ... ... ... ... 24
The Bond Market ... ... ... ... 25
The Equities Market ... ... ... ... 27
Real Sector Intervention... ... ... ... ... ... 27
The Nigerian Incentive-based Risk Sharing System for
Agricultural Lending (NIRSAL) Plc. ... ... ... 27
The Commercial Agriculture Credit Scheme ... ... 28
The Agricultural Credit Guarantee Scheme ... ... 28
The Small and Medium Enterprises Credit Guarantee
Scheme... ... ... ... ... ... ... ... 29
The Power and Aviation Intervention Fund ... ... 29
The SME Restructuring and Refinancing Fund ... ... 29
Entrepreneurship Development Centres ... ... ... 29
The External Sector ... ... ... ... ... ... 29
The Insurance Sector ... ... ... ... ... ... 31
Airtel Nigeria Life Insurance ... ... ... ... 31
MTN Nigeria Life Assurance Service ... ... ... 31
Macro-Prudential Supervision ... ... ... ... ... 33
Financial Soundness Indicators ... ... ... ... 33
Asset and Liquidity-based Indicators ... ... 33
Capital-based Indicators ... ... ... 34
Income and Expense-based Indicators ... ... 34
Banking Industry Stress Tests ... ... ... ... 35
Liquidity Stress Test ... ... ... ... 35
Contagion Risk Analysis through Inter Bank Exposures 39
Solvency Stress Test ... ... ... ... 39
Supervision of Banks and Other Financial Institutions ... ... 46
Banks and Discount Houses ... ... ... ... 46
2.5.2.1
2.5.2.2
2.5.3
2.5.4
2.6
2.6.1
2.7
2.7.1
2.7.2
2.7.3
2.7.3.1
2.7.3.2
2.7.3.3
2.7.3.4
2.7.3.5
2.8
2.8.1
2.8.2
2.8.3
2.8.4
2.8.5
2.8.6
2.8.7
2.9
2.10
2.10.1
2.10.2
3.0 REGULATORY AND SUPERVISORY ACTIVITIES ... ... ... 33
3.1
3.1.1
3.1.1.1
3.1.1.2
3.1.1.3
3.1.2
3.1.2.1
3.1.2.2
3.1.2.3
3.2
3.2.1
Mortgage Refinancing ... ... ... 19

CBN FINANCIAL STABILITY REPORT DECEMBER 2013
iv
Discount Houses ... ... ... ... 47
Other Financial Institutions ... ... ... ... 47
Microfinance Banks ... ... ... ... 47
Primary Mortgage Banks (PMBs) ... ... 47
Finance Companies (FCs) ... ... ... 48
Bureaux de Change ... ... ... ... 48
Compliance with International Standards ... ... ... 48
Anti-Money Laundering/Combating the Financing of
Terrorism ... ... ... ... ... ... 48
Implementation of Basel II/III ... ... ... 49
International Financial Reporting Standards ... ... 50
The Assets Management Corporation of Nigeria ... ... ... 50
Key Risks in the Financial System ... ... ... ... 50
Credit Risk ... ... ... ... ... ... 50
Liquidity Risk ... ... ... ... ... ... 51
Market Risk ... ... ... ... ... ... 51
Operational Risk ... ... ... ... ... 51
Reputational Risk ... ... ... ... ... 52
Credit Bureaux ... ... .. ... ... ... ... 52
CBN’s Credit Risk Management System ... ... ... 52
Private Credit Bureaux ... ... ... ... ... 52
The Financial Services Regulation Coordinating Committee ... 52
Consumer Protection ... ... ... ... ... ... 53
Customer Complaints ... ... ... ... ... 53
The Payments System Vision 2020 ... ... ... ... 55
The Real-Time Gross Settlement System... ... ... ... 56
NIBSS Instant Payment ... ... ... ... ... ... 56
NIBSS Electronic Fund Transfer... ... ... ... ... 57
Cheque Clearing ... ... ... ... ... ... 58
Electronic Cards ... ... ... ... ... ... 59
ATM Transactions ... ... ... ... ... 61
Mobile Payments ... ... ... ... ... 62
Point of Sale Terminal Transactions ... ... ... 63
3.2.1.1
3.2.1.2
3.2.2
3.2.2.1
3.2.2.2
3.2.2.3
3.2.2.4
3.3
3.3.1
3.3.2
3.3.3
3.4
3.5
3.5.1
3.5.2
3.5.3
3.5.4
3.5.5
3.6
3.6.1
3.6.2
3.7
3.8
3.8.1
4.0 THE PAYMENTS SYSTEM ... ... ... ... ... ... 55
4.1
4.2
4.3
4.4
4.5
4.6
4.6.1
4.6.2
4.6.3
5.0 OUTLOOK ... ... ... ... ... ... ... ... 65
Banks ... ... ... ... ... ... 46

CBN FINANCIAL STABILITY REPORT DECEMBER 2013
v
Page
Real GDP Growth of Selected Countries and Regions ... ... 2
Global Inflation (Consumer Prices) ... ... ... ... 3
Inflation Rates for Selected Countries ... ... ... ... 3
Summary of Policy Rates Across Selected Countries
(Jan 2013 – Dec 2013) ... ... ... ... ... 5
Percentage Changes in Real GDP by Sector ... ... ... 6
Consumer Credit by Sector ... ... ... ... ... 13
Distribution of Off-shore Subsidiaries of Nigerian Banks ... 17
Matured FGN Bonds, July - Dec 2013 ... ... ... ... 25
New Sub-national Bonds Issued During the Review Period ... 26
New Corporate Bonds Issued in the Second Half of 2013 ... 27
Activities of NIRSAL, July - Dec 2013 ... ... ... 28
Selected Financial Soundness Indicators of the Nigerian Banking
Industry ... ... ... ... ... ... ... 34
Assets Un-encumbered ... ... ... ... ... ... 35
Implied Cash Flow Analysis ... ... ... ... ... 36
Baseline CARs and LRs ... ... ... ... ... 40
Stress Test Results – Credit Risk ... ... ... ... 42
Credit Concentration Risk ... ... ... ... ... 43
Stress Test Results - Liquidity Risk ... ... ... ... 43
Stress Test Results - Interest Rate Risk ... ... ... ... 44
Stress Test Result - Exchange Rate Risk ... ... ... 45
Stress Test Result - FX Trading Risk ... ... ... ... 45
Table 1.1:
Table 1.2:
Table 1.3:
Table 1.4:
Table 1.5:
Table 2.1:
Table 2.2:
Table 2.3:
Table 2.4:
Table 2.5:
Table 2.6:
Table 3.1:
Table 3.2:
Table 3.3:
Table 3.4:
Table 3.5:
Table 3.6:
Table 3.7:
Table 3.8:
Table 3.9:
Table 3.10:

CBN FINANCIAL STABILITY REPORT DECEMBER 2013
vi
Page
Gross Domestic Product ... ... ... ... ... 6
Shares of Oil and Non-oil Sectors in Real GDP ... ... ... 6
Share in Total GDP (%) ... ... ... ... ... 7
Inflationary Trend (Year-on-Year) ... ... ... ... 7
Money Market Interest Rates and MPR ... ... ... ... 8
Lending and Deposit Rates ... ... ... ... ... 8
Federal Government Fiscal Operations ... ... ... ... 9
Trend in Monetary Aggregate ... ... ... ... ... 11
Credit to the Economy ... ... ... ... ... ... 12
Consumer Credit ... ... ... ... ... ... 13
Sectoral Allocation of Credit ... ... ... ... ... 14
Distribution of Bank Loans and Advances by Maturity ... ... 15
Distribution of Banks' Deposit Structure ... ... ... 15
Market Concentration Ratios of Banks (Assets and Deposits) ... 16
Inter-bank Rates Movements ... ... ... ... ... 22
WDAS, Inter-bank and BDC Rates, 2013 ... ... ... 23
Yield Curves for Nigeria ... ... ... ... ... 26
Breakdown of External Reserves ... ... ... ... 30
Banking Industry NPLs to Total Gross Loans ... ... ... 33
Banking Industry Liquidity Indicators ... ... ... ... 33
Banking Industry Capital Adequacy Indicators ... ... ... 34
Industry and Individual Bank Pre-Shock Liquidity Ratio Positions 37
Industry Position after 1-5 day and Cumulative 30- day Shocks ... 37
Individual Bank Positions after 5-day and Cumulative 30-day Shocks 38
Roll-over Risk, Pre- and Post-shock ... ... ... ... 38
Total Bilateral Exposure ... ... ... ... ... 39
Banks in Each Bucket of CAR ... ... ... ... ... 40
Banks in Each Bucket of LR ... ... ... ... ... 40
Baseline CARs and LRs (%) ... ... ... ... ... 41
Baseline ROAs and ROEs (%) ... ... ... ... ... 41
Credit Concentration Risk ... ... ... ... ... 42
Trend of Banking Industry NPLs, 2010 - 2013 ... ... ... 51
Figure 1.1:
Figure 1.2:
Figure 1.3:
Figure 1.4:
Figure 1.5:
Figure 1.6:
Figure 1.7:
Figure 2.1:
Figure 2.2:
Figure 2.3:
Figure 2.4:
Figure 2.5:
Figure 2.6:
Figure 2.7:
Figure 2.8:
Figure 2.9:
Figure 2.10:
Figure 2. 11:
Figure 3.1:
Figure 3.2:
Figure 3.3:
Figure 3.4:
Figure 3.5:
Figure 3.6:
Figure 3.7:
Figure 3.8:
Figure 3.9:
Figure 3.10:
Figure 3.11:
Figure 3.12:
Figure 3.13:
Figure 3.14:
CBN FINANCIAL STABILITY REPORT DECEMBER 2013
vii
Figure 4.1:
Figure 4.2:
Figure 4.3:
Figure 4.4:
Figure 4.5:
Figure 4.6:
Figure 4.7:
Figure 4.8:
Figure 4.9:
Figure 4.10:
Figure 4.11:
Figure 4.12:
Figure 4.13:
Figure 4.14:
Box
Box 1:
Volume of NIP Transactions, July to December 2013 ... ... 57
Value (N Billion) of NIP Transactions, July to December 2013 ... 57
Volume of NEFT Transactions, July to December 2013 ... ... 58
Value (N Billion) of NEFT Transactions, July to December 2013 ... 58
Volume of Cheques Cleared, July to December 2013 ... ... 59
Value (N Billion) of Cheques Cleared, July to December 2013 ... 59
Volume of Electronic Card Transactions, July to December 2013 ... 60
Value of Electronic Card Transactions, July to Dec 2013 ... ... 60
Volume of ATM Transactions, July - Dec 2013 ... ... ... 61
Value (N Billion) of ATM Transactions, July - Dec 2013 ... ... 61
Volume of Mobile Payments, July - Dec 2013 ... ... ... 62
Value (N Billion) of Mobile Payments, July - Dec 2013 ... ... 62
Volume of PoS Transactions, July - Dec 2013 ... ... ... 63
Value (N Billion) of PoS Transactions, July - Dec 2013 ... ... 63
Guidance Note on Regulatory Capital ... ... ... ... 67

CBN FINANCIAL STABILITY REPORT DECEMBER 2013
AIPs Approvals-in-Principle
AMCON Asset Management Corporation of Nigeria
AML/CFT Anti-Money Laundering and Combating the Financing of
Terrorism
ASI All Share Index (Nigerian Stock Exchange Index)
ATMs Automated Teller Machines
EBAs Eligible Bank Assets
EDC Enterprise Development CentreeFASS Electronic Financial Analysis and Surveillance SystemFATF Financial Action Task Force
FCs Finance Houses
FCT Federal Capital Territory
FGN Federal Government of Nigeria
BCEAO Banque Centrale des Etats de l'Afrique de l'Ouest (Central Bank of
West African States)
BDCs Bureaux de Change
BOA Bank of Agriculture
BOFIA Banks and Other Financial Institutions Act 1991 (as amended)
BOI Bank of Industry
BRICS Brazil, Russia, India, China, and South Africa
CACS Commercial Agricultural Credit Scheme
CAR Capital Adequacy Ratio
CBN Central Bank of Nigeria
CIBN Chartered Institute of Bankers of Nigeria
CIFTS CBN Inter-bank Fund Transfer System
CR6 Concentration Ratio (of the six largest banks)
CRMS Credit Risk Management System
DFIs Development Finance Institutions
DMBs
Delivery versus Payment
FMBN Federal Mortgage Bank of Nigeria
FMF Federal Ministry of Finance
FSIs Financial Soundness Indicators
FSRCC Financial Services Regulation Coordinating Committee
GDP Gross Domestic Product
GIZ Deutsche Gesellschaft fur InternationaleZusammenarbeit (German
Society for International Cooperation)
HHI Herfindahl-Hirschman Index
ICFA Implied Cash Flow Analysis
IFRS International Financial Reporting Standards
IFSB Islamic Financial Services Board
IMF International Monetary Fund
viii
DvP
Deposit Money Banks
CBN FINANCIAL STABILITY REPORT DECEMBER 2013
KYC Know Your Customer
L/C Letter of Credit
M1 Narrow Money Supply
M2 Broad Money Supply
MCP Microfinance Certification Programme
MENA Middle East and North African Countries
MFBs Microfinance Banks
ML/FT Money Laundering and Financing of Terrorism
MoUs Memoranda of Understanding
MPR Monetary Policy Rate
NAICOM National Insurance Commission
NDIC Nigeria Deposit Insurance Corporation
NERFUND National Economic Reconstruction FundNEXIM Nigerian Export-Import Bank
NFIU Nigerian Financial Intelligence Unit
NGAAP Nigerian Generally Accepted Accounting Principles
NIBSS Nigeria Inter-bank Settlement System
NIRSAL Nigerian Incentive-based Risk Sharing System for Agricultural
Lending
NMRC Nigeria Mortgage Re-finance Company Plc NPLs Non-Performing Loans
NSE Nigerian Stock Exchange
OBB Open Buy Back OFIs Other Financial Institutions PAIF Power and Aviation Infrastructure Fund
PCBs Private Credit Bureaux
PENCOM National Pension Commission
PFAs Pension Fund Administrators PFCs Pension Fund Custodians
PMBs Primary Mortgage Banks
PoS Point of Sale
PSV 2020 Payments System Vision 2020
RDAS Retail Dutch Auction System
ROA Return on Asset
ROE Return on Equity
RTGS Real-Time Gross Settlement System
SEC Securities and Exchange Commission
SMEs Small and Medium Enterprises
SMECGS Small and Medium Enterprises Credit Guarantee Scheme
WAMZ West African Monetary Zone
WDAS Wholesale Dutch Auction System
WEO World Economic Outlook
ix

CBN FINANCIAL STABILITY REPORT DECEMBER 2013
‘Financial stability’ is the resilience of the financial system to unanticipated adverse
shocks, while enabling the continued smooth functioning of the financial system's
intermediation process. A stable financial system contributes to broader economic
growth and rising living standards. The financial system performs one of the most
important functions in the welfare of citizens by supporting the ability of households and
firms to hold or transfer financial assets with confidence. Thus, the stability of the
financial system and its adequate analysis and reporting are important policy goals of the
CBN.
x

CBN FINANCIAL STABILITY REPORT DECEMBER 2013
During the second half of 2013, while the global economy sustained its recovery, fiscal
and monetary authorities focused on measures that would further enhance growth and
curb unemployment. In the emerging economies, a decline in commodity prices
contributed to the dampening of the significant growth in GDP experienced in recent
years. In Nigeria, the efforts to diversify the economy achieved results, as the real GDP
growth was mainly driven by growth in the non-oil sectors of the economy.
With respect to monetary policy, rates remained low in most advanced economies. In Nigeria, the policy thrust was to rein in inflation. Thus, the monetary policy rate was retained at 12.0 per cent throughout the review period. Inflationary pressure was, therefore, contained as year-on-year inflation rate was 8.0 per cent at end-December 2013. Money markets and foreign exchange rates were relatively stable. In the near term, we expect to continue the tight monetary policy stance in order to maintain price stability.
For the Central Bank of Nigeria, it was critical to ensure that the shocks noted in the global environment did not threaten the stability of the domestic banking system. Regulatory actions were, therefore, focused on ensuring that the banks maintained healthy loan portfolios by creating high quality assets that would ensure sustainable growth. Meanwhile, the proactive actions taken to resolve the distress situation in the system have achieved the desired results and contributed to the overall stability of the financial system.
Following the successes recorded in the pilot scheme of the cash-less policy, its implementation was extended to five additional states and the Federal Capital Territory in the second half of 2013. The expected reduction in the cost of cash handling in the country was already being achieved. The implementation of the policy has also contributed to the achievement of the Bank's financial inclusion targets. We believe that the inclusion of the economically active but poor people into the formal financial system would enhance the ability of the financial system to contribute to economic growth and development.
With the Federal Government's continued commitment to implementing measures to address security challenges and tackle the disruption in crude oil production, it is expected that the success achieved in these efforts would enhance both economic growth and government's revenue base.
Sanusi Lamido Sanusi (CON)Governor, Central Bank of Nigeria
xi

CBN FINANCIAL STABILITY REPORT DECEMBER 2013
Global output was estimated to have grown by 3.0 per cent in 2013, compared with the
3.1 per cent achieved in 2012. However, in the second half of the year, growth achieved
was higher than the 2.9 per cent projected for the half year, driven mainly by growth in
advanced economies. In Nigeria, real GDP growth was estimated at 6.7 per cent in 2013,
compared to 6.6 per cent in 2012. In advanced economies, inflation decreased in 2013
owing to declining commodity prices caused by improved supply and reduced demand
from major consuming nations, such as China. In Nigeria, headline inflation decelerated
to 8.0 per cent at end-December 2013, from 8.4 per cent at end-June 2013.
In 2013, most advanced economies maintained a stable monetary policy stance. Among the BRICS, only Brazil and India reviewed their policy rates upwards.
The CBN maintained its policy rate at 12.0 per cent in the review period. However, lending rates in the banking industry trended upwards. On the fiscal side, the Federal Government operated at a deficit of 6.3 per cent of GDP, which was financed through domestic borrowings and privatization proceeds.
The CBN examined 21 banks and 14 foreign subsidiaries of Nigerian banks. The results showed that most banks had a stable outlook in their composite risk rating and improvements in their internal audit and financial analysis functions. In addition, the stress test conducted, based on their end-December 2013 call reports indicated that the banking industry was stable and resilient.The key challenges in the industry, however, remained corporate governance and risk management practices.
The Other Financial Institutions sub-sector witnessed several developments, including the establishment of the Nigeria Mortgage Refinancing Company Plc to provide liquidity in the mortgage market and promote availability and affordability of housing in Nigeria.
The Bank continued to promote financial inclusion during the review period in line with its Financial Inclusion Strategy.The geo-spatial mapping of financial services' access points and the Micro Small and Medium Enterprises Development Fund were launched. The Bank also commenced financial literacy/enlightenment programmes through public workshops, secondary schools' outreach, road shows and engagement of the media.
Meanwhile, matured AMCON bonds, as at December 2013 were redeemed in line with the terms of the indenture.
The cash-less policy, earlier launched in Lagos, was extended to five additional States and the FCT.
The Nigerian economy is projected to remain strong, driven largely by increased growth
xii

CBN FINANCIAL STABILITY REPORT DECEMBER 2013
in agriculture, trade and services, while activities in the oil sector are projected to recover in 2014. Although inflation is projected to decline, the 2015 electioneering activities would pose some threat.
This edition of the FSR is divided into five sections. Section one reviews global and domestic economic and financial developments, highlighting key stability issues. Section two chronicles developments in the domestic economy, while section three covers regulatory and supervisory activities. Key developments in the payments system are highlighted in section four. Finally, section five provides the outlook for financial stability.
xiii


was expected to partly offset the drag from the consumption tax increase in early 2014.
Real GDP growth of the Euro area improved to negative 0.4 per cent in 2013, compared with the negative 0.7 per cent recorded in 2012, and is projected to strengthen to 1.0 per cent in 2014 in spite of the uneven recovery within the area. High private and public debts and financial fragmentation were expected to hold back domestic demand, while exports were projected to further contribute to growth, with the improvement in growth being more modest in economies under stress.
The emerging market and developing economies were estimated to grow by 4.7 per cent in 2013, compared with the 4.9 per cent achieved in 2012. The marginal decline in 2013 was attributed to low commodity prices and weak internal and external demand. Growth was projected to strengthen to 5.1 per cent in Sub-Saharan Africa in 2013. Growth in the BRICS countries (Brazil, Russia, India, China, and South Africa) was mixed in 2013. While Brazil improved from a growth rate of 1.0 per cent in 2012 to 2.3 per cent in 2013, Russia slowed down from 3.4 per cent in 2012 to 1.5 per cent in
22013. India grew by 4.4 per cent in 2013, compared with the 3.2 per cent recorded in 2012. China grew by 7.7 per cent in 2013, the same as in 2012, and South Africa recorded a growth of 1.8 per cent in 2013, down from the 2.5 per cent achieved in 2012.
1.1 Global Economic and
Financial Developments
1.1.1 OutputGlobal output was estimated to have grown by 3.0 per cent in 2013, compared
1with the 3.1 per cent achieved in 2012 . The lower growth rate was attributed to the continued fragility and persistent downside risks in some economies. The growth in the second half of 2013 was stronger than the 2.9 per cent projected in the October 2013 World Economic Outlook (WEO). The stronger growth during the second half of 2013 was due to improved macroeconomic and financial conditions in most economies. Global output in 2013 was driven mainly by growth in advanced economies as growth in emerging markets and developing economies slowed down.
Output in advanced economies was projected to improve to 2.2 per cent in 2014, due to higher inventory demand aimed at filling the large output gaps.
The US economy was estimated to have grown by 1.9 per cent in 2013, due to upward surprises to inventories in the second half of 2013. This was expected to improve to 2.8 per cent in 2014, given the carryover effects of final domestic demand supported by reduction in the fiscal drag following the recent agreement on the budget. Japan's growth was estimated at 1.7 per cent in 2013, up from the 1.4 per cent achieved in 2012. It was projected to remain unchanged at 1.7 per cent as the temporary fiscal stimulus
CBN FINANCIAL STABILITY REPORT DECEMBER 2013
1 World Economic Outlook (WEO) January 2014 Update2 For India, the IMF WEO Report noted that, “all data and forecast are presented on a fiscal year basis in the July 2013 WEO, whereas data were presented on a calendar year basis in the April 2013 WEO.” It added that the difference between the April 2013 WEO and the July 2013 WEO Update was adjusted to a fiscal year basis.
1
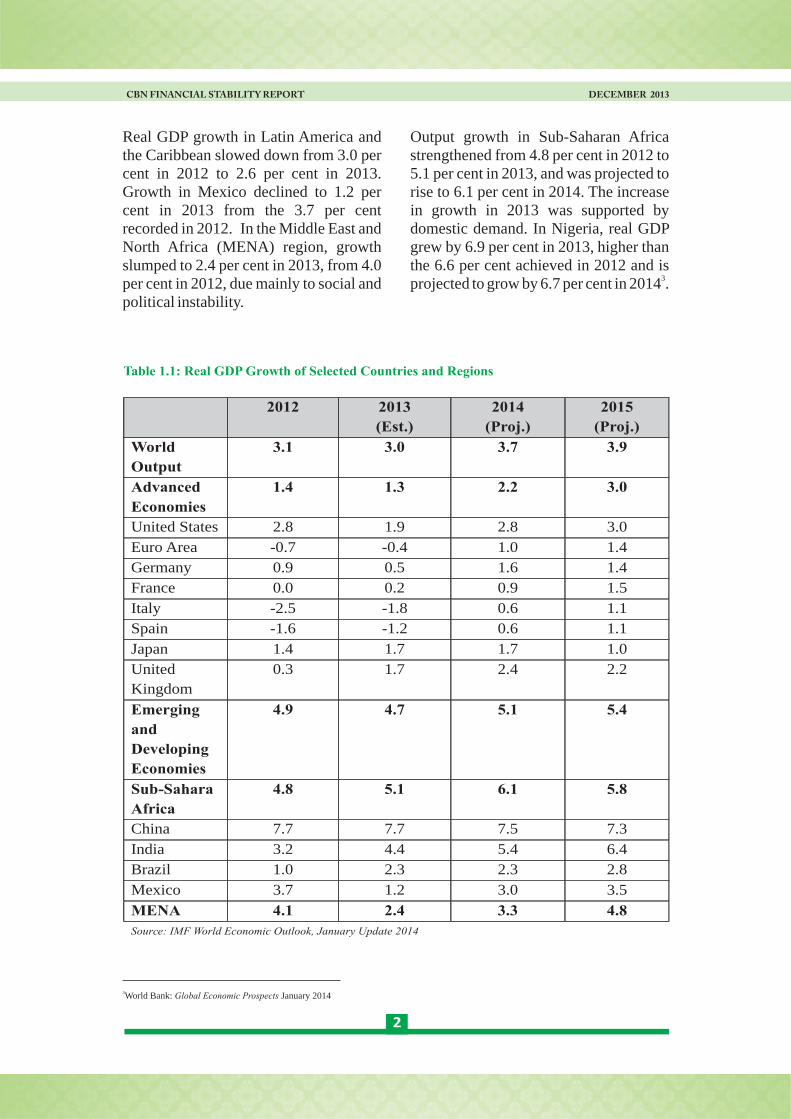
Output growth in Sub-Saharan Africa strengthened from 4.8 per cent in 2012 to 5.1 per cent in 2013, and was projected to rise to 6.1 per cent in 2014. The increase in growth in 2013 was supported by domestic demand. In Nigeria, real GDP grew by 6.9 per cent in 2013, higher than the 6.6 per cent achieved in 2012 and is
3projected to grow by 6.7 per cent in 2014 .
Real GDP growth in Latin America and the Caribbean slowed down from 3.0 per cent in 2012 to 2.6 per cent in 2013. Growth in Mexico declined to 1.2 per cent in 2013 from the 3.7 per cent recorded in 2012. In the Middle East and North Africa (MENA) region, growth slumped to 2.4 per cent in 2013, from 4.0 per cent in 2012, due mainly to social and political instability.
CBN FINANCIAL STABILITY REPORT DECEMBER 2013
Table 1.1: Real GDP Growth of Selected Countries and Regions
2012 2013
(Est.)
2014
(Proj.)
2015
(Proj.)
World
Output
3.1 3.0 3.7 3.9
Advanced
Economies
1.4 1.3 2.2 3.0
United States 2.8 1.9 2.8 3.0
Euro Area -0.7 -0.4 1.0 1.4
Germany 0.9 0.5 1.6 1.4
France 0.0
0.2
0.9 1.5
Italy -2.5
-1.8
0.6 1.1
Spain -1.6
-1.2
0.6 1.1
Japan 1.4
1.7
1.7 1.0
United
Kingdom
0.3
1.7
2.4 2.2
Emerging
and
Developing
Economies
4.9
4.7
5.1 5.4
Sub-Sahara
Africa
4.8 5.1 6.1 5.8
China 7.7 7.7 7.5 7.3
India 3.2 4.4 5.4 6.4
Brazil 1.0 2.3 2.3 2.8
Mexico 3.7 1.2 3.0 3.5
MENA 4.1 2.4 3.3 4.8
Source: IMF World Economic Outlook, January Update 2014
3World Bank: Global Economic Prospects January 2014
2
CBN FINANCIAL STABILITY REPORT DECEMBER 2013
capacity constraints, weakening exchange rates as well as strong domestic demand pressures in some of the countries, led to a marginal rise in prices relative to 2012.
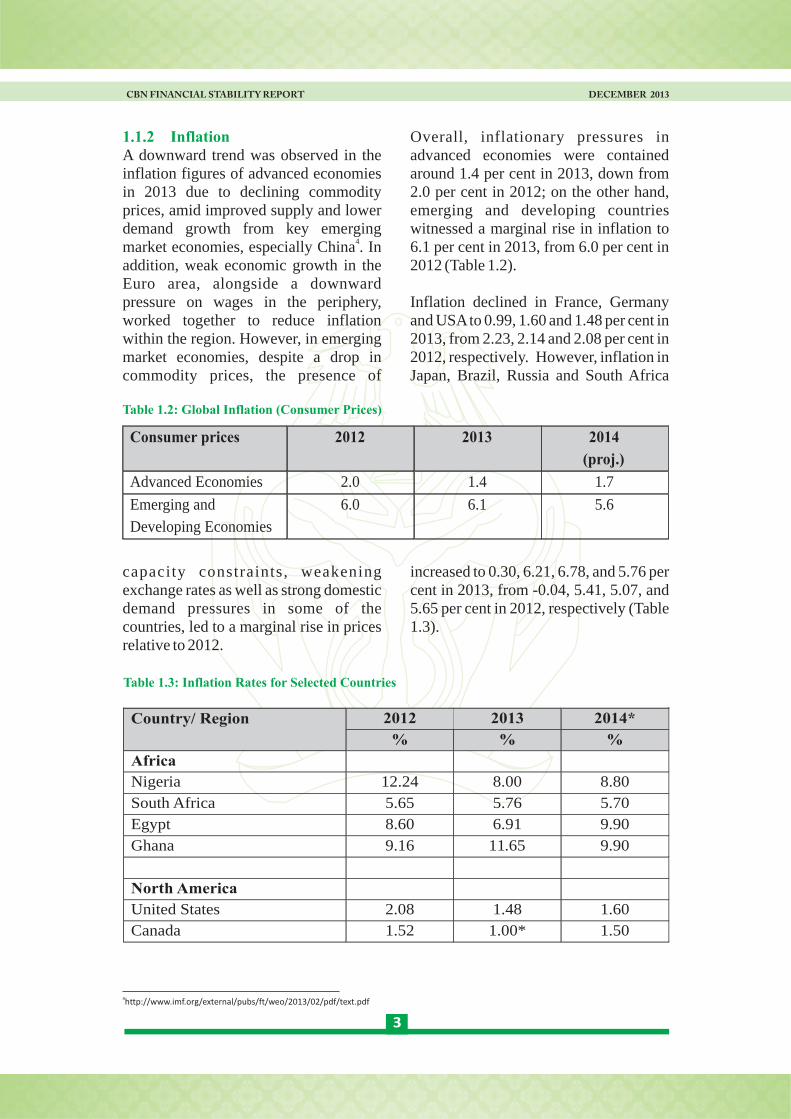
1.1.2 InflationA downward trend was observed in the inflation figures of advanced economies in 2013 due to declining commodity prices, amid improved supply and lower demand growth from key emerging
4market economies, especially China . In addition, weak economic growth in the Euro area, alongside a downward pressure on wages in the periphery, worked together to reduce inflation within the region. However, in emerging market economies, despite a drop in commodity prices, the presence of
Table 1.2: Global Inflation (Consumer Prices)
Consumer prices 2012 2013 2014
(proj.)
Advanced Economies 2.0 1.4 1.7
Emerging and
Developing Economies
6.0 6.1 5.6
increased to 0.30, 6.21, 6.78, and 5.76 per cent in 2013, from -0.04, 5.41, 5.07, and 5.65 per cent in 2012, respectively (Table 1.3).
Overall, inflationary pressures in advanced economies were contained around 1.4 per cent in 2013, down from 2.0 per cent in 2012; on the other hand, emerging and developing countries witnessed a marginal rise in inflation to 6.1 per cent in 2013, from 6.0 per cent in 2012 (Table 1.2).
Inflation declined in France, Germany and USA to 0.99, 1.60 and 1.48 per cent in 2013, from 2.23, 2.14 and 2.08 per cent in 2012, respectively. However, inflation in Japan, Brazil, Russia and South Africa
4http://www.imf.org/external/pubs/ft/weo/2013/02/pdf/text.pdf
Table 1.3: Inflation Rates for Selected Countries
Country/ Region 2012 2013 2014*
% % %
Africa
Nigeria 12.24 8.00 8.80
South Africa 5.65 5.76 5.70
Egypt 8.60 6.91 9.90
Ghana 9.16 11.65 9.90
North America
United States 2.08 1.48 1.60
Canada 1.52
1.00* 1.50
3

1.1.4 Monetary Policy RatesMonetary policy rates remained low in most advanced economies for the greater part of 2013. The U.S. Federal Reserve, the Bank of Japan, the Bank of England and the Bank of Canada maintained their rates at 0.25, 0.10, 0.50, and 1.00 per cent, respectively, while the European Central Bank maintained its rate between 0.25 and 0.75 per cent. The Reserve Bank of Australia reduced its policy rate from 2.75 per cent at end-July 2013 to 2.50 per cent by December 2013.
In the BRICS countries, monetary policy rates remained unchanged, except in Brazil and India where the rates were reviewed upward at end-July 2013 to 10.00 and 6.75 per cent, from 8.50 and 6.25 per cent, respectively (Table 1.4).
1.1.3 Oil pricesAverage crude oil prices declined marginally to US$104.10 in 2013, from US$105.00 in 2012. The decline was attributed to increased supply from new oil discoveries in China and the U.S. as well as the return to the market by Libya and Iran. Furthermore, increasing U.S. production arising from innovations in shale oil technology placed her as the largest non-OPEC producer of liquid hydrocarbons.
Global demand for crude oil was projected to grow at less than 1.5 per cent annually, with the growth coming from non-OECD countries. OECD oil consumption was expected to remain subdued in the light of sluggish economic growth and sustained general energy efficiency.
CBN FINANCIAL STABILITY REPORT DECEMBER 2013
Latin America
Brazil 5.41 6.21 5.80
Argentina 10.03 10.61 12.15
Mexico 4.11 3.81 3.70
Colombia 3.17 2.02 2.90
Europe
United Kingdom 2.84 2.57 2.10
France 2.23 0.99 1.20
Germany 2.14 1.60 1.50
Russia 5.07 6.78 5.40
Asia
Japan -0.04 0.30* 2.40
China 2.65 2.63 3.10
India 11.44 9.01 8.84
·Sources: All figures were sourced from Bloomberg except those for India which were from the IMF, World Economic Outlook (WEO) October 2013 and January 2014 update;
·(*) Bloomberg estimates
4

and the corresponding quarter of 2012, respectively. The growth in the non-oil sector was driven by activities in the telecommunications and postal services (26.73%), building and construction (14.96%), solid minerals (13.61%), hotels and restaurants (13.48%), wholesale and retail trade (11.33%), real estate and business services (11.02%), manufacturing (8.81%), and agriculture (4.29%) (Table 1.5).
The oil sector recorded a real growth rate of 0.30 per cent and contributed 11.73 per cent to GDP in the fourth quarter of 2013, in contrast to the negative growth of 1.15 and 0.53 per cent recorded in the second and third quarters of 2013, respectively. Its contribution to GDP was, however,
1.2 Domestic Developments
1.2.1 OutputDespite the slowdown in some emerging market economies, including the BRICS, the Nigerian domestic economy remained strong in the second half of 2013 as growth in output rose by 1.2 percentage points above its level of 6.5 per cent in the preceding period. The development was attributed to the increase in the contribution of the non-oil sector, reinforced by the relative stability in monetary and fiscal policies. The non-oil sector, in the fourth quarter, recorded a growth of 8.73 per cent, in real terms, and contributed 88.27 per cent to real GDP, compared with the growth of 7.95 and 8.21 per cent in the third quarter of 2013
CBN FINANCIAL STABILITY REPORT DECEMBER 2013
Table 1.4: Summary of Policy Rates Across Selected Countries (Jan 2013 – Dec 2013)
5
Country Jan Feb Mar Apr May Jun Jul Aug Sep Oct Nov Dec
Developed Economies
Japan 0.10 0.10 0.10 0.10 0.10 0.10 0.10 0.10 0.10 0.10 0.10 0.10
Europe 0.75 0.75 0.75 0.75 0.50 0.75 0.75 0.75 0.75 0.75 0.25 0.25
UK 0.50 0.50 0.50 0.50 0.50 0.50 0.50 0.50 0.50 0.50 0.50 0.50
US 0.25 0.25 0.25 0.25 0.25 0.25 0.25 0.25 0.25 0.25 0.25 0.25
Canada 1.00 1.00 1.00 1.00 1.00 1.00 1.00 1.00 1.00 1.00 1.00 1.00
South Korea 2.75 2.75 2.75 2.75 2.50 2.50 2.50 2.50 2.50 2.50 2.50 2.50
New Zealand 2.50 2.50 2.50 2.50 2.50 2.50 2.50 2.50 2.50 2.50 2.50 2.50
Australia 3.00 3.00 3.00 3.00 2.75 2.75 2.75 2.50 2.50 2.50 2.50 2.50
ASEAN
Indonesia 5.75 5.75 5.75 5.75 5.75 6.00 6.50 7.00 7.25 7.25 7.50 7.50
Malaysia 3.00 3.00 3.00 3.00 3.00 3.00 3.00 3.00 3.00 3.00 3.00 3.00
BRICS
Brazil 7.25 7.25 7.25 7.50 8.00 8.00 8.50 9.00 9.00 9.50 10.00 10.00
Russia 8.25 8.25 8.25 8.25 8.25 8.25 8.25 8.25 8.25 8.25 8.25 8.25
India 6.75 6.75 6.50 6.50 6.25 6.25 6.25 6.25 6.50 6.50 6.75 6.75
Hong Kong Base 0.50 0.50 0.50 0.50 0.50 0.50 0.50 0.50 0.50 0.50 0.50 0.50
South Africa 5.00 5.00 5.00 5.00 5.00 5.00 5.00 5.00 5.00 5.00 5.00 5.00
Other Emerging Economies & South America
Mexico 4.50 4.50 4.00 4.00 4.00 4.00 4.00 4.00 3.75 3.50 3.50 3.50
Chile 5.00 5.00 5.00 5.00 5.00 5.00 5.00 5.00 5.00 4.75 4.50 4.50
Colombia 4.00 3.75 3.25 3.25 3.25 3.25 3.25 3.25 3.25 3.25 3.25 3.25
Africa
Egypt 9.25 9.25 9.75 9.75 9.75 9.75 9.75 9.25 8.75 8.75 8.75 8.25
Ghana 15.00 15.00 15.00 15.00 16.00 16.00 16.00 16.00 16.00 16.00 16.00 16.00
Monthly Policy Rate
Source: Bloomberg

growth rate of the oil sector was attributed to improved production levels.
lower than the 12.50 per cent recorded in the second quarter of 2013.The rise in the
CBN FINANCIAL STABILITY REPORT DECEMBER 2013
Figure 1.1: Gross Domestic Product
0
50
100
150
Q4 2012 Q1 2013 Q2 2013 Q3 2013 Q4 2013
N b
illio
n
Crop Production Crude Petroleum and Nat res. Building & Constwholesale and Retail Trade Telecommunications Real Estate & Business Serv.
Table 1.5: Percentage Changes in Real GDP by Sector
Sector Q4 12 Q1 13 Q2 13 Q3 13 Q4 13
Telecommunication and Postal Services 32.44 24.53 22.12 24.42 26.73
Building and Construction 12.55 15.66 14.87 14.31 14.96
Solid Minerals 13.59
12.00 11.84 12.67 13.61
Hotels and Restaurants -3.12
13.61 13.69 13.66 13.48
Wholesale and Retail Trade 11.19
8.22 7.44 9.03 11.33
Real Estate and Business Services 5.58 9.81 10.58 10.15 11.02
Manufacturing 7.70 8.41 6.81 8.16 8.81
Agriculture 3.62 4.14 4.52 5.08 4.29
Crude Petroleum & Natural Gas -0.79 -0.54 -1.15 -0.53 0.3
Figure 1.2 : Shares of Oil and Non-oil Sectors in Real GDP
0
20
40
60
80
100
Q4 2012 Q1 2013 Q2 2013 Q3 2013 Q4 2013
OIL GDP/GDP NON-OILGDP/GDP
Pe
r c
en
t
6

at end-June 2013, and a decline of 4.0 percentage points from the level in December 2012. Furthermore, core and food inflation declined to 7.9 and 9.3 per cent at end-December 2013, from their respective levels of 13.7 and 10.2 per cent in December 2012.
Rates generally trended upwards with the exception of the Inter-bank Call and the Open-Buy-Back (OBB) rates. The
1.2.3 Interest Rates
1.2.2 InflationInflation was generally mild in the second half of 2013, due largely to price moderation in both food and non-food commodities classification. Year-on-year headline inflation stood at 8.0 per cent in December 2013, down from 8.4 per cent
CBN FINANCIAL STABILITY REPORT DECEMBER 2013
Figure 1.3: Share in Total GDP (%)
05
1015202530354045
Q4 2012 Q1 2013 Q2 2013 Q3 2013 Q4 2013Agriculture Crude Petroleum, Nat. Res. and Solid Min. Manufacturing
Building and Construction Wholesale and Retail Trade Telecommunication
Real Estate Other Services
Pe
r c
en
t
Figure 1.4: Inflationary Trend (Year-on-Year)
0
5
10
15
SECOND HALF 2012 FIRST HALF 2013 SECOND HALF 2013
Pe
r ce
nt
Head line (Y-o-Y) Core (Y-o-Y) Food (Y-o-Y)
Similarly, rates for other deposits with various maturities rose to a range of 1.71 - 7.92 per cent in the second half of 2013, from a range of 1.34 - 7.72 per cent in the first half of 2013.
However, the average Inter-bank Call and Open-Buy-Back (OBB) rates stood at 11.02 and 11.07 per cent in the second half of 2013, down from 11.69 and 11.27 per cent in the first half of 2013, respectively. The prime and maximum
development was largely attributed to the continued monetary tightening stance of the CBN. During the review period, the Bank maintained its policy rate at 12.00 per cent. Consequently, the average term deposit rate rose to 6.64 per cent, from 6.58 per cent in the first half of 2013.
7

savings, remained a major challenge to capital accumulation and the ability of banks to build a sustainable long-term
lending rates rose by 0.47 and 0.37 percentage points, respectively, to 17.09 and 24.93 per cent in the review period. Thus, the spread between the maximum lending and the average term deposit rates stood at 18.30 percentage points, a 0.32 percentage point over the level in the first half of 2013. With the inflation rate at 8.0 per cent in December 2013, all deposit rates were negative in real terms, while lending rates were positive in real terms. The negative real rate of return on deposits, which has been a disincentive to
CBN FINANCIAL STABILITY REPORT DECEMBER 2013
10.40
10.60
10.80
11.00
11.20
11.40
11.60
11.80
12.00
12.20
SECOND HALF 2012 FIRST HALF 2013 SECOND HALF 2013
Pe
r ce
nt
Call OBB MPR
Figure 1.5: Money Market Interest Rates and MPR
Figure 1.6: Lending and Deposit Rates
16.00
16.50
17.00
17.50
18.00
18.50
0.00
5.00
10.00
15.00
20.00
25.00
30.00
SECOND HALF 2012 FIRST HALF 2013 SECOND HALF 2013
pe
rce
nta
ge p
oin
t
Pe
r ce
nt
Savings Prime Maximum Avterm Dep. Spread (Max-Avtrm) rhs
second half of 2013, against the proportionate budget estimate of N2,452.68 billion, while expenditure was
loanable funds base. As part of efforts to improve the savings culture, the CBN continued to initiate and encourage banks to implement customer-friendly policies. Specifically, the recently revised Guide to Bank Charges specifies the minimum interest rate payable on savings accounts at 30 per cent of the ruling MPR.
The Federal Government's retained revenue stood at N1,817.49 billion in the
1.2.4 Fiscal Operations
8

budget deficit of N443.53 billion for the first half of 2013 and N278.55 billion for the corresponding period of 2012. The deficit was financed through domestic borrowings and privatization proceeds.
estimated at N2,561.77 billion, compared with N2,896.22 billion budgeted for the second half of 2013. Thus, the fiscal operations of Government resulted in a deficit of N744.28 billion or 6.3 per cent of GDP, as against the proportionate
CBN FINANCIAL STABILITY REPORT DECEMBER 2013
Figure 1.7: Federal Government Fiscal Operations
-1000
-500
0
500
1000
1500
2000
H2 2012 H1 2013 H2 2013
N B
illio
n
Retained Revenue Total Expenditure Budget Balance
9


credit, which more than offset the respective 26.0 and 5.9 per cent decline in other assets (net) and foreign assets (net) of the banking system.
Narrow money supply (M ) rose by 1.1 1
per cent at end-December 2013, in
52.1 Money and CreditGrowth in money supply remained sluggish at the end of the second half of 2013. Relative to the level at end-June 2013, broad money supply (M ) grew by 2
0.5 per cent to N15,668.95 billion at the end of the second half of 2013. The increase in money supply relative to the position during the preceding half year reflected, largely, the respective 14.4 and 17.3 per cent rise in net domestic credit and other assets (net) which more than offset the 7.1 per cent decline in net foreign assets of the banking system. Over the level at end-December 2012, M 2
rose by1.2 per cent, due largely, to the 18.5 per cent increase in net domestic
CBN FINANCIAL STABILITY REPORT DECEMBER 2013
Figure 2 .1: Trend in Monetary Aggregate
0
2000
4000
6000
8000
10000
12000
14000
16000
18000
SECOND HALF 2012 FIRST HALF 2013 SECOND HALF 2013
M2 M1 COB DD
NB
illio
n
5The analysis is based on the revised CBN Monetary Survey.
at end-June 2013. This reflected the 42.2, 17.3 and 5.2 per cent growth in claims on the Federal Government, and other assets (net) and claims on the private sector, respectively.
contrast to the 6.5 per cent decline at the end of the first half of 2013.The increase relative to the position in the preceding half year was attributed, largely, to the 28.3 per cent rise in currency outside banks (COB). As a ratio of total monetary assets, COB stood at 9.2 per cent, compared with the 7.2 per cent recorded at the end of the preceding half year.
Net domestic credit (NDC) to the economy grew by 7.3 per cent to N15,040.7 billion at end-December 2013, compared with N13,149.4 billion
2.1.1 Aggregate Credit to the Economy
11
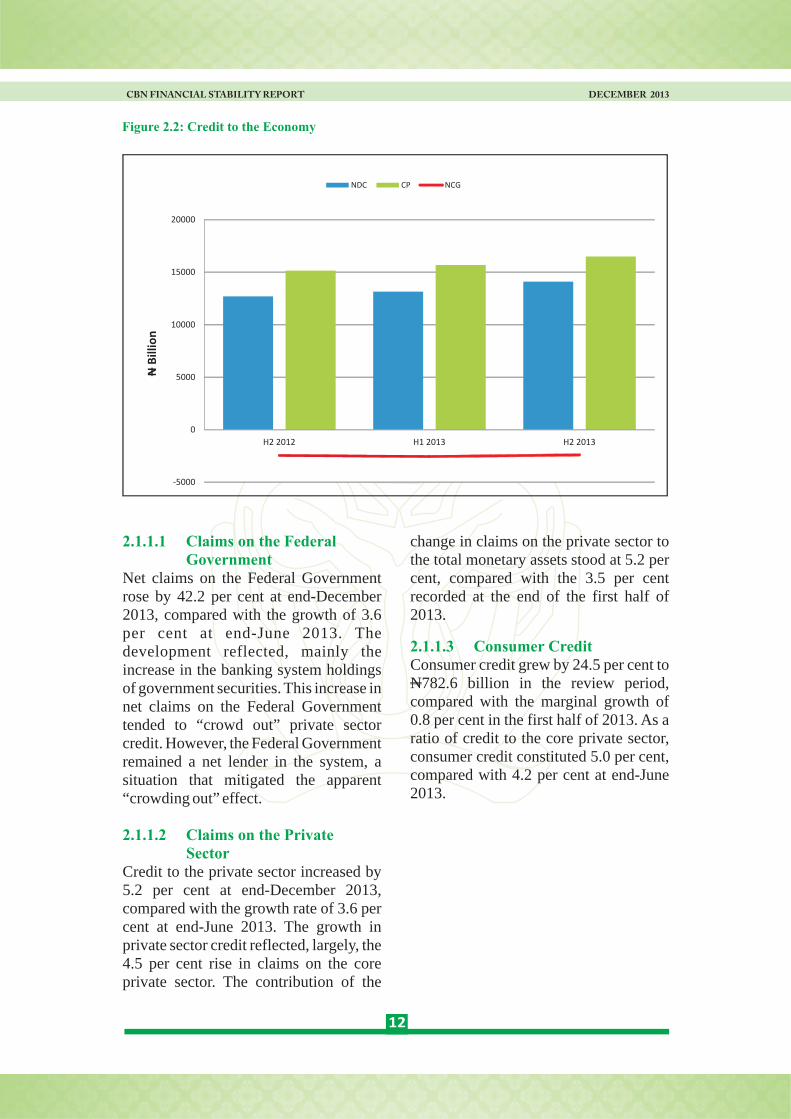
change in claims on the private sector to the total monetary assets stood at 5.2 per cent, compared with the 3.5 per cent recorded at the end of the first half of 2013.
Consumer credit grew by 24.5 per cent to N782.6 billion in the review period, compared with the marginal growth of 0.8 per cent in the first half of 2013. As a ratio of credit to the core private sector, consumer credit constituted 5.0 per cent, compared with 4.2 per cent at end-June 2013.
2.1.1.3 Consumer Credit
2.1.1.1 Claims on the Federal Government
2.1.1.2 Claims on the Private Sector
Net claims on the Federal Government rose by 42.2 per cent at end-December 2013, compared with the growth of 3.6 per cent at end-June 2013. The development reflected, mainly the increase in the banking system holdings of government securities. This increase in net claims on the Federal Government tended to “crowd out” private sector credit. However, the Federal Government remained a net lender in the system, a situation that mitigated the apparent “crowding out” effect.
Credit to the private sector increased by 5.2 per cent at end-December 2013, compared with the growth rate of 3.6 per cent at end-June 2013. The growth in private sector credit reflected, largely, the 4.5 per cent rise in claims on the core private sector. The contribution of the
CBN FINANCIAL STABILITY REPORT DECEMBER 2013
Figure 2.2: Credit to the Economy
-5000
0
5000
10000
15000
20000
H2 2012 H1 2013 H2 2013
NDC CP NCG
N B
illio
n
12

with a share of 24.4 per cent, followed by manufacturing (12.9 per cent) and the general sector (11.6 per cent). The share of the agricultural sector declined to 3.7 per cent, from 4.0 per cent in the first half of 2013 (Table 2.1).
2.1.2 Sectoral Classification of Private Sector Credit
Total bank loans and advances to the various sectors of the economy grew by 13.9 per cent to N10,042.71 billion at end-December 2013. The oil and gas sector recorded the highest growth rate,
CBN FINANCIAL STABILITY REPORT DECEMBER 2013
Figure 2.3: Consumer Credit
0%
10%
20%
30%
40%
0
100
200
300
400
500
600
700
800
900
SECOND HALF 2012 FIRST HALF 2013 SECOND HALF 2013
Consumer Credits Growth over end-Dec Ratio of Credit to Core private sector
NB
illio
n
per
cen
t
Table 2.1: Consumer Credit by Sector
13
Sector N'Billion Per cent N'Billion Per cent
Oil and Gas 2,002.26 22.72 2,450.48 24.40
Manufacturing 1,196.64 13.58 1,295.41 12.90
General 1,017.03 11.54 1,164.42 11.59
Information and Communication 845.86 9.60 881.22 8.77
General Commerce 777.45 8.80 807.51 8.04
Governments 684.48 7.77 764.91 7.62
Real Estate Activities 414.44 4.70 450.10 4.48
Construction 394.26 4.47 431.27 4.29
Agriculture, Forestry and Fishing 352.43 4.00 370.63 3.69
Finance and Insurance 247.70 2.80 324.21 3.23
Transportation and Storage 235.09 2.67 291.44 2.90
Capital Market 192.83 2.19 255.79 2.55
Power and Energy 131.11 1.49 193.98 1.93
Professional, Scientific and Technical Activities 125.90 1.43 159.13 1.58
Education 74.16 0.84 70.99 0.71
Administrative and Support Service Activities 54.55 0.62 58.67 0.58
Human Health and Social Work Activities 22.19 0.25 32.38 0.32
Activities of Extraterritorial Organizations and Bodies 18.07 0.21 14.66 0.15
Mining and Quarrying 10.59 0.12 11.35 0.11
Water Supply Sewerage, Waste Management and Remediation Activities
8.38 0.10 8.22 0.08
Arts, Entertainment and Recreation 8.05 0.09 3.98 0.04
Public Utilities 0.88 0.01 1.96 0.02
Total 8,814.36 100.00 10,042.71 100.00
Jun. 2013 Dec. 2013

second half of 2013. On the average, credits maturing within one year accounted for 52.6 per cent, compared with 57.1 per cent in the first half of 2013. The medium-term (≥1yr and < 3yrs) and long-term (3yrs and above) maturities stood at 19.1 and 28.3 per cent in the review period, compared with 19.7 and 23.2 per cent, respectively, in the first half of 2013.
Similarly, deposits of below one-year maturity constituted 97.1 per cent of total deposits (out of which 76.7 per cent had maturity of less than 30 days), compared with 96.9 per cent at end-June 2013. The medium and long-term deposits constituted 2.8 and 0.003 per cent in the review period, compared with 3.1 and 0.05 per cent recorded in the first half of
2.1.3 Reserve Money
2.1.4 Maturity Structure of Bank Deposits and Credits
Reserve money (RM) increased at the end of the second half of 2013 and was higher than the indicative benchmark for 2013. It rose by 71.8 per cent to N5,558.9 billion at end-December 2013, in contrast to the decline of 12.6 per cent recorded at the end of the first half of 2013. This development reflected the 108.9 and 24.6 per cent increases in bank deposit with the Bank and currency-in-circulation, respectively. The corresponding rise in the sources of reserve money, relative to the first half of 2013, was attributed to increases in net domestic credit and other assets (net) of the Bank.
Short- term maturi t ies remained dominant in the credit market in the
CBN FINANCIAL STABILITY REPORT DECEMBER 2013
Figure 2.4: Sectoral Allocation of Credit
0
500
1000
1500
2000
2500
3000
Oil&
Gas
MA
NU
FAC
TUR
ING
GEN
ERA
L
INFO
RM
ATIO
N &
CO
MM
UN
ICA
TIO
N
GEN
ERA
L C
OM
MER
CE
GO
VER
NM
ENTS
REA
L ES
TATE
AC
TIV
ITIE
S
CO
NST
RU
CTI
ON
AG
RIC
ULT
UR
E, F
OR
ESTR
Y A
ND
FIS
HIN
G
FIN
AN
CE
AN
D IN
SUR
AN
CE
TRA
NSP
OR
TATI
ON
AN
D S
TOR
AG
E
CA
PIT
AL
MA
RK
ET
PO
WER
AN
D E
NER
GY
PR
OFE
SSIO
NA
L, S
CIE
NTI
FIC
AN
D…
EDU
CA
TIO
N
AD
MIN
ISTR
ATIV
E A
ND
SU
PP
OR
T SE
RV
ICE…
HU
MA
N H
EALT
H A
ND
SO
CIA
L W
OR
K…
AC
TIV
ITIE
S O
F EX
TRAT
ERR
ITO
RIA
L…
MIN
ING
AN
D Q
UA
RR
YIN
G
WAT
ER S
UP
PLY
SEW
ERA
GE,
WA
STE
MG
T. &
…
AR
TS, E
NTE
RTA
INM
ENT
AN
D R
ECR
EATI
ON
PU
BLI
C U
TILI
TIES
Jun. 2013
Dec. 2013
14

for longer loan maturities. Thus, the observed mismatch portends refinancing and re-pricing risks for the system.
The banking industry was dominated by a few banks as the average market share of
2.1.5 Market Structure of the Banking Industry
2013, respectively. The continued dominance of short-term deposits constrained the ability of banks to lend long term loans and especially to the real sector which typically has a preference
CBN FINANCIAL STABILITY REPORT DECEMBER 2013
Figure 2.5: Distribution of Bank Loans and Advances by Maturity
0
10
20
30
40
50
60
70
SECOND HALF 1012 FIRST HALF 2013 SECOND HALF 2013
Per
cent
Short term Medium term Long term
Figure 2.6: Distribution of Banks' Deposit Structure
-0.5
0.5
1.5
2.5
3.5
96.6
96.7
96.8
96.9
97
97.1
97.2
97.3
97.4
97.5
SECOND HALF 2012 FIRST HALF 2013 SECOND HALF 2013
Short term
Medium term
Per
cen
t
Per
cen
t
assets and deposits, stood at 13.71 and 15.14 per cent, respectively, compared with 13.57 and 15.17 per cent at end-June 2013. However, the banking industry remained competitive in both deposits and assets as revealed by the respective Herfindahl-Hirschman Index (HHI) of 798.08 and 750.16 for total deposits and
assets and deposits of the six largest banks (concentration ratio–CR ) stood at 6
50.68 and 52.23 per cent, respectively. During the review period, the market share of the largest bank, in terms of
15

CBN FINANCIAL STABILITY REPORT DECEMBER 2013
Figure 2.7: Market Concentration Ratios of Banks (Assets and Deposits)
700.0
720.0
740.0
760.0
780.0
800.0
820.0
49.5
50.0
50.5
51.0
51.5
52.0
52.5
53.0
SECOND HALF 2012 FIRST HALF 2013 SECOND HALF 2013
HH
I
CR
CR( Assets) CR(Deposits) HHI (Deposits) rhs HHI (Assets)rhs
during the review period.A new unit was created in the CBN to formulate policies on Islamic finance and serve as a secretariat for the Financial Regulation Advisory Council of Experts (FRACE).The roles and responsibilities of the Unit include the following:
·Develop policies on the Non-Interest Financial Institutions (NIFIs) under the purview of the CBN;
·Process reques t s fo r the establishment of NIFIs;
·Develop guidelines for the operations of NIFIs;
·Arrange and co-ordinate the meetings of FRACE;
·Receive requests and queries directed to the Council from NIFIs and other regulatory authorities; and
·Develop parameters for non-interest products and instruments issued by the NIFIs.
Nigerian banks continued to expand their operations outside the country with the
2.4 Cross-border Collaboration
2.2 Implementation of the 2010 Banking Model
2.3 Non-Interest (Islamic) Banking
The deadline for the implementation of the prescribed banking model introduced in October 2010 expired on June 30, 2013. At end-December 2013, most of the banks had complied with the Regulation on the Scope of Banking Activities and Ancillary Matters by divesting from their non-banking activities.
As part of efforts to promote non-interest banking (NIB) in Nigeria, the CBN i n t e n s i f i e d c o l l a b o r a t i o n w i t h international agencies, such as the Islamic Financial Services Board (IFSB) and the International Islamic Liquidity Management Corporation (IILM) in the review period.
As evidence of growing interest in NIB products and services in Nigeria, one bank was granted approval to operate a non-interest banking window, while an
16
assets, compared with 797.36 and 748.55, respectively, in the preceding period. (Figure 2.7)
Approval-in-Principle (AIP) was issued to a micro-finance bank (MFB) to establish a state-wide non-interest MFB

host regulators. The MoUs facilitated information sharing, consolidated supervision and joint examinations across jurisdictions. In the review period,
opening of seven subsidiaries across the African continent during the review period, bringing the total to 64 at end-December 2013 (Table 2.2). The increase
CBN FINANCIAL STABILITY REPORT DECEMBER 2013
Table 2.2: Distribution of Off-shore Subsidiaries of Nigerian Banks
s
es
& Region Subsidiaries Representative Office
Branch
Jan-Jun
2013
Jul-Dec
2013
Jan-Jun
2013
Jul-Dec
2013
West Africa 32 35 - -
The Rest of Africa 17 20 4 4
Europe, N/ America
& Asia
9 9 5 5
58 64 9
9
the CBN also initiated the process of signing an MoU with the Bank of Maur i t ius , wh i le co l l abora t ive discussions on the MoUs with the Central Bank of Sudan and the Banque Central du Congo continued.
During the review period, agreements were reached on the establishment of a College of Supervisors for the banking subsidiaries of Ecobank Transnational Incorporated (ETI) led by the Central Bank of West African States (BCEAO), and a College of Supervisors for the United Bank of Africa, led by the CBN.
In order to ascertain the health of foreign subsidiaries of Nigerian banks, the CBN examined 14 of them in the review period. Of this number, eight (8) were jointly conducted with host supervisors, while six (6) were solely carried out by the CBN. Six (6) examination reports were issued during the period, which indicated that three (3) of the subsidiaries
2.4.2 Colleges of Supervisors
2.4.3 Cross-border Examination
in foreign subsidiaries was as a result of four acquisitions in West Africa and three in East Africa, while one bank divested from a subsidiary in West Africa.
The cross-border expansion of Nigerian banks has continued to be motivated by several factors which include profit maximization, risk diversification, the demand pull from corporate clients, and increasing business opportunities. However, the expansion exposes the Nigerian financial system to regional contagion risk.
The major thrust in managing the contagion risk is the timely exchange of information amongst home and host regulatory authorities. This is facilitated through the execution of MoUs, the activities of the College of Supervisors, and cross-border examination.
At end-December 2013, 15 MoUs had been executed between the CBN and the
2.4.1 Memoranda of Understanding (MoUs)
17

sector is divided by institution-type: Development Finance Institutions (DFIs), Primary Mortgage Banks (PMBs), Microfinance Banks (MFBs), Finance Companies (FCs), and Bureaux de Change (BDCs). In terms of total number of OFIs in operation, the figure rose to 3,858 at end-December 2013, representing an increase of 9.95 per cent over the 3,509 recorded at end-June 2013. The number comprised 6 Development Finance Institutions (DFIs), 82 Primary Mortgage Banks (PMBs), 820 Microfinance Banks (MFBs), 61 Finance Companies (FCs) and 2,889 Bureaux de Change (BDCs). The increase was accounted for by approvals to resume operations/licences granted to 456 operators (1 DFI, 4 MFBs and 451 BDCs) and the exit of 107 OFIs (83 MFBs, 4 FCs and 20 BDCs) during the review period. Total assets of the sub-sector similarly increased by 39.00 per cent to N1,565.65 billion at end-December 2013, from N1,126.40 billion at end-June 2013. Paid-up capital and net loans/advances also increased by 156.10 and 43.75 per cent to N532.31 billion and N673.95 billion, respectively, at end-December 2013. Total deposit liabilities followed the same pattern, increasing by 10.73 per cent to N457.56 billion at end-December 2013, from N413.22 billion at end-June 2013.
The specific developments analyzed under each segment/OFI-type were as follows:
At end-December 31, 2013, the number of DFIs under the supervisory purview of the CBN was six (6), compared with five (5) at end-June 2013. The increase resulted from the re-emergence, in October 2013, of the National Economic Reconstruction Fund (NERFUND).
2.5.1 Development Finance Institutions (DFIs)
had a “Moderate” composite risk rating while three (3) other subsidiaries had a risk rating of “Above Average”.
The CBN and the entire banking industry have adopted the Nigerian Sustainable Banking Principles. This is to ensure that financial institutions get committed to economic growth that is environmentally responsible and socially relevant. The Nigerian Sustainable Banking Principles consist of the following nine overarching commitments:
·Managing environmental and social risks;
·Managing each bank's own environmental and socia l footprints;
·Safeguarding human rights;·Promoting women's economic
participation and empowerment;·Promoting financial inclusion;·Ensuring good governance,
transparency and accountability;·Supporting capacity building in
the sector;·P r o m o t i n g c o l l a b o r a t i v e
partnership to accelerate sector progress; and
·Reporting to take stock of progress.
During the review period, the Bank issued guidelines on sustainable bank lending to the power, aviation as well as the oil and gas sectors. A reporting template was also developed to standardize reporting by financial institutions.
During the review period, significant developments were recorded in each of the five segments into which the sub-
2.4.4 Nigerian Sustainable Banking Principles
2.5 Other Financial Institutions (OFIs)
CBN FINANCIAL STABILITY REPORT DECEMBER 2013
18

minimum of N2.5 billion (for state licence) and N5 billion (for national licence), 40 PMBs met the new capital requirement. Further analysis of the existing 82 PMBs indicated that: seven (7) emerged as National PMBs; 33 as State PMBs; four (4) were subsumed in merger and acquisition arrangements; 13 applied for conversion to OFI-types, with lower capital requirements; and 25 were unable to meet the re-capitalization deadline.
Analysis of PMBs' financial information showed that their total assets increased by 32.77 per cent to N484.01 billion at end-December 2013, from N364.54 billion at end-June 2013. Paid-up capital and shareholders' funds also increased by 117.97 and 88.33 per cent to N150.25 billion and N144.58 billion, respectively, at end-December 2013, from N68.93 billion and N76.77 billion respectively at end-June 2013. The growth was attributed to the effort of PMBs to comply with the new capital requirements under the mortgage/housing finance sector reforms. Similarly, loans/advances and deposits increased by 21.05 and 0.12 per cent to N157.40 billion and N164.69 billion, respectively, at end-December 2013, from N130.03 billion and N164.50 billion, respectively, at end-June 2013, respectively.
The Nigeria Mortgage Re-finance Company Plc (NMRC) was incorporated in the second half of 2013 as a second-tier, mono-line institution to promote the availability and affordability of housing to Nigerians by providing liquidity in the mortgage market through financial institutions. The NMRC is expected to address the mismatch between the short-term tenor of deposit liabilities and the long-term nature of mortgage assets. This
2.5.2.1 Mortgage Refinancing
Following the appointment of a new management team, the process of restructuring and recapitalizing the Fund, as well as the recovery of loans, commenced.
Provisional data showed that the total assets of the 6 DFIs increased by 31.26 per cent to N586.66 billion at end-December 2013, from N446.94 billion at end-June 2012.The increase in aggregate assets was due to the improved financial performance of the Bank of Industry (BOI), Bank of Agriculture (BOA), and The Infrastructure Bank (TIB), while the data showed that the financial performance of FMBN and NEXIM declined marginally during the review period. The paid-up capital and net loans/advances of the institutions increased by 227.44 and 57.86 per cent to N230.94 billion and N358.21 billion, respectively, as at December 31, 2013. Also, total deposit liabilities increased by 56.22 per cent to N171.81 billion at end-December 2013. A disaggregation of the total assets showed that BOA, FMBN, NEXIM, TIB, BOI and NERFUND accounted for 8.85, 24.03, 9.13, 5.22, 50.49 and 2.28 per cent, respectively, while their respective shares of the total loans and advances were 7.22, 31.59, 8.55, 3.93, 45.57 and 3.13 per cent.
In the area of corporate governance, the review period also witnessed the reconstitution of the Boards of Directors of BOA and NEXIM. Those of FMBN and the privatized TIB were already in place while BOI and NERFUND were still being governed by a Shareholders' and Interim Management Committees, respectively.
At the expiration of the December 31, 2013 deadline for operators of PMBs to increase their capital to the prescribed
2.5.2 Primary Mortgage Banks
CBN FINANCIAL STABILITY REPORT DECEMBER 2013
19

December 2013, from N278.93 billion at end-June 2013. The paid-up share capital and net loans/advances also decreased by 2.54 and 8.92 per cent to N67.40 billion and N129.03 billion, respectively, at end-December 2013, from N69.16 billion and N141.67 billion, respectively, at end-June 2013. Similarly, aggregate reserves decreased to N5.56 billion at end-December 2013, compared with N5.76 billion at end-June 2013, reflecting a decline of 3.47 per cent. The decrease was attributed, largely, to the revocation of the licenses of 83 MFBs.
In 2013, the Microfinance Certification Programme (MCP), which was introduced to bridge the observed skills gap in the microfinance industry, concluded its second phase and with it, the withdrawal of the subsidy to it by the CBN and the NDIC. The subsidy, designed to nurture the fledgling programme, had entailed the payment of 60 per cent of the total cost of training. The CBN will, however, continue to co-ordinate the Programme and accredit the Microfinance Training Service Providers (MTSPs). During the first four years of the Programme, a total of 9,352 operators of microfinance banks were trained in the 12 runs organized for the two approved levels of training as against the set target of 6,000, representing a 156 per cent performance rate. Of the 9,352 trained MFB operators, 2,202 have been certified by the Chartered Institute of Bankers of Nigeria and are spread over 632 MFBs. The Programme was also extended to non-executive directors of MFBs and other stakeholders, with a total of 1,406 non-executive directors and 223 regulators having been trained in 2012 and 2013.
The number of operating finance companies (FCs) fell to 61 at end-
2.5.4 Finance Companies
would be achieved by raising long-term funds from the capital market and other sources of debt capital to re-finance eligible mortgages originated by the financial institutions. To ensure a smooth take-off of the NMRC, the Federal Government of Nigeria secured a 40-year term loan of US$ 300 million from the Wo r l d B a n k , o n I n t e r n a t i o n a l Development Association (IDA) terms. Of the total loan, US$250 million was for the NMRC, US$25 million for financing micro-housing”, and US$25 million for a mortgage-guarantee programme to enable low income borrowers to access mortgage loans.
Following the CBN's “No Objection” approval in 2012 for the registration of mortgage brokers in Nigeria, the Mortgage Banking Association of Nigeria (MBAN), in July 2013, released the guidelines for mortgage brokerage companies/operators in Nigeria. The guidelines created a new class of operators in the system - Licensed Professional Mortgage Brokers - who are authorized to solicit for borrowers; negotiate, find and place mortgages; as well as provide related advisory services - for a fee.
The number of licensed microfinance banks (MFBs) fell to 820 at end-December 2013 from 899 at end-June 2013. The fall was due to the revocation of the licenses of 83 institutions that were confirmed to have either closed shop or ceased to carry on microfinance business, while four new MFBs were licensed. Of the existing 820 MFBs four (4) operated as National, 69 as State, and 753 as Unit MFBs. Available data indicated that the total assets of MFBs decreased by 2.88 per cent to N270.90 billion at end-
2.5.2.2 Guidelines on Mortgage Brokerage
2.5.3 Microfinance Banks
CBN FINANCIAL STABILITY REPORT DECEMBER 2013
20

dedicated to enterprises promoted by women. The Financial Inclusion Secretariat was also established in the review period to co-ordinate the financial inclusion programmes in the country.
Following the adoption of the tiered-KYC and the need to mitigate the associated risk, CBN's Anti Money Laundering/Combating the Financing of Terrorism Regulation 77 (1)-(8) was amended to require financial institutions to:
·Allow third parties with acceptable means of identification, such as clergymen, village/clan heads and headmasters, to identify the financially excluded persons, for account opening purposes;
·Formulate policies on financially disadvantaged customers and prescribe the type of documents to be provided by third-party identifiers;
·Adopt a risk-based approach on the operation of this category of customers; and
·Enhance the monitoring of such accounts, customers and third party identifiers and render monthly returns to the CBN and the NFIU on their operations.
It is expected that full implementation of these measures will improve access to formal financial services.
T h e B a n k c o m m e n c e d t h e implementation of its Financial Literacy Awareness/Enlightenment initiative, in line with its financial inclusion strategy, through public workshops, road shows, a secondary schools programme, and the
2.6.1 Financial Literacy
December 2013, from 65 at end-June 2013. This was due to the voluntary liquidation of two (2) FCs and discontinuation of finance company business by two (2) others, while one (1) was sealed up and is being investigated by the Economic and Financial Crimes Commission. One (1) new FC was licensed in the period.
Total assets of FCs increased to N103.05 billion at end-December 2013, from N82.13 billion at end-June 2013, reflecting a growth of 25.47 per cent. Similarly, paid-up capital increased by 3.23 per cent to N14.69 billion at end-December 2013, from N14.23 billion at end-June 2013. Aggregate reserves rose to N3.59 billion at end-December 2013, from N0.07 billion at end-June 2013. Net loans/advances and borrowings also increased by 68.58 and 20.64 per cent to N46.68 billion and N59.22 billion, respectively, at end-December 2013, from N27.69 billion and N49.09 billion, respectively, at end-June 2013.
As part of efforts to implement the national financial inclusion strategy, the geo-spatial mapping of financial services access points was launched in July 2013.The mapping exercise was aimed at providing consumer information by indicating the geographic distribution of financial access points across the country, including banks, other financial i n s t i t u t i ons , non -gove rnmen ta l organisations, ATMs, and Nigeria Postal Service offices.
The N220 billion Micro Small and Medium Enterprises Development Fund (MSMEDF) was launched on August 15, 2013 to provide wholesale funding to MFBs/MFIs, as well as enhance access to financial services by women. Towards this end, 60 per cent of the Fund was
2.6 Financial Inclusion
CBN FINANCIAL STABILITY REPORT DECEMBER 2013
21
2.7 Financial Markets
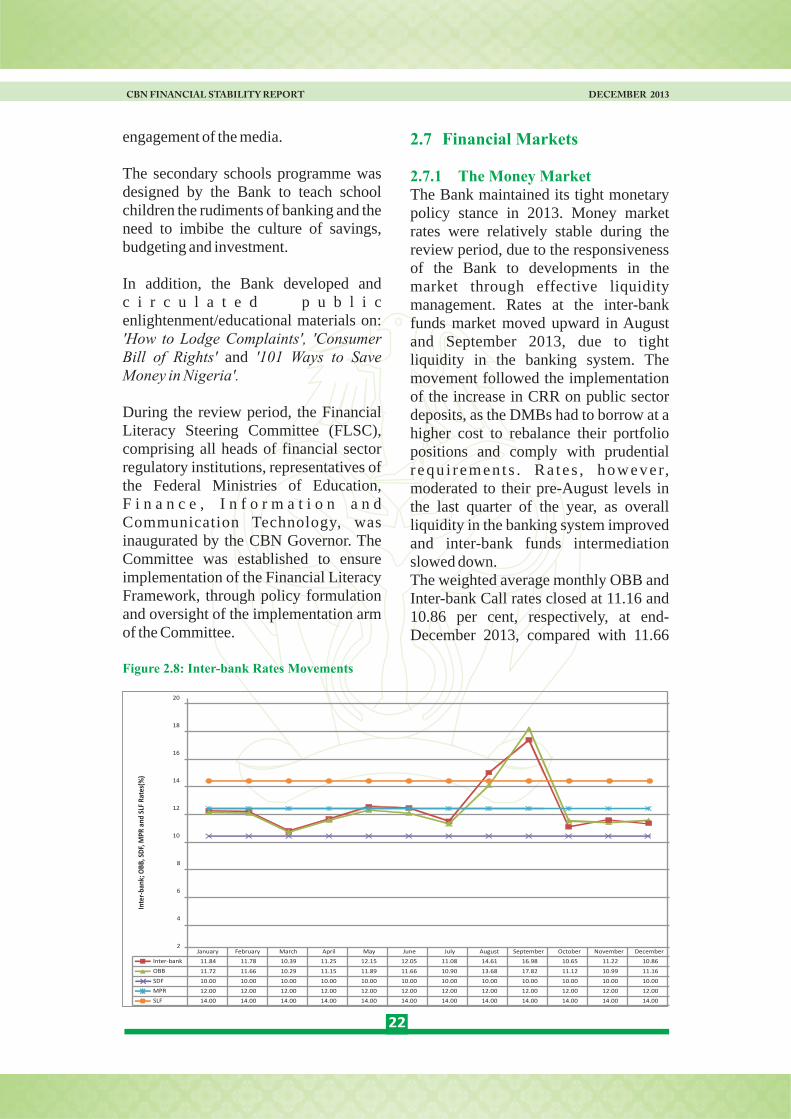
2.7.1 The Money MarketThe Bank maintained its tight monetary policy stance in 2013. Money market rates were relatively stable during the review period, due to the responsiveness of the Bank to developments in the market through effective liquidity management. Rates at the inter-bank funds market moved upward in August and September 2013, due to tight liquidity in the banking system. The movement followed the implementation of the increase in CRR on public sector deposits, as the DMBs had to borrow at a higher cost to rebalance their portfolio positions and comply with prudential r equ i r emen t s . Ra te s , however, moderated to their pre-August levels in the last quarter of the year, as overall liquidity in the banking system improved and inter-bank funds intermediation slowed down.The weighted average monthly OBB and Inter-bank Call rates closed at 11.16 and 10.86 per cent, respectively, at end-December 2013, compared with 11.66
engagement of the media.
The secondary schools programme was designed by the Bank to teach school children the rudiments of banking and the need to imbibe the culture of savings, budgeting and investment.
In addition, the Bank developed and c i r c u l a t e d p u b l i c enlightenment/educational materials on: 'How to Lodge Complaints', 'Consumer Bill of Rights' and '101 Ways to Save Money in Nigeria'.
During the review period, the Financial Literacy Steering Committee (FLSC), comprising all heads of financial sector regulatory institutions, representatives of the Federal Ministries of Education, F i n a n c e , I n f o r m a t i o n a n d Communication Technology, was inaugurated by the CBN Governor. The Committee was established to ensure implementation of the Financial Literacy Framework, through policy formulation and oversight of the implementation arm of the Committee.
CBN FINANCIAL STABILITY REPORT DECEMBER 2013
Figure 2.8: Inter-bank Rates Movements
January February March April May June July August September October November December
Inter-bank 11.84 11.78 10.39 11.25 12.15 12.05 11.08 14.61 16.98 10.65 11.22 10.86
OBB 11.72 11.66 10.29 11.15 11.89 11.66 10.90 13.68 17.82 11.12 10.99 11.16
SDF 10.00 10.00 10.00 10.00 10.00 10.00 10.00 10.00 10.00 10.00 10.00 10.00
MPR 12.00 12.00 12.00 12.00 12.00 12.00 12.00 12.00 12.00 12.00 12.00 12.00
SLF 14.00 14.00 14.00 14.00 14.00 14.00 14.00 14.00 14.00 14.00 14.00 14.00
2
4
6
8
10
12
14
16
18
20
Inte
rba
nk; O
BB
, SD
F, M
PR a
nd S
LF R
ates
(%)
-
22

restriction on importation of foreign currency, subject to CBN approval; payment of receipts of the proceeds of international money transfers in naira; and an increase in the amount spendable on naira debit and credit cards to US$150,000 from US$40,000 per annum.
The WDAS operated in the third quarter until October 2, 2013 when they were replaced by the RDAS in a bid to check the persistent demand pressures in the foreign exchange markets and curb the huge movement of cash without the required documentation and reporting to the monetary authorities. The re-introduction of the RDAS was aimed at monitoring the utilisation of funds in order to curtail round tripping and ensure exchange rate stability.
The average foreign exchange rate at the RDAS and Inter-bank segments appreciated by 0.02 and 0.60 per cent to N157.2742/$ and N159.0505/$,
and 12.05 per cent at end-June 2013.
The Scripless Securities Settlement System (S4) was deployed in December 2013 to provide a straight-through process for securities trading and settlement. The S4 is geared towards facilitating electronic management of securities by easing transfer and settlement of OBB transactions, thereby boosting activities in the segment. It is also aimed at facilitating delivery versus payment (DvP) settlements and reducing settlement risks, thus encouraging trading in Federal Government debt instruments.
During the review period, the CBN introduced a number of policies to address inherent risks to exchange rate stability and check money laundering. These included: the re-introduction of the Retail Dutch Auction System (RDAS); the pegging of purchases from DMBs to US$250,000 by each BDC per week;
2.7.2 The Foreign Exchange Market
CBN FINANCIAL STABILITY REPORT DECEMBER 2013
Figure 2.9: WDAS, Inter-bank and BDC Rates, 2013
Jan Feb Mar Apr May Jun Jul Aug Sep Oct Nov Dec
W/DAS-SPT (incl. 1% comm.) 157.30 157.30 157.31 157.31 157.30 157.31 157.32 157.31 157.32 157.42 157.27 157.27
Inter-Bank 156.96 157.52 158.38 158.20 158.02 160.01 161.12 161.15 161.96 159.83 158.79 159.05
BDC 159.12 158.70 159.80 159.81 159.57 160.98 162.43 162.28 163.14 165.00 167.19 171.40
145
150
155
160
165
170
175
Inte
r-b
ank/
OB
B V
olu
me
(N
'B)
23

respectively, while the average rate at the BDC segment depreciated by 6.08 per cent to close at N171.4000/$ at end-December 2013.
Transactions on the Nigerian Stock Exchange (NSE) were bullish during the review period as both the All Share Index (ASI) and Market Capitalization (MC) trended upwards. The development was attributed to improved corporate earnings by blue chip companies and increased p o r t f o l i o i n v e s t m e n t . T h e implementation of the Transformation Agenda of the Federal Government, such as privatization of the power sector and the Subsidy Re-investment and Empowerment Programme (SURE-P) bolstered capital investment. Salient institutional developments were also contributory factors.
The Ten-Year Master Plan Committees, which the Securities and Exchange Commission (SEC) set up to articulate modalities for moving the market forward, presented their interim reports
rdduring the 3 Annual Capital Market Committee Retreat in November 2013. The Committees are:
I. Capital Market Master Plan Committee;
ii. Capital Market Literacy Master Plan Committee; and
iii. Non-interest Capital Market P r o d u c t s M a s t e r P l a n Committee.
The Committees were expected to submit their final reports by March 2014.
2.7.3 The Capital Market
2.7.3.1 The Ten-Year Blueprint Committees
CBN FINANCIAL STABILITY REPORT DECEMBER 2013
2.7.3.2 M i n i m u m C a p i t a l Requirements for Capital Market Operators
2.7.3.3 Financial Markets Dealers Q u o t a t i o n s O v e r- t h e -Counter Plc
In September 2013, the Board of the SEC approved a review of the minimum capital requirements for registered market operators as follows:
I. Brokers/Dealers N300 millionii. Trustees N300 millioniii. Brokers N200 millioniv. Issuing Houses N200 millionv. Underwriters N200 millionvi. Registrars N150 millionvii. Rating Agency N150 millionviii. Fund/Portfolio
Manager N150 millionix. Dealer N100 millionx. Corporate Investment
Adviser N5 millionxi. Individual Investment
Adviser N2 million
The Financial Markets Dealers Quotations Over the Counter (FMDQ-OTC) Plc was inaugurated on November 7, 2013 as a SEC-licensed OTC market securities exchange and self-regulatory organization with a focus on the money market and government securities. The functions of the FMDQ-OTC include market governance, compliance and development, as well as data services to ensure market integrity, liquidity, transparency and reliability. It has also improved quoting on the Nigeria Inter Bank Offered Rate; the Nigeria Inter-Bank Foreign Exchange Fixing; and yields on NTBs, FGN bonds, sub-national and corporate bonds. The FMDQ-OTC publishes these rates on its electronic platform daily.
24

2.7.3.4 The Bond Market
FGN Bonds
Total bonds outstanding at end-December 2013 stood at N5,038.04 billion, of which FGN, sub-national and corporate bonds constituted N4,222.03 billion (83.80%), N597.50 billion (11.86%) and N218.51 billion (4.34%), respectively. This level reflected an increase over end-June 2013 figures of N4,745.90 billion, comprising FGN, sub -national and corporate bonds valued N4,032.90 billion (84.98%), N498.00 billion (10.49%) and N215.00 billion (4.53%), respectively.
Demand for FGN Bonds at the secondary market increased as evidenced by the decline in yields, compared with the position at end-June 2013.This was attributed to the high level of liquidity in the banking system and the establishment of the Financial Markets Dealers Quotations Over-the-Counter Plc. (FMDQ-OTC Plc) platform. The FMDQ-
CBN FINANCIAL STABILITY REPORT DECEMBER 2013
Table 2.3: Matured FGN Bonds, July - Dec 2013
NEW
NOMENCLATURE
INTEREST.
RATE
ISSUE
DATE
ISSUE
AMOUNT (N)
REDEMPTION
DATE
INTEREST PAY
DATES
3.75%+NTB RATE
FGN SEP 2013
3.75% + NTB
RATE
27-10-2003 599,454,000 30-09-2013 31 MAR & 30
SEP.
12.74% FGN OCT
2013
12.74% 27/10/2006
10,000,000,000
27/10/2013 27 APR & 27
OCT
10.98% FGN NOV
2013
10.98% 24/11/2006
10,000,000,000
24/11/2013 24 MAY & 24
NOV
11.99% FGN DEC
2013
11.99% 22/12/2006 10,000,000,000 22/12/2013 22 JUN & 22
DEC.
10.50% FGN NOV
2013
10.50% 28/11/2008 200,000,000,000 28/11/2013 28 MAY & 28
NOV.
OTC Plc platform standardized OTC transactions.
Five (5) bonds matured and were redeemed by the Federal Government during the review period. These were the 3.75%+NTB Rate FGN September 2013, the 12.74% FGN October 2013, the 10.98% FGN November 2013, the 11.99% FGN December 2013 and the 10.50% FGN November 2013 (Table 2.3).
With headline inflation at single digit, FGN bonds remained attractive to investors. The yield curve reflected investors' expectations of future monetary policy tightening. Therefore, they demanded higher compensation on the long-dated assets. Another reason was that investors were swapping long- for short-term assets, thus pushing down long-term asset prices and raising their yield.
25

valued N130.00 billion in the first half of 2013. Total outstanding bonds held by 14 state governments stood at N597.50 billion.
Sub-National BondsTwo state governments issued bonds valued N99.50 billion, compared with three state governments that issued bonds
CBN FINANCIAL STABILITY REPORT DECEMBER 2013
Figure 2.10: Yield Curves for Nigeria
9.00%
10.00%
11.00%
12.00%
13.00%
14.00%
15.00%
0 2 4 6 8 10 12 14 16 18 20
Yie
ld
Time to Maturity
Dec-2013
Dec-2012
Jun-2013
Source: Financial Markets Dealers Quotations
Table 2.4: New Sub-national Bonds Issued During the Review Period
State
Government
Bond Features Value
(N Billion)
Issue Date
Niger 14% Fixed Rate 5-Year Amortiz ing
Bond (Tranche 1)
12.0 Nov-13
Lagos 13.50% Fixed Rate 7-Year Bullet
Payment Bond (Tranche 4)
87.5 Nov-13
Total 99.5
N12.94 billion in the first half of 2013.
Corporate Bonds
Three corporate bonds were issued, valued N10.60 billion, compared with
26

investors invested N203.60 billion in the equities market while total sales amounted to N255.80 billion, compared with N327.66 billion and N254.98 billion invested and sold by foreign investors, respectively, in the first half of 2013. The development reflected a decline in foreign portfolio investments in the review period. As a result of risks posed to the stability of the market by the continued decline in foreign portfolio investment, the Bank will continue to monitor movements in portfolio funds to ensure system stability.
During the review period, NIRSAL Plc accomplished the following:
·Issued four (4) Credit Risk Guarantees (CRGs) valued N3.051 billion to four (4) counterparties, compared with 22 CRGs valued N6.653 billion issued in the first half of 2013;
·Paid the sum of N67.52 million to 18 customers from eleven (11)
2.8 Real Sector Intervention
2.8.1 The Nigerian Incentive-based Risk Sharing System for Agricultural Lending (NIRSAL) Plc.
2.7.3.5 The Equities MarketIn the review period, several initiatives were taken to enhance the performance of the equities market. Specifically, the NSE:
·Launched the electronic issuers portal, called X-Issuer, to enhance efficiency, compliance and integrity in the market;
·Partnered with Standard & Poor's, Dow Jones, and Morgan Stanley Capital International for the generation of key market data;
·Migrated to a new trading platform (X-Gen); and
·Established an OTC market platform in un-listed equities by the National Association of Securities Dealers to standardize operations and promote liquidity, efficiency and reliability in the market.
These initiatives resulted in increased trading activities on the floor of the NSE and led to a significant rise in market indices, as the ASI and MC attained new heights since May 2008. The NSE ASI closed at 39,858.23 at end-December 2013, from 36,164.31 at end-June 2013.
During the review period, foreign
CBN FINANCIAL STABILITY REPORT DECEMBER 2013
Table 2.5: New Corporate Bonds Issued in the Second Half of 2013
Company Description Value (Nbillion)
Issue Date
Lacasera Company
Plc
15.75% Fixed Rate 5 -Year
Amortising Bond
3.0 Oct-13
FSDH SPV Plc
14.25% Fixed Rate 3 -Year
Amortising Bond
5.5 Oct-13
NAHCO
15.25% Fixed Rate 7 -Year
Bullet Payment Bond 2.1 Dec-13
Total 10.6
27
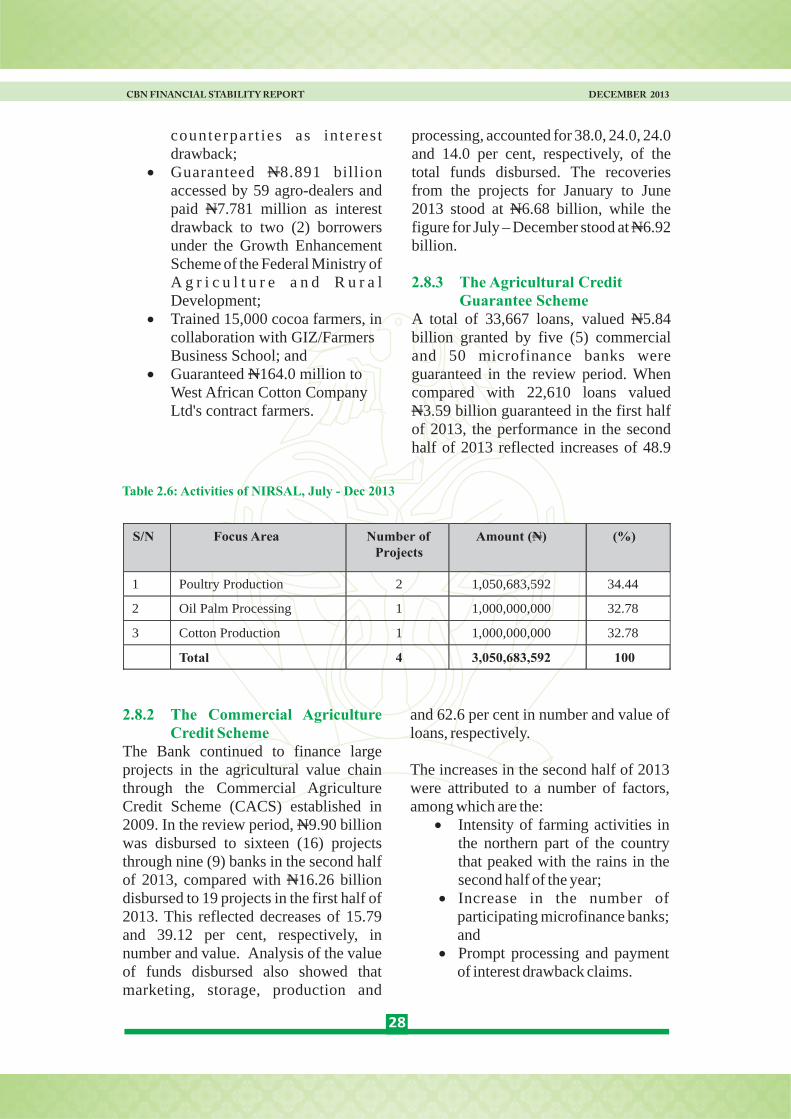
and 62.6 per cent in number and value of loans, respectively.
The increases in the second half of 2013 were attributed to a number of factors, among which are the:
·Intensity of farming activities in the northern part of the country that peaked with the rains in the second half of the year;
·Increase in the number of participating microfinance banks; and
·Prompt processing and payment of interest drawback claims.
2.8.2 The Commercial Agriculture Credit Scheme
The Bank continued to finance large projects in the agricultural value chain through the Commercial Agriculture Credit Scheme (CACS) established in 2009. In the review period, N9.90 billion was disbursed to sixteen (16) projects through nine (9) banks in the second half of 2013, compared with N16.26 billion disbursed to 19 projects in the first half of 2013. This reflected decreases of 15.79 and 39.12 per cent, respectively, in number and value. Analysis of the value of funds disbursed also showed that marketing, storage, production and
CBN FINANCIAL STABILITY REPORT DECEMBER 2013
Table 2.6: Activities of NIRSAL, July - Dec 2013
28
counterpar t ies as interest drawback;
·Guaranteed N8.891 billion accessed by 59 agro-dealers and paid N7.781 million as interest drawback to two (2) borrowers under the Growth Enhancement Scheme of the Federal Ministry of A g r i c u l t u r e a n d R u r a l Development;
·Trained 15,000 cocoa farmers, in collaboration with GIZ/Farmers Business School; and
·Guaranteed N164.0 million to West African Cotton Company Ltd's contract farmers.
processing, accounted for 38.0, 24.0, 24.0 and 14.0 per cent, respectively, of the total funds disbursed. The recoveries from the projects for January to June 2013 stood at N6.68 billion, while the figure for July – December stood at N6.92 billion.
A total of 33,667 loans, valued N5.84 billion granted by five (5) commercial and 50 microfinance banks were guaranteed in the review period. When compared with 22,610 loans valued N3.59 billion guaranteed in the first half of 2013, the performance in the second half of 2013 reflected increases of 48.9
2.8.3 The Agricultural Credit Guarantee Scheme
S/N Focus Area Number of Projects
Amount (N) (%)
1 Poultry Production
2
1,050,683,592 34.44
2 Oil Palm Processing
1
1,000,000,000 32.78
3 Cotton Production 1 1,000,000,000 32.78
Total 4 3,050,683,592 100

power generated increased by 30.85 per cent over the level of 647.6MW generated in 2012.
The Fund was established to fast-track the development of the manufacturing sector of the Nigerian economy by facilitating access to credit by manufacturers, improve the financial position of DMBs, generate employment and increase foreign exchange earnings, among others.
Some of the repayments were ploughed back to finance new SMEs, resulting in the disbursement of N28.98 billion to fund th i r ty two (32) projec ts . Consequently, direct employment created by the benefiting SMEs increased by 22.3 per cent, and turnover increased by 24.9 per cent during the review period.
During the review period, a total of 2,806 participants were trained by the new entrepreneurship development centres located in North-East (Maiduguri), North-Central (Makurdi) and South-South (Calabar). A total of 1,018 start-up businesses were thereby created, while 317 graduates, representing 11.3 per cent of the total trained participants accessed loans valued N22.4 million to start or expand their businesses.
The process of transferring ownership of the first phase EDCs located in Kano (North-West), Lagos (South-West) and Onitsha (South-East) to the host states had commenced, in line with the policy establishing the Scheme.
The level of gross external reserves decreased to US$42.85 billion at end-
2.8.6 The SME Restructuring and Refinancing Fund
2.8.7 Entrepreneurship Development Centres
2.9 The External Sector
2.8.4 The Small and Medium Enterprises Credit Guarantee Scheme
2.8.5 The Power and Aviation Intervention Fund
The Scheme, established to fast track the development of the Nigerian economy by guaranteeing bank credits to small and medium enterprises (SMEs), continued to play a critical role in facilitating funding for start-ups. The number of facilities guaranteed increased by 112.5 per cent to 17, valued N896.78 million, in the second half of 2013, from 8 facilities valued N279.22 million that were guaranteed in the first half of 2013.
The Fund, established to stimulate and sustain investment in the power and aviation sectors of the economy through the provision of long-term credits suitable for infrastructure projects, contributed to enhancing the quality of credits in the banking industry. Other impacts of the Fund included:
·Improvement in the liquidity of banks and the balance sheet positions of the beneficiaries;
·Reduction of the cost of doing business;
·Resuscitation of some non-performing projects; and
·Increase in capacity utilization of benefiting projects.
During the review period, N11.628 billion was disbursed to five (5) power projects, compared with N39.61 billion disbursed to the same number of projects in the first half of 2013. The power projects financed through the scheme had a combined generating capacity of 847.4MW of power, out of which 440.1MW was utilized by the companies to guarantee stable and reliable power for their manufacturing processes. The
CBN FINANCIAL STABILITY REPORT DECEMBER 2013
29

indicated that the CBN, the FGN and the Federation holdings were US$36.94 billion, US$2.62 billion and US$3.29 billion, respectively, at end-December 2013, compared with US$36.68 billion, US$1.30 billion and US$6.98billion, respectively at end-June 2013. Further analysis showed that 83.88 per cent of the reserves was held in US Dollars, 5.90 per cent in Euro, 2.09 per cent in Renminbi, 2.08 per cent in Pound Sterling, and 6.02 per cent in SDR at end-December 2013.
Total foreign exchange inflow during the second half of 2013 was US$21.32 billion, compared with US$19.75 billion recorded in the first half of 2013,
December 2013, from US$44.96 billion at end-June 2013, representing a decline of US$2.11 billion or 4.69 per cent. The decrease in reserves, when compared with the level at the end of first half 2013, reflected an increase in demand and sale to authorized dealers.
A breakdown of the external reserves
CBN FINANCIAL STABILITY REPORT DECEMBER 2013
Figure 2.11: Breakdown of External Reserves
0
5
10
15
20
25
30
35
40
45
50
ExternalReserves
CBN Portion FGN Portion FederationPortion
US$
Bill
ion
Jun-13
Dec-13
2013.Similarly, total outflow rose to US$23.46 billion in the review period, from US$18.86 billion in the first half of 2013, reflecting an increase of US$4.60 billion or 24.39 per cent. Foreign exchange flows in the review period resulted in a net outflow of US$2.14 billion.
At end-December 2013, the country's external reserves could finance about10 months of imports. This was lower than the 11.96 months at end-June 2013, but higher than the minimum international benchmark of 3 months.
In order to manage the decreasing trend in
reflecting an increase of US$1.57 billion or 7.95 per cent. The increase in gross inflows in the review period reflected, largely, the increase in other government revenues, reinforced by the rise in non-oil export proceeds and interest on reserves and investments. The sum of US$0.24 billion was recorded as unrealized exchange rate gain at end-December
30

Operational Guidelines was formally launched in November 2013 at the Takaful Stakeholder Engagement Workshop, held in Lagos.
In July 2013, FBN Life Assurance, in partnership with Airtel Nigeria, introduced a micro insurance scheme, 'Padi4Life'. The scheme is aimed at providing low-income earners living in remote locations a daily insurance cover for permanent disability or death. For a daily premium of N20, the subscriber would be entitled to a N500,000 insurance cover.
In October 2013, MTN Nigeria introduced airtime-based insurance service, in collaboration with Mansard Insurance Plc. This service would enable subscribers on the platform to have access to affordable life protection plan directly from their mobile phones. For a N15 daily premium, the subscriber would receive a N350,000 insurance cover.
The first claim on the MTN Yello Cover was made in December 2013. The settlement came barely two months after the launch of the service.
Overall, the introduction of the new products would increase the patronage of insurance by people in the lower segment of the market to purchase life insurance at low cost, via the use of mobile phone technology.
It is envisaged that there would be increased consolidation of activities among the 50 existing insurance companies as the pressure of competition forces them into mergers. Furthermore,
2.10.1 Airtel Nigeria Life Insurance
2.10.2 MTN Nigeria Life Assurance Service
reserves, a number of measures were taken, including the following:
·The increase in CRR for public sector deposits in order to reduce b a n k s ' c a p a c i t y t o f u n d speculative activities in the foreign exchange market;
·The re-introduction of RDAS in place of WDAS to reduce speculation; and
·Reconciliation of critical inflows into the reserve accounts to ensure that all receivables are tracked.
In addition, the Federal Government continued to encourage the development of local industries that would reduce over-reliance on imports and thus conserve foreign exchange.
In order to promote micro-insurance, the National Insurance Commission issued guidelines on micro-insurance operations in Nigeria in December 2013 and inaugurated the Micro-Insurance Steering Committee.
During the period under review, four insurance companies merged to form a single entity. This is expected to enable the consolidated company benefit from economies of scale and thereby engage in big ticket transactions.
In pursuance of the National Roadmap for the Adoption of IFRS, 43 of the 50 operating insurance companies published IFRS-compliant accounts.
NAICOM facilitated the settlement of 61 disputes on claims between insurance companies and customers, with the settlement claims valued N2.24 billion for 2013.
The Takaful (Shari'a Insurance)
2.10 The Insurance Sector
CBN FINANCIAL STABILITY REPORT DECEMBER 2013
31

premium income for insurance companies and thereby enhance their viability.
the sustained enforcement of compulsory insurances schemes, particularly Group Life and motor, is expected to increase
CBN FINANCIAL STABILITY REPORT DECEMBER 2013
32


December 2013, from 3.7 per cent at end-J u n e 2 0 1 3 ( F i g u r e 3 . 1 ) . T h e improvement in asset quality was attributed to stricter adherence to credit risk management policies and standards by banks. The ratio of core liquid assets to total assets increased by 1.2 percentage points to 22.2 per cent at end-December 2013, from 21.0 per cent at end-June 2013. Similarly, the ratio of liquid assets to short-term liabilities improved by 0.9 percentage point to 25.2 per cent at end-June 2013 (Figure 3.2).
3.1 Macro-Prudential Supervision
3.1.1 Financial Soundness Indicators
3.1.1.1 Asset and Liquidity- based Indicators
The quality of assets of the banking industry improved slightly in the second half of 2013, compared with the first half. The ratio of non-performing loans (NPLs) to total loans dropped by 0.5 percentage point to 3.2 per cent at end-
CBN FINANCIAL STABILITY REPORT DECEMBER 2013
Figure 3.1: Banking Industry NPLs to Total Gross Loans
3.5
3.7
3.2
2.9
3
3.1
3.2
3.3
3.4
3.5
3.6
3.7
3.8
End-Dec 2012 End-June 2013 End-Dec 2013
Perc
enta
ge
33
Figure 3.2: Banking Industry Liquidity Indicators
0
5
10
15
20
25
30
35
End-Dec 2012 End-June 2013 End-Dec 2013
Liquid assets (core) to total assets Liquid assets (core) to short-term liabilities

2013 was 1.4 and 0.9 percentage points below the levels at end-June 2013 and end-December 2012, respectively (Figure 3.3).The industry ratio of non-performing loans (net of provisions) to capital remained stable at 7.4 per cent at end-December 2013. On the whole, the
3.1.1.2 Capital-based IndicatorsThe average ratio of regulatory capital to risk weighted assets stood at 17.2 per cent at end-December 2013, showing a decrease of 1.7 and 1.1 percentage points, respectively, below the levels at end-June 2013 and end-December 2012. Similarly, the ratio of Tier 1 capital to risk weighted assets of 17.1 per cent at end-December
CBN FINANCIAL STABILITY REPORT DECEMBER 2013
Figure 3.3: Banking Industry Capital Adequacy Indicators
16
16.4
16.8
17.2
17.6
18
18.4
18.8
19.2
End Dec-2012 End-June 2013 End-Dec 2013
Regulatory capital to risk-weighted assets Tier 1 capital to risk-weighted assets
34
expenses to gross income rose by 5.9 percentage points to 68.9 per cent at end-December 2013. Conversely, the ratio of personnel expenses to non-interest expenses fell by 3.2 percentage points to 36.5 per cent, from 39.7 per cent at end-June 2013 (Table 3.1).
above scenario reflected a strong capital base for Nigerian banks (Table 3.1).
The ratio of interest margin to gross income increased to 64.9 per cent in the review period, from 63.9 per cent at end-June 2013. The ratio of non-interest
3.1.1.3 Income and Expense-based Indicators
Table 3.1: Selected Financial Soundness Indicators of the Nigerian Banking Industry
2009 2010 2011 2012 2013
(1) (2) (3) (4) (5) (6) (7) (8) (9) (10)
End
June
End
Dec
End
June
End
Dec
End
June
End
Dec
End
June
End
Dec
End
June
End
Dec
1. Asset-based Indicators
NPL to total gross loans 8.5
27.6
28.8
15.7
10.8
5.3
4.3
3.5 3.7 3.2
Liquid assets (core) to total
assets
15.6
16.5
17.2
17.2
22.6
25.7
23.5
24.7 21.0 22.2
Liquid assets (core) to short-
term liabilities
21.5
22.3
19.4
19.8
25.7
31.3
28.1
28.9 24.3 25.2
Return on Assets (ROA) 1.7
-8.9
1.0
3.9
0.9
0.1
1.5
1.2 1.4 0.8

CBN FINANCIAL STABILITY REPORT DECEMBER 2013
2. Capital-based Indicators
Regulatory capital to risk-
weighted assets
22.4 4.1 1.5 1.8 4.2 17.9 17.7 18.3 18.9 17.2
Tier 1 capital to risk-weighted
assets
21.9 4.9 2.4 2.2 4.5 18.1 17.8 18.0 18.5 17.1
NPLs net of provision to capital
12.5
106.8
289.8
192.7
74.3
10.1
6.8
6.1 7.4 7.4
Return on equity (ROE) 8.9
-222.8
50.2
265.2
29.4
0.5
13.1
11.2 12.4 7.7
3. Income and Expense-
based Indicators
Interest margin to gross income 60.1 57.8 54.0 53.7 50.8 45.2 64.6 64.3 63.9 64.9
Non-interest expenses to gross
income
64.5 81.2 80.5 66.9 72.9 75.4 64.8 64.9 63.0 68.9
Personnel expenses to gross
income
46.7 47.6 45.5 42.8 44.6 36.1 43.6 43.9 39.7 36.5
cumulative 30-day shocks, with specific assumptions on fire sale of assets.
The test assumed a gradual average outflow of 3.8, 5.0 and 1.5 per cent of total deposits, short-term and long-term funding, respectively, over a 5-day (Test 1.1) and a cumulative average outflow of 22.0, 11.0 and 1.5 per cent of total deposits, short-term and long-term funding, respectively, on a 30-day balance (Test 1.2). The test further assumed that a percentage of the assets would remain unencumbered on a fire sale (Table 3.2).
3.1.2 Banking Industry Stress Tests
3.1.2.1 Liquidity Stress TestThe liquidity stress test was conducted at end-December 2013 to assess the resilience of the banking industry to liquidity and funding shocks, using the Implied Cash Flow Analysis (ICFA) and Maturity Mismatch/Rollover Risk approaches.
The ICFA test assessed the ability of the b a n k i n g s y s t e m t o w i t h s t a n d unanticipated substantial withdrawal of deposits, as well as short-term wholesale and long-term funding over 5-day and
Table 3.2: Assets Un-encumbered
35
Item
No
Assets %
Unencumbered
1 Cash and cash equivalent 100
2 Current account with CBN 100
3 CRR 30
4 Government Bonds & Treasury Bills
and other assets with 0% risk-
weighting exposure
66.5
5
Other Short - term investments 49
6
Certificates of deposits held 66.5

total deposits would be available from the CBN and intra-group funding; and
iii. Test 2c: Dynamic Rollover Risk: the assumption was as in 2b above, but with the option of closing the liquidity gap from other buckets.
The test revealed that, after the 5-day and cumulative 30-day shocks were applied, the industry liquidity ratio (LR) declined to 12.2 and 10.4 per cent, respectively, from 50.53 per cent (Table 3.3). Most banks' LRs were also below the 30.0 per cent threshold after the two scenarios. Furthermore, three (3) banks recorded a negative LR, following a cumulative 30-day shock. Two of these banks were
6among the categorised “large banks” .
Analysis of Test Results
The Maturity Mismatch/Rollover Risk approach assessed funding maturity mismatch and rollover risk for assets and liabilities in the 0-30 and 31-90 day buckets, with the assumption on the availability of funding from CBN and intra-group sources as described below:
i. Test 2a: Descriptive Maturity Mismatch assumed that the baseline mismatch remained, but 5 per cent of total deposits would be made available from the CBN and intra-group funding;
ii. Test 2b: Static Rollover Risk assumed that 80.0 and 72.0 percent of the funding in the 0-30 and 31-90 day buckets would be rolled over with no possibility to close the funding gap from other buckets. However, it is assumed that 5 per cent of
CBN FINANCIAL STABILITY REPORT DECEMBER 2013
6Banks with assets over N1 trillion
36
Total
Number of
Banks tested
Number of
Banks with <
30% liquidity
ratio
Dec 2013
23 Dec 2013 (23
DMBs)
Sept
2013 (23
DMBs)
June 2013
(23 DMBs)
Mar 2013
(20 DMBs)
System
LR
Liquidity Shortfall to make 30% LR (N’billion)
Test 1.1:
Implied Cash
Flow Test ( 5
Days)
Day 1 7 12
9
4
34.1% NIL
Day 2 10 13
11
9
29.4% 168.78
Day 3 14 17
12
11
24.2% 716.94
Day 4 16 17
14
14
18.5% 1,240.33
Day 5 17 17 16 15 12.2% 1,740.82
Test 1.2:
Implied Cash
Flow Test (30
Days)
17 18 18 17 10.4% 1,873.30
Table 3.3: Implied Cash Flow Analysis

CBN FINANCIAL STABILITY REPORT DECEMBER 2013
160B
an
k 1
Ba
nk
2
Ba
nk
3
Ba
nk
4
Ba
nk
5
Ba
nk
6
Ba
nk
7
Ba
nk
8
Ba
nk
9
Ba
nk
10
Ba
nk
11
Ba
nk
12
Ba
nk
13
Ba
nk
14
Ba
nk
15
Ba
nk
16
Ba
nk
17
Ba
nk
18
Ba
nk
19
Ba
nk
20
Ba
nk
21
Ba
nk
22
Ind
ust
ry
Mar-13
Jun-13
Sep-13
Dec-13
0
20
40
60
80
100
120
140
Pe
r ce
nt
Figure 3.4: Industry and Individual Bank Pre-Shock Liquidity Ratio Positions
37
Figure 3.5: Industry Position after 1-5 day and Cumulative 30- day Shocks
-5
5
15
25
35
45
55
65
75
Pre-Shock After Day 1 After Day 2 After Day 3 After Day 4 After Day 5 After cum30 days
Pe
r ce
nt
Mar-13 Jun-13 Sep-13 Dec-13

Tests (Test 2c) (Figure 3.7).
In general, the banking industry was resilient to liquidity stress, although the test results indicated a deterioration in the banks' resilience, compared with the position in the preceding period.
Under the maturity mismatch/rollover test, assets in the 0-30 day bucket were adequately funded under the three scenarios used for the test. However, there was deterioration in the 31-90 day bucket under the Static Rollover Analysis (Test 2b) and the Dynamic Risk Rollover
CBN FINANCIAL STABILITY REPORT DECEMBER 2013
Figure 3.6: Individual Bank Positions after 5-day and Cumulative 30-day Shocks
-20.00
-10.00
0.00
10.00
20.00
30.00
40.00
50.00
60.00
70.00
80.00
90.00
100.00
110.00
120.00
130.00
140.00
150.00
Pe
rce
nt
Day 5 Day 30 Pre-shock
N.B: Bank 23 was excluded from figure 3.6 because of its outlier effect
Less than30 days
(N'billion)
31-90 days
(N'billion)
90 -180days
(N'billion)
180360days
(N'billion)
1-3 years
(N'billion)
above 3years
(N'billion)
Pre-shock 7,557 -134.61 -507.22 -780.01 1,789 3,803
Test 2a 9281.38 1,653.62 1267.62 989.81 -5.7 -2,026.93
Test 2b 6,768.55 -800.84 -656.57 -957.27 -2,020.21 -3,790.64
Test 2c 56.51 -87.31 -45.87 -137.94 -267.3 -1153.69
-4,000
-2,000
0
2,000
4,000
6,000
8,000
Figure 3.7: Roll-over Risk, Pre- and Post-shock
38

multiple financial institutions on the entire banking system arising from exposures across institutions.
The analysis revealed that contagion risk through interbank exposures in the banking sector was minimal, as all the placing banks met the minimum CAR. Also, the industry position was above the minimum required CAR.
A solvency stress test was conducted on 3.1.2.3 Solvency Stress Test
3.1.2.2 Contagion Risk Analysis through Inter Bank Exposures
The contagion risk analysis assessed the effect of the financial interconnectedness of institutions in transmitting shocks to individual banks and the banking system as a whole. The test was conducted using a network analysis tool which evaluates sets of bilateral links among different financial institutions. It assessed the impact of a failure or a weakness of
CBN FINANCIAL STABILITY REPORT DECEMBER 2013
Figure 3.8: Total Bilateral Exposure
Bank 10Bank 4
Bank EBank F
Bank D DH 2
Bank 4
0.5 percentage points over the end-June 2013 positions. Similarly, the pre-shock liquidity ratios for the banking industry, large and medium banks declined by 18.68, 19.47 and 13.15 percentage points to 51.02, 50.75 and 62.30 per cent, respectively compared with the end-June 2013 positions. However, the pre-shock liquidity ratio for small banks increased by 5.96 percentage points (Table 3.4).
the banking industry as at December 31, 2013 to assess the stability of the sector under various hypothetically strained macroeconomic conditions.
The pre-shock CARs for the entire banking industry, large, medium and small banks stood at 17.20, 16.24, 18.05 and 18.33 per cent, respectively. These reflected decreases of 1.49, 2.62, 0.2 and
Baseline Position
39
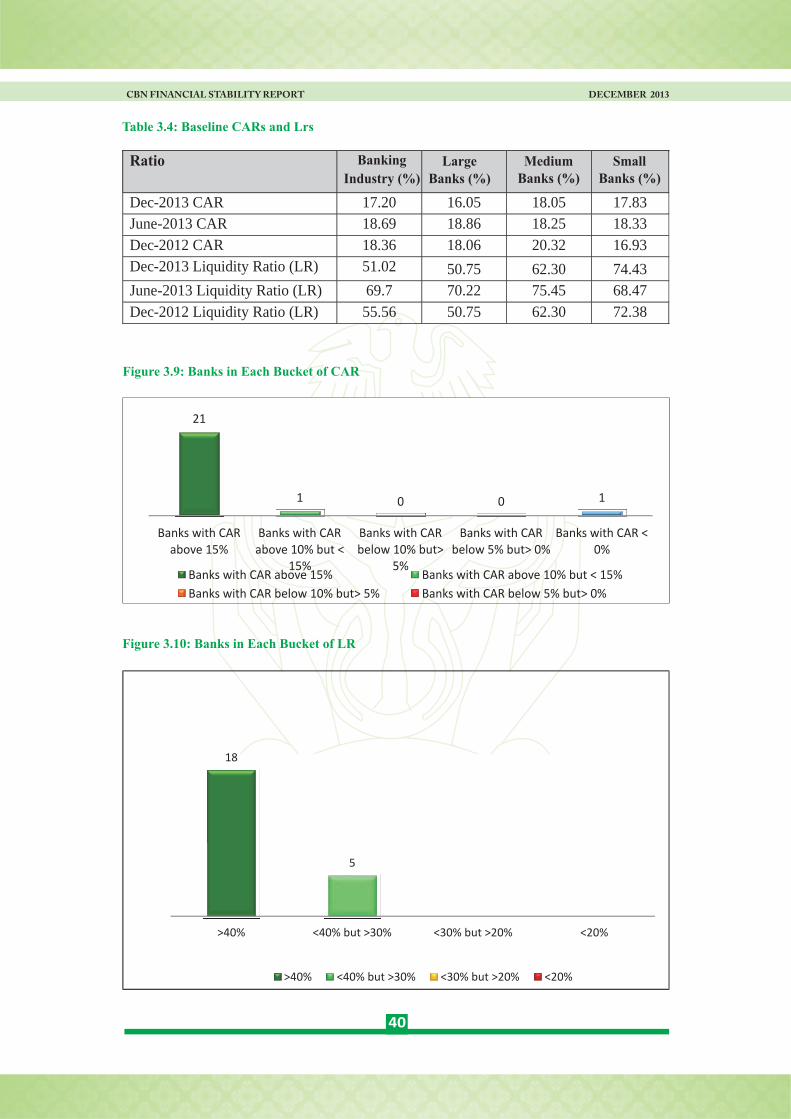
CBN FINANCIAL STABILITY REPORT DECEMBER 2013
Table 3.4: Baseline CARs and Lrs
Ratio Banking
Industry (%)
Large
Banks (%)
Medium
Banks (%)
Small
Banks (%)
Dec-2013 CAR 17.20
16.05
18.05 17.83
June-2013 CAR
18.69
18.86
18.25 18.33
Dec-2012 CAR 18.36
18.06
20.32 16.93
Dec-2013 Liquidity Ratio (LR)
51.02
50.75
62.30 74.43
June-2013 Liquidity Ratio (LR)
69.7
70.22
75.45 68.47
Dec-2012 Liquidity Ratio (LR) 55.56 50.75 62.30 72.38
Figure 3.9: Banks in Each Bucket of CAR
21
1
0
0
1
Banks with CARabove 15%
Banks with CARabove 10% but <
15%
Banks with CARbelow 10% but>
5%
Banks with CARbelow 5% but> 0%
Banks with CAR <0%
Banks with CAR above 15% Banks with CAR above 10% but < 15%
Banks with CAR below 10% but> 5% Banks with CAR below 5% but> 0%
Figure 3.10: Banks in Each Bucket of LR
18
5
>40% <40% but >30% <30% but >20% <20%
>40% <40% but >30% <30% but >20% <20%
40

banks being the most profitable, while ROEs stood at 19.83, 22.14, 20.40 and 17.56 per cent, respectively.
·Credit RiskGenerally, the banking industry resilience to credit risk sustained an upward trend as the average industry
Analysis of Test Results
The pre-shock ROAs for the entire banking industry, large, medium and small banks were 2.31, 3.04, 2.42 and 2.02 per cent, respectively, with large
CBN FINANCIAL STABILITY REPORT DECEMBER 2013
Figure 3.11: Banks in Each Bucket of LR
Figure 3.12: Baseline ROAs and ROEs (%)
2.31 1.8
19.83
12.8
3.04 2.0
22.14
13.1
2.421.2
20.4
11.0
2.02 1.5
17.56
13.7
Dec-2013 ROA June-2013 ROA Dec-2013 ROE June-2013 ROE
Banking Industry Large Banks Medium Banks Small Banks
general credit risks as their average CARs fell from 17.64 per cent to 12.21 per cent and 17.03 to 11.45 per cent, respectively. However, the average CAR for the small banks deteriorated to 5.56 per cent (below the required minimum of 10.0 per cent), from 18.33 per cent. This indicated that about N89.15 billion would be required to raise their CAR to 10.0 per
CAR stood at 12.42 per cent under a shock scenario of 200 per cent rise in NPLs. Also, large banks and medium-sized banks were less vulnerable to
41
Dec-2013 CAR June-2013 CAR Dec-2013 Liquidty Ratio June-2013 Liquidty Ratio
Banking Industry Large Banks Medium Banks Small Banks
17.2 16.05 18.05 17.83 18.69 18.86 18.25 18.33
51.02 50.75
62.3
74.4369.7 70.22
75.45
68.47

the CARs of the entire banking industry, large, medium and small banks declined from their baseline positions to 9.91, 7.22, 4.19 and 9.02 per cent, respectively. Under this scenario, only five banks would be able to maintain CARs equal to or above 10.0 per cent, while the remaining 18 would record less than 10.0 per cent CAR.
cent. Under this scenario, 15 banks maintained CARs above 10.0 per cent, 5 banks had CARs between 5.0 and 10.0 per cent and 3 banks had less than 5 per cent CARs (Table 3.5).
The banking industry and peered banks, however, showed significant levels of credit concentration as indicated by the extent of capital depletion under the various shock scenarios. On the assumption that the credit facilities of the five (5) biggest corporate obligors deteriorated from “doubtful” to “lost”,
CBN FINANCIAL STABILITY REPORT DECEMBER 2013
Table 3.5: Stress Test Results – Credit Risk
Number of banks
Scenarios≤0%
>0 but ≤5
>5 but ≤10
>10 but
≤15 >15 Total
Shock 1av-50% NPLs increase 1
2
2 5 13 23
Shock 1avi-100% NPLs increase 2 1 2 10 8 23
Shock 1avii-200% NPLs increase 2 1 5 7 8 23
42
Figure 3.13: Credit Concentration Risk
17.12
9.91
17.64
7.22
17.03
4.19
18.16
9.02
Baseline Five biggest corporate obligor credit facilities shiftedfrom 'Doubtful' to 'Lost' (100%)
All banks Large banks Medium-sized banks Small banks

showed more resilience as their liquidity ratios were 36.00 and 42.12 per cent, from 62.30 and 74.43 per cent, respectively. All the peered groups of banks remained above the 30 per cent benchmark. Thus, the banking industry and the three groups of peered banks were resilient to the liquidity shock at the level indicated.
·Liquidity RiskLiquidity risk was moderate as the impact of a 10 per cent general run on the banking industry resulted in the average liquidity ratio falling to 31.24 per cent (above the threshold of 30 per cent) from 51.02 per cent. Large banks followed the same trajectory as their liquidity ratio deteriorated to 30.07 per cent from 50.75 per cent. The medium and small banks
CBN FINANCIAL STABILITY REPORT DECEMBER 2013
Table 3.6: Credit Concentration Risk
CREDIT CONCENTRATION RISK
All Banks Large Banks Medium Small
Baseline 17.20 16.05 18.05 17.83
Single Factor Credit
Concentration Shocks
Solvency Ratios after Shocks
All Banks Large Banks Medium Small
2bi - Five biggest corporate obligors credit facilities shifted from ‘pass-through’to ‘sub-standard’(10%)
16.73 16.89 16.22 17.53
2bii- Five biggest corporate
obligor credit facilitie s shifted
from ‘sub-standard’ to
‘doubtful’ (50%)
14.03 11.85 10.27 12.56
2biii - Five biggest corporate
obligor credit facilities shifted
from ‘doubtful’ to ‘lost’ (100%)
9.91 7.22 4.19 9.02
Table 3.7: Stress Test Results - Liquidity Risk
43
Banking
Industry (%)
Banks by Category
Large (%)
Medium (%) Small (%)
Baseline
51.02
50.75
62.30 74. 43
Shock 6gi ( 10% General Run)
31.24
30.07
36.00 42.12
Shock 6gii ( 15% General Run)
27.21
22.17
31.77 41.61
Shock 6giii ( 20% General Run)
21.10
17.13
22.42 37.35
Shock 6hi (20% Run on 20 largest Deposits)
38.42
36.99
43.45 48.52
Shock 6hii ( 50% Run on 20 largest
Deposits)
33.47
34.52
44.97 47.00
Unsatisfactory
<30
Border Line ≥30 < 35
Sound Position ≥35<60
Very Sound Position ≥60
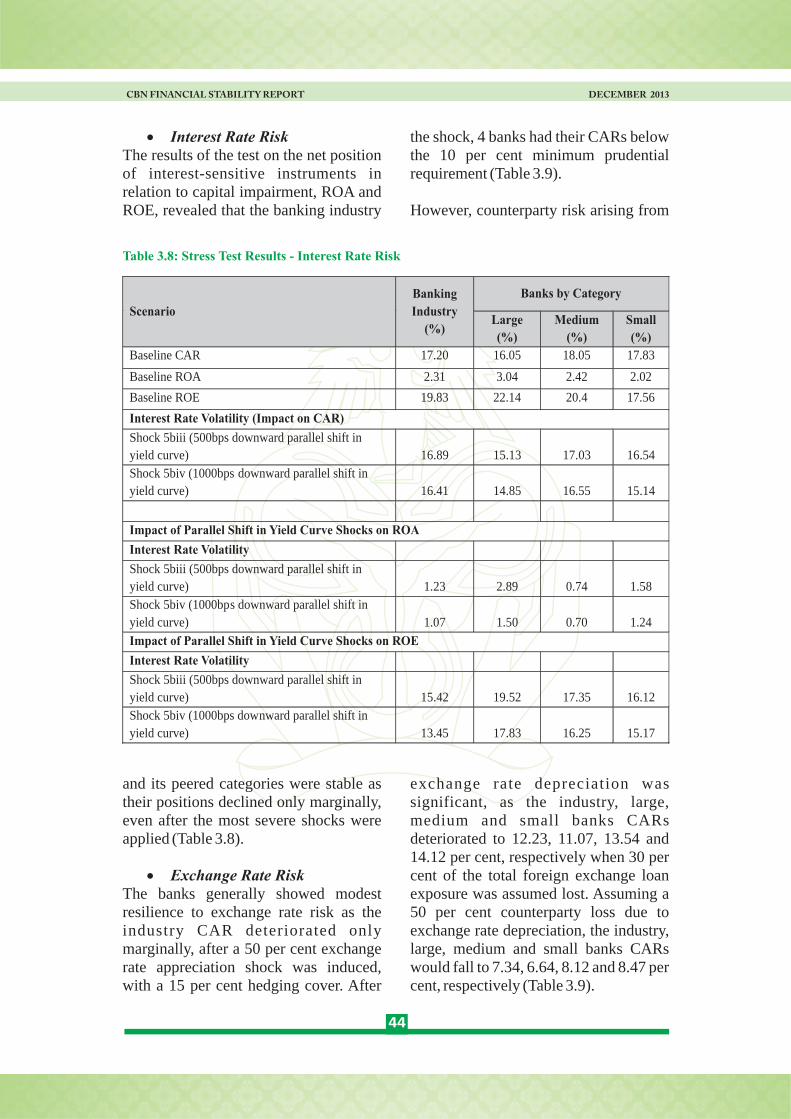
and its peered categories were stable as their positions declined only marginally, even after the most severe shocks were applied (Table 3.8).
·Exchange Rate RiskThe banks generally showed modest resilience to exchange rate risk as the industry CAR deteriorated only marginally, after a 50 per cent exchange rate appreciation shock was induced, with a 15 per cent hedging cover. After
·Interest Rate RiskThe results of the test on the net position of interest-sensitive instruments in relation to capital impairment, ROA and ROE, revealed that the banking industry
CBN FINANCIAL STABILITY REPORT DECEMBER 2013
Table 3.8: Stress Test Results - Interest Rate Risk
Scenario
Banking
Industry
(%)
Banks by Category
Large
(%)
Medium
(%)
Small
(%)
Baseline CAR 17.20 16.05 18.05 17.83
Baseline ROA 2.31 3.04 2.42 2.02
Baseline ROE 19.83 22.14 20.4 17.56
Interest Rate Volatility (Impact on CAR)
Shock 5biii (500bps downward parallel shift in
yield curve) 16.89
15.13 17.03 16.54
Shock 5biv (1000bps downward parallel shift in
yield curve) 16.41
14.85 16.55 15.14
Impact of Parallel Shift in Yield Curve Shocks on ROA
Interest Rate Volatility
Shock 5biii (500bps downward parallel shift in
yield curve) 1.23
2.89 0.74 1.58
Shock 5biv (1000bps downward parallel shift in
yield curve) 1.07 1.50 0.70 1.24
Impact of Parallel Shift in Yield Curve Shocks on ROE
Interest Rate Volatility
Shock 5biii (500bps downward parallel shift in
yield curve) 15.42 19.52 17.35 16.12
Shock 5biv (1000bps downward parallel shift in
yield curve) 13.45 17.83 16.25 15.17
exchange rate depreciation was significant, as the industry, large, medium and small banks CARs deteriorated to 12.23, 11.07, 13.54 and 14.12 per cent, respectively when 30 per cent of the total foreign exchange loan exposure was assumed lost. Assuming a 50 per cent counterparty loss due to exchange rate depreciation, the industry, large, medium and small banks CARs would fall to 7.34, 6.64, 8.12 and 8.47 per cent, respectively (Table 3.9).
the shock, 4 banks had their CARs below the 10 per cent minimum prudential requirement (Table 3.9).
However, counterparty risk arising from
44

and ROE changed marginally after a 100 per cent decline in FX trading income was assumed. This was largely due to the small proportion of FX trading income to gross income.
·Foreign Exchange Trading Risk
The results of the test showed that the banking industry was resilient to FX trading risk. The banks' pre-shock ROA
CBN FINANCIAL STABILITY REPORT DECEMBER 2013
Table 3.9: Stress Test Result - Exchange Rate Risk
Exchange Rate Shocks Banking
IndustryBanks by Category
Large Medium Small
CAR - Pre-shock position 17.20 17.64 17.03 18.16
Shock 4bi (10% appreciation in
favour of the Naira)17.14 17.20 16.93 17.12
Shock 4bii (20% appreciation in
favour of the Naira)15.59
15.53
15.61 15.90
Shock 4biii (50% appreciation in
favour of the Naira)14.13
12.24
14.36 12.91
Shock 4biv (100% appreciation in
favour of the Naira)3.21
2.22
5.08 6.20
Counterparty Risk Due to Exchange Rate Depreciation
20% of the total foreign exchange
loans exposure are categorised as loss
14.23 13.07 15.34 15.79
30% of the total foreign exchange
loans exposure are categorised as loss
12.23 11.07 13.54 14.12
50% of the total foreign exchange loans exposure are categorised asloss
7.34 6.64 8.12 8.47
Table 3.10: Stress Test Result - FX Trading Risk
45
Number of Banks with ROAs
and ROEs in the Respective
Buckets
≤0% >0 ≤5% >5 ≤10% >10 ≤15% >15%
Impact of FX Trading
Shocks on ROA
FX Trading Income Volatility
Banks
Shock 7ai (10% decline in FX
trading Income) 0
0
4
3 16 23
Shock 7aii (20% decline in FX
trading Income) 1
0
4
3 15 23
Shock 7aiii (50% decline in FX
trading Income) 1 0 6 2 14 23
Shock 7aiv (100% decline in
FX trading Income) 3 0 8 2 10 23

CBN FINANCIAL STABILITY REPORT DECEMBER 2013
The key challenges in the banking industry remained weak corporate governance and inadequate risk management practices, while the rating of the control functions generally trended towards 'needs improvement' due to the non-implementation of some previous recommendations. Improvements were, however, noted in the internal audit and financial analysis functions of most banks.
Risk-based examination of some specialized financial institutions, including the Asset Management Corporation of Nigeria (AMCON), the three private credit bureaux, and the non-interest banks (including the non-interest banking windows of conventional banks) was also conducted in the review period.
As part of its monitoring activities in the foreign exchange market, the CBN examined banks to ascertain their compliance with regulations and extant laws on utilisation of foreign exchange. The major infractions observed included failure to issue certificates of capital importation to beneficiaries on time, rendition of inaccurate returns to regulators, and non-compliance with approved net open position limits. The erring banks were appropriately penalised.
On the whole, the banking industry was adjudged as being stable and resilient to most of the shocks, even with severe shock scenarios.
The Bank conducted risk-based examination jointly with NDIC on 21 DMBs in the second half of 2013. The examination covered the assessment of risk assets and tested compliance with prudential requirements and the quality of the risk management control functions. Of the 21 banks examined, two were maiden examinations of the recently licensed merchant banks.
Most banks' composite risk rating had a stable outlook; while one (1) bank had an increasing and two (2) others had a decreasing risk outlook. Four of the banks were examined under the risk-based supervision framework for the first time.
The relatively stable risk profile of banks, coupled with the measures taken by the CBN and AMCON to support the industry, resulted in the general stability experienced by the banking industry as the industry witnessed signs of recovery and profitability.
3.2 Supervision of Banks and Other Financial Institutions
3.2.1 Banks and Discount Houses
3.2.1.1 Banks
46
Impact of FX Trading Shocks on ROE <0% <1% <2% <5% >5%
Initial ROE
FX Trading Income Volatility Banks
Shock 7ai (10% decline in FX trading
Income) 1
2 18 2 0 23
Shock 7aii (20% decline in FX trading
Income) 1 2 17 3 0 23
Shock 7aiii (50% decline in FX trading
Income) 2 3 16 2 0 23
Shock 7aiv (100% decline in FX trading
Income) 5 2 15 1 0 23
with a view to enhancing stability in the sub-sector.
To give greater attention to the s u p e r v i s i o n o f M F B s a n d i n consideration of their large number, the bank engaged 116 consultants to carry out post-examination monitoring. The first round of the post-examination monitoring, involving 580 MFBs, took place in December 2013, the outcome of which is expected to inform appropriate supervisory action early in 2014.
The examinations conducted in the second half brought the total number of MFBs examined in 2013 to 810. The CBN will continue to ensure effective supervision of the institutions with a view to enhancing stability in the sub-sector.
The examinations conducted in the second half brought the total number of MFBs examined in 2013 to 810. The CBN will continue to ensure effective supervision of the in institutions with a view to enhancing stability in the sub-sector.
On-site examination of the 82 licensed PMBs was undertaken in the period. The examination revealed that the average NPL ratio was 42.0 per cent, with 23 meeting the 30 per cent benchmark. The examination further revealed the lack of focus on core mortgage banking business by most operators as only 26 PMBs met the minimum mortgage assets to loanable funds ratio of 60 per cent, while 3 met the minimum mortgage assets to total assets ratio of 50 per cent. The examination also showed that a considerable proportion of the sub-sector's investible funds were placed with commercial banks.
3.2.2.2 Primary Mortgage Banks (PMBs)
3.2.1.2 Discount Houses
3.2.2 Other Financial Institutions
3.2.2.1 Microfinance Banks
The license of one discount house was revoked as a result of its failure to meet maturing obligations, severe under-capitalization and inability of the shareholders to inject additional capital. A liquidator was subsequently appointed.
In Sep tember 2013 , a spec ia l examination conducted on another discount house showed signs of distress. The investigation revealed that the company's capital had been significantly eroded, thus requiring a fresh capital injection for it to continue as a going concern. In the overarching interest of financial system stability, the CBN took over the company's management and AMCON acquired its shares and injected additional funds to recapitalize it.
Of the 821 MFBs in existence as at December 31, 2013, on-site examination was conducted on 797 MFBs in 2013, while 24 MFBs were not examined. The 24 MFBs that were not examined comprised 18 newly licensed MFBs that had not operated for up to 6 six months as at December 31, 2013 and 6 MFBs located in volatile parts of the North-east geo-political zone. Analysis of the on-site examination revealed that 526 MFBs or 66 per cent of the 797 MFBs met the capital adequacy ratio (CAR) of 10 per cent. Furthermore, 568 MFBs or 71.27 per cent satisfied the minimum liquidity ratio requirement of 20 per cent. The asset quality of the MFBs was, however, relatively poor as the average portfolio-at-risk (PAR) ratio for the sub-sector was 45.70 per cent, much higher than the prescribed maximum ratio of five (5) per cent. The CBN will continue to ensure effective supervision of the institutions
CBN FINANCIAL STABILITY REPORT DECEMBER 2013
47

3.3 Compliance with International
Standards
3.3.1 Anti-Money Laundering/Combating the Financing of Terrorism
In supporting the global fight against terrorism, the CBN regularly circulated the United Nations Consolidated Lists of Persons/Entities Involved in Terrorism Financing or Terrorist Activities to financial institutions under its regulatory purview for appropriate action.
In order to strengthen domestic collaboration, the CBN inaugurated the AML/CFT Stakeholders' Consultative Forum for key stakeholders in the fight against money laundering and financing of terrorism. This resulted in an increased level of co-operation through the exchange of information, joint examinations, and training programmes.
Nigeria had been placed on the Financial Action Task Force (FATF) “grey list” of countries which had failed to make significant progress in their AML/CFT regimes in 2009. To address this problem, the CBN and other stakeholders took action based on the reports of the GIABA Mutual Evaluation and International Monetary Fund Technical Assistance Team to improve legislation and enforcement of the regulations on AML/CFT.The CBN action included the issuance of:·AML/CFT Regulations in 2013
(amended);·An AML/CFT Risk-based
Supervision (RBS) Framework;·An AML/CFT Compliance
Framework applicable to the Bank's operations;
·A Dud Cheques Policy;·Standard account opening forms
for financial institutions, in
3.2.2.3 Finance Companies (FCs)
3.2.2.4 Bureaux de Change
On-site examination was conducted on 55 out of the 61 operating finance companies during the review period. Six of the companies were undergoing restructuring. The examination revealed that 40 per cent of the FCs met the capital adequacy ratio (CAR) of 12.5 per cent. The average CAR for the sub- sector was, however, a negative 442 per cent. Overall, 40 per cent of the FCs had shareholders' fund unimpaired by losses of above N20 million. Thirty nine of the FCs were operating with a lower capital than the regulatory minimum of N20 million. Poor asset quality remained the bane of the sub-sector, as the NPL ratio stood at 40.7 per cent, well above the prescribed maximum of 20 per cent. As part of the reform measures adopted by the Bank, the minimum capital was raised to N100 million, from N20 million, during the review period while the final approval of the operating guidelines for the sub- sector was being awaited.
Spot checks were carried out on 160 bureaux de change (BDCs) during the review period, compared with the checks on 60 undertaken in the first half of 2013, thus bringing the total number of reviewed BDCs in 2013 to 220. The exercise indicated that certain infractions persisted amongst the institutions, including: non-rendition of returns on the purchase and utilization of foreign exchange (Forex); failure to keep accounting records; and engaging in wholesale foreign exchange trading. Accordingly, 29 BDCs were suspended from the CBN Forex window, 58 were subjected to monetary sanctions, while the licenses of 20 BDCs were revoked. This brought the total number of revoked BDC licenses in 2013 to 222.
CBN FINANCIAL STABILITY REPORT DECEMBER 2013
48

·Comply with the Pillar 3 disclosure requirements on a bi-annual basis.
The implementation of Basel II/III in Nigeria is expected to enhance the safety and soundness of financial institutions and promote broad stability of the financial system.
One of the identified risks in the banking system is concentration risk. To mitigate this risk and to p r o v i d e i n c e n t i v e s f o r d ive r s i f i ca t ion , the CBN reviewed the risk weights for the computation of capital adequacy ratio. The review provided that:
·Where the exposure to a particular sector, as defined by the International Standard Industrial Classification of Economic Sectors is in excess of 20 per cent of the total credit facilities of a bank, the risk weight of the entire portfolio shall be 150 per cent;
·Bonds that meet the eligibility criteria set out in the Guidelines for Granting Liquid Asset Status for State Government Bonds would be risk-weighted at 20 per cent, while others would be weighted at 100 per cent;
·Any breach of the single obligor limit shall be regarded as impairment of capital;
·Lending by a bank to its financial holding company would be regarded as return of capital and shall, accordingly, be deducted from the capital of the bank in the course of computing its capital adequacy ratio; and
·Lending to subsidiaries within the group shall be risk-weighted at 100 per cent, provided they are fully collateralised. Otherwise,
Review of Risk Weights on Certain Industry Exposures
collaboration with the Committee of Chief Compliance Officers of Banks in Nigeria; and
·A Safe Custody Items Policy.
These measures led to the delisting of Nigeria from the “grey list” by the Financial Action Task Force on October 18, 2013.
For effective implementation of the Basel II/III framework in Nigeria, the Bank issued the Guidance Notes on the Calculation of Regulatory Capital to the banking industry in the reporting period.
The Guidance Notes took cognisance of the peculiarities of Nigeria's local environment and, therefore, required banks to:
·Commence a parallel run of capital adequacy computation, based on the requirements of the new guidelines alongside Basel I requirements, effective January 1, 2014 and migrate fully to Basel II by June 2014;
·Adopt basic approaches for calculating credit, market and ope ra t i ona l r i sk s cap i t a l requirements for the first two years, in anticipation of the development of an effective rating system in Nigeria. This would also afford banks sufficient time to gather the required data and acquire necessary experience for the adoption of the more advanced approaches;
·Carry out an Internal Capital Adequacy Assessment Process (ICAAP) on an annual basis, as at December 31, and forward copies of the assessment report to the CBN for review, not later than four (4) months after the year end, beginning from 2014; and
3.3.2 Implementation of Basel II/III
CBN FINANCIAL STABILITY REPORT DECEMBER 2013
49

was deployed by the Bank in November 2013. The new application, which went live in December 2013, is expected to run concurrently with the existing e-FASS application.
The Corporation's bonds held by banks
and other private investors, amounting to
N734.09 billion, became due and were
redeemed on 31st December 2013, in line
with the terms of the indenture, while
bonds of N3.51 trillion held by the CBN
were restructured into a N3.80 trillion
Note at 6 per cent, with a 10-year tenor.
AMCON is due to redeem the third
tranche of its bonds held by private
investors in the sum of N866.73 billion
by October 2014. Thereafter, the CBN
would be the only bondholder in
AMCON.
The Eligible Bank Assets (EBAs) acquired by AMCON stood at N2.37 trillion at end-December 2013, from N2.72 trillion at end-June 2013. Restructured loans amounted to N374.35 billion as at December 31, 2013 of which 55.75 per cent were performing, while 44.25 per cent were non-performing. Total recoveries at end-December 2013 were N164.5 billion, from the N109.40 billion achieved at end-June 2013.
The NPL ratio decreased to 3.23 per cent, compared with 3.65 per cent at end-June 2013, reflecting an improvement in the quality of banks' assets. It also remained within the regulatory threshold of 5 per
3.4 The Assets Management Corporation of Nigeria
3.5 Key Risks in the Financial System
3.5.1 Credit Risk
such exposures would be taken as reduction of capital and be deducted from capital during capital adequacy computation.
The above policy measures, approved to take effect from January 1, 2014, would ensure a stricter prudential assessment of the banks' capital adequacy.
Sequel to the publication of the first IFRS-based annual financial statements by banks and discount houses in the first half of 2013, the CBN/NDIC added traction to the implementation by conducting an assessment of the impairment methodology and IT support for IFRS reporting of the entities in the second half of 2013. The impairment methodology assessment reviewed the impairment models of the entities for appropriateness, adequacy of the inputs, and correctness of the output.
The assessment of IT support for IFRS reporting indicated that while some entities used Excel to convert their NGAAP figures to IFRS figures, others were at various stages of implementing IT solutions for IFRS reporting.
During the review period, capacity building programmes continued, especially in the Other Financial Institutions (OFIs) sub-sector. In addition, 19 publicly quoted OFIs issued their first IFRS financial statements as at December 31, 2012. Guidelines were also issued on the mode of adoption expected of the other OFIs, with the unit MFBs and BDCs categorised under SMEGA Levels II and III respectively.
Following the adoption of IFRS in the banking industry, an application, FinA,
3.3.3 International Financial Reporting Standards
CBN FINANCIAL STABILITY REPORT DECEMBER 2013
50

end-June 2013, indicating a marginal decrease in credit concentration.
Liquidity risk remained subdued during the review period as all banks exceeded the minimum required ratio of 30 per cent and the industry maintained an average of 50.63 per cent. The downside risk, however, was the cost of liquidity management in order to contain inflationary pressure and to protect the naira exchange rate.
Rates were generally stable in the second
3.5.2 Liquidity Risk
3.5.3 Market Risk
cent. Total NPLs, however, increased by 0.72 per cent to N324.13 billion at end-December 2013, from N321.80 billion at end-June 2013.
Furthermore, credit concentration remained a concern as the top 50 and 100 borrowers constituted 31.88 and 40.51 per cent, respectively, of gross credit at end-December 2013. This compares with 32.57 and 40.76 per cent, respectively, at
CBN FINANCIAL STABILITY REPORT DECEMBER 2013
Figure 3.14: Trend of Banking Industry NPLs, 2010 - 2013
40
35
30
25
20
15
10
5
0
34.5
15.5
9.4 8.8
4.9 4.44 4.3 4.08 3.47 3.65 3.65 3.23
Nov, ‘10 Mar’11 Jun’11 Sep’11 Dec’11 Mar ‘12 Jun ‘12 Sep ‘12 Dec‘12 Mar‘13 Jun ’13 Dec’13
NPLs %
Notwithstanding the stable rates, the continued decline of foreign reserves and decrease in oil receipts due to challenges in the oil sector, coupled with possible foreign portfolio investment reversals following the tapering of the US quantitative easing programme, could elevate market risk.
With enhanced security features in electronic banking software, identity theft and other cyber crimes have been ameliorated. However, other operational risks, such as fraud and forgeries, persisted.
3.5.4 Operational Risk
half of 2013 except for the fluctuations caused by the short-run effects of the July 2013 MPC decision to raise CRR on public sector deposits to 50 per cent from 12 per cent, and the challenges experienced by some discount houses. Measures taken by the CBN, however, helped in moderating the rates towards the end of the reporting period.
51

in the CRMS were processed as against 86 from January to June 2013.
Periodic spot checks on banks' compliance with the CRMS regulation helped to improve the number of borrowers registered in the database, while the decline in CRMS-related complaints was due to improved compliance with the CRMS Guidelines. Also, a workshop on basic CRMS administration and processes was conducted in November 2013 to train desk officers of reporting institutions.
The three licensed private credit bureaux (PCBs) continued to complement the efforts of CBN's CRMS in ensuring that financial institutions have adequate information on prospective borrowers while processing their credit requests. The number of credit records in PCBs increased to 21.89 million, from 21.08 million at end-June 2013.
The progress made by the PCBs notwithstanding, they continued to face the challenges of low public awareness, absence of a unique identifier, inadequate skilled human resources, and lack of an e f f i c i e n t i n f o r m a t i o n s h a r i n g mechanism. The guidelines for the operation and regulation of PCBs were revised, effective November 14, 2013, to address the identified challenges and facilitate sustainable growth of the economy.
The Financial Services Regulation Coordinating Committee (FSRCC) continued to provide a forum for interaction and coordination by the
3.6.2 Private Credit Bureaux
3.7 T h e F i n a n c i a l S e r v i c e s Regulation Coordinating Committee
Reported cases of fraud and forgery increased by 58.07 per cent to 3,917, involving a total sum of N31.49 billion in the second half of 2013, from 2,478 cases involving N22.41 billion in the first half of 2013. Actual losses, however, declined by 45.55 per cent to N2.08 billion in the review period, from N3.82 billion in the first half of 2013.
The activities of the consumer protection function of the CBN, in mediating between banks and their customers, contributed in enhancing confidence in the banking system. Furthermore, the engagement of the general public through sensitization workshops, road shows, and consumer parliaments improved confidence in the system. This was evidenced by the substantial decline in the number of complaints by bank customers to the CBN.
Also, the delisting of Nigeria from the Financial Action Task Force (FATF) “Grey List” in October 2013 has improved the country's reputation as an investors' destination.
The Credit Risk Management System 7(CRMS) continued to complement the
process of credit risk management in the banking industry. At end-December 2013, the number of borrowers registered by banks in the CRMS database stood at 202,611, while the total value of outstanding credits was N16.49 billion.
During the review period, 75 requests/or complaints on customers' credit records
3.5.5 Reputational Risk
3.6 Credit Bureaux
3.6.1 CBN's Credit Risk Management System
CBN FINANCIAL STABILITY REPORT DECEMBER 2013
7The CRMS is a depository of credit information on borrowers of N1 million and above for individuals, and N5 million and above for corporate customers.
52

charged its Financial Sector Soundness Sub-Committee (FSSSC) with the task of developing a financial stability monitor/dashboard and report on the dashboard at every meeting of the FSRCC.
The Bank received a total of 305 customer petitions against financial institutions during the second half of 2013.The figure showed a decrease of 59.82 per cent, from the 759 petitions received in the first half of 2013. The total refunds by banks to petitioners arising from the complaints amounted to N1.48 billion and US$194,000, compared with N1.45 billion recorded in the first half of the year.
3.8 Consumer Protection
3.8.1 Customer Complaints
regulatory authorities in the Nigerian financial system. The framework for the enhancement of supervisory tools, developed by the Bank, was adopted by the Committee for implementation.
Under the framework, the FSRCC would be restructured to have a Support Service Group (SSG) responsible for financial research and macro-prudential analysis. A r o b u s t , I T- d r i v e n d a t a b a s e infrastructure is expected to become an important component part of the restructuring arrangement. Other aspects of the adopted framework include the review of existing legislation and capacity building to transform the FSRCC into the Financial System Stability Committee (FSSC).
The FSRCC also identified the need for regular reports on vulnerabilities and threats to financial system stability and
CBN FINANCIAL STABILITY REPORT DECEMBER 2013
53


4.1 The Payments System Vision 2020
The Bank sustained the implementation of the Payments System Vision 2020 (PSV 2020) and achieved the following milestones during the review period:
1. Hosted a 2-day maiden International Conference on the Payments System, with over one thousand participants from stakeholders across the globe;
2. Revised and launched the Payments System Vision 2020 Strategy document. This would provide the policy direction for the Bank in the payments space in the next five years. The overall objective remains consistent with the original PSV 2020 document, intended to create an electronic payments infrastructure that is nationally utilised and internationally recognized; and
3. Assessed the Nigerian Payments System Market Infrastructure against the current 24 BIS/IOSCO core Principles for Financial Market Infrastructure (PFMI).
Consequent upon the revision of the strategy document and benchmarking of the Nigerian PFMI against the 24 BIS/IOSCO principles, the CBN shall:
a. Ensure that, henceforth, no national payments system shall invoke the principle of unwind;
b. Remove its implicit role of 'Lender of Last Resort' for the RTGS payment system by December 2016 and Deferred Net Settlement systems by December 2019;
In pursuance of the Payments System
Vision 2020, the CBN deployed a new
real-time gross settlement (RTGS)
system in the review period for the
settlement of inter-bank fund transfers,
customers' transfers and net positions
from clearing systems on real-time basis.
The new system interfaces with the
Scripless Securities Settlement System
(S4) to facilitate simultaneous delivery
versus payment to mitigate settlement
risks.
The Bank extended its cash-less policy, earlier launched in Lagos, to five additional States and the FCT, effective October 1, 2013. This reduced the cost of cash management, increased efficiency of the payments system, and enhanced financial inclusion.
Ten (10) additional Payment Terminal Service Providers (PTSPs) were licensed in the review period to deploy and maintain PoS terminals, bringing the total number of PTSPs to 16. With the additional PTSPs, a wider coverage on the deployment of PoS terminals across the country would be achieved.
The Bank, in collaboration with the Bankers Committee, commenced the development of a biometric solution to address the challenges posed by the absence of a unique identifier in the Nigerian banking industry.
During the review period, the Bank adopted the use of mobile money and issued the Guidelines for the Operation and Regulation of Agent Banking in Nigeria, aimed at promoting financial inclusion.
CBN FINANCIAL STABILITY REPORT DECEMBER 2013
55

I. Health,ii. Bill Presentment.
5. Issued the following guidelines:i. The Revised RTGS Rules and
Regulations, andii. The Clearing House sanctions.
The volume and value of inter-bank transfers through the Nigeria Inter-bank Settlement System (NISS) increased to 200,918 and N56,610.69 billion at end-December 2013, from 197,220 and N55,005.31 billion at end-June 2013, reflecting increases of 1.88 and 2.92 percen t in vo lume and va lue , respectively.
The volume of NIBSS instant payment (NIP) rose to 11,186,930 at end-December 2013, from 5,924,602 at end-June 2013, reflecting an increase of 88.82 per cent, while the value increased by 59.53 percent to N6,666.17 billion. The significant rise in volume and value of NIP was attributed to the extension of the cash-less policy to 5 additional states and the FCT.
4.2 The Real-Time Gross Settlement System
4.3 NIBSS Instant Payment
c. S t r e n g t h e n i t s s c h e m e governance structure to reflect t he s i gn i f i c an t l y g r ea t e r r e spons ib i l i ty o f scheme management, covering all aspects o f r i s k , b u s i n e s s m a n a g e m e n t a n d operational resilience;
d. Ensure that each Scheme Management Board carries out an annual self-assessment against the CPSS/IOSCO PFMI. An independent review shall be undertaken every four years, with the objective of making the results publicly available by end-2017;
e. Open formal engagement channels with Continuous Linked Settlement as a first step towards the naira becoming a settlement currency;
f. Mandate the use of the SWIFT Sanctions Checking (or its equivalent) for international payment instructions originating from all banks in Nigeria; and
g. Work jointly with SEC and other key stakeholders to sponsor a formal review of the securities market in Nigeria, which would be completed under the FSS2020 Financial Markets work stream.
4. Furthermore, the CBN identified the following new areas and initiatives to deepen the adoption of e-payment in the next phase of the PSV2020 Project in the following areas:i. Agriculture,ii. Smart cities,iii. Transportation,iv. Education,v. Hotels & entertainment,
CBN FINANCIAL STABILITY REPORT DECEMBER 2013
56

billion at end-December 2013, from 13,918,838 and N6,738.14 billion at end-June 2013, reflecting increases of 15.78 per cent and 12.33 per cent in volume and value, respectively.
4.4 NIBSS Electronic Fund
TransferThe volume and value of NIBSS Electronic Funds Transfer (NEFT) increased to 16,115,171 and N7,569.17
CBN FINANCIAL STABILITY REPORT DECEMBER 2013
Figure 4.1: Volume of NIP Transactions, July to December 2013
-
500,000
1,000,000
1,500,000
2,000,000
2,500,000
3,000,000
July August September October November December
Figure 4.2: Value (N Billion) of NIP Transactions, July to December 2013
-
200
400
600
800
1,000
1,200
1,400
1,600
Value N' Billion
57

21,096,075 and N11,492.50 billion at end-June 2013, thus reflecting decreases of 40.23 and 13.09 per cent, respectively.
4.5 Cheque ClearingThe volume and value of cheques cleared decreased to 8,257,330 and N4, 073.15 billion at end-December 2013, from
CBN FINANCIAL STABILITY REPORT DECEMBER 2013
Figure 4.3: Volume of NEFT Transactions, July to December 2013
-
500,000
1,000,000
1,500,000
2,000,000
2,500,000
3,000,000
3,500,000
July August September October November December
Figure 4.4: Value (N Billion) of NEFT Transactions, July to December 2013
-
200
400
600
800
1,000
1,200
1,400
1,600
1,800
July August September October November December
58

increased to 176,413,492 at end-December 2013, from 146,961,511 at end-June 2013.
Automated teller machines (ATMs) remained the dominant channel of
4.6 Electronic CardsElectronic card (e-card) transactions rose to N1,764.11 billion in the second half of 2013, from N1,416.10 billion in the first half of 2013, reflecting an increase of 20.04 per cent, while the volume
CBN FINANCIAL STABILITY REPORT DECEMBER 2013
Figure 4.5: Volume of Cheques Cleared, July to December 2013
Figure 4.2: V
1,200,000
1,250,000
1,300,000
1,350,000
1,400,000
1,450,000
1,500,000
1,550,000
Figure 4.6: Value (N Billion) of Cheques Cleared, July to December 2013
0
100
200
300
400
500
600
700
800
900
July August September October November December
59

patronised and accounted for only 1.02 per cent of the total. In value terms, ATMs accounted for 87.44 per cent; PoS, 5.88 per cent; mobile payments 5.17 per cent; while the Internet accounted for 1.51 per cent.
electronic payments. ATMs accounted for 89.92 per cent, followed by mobile payments with 5.55 per cent and PoS terminals with 3.51 per cent. The Internet as a payment channel (e-commerce) is yet to be fully embraced by the banking public. Thus, it remained the least
CBN FINANCIAL STABILITY REPORT DECEMBER 2013
Figure 4.7: Volume of Electronic Card Transactions, July to December 2013
ATM
POS
WEB
MOBILE
Figure 4.8: Value of Electronic Card Transactions, July to Dec 2013
ATM
POS
WEB
MOBILE
60

136,663,013, reflecting an increase of 16.07 per cent, while the value increased to N1,542.59 billion from N1,286.35 billion at end-June 2013, reflecting an increase of 19.92 per cent.
4.6.1 ATM TransactionsThe number of ATMs rose to 12,755 at end-December 2013, from 11,702 at end-June 2013. The volume of ATM transactions increased during the period under review to 158,629,927, from
CBN FINANCIAL STABILITY REPORT DECEMBER 2013
Figure 4.9: Volume of ATM Transactions, July - Dec 2013
23,000,000
24,000,000
25,000,000
26,000,000
27,000,000
28,000,000
29,000,000
30,000,000
July August September October November December
Figure 4.10: Value (N Billion) of ATM Transactions, July - Dec 2013
-
50
100
150
200
250
300
350
July August September October November December
61

respective, in the first half of 2013, respectively, reflecting increases of 63.77 and 75.96 per cent, respective, in volume and value, respectively.
4.6.2 Mobile PaymentsThe volume and value of mobile payments increased during the review period to 9,797,110 and N91.14 billion, from 5,982,225 and N51.79 billion,
CBN FINANCIAL STABILITY REPORT DECEMBER 2013
Figure 4.11: Volume of Mobile Payments, July - Dec 2013
-
500,000
1,000,000
1,500,000
2,000,000
2,500,000
July August September October November December
Figure 4.12: Value (N Billion) of Mobile Payments, July - Dec 2013
-
5
10
15
20
25
30
July August September October November December
62

billion, respectively, in the second half of 2013, reflecting increases of 93.11 and 81.37 per cent in volume and value. The number of PoS terminals rose to 120,191 at end-December 2013 from 119,653 at end June 2013.
4.6.3 Point of Sale Terminal Transactions
The volume and value of point of sale (PoS) transactions increased during the review period to 6,194,467 and N103.79 billion from 3,207,788 and N57.23
CBN FINANCIAL STABILITY REPORT DECEMBER 2013
-
200,000
400,000
600,000
800,000
1,000,000
1,200,000
1,400,000
1,600,000
July August September October November December
Figure 4.13: Volume of PoS Transactions, July - Dec 2013
Figure 4.14: Value (N Billion) of PoS Transactions, July - Dec 2013
0
5
10
15
20
25
30
July August September October November December
63


2014. Although responses to the news on tapering were relatively subdued in most economies, the combination of portfolio shifts and domestic weaknesses could result in sharper capital outflows and exchange rate adjustments.
Consequently, the report recommends that efforts to strengthen the global financial system and sever the links between banking and sovereign debt distress in Europe should be embarked upon to ensure that improvements in the global financial outlook translate into better prospects for the real economy.
For the Nigerian economy, real GDP growth is expected to remain strong at 7.3 per cent in 2014, up from the 6.4 per cent recorded in 2013. Similarly, real GDP growth in the non-oil sector is expected to remain strong, driven largely by agriculture, trade and services, while activities in the oil sector are projected to recover in 2014. Inflation is projected to decline to 7.0 per cent by end of 2014, down from the 8.0 per cent recorded at end December 2013. The forecast is based on the assumption that the Bank would sustain its tight monetary policy stance, in view of the forthcoming 2015 elections, and that the trend of declining food prices, arising from higher rice and wheat production, would persist. The downside risks to developments in the domestic economy include a continued decline in oil revenues due to changes in the international oil market, lack of fiscal prudence induced by increasing political activities, unabated security challenges in the northern part of the country, likely capital flow reversals as the Federal Reserve continues implementing its tapering programme, and uncertainties
Growth in global output is projected to strengthen at 3.7 per cent in 2014, up from the 3.0 per cent recorded in 2013. Most of the growth is expected to come from the advanced economies, as the drag in fiscal consolidation and uncertainties surrounding the impact of the US Federal Reserve's decision to systematically cut back on its quantitative easing programme on most economies thin out and private sector demand gains firmer ground. Also, it is expected that 2014 would witness an appreciable reduction in fiscal tightening, but accommodative monetary conditions in most economies. Consequently, output growth in the advanced economies is projected at 2.2 per cent or 0.9 per cent higher than the 1.3 per cent recorded in 2013. The stronger recovery in advanced economies will see emerging markets benefiting from higher external demand. Output in Emerging Market and Developing Economies is projected to grow at 5.1 per cent in 2014, compared to 4.7 per cent in 2013, and growth in Sub-Saharan Africa is projected to expand to 6.1 per cent in 2014 from 5.1 per cent in 2013.
The IMF World Economic Outlook (January 2014 Update), however, noted that downside risks remained with these forecasts. The risks include low inflation in advanced economies, especially the Euro area. Increases in real debt burdens and “premature real interest rate”, given that monetary policy in the Euro area, is constrained in lowering nominal interest rate. In the emerging market economies, increased financial market and capital flow volatility remains an issue of concern, given the announcement in December 2013 that the U.S. Federal Reserve would start its tapering early
CBN FINANCIAL STABILITY REPORT DECEMBER 2013
65

associated benefits in the reduction of fraud and credit risk.
In the area of regulation, further measures are expected to address issues relating to capacity in the banking system to further enhance the resilience of the financial system. These measures include the deve lopment o f a compe tency framework for the banking industry, the issuance of regulations for holding companies, and the automation of the 'fit and proper persons' portal.
It is envisaged that the system will remain resilient and capable of dealing with emerging challenges, despite short-term risks to financial stability.
about the pace of recovery in the global economy.
Money market rates are expected to remain stable in the first half of 2014, albeit at a slightly higher level than was recorded in the second half of 2013. Expectations of an increased liquidity surfeit in the system would likely be counter-balanced by tight monetary policy in order to maintain price stability.
The biometric solution to address the challenges associated with a unique identifier in the Nigerian banking industry is expected to be deployed in the first half of 2014. This would enhance the application of the “Know Your Customer” (KYC) principle, with its
CBN FINANCIAL STABILITY REPORT DECEMBER 2013
66
CBN FINANCIAL STABILITY REPORT DECEMBER 2013
Box 1: Guidance Note on Regulatory Capital
REGULATORY CAPITAL1.0 Introduction
2.0 Composition of Regulatory Capital
This document lays down new supervisory regulations for assessing the capital 8adequacy levels of banks and banking groups. The regulations have been revised
following the changes that were introduced in international regulations to take account of developments in risk management methodologies adopted by banks and the new policies and criteria underpinning supervisory activities.
9The rules governing regulatory capital , the total capital requirement, the internal capital assessment process and risk concentration shall be applied on solo and consolidated bases.
The following regulation is applicable to all banks licensed by the CBN.
This guideline establishes the procedures for calculating regulatory capital, which shall be the sum of
Capital elements:10Tier 1 Capital
(a) Paid-up share capital/common stock11(b) Disclosed reserves
12Tier 2 Capital(a) Revaluation reserves(b) General provisions/general loan-loss reserves (c) Hybrid (debt/equity) capital instruments(d) Subordinated debtLess anya) From Tier 1:(i) Goodwill and increase in equity capital resulting from a securitization;(ii) Investment in own shares (treasury stock);(iii) Losses carried forward and losses for the current financial year; and(iv) Intangible assets.b) The following items shall be deducted 50% from Tier 1 and 50%
from Tier 2 capital:(i) Investments in unconsolidated banking and financial subsidiary
companies;(ii) Investments in the capital of other banks and financial institutions; and
8More specifically, these are contained in International Convergence of Capital Measurement and Capital Standards, A Revised Framework. Comprehensive Version, published by the Basel Committee on Banking Supervision June 2006 (the “New Basel Capital Accord", or "Basel II")9Regulatory capital shall not be less than the initial capital required for authorization to engage in banking.10Subject to Tier 1 capital prudential filters, if any, as computed by the CBN.11These include share premium, retained profit, general reserves, SMEEIS reserves, regulatory risk reserves and statutory/legal reserves. 12Subject to Tier 2 capital prudential filters, if any, as specified by the CBN.
67
CBN FINANCIAL STABILITY REPORT DECEMBER 2013
13The total of Tier 2 capital will be limited to a maximum of 33.3% of the total of Tier 1, while Tier 3 capital, innovative instrument and undisclosed reserve are not allowed for inclusion in regulatory capital.
(iii) Significant minority investments in other financial entities.
This includes only permanent shareholders' equity (issued and fully paid ordinary shares/common stock and perpetual non-cumulative preference shares) and disclosed reserves (created or increased by appropriations of retained earnings or other surpluses).
In the case of consolidated accounts, this also includes minority interests in the equity of subsidiaries which are not wholly owned. This basic definition of capital excludes revaluation reserves and cumulative preference shares.
There is no limit on the inclusion of Tier 1 capital for the purpose of calculating regulatory capital. For this purpose, the equity shares with the following characteristics are included in Tier 1 capital:
·Issued directly by the bank;·Clearly and separately identified in the balance sheet;·Have no maturity (are perpetual); ·Fully paid;·Cannot be refunded beyond the possibility of the liquidation of a bank or a
reduction of its share capital;·Do not give to the holder rights to a minimum remuneration nor are there any
clauses that require the compulsory payment of dividends;·The dividends are paid solely out of distributable profits or retained earnings
distributable; and·Classified as equity instruments in accordance with IFRS.
(a) Revaluation Reservei) Fixed Asset Revaluation Reserve: This relates to revaluation of fixed assets in line with market values reflected on the face of the balance sheet.Prior approval of the CBN must be obtained by any bank before the recognition of the revaluation surplus on fixed assets in its books, which can only be done taking into consideration the following:
·The valuation must be made by qualified professionals and the basis of the revaluation as well as the identities of the valuers must be stated;
·The difference between the market and historic values of the eligible fixed assets being revalued shall be discounted by 55%;
·The revaluation of fixed assets is applicable to own premises only; and·The revaluation of fixed assets (own premises only) is permissible within a
3.0 Qualifying Criteria for the Assessment of Capital Components
3.1 Tier 1 Capital
133.2 Tier 2 Capital
68

CBN FINANCIAL STABILITY REPORT DECEMBER 2013
minimum period of seven years after the date of the purchase of the asset or the last revaluation.
ii) Other revaluation reserves: The inclusion of other revaluation reserves created by the adoption of the International Financial Reporting Standards (IFRS) as part of the Tier 2 capital shall be subject to the limitations that will be specified by the CBN from time to time.
(b) General provisions/General loan-loss reservesFor the purpose of the standardized credit risk measurement approach, provisions or loan-loss reserves held against future (presently unidentified) losses are freely available to meet losses which subsequently materialize and therefore qualify for inclusion in Tier 2 capital. Provisions ascribed to specific or identified deterioration of particular assets or known liabilities, whether individual or group (collective), are excluded. Furthermore, general provisions/general loan-loss reserves eligible for inclusion in Tier 2 will be limited to a maximum of 1.25 percentage points of credit risk-weighted assets and subject to the approval of the CBN.
(c) Hybrid (debt/equity) capital instrumentsThese include financial instruments which combine characteristics of equity and debt capital. Essentially, they should meet the following requirements:
·They are unsecured, subordinated and fully paid-up;·They are not redeemable at the initiative of the holder or without the prior
consent of the CBN;·They are available to participate in losses without the bank being obliged to
cease trading (unlike conventional subordinated debt);·Although the capital instrument may carry an obligation to pay interest that
cannot permanently be reduced or waived (unlike dividends on ordinary shareholders' equity), it should allow service obligations to be deferred (as with cumulative preference shares) where the profitability of the bank would not support payment; and
·Hybrid capital instruments that are redeemable must have a maturity of at least 10 years. The contract must clearly specify that repayment is subject to authorization by the Central Bank of Nigeria. Cumulative preference shares, having these characteristics, would be eligible for inclusion in this category.
·The valuation must be made by qualified professionals and the basis of the revaluation as well as the identities of the valuers must be stated;
·The difference between the market and historic values of the eligible fixed assets being revalued shall be discounted by 55%;
·The revaluation of fixed assets is applicable to own premises only; and·The revaluation of fixed assets (own premises only) is permissible within a
minimum period of seven years after the date of the purchase of the asset or the last revaluation.
69

CBN FINANCIAL STABILITY REPORT DECEMBER 2013
(d) Subordinated term debtsSubordinated debts issued by banks shall form part of the Tier 2 capital, provided that the contracts governing their issue expressly envisage that:
·In the case of the liquidation of the issuer, the debt shall be repaid only after all other creditors not equally subordinated have been satisfied;
·The debt has an original maturity of at least five years. Where there is no set maturity, repayment shall be subject to at least five years' prior notice;
·Early repayment of the liabilities may take place only at the initiative of the issuer and shall be subject to approval of the CBN;
·The contracts shall not contain clauses whereby, in cases other than those referred to in points (a) and (c), the debt may become redeemable prior to maturity; and
·During the last five years to maturity, a cumulative discount (or amortization) factor of 20% per year will be applied to reflect the diminishing value of these instruments as a continuing source of strength.
Unlike instruments included in hybrid capital above, these instruments are not normally available to participate in the losses of a bank which continues trading. For this reason, these instruments will be limited to a maximum of 50% of Tier 1 Capital.
Owing to the adoption of International Financial Reporting Standards (IFRS) by banks and for the purpose of calculating regulatory capital, the CBN may, from time to time, apply prudential filters.
Banks shall continue to report on regulatory capital in accordance with the CBN's extant rules.
4.0 Prudential Filters
5.0 Frequency of Reporting and Procedures for Calculating Individual Regulatory Capital
70

