towards decrypting the art of analog layout: …...towards decrypting the art of analog layout:...
TRANSCRIPT

Towards Decrypting the Art of Analog Layout:Placement Quality Prediction via Transfer Learning
Mingjie Liu∗, Keren Zhu∗, Jiaqi Gu, Linxiao Shen, Xiyuan Tang, Nan Sun, and David Z. PanECE Department, The University of Texas at Austin, Austin, TX, USA
{jay liu, keren.zhu, jqgu, lynn.shenlx, xitang}@utexas.edu, [email protected], [email protected]
Abstract—Despite tremendous efforts in analog layout au-tomation, little adoption has been demonstrated in practicaldesign flows. Traditional analog layout synthesis tools use variousheuristic constraints to prune the design space to ensure postlayout performance. However, these approaches provide limitedguarantee and poor generalizability due to a lack of modelmapping layout properties to circuit performance. In this paper,we attempt to shorten the gap in post layout performance mod-eling for analog circuits with a quantitative statistical approach.We leverage a state-of-the-art automatic analog layout tool andindustry-level simulator to generate labeled training data inan automated manner. We propose a 3D convolutional neuralnetwork (CNN) model to predict the relative placement qualityusing well-crafted placement features. To achieve data-efficiencyfor practical usage, we further propose a transfer learning schemethat greatly reduces the amount of data needed. Our modelwould enable early pruning and efficient design explorations forpractical layout design flows. Experimental results demonstratethe effectiveness and generalizability of our method acrossdifferent operational transconductance amplifier (OTA) designs.
I. INTRODUCTION
Analog and mixed-signal (AMS) integrated circuits (ICs)are widely used in many emerging applications, includingconsumer electronics, automotive, and Internet of Things. Theincreasing demand of these applications calls for a shorterdesign cycle and time-to-market. As technologies continue toscale, sensitive layout-dependent effects make robust and high-performance analog layout design a increasing challenge [1].
Implementing analog circuit layouts is a heavily manual,time-consuming and error-prone task. Human layout designersdraw the layouts following layout conventions learned fromexperience. Although those layout conventions provide goodguidelines, they cannot directly ensure or optimize for thepost layout performance. Time-consuming iterative trial anderror is often required for design closure. On the other hand,the endeavor to automate analog layout generation has beencontinuing for decades [2]. However, little adoption has beendemonstrated in practical analog design flows. This is partiallydue to the unavailability of the tools and, more importantly,the limited guarantee towards performance the tools provide.
Traditional analog layout synthesis tools rely on variousheuristic constraints rather than explicit optimization overthe post layout performance. Heuristic constraints are basedon human layout techniques and enforced during placementand routing. However, heuristic constraints-based methods
∗ Both authors contributed equally to this work.
are questionable in practical designs flows; hand-crafted con-straints are often questionable in explainability and confidence,and lack flexibility and generality in meeting the detailedneeds of different scenarios. Without a direct model to predictthe post-layout performance, analog layout has been moreconsidered as an art that stubbornly defies all attempts forautomation [3].
Previous works on analog performance modeling weretargeted towards modeling the effect of device parameterson the circuit performance [4]–[6]. Most of the proposedmodeling techniques are pre-layout; i.e., they model the analogdesign behavior at the schematic level. Prior works targetedtowards modeling performance at the layout level deriveequations to analyze various layout effects. Lampaert et al. [7]use sensitivity analysis on circuit performance and estimateinterconnect parasitic and mismatch effects. Ou et al. [8] adopta similar methodology in mitigating layout dependent effectsfor improved circuit robustness. However, with increased de-vice scaling, analytical sensitivity estimates of parasitics andmismatch over performance are no longer accurate. Therefore,a modeling framework that establishes a mapping betweena given layout and the expected post layout performance isimperative yet still challenging.
On the other hand, recent studies have demonstrated successin applying machine learning techniques to model abstractlayout guidelines and guide automatic physical design. Thework of [9] uses a CNN model to predict the post-routingresults from early macro placement solutions and [10] predictsroutability from standard cell placements. Similar success isalso shown in analog layout automation in applying generativemachine learning models to analog routing [11] and wellgeneration [12]. While works in digital domain often leverageautomatic layout flows to generate high-quality training data,the works of [11], [12] rely on manual analog layouts fortraining. The difficulty in obtaining human layouts mightexplain the lack of research in modeling analog layout quality.
In this paper, we propose a new methodology to shorten thegap in post layout performance modeling for analog circuits.We propose to predict the relative layout quality with certainpost layout performance as a quantitative metric, given acertain design space. Successful quality prediction will enableearly design pruning for fast design space explorations. Ourproposed approach leverages an automatic flow to generatehigh-quality labeled training data and a convolutional neuralnetwork (CNN) along with well-crafted placement features to
predict the post layout performance. To overcome the highcost of obtaining labeled training data, we further proposea transfer learning scheme that reduces the amount of dataneeded under different design setups. Our main contributionsare summarized as follows:
• To the best of the authors’ knowledge, we are the firstto propose a placement quality prediction model for fastdesign space explorations.
• We propose a method of automatically generating simu-lated layout training data and extracting effective place-ment features related to placement quality.
• We apply coordinate channels with 3D convolution layersfor improved model performance.
• We propose a transfer learning scheme that significantlyreduces the amount of data needed during training, whilestill achieving effective design pruning.
The remainder of this paper is organized as follows. Sec-tion II gives the background on design space pruning andformulates the quality prediction task; Section III explains indetails our proposed method of extracting placement featuresand 3D CNN model; Section IV demonstrates the experimentalresults on transfer learning; Section V concludes the paper.
II. BACKGROUND AND PRELIMINARIES
In this section we first give a background on design spacepruning in analog layout synthesis flows in Sec. II-A. We thenformulate our placement quality prediction task in Sec. II-B.
A. Design Space Pruning in Analog Layout Synthesis
To satisfy post layout performance requirements and achievedesign closure, a feedback loop from post layout performanceis needed in the development of practical layout synthesisflow. The work of [13] proposes a framework where thecircuit is resized if the post layout performance metrics isnot met. We suppose that the circuit is already well-designedand limit our scope exclusively to exploring the design spaceof layout implementations. Design exploration would thusactively search for satisfactory layout implementations in thedesign space based on the feedback results from simulations.Previous works of performance driven analog layout synthesistools attempt to reduce the design space by analytically em-bedding the layout impact on performance into a cost function.However, with increased device scaling and complexity oflayout dependent effects, these methods are no longer accurate.
B. Motivation and Problem Formulation
One major bottleneck of design exploration is the runtimeinvolved with post layout simulations. To obtain the finalsimulation results, the generated layout design after place androute need to be extracted for parasitics and then evaluatedwith transistor level simulations. The runtime of simulationsnormally dominates a single iteration cycle. An effectiveprediction on the post layout performance quality in the earlysteps of the design cycle would thus prune the design spaceand allow faster explorations.
With the motivation to prune design space, we propose topredict the layout quality with intermediate results after theplacement step. We define the layout quality as the relativepost layout performance with the performance distributionin some give design space. Our task if formulated intothe following classification problem: Given the circuit andintermediate placement solutions of device boundary box,placement coordinates and pin locations, predict whether toprune the design in regards to the performance quality. In otherwords, the objective is to discard placement candidates that areexpected to give poor post layout performance results in theearly design stage.
III. PLACEMENT QUALITY PREDICTION
In this section, we explain in details our method of pre-dicting placement quality. We first explain the method ofgenerating and labeling data with an automatic layout genera-tor in Sec. III-A. The details of the extracted features fromplacement results are presented in Sec. III-B. We then in-troduce embedding coordinate channels for coordinate relatedmachine learning tasks in Sec. III-C and our 3D CNN modelin Sec. III-D. Finally we give a brief overview of our transferlearning scheme in Sec. III-E.
A. Data Generation and Labeling
We generate layouts for training and testing with an auto-matic layout generator [14]. We enforce symmetry constraintsin placement and routing for all layouts generated. The sym-metry constraints and critical nets are provided by the circuitdesigner. An analytical placement engine is used with theobjective of minimizing the following cost:
fCost = fWL + a · fBND. (1)
where fWL is the total weighted half-perimeter wirelength(HPWL) and fBND is the penalty term for violating a desir-able boundary for the design based on aspect ratio and whitespace ratio. While generating different layouts of the samedesign, we keep fBND fixed and change the net weighting infWL. We generate different net weights by selecting differentcombinations of critical nets for a higher weight value.
Since the performance metric and layout design spacediffer significantly for different analog functional buildingblocks, we limit our study to operational transconductanceamplifier (OTA) designs. The statistics and performance metricevaluated are shown in Table I. OTA1 and OTA2 have the samecircuit schematic but different sizing. All generated layouts areLVS (Layout Versus Schematic) clean.
TABLE I: Data Statistics
Design Stage Compensation Layouts MetricOTA1 3 Nested Miller 16,376 OffsetOTA2 3 Nested Miller 16,381 OffsetOTA3 2 Miller 16,384 OffsetOTA4 2 None 16,363 CMRR
After obtaining the post layout simulation results, we labelthe quality for each data point based on the relative rank
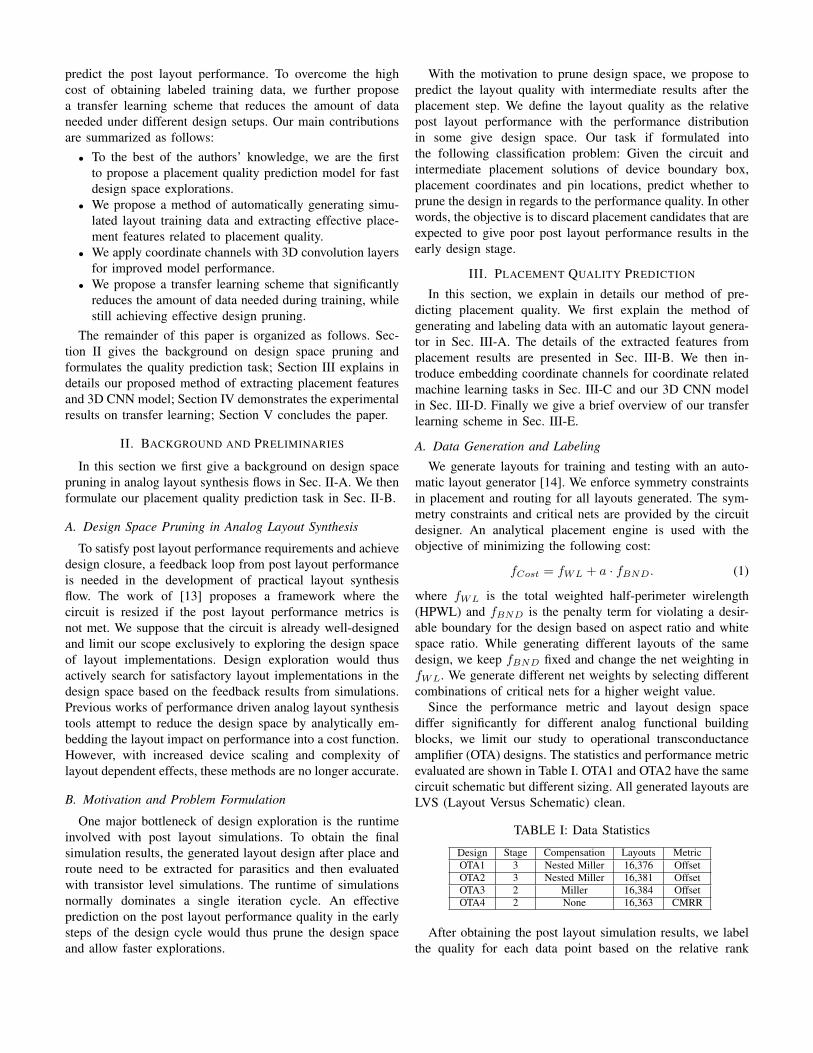
Pruned, Label as 1
Fig. 1: Offset distribution of OTA1.
(a) (b)
Fig. 2: Example of layouts and labels. (a) Largest offset inOTA1, labeled 1 (b) Smallest offset in OTA1, labeled 0.
on performance. Figure 1 shows the distribution of the inputreferred offset (absolute value) of OTA1. A layout is labeled asbeing pruned if the performance is in the worst 25th percentileof the entire data set distribution. Figure 2 shows the worstand best layout of OTA1 and their corresponding labels.
B. Placement Feature Extraction
The complex and intricate nature of analog circuit behaviorsmake extracting performance relevant features from placementextremely important. The performance impact of a deviceplacement lies in both the placement location and circuittopology. As an example, the mismatch of differential inputpairs has a larger impact towards offset compared with theload. Thus, to ensure a good and generalized model, extractedfeatures have to be both easily extendable to different circuittopologies and able to encode effective placement information.
To leverage the success of convolutional neural networksin computer vision tasks, we represent intermediate layoutplacement results into 2D images. Instead of compacting theentire circuit placement into a single image, we separatedevices into different images based on the circuit topology. ForOTA circuits, we propose divide the circuit into the followingsubcircuits based on functionality:
• First Stage Devices in the first stage. This include thedifferential input, load, and tail transistors.
• Other Stages Devices in the other amplifier stages.• Feedback Passive devices in the compensation feedback
loop, such as miller capacitance.
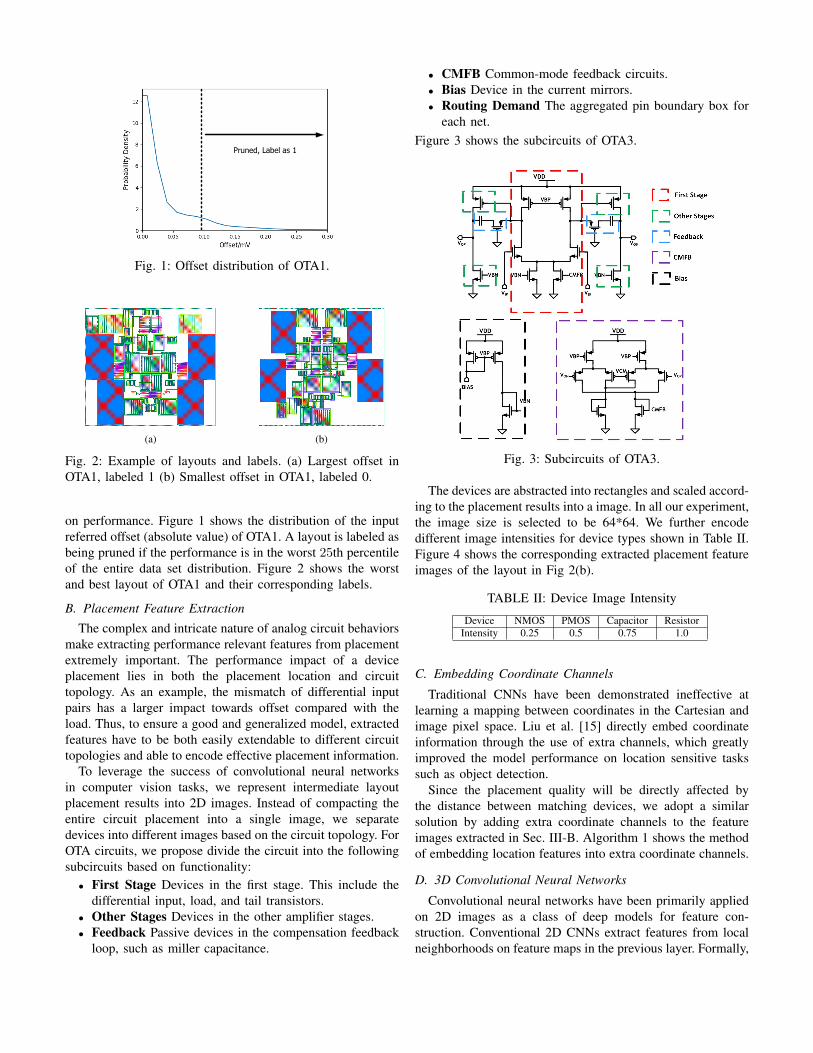
• CMFB Common-mode feedback circuits.• Bias Device in the current mirrors.• Routing Demand The aggregated pin boundary box for
each net.Figure 3 shows the subcircuits of OTA3.
Fig. 3: Subcircuits of OTA3.
The devices are abstracted into rectangles and scaled accord-ing to the placement results into a image. In all our experiment,the image size is selected to be 64*64. We further encodedifferent image intensities for device types shown in Table II.Figure 4 shows the corresponding extracted placement featureimages of the layout in Fig 2(b).
TABLE II: Device Image Intensity
Device NMOS PMOS Capacitor ResistorIntensity 0.25 0.5 0.75 1.0
C. Embedding Coordinate Channels
Traditional CNNs have been demonstrated ineffective atlearning a mapping between coordinates in the Cartesian andimage pixel space. Liu et al. [15] directly embed coordinateinformation through the use of extra channels, which greatlyimproved the model performance on location sensitive taskssuch as object detection.
Since the placement quality will be directly affected bythe distance between matching devices, we adopt a similarsolution by adding extra coordinate channels to the featureimages extracted in Sec. III-B. Algorithm 1 shows the methodof embedding location features into extra coordinate channels.
D. 3D Convolutional Neural Networks
Convolutional neural networks have been primarily appliedon 2D images as a class of deep models for feature con-struction. Conventional 2D CNNs extract features from localneighborhoods on feature maps in the previous layer. Formally,
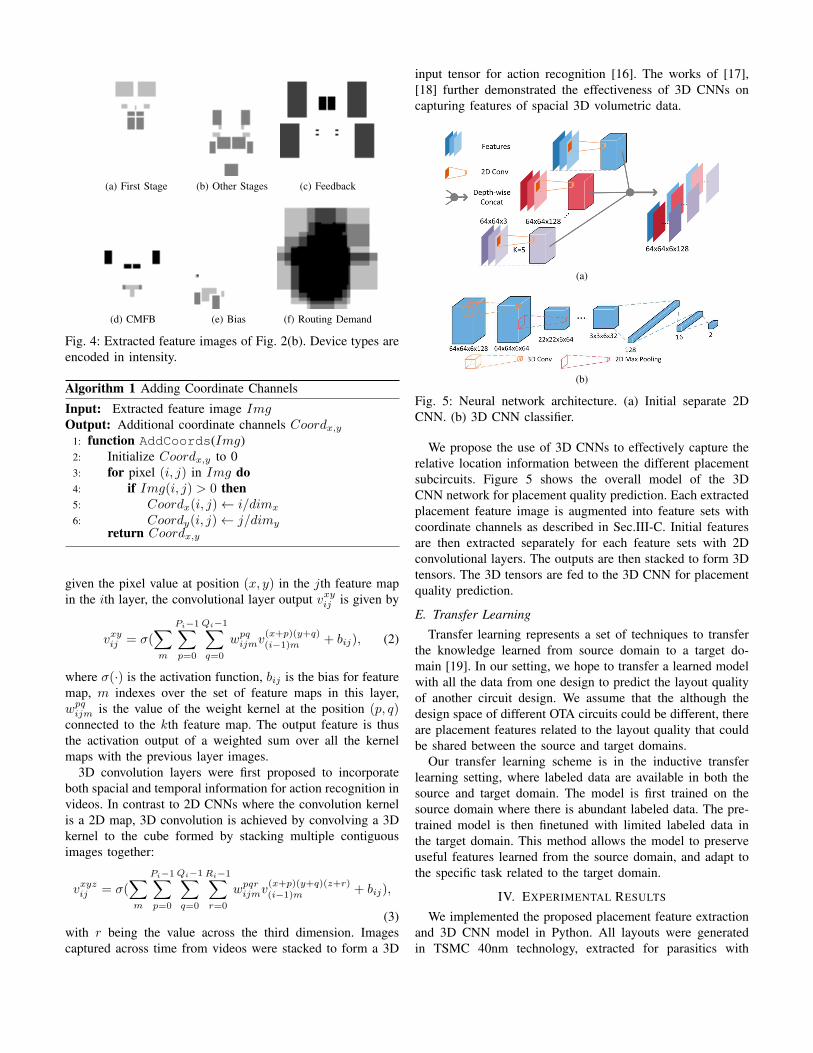
(a) First Stage (b) Other Stages (c) Feedback
(d) CMFB (e) Bias (f) Routing Demand
Fig. 4: Extracted feature images of Fig. 2(b). Device types areencoded in intensity.
Algorithm 1 Adding Coordinate Channels
Input: Extracted feature image ImgOutput: Additional coordinate channels Coordx,y
1: function AddCoords(Img)2: Initialize Coordx,y to 03: for pixel (i, j) in Img do4: if Img(i, j) > 0 then5: Coordx(i, j)← i/dimx
6: Coordy(i, j)← j/dimyreturn Coordx,y
given the pixel value at position (x, y) in the jth feature mapin the ith layer, the convolutional layer output vxyij is given by
vxyij = σ(∑m
Pi−1∑p=0
Qi−1∑q=0
wpqijmv
(x+p)(y+q)(i−1)m + bij), (2)
where σ(·) is the activation function, bij is the bias for featuremap, m indexes over the set of feature maps in this layer,wpq
ijm is the value of the weight kernel at the position (p, q)connected to the kth feature map. The output feature is thusthe activation output of a weighted sum over all the kernelmaps with the previous layer images.
3D convolution layers were first proposed to incorporateboth spacial and temporal information for action recognition invideos. In contrast to 2D CNNs where the convolution kernelis a 2D map, 3D convolution is achieved by convolving a 3Dkernel to the cube formed by stacking multiple contiguousimages together:
vxyzij = σ(∑m
Pi−1∑p=0
Qi−1∑q=0
Ri−1∑r=0
wpqrijmv
(x+p)(y+q)(z+r)(i−1)m + bij),
(3)with r being the value across the third dimension. Imagescaptured across time from videos were stacked to form a 3D
input tensor for action recognition [16]. The works of [17],[18] further demonstrated the effectiveness of 3D CNNs oncapturing features of spacial 3D volumetric data.
(a)
(b)
Fig. 5: Neural network architecture. (a) Initial separate 2DCNN. (b) 3D CNN classifier.
We propose the use of 3D CNNs to effectively capture therelative location information between the different placementsubcircuits. Figure 5 shows the overall model of the 3DCNN network for placement quality prediction. Each extractedplacement feature image is augmented into feature sets withcoordinate channels as described in Sec.III-C. Initial featuresare then extracted separately for each feature sets with 2Dconvolutional layers. The outputs are then stacked to form 3Dtensors. The 3D tensors are fed to the 3D CNN for placementquality prediction.
E. Transfer Learning
Transfer learning represents a set of techniques to transferthe knowledge learned from source domain to a target do-main [19]. In our setting, we hope to transfer a learned modelwith all the data from one design to predict the layout qualityof another circuit design. We assume that the although thedesign space of different OTA circuits could be different, thereare placement features related to the layout quality that couldbe shared between the source and target domains.
Our transfer learning scheme is in the inductive transferlearning setting, where labeled data are available in both thesource and target domain. The model is first trained on thesource domain where there is abundant labeled data. The pre-trained model is then finetuned with limited labeled data inthe target domain. This method allows the model to preserveuseful features learned from the source domain, and adapt tothe specific task related to the target domain.
IV. EXPERIMENTAL RESULTS
We implemented the proposed placement feature extractionand 3D CNN model in Python. All layouts were generatedin TSMC 40nm technology, extracted for parasitics with

Calibre PEX, and simulated with Cadence Spectre. For all ourexperiments, we select 20% of the data (around 3,200 layouts)to be the testing set which is never observed during training.The data set and feature extraction are open-source1.
A. Evaluation Metrics
For our application setting, we use the false omission rateFOR as the key performance metric:
FOR =FN
TN + FN, (4)
where FN is the number of not pruned bad designs and TNare the designs correctly selected to explore. False omissionrate (FOR) measures the leakage of bad designs to designexploration. Without any pruning, none of the bad designswould be filtered and we would have a FOR of 25%. Wealso report the accuracy, precision, recall and F1 score inour results. A good layout quality prediction would have highaccuracy, high precision and low FOR.
B. Baseline Model and CNN Architecture Comparison
We use a balanced labeled data of OTA1 for training thebaseline model for transfer learning. Similar to the labelingmethod described in Sec.III-A, we create a balanced data withthe worst performing 25th percentile layout labeled as 1 andthe best 25th as 0. Intuitively, this is exposing the best andworst placements to the machine learning model.
We experiment with different neural network architectures.nofeat indicate compacting the placement result into a singleimage, while feat is separating different subcircuits into multi-ple images and embedding extra coordinate channels. 3D is theproposed 3D neural network architecture while 2D is replacingall the convolution filters with 2D. Table III compares thetraining and testing accuracy for different architecture models.The proposed feature extraction with 3D CNN achieves thebest testing accuracy.
TABLE III: Baseline Model Comparisons
Model Training Accuracy Testing Accuracynofeat+2D 97.95% 78.44%nofeat+3D 79.23% 78.32%feat+2D 96.19% 91.94%feat+3D 95.51% 93.83%
C. Transfer Learning with Limited Data
We experiment on the transfer learning scheme proposedin Sec. III-E. For the transfer learning results, we report theevaluation metrics of the testing set after training with areduced learning rate and compare with retraining.
Table IV reports the results on transfer learning. Trainingratio α is defined as the the percentage of training data usedin respect to the entire data set. Using the entire training setwould have a training ratio of 0.80 since the rest 20% isreserved for testing. A training ratio of 0.00 indicate directlyusing the pre-trained baseline model without finetuning on any
1https://github.com/magical-eda/UT-AnLay
target domain data. We only report OTA1 with α = 0.80 sincethe baseline is trained on this design. Based on the results, wemake the following observations:
• Transfer learning significantly improves the results com-pared with retraining from random initialization.
• The performance of prediction and the effectiveness ofpruning increases with the amount of training data.
• Even with limited training data of only 160 layouts, theplacement quality prediction is quite effective.
• Directly applying the baseline model without finetuningis non-ideal, since the data distribution of the target andsource domains could vary significantly.
With training on 10% of the data, our proposed transferlearning approach can achieve an average FOR of 8.95%compared to 22.91% in the baseline setup. On OTA1, ourmethod significantly reduces the FOR by 57% compared withthe baseline using only 1% of the data. The data efficiencydemonstrated in turn results in a significant reduction inthe exploration cost. With our model achieving up to 90%accuracy, we can prune more than 20% of the design spaceof low performance quality, while largely allowing designs ofhigh quality to be explored.
D. Transfer Learning with Few-shot Examples
In practical situations of design exploration, obtaining per-formance results of even a hundred layout might be expen-sive. Furthermore, the performance distribution could only beknown until the design space has been fully explored. Tofurther demonstrate the models effectiveness for early designpruning, we experiment transfer learning with only a fewexample from the target domain.
Our experiment setting is as follows. For every experiment,we randomly sample 16 layouts as the transfer training data.We label the training data according to their relative rank inthe training set instead of the entire design space. We thenrelabel the testing set according to the critical value in thetraining distribution. The number of positive data in the testingset could vary significantly from 25%. The confidence of ourmodel would thus be tested on the performance distribution ofthe training data instead of the entire design space. We repeatour experiment 100 times for each transfer target design.
Figure 6 shows the result on the few-shot transfer learning.The black line plots the false omission rate of random designpruning. With extremely limited data, the improvement gainedwith few-shot learning is highly correlated with the transfertask. Transferring the knowledge from the same design butdifferent sizing (OTA2) is extremely effective. There is onlylimited improvement in few-shot transfer learning to a differentdesign with different performance metric (OTA4).
V. CONCLUSION
In this paper, we propose a new method of early layoutdesign pruning by predicting the placement quality. Our 3DCNN model with well-crafted placement features offers en-hanced flexibility, capable of generalizing to different OTAdesigns. We further propose a transfer learning scheme that

TABLE IV: Transfer Learning Results
Design α Accuracy (%) Precision (%) Recall (%) F1 Score FOR (%)w w/o w w/o w w/o w w/o w w/o
OTA1 0.80 90.29 – 86.69 – 73.79 – 0.7972 – 8.32 –OTA2 0.80 90.96 92.61 84.75 84.64 77.97 85.07 0.8122 0.8485 7.12 4.99
0.10 90.10 80.40 82.53 68.07 76.78 17.74 0.7955 0.2815 7.57 22.000.01 88.28 74.05 80.74 43.85 69.93 21.37 0.7495 0.2875 9.60 22.380.00 70.10 – 52.47 – 25.06 – 0.3392 – 21.28 –
OTA3 0.80 90.23 91.33 86.51 84.76 73.61 80.95 0.7954 0.8281 8.38 6.260.10 87.29 79.98 77.52 58.07 69.78 80.95 0.7345 0.1385 9.75 23.840.01 81.21 77.32 64.79 57.46 58.78 17.44 0.6118 0.2676 13.40 26.760.00 74.73 – 49.81 – 40.25 – 0.4452 – 18.72 –
OTA4 0.80 89.81 92.05 77.87 81.69 82.15 88.06 0.7995 0.8476 6.06 4.090.10 88.70 74.33 81.69 48.96 70.01 15.80 0.7540 0.2389 9.54 22.900.01 81.05 76.68 68.87 56.50 42.71 20.13 0.5272 0.2968 16.95 21.920.00 49.72 – 26.78 – 59.54 – 0.3694 – 22.77 –
w are the transfer learning results. w/o are the results trained from random initialized weights.
Fig. 6: Few-shot transfer learning results.
greatly reduces the amount of labeled data needed, achievingup to 57% reduction in the false omission rate compared toretraining the model, while using only 1% of labeled data.With our model, we can effectively prune more than 20% ofthe design space of low performance quality.
ACKNOWLEDGEMENT
This work is supported in part by the NSF under GrantNo. 1704758, and the DARPA ERI IDEA program. Theauthors would like to thank Mohamed Baker Alawieh fromThe University of Texas at Austin for helpful comments.
REFERENCES
[1] R. A. Rutenbar, “Analog circuit and layout synthesis revisited,” in ISPD,2015, pp. 83–83.
[2] M. P.-H. Lin, Y.-W. Chang, and C.-M. Hung, “Recent research devel-opment and new challenges in analog layout synthesis,” in ASPDAC,2016.
[3] A. Hastings, The Art of Analog Layout. Prentice, 2005.[4] F. Wang, P. Cachecho, W. Zhang, S. Sun, X. Li, R. Kanj, and C. Gu,
“Bayesian model fusion: large-scale performance modeling of analogand mixed-signal circuits by reusing early-stage data,” IEEE TCAD,vol. 35, no. 8, pp. 1255–1268, 2015.
[5] M. B. Alawieh, S. A. Williamson, and D. Z. Pan, “Rethinking sparsityin performance modeling for analog and mixed circuits using spike andslab models,” in DAC, 2019.
[6] F. Gong, Y. Shi, H. Yu, and L. He, “Variability-aware parametric yieldestimation for analog/mixed-signal circuits: Concepts, algorithms, andchallenges,” IEEE Design & Test, vol. 31, no. 4, pp. 6–15, 2014.
[7] K. Lampaert, G. Gielen, and W. M. Sansen, “A performance-drivenplacement tool for analog integrated circuits,” JSSC, vol. 30, no. 7, pp.773–780, 1995.
[8] H.-C. Ou, K.-H. Tseng, J.-Y. Liu, I. Wu, Y.-W. Chang et al., “Layout-dependent-effects-aware analytical analog placement,” in DAC, 2015.
[9] Y.-H. Huang, Z. Xie, G.-Q. Fang, T.-C. Yu, H. Ren, S.-Y. Fang, Y. Chen,and J. Hu, “Routability-driven macro placement with embedded cnn-based prediction model,” in DATE, 2019.
[10] C. Yu and Z. Zhang, “Painting on placement, forecasting routingcongestion using conditional generative adversarial nets,” in DAC, 2019.
[11] K. Zhu, M. Liu, Y. Lin, B. Xu, S. Li, X. Tang, N. Sun, and D. Z. Pan,“Geniusroute: A new analog routing paradigm using generative neuralnetwork guidance,” in ICCAD, 2019.
[12] B. Xu, Y. Lin, X. Tang, S. Li, L. Shen, N. Sun, and D. Z. Pan,“Wellgan: Generative-adversarial-network-guided well generation foranalog/mixed-signal circuit layout,” in DAC, 2019.
[13] K. Hakhamaneshi, N. Werblun, P. Abbeel, and V. Stojanovic, “Latebreaking results: Analog circuit generator based on deep neural networkenhanced combinatorial optimization,” in DAC, 2019.
[14] B. Xu, K. Zhu, M. Liu, Y. Lin, S. Li, X. Tang, N. Sun, and D. Z. Pan,“Magical: Toward fully automated analog ic layout leveraging humanand machine intelligence,” in ICCAD, 2019.
[15] R. Liu, J. Lehman, P. Molino, F. Petroski Such, E. Frank, A. Sergeev,and J. Yosinski, “An intriguing failing of convolutional neural networksand the coordconv solution,” in Conference on Neural InformationProcessing Systems (NIPS), 2018.
[16] S. Ji, W. Xu, M. Yang, and K. Yu, “3d convolutional neural networksfor human action recognition,” IEEE Transactions on Pattern Analysisand Machine Intelligence, vol. 35, no. 1, pp. 221–231, Jan 2013.
[17] Q. Dou, H. Chen, L. Yu, L. Zhao, J. Qin, D. Wang, V. C. Mok, L. Shi,and P. Heng, “Automatic detection of cerebral microbleeds from mrimages via 3d convolutional neural networks,” IEEE Transactions onMedical Imaging, vol. 35, no. 5, pp. 1182–1195, May 2016.
[18] K. Hara, H. Kataoka, and Y. Satoh, “Can spatiotemporal 3d cnns retracethe history of 2d cnns and imagenet?” in IEEE Conference on ComputerVision and Pattern Recognition (CVPR), 2018.
[19] S. J. Pan and Q. Yang, “A survey on transfer learning,” IEEE Transac-tions on Knowledge and Data Engineering, vol. 22, no. 10, pp. 1345–1359, Oct 2010.