top trends in fresh - iri
TRANSCRIPT

TOP TRENDS IN FRESH: PERISHABLES ROLES IN A PANDEMIC
RETAIL LANDSCAPE
Hosted with thought leadership from FMI associate member
March 3, 2021

www.fmi.org 2
Rick Stein, Vice President, Fresh, FMI
Sally Lyons Wyatt, EVP, IRI Center-of-Store & Produce Vertical
Jonna Parker, Principal, IRI Fresh Center of Excellence
Today’s Speakers

www.fmi.org 3
FMI ANTITRUST COMPLIANCE
◆ It is FMI policy to comply in all respects with the antitrust laws.
◆ All participants in FMI meetings and events are expected to comply with applicable
antitrust and competition laws.
◆ Avoid discussions of sensitive topics that can create antitrust concerns.
▪ Agreements to fix prices, allocate markets, engage in product boycotts and to refuse to deal with third
parties are illegal.
▪ Discussions of prices (including elements of prices such as allowances and credit terms), quality ratings
of suppliers, and discussions that may cause a competitor to cease purchasing from a particular
supplier, or selling to a particular customer, should be avoided.
▪ No discussion that might be interpreted as a dividing up of territories.
◆ It is important to avoid even the appearance of unlawful activity.
◆ Questions or concerns? Please consult with FMI staff.
This presentation and any opinions expressed
therein are not created, sponsored or endorsed by
FMI – The Food Industry Association

www.fmi.org 4
Reminder
If you registered for this webinar, you will receive a link to this recorded presentation by e-mail in 2-3 days, including the Q&A.

March 3, 2021
BRIGHT LIGHTS AND KEY LEARNINGS FROM 2020
Top Trends in Fresh
© 2021 Information Resources Inc. (IRI). Confidential and Proprietary. 6
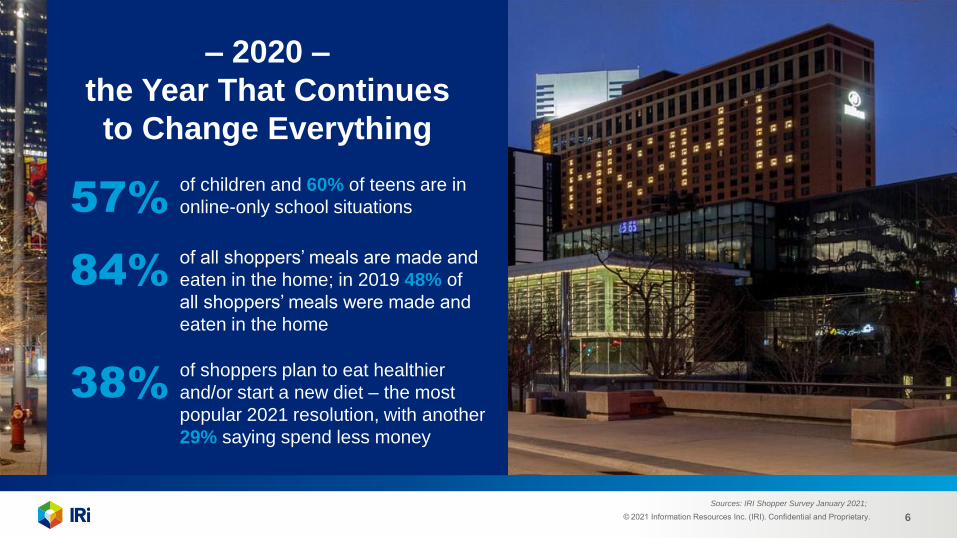
– 2020 –
the Year That Continues
to Change Everything
Sources: IRI Shopper Survey January 2021;
84%of all shoppers’ meals are made and
eaten in the home; in 2019 48% of
all shoppers’ meals were made and
eaten in the home
38%of shoppers plan to eat healthier
and/or start a new diet – the most
popular 2021 resolution, with another
29% saying spend less money
57%of children and 60% of teens are in
online-only school situations
© 2021 Information Resources Inc. (IRI). Confidential and Proprietary. 7
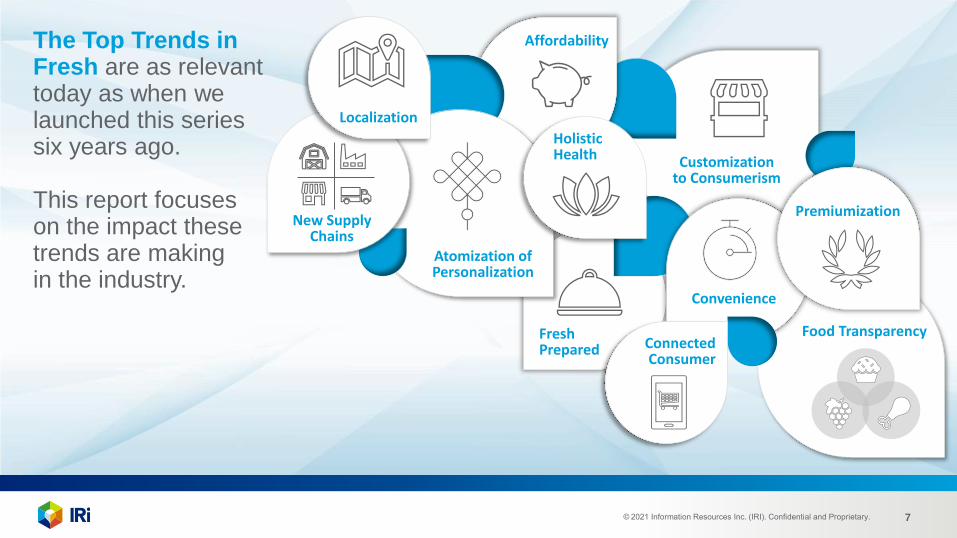
The Top Trends in Fresh are as relevant today as when we launched this series six years ago.
This report focuses on the impact these trends are making in the industry.
New Supply Chains
Localization
Affordability
Customization to Consumerism
Premiumization
Fresh Prepared
Food Transparency
HolisticHealth
Convenience
Atomization of Personalization
Connected Consumer

© 2021 Information Resources Inc. (IRI). Confidential and Proprietary. 8
7.0%
38.5%
54.4%
Adult Beverages
Fresh Foods Grocery, Frozen, RFG/Dairy
Share of Incremental Dollars Sold vs. 2019
8% 34% 58%
Dollar Sales % Change
(Sorted Top to Bottom by Total $ Sales)
Calendar Year 2020
Fresh Remains Important; However, COVID-19
Drove Grocery and Frozen 2020 Sales Higher
Source: IRI Integrated Fresh Market Advantage, including both fixed and random weight,52 weeks ending 12-27-20
Dollar Share, 2020
General Food 13.7%
Meat 19.2%
Beverages 12.1%
Refrigerated 14.0%
Produce 11.4%
Frozen 21.8%
Liquor 16.6%
Deli 1.8%
Bakery 6.2%
Seafood 25.7%
© 2021 Information Resources Inc. (IRI). Confidential and Proprietary. 9
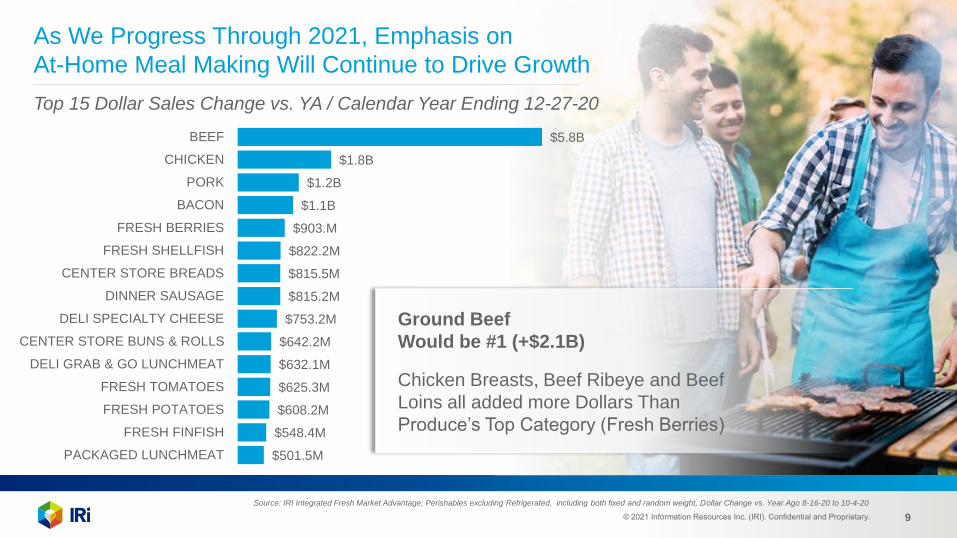
As We Progress Through 2021, Emphasis on
At-Home Meal Making Will Continue to Drive Growth
Top 15 Dollar Sales Change vs. YA / Calendar Year Ending 12-27-20
Source: IRI Integrated Fresh Market Advantage, Perishables excluding Refrigerated, including both fixed and random weight, Dollar Change vs. Year Ago 8-16-20 to 10-4-20
$501.5M
$548.4M
$608.2M
$625.3M
$632.1M
$642.2M
$753.2M
$815.2M
$815.5M
$822.2M
$903.M
$1.1B
$1.2B
$1.8B
$5.8B
PACKAGED LUNCHMEAT
FRESH FINFISH
FRESH POTATOES
FRESH TOMATOES
DELI GRAB & GO LUNCHMEAT
CENTER STORE BUNS & ROLLS
DELI SPECIALTY CHEESE
DINNER SAUSAGE
CENTER STORE BREADS
FRESH SHELLFISH
FRESH BERRIES
BACON
PORK
CHICKEN
BEEF
Ground Beef
Would be #1 (+$2.1B)
Chicken Breasts, Beef Ribeye and Beef
Loins all added more Dollars Than
Produce’s Top Category (Fresh Berries)

© 2021 Information Resources Inc. (IRI). Confidential and Proprietary. 10
2020 Changed Consumers’ Mobility and the At-Home / Out-of-Home Balance; These Trends Were Drivers of Category Choices
New Supply Chains
Localization
Affordability
Customization to Consumerism
Premiumization
Fresh Prepared
Food Transparency
HolisticHealth
Convenience
Atomization of Personalization
Connected Consumer

© 2021 Information Resources Inc. (IRI). Confidential and Proprietary. 11
2020 Growth in Fresh Food Categories Was a Result of the
Variety of Roles Fresh Plays, Especially in Meal Making
Growth Levers
The amount they are
paying in each
transaction (due to
volume, units or price)
is more this year
SPENDING
Shoppers had bought
this before, but now
are buying more often
FREQUENCY
Shoppers purchased
for the first time
they had not
purchased 2019
NEW BUYERS
© 2021 Information Resources Inc. (IRI). Confidential and Proprietary. 12
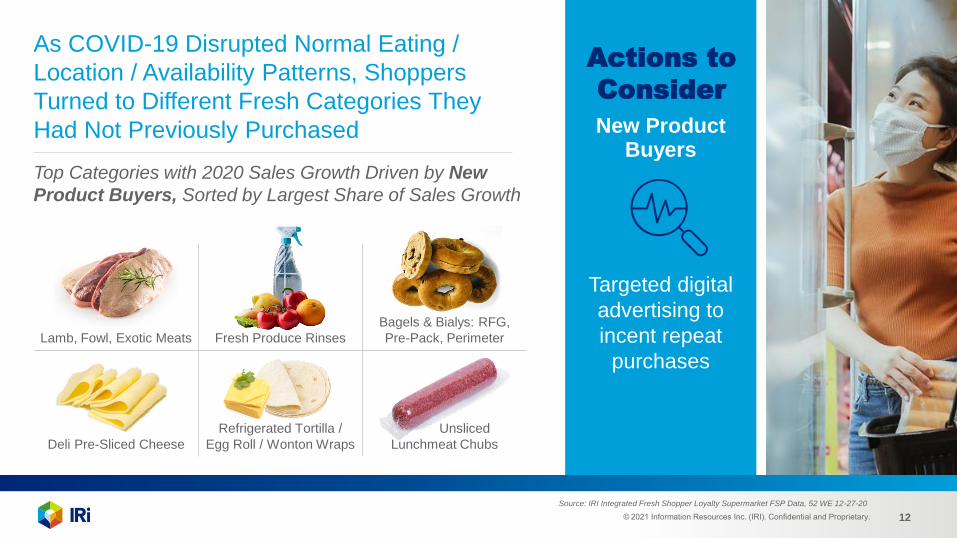
As COVID-19 Disrupted Normal Eating /
Location / Availability Patterns, Shoppers
Turned to Different Fresh Categories They
Had Not Previously Purchased
Top Categories with 2020 Sales Growth Driven by New
Product Buyers, Sorted by Largest Share of Sales Growth
Source: IRI Integrated Fresh Shopper Loyalty Supermarket FSP Data, 52 WE 12-27-20
Lamb, Fowl, Exotic Meats Fresh Produce Rinses
Bagels & Bialys: RFG,
Pre-Pack, Perimeter
Deli Pre-Sliced Cheese
Refrigerated Tortilla /
Egg Roll / Wonton Wraps
Unsliced
Lunchmeat Chubs
Actions to
Consider
Targeted digital
advertising to
incent repeat
purchases
New Product Buyers

© 2021 Information Resources Inc. (IRI). Confidential and Proprietary. 13
Drive Frequency of Fresh Purchases As a
Way to Align With the Different Roles
Perishables Play in Meal Making
Top Categories with 2020 Sales Growth Driven by
Frequency, Sorted by Largest Share of Sales Growth
Actions to
Consider
Source: IRI Integrated Fresh Shopper Loyalty Supermarket FSP Data, 52 WE 12-27-20
Out-of-store promotions to
win trips; bright, well-stocked
displays in high traffic areas to
incent even more trip frequency
Fresh Salads, Leafy
Greens (Pkgd, Bulk, etc.)
Fresh Cruciferous
Vegetables (Broccoli,
Cauliflower, etc.)
Fresh Tropical and
Specialty Fruit
Aisle, Packaged
English Muffins
Aisle, Packaged
Buns and Rolls
Fresh Snacking /
Salad Vegetables
Frequency

© 2021 Information Resources Inc. (IRI). Confidential and Proprietary. 14
As You Increase Trips, Then Promote in
Ways to Increase Spend as Well
Top Categories with 2020 Sales Growth Driven by
Spending, Sorted by Largest Share of Sales Growth
Actions to
Consider
Source: IRI Integrated Fresh Shopper Loyalty Supermarket FSP Data, 52 WE 12-27-20
Meat Department
Meals and Side
Dishes
Perimeter
Pastries / Danish /
Coffee Cakes
Fresh Stone Fruit Refrigerated Condiments Perimeter Bagels
In-Aisle Packaged Breads Fresh Chicken
Price promotions of these pandemic
era staples can sway shoppers between stores;
utilize TPR, feature as well as online
e-commerce deals
Spending

© 2021 Information Resources Inc. (IRI). Confidential and Proprietary. 15
Targeted digital advertising
to incent repeat
How are retailers capitalizing on the growth in fresh foods during 2020?
Price promotions
on staples to build
market share; utilize
TPR, feature & online
e-commerce deals
SPENDING
Out-of-store
promotions to win trips;
displays in high traffic
areas to incent even
more trip frequency
FREQUENCYNEW BUYERS
Discussion Question:
Growth Levers and Actions to Consider

© 2021 Information Resources Inc. (IRI). Confidential and Proprietary. 16
These Top Trends are Also Changing the Fresh Foods Retail Landscape
New Supply Chains
Localization
Affordability
Customization to Consumerism
Premiumization
Fresh Prepared
Food Transparency
HolisticHealth
Convenience
Atomization of Personalization
Connected Consumer

© 2021 Information Resources Inc. (IRI). Confidential and Proprietary. 17
29.9average minutes in the store; down >5 minutes
pre-pandemic Fresh Foods
(FW / RW) Channels Share
CY 2019
CY 2020
Share Change
% $ Change
Traditional
Grocery41.5% 42.0% 0.5pts 12.6%
Mass &
Supercenter15.5% 15.1% -0.4pts 8.4%
Club 9.8% 10.6% 0.8pts 20.4%
Discount
Grocery8.0% 7.8% -0.3pts 7.7%
Health/Specialty
Grocery4.0% 3.5% -0.5pts -2.5%
Dollar 0.5% 0.4% 0.0pts 6.9%
Unlike Earlier in the Pandemic, Fresh
Trip Frequency and Channel Share Are
Similar to YA, But Store Trips Are About
In/Out and Stock-Up On the Essentials
Sources: IRI Shopper Survey January 2021; IRI Household Panel data including FW/RW
flattrips to any outlet
change 4 WE 1/24/21
14%avg basket size with fresh,
change 4 WE 1/24/21

© 2021 Information Resources Inc. (IRI). Confidential and Proprietary. 18
E-Commerce Has Also Made Massive
Impact – Opening Fresh Opportunities
Shopper Demand for Online Groceries Has Fast-
Forwarded into 2025, Especially for Perishables
Source: IRI eMarket Insights CY 2020 and IRI Shopper Survey, Wave 24 January 2021
16%of households use online as their
primary way to buy groceries
throughout the Pandemic
81%of online grocery shoppers expect to
do this more or about the same even
after vaccinated or restrictions lifted
$9B2020 Fresh Foods eCommerce Sales
87%Fresh Foods 2020 eCommerce sales
growth, 10 points higher than center
and frozen foods/beverages

© 2021 Information Resources Inc. (IRI). Confidential and Proprietary. 19
Shoppers Seek Fresh Foods Differently Online than in Other
Foods and Non-Foods with Retailers’ Websites Driving 6 of 10 Orders
Filter: Dollar Sales
10%20%
30%
53% 34% 8%
7%
4%
2%
4%
27%
42%
59%
Total Store- Food & Non-Edibles
Center & Frozen Food Perishables (eCommerceTracked)
Total Brick&Mortar Site
Total Brick&Mortar Specialty Site
Total Online Specialty
Total Online Multi-Category
Total Delivery
Source: IRI eMarket Insights CY 2020
of Fresh B&M
eCommerce
Sales
84% is Pick-up at
Retailer
and 16%Retailer Delivery

© 2021 Information Resources Inc. (IRI). Confidential and Proprietary. 20
7.8 7.7
9.08.3
9.010.0
12.513.0
14.0 14.213.4 13.6
12.613.2
12.5
14.2
7.2 7.57.9
7.57.9
8.9
13.314.2
12.7 12.612.1 11.9 11.8 12.2 12.2
13.0
SNAP Households Non-SNAP Households
As the SNAP Online Pilot Became Available, More
SNAP Households Started to Shop Online, and
Fresh Offering Is More Crucial Than Ever
% HHs Purchasing Food & Beverage on the Internet / Total U.S.
Source: IRI Consumer Network™, Total U.S. – Internet 4 WE Feb 23,2020- 4 WE Dec 27,2020

© 2021 Information Resources Inc. (IRI). Confidential and Proprietary. 21
12% of the total F&B Spend, and
13% of total U.S. population
SNAP Recipients Represent
3% more trips* than
total population
A SNAP Shopper on Average Makes
36% of SNAP shoppers’ annual
food and beverage spend
Fresh Foods (ex. Dairy) Account for
SNAP Households Purchase $77B of Total Food & Beverage Annually,
and Typically Shop More Frequently Across a Variety of Channels
SNAP
Non-SNAP
SNAP Recipients F&B Generated Dollars*
12.4%$77B
Source: IRI Consumer Network™, Total US – All Outlets, 26 WE 12/27/20 / *Total F&B excludes Produce, Deli, Bakery / 52 WE 12/27/20 /.

© 2021 Information Resources Inc. (IRI). Confidential and Proprietary. 22
MEAT PRODUCE DELI BAKERY SEAFOOD
Pork Ingredient
Cuts
Specialty Root Veg
& Cooking GreensSandwiches
Center Store
Sweet Rolls
Fresh
Crab
Chicken Wings
& LegsMangoes
Deli Entrees
(esp. Chicken)
Perimeter
Sheet Cakes
Fresh
Pollock
Meat Cheese
Cracker Kits
Fresh Mixed
Veg Pkgs
Meat /
Cheese Tray
Bakery
Cupcakes
Fresh
Catfish
Within Each Fresh Department, SNAP Shoppers Gravitate Towards
Key Categories with Meal Making, Convenience and Comfort Top of Mind
SNAP Recipient 2020 Top Indexed Fresh Categories by Share of Dept. Spend, Compared to Non-SNAP
Source: IRI Integrated Fresh Shopper Loyalty Supermarket FSP data, 52 weeks ending 12-27-20, full list in appendix

© 2021 Information Resources Inc. (IRI). Confidential and Proprietary. 23
Despite 2020’s Changes, the Top Trends in Fresh Still Guide Consumers
New Supply Chains
Localization
Affordability
Customization to Consumerism
Premiumization
Fresh Prepared
Food Transparency
HolisticHealth
Convenience
Atomization of Personalization
Connected Consumer

© 2021 Information Resources Inc. (IRI). Confidential and Proprietary. 24
Ideas to Guide the Future of Fresh
© 2021 Information Resources Inc. (IRI). Confidential and Proprietary. 25
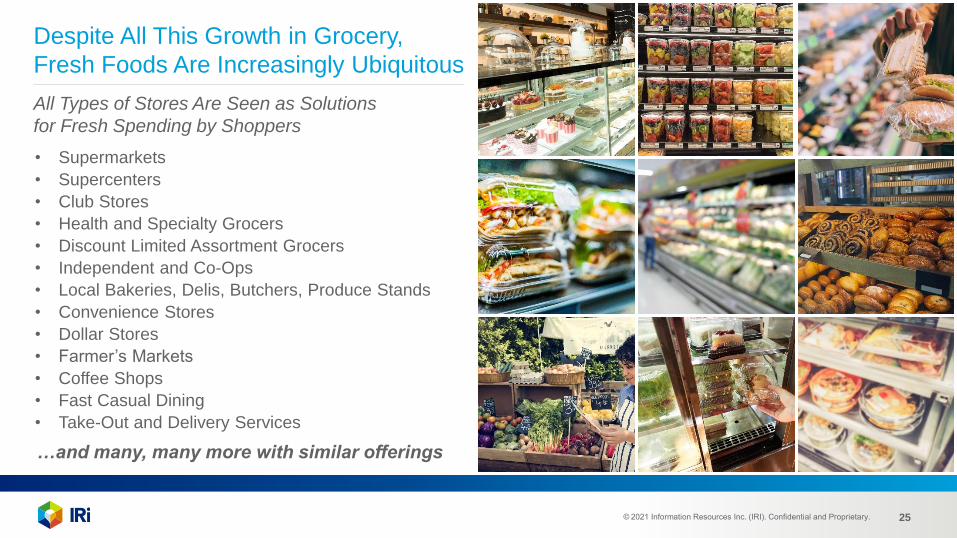
Despite All This Growth in Grocery,
Fresh Foods Are Increasingly Ubiquitous
All Types of Stores Are Seen as Solutions
for Fresh Spending by Shoppers
• Supermarkets
• Supercenters
• Club Stores
• Health and Specialty Grocers
• Discount Limited Assortment Grocers
• Independent and Co-Ops
• Local Bakeries, Delis, Butchers, Produce Stands
• Convenience Stores
• Dollar Stores
• Farmer’s Markets
• Coffee Shops
• Fast Casual Dining
• Take-Out and Delivery Services
…and many, many more with similar offerings

© 2021 Information Resources Inc. (IRI). Confidential and Proprietary. 26
So How Can Your Store or Product Win When Fresh is Everywhere?
Leveraging Fresh Uniquely,
Anchored in What
Consumers Want and Need
© 2021 Information Resources Inc. (IRI). Confidential and Proprietary. 27
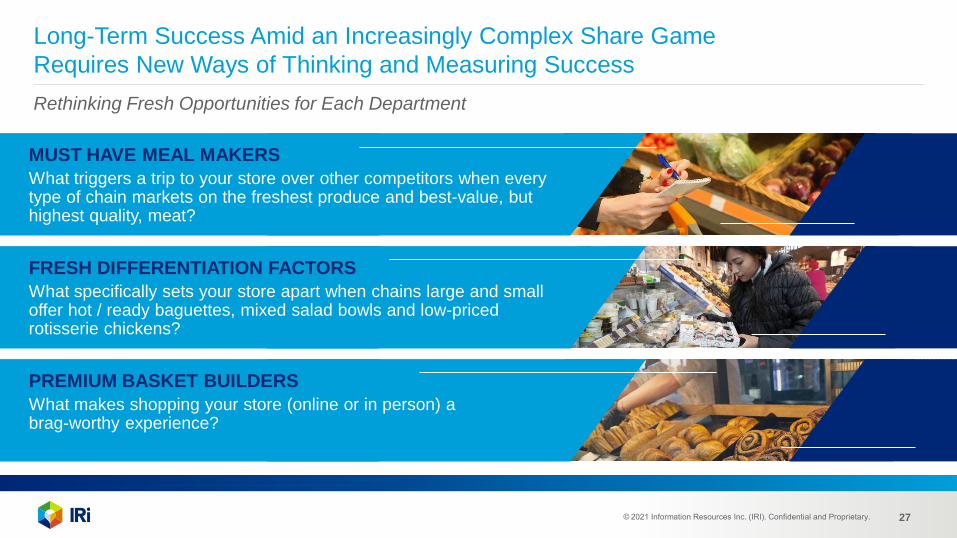
Long-Term Success Amid an Increasingly Complex Share Game
Requires New Ways of Thinking and Measuring Success
Rethinking Fresh Opportunities for Each Department
MUST HAVE MEAL MAKERS
What triggers a trip to your store over other competitors when every type of chain markets on the freshest produce and best-value, but highest quality, meat?
FRESH DIFFERENTIATION FACTORS
What specifically sets your store apart when chains large and small offer hot / ready baguettes, mixed salad bowls and low-priced rotisserie chickens?
PREMIUM BASKET BUILDERS
What makes shopping your store (online or in person) a brag-worthy experience?
© 2021 Information Resources Inc. (IRI). Confidential and Proprietary. 28
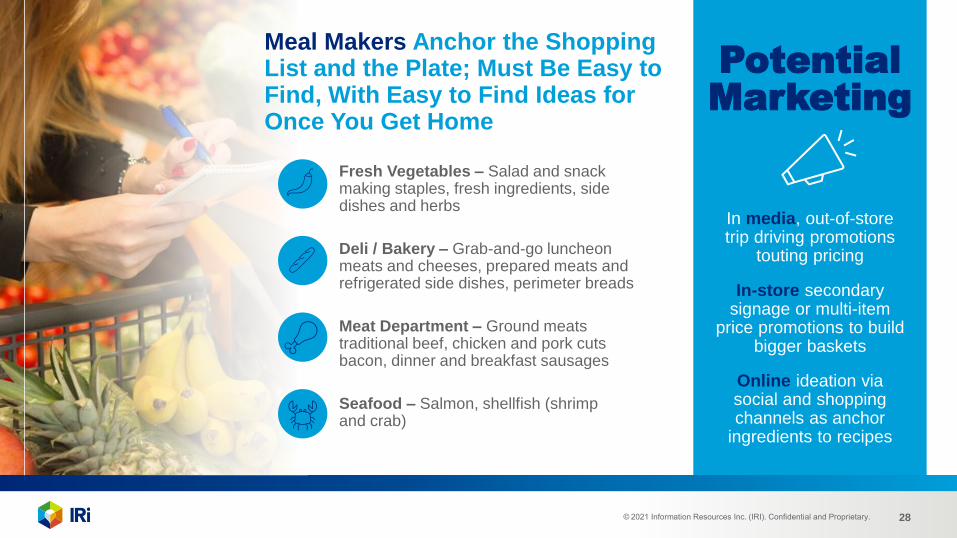
Meal Makers Anchor the Shopping List and the Plate; Must Be Easy to Find, With Easy to Find Ideas for Once You Get Home
Potential Marketing
In media, out-of-store trip driving promotions
touting pricing
In-store secondary signage or multi-item
price promotions to build bigger baskets
Online ideation via social and shopping channels as anchor
ingredients to recipes
Fresh Vegetables – Salad and snack making staples, fresh ingredients, side dishes and herbs
Deli / Bakery – Grab-and-go luncheon meats and cheeses, prepared meats and refrigerated side dishes, perimeter breads
Meat Department – Ground meatstraditional beef, chicken and pork cutsbacon, dinner and breakfast sausages
Seafood – Salmon, shellfish (shrimp and crab)
© 2021 Information Resources Inc. (IRI). Confidential and Proprietary. 29
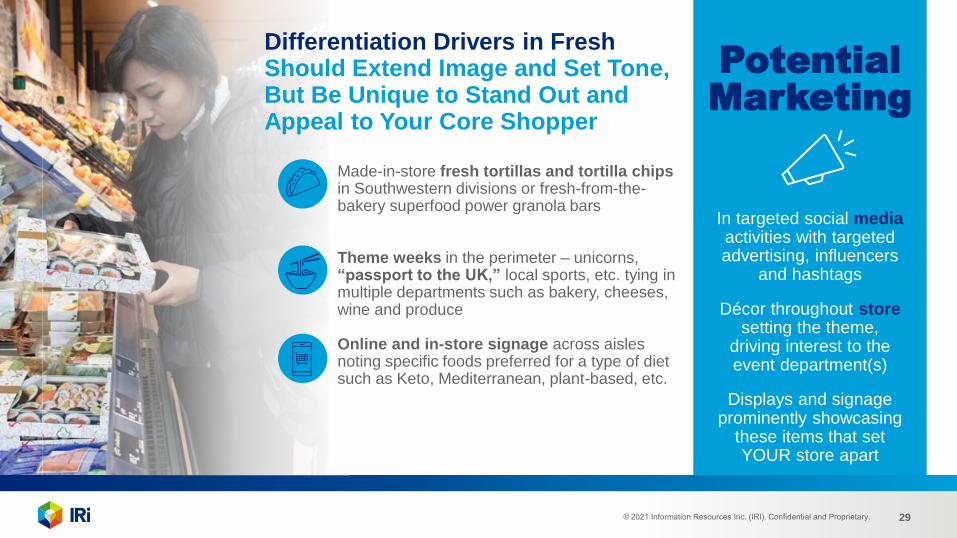
Differentiation Drivers in Fresh Should Extend Image and Set Tone, But Be Unique to Stand Out and Appeal to Your Core Shopper
Potential Marketing
In targeted social mediaactivities with targeted advertising, influencers
and hashtags
Décor throughout storesetting the theme,
driving interest to the event department(s)
Displays and signage prominently showcasing
these items that set YOUR store apart
Made-in-store fresh tortillas and tortilla chips in Southwestern divisions or fresh-from-the-bakery superfood power granola bars
Theme weeks in the perimeter – unicorns, “passport to the UK,” local sports, etc. tying in multiple departments such as bakery, cheeses, wine and produce
Online and in-store signage across aisles noting specific foods preferred for a type of diet such as Keto, Mediterranean, plant-based, etc.

© 2021 Information Resources Inc. (IRI). Confidential and Proprietary. 30
Set Yourself Apart by Using Fresh Premium Experiences in Impulse-Driving Ways Added to Perishables and Center-Store Staples
Potential Marketing
In media, out-of-store by telling your story –
why you carry, how they got to your store
In-store secondary promotions –
buy this, try that
Online shopping suggestions as basket builders that correlate
with staple foods
Wide variety of types and sizes of berries “limited time only” seasonal fruit like winter citrus, summer melons, cherries
Specialty cheese programs and charcuterie board-ready sliced meats – with assistance or in-store signage to help pair with meals and activities
Restaurant-quality steaks, roasts recipe-based meal kit programs / claim-based programs (if aligned with your shopper)
Cart-stopping WOW factor baked goods in variety of “event” sizes from one to a small group to a celebration

© 2021 Information Resources Inc. (IRI). Confidential and Proprietary. 31
Discussion Questions:
The Future of Fresh
1 | Which fresh foods might
be overlooked for their power,
especially during the pandemic?
2 | With the increase in eCommerce, what
recommendations do you have for
retailers to communicate fresh foods
to their shoppers?
© 2021 Information Resources Inc. (IRI). Confidential and Proprietary. 32
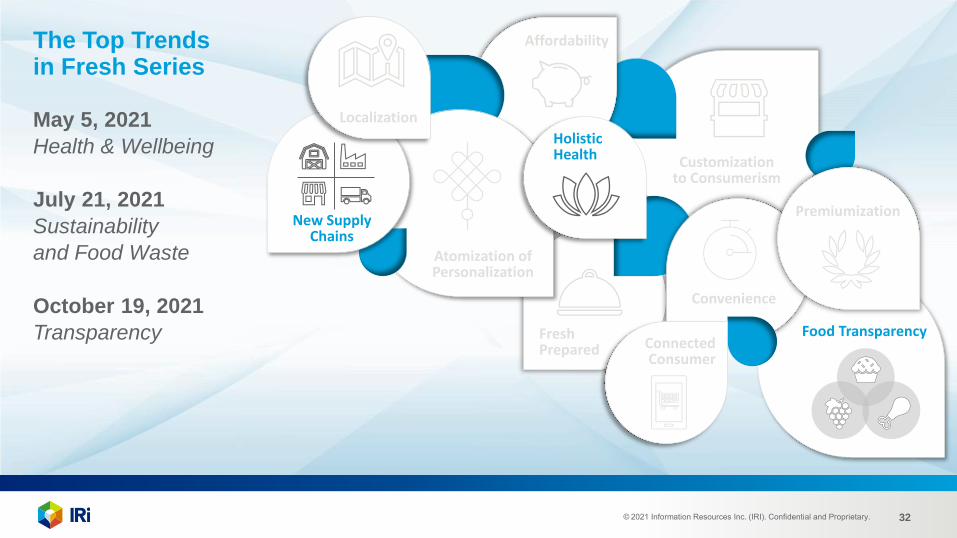
The Top Trends in Fresh Series
May 5, 2021
Health & Wellbeing
July 21, 2021
Sustainability
and Food Waste
October 19, 2021
Transparency
New Supply Chains
Localization
Affordability
Customization to Consumerism
Premiumization
Fresh Prepared
HolisticHealth
Convenience
Atomization of Personalization
Connected Consumer
Food Transparency

© 2021 Information Resources Inc. (IRI). Confidential and Proprietary. 33
xxx

© 2021 Information Resources Inc. (IRI). Confidential and Proprietary. 34
Your feedback is important.
Please complete a brief survey
so we can continue to improve.

© 2021 Information Resources Inc. (IRI). Confidential and Proprietary. 35
Mark Clouse
President and CEO, Campbell Soup Company
November 10, 2020
Stuart Aitken
Chief Merchant & Marketing Officer, The Kroger Co.
September 3, 2020
Vivek Sankaran
President & CEO, Albertsons Companies
August 25, 2020

© 2021 Information Resources Inc. (IRI). Confidential and Proprietary. 36
IRI’s Latest CPG and Retail Insights Reports to Manage
the Impact of COVID-19 (click to see full report)
The Changing Shape of the CPG Demand Curve
Discovering Pockets of Demand
COVID-19 Emerging Point of View
Recession Proof Your Business
IRI COVID-19 Impact Assessment Reports
13. America Is Ready for Football
12. Revenue Management
Opportunities in a Pandemic
11. Home for the Holidays
10. Powering the Future of
Convenience Retail
9. Reignite In-Store
Merchandising in Grocery
8. SNAP Benefits
7. U.S. CPG Growth Leaders
6. E-Commerce
5. Boomers
4. A Global Perspective
3. Tracking Transformation
2. Meat and Millennials
1. Anticipate the Future
3. Innovation for a Post-
Pandemic World
2. Harness Growth in 2021
1. The Premium Opportunity
5. COVID-19 Vaccine Update:
Impact on CPG Industry
4. Anticipated Vaccine Adoption &
Impact on the CPG Industry
3. Potential Impact of Reduced
Unemployment Benefit
Changes on F&B Spending
2. Consumer Stimulus,
Unemployment Benefit
Spending & Shopping Behavior
1. The Impact of a Second Round
of Stimulus on the CPG
Demand Curve
7. Defending and Recapturing
the Shelf
6. Innovation Lessons from the
Great Recession to Apply
Today
5. Building Brands During
Recessionary Times
4. Recessionary Lessons to
Apply to Private Label Today
3. How Big Brands Performed
During the Great Recession
2. Maintaining Pricing Discipline
During a Recession
1. How the Great Recession
Reshaped CPG Demand Curve
5. Anticipating Life After
COVID-19
4. Consumers Provide a
Pessimistic View of Coming
Months
3. Tracking the Dramatic Pivot
of U.S. Consumer and
Shopper Behavior
2. Then and Now: Consumer
CPG Behavior During
Economic Downturns
1. COVID-19: Impact on CPG
and Retail

© 2021 Information Resources Inc. (IRI). Confidential and Proprietary. 37
The IRI CPG Demand Index™ provides a standard metric for tracking changes in spending on consumer packaged goods.
U.S. Demand Index™ Forecasts are delivered through a proprietary, fully automated forecasting solution that anticipates consumer demand.
Channel Shift Index™ provides a standard metric for tracking changes (migration) in spending on consumer packaged goods across select channels.
The IRI E-Commerce Demand Index™ provides a standard metric for tracking changes in spending on consumer packaged goods purchased online.
Inflation Tracker™ provides the well-known price per unit metric for tracking changes in pricing of consumer packaged goods.
Supply Index™ provides a standard metric for tracking changes in product availability (i.e., in-stock rates) in stores for consumer packaged goods.
Out-of-Stock Levels for Top-Selling Subcategories by Market Area in the U.S.
Top U.S. Topics from IRI Social Pulse™
CPG Economic IndicatorsAccess IRI’s industry-standard metrics for consumer product demand and supply during the pandemic, our CPG inflation tracker and the latest data on category trends, out-of-stock levels, consumer sentiment and more.
Demand Index™ U.S. Demand
Index™ Forecasts
Channel Shift
Index™
E-Commerce
Demand Index™
Inflation
Tracker™ Supply Index™ Out-of-Stock Levels
for Subcategories
U.S. Topics from
IRI Social Pulse™

© 2021 Information Resources Inc. (IRI). Confidential and Proprietary. 38
Want to Be the First to Know?
Registered Users Get New Thought Leadership
from IRI’s Research, Data & Analytics Experts
www.iriworldwide.com/en-US/Insights/Subscribe

© 2021 Information Resources Inc. (IRI). Confidential and Proprietary. 39
Sally Lyons Wyatt
Jonna Parker

© 2021 Information Resources Inc. (IRI). Confidential and Proprietary. 40© 2021 Information Resources Inc. (IRI).
Confidential and Proprietary. 40
CONTACT US FOR MORE
INFORMATION
IRI Global Headquarters
203 N. LaSalle St., Suite 1500
Chicago, IL 60601
+1 312.726.1221
Follow IRI on Twitter: @IRIworldwide