to the graduate school: on june 19, 2008. · to the graduate school: ... were studied in the...
TRANSCRIPT

To the Graduate School:
The members of the Committee approve the thesis of Scott A. Becker presented
on June 19, 2008.
_______________________________ Wayne A. Hubert, Co-Chairman
_______________________________ Matthew J. Kauffman, Co-Chairman
_______________________________ Thomas L. Thurow
_______________________________ Frederick G. Lindzey
_______________________________ Charles R. Anderson
APPROVED:
_________________________________________________________________________ Frank J. Rahel, Head, Department of Zoology and Physiology
_________________________________________________________________________ Don Roth, Dean, The Graduate School

1
Becker, Scott A., Habitat selection, condition, and survival of Shiras moose in northwest Wyoming, M.S., Department of Zoology and Physiology, December, 2008.
Seasonal movements, habitat selection, physiological health, and demography of
Shiras moose (Alces alces shirasi) were studied in the Jackson Valley of northwest
Wyoming. Moose congregated on low-elevation ranges during winter and migrated to
more dispersed, mid-elevation ranges during summer. Moose selected winter habitat
dominated by deciduous shrubs, whereas they selected summer habitat that was more
variable. Blood parameters indicated that moose were in moderate physical condition.
Ultrasonic rump fat measurements were relatively high, but there were indications of
nutritional deficiencies. Diseases and parasites appeared to have minimal population-
level effects. Population modeling suggested that the moose population was more likely
to be declining than stable or increasing and the population growth rate was influenced
primarily by late-winter and early-spring adult female mortality. Pregnancy rates were
high, but calf production was relatively low. Neonate and annual calf survival were
relatively high. Habitat quality appeared to be the primary factor limiting population
growth while the effects of predation appeared to be less important.

HABITAT SELECTION, CONDITION, AND SURVIVAL OF SHIRAS MOOSE IN NORTHWEST WYOMING
by Scott A. Becker
A thesis submitted to the Department of Zoology and Physiology and the Graduate School of the University of Wyoming
in partial fulfillment of the requirements for the degree of
MASTER OF SCIENCE in
ZOOLOGY AND PHYSIOLOGY
Laramie, Wyoming December 2008

DEDICATION
Dedicated to the memory of:
Stanley H. Anderson
1939 – 2005
ii

ACKNOWLEDGMENTS
A project of this magnitude could not have been accomplished alone and the
support of many individuals from numerous agencies was vital to its success. I am
forever grateful to my original graduate advisor, the late Stanley H. Anderson, for his
belief in my abilities to accomplish this task and for providing me the opportunity to
study a fascinating critter, the moose. Although I was not a “fish-head,” I cannot thank
Wayne Hubert enough for the guidance and support he provided as my committee co-
chair during the later stages of this project. I also thank Matt Kauffman who arrived half-
way through this project, but stepped in and admirably provided much needed guidance
as my committee co-chair. I would also like to thank my three remaining committee
members, Frederick Lindzey, Charles Anderson, and Thomas Thurow, for stimulating
discussions and the support they provided throughout. The assistance and guidance
offered by Mandi Larson and Linda Ohler helped keep me in-line and prevented me from
missing deadlines. This project would not have been possible without funding and
support provided by the Teton County Conservation District, Wyoming Animal Damage
Management Board, Wyoming Department of Transportation, Wyoming Game and Fish
Department, and the Wyoming Governor’s Big Game License Coalition/Wildlife
Heritage Foundation of Wyoming.
There are many other individuals from all walks of life who have contributed a
great deal of time and effort to this project. I thank Doug Brimeyer for recognizing the
necessity of this research and securing much needed funding. Without his determination,
the Jackson moose project would never have materialized. Steve Kilpatrick and Sarah
Dewey continually provided more than their share of field assistance. I am grateful to
iii

Terry Kreeger who hung out of the helicopter when it was -30°F to dart moose. I extend
my sincerest gratitude to the pilots: Gary Lust (retired) of Mountain Air Research, Dave
(and Nora and Ashes) Savage of Savage Air Services, and Dave Stinson of Sky Aviation.
Without their skills and abilities in the air, I would not have been able to accomplish half
of what I set out to do. Trent McDonald, Ryan Nielson, and Hall Sawyer of Western
Ecosystems Technology provided a great deal of assistance with habitat selection
techniques. Without their help, I would probably still be trying to figure out R-code.
Cody Beers and Michael Patritch of the Wyoming Department of Transportation
provided needed data, support, assistance, and were always available to answer questions.
The Triangle X Ranch and the many landowners in the Buffalo Valley deserve
special recognition. I thank Mark Gocke for all the great photos, Bill Long and Tim
Fuchs for hopping in the helicopter during spring and summer surveys, Dave Moody and
Dan Bjornlie for field assistance and additional funding, Judy and Larry Robinson for
help with housing and captures, Hank Edwards and Todd Cornish for assistance with
biological samples and for entertaining my physiology questions, Jeff Beck for assistance
with survival analyses, Steve Prager and Eli Rodemaker for GIS assistance, Theo Schuff
for ultrasound assistance, Tom Laurion and Kathy Firchow for bringing the mules and
horses over the pass so we could chase some moose in the back-country, Harold and
Loretta Lemons for the dinners and the long hours of conversation in the Blackrock lot,
and Doug and Peggy Sobey for field assistance. Although I cannot mention everyone
individually, a huge thank you goes out to the many Wyoming Game and Fish
Department, Grand Teton National Park, Bridger-Teton National Forest, U.S. Fish and
Wildlife Service, and Beringia South personnel who assisted with moose captures and
iv

many other aspects of this study. Frequent discussions with Chuck Schwartz, Tom
Lohuis, Eric Wald, and moose biologists throughout North America were helpful and
thought-provoking. A very special thank you goes out to Hank and Mary Ann Harlow
for the many moose expeditions we partook in, for assistance with navigating the
University of Wyoming library, and for the many BBQs and beverages shared at the
AMK Ranch. I also thank my fellow graduate students for helping me remain sane
throughout this endeavor.
I extend a heartfelt thanks to my parents, Ken and Ann Becker, for their constant
encouragement and support. It took a while, but I have finally landed a job with
“benefits!!” I thank my dog, Tuff, for being patient with me during the writing process –
I promise I will take you for a run in the hills again! Finally, I would like to extend my
sincerest gratitude to Andrea Barbknecht. When I thought I would never be able to get
this completed, her constant encouragement helped me through. Andrea stuck by me
through thick and thin and, for that, I will be forever grateful.
v

TABLE OF CONTENTS
LIST OF TABLES ......................................................................................................... viii LIST OF FIGURES ......................................................................................................... ix LIST OF APPENDICES ................................................................................................ xii CHAPTER 1. GENERAL INTRODUCTION..............................................................1
Research Goals and Objectives...................................................................................5 Thesis Organization ....................................................................................................6 Literature Cited ...........................................................................................................7
CHAPTER 2. SEASONAL MOVEMENTS AND HABITAT SELECTION OF
ADULT FEMALE SHIRAS MOOSE IN NORTHWEST WYOMING ...........................................................................................11
Introduction...............................................................................................................11 Study Area ................................................................................................................14 Methods.....................................................................................................................16 Results.......................................................................................................................23 Discussion.................................................................................................................29 Management Implications.........................................................................................36 Literature Cited .........................................................................................................39
CHAPTER 3. PHYSIOLOGICAL HEALTH ASSESSMENT OF ADULT
FEMALE SHIRAS MOOSE IN NORTHWEST WYOMING.........70
Introduction...............................................................................................................70 Study Area ................................................................................................................73 Methods.....................................................................................................................74 Results.......................................................................................................................78 Discussion.................................................................................................................82 Management Implications.........................................................................................90 Literature Cited .........................................................................................................92
CHAPTER 4. THE DYNAMICS OF A SHIRAS MOOSE POPULATION IN A
MULTIPLE PREDATOR AND PREY ECOSYSTEM IN NORTHWEST WYOMING..............................................................113
Introduction.............................................................................................................113 Study Area ..............................................................................................................116 Methods...................................................................................................................118 Results.....................................................................................................................125
vi

Discussion...............................................................................................................132 Management Implications.......................................................................................142 Literature Cited .......................................................................................................144
CHAPTER 5. GENERAL CONCLUSIONS ............................................................168
Summary .................................................................................................................168 Management Implications.......................................................................................171 Future Research ......................................................................................................173 Literature Cited .......................................................................................................176
vii

LIST OF TABLES
Table 2.1. Coefficients for population-level resource selection probability function models of GPS-collared adult female moose winter and summer habitat selection in northwest Wyoming. Variables are in the order that they entered during the winter model-building process........................................51
Table 3.1. Reference values used in application of the animal indicator concept for
Shiras moose in northwest Wyoming .........................................................101 Table 3.2. Count (n), mean ( x ) standard error (SE), and 95% confidence
intervals (CI) for rump fat depth and body condition scores (BCS) by year for adult female moose captured in northwest Wyoming during winter 2005-2007. .......................................................................................102
±
Table 3.3. Mean standard deviation for hematological analyses of adult female
moose captured in northwest Wyoming during winter 2005-2007 ............103 ±
Table 3.4. Mean standard deviation for serum chemical analyses of adult female
moose captured in northwest Wyoming during winter 2005-2007 ............104 ±
Table 3.5. Total moose sampled (n), range, and the proportion of the sample that
was below the reference value for moose considered to be in average to above average condition for five blood parameters used for condition assessment...................................................................................................106
Table 3.6. Annual mean standard deviation, published deficiency levels, and the
proportion of sampled adult female moose that were deficient in macro- and micronutrients analyzed in serum and hair from northwest Wyoming during winter 2005-2007. No published deficiency levels are reported for barium, chromium, and lead..................................................................107
±
Table 4.1. Number of moose sampled (n), mean rate ( x ), and 95% confidence
intervals (95% CI) for adult female moose reproductive parameters and calf moose survival in northwest Wyoming, biological years 2004-2006.............................................................................................................156
Table 4.2. Adult annual (i.e., biological year [BY]) and study period (i.e., total)
survival rates and 95% confidence intervals (CI) estimated using the Kaplan-Meier staggered entry design for radio-collared female and male Shiras moose in northwest Wyoming. Male BY 2004 included February, March, April, and May only and was not an estimate for the entire BY. Male survival rates were estimated separately with harvest included and harvest censored in BY 2005 and BY 2006 ..........................157
viii

LIST OF FIGURES
Figure 1.1. Jackson moose herd unit (A) population trend counts and (B) calf-cow ratios compiled from the Wyoming Game and Fish Department Jackson region big game herd unit reports, 1975-2007..............................................10
Figure 2.1. Mean 90% LoCoH home range size (km2) standard error by season
for GPS-collared adult female moose in northwest Wyoming .....................52 ±
Figure 2.2. Location of major migration routes to and from the 4 identified summer
range complexes for GPS-collared adult female moose in northwest Wyoming (2005-2006). Migration routes shown that do not lead to one of the summer range complexes were individuals that used separate summer ranges. The Lava Creek summer range is depicted by the black square and migration routes were not included for moose that used this area because the distance traveled was short. GTNP: Grand Teton National Park; BTNF: Bridger-Teton National Forest .................................53
Figure 2.3. Scatterplot of the onset of spring migration (Julian date) against the
mean elevation of summer range (m) for individual GPS-collared adult female moose in northwest Wyoming during spring 2006...........................54
Figure 2.4. Winter habitat selection study area defined by the movement and
distribution of GPS-collared adult female moose in northwest Wyoming, 2005-2007 .....................................................................................................55
Figure 2.5. Predicted probabilities and associated categories of winter habitat use for
adult female moose in northwest Wyoming, 2005-2007..............................56 Figure 2.6. Summer habitat selection study area defined by the movement and
distribution of GPS-collared adult female moose in northwest Wyoming, summer 2005-2006 .......................................................................................57
Figure 2.7. Predicted probabilities and associated categories of summer habitat use
for adult female moose in northwest Wyoming, 2005-2006 ........................58 Figure 3.1. Scatterplot describing the relationship between rump fat depth (mm) and
aspartate aminotransferase (U/l) concentrations of captured adult female moose in northwest Wyoming, winter 2005-2007 (n = 43)........................108
Figure 3.2. Scatterplot describing the relationship between rump fat depth (mm) and
lactate dehydrogenase (U/l) concentrations of captured adult female moose in northwest Wyoming, winter 2005-2007 (n = 43)........................109
ix

Figure 3.3. Scatterplot describing the relationship between rump fat depth (mm) and creatine kinase (U/l) concentrations of captured adult female moose in northwest Wyoming, winter 2005-2007 (n = 43). When the outlier was removed, this relationship became insignificant (P = 0.130) .....................110
Figure 3.4. Regression of calf presence in spring on serum Cu concentration (ppm)
for pregnant adult female moose captured in northwest Wyoming, 2005-2007. The top row represents Cu concentrations for cows observed with a calf in the spring (n = 9) and the bottom row represents Cu concentrations for cows not observed with a calf in the spring (n = 28) ....111
Figure 3.5. Regression of calf presence in spring on hair Cu concentration (ppm) for
pregnant adult female moose captured in northwest Wyoming, 2005-2007. The top row represents Cu concentrations for cows observed with a calf in the spring (n = 11) and the bottom row represents Cu concentrations for cows not observed with a calf in the spring (n = 35) ....112
Figure 4.1. Study area located in northwest Wyoming. The Buffalo Fork River is
approximately 50 km north of Jackson, Wyoming, USA. Moose hunt areas 7, 14, and 32 were closed to hunting during 2005 and 2006, but opened to limited quota, antlered harvest in 2007 ......................................159
Figure 4.2. Results of fecal progestagen regression tree analysis used to predict the
pregnancy status of adult female moose at capture in February 2007. Initial pregnancy status was determined using pregnancy-specific protein B. This cutoff value was used to determine pregnancy status of adult female moose approximately 1-2 months post-capture, but prior to parturition....................................................................................................160
Figure 4.3. Progestagen concentrations from fecal samples collected > 1 month
post-capture for handled and unhandled adult female moose in northwest Wyoming, 2006-2007. The handled sample was for moose that were pregnant at capture based on pregnancy-specific protein B while the pregnancy status of unhandled moose was estimated using the fecal progestagen cutoff value (vertical line). The top row represents female moose that were observed with calves (n = 7 handled, n = 9 unhandled) and the bottom row represents female moose that were not observed with calves (n = 14 handled, n = 3 unhandled) during spring parturition surveys ........................................................................................................161
Figure 4.4. Pooled annual survival curve and upper and lower 95% confidence
intervals (CI) by month for radio-collared adult female moose in northwest Wyoming, biological years 2004-2007. .....................................162
Figure 4.5. Cause-specific mortality by sex for radio-collared adult moose in
northwest Wyoming, February 2005 to May 2008.....................................163
x

Figure 4.6. Pooled annual survival curves and upper and lower 95% confidence intervals (CI) by month for radio-collared adult male moose when (A) harvest was censored and (B) harvest was included in survival analyses, biological years 2004-2007.........................................................................164
Figure 4.7. Schematic of female-based, Lefkovich matrix model with 3 stage classes
using the demographic data estimated (i.e., calves and adults) or assumed (i.e., yearlings) for moose in northwest Wyoming. Productivity equals the product of stage-specific survival, parturition, and fecundity for yearlings and adults...............................................................................165
Figure 4.8. The deterministic elasticity of matrix elements calculated from the
pooled vital rates from the demographic study. Adult productivity was the product of adult survival, parturition, and fecundity rates. The elasticity for yearling productivity was < 0.01 ...........................................166
Figure 4.9. Distribution and range of the finite rate of increase (λ) for Shiras moose
in northwest Wyoming, biological year 2004-2007, based on 1,000 replicates of a Leslie matrix population model with vital rates selected randomly from a binomial distribution. The middle vertical line represents the mean λ estimate. The left and right vertical lines represent the lower and upper 95% confidence intervals, respectively. .....167
xi

LIST OF APPENDICES
Appendix 2.1. Total available successful fixes, total number of fix attempts, and percent successful fixes by season and year for GPS-collared adult female moose in northwest Wyoming .......................................................59
Appendix 2.2. Total available successful fixes, total number of 3-dimensional (3D)
fixes, and percent 3D fixes by season and year for GPS-collared adult female moose in northwest Wyoming. Total available fixes for summer 2005 and 2006 differs from those in Appendix 2.1 because locations were removed from summer if a moose arrived on summer range prior to 15 June or left after 15 November to maintain a constant fix schedule of 1 fix attempt every 5 hours during the summer period ...........................................................................................61
Appendix 2.3. Mean distance moved per day (km) by year and season for GPS-
collared adult female moose in northwest Wyoming. Mean winter and summer daily distance moved were calculated by dividing the total distance moved for the season by 24 and 4.75, respectively. Total distance moved per season was estimated in ArcGIS using the Home Range Tools Extension for ArcGIS, Version 1.1 (Rodgers et al. 2007) .....................................................................................................63
Appendix 2.4. Dates of seasonal range use for GPS-collared adult female moose by
season and year in northwest Wyoming ....................................................64 Appendix 2.5. Number of relocations (n) and nearest neighbors (k) used to calculate
90% LoCoH home range (HR) size (km2) for individual GPS-collared adult female moose by season in northwest Wyoming, 2005-2007. .................................................................................................66
Appendix 2.6. Coefficients for population-level resource selection probability
function models developed from GPS-collared adult female moose in northwest Wyoming during winters 2005-2007 ....................................68
Appendix 2.7. Coefficients for population-level resource selection probability
function models developed from GPS-collared adult female moose in northwest Wyoming during summer 2005 and 2006.............................69
Appendix A. Spatial and temporal characteristics of moose highway crossings in
the Buffalo Fork Valley, Wyoming. A final report submitted to the Wyoming Department of Transportation. ..............................................179
xii

1
CHAPTER 1
GENERAL INTRODUCTION
It is generally believed the first modern moose (Alces alces) arrived in North
America from Siberia via the Bering land bridge during the last ice age 10,000–14,000
years ago (Peterson 1955, Bubenik 1997, Bowyer et al. 2003, Hundertmark et al. 2003).
With the retreat of the continental glaciers, moose began to inhabit portions of North
America once covered with ice, although the exact patterns of dispersal and speciation
are debated (Peterson 1955, Bubenik 1997, Bowyer et al. 2003, Hundertmark et al. 2003).
Nevertheless, 4 distinct subspecies of moose evolved in North America, each strongly
associated with the distribution of coniferous forests. The Eastern or Taiga moose (A.a.
Americana) occur from Ontario, Canada eastward to the Atlantic Ocean; the
Northwestern moose (A.a. andersoni) inhabit the region from western Ontario, Canada
and northern Michigan, USA to British Columbia and the Yukon Territory, Canada;
Alaskan moose (A.a. gigas) primarily inhabit Alaska, USA, but also occur in western
Yukon Territory, Canada; and Shiras moose (A.a. shirasi) inhabit the Intermountain West
along the Rocky Mountains from Colorado, USA to southern Alberta and southeastern
British Columbia, Canada (Bubenik 1997).
Few, if any, moose existed in Wyoming prior to 1850 (Houston 1968, Brimeyer
and Thomas 2004). Between 1834 and 1843, Osborne Russell traveled extensively
throughout western Wyoming and kept a detailed journal of his travels yet never
mentioned observing a moose although descriptions of other wildlife species were noted
(Haines 1955). Sporadic observations of moose occurred in northwest Wyoming after

1850 (Houston 1968), but it is believed the population did not begin to increase and
expand until after the establishment of Yellowstone National Park (YNP) in 1872
(Peterson 1955, Denniston 1956). By the late 1890s and early 1900s, observations of
moose in the Jackson Valley were on the rise (Peterson 1955). Houston (1968) believed
that a self-sustaining moose population in the Jackson Valley occurred shortly before
1912 via emigrations from YNP.
Moose management in Wyoming began shortly after moose appeared in the state
(Blair 1987). In 1882, the first hunting seasons for moose were set from 1 August
through 15 November in an attempt to protect the species from overexploitation.
However, by 1899, moose numbers were in decline so the Wyoming legislature granted
moose full protection from harvest for at least 10 years (Brimeyer and Thomas 2004). By
1912, there were an estimated 500 moose in Wyoming, predominately in the northwest
region, and populations were deemed large enough to sustain limited harvest (Brimeyer
and Thomas 2004). From that time, moose populations have continued to increase in
Wyoming and, through natural emigration or translocation, currently occupy almost all
available habitats in the state.
Concurrent with moose population expansion in northwest Wyoming was a large-
scale predator reduction program to protect livestock and game animals (Blair 1987).
During the late 1800s and early 1900s, state and federal predator removal programs
greatly reduced large carnivore populations in the state. Gray wolves (Canis lupus) were
extirpated by the 1930s (Weaver 1978, Wyoming Game and Fish Department [WGFD]
2007a) while cougar (Puma concolor) and grizzly bear (Ursus arctos) numbers were
reduced. By 1940, most grizzly bears were restricted to YNP (Blair 1987). Grizzly bears
2
were listed as “threatened” under the Endangered Species Act in 1975 (Fed. Reg. 40:145,
31734-31736) and since the early 1990s, have steadily expanded their range in the
Greater Yellowstone Ecosystem (Schwartz et al. 2006). Gray wolves were reintroduced
into YNP in 1995 and 1996 (Bangs and Fritts 1996) and were first observed in the
Jackson Valley during the winter of 1997-1998 (Smith et al. 1999). At present, cougar
populations are suspected to be increasing statewide (WGFD 2006). Although historical
data are lacking for black bears (U. americanus), harvest data suggest a stable population
trend (WGFD 2007b).
Early moose research in northwest Wyoming occurred during the period when
large predators were less common. Most studies examined the winter food habits and
social dynamics of moose in the Jackson Valley (Rudersdorf 1952, Denniston 1956,
Harry 1957, Altmann 1959). Humans were presumed to be the primary predator of
moose (Denniston 1956) and, due to the lack of large predators, several studies reported
overutilization of winter ranges and a need to reduce wintering moose numbers
(Rudersdorf 1952, Harry 1957). Houston (1968) provided extensive data on the habitat
relationships, life habits, and population dynamics of moose in the Jackson Valley during
the mid-1960s. He suggested that moose populations fluctuated between 1950 and 1966
in response to the condition of willows on winter range and periodic die-offs that
occurred during severe winters. He also indicated that disease and parasites had little
influence on the dynamics of the Jackson moose herd.
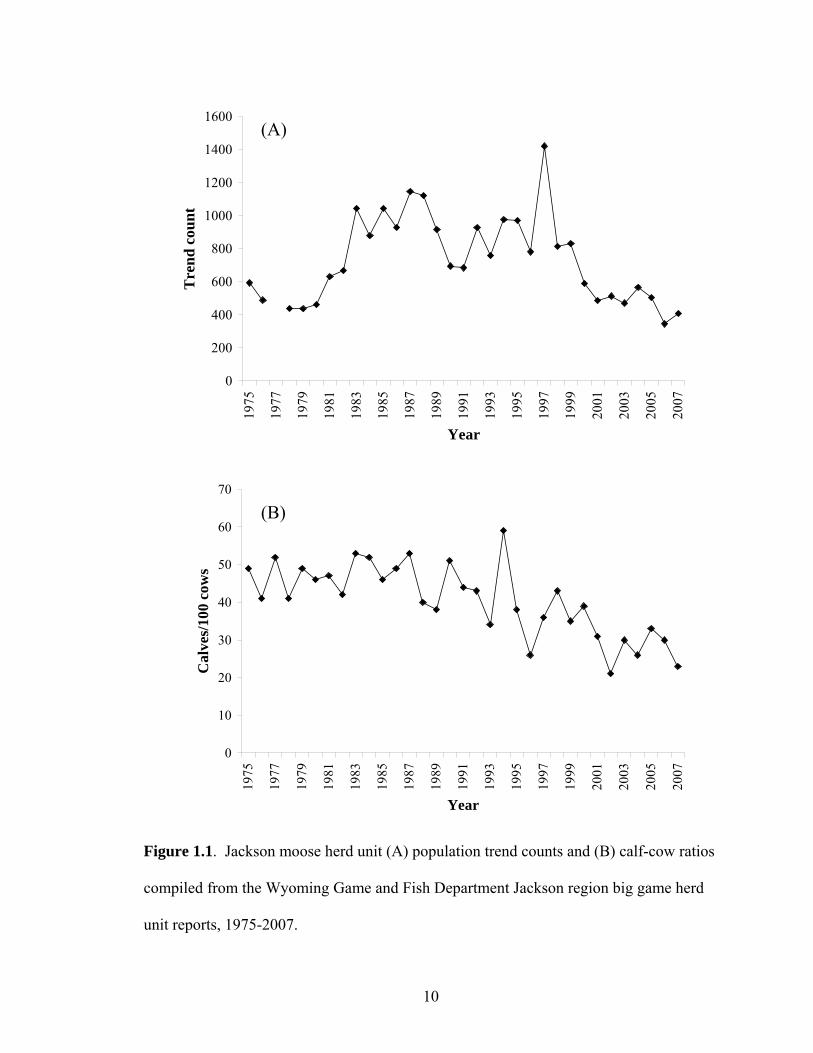
During the late 1970s, the north Jackson moose herd was in decline, possibly
exacerbated by liberal harvest of antlerless moose (Figure 1.1; WGFD 1982). Therefore,
antlerless moose licenses were reduced and moose responded by slowly increasing in
3

numbers until the late 1980s (WGFD 1990). Additionally, there were concerns regarding
a rise in the number of elk (Cervus elaphus) wintering in the Buffalo Valley that may
have been competing with moose for winter browse. It was suspected that higher elk
numbers were a result of conservative harvest during the 1980s, a series of mild winters,
and public feeding programs (WGFD 1988). As a result, elk harvest was increased in
1989 (WGFD 1990) and elk winter range improvement projects were initiated to reduce
the potential effects of competition. There was also a need to improve moose winter
ranges (WGFD 1991) and several improvement projects were implemented in the early
1990s. Nonetheless, moose trend counts and calf-cow ratios began to decline in the late
1980s and early 1990s and it was suspected that the 1988 wildfires might have been more
detrimental to moose than originally believed (WGFD 1991). Since the early 1990s, the
population has continued to fluctuate, however, as of 2007, population trend counts were
near levels observed in the late 1970s and calf-cow ratios were the lowest observed
during the previous 30 years (Figure 1.1).
Because of this decline, research was initiated to determine the factors impacting
the north Jackson moose herd. It was suspected that habitat quality had declined due to
high moose densities, resulting in pregnancy rates that were among the lowest reported in
North America (≈ 75%; Berger et al. 1999, Berger et al. 2001a). It was also suspected
that because grizzly bears had recently expanded into the study area, naïve moose were
more vulnerable to predation (Berger et al. 2001b) and, as a result, parturient moose
increased their use of areas closer to roads to avoid bear predation (Berger 2007).
Although previous research provided much information regarding certain aspects
of moose dynamics in northwest Wyoming, there was a need for research on specific
4

aspects of Shiras moose ecology. Therefore, I utilized global positioning system (GPS)
and very high frequency (VHF) radio collars to assess reproductive parameters, calf and
adult survival, seasonal distribution, and seasonal habitat selection patterns. Furthermore,
I examined the physiological health of this herd via blood, hair, and ultrasonic rump fat
measurements. Information provided from this study can be used to assess potential
mechanisms limiting the north Jackson moose herd and can provide a framework to
direct future research to answer more specific questions.
Research Goals and Objectives
The primary goal of this study was to provide insight into the life-history
characteristics of Shiras moose in northwest Wyoming and to use this information to
examine potential factors contributing to the possible population declines recently
observed in the north Jackson moose herd. The results can assist land and wildlife
managers in identifying appropriate management strategies that can benefit moose
populations in northwest Wyoming. There were three primary objectives:
(1) Investigate the seasonal distribution and habitat selection patterns of adult
female Shiras moose in northwest Wyoming (Chapter 2);
(2) Evaluate the physical condition and nutritional status of adult female Shiras
moose (Chapter 3); and
(3) Estimate reproductive parameters, calf survival, adult female and male
survival, and the finite rate of population growth for the north Jackson moose
herd and make preliminary inferences regarding potential limiting factors
(Chapter 4).
5

In addition to the above objectives, I also investigated the spatial and temporal
characteristics of moose highway crossings along a 9.7-km section of U.S. Highway
26/287 that bisects crucial moose winter range in the Buffalo Fork Valley of northwest
Wyoming (Appendix A). These results can assist transportation and wildlife managers in
identifying, evaluating, and implementing highway designs and mitigation that improve
the safety of motorists by reducing the risk of moose-vehicle collisions while maintaining
highway permeability for moose.
Thesis Organization
This thesis consists of five chapters, three of which are intended for publication in
peer-reviewed scientific journals. Chapter 1 includes a general introduction that provides
background information and my research objectives, while Chapter 5 includes general
conclusions from my research and provides recommendations for management and future
research. Chapters 2, 3, and 4 are in the format required for submission to appropriate
scientific journals. The spatial and temporal characteristics of moose highway crossings
is included as Appendix A and is in the format required for a final report that has been
submitted to the Wyoming Department of Transportation.
6
LITERATURE CITED
Altmann, M. 1959. Group dynamics of the Wyoming moose during the rutting season.
Journal of Mammalogy 40: 420-424.
Bangs, E. E., and S. H. Fritts. 1996. Reintroducing the gray wolf into central Idaho and
Yellowstone National Park. Wildlife Society Bulletin 24: 402-413.
Berger, J., J. W. Testa, T. Roffe, and S. L. Monfort. 1999. Conservation endocrinology:
a noninvasive tool to understand relationships between carnivore colonization and
ecological carrying capacity. Conservation Biology 13: 980-989.
Berger, J., P. B. Stacey, L. Bellis, and M. P. Johnson. 2001a. A mammalian predator-
prey imbalance: grizzly bear and wolf extinction affect avian neotropical
migrants. Ecological Applications 11: 947-960.
Berger, J., J. E. Swenson, and I.-L. Persson. 2001b. Recolonizing carnivores and naïve
prey: conservaton lessons from Pleistocene extinctions. Science 291: 1036-1039.
Berger, J. 2007. Fear, human shields and the redistribution of prey and predators in
protected areas. Biology Letters 3: 620-623.
Blair, N. 1987. The history of wildlife management in Wyoming. Wyoming Game and
Fish Department. Cheyenne, Wyoming, USA.
Brimeyer, D. G., and T. P. Thomas. 2004. History of moose management in Wyoming
and recent trends in Jackson Hole. Alces 40: 133-143.
Bowyer, R. T., V. Van Ballenberghe, and J. G. Kie. 2003. Moose. Pages 931-964 in G.
A. Feldhamer, B. C. Thompson, and J. A. Chapman, eds. Wild mammals of
North America: biology, management, and conservation. The Johns Hopkins
University Press, Baltimore, Maryland, USA.
7
Bubenik, A. B. 1997. Evolution, taxonomy and morphophysiology. Pages 77-123 in A.
W. Franzmann and C. C. Schwartz, eds. Ecology and management of North
American moose. Smithsonian Institute Press, Washington, D.C., USA.
Denniston, R. H., II. 1956. Ecology, behavior and population dynamics of the Wyoming
or Rocky Mountain moose, Alces alces shirasi. Zoologica 41: 105-118.
Haines, A. L. 1955. Osborne Russell’s Journal of a Trapper. Oregon Historical Society.
Portland, Oregon, USA.
Harry, G. B. 1957. Winter food habits of moose in Jackson Hole, Wyoming. Journal of
Wildlife Management 21: 53-57.
Houston, D. B. 1968. The Shiras moose in Jackson Hole, Wyoming. Technical Bulletin
No. 1. Grand Teton Natural History Association.
Hundertmark, K. J., R. T. Bowyer, G. F. Shields, and C. C. Schwartz. 2003.
Mitochondrial phylogeography of moose (Alces alces) in North America. Journal
of Mammalogy 84: 718-728.
Peterson, R. O. 1955. North American moose. University of Toronto Press, Toronto,
Ontario, Canada.
Rudersdorf, W. J. 1952. The coactions of beaver and moose on a joint food supply in the
Buffalo River Meadows and surrounding area in Jackson Hole, Wyoming.
Thesis, Utah State Agricultural College, Logan, Utah, USA.
Schwartz, C. C., M. A. Haroldson, K. A. Gunther, and D. Moody. 2006. Distribution of
grizzly bears in the Greater Yellowstone Ecosystem in 2004. Ursus 17: 63-66.
8

Smith, D. W., K. M. Murphy, and D. S. Guernsey. 1999. Yellowstone Wolf Project:
Annual Report, 1998. National Park Service, Yellowstone Center for Resources,
Yellowstone National Park, Wyoming, USA, YCR-NR-99-1.
Weaver, J. 1978. The wolves of Yellowstone. Natural Resources Report No. 14. U.S.
National Park Service, Washington, D.C., USA.
Wyoming Game and Fish Department. 1982. Jackson region annual big game herd unit
report 1981. Wyoming Game and Fish Department, Cheyenne, Wyoming, USA.
Wyoming Game and Fish Department. 1988. Jackson region annual big game herd unit
report 1987. Wyoming Game and Fish Department, Cheyenne, Wyoming, USA.
Wyoming Game and Fish Department. 1990. Jackson region annual big game herd unit
report 1991. Wyoming Game and Fish Department, Cheyenne, Wyoming, USA.
Wyoming Game and Fish Department. 1991. Jackson region annual big game herd unit
report 1990. Wyoming Game and Fish Department, Cheyenne, Wyoming, USA.
Wyoming Game and Fish Department. 2006. Mountain lion management plan. Trophy
Game Section (Management/Research Branch), Wyoming Game and Fish
Department, Lander, Wyoming, USA.
Wyoming Game and Fish Department. 2007a. Final Wyoming Gray Wolf Management
Plan. Wyoming Game and Fish Commission, Wyoming Game and Fish
Department, Cheyenne, Wyoming, USA.
Wyoming Game and Fish Department. 2007b. Annual black bear mortality summary:
harvest year 2007. Trophy Game Section (Management/Research Branch),
Wyoming Game and Fish Department, Lander, Wyoming, USA.
9
0
200
400
600
800
1000
1200
1400
1600
1975
1977
1979
1981
1983
1985
1987
1989
1991
1993
1995
1997
1999
2001
2003
2005
2007
Year
Tre
nd
cou
nt
(A)
0
10
20
30
40
50
60
70
1975
1977
1979
1981
1983
1985
1987
1989
1991
1993
1995
1997
1999
2001
2003
2005
2007
Year
Cal
ves/
100
cow
s
(B)
Figure 1.1. Jackson moose herd unit (A) population trend counts and (B) calf-cow ratios
compiled from the Wyoming Game and Fish Department Jackson region big game herd
unit reports, 1975-2007.
10

CHAPTER 2
SEASONAL MOVEMENTS AND HABITAT SELECTION OF ADULT FEMALE
SHIRAS MOOSE IN NORTHWEST WYOMING
In the format of a paper in the Journal of Wildlife Management
INTRODUCTION
Because ungulates can migrate considerable distances between seasonal ranges,
understanding their ecology requires the study of year-round habitat use patterns
(Nicholson et al. 1997, Unsworth et al. 1998, Nikula et al. 2004). Although researchers
and wildlife managers recognize this need, studies often focus on habitat selection during
winter when resources are most limited and management actions are likely to benefit a
large number of individuals (Hundertmark et al. 1990, Pearson et al. 1995, D’Eon and
Serrouya 2005, Poole and Stuart-Smith 2006). However, several aspects of ungulate
ecology act to link the dynamics of animals across seasonal ranges. For example, the
overwinter survival of bighorn sheep lambs (Ovis canadensis) was influenced more by
weather, and its potential effects on forage production, the previous spring than by the
severity of winter conditions (Portier et al. 1998). Similarly, several studies have
suggested that forage limitations on summer range can reduce maternal body condition
resulting in decreased reproductive success the following year for elk (Cervus elaphus;
Cook et al. 2004), caribou (Rangifer tarandus; Cameron 1994), muskoxen (Ovibos
moschatus; Reynolds 2001), and moose (Alces alces; Testa and Adams 1998). These
11

interrelationships among seasonal movements and the dynamics of populations challenge
our understanding and management of many ungulate species (Gordon et al. 2004).
Moose are typical of temperate ungulates in which individuals within a
population have distinct winter and summer ranges linked by migrations of varied
distances (Edwards and Ritcey 1956, LeResche et al. 1974, DeMarchi 2003). Different
migratory strategies have evolved to maximize individual fitness due to the seasonal
availability of forage in temperate environments (Fryxell and Sinclair 1988). Migratory
ungulates typically benefit by increasing their access to high quality forage during
summer, whereas nonmigratory (i.e., resident) ungulates may remain on lower quality
summer range but reduce their risk of predation (Nicholson et al. 1997, Hebblewhite et
al. 2006). The availability of forage can also influence the size of seasonal home ranges.
Resources are often restricted during winter due to snow accumulations, so moose
generally seek winter habitats that provide for a high quantity of forage in a relatively
small area (Dussault et al. 2005a). In contrast, summer home ranges are typically larger
because the availability of forage is not limited by environmental conditions (Houston
1968, Cederlund and Okarma 1988, Kufeld and Bowden 1996). Thus, moose habitat
selection patterns may be governed by the amount or quality of resources available on
seasonal ranges (Peek 1997). In general, moose select for shrub-dominated, open
habitats in winter, but may make use of closed-canopy areas as environmental conditions
warrant (Philips et al. 1973, Matchet 1985, Hundertmark et al. 1990, Stephenson et al.
2006). As summer approaches, moose make use of a variety of open habitats then shift
use to more closed-canopy areas during late summer possibly due to phenological
changes in the quality of forage (Hjelford et al. 1990, Peek 1997). By understanding the
12

spatial distribution of moose across the landscape, managers may be able to gain insight
into habitat alterations that impact moose population performance.
The understanding of Shiras moose (A. a. shirasi) seasonal distributions and
habitat selection in the Intermountain West is limited. Early research was primarily
observational in nature and used univariate approaches on a limited number of
individuals to assess movement and habitat selection patterns. Nonetheless, Shiras
moose have been associated with low-elevation ranges during winter followed by
movements of short-to-moderate distances to reach higher elevation ranges during
summer (Knowlton 1960, Ritchie 1978, Pierce and Peek 1984, Kufeld and Bowden
1996). Several studies have described the importance of shrub-dominated habitats during
winter (Knowlton 1960, Stevens 1970, Van Dyke et al. 1995, Kufeld and Bowden 1996)
with a shift to closed-canopy coniferous forests during late winter (Houston 1968, Ritchie
1978, Matchet 1985, Tyers and Irby 1995). Where riparian habitats were limited, the use
of mature coniferous forests that provide abundant cover and forage throughout winter
were found to be most important (Peek 1974, Pierce 1984, Pierce and Peek 1984).
Browse and forbs appeared to dominate summer diets of Shiras moose (Knowlton 1960,
Houston 1968, Stevens 1970, Ritchie 1978), but mature coniferous forests, particularly
lodgepole pine (Pinus contorta), that do not necessarily provide an abundance of forage
have been described as an important component of summer habitats (Ritchie 1978,
Kufeld and Bowden 1996).
This study was initiated because declining indices of population density and calf-
cow ratios suggested a downward trend in Shiras moose numbers in northwest Wyoming.
Moose declines have been most evident in the Buffalo Valley, approximately 50 km
13
north of the town of Jackson, Wyoming (Brimeyer and Thomas 2004). Therefore, the
goal of this research was to describe seasonal movements, distribution, and habitat
selection patterns of adult female Shiras moose captured in the Buffalo Valley. By
examining and contrasting Shiras moose habitat use both within and across seasons, I
intended to identify potential limiting factors. My specific objectives were to: (1)
estimate the dates of winter and summer seasonal range use and the onset of spring and
fall migration; (2) describe seasonal space-use patterns including home range size,
fidelity, and distances moved; and (3) determine habitat and landscape features that are
important predictors of winter and summer habitat selection. Using these data, I mapped
population-level predictions of seasonal habitat selection across the winter and summer
study area to provide managers with information on important seasonal ranges and to
assist with future land-use decisions.
STUDY AREA
The study area encompassed approximately 6,400 km2 of predominately public
land in northwest Wyoming. It was north of the town of Jackson, Wyoming and included
portions of Grand Teton National Park (GTNP), Yellowstone National Park (YNP), and
the Bridger-Teton National Forest (BTNF) where elevations ranged from 1,866 to 4,197
m. The study area included the upper Snake River and upper Yellowstone River
watersheds. Primary moose winter ranges and major tributaries of the Snake River
consisted of Pacific Creek, the Buffalo Fork River, and the Gros Ventre River (Houston
1968).
14

Vegetation types varied with elevation and aspect within the study area (Whitlock
1993, Knight 1994). Lower elevations, and many south-facing slopes at higher
elevations, were dominated by sagebrush (Artemisia spp.). Mid-elevations were
characterized by large stands of lodgepole pine intermixed with Douglas fir
(Psuedotsugia menziesii) and aspen (Populus tremuloides). Engelmann spruce (Picea
engalmanni) and subalpine fir (Abies lasiocarpa) were found on north slopes and more
mesic sites. Engelmann spruce, subalpine fir, and lodgepole pine intermixed with smaller
stands of whitebark pine (Pinus albicaulis), limber pine (Pinus flexilis), and aspen
dominated higher elevations. Alpine tundra occurred at the highest elevations while open
forest parks and subalpine meadows occurred at all elevational gradients. Riparian areas
dominated by willows (Salix spp.) intermixed with narrowleaf cottonwood (Populus
angustifolia) were located in large, relatively flat flooplain environments at lower
elevations and along nearly all drainages within the study area (Wigglesworth and
Wachob 2004).
The climate was characterized by short, cool summers and long, cold winters.
From 1975-2004, annual precipitation averaged 56 cm (range = 38-79 cm) of which
approximately 65% fell as snow between November and May (http://www.cdc.noaa.gov/
cgi-bin/Timeseries/timeseries1.pl; accessed 16 October 2005). The Teton Mountains to
the west and the northern highlands along the southern boundary of YNP typically
receive the greatest amounts of precipitation (Houston 1968, Cole 1969, Boyce 1989).
15

METHODS
Moose Captures and Data Management
Adult (≥ 2 years) female moose were captured using a helicopter on winter range
in the Buffalo Valley of northwest Wyoming during February 2005 and 2006. Moose
were darted and immobilized with 10-mg thiafentanil oxalate (A-3080, Wildlife
Pharmaceuticals, Fort Collins, Colorado, USA: McJames et al. 1994, Arnemo et al. 2003,
Kreeger et al. 2005) and, once handling was completed, thiafentanil was antagonized
with 300-mg naltrexone (Trexonil, Wildlife Pharmaceuticals, Fort Collins, Colorado,
USA) administered intramuscularly at multiple sites. Captures were performed in
accordance with approved University of Wyoming Animal Care and Use Committee
protocols.
Moose were fitted with TGW-3700 global positioning system (GPS) collars with
store-on-board technology and mortality sensing options (Telonics, Inc., Mesa, Arizona,
USA). Collars were preprogrammed to attempt a location fix every hour from 15
November to 15 June and every 5 hours from 16 June to 14 November. Location data
were collected continuously until 1 March 2007 when the collars were preprogrammed to
release from the moose. Location data were examined and all unsuccessful fixes and
obvious location errors were removed from datasets (D’Eon et al. 2002, D’Eon and
Serrouya 2005). Data were not corrected for fix-rate bias because of high fix-rate success
during winter (99.1%) and summer (96.2%, Appendix 2.1; D’Eon 2003, Friar et al. 2004,
Hebblewhite et al. 2007). Three-dimensional fixes accounted for a high proportion of
winter (83.0%) and summer (60.6%) locations (Appendix 2.2), therefore, data were not
16

differentially corrected because 3-dimensional locations generally have < 20 m error (Di
Orio et al. 2003).
Seasonal Home Range Characteristics
Due to variability among individuals in the onset of movements between seasonal
ranges, I visually examined the spatial and temporal distribution of location data for
individual moose in ArcGIS 9.2 (Environmental Systems Research Institute, Redlands,
California, USA) to identify dates and times of seasonal range use (Nikula et al. 2004,
D’Eon and Serrouya 2005). Moose were assumed to have left a seasonal range when the
distance between sequential relocations increased and the direction of travel suggested
movement away from a cluster of locations without returning. Similarly, when the
distance between relocations decreased and locations began to cluster, moose were
assumed to have arrived at a seasonal range. All locations that occurred outside of these
parameters were classified as migration. Based on these assumptions, I identified seasons
of use as winter and summer.
If I was unable to estimate movement dates for an individual, I plotted the
location data in ArcGIS and examined the number of moose whose seasonal ranges
overlapped the location data. I then calculated the mean dates of use for all moose that
overlapped the location data and used this as the date of seasonal range use for the
individual moose of interest. This was based on the assumption that dates of seasonal
range use were comparable among individual moose that utilized similar seasonal ranges
during the same year. For moose that arrived on summer range prior to 16 June and left
after 14 November, every fifth location was retained prior to and after these dates to
maintain a constant fix schedule during summer. I used a Kruskal-Wallis one-way
17

ANOVA to test for among year differences (α = 0.05) in seasonal range arrival and
departure dates.
Due to the topographic relief of the study area and the number of locations
obtained from the GPS collars, I used the fixed-k local convex hull (LoCoH) method to
estimate home range size for each moose during each season because it does not require
statistically independent location data (Getz and Wilmers 2004, Ryan et al. 2006). This
method creates hulls around each location and its k nearest neighbors then constructs
isopleths by merging these polygons together, beginning with the smallest and ending
with the largest (Getz and Wilmers 2004, Ryan et al. 2006). To begin, values of k at the
100% isopleth were run in increments of 5 that encompassed the square root of the
number of locations for each moose and season. I plotted area estimates against k to
locate the point at which home range size plateaued (Ryan et al. 2006). Values of k were
then run in increments of 1 to determine the best k value, area estimates were plotted, and
shapefiles were created to view the results. To obtain more accurate and unbiased
estimates of home range size, 90% LoCoH isopleths were calculated for selected values
of k for moose during each season (Börger et al. 2006, Elwen et al. 2006). I used a
Kruskal-Wallis one-way ANOVA to test for among year differences (α = 0.05) in winter
and summer home range sizes and if differences were not observed, I pooled annual
winter and summer home range sizes, respectively, to test for seasonal differences. If
individual moose were monitored during multiple years, home range estimates were
averaged to provide a single estimate for each individual prior to testing for seasonal
differences.
18

To estimate the extent of fidelity to seasonal home ranges, I calculated the percent
overlap between seasonal ranges for adult female moose that were monitored for 2
consecutive years. Seasonal 90% LoCoH home range polygons were mapped and the
total area of overlap for each moose and season was calculated in ArcGIS. The total area
of overlap was then divided by the total area encompassed by the 2 seasonal ranges
(Scarpitti et al. 2005). To determine the migratory status of radio-collared moose, I
estimated overlap between winter and summer ranges within the same year. If < 50%
overlap occurred, the moose was considered migratory (MacCracken et al. 1997). For
individuals that were considered migratory, I measured the straight-line distance between
the mean centers of winter and summer ranges within years. I tested for annual
differences (α = 0.05) in home range overlap within seasons and straight-line distance
moved between seasonal ranges with a Kruskal-Wallis one-way ANOVA.
All 90% LoCoH summer home range polygons were mapped in ArcGIS and if
they overlapped at any point, this area was classified as a moose summer range complex.
Migration routes were delineated by mapping all transition locations for each moose in
ArcGIS and tracing the routes taken from winter to summer range, and back, in both
years. To examine the relationship between onset of spring and autumn migration and
the elevation of moose summer ranges, I extracted summer elevation data for each moose
from a 26 x 26-m digital elevation model (DEM; U.S. Geological Survey [USGS] 1999).
I used Spearman rank correlation (α = 0.05) to determine if a relationship existed between
the onset of spring and autumn migration and the elevation of summer ranges.
19

Seasonal Habitat Selection
Modeling procedures to estimate resource selection probability functions (RSPF;
Manly et al. 2002) followed those outlined by Sawyer et al. (2006) and consisted of 4
basic steps: (1) estimate the relative frequency of use for each GPS-collared moose from
a large number of sampling units for each season and year, (2) use the relative frequency
as a continuous response variable in a multiple regression analysis (i.e., generalized linear
model) that was assumed to have a negative binomial distribution (White and Bennetts
1996) to model the probability of use for each moose as a function of a set of predictor
variables, (3) develop a population-level model by averaging the coefficient estimates
from the individual moose models for each season, and (4) map the predictions of the
population-level model for each season. Individual GPS-collared moose were treated as
the experimental unit to avoid spatial and temporal autocorrelation (Aebischer et al. 1993,
Otis and White 1999, Millspaugh et al. 2006).
I used the distribution of radio-collared moose from 2005 to 2007 to define winter
and summer habitat availability (McClean et al. 1998) by creating a minimum convex
polygon around all moose locations for each season using the HOME RANGE TOOLS
extension for ArcGIS (Rodgers et al. 2007). I buffered the winter and summer study
areas by the average daily distance moved per season (winter = 1,450 m, summer = 1,680
m; Appendix 2.3) to include what could potentially be available to moose within one
day’s travel. I created a single vegetation layer from 2 existing layers (Homer 1998,
Cogan et al. 2005) and reclassified vegetation data into 6 classes: (1) spruce/fir, (2)
lodgepole, (3) mixed/other conifer, (4) aspen, (5) riparian/deciduous shrub, or (6)
burn/other. Since the vegetation layers did not contain canopy height or percent cover
20

information, I could not estimate canopy height for deciduous shrubs. Therefore, to
assess habitat types that could potentially provide thermal cover for moose, cover was
defined strictly as conifers in winter and conifers and aspen habitats in summer. I used
the SPATIAL ANALYST extension for ArcGIS to estimate distance to cover for each
season and to calculate slope (i.e., degrees) and aspect from a 26 x 26-m DEM (USGS
1999).
I created circular sample units with 125-m radii that were systematically
distributed with a random start across each study area to measure 11 variables that could
potentially influence winter and summer habitat selection. These included the 6
vegetation classes listed above, elevation, slope, aspect, distance to cover, and habitat
diversity. I chose 125-m radii circular sampling units because this was approximately the
average distance moved by moose in a 2-hour period during both winter and summer.
This ensured that the area of the sample unit was small enough to detect changes in
animal movement, but large enough to obtain multiple locations within each unit (Sawyer
et al. 2006). I extracted vegetation data from each sample unit and calculated the
proportion of each vegetation type that occurred within each unit. Elevation, slope,
aspect, and distance to cover were obtained from the midpoint of each sample unit. It has
been demonstrated that moose select for habitat diversity at a larger spatial scale
(Hjelford et al. 1990, Nikula et al. 2004). Thus, I created 250-m-radii circular units
centered on the midpoint of each sample unit, extracted vegetation data from each unit,
and calculated a Shannon-Weiner diversity index (Krebs 1989) based on the 6 vegetation
classes listed above.
21

To estimate the relative frequency of use for each moose, I counted the number of
individual moose locations within each sample unit across the seasonal study areas during
each year. Prior to modeling, and to ensure independence of the sample units (Thompson
1992:51), I took a random sample with replacement of approximately 6,000 sample units
for winter and 20,000 sample units for summer. I used a forward stepwise modeling
procedure to estimate population-level models for each season and used a t-statistic to
determine variable entry (α ≤ 0.15) and exit (α ≤ 0.20; Hosmer and Lemeshow 2000). I
considered quadratic terms for slope during winter and elevation and slope during
summer. If a quadratic term entered the model then the linear form of each variable was
included. Aspect was considered as a categorical variable with the northeast aspect as the
reference and if one of the aspect categories (i.e., northwest, southeast, and southwest)
was significant (α ≤ 0.15) all of the categories were included. The burn/other vegetation
category was not fitted during the model building process for any season because
inference as to selection or avoidance would be difficult to ascertain due to the many
different vegetation types that were included in this class. This ensured independence of
the vegetation classes and did not violate the unit-sum constraint (Aebischer et al. 1993,
Nikula et al. 2004). A Pearson’s pairwise correlation analysis was conducted prior to
modeling to identify multicolinearities and to identify any predictor variables that should
be excluded from analysis ( r > 0.60). Population-level models were developed for each
season and year. I used a Spearman’s rank correlation analysis (α = 0.05) to determine if
a significant relationship existed in predicted RSPF values between years for all sample
units within each seasonal study area. If no differences were observed, all moose
locations were pooled across years for each season and a single winter and summer
22

population-level model was developed using the same techniques described above. All
habitat modeling procedures were conducted using the R statistical software package (R
Core Development Team 2006).
I mapped RSPF predictions of population-level models across 130 x 130-m pixels
for winter and 250 x 250-m pixels for summer that covered each seasonal study area.
The RSPF values were assigned values from 1 to 5 representing highest to lowest
estimated use probabilities in 20% increments (i.e., highest predicted probability of use =
1 [highest 20%], lowest predicted probability of use = 5 [lowest 20%]; Sawyer et al.
2006, Sawyer et al. 2007).
RESULTS
Moose Captures and Data Management
Twenty adult female moose were captured in February 2005 and 6 additional
moose were captured in February 2006. Two GPS collars malfunctioned during this
study. One collar partially failed in summer 2005 and averaged < 60% fix-rate success
during the remaining seasons. The other partially failed during winter 2006 and again in
winter 2007. These collars were removed from all analyses for the seasons they failed
except when estimating the dates of seasonal movements.
Seasonal Movements and Home Range Characteristics
Movements between seasonal ranges were identifiable for most moose in both
years. I was, however, unable to identify transition from winter to summer range for 3
23

moose and transition from summer to winter range for 1 moose, thus the mean dates from
moose whose summer ranges overlapped these individuals were used to estimate the end
of one season and the beginning of the next (Appendix 2.4). Although spring migration
began approximately 2 weeks earlier in 2005 ( x = 8 May ± 4.6 days; n = 17) than in
2006 ( x = 20 May ± 4.3 days; n = 20), no statistical difference was observed between
years (P = 0.094). No significant difference was observed between 2005 ( x = 18
November 3.7 days, n = 17) and 2006 (± x = 22 November ± 3.9 days, n = 19) in the
onset of fall migration (P = 0.557).
Winter home range sizes were estimated for all moose (Appendix 2.5); however,
only those moose that successfully left winter range in 2005 (n = 17), had a full winter of
data in 2006 (n = 12), or successfully remained on winter range until collars dropped or
were removed during capture efforts in 2007 (n = 18) were used to examine annual
differences. Mean winter home range size was 4.0 0.5 km± 2 in 2005, 5.5 0.9 km± 2 in
2006, and 2.9 0.5 km± 2 in 2007 (Figure 2.1). There were no differences in winter home
range sizes between 2005 and 2006 (P = 0.268), but differences were observed when
2007 was compared to 2005 (P = 0.027) and 2006 (P = 0.014). Therefore, only winter
home range sizes from 2005 and 2006 were used for remaining winter home range
comparisons. Total mean winter home range size was 4.5 0.5 km± 2 (n = 17, x
relocations = 2,720, k = 62).
Summer home range estimates were calculated for all moose that had functional
collars while on summer range in 2005 (n = 16) and 2006 (n = 19). Mean summer home
range size was 11.9 1.8 km± 2 in 2005 and 13.4 ± 2.1 km2 in 2006 (Figure 2.1). No
difference was observed between years (P = 0.843). Total mean summer home range size
24

was 13.2 1.9 km± 2 (n = 22, x relocations = 814, k = 38). When years were pooled,
mean summer home range size was significantly greater than mean winter home range
size (P < 0.001).
There was a significant difference (P < 0.001) between percent winter (n = 12, x
= 21.5 0.03%) and summer home range overlap (n = 13, ± x = 44.5 ± 0.03%). All
adult female moose were considered migratory in 2005 (n = 16) and 2006 (n = 18). Only
2 moose had overlapping winter and summer ranges (1 in both years) and the greatest
percent overlap observed for an individual moose within a year was 2.9%. There was no
significant difference (P = 0.352) in the distance traveled between seasonal ranges in
2005 ( x = 19.8 ± 3.4 km, range = 3.1-38.3 km) and 2006 ( x = 23.1 ± 3.1 km, range =
3.8-44.0 km).
Seasonal movement patterns involved a general congregation on low elevation
winter ranges followed by individual migrations to more dispersed, high elevation
summer ranges. All moose traveled along migration routes that paralleled primary
drainages or crossed low elevation passes throughout the study area and used the same
general routes during spring and autumn (Figure 2.2). Moose that were monitored during
migrations in 2005 and 2006 (n = 12) used similar routes in both years. Most collared
adult female moose occupied 1 of 4 summer range complexes while 3 individuals
occupied an area where no other collared moose traveled (Figure 2.2). When the
elevations of individual moose summer ranges were regressed against the onset of spring
migration, a positive relationship existed, but this correlation was only significant in 2006
(rs = 0.728, P < 0.001, Figure 2.3). In general, the onset of fall migration and the
25
elevations of summer ranges were negatively correlated, however, no significant
relationship was observed in either year (P > 0.05).
Habitat Selection
Winter
Based on movements and distributions of GPS-collared adult female moose
during the winters of 2005 to 2007, the winter study area encompassed approximately
1,100 km2 (Figure 2.4). Population-level habitat selection models were developed for
each winter period using 36,485 relocations in 2005 (n = 17 moose), 67,160 relocations
in 2006 (n = 21 moose), and 35,977 relocations in 2007 (n = 18 moose). Moose selected
winter habitats with a high proportion of riparian/deciduous shrub vegetation, low
elevation, high habitat diversity, and near coniferous cover in all years (Appendix 2.6).
Moose selected moderate slopes in 2006 and 2007 and avoided northerly aspects in 2005
and 2007. Mixed conifer was avoided in 2006 and 2007 and spruce/fir was avoided in
2007. In 2007, most moose avoided spruce/fir (10 of 18) and mixed conifer (16 of 18).
However, individual model coefficients were < -700 for 4 moose and < -800 for 2 moose
for the spruce/fir and mixed conifer vegetation classes, respectively, due to a lack of these
vegetation types within individual moose winter home ranges. When the coefficients
were averaged for the population-level model, estimates for spruce/fir and mixed conifer
were not indicative of population-level habitat selection for the GPS-collared sample
(βspruce/fir = -169, βmixed conifer = -101), thus they were removed from the final model
(Appendix 2.6). The model was rerun for 2007 and no other variables entered the model.
Although each winter model contained different combinations of covariates (Appendix
26

2.6), the predicted RSPF values for each sample unit were similar between 2005 and
2006 (rs = 0.839, P < 0.001), 2005 and 2007 (rs = 0.791, P < 0.001), and 2006 and 2007
(rs = 0.823, P < 0.001).
Since differences were not observed in the predicted RSPF values among years,
all winter relocations were pooled to create a single population-level winter habitat
selection model and predictive map of the probability of use. The final pooled model
included riparian/deciduous shrub, aspen, and mixed conifer vegetation types, elevation,
slope, habitat diversity, and distance to coniferous cover (Table 2.1). Population-level
model coefficients indicated that moose selected areas with a high proportion of
riparian/deciduous shrub and aspen vegetation, low elevation, high habitat diversity,
moderate slopes, close to coniferous cover, and avoided mixed conifer forests (Table
2.1). Areas with the highest predicted probability of moose use were composed of 29%
riparian/deciduous shrub, 24% lodgepole, 7% aspen, 6% spruce/fir, and 2% mixed
conifer, had an average elevation of 2,114 m, slopes of 4°, and were approximately 151
m from coniferous cover. Predictive maps indicate that the highest probability of use
occurred along relatively flat, low-elevation drainages dominated by riparian and
deciduous shrub habitats interspersed with patches of conifer and aspen (Figure 2.5).
Summer
Based on movements and distributions of GPS-collared adult female moose
during the summers of 2005 and 2006, the summer study area encompassed
approximately 3,800 km2 (Figure 2.6). Population-level habitat selection models were
developed for each summer using 13,781 relocations in 2005 (n = 16 moose) and 14,915
27

relocations in 2006 (n = 19 moose). Moose selected summer habitats composed of
moderate elevations and slopes and avoided mixed conifer forests and aspen in all years
(Appendix 2.7). Spruce/fir was avoided in 2005 while lodgepole was avoided in 2006.
In 2006, moose also selected summer habitats that offered high habitat diversity,
northerly aspects, and were relatively close to cover provided by aspen and conifers.
Although the summer 2006 model contained 5 additional covariates (Appendix 2.7), the
predicted RSPF values for each sample unit within the summer study area were similar
between years (rs = 0.924, P < 0.001).
Since differences were not observed in the predicted RSPF values among years,
all summer relocations were pooled to create a single population-level summer habitat
selection model and predicted probability of use map. The final model included, in the
order that they entered, elevation, slope, distance to cover, and lodgepole, mixed conifer,
and aspen vegetation types (Table 2.1). Population-level model coefficients indicated
that moose selected areas of moderate elevation and slope, close to cover, and avoided
lodgepole, mixed conifers, and aspen (Table 2.1). Areas with the highest predicted
probability of moose use were composed of 24% lodgepole, 16% spruce/fir, 12%
riparian/deciduous shrub, 7% aspen, and 6% mixed conifer, had an average elevation of
2,438 m, slopes of 9°, and were approximately 49 m from cover. Predictive maps
indicated that the highest probability of moose use during summer occurred at mid-
elevation habitats that were close to cover with relatively flat slopes (Figure 2.7). The
low-elevation ranges classified as high or medium-high probabilities of use during winter
were classified as low or medium-low probabilities of use during summer.
28

DISCUSSION
Population-level habitat selection models suggested that adult female moose in
the study area selected for low-elevation, riparian habitats dominated by extensive willow
communities during winter. Throughout their distribution moose generally seek winter
habitats that provide abundant forage (Peek 1997, Månsson et al. 2007). The extensive
use of shrub-dominated habitats during winter has been well documented for moose in
Alaska (Mould 1979, Hundertmark et al. 1990, MacCracken et al. 1997) and the
Intermountain West (Knowlton 1960, Van Dyke et al. 1995, Kufeld and Bowden 1996).
Furthermore, past diet and forage studies conducted on Shiras moose in the Greater
Yellowstone Area demonstrated the historical preference of willow as winter forage
(Rudersdorf 1952, McMillan 1953, Harry, 1957, Houston 1968). Where riparian habitats
are less extensive, the use of mature coniferous forests that contain a high diversity of
forage species becomes important (Stevens 1970, Pierce and Peek 1984, Matchett 1985,
Tyers 2003). Shrub-dominated, riparian habitats provide the greatest abundance of
available forage within the study area during the most restrictive time of year. Therefore,
these habitats likely reduce the energetic demands of traveling through snow in search of
forage and allow moose the opportunity to reduce the negative energy balance typically
incurred during winter.
Although moose selected areas dominated by riparian shrubs, they did not select
homogenous stands of willows. Adult female moose selected areas with high habitat
diversity which suggests that they require a variety of resources to meet their nutritional
and energetic requirements during winter. These findings are consistent with results from
an experimental study that demonstrated moose selection for a diverse diet even when
29

preferred forage species were highly available (Miquelle and Jordan 1979). On the Kenai
Peninsula, Alaska, Oldemeyer et al. (1977) suggested that succession from multi-species
to single-species dominated winter range may have contributed to an increased incidence
of mortalities associated with malnourishment. Browse quality is generally lower during
winter than during summer (Regelin et al. 1987, MacCracken et al. 1997, Schwartz and
Renecker 1997); therefore, a variety of resources can better meet the nutritional
requirements of moose than a single, highly abundant species (Oldemeyer et al. 1977,
Ohlson and Staaland 2001). When browse digestibility, fiber content, protein content,
and mineral content were examined among forage species in Alaska, aspen ranked as the
highest quality winter browse while willows were intermediate (Oldemeyer et al. 1977).
Although browse quality may vary by region, selection by adult female moose for aspen
habitats in the study area indicated that moose not only preferred areas with high browse
biomass, but they also selected the highest quality browse available during winter.
Based on my results, there is little evidence to support a shift to habitats with
greater canopy cover during late winter even though distance to cover entered the final
population-level model. The model developed for winter 2005 could have been
interpreted as late winter habitat selection since monitoring was conducted from February
2005 until individual moose left the winter range that year. Adult female moose did
select habitats closer to coniferous cover in 2005 ( x = 95 m) than in 2006 ( x = 130 m)
or 2007 ( x = 169 m). However, there were no differences in predicted RSPF values
among winters suggesting that habitat use was similar for late winter (i.e., 2005), full
winter (i.e., 2006), and early winter (i.e., 2007). This indicated that forage availability
was more important than cover during the entire winter over the range of conditions
30

observed during this study. Similar results have been described for moose in
southeastern British Columbia, Canada (Poole and Stuart-Smith 2006) and in east-central
Idaho (Ritchie 1978). This contrasts with other studies where shifts to closed-canopy
coniferous forests were observed during late winter due to increased snow accumulations
in Alaska (Hundertmark et al. 1990, Ballard et al. 1991, MacCracken et al. 1997,
Stephenson et al. 2006), Minnesota (Philips et al. 1973, Peek et al. 1976), Montana
(Stevens 1970, Matchett 1985), and Wyoming (Houston 1968). Winter range conditions
may not have been severe enough during my study to necessitate selection for coniferous
habitats (Poole and Stuart-Smith 2006). Additionally, moose may have utilized tracks of
other individuals to reduce the energetic costs of locomotion rather than seeking areas of
reduced snow depths under closed-canopy forests (LeSage et al. 2000, Ball et al. 2001).
Although conifers appeared to be of minor importance to moose in the study area, the
cover that these habitats provide may be important for short periods during the winter.
This could especially be true during late winter and early spring when rising ambient
temperatures increase thermal stress (Renecker and Hudson 1986, Schwab and Pitt 1991).
In winter, moose experience heat stress at -5°C (Renecker and Hudson 1986, Schwartz
and Renecker 1997) and generally avoid areas where this threshold is exceeded for
extended periods of time (Schwab and Pitt 1991). Thus, during late winter and early
spring, moose in the study area may have utilized coniferous habitats during the warmest
parts of the day and returned to more open habitats as temperatures cooled.
Summer habitat selection by adult female moose appeared to be associated with
habitat and landscape features that may reduce the effects of thermal stress. All moose
migrated to higher elevation summer ranges and selected for areas in close proximity to
31

cover provided by aspens and conifers. Areas classified as high-use during summer were
> 300 m higher in elevation and were > 100 m closer to cover than high-use areas in
winter. In northwest Wyoming, Dirks and Martner (1982) reported a cooling rate of
9.8°C per 1,000 m gain in elevation, thus high-use summer areas were on average 3.2°C
cooler than if moose had remained on low-elevation, high-use winter ranges during
summer. During summer, moose experience heat stress at 14°C (Schwartz and Renecker
1997) and it has been suggested that regions with temperatures > 27°C for extended
periods of time are unsuitable for moose unless there are refugia to provide relief (Kelsall
and Telfer 1974). Maximum daily temperatures recorded at the Two Ocean Plateau
SnoTel station in the middle of the summer study area (elevation = 2,816 m;
approximately 400 m higher than the mean elevation of predicted high-use summer areas)
indicated that summer temperatures routinely exceeded the 14°C heat stress threshold,
and were very near the upper threshold limit for extended periods of time during the
summers of 2005 and 2006 (http://www.wcc.nrcs.usda.gov/snotel/Wyoming/
wyoming.html). Therefore, selection for habitats in close proximity to cover may have
provided relief from high summer temperatures. This is similar to other research that
documented the increased use of closed-canopy forests by moose as summer
temperatures rose (Schwab and Pitt 1991, Dussault et al. 2004, Muir 2006). It has also
been reported that moose increased nocturnal activity (Dussault et al. 2004) and were
more likely to be located in open shrub fields during crepuscular hours in response to
increased temperatures (Muir 2006). In north-central Colorado, researchers suggested
that lower growth forms of willow at higher elevations provided little cover, thus moose
utilized coniferous cover in close proximity to preferred deciduous shrub habitats (Kufeld
32
and Bowden 1996). Although my study cannot prove that mature coniferous forests are
critical for moose survival during summer (Balsom et al. 1996), it does lend support for
the importance of these habitats in providing cover that could reduce heat stress near the
southern extent of their range.
Summer habitats that are closer to cover could provide females tending calves
increased protection from predators. It has been documented that parturient female
moose seek calving locations that provide greater hiding cover during the neonate phase
(Langley and Pletscher 1994, Bowyer et al. 1999, Poole and Stuart-Smith 2007), while
only recently has it been reported that females tending calves select habitats that may
reduce predation risk during the entire summer (Dussault et al. 2005b). While this may
have influenced habitat selection for some individuals in the study area, most adult
female moose that were fitted with GPS collars were not observed with calves in 2005 or
2006 (Chapter 4). Thus, predation risk likely had little to no effect on the summer habitat
selection patterns for the study animals and lends further support for the importance of
cover in reducing thermal stress.
The summer habitat selection patterns by moose likely reflect a release from the
environmental constraints of deep snow that restrict habitat selection during winter
(Dussault et al. 2005a, Stephenson et al. 2006). Summer home range sizes were greater
than winter and no specific vegetation types were selected for during summer. Habitat
diversity did not enter the summer model which suggested that moose were not limited
by the availability of forage and could be more selective in their summer habitat use
patterns. This is supported by research conducted in Quebec Province, Canada that
reported a negative relationship between moose home range size and forage availability
33

in winter, but not during summer (Dussault et al. 2005a). When resources are widely
distributed and highly available, as they are during summer, moose may seek out patches
of the highest quality forage within their home ranges and not necessarily use areas that
contain the greatest abundance of forage. Due to differences in elevation, slope, and
aspect, changes in plant phenology could have also influenced the choices of feeding sites
and habitats used by moose (Hjelford et al. 1990, Mysterud et al. 2001). For example,
several researchers have documented high use of forbs by Shiras moose, especially in late
spring and early summer even though browse remained a staple of the diet (McMillan
1953, Harry 1957, Knowlton 1960, Houston 1968, Stevens 1970, Ritchie 1978). It is
possible that moose used habitat patches within different vegetation classes to take
advantage of changes in the quality of forage throughout the summer (Peek 1997).
Additionally, summer provided moose with many forage choices resulting in a high level
of individual variation in habitat selection patterns across the summer range.
Fidelity to seasonal home ranges may also be influenced by habitat diversity and
the spatial distribution of preferred habitat patches. Adult female moose exhibited
greater fidelity to larger summer home ranges than to smaller winter home ranges.
Higher fidelity to summer home ranges have also been observed in Alaska (MacCracken
et al. 1997), New Hampshire (Scarpitti et al. 2005), and Sweden (Andersen 1991a).
Preferred riparian habitats occur throughout the Buffalo Valley winter range, thus
specific knowledge of preferred, high quality habitat patches may not be needed because
wherever moose move, they are likely to encounter sufficient forage of similar nutritional
value. In contrast, summer range resources are highly available, but the spatial
distribution of heterogeneous patches of high quality forage may be more widely
34

dispersed. Over time, moose may have learned where specific patches of high quality
resources were located within their summer home ranges resulting in greater fidelity as
they frequently visited preferred patches (Forester et al. 2007).
Spring and autumn migrations are influenced by a combination of snow
conditions and the availability of forage (Edwards and Ritcey 1957, Coady 1974,
LeResche 1974). If elevation was used as a surrogate for snow depth (Poole and Stuart-
Smith 2006), moose with higher elevation summer ranges generally began spring
migration later, but this relationship was only significant in 2006. During the winter of
2006, snow accumulations were greater and persisted longer into the spring than in 2005
(http://www.wcc.nrcs.usda.gov/snotel/Wyoming/wyoming.html; accessed 16 November
2007). This suggested that after winters with high snow accumulations, spring
migrations were highly influenced by snow conditions and the effects this might have in
delaying spring green-up, whereas after winters with relatively low snow accumulations,
moose may use some other factor to initiate movement. The lack of a relationship
between the onset of autumn migration and elevation implies that a rapid accumulation of
snow on summer range initiated the return to winter range for all moose regardless of
where they summered (Ballard et al. 1991, DeMarchi 2003).
While the timing of movements between seasonal ranges appeared to be
influenced by snow, adult female moose exhibited a high degree of individual variability
in the onset of spring and autumn migrations. This is similar to research conducted in
Alaska (Ballard et al. 1991) and Minnesota (Philips et al. 1973). The variation in
movements may be due to the energetic demands of the animals following winters of
differing severity. Mule deer (Odocoileus hemionus) research in Colorado suggested that
35

improved physical condition following mild winters allowed for earlier migration to
summer ranges (Garrott et al. 1987). Nonetheless, a more comprehensive understanding
of the timing of seasonal movements and the physical condition of moose prior to
migration is needed.
As with application of most modeling procedures to biological data, there were
potential weaknesses in the methodology used. Since annual habitat selection models
were combined into a single model for each season, some potential for pseudoreplication
was introduced because some moose were used to build habitat selection models during
all seasons. However, I concluded that the potential for introducing bias was minimal
(Oksanen 2001) and that this was the best modeling procedure for the data available. A
second area of potential weakness was that all of the available data was used in the
modeling procedure in order to produce seasonal models with the highest predictive
power possible, thus I was unable to independently validate the model. In the future, I
would strongly suggest model validation using independent data in order to verify the
predictions of moose habitat selection in northwest Wyoming.
MANAGEMENT IMPLICATIONS
Summer and winter ranges may be equally important components of moose
habitat in northwest Wyoming. Managers cannot assume the relative importance of one
seasonal range over the other because both are integrally linked into the dynamics of
populations. Migration routes are also important components of year-round ranges
because access to seasonal ranges would be limited without these and it is unlikely that
36

current population levels could be maintained (Sawyer et al. 2005). Migrations between
seasonal ranges generally follow traditional routes and this knowledge is passed from
parent to offspring (Sweanor and Sandegren 1988, Andersen 1991b), thus it may take
several generations for moose to adapt to habitat alterations that impact seasonal
movements and the quality of seasonal ranges.
Shiras moose in the study area selected for winter habitats that provided the
greatest abundance of, and potentially the highest quality, forage. However, the
importance of habitat diversity that includes cover provided by coniferous forests cannot
be underestimated, especially during spring when increasing ambient temperatures may
limit the foraging activities of moose during the day. Since moose are more concentrated
on winter range, habitat improvements could benefit many more individuals, but these
projects should not focus strictly on willow-dominated riparian communities. This study
suggested that managing for a variety of habitats within the winter range may allow
moose to better meet their nutritional and cover requirements.
Shiras moose summer range appears to be highly influenced by habitat and
landscape features that limit thermal stress while still securing adequate amounts of high
quality forage. Moose are more dispersed on summer ranges and large-scale habitat
improvement projects would be impractical. Additionally, most of the summer ranges
are relatively protected from human disturbance because much of the area is managed as
wilderness by the Bridger-Teton National Forest, Grand Teton National Park, or
Yellowstone National Park. However, natural disturbances that can impact moose
summer ranges have occurred in northwest Wyoming. Tyers (2003) suggested that the
1988 Yellowstone wildfires were detrimental to moose on the Northern Yellowstone
37

winter range because they removed a large portion of mature coniferous forests. Large-
scale wildfires or insect infestations that reduce the amount of mature forests could
reduce the physical condition of moose entering winter (Saether 1985, Solberg et al.
1999, Solberg et al. 2004) and may have a detrimental effect on moose populations in the
future. A reduction in physical condition could also make moose more susceptible to
diseases and parasitic infections by reducing reproductive output and adult survival
(Murray et al. 2006). My study was not designed to test how a reduction in the amount of
mature coniferous forests may result in population declines (Chapter 1), but indices of
moose population density and calf-cow ratios for the north Jackson moose herd suggested
the declines began shortly after the 1988 Yellowstone fires. Therefore, due to the
continued threat of wildfire and the increased threat of insect infestations that may alter
the availability and quality of moose summer ranges through direct destruction of mature
coniferous forests, increased monitoring of the availability of mature forests appears
warranted. If large-scale habitat alterations occur, moose populations may be negatively
impacted and harvest strategies and herd unit objectives may need to be adjusted
accordingly.
38

LITERATURE CITED
Aebischer, N. J., P. A. Robertson, and R. E. Kenward. 1993. Compositional analysis of
habitat use from animal radio-tracking data. Ecology 74: 1313-1325.
Andersen, R. 1991a. Habitat changes in moose ranges: effects on migratory behavior,
site fidelity and size of summer home range. Alces 27: 85-92.
Andersen, R. 1991b. Habitat deterioration and the migratory behaviour of moose (Alces
alces L.) in Norway. Journal of Applied Ecology 28: 102-108.
Arnemo, J. M., T. J. Kreeger, and T. Soveri. 2003. Chemical immobilization of free-
ranging moose. Alces 39: 243-253.
Ball, J. P., C. Nordengren, and K. Wallin. 2001. Partial migration by large ungulates:
characteristics of seasonal moose Alces alces ranges in northern Sweden.
Wildlife Biology 7: 39-47.
Ballard, W. B., J. S. Whitman, and D. J. Reed. 1991. Population dynamics of moose in
south-central Alaska. Wildlife Monographs 114.
Balsom, S., W. B. Ballard, and H. A. Whitlaw. 1996. Mature coniferous forests as
critical moose habitat. Alces 32: 131-140.
Börger, L., N. Franconi, G. De Michele, A. Gantz, F. Meschi, A. Manica, S. Lovari, and
T. Coulson. 2006. Effects of sampling regime on the mean and variance of home
range size estimates. Journal of Animal Ecology 75: 1393-1405.
Bowyer, R. T., V. Van Ballenberghe, J. G. Kie, and J. A. K. Maier. 1999. Birth-site
selection by Alaskan moose: maternal strategies for coping with a risky
environment. Journal of Mammalogy 80: 1070-1083.
39
Boyce, M. S. 1989. The Jackson elk herd: intensive wildlife management in North
America. Cambridge University Press, Cambridge, England.
Brimeyer, D. G., and T. P. Thomas. 2004. History of moose management in Wyoming
and recent trends in Jackson Hole. Alces 40: 133-143.
Cameron, R. D. 1994. Reproductive pauses by female caribou. Journal of Mammalogy
75: 10-13.
Cederlund, G. N., and H. Okarma. 1988. Home range and habitat use of adult female
moose. Journal of Wildlife Management 52: 336-343.
Coady, J. W. 1974. Influence of snow on behavior of moose. Naturaliste Canadien 101:
417-436.
Cogan, D., K. Varga, and G. Kittel. 2005. USGS-NPS vegetation mapping program,
Grand Teton National Park, 2002-2005 Vegetation mapping project: Final Report.
Bureau of
Reclamation Technical Memorandum No. 8260-06-02.
Cole, G. F. 1969. The elk of Grand Teton and south Yellowstone National Parks.
National Park Service Research Report GRTE-N-1. Washington, D.C., USA.
Cook, R. C., J. G. Cook, and L. D. Mech. 2004. Nutritional condition of northern
Yellowstone elk. Journal of Mammalogy 85: 714-722.
D’Eon, R. G., R. Serrouya, G. Smith, and C. O. Kochany. 2002. GPS radiotelemetry
error and bias in mountainous terrain. Wildlife Society Bulletin 30: 430-439.
D’Eon, R. G. 2003. Effects of a stationary GPS fix-rate bias on habitat-selection
analyses. Journal of Wildlife Management 67: 858-863.
40
D’Eon, R. G., and R. Serrouya. 2005. Mule deer seasonal movements and multiscale
resource selection using global positioning system radiotelemetry. Journal of
Mammalogy 86: 736-744.
DeMarchi, M. W. 2003. Migratory patterns and home range size of moose in the central
Nass Valley, British Columbia. Northwestern Naturalist 84: 135-141.
Di Orio, A. P., R. Callas, and R. J. Schaefer. 2003. Performance of two GPS telemetry
collars under different habitat conditions. Wildlife Society Bulletin 31: 372-379.
Dirks, R. A., and B. E. Martner. 1982. The climate of Yellowstone and Grand Teton
National Parks. U.S. National Park Service, Occasional Paper 6, Washington,
D.C., USA.
Dussault, C., J. P. Ouellet, R. Courtois, J. Huot, L. Breton, and J. Larochelle. 2004.
Behavioural responses of moose to thermal conditions in the boreal forest.
Ecoscience 11: 321-328.
Dussault, C., R. Courtois, J. P. Ouellet, and I. Girard. 2005a. Space use of moose in
relation to food availability. Canadian Journal of Zoology 83: 1431-1437.
Dussault, C., J. P. Ouellet, R. Courtois, J. Huot, L. Breton, and H. Jolicoeur. 2005b.
Linking moose habitat selection to limiting factors. Ecography 28: 619-628.
Edwards, R. Y., and R. W. Ritcey. 1956. The migrations of a moose herd. Journal of
Mammalogy 37: 486-494.
Elwen, S., M. A. Meÿer, P. B. Best, P. G. H. Kotze, M. Thornton, and S. Swanson. 2006.
Range and movements of female Heaviside’s dolphins (Cephalorhynchus
heavisidii), as determined by satellite-linked telemetry. Journal of Mammalogy
87: 866-877.
41
Forester, J. D., A. R. Ives, M. G. Turner, D. P. Anderson, D. Fortin, H. L. Beyer, D. W.
Smith, and M. S. Boyce. 2007. State-space models link elk movement patterns to
landscape characteristics in Yellowstone National Park. Ecological Monographs
77: 285-299.
Friar, J. L., S. E. Nielsen, E. H. Merrill, S. R. Lele, M. S. Boyce, R. H. M. Munro, G. B.
Stenhouse, and H. L. Beyer. 2004. Removing GPS collar bias in habitat selection
studies. Journal of Applied Ecology 41: 201-212.
Fryxell, J. M., and A. R. E. Sinclair. 1988. Causes and consequences of migration by
large herbivores. Trends in Ecology and Evolution 3: 237-241.
Garrott, R. A., G. C. White, R. M. Bartmann, L. H. Carpenter, and A. W. Alldredge.
1987. Movements of female mule deer in northwest Colorado. Journal of
Wildlife Management 51: 634-643.
Getz, W. M., and C. C. Wilmers. 2004. A local nearest-neighbor convex-hull
construction of home ranges and utilization distributions. Ecography 27: 489-
505.
Gordon, I. J., A. J. Hester, and M. Festa-Bianchet. 2004. The management of large
herbivores to meet economic, conservation and environmental objectives. Journal
of Applied Ecology 41: 1021-1031.
Harry, G. B. 1957. Winter food habits of moose in Jackson Hole, Wyoming. Journal of
Wildlife Management 21: 53-57.
Hebblewhite, M., E. M. Merrill, L. E. Morgantini, C. A. White, J. R. Allen, E. Bruns, L.
Thurston, and T. E. Hurd. 2006. Is the migratory behavior of montane elk herds
42

in peril? The case of Alberta’s Ya Ha Tinda elk herd. Wildlife Society Bulletin
34: 1280-1294.
Hebblewhite, M., M. Percy, and E. H. Merrill. 2007. Are all global positioning system
collars created equal? Correcting habitat-induced bias using three brands in the
central Canadian Rockies. Journal of Wildlife Management 71: 2026-2033.
Hjelford, O., N. Hövik, and H. B. Pedersen. 1990. Choice of feeding sites by moose
during summer, the influence of forest structure and plant phenology. Holarctic
Ecology 13: 281-292.
Homer, C. G. 1998. Idaho/Western Wyoming Landcover Classification: Report &
Metadata. Unpublished Document. Department of Geography and Earth
Resources, Utah State University, Logan, Utah, USA.
Hosmer, D. W., and S. Lemeshow. 2000. Applied logistic regression. Second edition.
John Wiley and Sons, New York, New York, USA.
Houston, D. B. 1968. The Shiras moose in Jackson Hole, Wyoming. Technical Bulletin
No. 1. Grand Teton Natural History Association.
Hundertmark, K. J., W. L. Eberhardt, and R. E. Ball. 1990. Winter habitat use by moose
in southeastern Alaska: implications for forest management. Alces 26: 108-114.
Kelsall, J. P., and E. S. Telfer. Biogeography of moose with particular reference to
western North America. Naturaliste Canadien 101: 117-130.
Knight, D. L. 1994. Mountains and plains: the ecology of Wyoming landscapes. Yale
University Press. New Haven, Connecticut, USA.
Knowlton, F. F. 1960. Food habits, movements and populations of moose in the
Gravelly Mountains, Montana. Journal of Wildlife Management 24: 162-170.
43

Krebs, C. J. 1989. Ecological methodology. Harper & Row. New York, New York,
USA.
Kreeger, T. J., W. H. Edwards, E. J. Wald, S. A. Becker, D. Brimeyer, G. Fralick, and J.
Berger. 2005. Health assessment of Shiras moose immobilized with thiafentanil.
Alces 41: 121-128.
Kufeld, R. C., and D. C. Bowden. 1996. Movements and habitat selection of Shiras
moose (Alces alces shirasi) in Colorado. Alces 32: 85-99.
Langley, M. A., and D. H. Pletscher. 1994. Calving areas of moose in northwestern
Montana and southeastern British Columbia. Alces 30: 127-135.
LeResche, R. E. 1974. Moose migrations in North America. Naturaliste Canadien 101:
393-415.
Lesage, L., M. Crête, J. Huot, A. Dumont, and J. P. Ouellet. 2000. Seasonal home range
size and philopatry in two northern white-tailed deer populations. Canadian
Journal of Zoology 78: 1930-1940.
MacCracken, J. G., V. Van Ballenberghe, and J. M. Peek. 1997. Habitat relationships of
moose on the Copper River delta in coastal south-central Alaska. Wildlife
Monographs 136.
Manly, B. F., L, McDonald, D. Thomas, T. McDonald, and W. Erickson. 2002.
Resource selection by animals: statistical design and analysis for field studies.
Second edition. Kluwer Academic, Boston, Massachusetts, USA.
Månsson, J., H. Andrén, A. Pehrson, R. Bergström. 2007. Moose browsing and forage
availability: a scale-dependent relationship? Canadian Journal of Zoology 85:
372-380.
44

Matchett, M. R. 1985. Habitat selection by moose in the Yak River drainage,
northwestern Montana. Alces 21: 161-190.
McClean, S. A., M. A. Rumble, R. M. King, and W. L. Baker. 1998. Evaluation of
resource selection methods with different definitions of availability. Journal of
Wildlife Management 62: 793-801.
McJames, S. W., J. F. Kimball, and T. H. Stanley. 1994. Immobilization of moose with
A-3080 and reversal with nalmefene HCl or naltrexone HCl. Alces 30: 21-24.
McMillan, J. F. 1953. Some feeding habits of moose in Yellowstone Park. Ecology 34:
102-110.
Millspuagh, J. J., R. M. Nielsen, L. McDonald, J. M. Marzluff, R. A. Gitzen, C. D.
Rittenhouse, M. W. Hubbard, and S. L. Sheriff. 2006. Analysis of resource
selection using utilization distributions. Journal of Wildlife Management 70: 384-
395.
Miquelle, D. G., and P. A. Jordan. 1979. The importance of diversity in the diet of
moose. Proceedings of the North American Moose Conference and Workshop
15: 54-79.
Mould, E. 1979. Seasonal movement related to habitat of moose along the Colville
River, Alaska. The Murrelet 60: 6-11.
Muir, J. D. 2006. Habitat selection and reproduction of Shiras moose (Alces alces
shirasi) in anthropogenic landscapes in Idaho. Thesis, University of Idaho,
Moscow, Idaho, USA.
45
Murray, D. L., E. W. Cox, W. B. Ballard, M. S. Lenarz, T. W. Custer, T. Barnett, and T.
K. Fuller. 2007. Pathogens, nutritional deficiency, and climate influences on a
declining moose population. Wildlife Monographs 166.
Mysterud, A., R. Langvatn, N. G. Yoccoz, and N. C. Stenseth. 2001. Plant phenology,
migration and geographical variation in body weight of a large herbivore: the
effect of a variable topography. Journal of Animal Ecology 70: 915-923.
Nicholson, M. C., R. T. Bowyer, and J. G. Kie. 1997. Habitat selection and survival of
mule deer: tradeoffs associated with migration. Journal of Mammalogy 78: 483-
504.
Nikula, A., S. Heikkinen, and E. Helle. 2004. Habitat selection of adult moose Alces
alces at two spatial scales in central Finland. Wildlife Biology 10: 121-135.
Ohlson, M., and H. Staaland. 2001. Mineral diversity in wild plants: benefits and bane
for moose. Oikos 94: 442-454.
Oldemeyer, J. L., A. W. Franzmann, A. L. Brundage, P. D. Arneson, and A. Flynn. 1977.
Browse quality and the Kenai moose population. Journal of Wildlife
Management 41: 533-542.
Oksanen, L. 2001. Logic of experiments in ecology: is pseudoreplication a pseudoissue?
Oikos 94: 27-38.
Otis, D. L., and G. C. White. 1999. Autocorrelation of location estimates and the
analysis of radiotracking data. Journal of Wildlife Management 63: 1039-1044.
Pearson, S. M., M. G. Turner, L. L. Wallace, and W. H. Romme. 1995. Winter habitat
use by large ungulates following fire in northern Yellowstone National Park.
Ecological Applications 5: 744-755.
46

Peek, J. M., D. L. Ulrich, and R. J. Mackie. 1976. Moose habitat selection and
relationships to forest management in northeastern Minnesota. Wildlife
Monographs 48.
Peek, J. M. 1997. Habitat relationships. Pages 351-375 in A.W. Franzmann and C.C.
Schwartz, eds. Ecology and Management of North American Moose.
Smithsonian Institute Press, Washington, D.C., USA.
Pierce, J. D., and J. M. Peek. 1984. Moose habitat use and selection patterns in north-
central Idaho. Journal of Wildlife Management 48: 1335-1343.
Philips, R. L., W. E. Berg, and D. B. Sniff. 1973. Moose movement patterns and range
use in northwestern Minnesota. Journal of Wildlife Management 37: 266-278.
Poole, K. G., and K. Stuart-Smith. 2006. Winter habitat selection by female moose in
western interior montane forests. Canadian Journal of Zoology 84: 1823-1832.
Poole, K. G., R. Serrouya, and K. Stuart-Smith. 2007. Moose calving strategies in
interior montane ecosystems. Journal of Mammalogy 88: 130-150.
Portier, C., M. Festa-Bianchet, J. –M. Gaillard, J. T. Jorgenson, and N. G. Yoccoz. 1998.
Effects of weather and density on survival of bighorn sheep lambs (Ovis
canadensis). Journal of Zoology 245: 271-278.
R Core Development Team. 2006. R 2.4.0 – a language and environment. R Foundation
for Statistical Computing, Vienna, Austria. <http://www.R-project.org>.
Accessed 6 Oct 2006.
Regelin, W. L., C. C. Schwartz, and A. W. Franzmann. 1987. Effects of forest
succession on nutritional dynamics of moose forage. Swedish Wildlife Research
(Supplement) 1: 247-263.
47

Renecker, L. A., and R. J. Hudson. 1986. Seasonal energy expenditure and
thermoregulatory response of moose. Canadian Journal of Zoology 64: 322-327.
Reynolds, P. E. 2001. Reproductive patterns of female muskoxen in northeastern Alaska.
Alces 37: 403-410.
Ritchie, B. W. 1978. Ecology of moose in Fremont County, Idaho. Wildlife Bulletin
No. 7. Idaho Department of Fish and Game, Boise, Idaho, USA.
Rodgers, A. R., A. P. Carr, H. L. Beyer, L. Smith, and J. G. Kie. 2007. HRT: Home
Range Tools for ArcGIS. Version 1.1. Ontario Ministry of Natural Resources,
Centre for Northern Forest Ecosystem Research, Thunder Bay, Ontario, Canada.
Rudersdorf, W. J. 1952. The coactions of beaver and moose on a joint food supply in the
Buffalo River Meadows and surrounding area in Jackson Hole, Wyoming.
Thesis, Utah State Agricultural College, Logan, Utah, USA.
Ryan, S. J., C. U. Knechtel, and W. M. Getz. 2006. Range and habitat selection of
African buffalo in South Africa. Journal of Wildlife Management 70: 764-776.
Saether, B. E. 1985. Annual variation in carcass weight of Norwegian moose in relation
to climate along a latitudinal gradient. Journal of Wildlife Management 49: 977-
983.
Sawyer, H., F. Lindzey, and D. McWhirter. 2005. Mule deer and pronghorn migration
in western Wyoming. Wildlife Society Bulletin 33: 1266-1273.
Sawyer, H., R. M. Nielsen, F. Lindzey, and L. L. McDonald. 2006. Winter habitat
selection of mule deer before and during development of a natural gas field.
Journal of Wildlife Management 70: 396-403.
48
Sawyer, H., R. M. Nielsen, F. G. Lindzey, L. Keith, J. H. Powell, and A. A. Abraham.
2007. Habitat selection of Rocky Mountain elk in a nonforested environment.
Journal of Wildlife Management 71: 868-874.
Scarpitti, D., C. Habeck, A. R. Musante, and P. J. Pekins. 2005. Integrating habitat use
and population dynamics of moose in northern New Hampshire. Alces 41: 25-35.
Schwab, F. E., and M. D. Pitt. 1991. Moose selection of canopy cover types related to
operative temperature, forage, and snow depth. Canadian Journal of Zoology 69:
3071-3077.
Schwartz, C. C., and L. A. Renecker. 1997. Nutrition and energetics. Pages 441-478 in
A.W. Franzmann and C.C. Schwartz, eds. Ecology and Management of North
American Moose. Smithsonian Institute Press, Washington, D.C., USA.
Solberg, E. J., B. E. Saether, O. Strand, and A. Loison. 1999. Dynamics of a harvested
moose population in a variable environment. Journal of Animal Ecology 68: 186-
204.
Solberg, E. J., A. Loison, J. M. Gaillard, and M. Heim. 2004. Lasting effects of
conditions at birth on moose body mass. Ecography 27: 677-687.
Stephenson, T. R., V. Van Ballenberghe, J. M. Peek, and J. G. MacCracken. 2006.
Spatio-temporal constraints on moose habitat and carrying capacity in coastal
Alaska: vegetation succession and climate. Rangeland Ecology and Management
59: 359-372.
Stevens, D. R. 1970. Winter ecology of moose in the Gallatin Mountains, Montana.
Journal of Wildlife Management 34: 37-46.
49

Sweanor, P. Y., and F. Sandegren. 1988. Migratory behavior of related moose.
Holarctic Ecology 11: 190-193.
Testa, J. W., and G. P. Adams. 1998. Body condition and adjustments to reproductive
effort in female moose (Alces alces). Journal of Mammalogy 79: 1345-1354.
Thompson, S. K. 1992. Sampling. John Wiley and Sons, New York, New York, USA.
Tyers, D. B. 2003. Winter ecology of moose on the northern Yellowstone winter range.
Dissertation, Montana State University, Bozeman, Montana, USA.
Unsworth, J. W., L. Kuck, E. O. Garton, and B. R. Butterfield. 1998. Elk habitat
selection on the Clearwater National Forest, Idaho. Journal of Wildlife
Management 62: 1255-1263.
U.S. Geological Survey. 1999. 30-meter National Elevation Dataset (tiled for
Wyoming). U.S. Geological Survey EROS Data Center, Sioux Falls, South
Dakota, USA.
Van Dyke, F., B. L. Probert, and G. M. Van Beek. 1995. Seasonal habitat characteristics
of moose in south-central Montana. Alces 31: 15-26.
White, G. C., and R. E. Bennetts. 1996. Analysis of frequency count data using the
negative binomial distribution. Ecology 77: 2549-2557.
Whitlock, C. 1993. Postglacial vegetation and climate of Grand Teton and southern
Yellowstone National Parks. Ecological Monographs 63: 173-198.
Wigglesworth, R. R., and D. G. Wachob. 2004. Historical and present habitat conditions
on the Jackson Hole, Wyoming moose winter range. Teton Science Schools
Conservation Research Center, Jackson, Wyoming, USA.
50

Winter Summer
Variable β SE P β SE P
Intercept 11.204 3.775 0.007 -452.987 101.276 <0.001
Riparian 3.559 0.173 <0.001 N.S.a
Elevation (m) -0.011 0.002 <0.001 0.364 0.088 <0.001
Elevation2 (m) N.A.b -0.000 0.038 <0.001Habitat diversity 0.856 0.143 <0.001 N.S.
Slope (°) 0.105 0.034 0.005 0.012 0.038 0.752
Slope2 (°) -0.006 0.002 <0.001 -0.003 0.001 0.015
Mixed conifer -2.251 0.995 0.034 -2.427 1.323 0.081
Dist. to cover (m) -0.002 0.001 0.051 -0.006 0.003 0.041
Aspen 0.590 0.384 0.139 -2.644 1.663 0.127
Lodgepole N.S. -0.628 0.293 0.044
Table 2.1. Coefficients for population-level resource selection probability function models of GPS-collared adult female moose
winter and summer habitat selection in northwest Wyoming. Variables are in the order that they entered during the winter model-
building process.
a Not significant. b Not applicable. Quadratic for elevation was not used during model building process for winter.
51

0.0
2.0
4.0
Winter 2005 Summer 2005 Winter 200
Seasons
Mea
n H
6.0
8.0
10.0
12.0
14.0
16.0
18.0
6 Summer 2006 Winter 2007
ome
Ran
ge S
ize
(km
2 )
Figure 2.1. ±
GPS-collared adult fem
Mean 90% LoCoH home range size (km2) standard error by season for
ale moose in northwest Wyoming.
52

Figure 2.2. Location of major migration routes to and from the 4 identified summer
range complexes for GPS-collared adult female moose in northwest Wyoming (2005-
2006). Migration routes shown that do not lead to one of the summer range complexes
were individuals that used separate summer ranges. The Lava Creek summer range is
depicted by the black square and migration routes were not included for moose that used
this area because the distance traveled was short. GTNP: Grand Teton National Park;
BTNF: Bridger-Teton National Forest.
53

y = 5.519x + 1708.6
R2 = 0.492, p < 0.001
2200
2300
2400
2500
2600
2700
2800
2900
100 110 120 130 140 150 160 170 180
Onset Spring Migration
Mea
n E
leva
tion
Sum
mer
Ran
ge (
m)
Figure 2.3. Scatterplot of the onset of spring migration (Julian date) against the mean
elevation of summer range (m) for individual GPS-collared adult female moose in
northwest Wyoming during spring 2006.
54
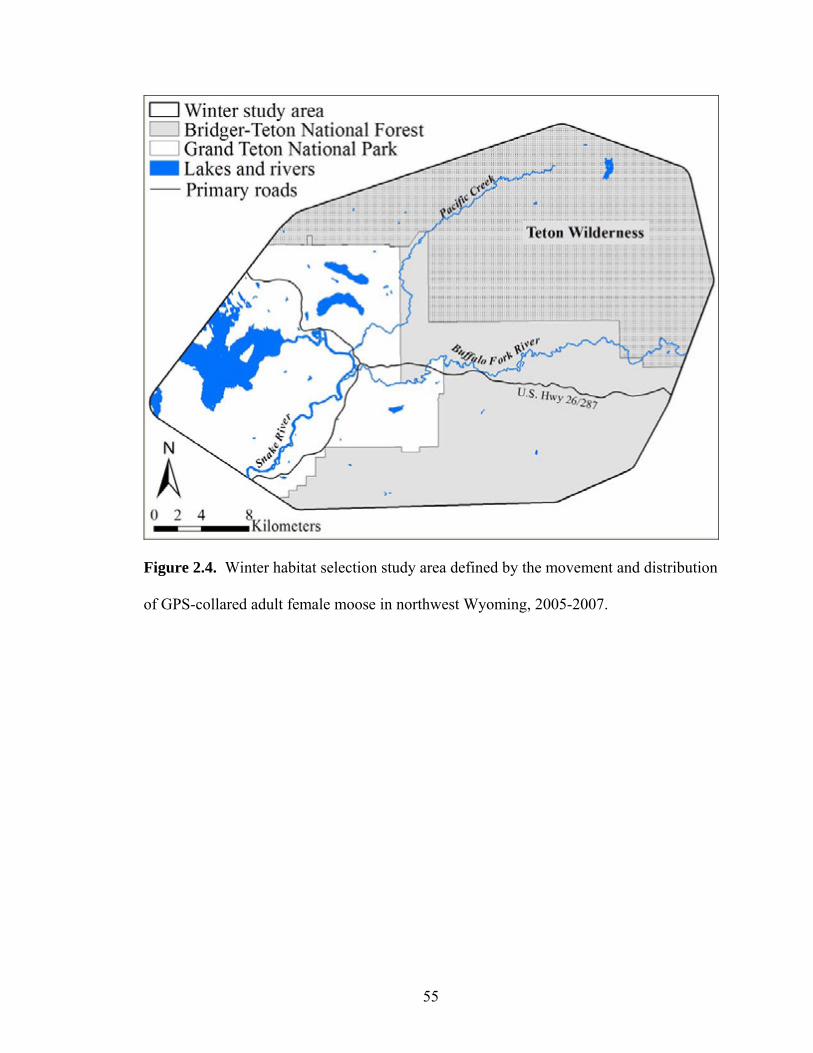
Figure 2.4. Winter habitat selection study area defined by the movement and distribution
of GPS-collared adult female moose in northwest Wyoming, 2005-2007.
55

Figure 2.5. Predicted probabilities and associated categories of winter habitat use for
adult female moose in northwest Wyoming, 2005-2007.
56

Figure 2.6. Summer habitat selection study area defined by the movement and
distribution of GPS-collared adult female moose in northwest Wyoming, summer 2005-
2006.
57
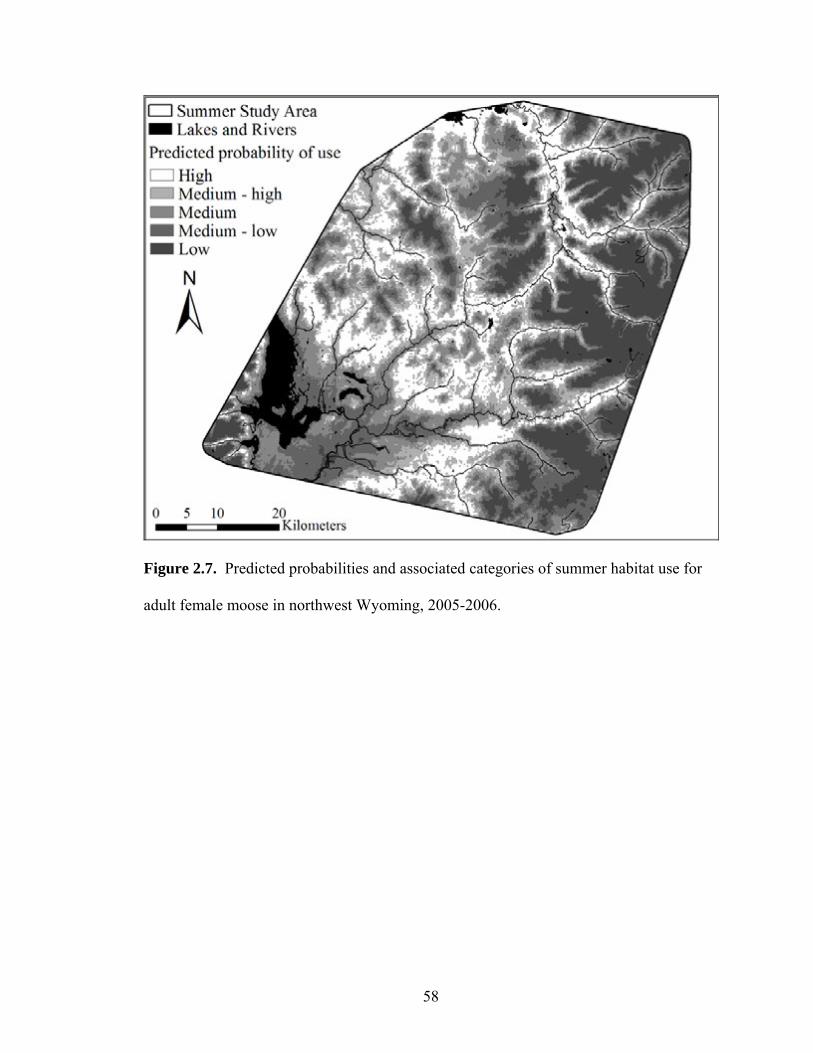
Figure 2.7. Predicted probabilities and associated categories of summer habitat use for
adult female moose in northwest Wyoming, 2005-2006.
58
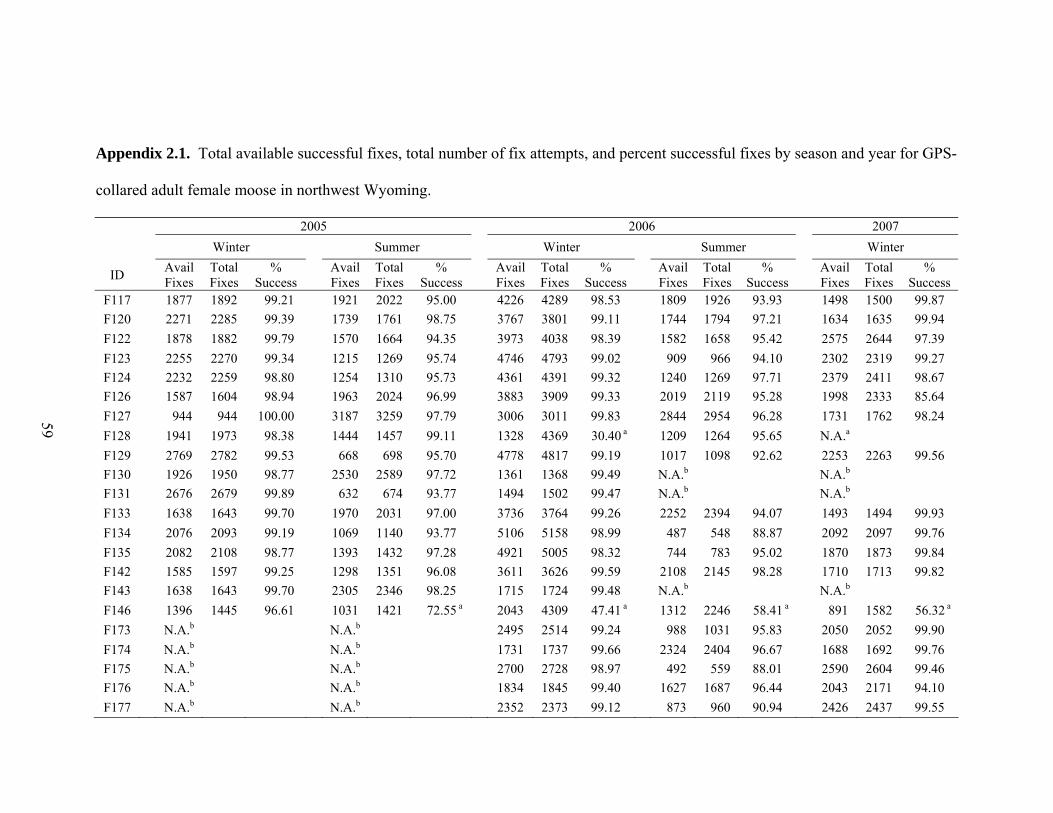
59
Appendix 2.1. Total available successful fixes, total number of fix attempts, and percent successful fixes by season and year for GPS-
collared adult female moose in northwest Wyoming.
2005 2006 2007
Winter Summer Winter Summer Winter
ID Avail Fixes
Total Fixes
% Success
Avail Fixes
Total Fixes
% Success
Avail Fixes
Total Fixes
% Success
Avail Fixes
Total Fixes
% Success
Avail Fixes
Total Fixes
% Success
F117 1877 1892 99.21 1921 2022 95.00 4226 4289 98.53 1809 1926 93.93 1498 1500 99.87
F120 2271 2285 99.39 1739 1761 98.75 3767 3801 99.11 1744 1794 97.21 1634 1635 99.94
F122 1878 1882 99.79 1570 1664 94.35 3973 4038 98.39 1582 1658 95.42 2575 2644 97.39
F123 2255 2270 99.34 1215 1269 95.74 4746 4793 99.02 909 966 94.10 2302 2319 99.27
F124 2232 2259 98.80 1254 1310 95.73 4361 4391 99.32 1240 1269 97.71 2379 2411 98.67
F126 1587 1604 98.94 1963 2024 96.99 3883 3909 99.33 2019 2119 95.28 1998 2333 85.64
F127 944 944 100.00 3187 3259 97.79 3006 3011 99.83 2844 2954 96.28 1731 1762 98.24
F128 1941 1973 98.38 1444 1457 99.11 1328 4369 30.40 a 1209 1264 95.65 N.A.a
F129 2769 2782 99.53 668 698 95.70 4778 4817 99.19 1017 1098 92.62 2253 2263 99.56
F130 1926 1950 98.77 2530 2589 97.72 1361 1368 99.49 N.A.b N.A.b
F131 2676 2679 99.89 632 674 93.77 1494 1502 99.47 N.A.b N.A.b
F133 1638 1643 99.70 1970 2031 97.00 3736 3764 99.26 2252 2394 94.07 1493 1494 99.93
F134 2076 2093 99.19 1069 1140 93.77 5106 5158 98.99 487 548 88.87 2092 2097 99.76
F135 2082 2108 98.77 1393 1432 97.28 4921 5005 98.32 744 783 95.02 1870 1873 99.84
F142 1585 1597 99.25 1298 1351 96.08 3611 3626 99.59 2108 2145 98.28 1710 1713 99.82
F143 1638 1643 99.70 2305 2346 98.25 1715 1724 99.48 N.A.b N.A.b
F146 1396 1445 96.61 1031 1421 72.55 a 2043 4309 47.41 a 1312 2246 58.41 a 891 1582 56.32 a
F173 N.A.b N.A.b 2495 2514 99.24 988 1031 95.83 2050 2052 99.90
F174 N.A.b N.A.b 1731 1737 99.66 2324 2404 96.67 1688 1692 99.76
F175 N.A.b N.A.b 2700 2728 98.97 492 559 88.01 2590 2604 99.46
F176 N.A.b N.A.b 1834 1845 99.40 1627 1687 96.44 2043 2171 94.10
F177 N.A.b N.A.b 2352 2373 99.12 873 960 90.94 2426 2437 99.55
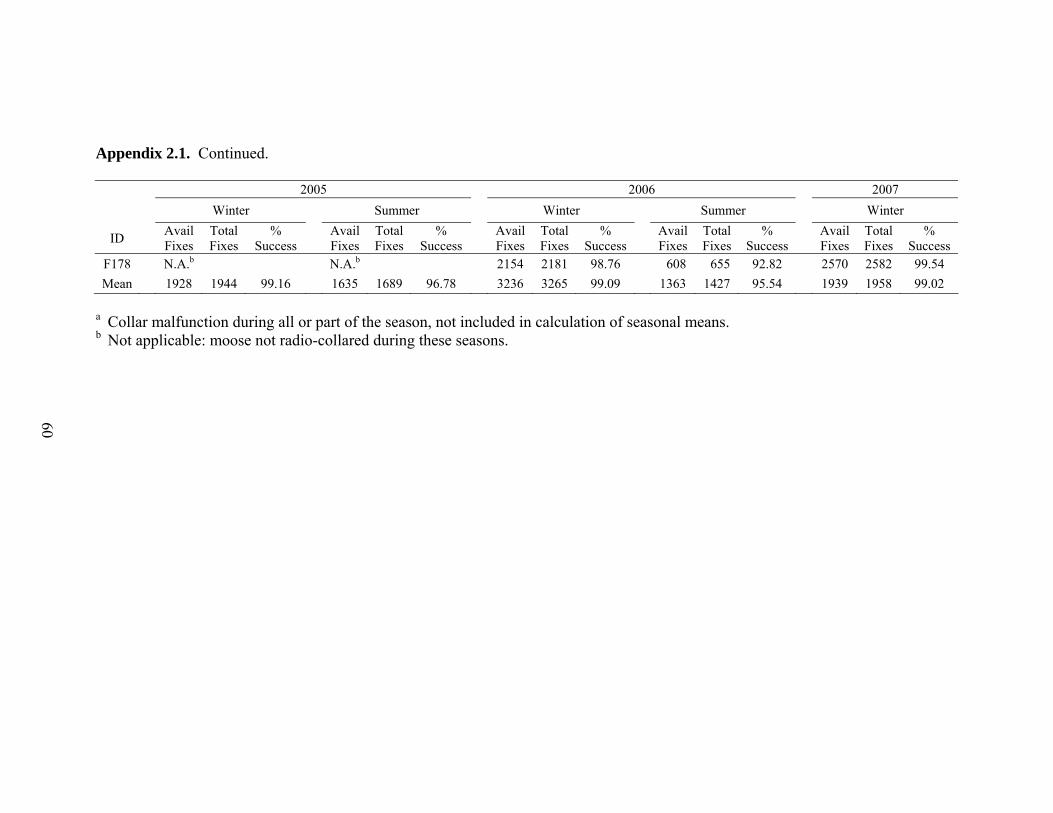
Appendix 2.1. Continued.
2005 2006 2007
Winter Summer Winter Summer Winter
ID Avail Fixes
Total Fixes
% Success
Avail Fixes
Total Fixes
% Success
Avail Fixes
Total Fixes
% Success
Avail Fixes
Total Fixes
% Success
Avail Fixes
Total Fixes
% Success
F178 N.A.b N.A.b 2154 2181 98.76 608 655 92.82 2570 2582 99.54
Mean 1928 1944 99.16 1635 1689 96.78 3236 3265 99.09 1363 1427 95.54 1939 1958 99.02
a Collar malfunction during all or part of the season, not included in calculation of seasonal means. b Not applicable: moose not radio-collared during these seasons.
60

Appendix 2.2. Total available successful fixes, total number of 3-dimensional (3D) fixes, and percent 3D fixes by season and year for
GPS-collared adult female moose in northwest Wyoming. Total available fixes for summer 2005 and 2006 differs from those in
Appendix 2.1 because locations were removed from summer if a moose arrived on summer range prior to 15 June or left after 15
November to maintain a constant fix schedule of 1 fix attempt every 5 hours during the summer period.
2005 2006 2007
Winter Summer Winter Summer Winter
ID Avail Fixes
Total 3D
% 3D Avail Fixes
Total 3D
% 3D Avail Fixes
Total 3D
% 3D Avail Fixes
Total 3D
% 3D Avail Fixes
Total 3D
% 3D
F117 1877 1468 78.21 899 520 57.84 4226 3449 81.61 879 432 49.15 1498 1286 85.85
F120 2271 1858 81.81 914 676 73.96 3767 3402 90.31 903 626 69.32 1634 1513 92.59
F122 1878 1686 89.78 809 412 50.93 3973 3506 88.25 776 429 55.28 2575 2217 86.10
F123 2255 1693 75.08 754 435 57.69 4746 3679 77.52 684 366 53.51 1377 1758 76.37
F124 2232 1781 79.79 785 516 65.73 4361 3616 82.92 771 535 69.39 2379 2107 88.57
F126 1587 1313 82.73 939 508 54.10 3883 3319 85.48 923 484 52.44 1998 1232 61.66
F127 944 903 95.66 1189 730 61.40 3006 2813 93.58 1087 628 57.77 1731 1498 86.54
F128 1941 1611 83.00 856 660 77.10 1328 1187 89.38 a 675 543 80.44 N.A.a
F129 2769 2342 84.58 668 447 66.92 4778 4004 83.80 727 346 47.59 2253 1868 82.91
F130 1926 1291 67.03 1064 658 61.84 1361 1214 89.20 N.A.b N.A.b
F131 2676 2417 90.32 632 426 67.41 1494 1337 89.49 N.A.b N.A.b
F133 1638 1420 86.69 939 523 55.70 3736 3369 90.18 939 464 49.41 1493 1339 89.69
F134 2076 1585 76.35 701 389 55.49 5106 4015 78.63 487 223 45.79 2092 1757 83.99
F135 2082 1618 77.71 814 479 58.85 4921 3977 80.82 669 336 50.22 1870 1574 84.17
F142 1585 1213 76.53 794 588 74.06 3611 3031 83.94 985 700 71.07 1710 1487 86.96
F143 1638 1426 87.06 1024 690 67.38 1715 1507 87.87 N.A.b N.A.b
F146 1396 862 61.75 540 176 32.59 a 2043 561 27.46 a 596 163 27.35 a 891 210 23.57 a
F173 N.A.b N.A.b 2495 2079 83.33 753 447 59.36 2050 1765 86.10
61
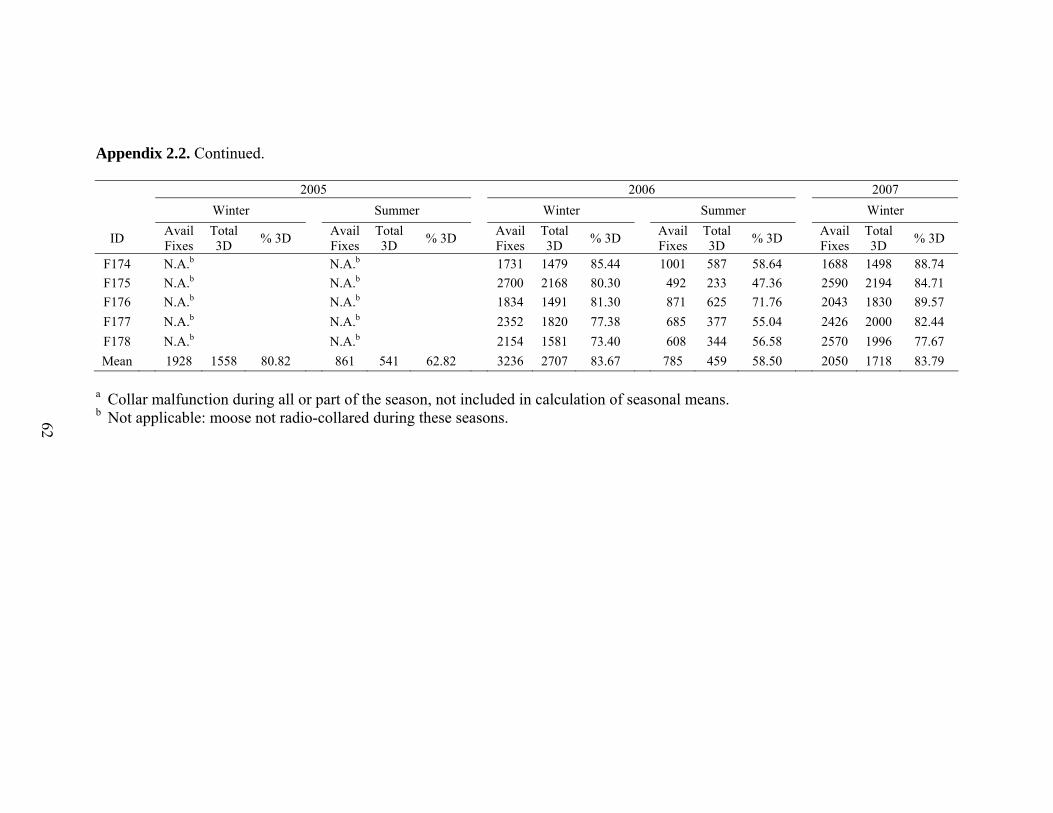
Appendix 2.2. Continued.
2005 2006 2007
Winter Summer Winter Summer Winter
ID Avail Fixes
Total 3D
% 3D Avail Fixes
Total 3D
% 3D Avail Fixes
Total 3D
% 3D Avail Fixes
Total 3D
% 3D Avail Fixes
Total 3D
% 3D
F174 N.A.b N.A.b 1731 1479 85.44 1001 587 58.64 1688 1498 88.74
F175 N.A.b N.A.b 2700 2168 80.30 492 233 47.36 2590 2194 84.71
F176 N.A.b N.A.b 1834 1491 81.30 871 625 71.76 2043 1830 89.57
F177 N.A.b N.A.b 2352 1820 77.38 685 377 55.04 2426 2000 82.44
F178 N.A.b N.A.b 2154 1581 73.40 608 344 56.58 2570 1996 77.67
Mean 1928 1558 80.82 861 541 62.82 3236 2707 83.67 785 459 58.50 2050 1718 83.79
a Collar malfunction during all or part of the season, not included in calculation of seasonal means. b Not applicable: moose not radio-collared during these seasons. 62

63
Appendix 2.3. Mean distance moved per day (km) by year and season for GPS-collared
adult female moose in northwest Wyoming. Mean winter and summer daily distance
moved were calculated by dividing the total distance moved for the season by 24 and
4.75, respectively. Total distance moved per season was estimated in ArcGIS using the
Home Range Tools Extension for ArcGIS, Version 1.1 (Rodgers et al. 2007).
2005 2006 2007 ID Winter Summer Winter Summer Winter
F117 1764.7 1481.7 1680.7 1298.4 1120.1 F120 1882.1 2197.6 1272.5 1942.3 1150.3 F122 2057.3 803.3 1411.4 859.3 1721.0 F123 1711.2 2164.5 1587.8 2392.2 1755.8 F124 1668.2 1599.5 1541.5 1746.2 1472.2 F126 1379.5 1449.1 1234.1 1439.9 1425.1 F127 1187.8 1066.1 1001.0 1251.6 1466.4 F128 1958.4 1983.4 1504.7 F129 2033.3 1741.0 1534.6 2142.8 1402.8 F130 1951.7 1706.5 1023.1 F131 1124.4 753.5 1039.4 F133 1337.8 1429.6 1048.3 1373.1 1164.5 F134 1166.6 1678.9 1768.8 1834.9 1755.6 F135 1545.4 1567.2 1520.4 1323.5 1141.9 F142 1837.2 2929.3 1801.7 2611.8 1401.4 F143 1791.8 1977.8 832.8 F146 1453.9 F173 931.0 1630.4 1535.0 F174 1339.7 873.2 1451.5 F175 1284.7 1498.8 1428.2 F176 1410.7 1234.2 1393.2 F177 2102.2 2767.9 1660.6 F178 1096.1 2606.4 1706.6
Mean 1638.3 1658.1 1355.4 1701.7 1452.9

.4. Dates of seasonal range use for GPS-collared adult female moose by season and year in northwest Wyoming.
64
Appendix 2
2005 2006 2007
Winter Summer Winter Summer Winter
ID Begina End Begin End Begin End Begin End Begin Endb
F117 16 Feb 5 May 5 May 27 Novc 30 Novc 28 May 28 May 16 Dec 16 Dec 17 Feb F120 16 Feb 22 May 24 May 5 Dec 10 Dec 18 May 24 May 6 Dec 9 Dec 15 Feb F122 16 Feb 5 May 6 May 7 Nov 8 Nov 2 May 4 May 26 Oct 27 Oct 1 Mar F123 16 Feb 21 May 22 May 4 Nov 10 Nov 2 Jun 3 Jun 3 Nov 21 Dec 17 Feb F124 16 Feb 21 May 21 May 11 Nov 16 Nov 19 May 22 May 4 Nov 20 Nov 1 Mar F126 16 Feb 23 Apr 24 Apr 15 Nov 15 Nov 27 Apr 28 Apr 23 Nov 24 Nov 1 Mar
F127 16 Feb 27 Mar 27 Mar 9 Dec 10 Dec 15 Apr 17 Apr 17 Dec 17 Dec 1 Mar
F128 16 Feb 9 May 15 May 12 Nov 16 Nov 17 May 18 May F129 16 Feb 11 Jun 15 Jun 8 Nov 16 Nov 6 Jun 8 Jun 22 Nov 26 Nov 1 Mar F130 16 Feb 8 May 10 May 25 Dec 27 Dec F131 16 Feb 7 Jun 16 Jun 3 Nov 16 Nov F133 16 Feb 25 Aprc 1 Mayc 23 Nov 2 Dec 8 Mayc 9 Mayc 16 Dec 17 Dec 17 Feb F134 16 Feb 14 May 27 May 2 Nov 14 Nov 25 Jun 30 Jun 22 Oct 3 Dec 1 Mar F135 16 Feb 14 May 16 May 7 Nov 14 Nov 11 Jun 24 Jun 18 Nov 29 Nov 15 Feb F142 16 Feb 23 Apr 20 May 12 Nov 30 Nov 2 May 18 May 15 Dec 19 Dec 1 Mar F143 16 Feb 25 Aprc 1 Mayc 6 Dec 12 Dec 1 Mar F146 16 Feb 17 Apr 16 May 9 Nov 10 Nov 12 May 16 May 17 Dec 25 Dec 1 Mar F173 23 Feba 6 May 13 Jun 24 Nov 5 Dec 1 Mar F174 23 Feba 7 May 8 May 16 Dec 20 Dec 1 Mar F175 23 Feba 25 Jun 29 Jun 23 Oct 4 Nov 1 Mar F176 23 Feba 11 May 22 May 29 Nov 30 Nov 1 Mar F177 23 Feba 2 Jun 5 Jun 10 Nov 19 Nov 1 Mar
F178 23 Feba 25 May 16 Jun 31 Oct 9 Nov 1 Mar
P
a
P
b Date monitoring began. Date monitoring ended. Collar was either removed or released from the moose.

Appendix 2.4. Continued.
c Unable to identify exact date of transition between seasonal ranges. Dates estimated from the mean dates of movement from moose that overlapped.
65

Appendix 2.5. Number of relocations (n) and nearest neighbors (k) used to calculate 90% LoCoH home range (HR) size (km2) for
individual GPS-collared adult female moose by season in northwest Wyoming, 2005-2007.
2005 2006 2007
Winter Summer Winter Summer Winter
ID n k HR Size n k HR Size n k HR Size n k HR Size n k HR Size
F117 1877 64 3.48 899 34 4.50 4226 73 4.35 879 43 5.37 1498 62 0.86
F120 2271 50 2.26 914 50 17.00 3768 61 2.20 903 54 20.39 1634 47 1.01
F122 1878 44 2.74 809 37 1.75 3973 74 5.61 776 48 1.85 2575 55 2.10
F123 2255 61 4.72 754 29 12.48 4746 68 8.08 684 44 20.41 1377 46 1.86
F124 2232 51 4.40 785 40 15.81 4361 79 9.21 771 43 14.91 2379 65 3.79
F126 1587 53 2.73 939 40 13.37 3883 67 2.86 923 37 12.49 1998 66 2.21
F127 944 41 0.88 1189 41 5.60 3006 73 1.32 1087 39 7.36 1731 59 1.40
F128 1941 53 6.14 856 30 12.51 N.A.a 675 36 8.94 N.A.a
F129 2769 67 10.40 668 43 6.17 4778 77 7.59 727 39 7.09 2253 50 3.01
F130 1926 62 5.65 1064 37 9.23 1361 44 1.15 N.A.b N.A.b
F131 2676 64 3.12 632 42 4.28 N.A.c
F133 1638 51 3.02 939 32 10.53 3736 77 3.15 939 48 8.89 1493 68 1.24
F134 2076 59 2.85 701 41 9.95 5106 82 12.34 487 29 9.97 2092 62 3.23
F135 2082 60 3.48 814 34 14.23 4921 87 5.05 669 48 9.44 1870 60 2.14
F142 1585 42 4.89 794 32 25.87 3611 82 3.85 985 41 32.60 1710 52 1.99
F143 1638 58 4.40 1024 32 27.35 1715 46 0.73 N.A.c
F146 1396 46 3.16 N.A.a N.A.a N.A.a N.A.a
F173 N.A.b N.A.b 1705 41 0.29 753 29 10.74 2050 48 2.64
F174 N.A.b N.A.b 1731 52 2.12 1001 52 5.40 1688 56 4.01
F175 N.A.b N.A.b 2700 69 1.65 492 36 6.00 2590 60 1.94
F176 N.A.b N.A.b 1834 61 2.77 871 40 13.72 2043 57 4.36
F177 N.A.b N.A.b 2352 55 6.62 685 25 35.85 2426 63 6.26
66

Appendix 2.5. Continued.
2005 2006 2007
Winter Summer Winter Summer Winter
ID n k HR Size n k HR Size n k HR Size n k HR Size n k HR Size
F178 N.A.b N.A.b 2154 59 0.62 608 27 22.26 2570 58 8.36
a Not applicable: collar malfunction, home range size not calculated. b Not applicable: moose not radio collared. c Not applicable: mortality, home range size not calculated.
67
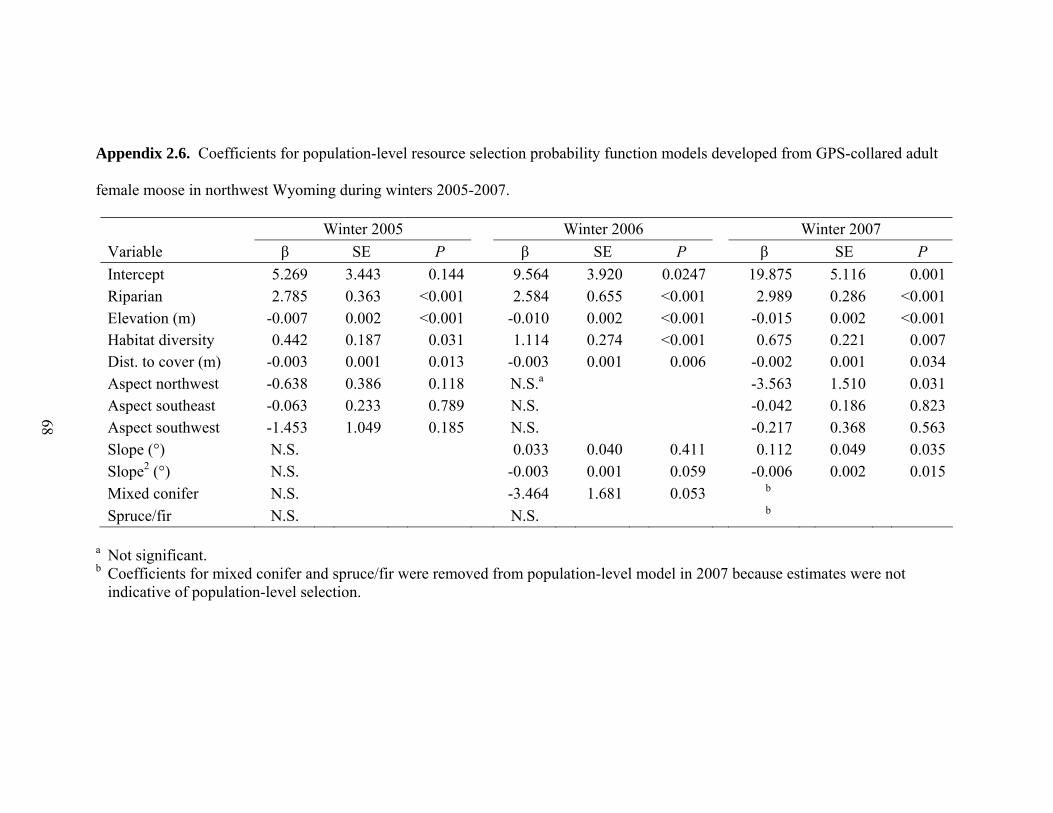
Appendix 2.6. Coefficients for population-level resource selection probability function models developed from GPS-collared adult
female moose in northwest Wyoming during winters 2005-2007.
Winter 2005 Winter 2006 Winter 2007
Variable β SE P β SE P β SE P
Intercept 5.269 3.443 0.144 9.564 3.920 0.0247 19.875 5.116 0.001Riparian 2.785 0.363 <0.001 2.584 0.655 <0.001 2.989 0.286 <0.001Elevation (m) -0.007 0.002 <0.001 -0.010 0.002 <0.001 -0.015 0.002 <0.001Habitat diversity 0.442 0.187 0.031 1.114 0.274 <0.001 0.675 0.221 0.007Dist. to cover (m) -0.003 0.001 0.013 -0.003 0.001 0.006 -0.002 0.001 0.034Aspect northwest -0.638 0.386 0.118 N.S.a -3.563 1.510 0.031Aspect southeast -0.063 0.233 0.789 N.S. -0.042 0.186 0.823Aspect southwest -1.453 1.049 0.185 N.S. -0.217 0.368 0.563Slope (°) N.S. 0.033 0.040 0.411 0.112 0.049 0.035Slope2 (°) N.S. -0.003 0.001 0.059 -0.006 0.002 0.015
Mixed conifer N.S. -3.464 1.681 0.053 b
Spruce/fir N.S. N.S. b
68
a Not significant. b Coefficients for mixed conifer and spruce/fir were removed from population-level model in 2007 because estimates were not
indicative of population-level selection.

Appendix 2.7. Coefficients for population-level resource selection probability function models developed from GPS-collared adult
female moose in northwest Wyoming during summer 2005 and 2006.
Summer 2005 Summer 2006 Variable β SE P β SE P Intercept -436.311 91.240 <0.001 -391.534 56.487 <0.001Elevation (m) 0.348 0.072 <0.001 0.308 0.046 <0.001Elevation2 (m) -0.000 <0.001 <0.001 -0.000 <0.001 <0.001Mixed -3.854 1.916 0.063 -1.362 0.449 0.007Slope (°) 0.062 0.064 0.349 -0.002 0.039 0.969Slope2 (°) -0.004 0.002 0.058 -0.002 0.001 0.116Aspen -1.511 0.736 0.058 -1.839 0.932 0.064Spruce/fir -1.010 0.563 0.070 N.S.a Habitat diversity N.S. 0.570 0.206 0.013Aspect northwest N.S. 0.329 0.204 0.124Aspect southeast N.S. 0.049 0.174 0.783Aspect southwest N.S. -0.405 0.203 0.061Lodgepole N.S. -1.106 0.357 0.006Dist. to cover (m) N.S. -0.004 0.002 0.085
69
a Not significant.
70
CHAPTER 3
PHYSIOLOGICAL HEALTH ASSESSMENT OF ADULT FEMALE SHIRAS
MOOSE IN NORTHWEST WYOMING
In the format of a paper in the journal Alces
INTRODUCTION
The “animal indicator concept” has been used to provide managers with a relative
index of a population with respect to the carrying capacity of its habitat (Franzmann
1985). This approach assumes that because an animal is a product of its environment, it
will likely reflect the quality of its environment. Early work focused on the use of
hematological and serum chemical parameters to assess differences in habitat quality
among populations of pronghorn (Antilocapra americana; Seal and Hoskinson 1978),
white-tailed deer (Odocoileus virginianus; Seal et al. 1978), and elk (Cervus elaphus;
Weber et al. 1984). Franzmann and LeResche (1978) expanded this concept by
evaluating blood parameters in relation to indices of physical condition for Alaskan
moose (Alces alces gigas). This provided a set of baseline data that could be used for
comparative purposes to assess population condition and, thus, habitat quality and
potential reproductive performance (Franzmann and Schwartz 1985, Stephenson 2003).
Packed cell volume (PCV) was the single best predictor of body condition in moose,
followed by hemoglobin (Hb), total serum protein (TSP), calcium (Ca), and phosphorous
(P; Franzmann and LeResche 1978). These blood parameters identified populations on
the extremes (i.e., very good or very poor condition), but were less effective when used to
compare populations in moderate condition (Franzmann et al. 1987). More recently, the
value of using TSP, Ca, and P has come into question (Keech et al. 1998). Another
technique has been developed to evaluate body condition and estimate total body fat
using ultrasonography to measure rump fat depth (Stephenson et al. 1993, Stephenson et
al. 1998).
The “animal indicator concept” has also been applied to assessment of the nutrient
quality of habitat because herbivores acquire minerals from the plants they consume
(Franzmann 1985). Even if an animal appears to be in relatively good physical condition,
nutritional deficiencies can create physiological imbalances that may impact population
performance (Combs 1987, Gogan et al. 1989). Free-ranging herbivores rarely acquire
sufficient quantities of particular nutrients because of high variability in forage mineral
concentrations among sites and seasons (McDowell 2003). The nutrient quality of
browse used by moose is most limited during winter (Kubota et al. 1970, Oldemeyer et
al. 1977, Ohlson and Staaland 2001) and mineral concentrations in moose hair show
similar temporal trends (Franzmann et al. 1974, Flynn et al. 1977, Stewart and Flynn
1978, Flynn and Franzmann 1987). Therefore, the effects of nutritional deficiencies
should be most apparent in winter. Mineral deficiencies can lead to reduced survival,
especially among calves and yearlings, and reduced reproductive output among domestic
herbivores (WallisDeVries 1998). Clinical deficiencies have rarely been observed in
moose populations because a reduction in fitness often predisposes moose to other forms
of mortality (O’Hara et al. 2001). Nonetheless, deficiencies of trace elements,
specifically Cu, have been suggested as a cause of moose population declines in Alaska
(Flynn et al. 1977, O’Hara et al. 2001), Sweden (Frank et al. 1994), and Minnesota
71

(Custer et al. 2004). Furthermore, O’Hara et al. (2001) suggested that populations
experiencing marginal Cu deficiencies may not exhibit clinical symptoms unless
additional stressful events occur.
Indices of population density and calf-cow ratios suggest a downward trend in
Shiras moose (A.a. shirasi) numbers in northwest Wyoming. Potential factors
contributing to the decline include a decrease in the quality of summer and winter habitat,
increased predation by large carnivores, disease or parasites, or a combination of factors
(Berger et al. 1999, Berger et al. 2001, Brimeyer and Thomas 2004). Population declines
have been most evident in the Buffalo Fork Valley, approximately 50 km north of the
town of Jackson, Wyoming (Brimeyer and Thomas 2004). To address the issues of
habitat quality, disease, and parasites, I used the animal indicator concept to investigate
the physiological health of adult (≥ 2 years) female Shiras moose in northwest Wyoming
via a suite of physiological measurements that can be used to describe the nutritional
status of the study population. Although Houston (1969) and Kreeger et al. (2005) have
reported blood values for Shiras moose in Wyoming, few data were available from large
samples collected over multiple years. Therefore, this work provides baseline data that
can be used to aid managers in future evaluation of the health of Shiras moose throughout
the Intermountain West. My research objectives were to: (1) compare hematological and
serum chemical parameters to baseline data from Alaskan moose, (2) measure maximum
rump fat depth with ultrasonography to assess relative health compared to Alaskan
moose, (3) examine macronutrient and micronutrient content of moose serum and hair
and compare to reported deficiency values for domestic ruminants, (4) evaluate the
presence of infectious diseases, and (5) assess endoparasite and ectoparasite loads.
72
During this study, pregnant adult moose captured during winter experienced reduced
parturition rates the following spring (Chapter 4). Consequently, a sixth objective was
established to examine the hypothesis that if moose are Cu deficient, a stressful event
(i.e., capture) could induce perinatal mortality and influence reproductive success
(O’Hara et al. 2001).
STUDY AREA
The study area encompassed approximately 6,400 km2 of predominately public
land in northwest Wyoming. It included the upper Snake River and upper Yellowstone
River watersheds and included portions of Grand Teton National Park (GTNP),
Yellowstone National Park (YNP), and the Bridger-Teton National Forest (BTNF) where
elevations ranged from 1,866 to 4,197 m. Moose wintered in low-elevation, riparian-
dominated habitats along the Snake River and its primary tributaries (i.e., Pacific Creek,
Buffalo Fork River, Gros Ventre River; Chapter 2). During summer, migratory moose
traveled to more dispersed, mid-elevation ranges (Chapter 2), whereas nonmigratory
individuals remained on low-elevation ranges (Houston 1968).
Vegetation types varied with elevation and aspect (Whitlock 1993, Knight 1994).
Lower elevations, and many south-facing slopes at higher elevations, were dominated by
sagebrush (Artemisia spp.). Mid-elevations were characterized by large stands of
lodgepole pine (Pinus contorta) intermixed with Douglas fir (Psuedotsugia menziesii)
and aspen (Populus tremuloides). Engelmann spruce (Picea engalmanni) and subalpine
fir (Abies lasiocarpa) were found on north slopes and more mesic sites. Engelmann
73
spruce, subalpine fir, and lodgepole pine intermixed with smaller stands of whitebark
pine (Pinus albicaulis), limber pine (Pinus flexilis), and aspen dominated higher
elevations. Alpine tundra occurred at the highest elevations while open forest parks and
subalpine meadows occurred at all elevational gradients. Riparian areas dominated by
willows (Salix spp.) intermixed with narrowleaf cottonwood (Populus angustifolia) were
located in large, relatively flat floodplain environments at lower elevations and along
nearly all drainages within the study area (Wigglesworth and Wachob 2004).
The climate was characterized by short, cool summers and long, cold winters.
From 1975-2004, annual precipitation averaged 56.2 cm (range = 37.9-79.1 cm) of which
approximately 65% fell as snow between November and May (http://www.cdc.noaa.gov/
cgi-bin/Timeseries/ timeseries1.pl; accessed 16 October 2005). The Teton Mountains to
the west and the northern highlands along the southern boundary of YNP typically
received the greatest amounts of precipitation (Houston 1968, Cole 1969, Boyce 1989).
METHODS
Adult female moose were captured on winter range within the study area between
January and March 2005, 2006, and 2007. Moose were darted from the ground or a
helicopter and immobilized with 10-mg thiafentanil oxalate (A-3080, Wildlife
Pharmaceuticals Inc., Fort Collins, Colorado, USA; McJames et al. 1994, Arnemo et al.
2003, Kreeger et al. 2005) in 2005 and 2006 and 10-mg carfentanil (Wildnil, Wildlife
Pharmaceuticals Inc., Fort Collins, Colorado, USA) in 2007. Immobilization drugs were
delivered in a 1-ml dart (Pneu-dart, Williamsport, Pennsylvania, USA) fired from a CO2-
74

powered dart rifle (Dan-Inject North America, Fort Collins, Colorado, USA) or a 0.22-
caliber-blank dart rifle (Model 193, Pneu-dart, Williamsport, Pennsylvania, USA). Once
handling was completed, thiafentanil and carfentanil were antagonized with an
intramuscular injection of 300-mg naltrexone (Trexonil, Wildlife Pharmaceuticals, Fort
Collins, Colorado, USA; Kreeger et al. 2005) administered at multiple sites. Techniques
used to evaluate pregnancy and to determine the presence of a calf in spring were
described in Chapter 4. Captures were performed in accordance with approved
University of Wyoming Animal Care and Use Committee protocols.
Once immobilized, moose were blindfolded and fitted with global positioning
system (GPS; model TGW-3700, Telonics, Mesa, Arizona, USA) or very high frequency
(VHF) radio transmitters (model M2710, Advanced Telemetry Systems, Isanti,
Minnesota, USA). Numbered, aluminum ear tags were affixed to each ear. Body
condition was subjectively evaluated and a score from 0 to 10 was assigned to each
moose (Franzmann 1977). Depth of rump fat was measured with an Omega I portable
ultrasound unit (E.I. Medical, Loveland, Colorado, USA) in 2005 and a Bantam XLS
portable ultrasound unit (E.I. Medical, Loveland, Colorado, USA) in 2006 and 2007
(Stephenson et al. 1993, Keech et al. 1998, Stephenson et al. 1998). Both ultrasound
units used a 5-MHz 8-cm linear-array transducer and subcutaneous fat was measured
with electronic calipers to the nearest 0.1 cm (Stephenson et al. 1998).
Approximately 50-ml of blood was collected from each moose via jugular
venipuncture for hematological analyses, serum chemical analyses, serum trace element
screen, and bacterial and viral serology. Hematological analyses included whole blood
concentrations of PCV, Hb, mean corpuscular hemoglobin content (MCHC), red blood
75

cells (RBCs), total white blood cells (WBCs), composition of white blood cells, and
platelets. Serum chemical analyses included concentrations of albumin (ALB), alkaline
phosphate (ALP), aspartate aminotransferase (AST), blood urea nitrogen (BUN), creatine
kinase (CK), gamma-glutanyl transferase (GGT), globulins (Glob), glucose (Gluc),
lactate dehydrogenase (LDH), TSP, and the macronutrients Ca, magnesium (Mg), and P.
Levels of five micronutrients were analyzed with serum trace element screens and
included Cu, iron (Fe), manganese (Mn), molybdenum (Mb), and zinc (Zn). Blood was
analyzed for the presence of antigens against Brucella abortus, Leptospira, infectious
bovine rhinotracheitis virus, bovine viral diarrhea virus, parainfluenza-3 virus, and
bovine respiratory syncytial virus in 2005 while analysis was conducted for only B.
abortus in 2006 and 2007. Fecal samples and ear swabs were collected to evaluate endo-
and ectoparasite loads. A 30-second tick count was performed along the dorsal midline
posterior to the neck of each moose to assess the severity of winter tick (Dermacantor
albipictus) infestations. Hair samples were collected from the dorsal midline between the
shoulders and analyzed for concentrations of arsenic (As), barium (Ba), cadmium (Cd),
chromium (Cr), cobalt (Co), Cu, Fe, lead (Pb), Mn, mercury (Hg), Mb, nickel (Ni),
selenium (Se), thallium (Tl), vanadium (V), tin (Sn) and Zn. All diagnostic analyses
were performed at the Wyoming State Veterinary Laboratory (Laramie, Wyoming,
USA).
Blood parameter (hematological and serum chemical) values and mineral
concentrations (serum and hair macro- and micronutrients) were pooled within years and
Table 3.1 was used to assess the nutritional status of the sampled populations based on
published reference values. Mean values for PCV, Hb, TSP, Ca, and P were compared to
76

baseline data from Alaskan moose that were considered to be in average to above average
condition (Franzmann and LeResche 1978) and the proportion of the sampled population
that were below these reported values was presented. Macro- and micronutrient
requirements for moose have not been established, so the proportion of the sampled
population that was deficient was calculated based on published deficiency thresholds for
domestic ruminants (Puls 1994, McDowell 2003). The published reference values for Ca
and Mg are not true deficiency thresholds and only represent the lower normal limit for
domestic ruminants (Puls 1994, McDowell 2003).
A one-way analysis of variance and a Tukey’s Honestly Significant Difference
(HSD) test were used to examine among year differences (α = 0.05) in rump fat depth,
body condition scores (BCS), all blood parameters, and minerals that were above the
minimum detection limit (MDL) in order to quantify between year variations. A
Spearman rank correlation analysis was conducted to determine if a significant
relationship existed between hematological and serum chemical parameters and depth of
rump fat (α = 0.05). I used logistic regression (Hosmer and Lemeshow 2000) to
determine if there was a relationship between Cu levels and parturition rates for pregnant,
captured moose and to estimate the level of Cu likely to induce perinatal mortality if a
significant relationship was observed. I also used a 2-sample t-test with equal variance to
test for differences in serum and hair Cu concentrations and rump fat depths for pregnant
cows observed with and without calves in the spring. All statistical analyses were
performed with Statistix 8.0 software (Analytical Software, Tallahassee, Florida, USA).
77

RESULTS
Moose Captures, Rump Fat, Disease, and Parasites
Forty-eight adult female moose were captured 61 times during the course of the
study. Most captures occurred in February (n = 54) from a helicopter (n = 53). Nearly
all ultrasonic rump fat measurements were recorded in February (n = 41) with the
exception of 5 that were measured in early to mid-March. There was no attempt to
distinguish rump fat depth between cows with and without calves at their side because of
inconsistencies in reporting the presence of a calf during capture efforts. Mean rump fat
depth did not differ significantly among years (2005-2007; f(2,43) = 0.9, P = 0.399; Table
3.2). There were no differences between rump fat depth for pregnant cows observed
with (n = 8) or without calves (n = 31) in the spring (P = 0.246, df =37). Differences
were observed in BCS among years (f(2,51) = 4.8, P = 0.012) and post hoc analyses
indicated that BCS in 2005 were significantly higher than in either 2006 or 2007 (Table
3.2).
Sampled moose (n = 59) were negative for antigens against B. abortus in all years
and for Leptospira, infectious bovine rhinotracheitis virus, bovine viral diarrhea virus,
parainfluenza-3 virus, and bovine respiratory syncytial virus in 2005 (n = 20). Tick loads
were relatively low and 30-second counts averaged 2.8 ticks/moose with 55 of 59 moose
hosting < 10 ticks. No moose (n = 56) had evidence of ear mites and fluke eggs were not
observed in any sample (n = 43). Fecal examinations (n = 44) indicated a low infection
(≤ 12 eggs/gm) of Nematodirus spp. in 13 moose and Trichostrongylus spp. in two
moose.
78

Hematological, Serum Chemical, and Macroelement Analyses
There were no significant differences among years for Hb (P = 0.053) or platelets
(P = 0.104), but differences were evident for PCV (f(2,48) = 9.5, P < 0.005), MCHC (f(2,48)
= 8.3, P < 0.005), RBCs (f(2,48) = 6.9, P = 0.002), and WBCs (f(2,48) = 4.7, P = 0.013;
Table 3.3). No consistent increasing or decreasing patterns were observed for PCV,
MCHC, or RBCs, but WBCs exhibited a generally increasing trend with 2005
significantly lower than 2007. The percent composition of WBCs did not differ
significantly among years for lymphocytes (P = 0.089), eosinophils (P = 0.353), or
monocytes (P = 0.168), but significant differences were observed for neutrophils (f(2,48) =
4.7, P = 0.014) and post hoc analyses indicated that 2007 was significantly lower than
2005 and 2006 (Table 3.3).
For serum chemical analyses, there were no significant differences among years
for ALP (P = 0.149) and GGT (P = 0.339), but significant differences were found for
ALB (f(2,54) = 19.0, P < 0.005), AST (f(2,54) = 10.3, P < 0.005), BUN (f(2,54) = 4.7, P <
0.005), CK (f(2,53) = 6.5, P = 0.003), globulins (f(2,54) = 23.6, P < 0.005), glucose (f(2,54) =
12.5, P < 0.005), LDH (f(2,54) = 47.1, P < 0.005), and TSP (f(2,54) = 48.3, P < 0.005; Table
3.4). No consistent increasing or decreasing patterns were observed for ALB, AST,
BUN, globulins, glucose, LDH, and TSP. However, CK values exhibited a generally
increasing pattern with 2007 means significantly greater than 2005 (Table 3.4).
Serum analyses showed significant differences among years for all three
macronutrients (Ca: f(2,54) = 35.7, P < 0.005; Mg: f(2,53) = 16.1, P < 0.005; P: f(2,54) = 4.93,
P = 0.011; Table 3.4), but no consistent increasing or decreasing patterns were observed.
Serum Ca annual means exceeded the 8.0 mg/dl threshold (see Table 3.1) in 2006 and
79

2007, but were just below this level in 2005 (Table 3.4). When moose were compared
individually, 18% (11 of 58) had Ca levels below the 8.0 mg/dl threshold. Fifty-seven
percent (33 of 58) of sampled moose were below the 4.5 mg/dl threshold (see Table 3.1)
for serum P and annual means were below this level in 2005 and 2007 (Table 3.4).
Serum Mg annual means exceeded the 1.8 mg/dl threshold (see Table 3.1) during all
years (Table 3.4) and only 12% (7 of 57) of individual moose were below this level.
The proportions of moose with PCV, Hb, TSP, Ca, and P values lower than those
reported for Alaskan moose considered to be in average to above average condition (see
Table 3.1) varied (Table 3.5). Most sampled moose fell below the average moose
thresholds for Hb, Ca, and P. Approximately half of the moose sampled were below
average for PCV while only one-third were below for TSP. Mean Hb concentrations
were lower in all years while PCV was lower in 2006 and 2007 (Table 3.3). Serum levels
of Ca and P were lower in all years and TSP was lower in 2005, but higher than the
average moose threshold in 2006 and 2007 (Table 3.4).
Of the 13 serum chemical parameters analyzed, 2 exhibited a significant
relationship with rump fat depth (n = 43). Aspartate aminotransferase (rs = -0.339, P =
0.041; Figure 3.1) and LDH (rs = -0.327, P = 0.049; Figure 3.2) were both inversely
correlated with depth of rump fat. The enzyme CK revealed a partial correlation that was
negatively related to rump fat (rs = -0.317, P = 0.057; Figure 3.3) when all moose were
included. However, when one moose with a CK value >1000 U/l was removed from
analyses, the direction of correlation reversed and the relationship became insignificant
(rs = 0.237, P = 0.130). No significant relationship was observed between rump fat and
any hematological parameters (n = 38).
80

Serum and Hair Trace Mineral Analyses
Serum Cu, Fe, and Zn were detected in all moose (Table 3.6), whereas Mn and
Mb had levels below the MDL and were not detected in any sample. There was not a
significant difference among years in Cu (P = 0.329), but significant differences were
observed for Fe (f(2,47) = 3.79, P = 0.030) and Zn (f(2,47) = 25.1, P < 0.005). No consistent
increasing or decreasing patterns were observed for the annual means of Fe and Zn.
When compared to domestic ruminants (see Table 3.1), sampled moose were deficient in
Cu during all years and deficient in Zn in 2005 and 2007 (Table 3.6). When examined
individually, a high proportion of moose were deficient in Cu and Zn (Table 3.6) and all
moose above the Zn deficiency threshold were sampled in 2006 (n = 15). Serum Fe
annual means exceeded the 1.1 ppm threshold (see Table 3.1) during all years and only
2% (1 of 50) of individual moose were below this level (Table 3.6).
Hair concentrations of As, Cd, Co, Hg, Mb, Ni, Se, Tl, V, and Sn were
consistently below MDL whereas all samples had detectable levels of Ba, Cr, Cu, Fe,
Mn, Pb, and Zn (Table 3.6). There were no significant differences among years in Cu (P
= 0.279), Mn (P = 0.429), and Pb (P = 0.080), but significant differences were evident for
Ba (f(2,56) = 3.34, P = 0.043), Cr (f(2,56) = 4.80, P = 0.012), Fe (f(2,56) = 4.52, P = 0.015),
and Zn (f(2,56) = 11.80, P < 0.005). No consistent increasing or decreasing patterns were
observed in concentrations of Ba, Cr, and Zn, but Fe concentrations showed a generally
decreasing pattern with 2007 means significantly lower than 2005. Hair annual means
for Cu, Fe, Zn, and Mn were below deficiency thresholds for domestic ruminants (see
Table 3.1) during all years (Table 3.6). When examined individually, all moose were
81

deficient in Cu, Zn, and Mn while all but 3 moose were below the deficiency threshold
for Fe (Table 3.6).
In order to test the hypothesis that a stressful event (i.e., captures) may increase
the incidence of perinatal mortality, I examined the relationship between serum and hair
Cu concentrations collected from adult female moose in winter and the presence of a calf
in spring. All years were pooled and logistic regression failed to reveal a significant
relationship between mean serum (P = 0.275, df = 35; Figure 3.4) or hair (P = 0.231, df =
44; Figure 3.5) Cu concentrations and the presence of a calf in the spring. The mean
serum Cu concentration for pregnant cows observed with a calf was 0.52 ppm (SD =
0.08, n = 9) and for pregnant cows not observed with a calf was 0.47 ppm (SD = 0.11, n =
28). The mean hair Cu concentration for pregnant cows observed with a calf was 4.62
ppm (SD = 0.69, n = 11) and for pregnant cows not observed with a calf was 4.56 ppm
(SD = 0.70, n = 35). There were no significant differences between mean serum (t =
-1.22, df = 35, P = 0.230) or hair (t = -0.23, df = 44, P = 0.821) Cu concentrations and the
presence of a calf in the spring.
DISCUSSION
Blood Parameters and Rump Fat
Although PCV, Hb, TSP, Ca, and P have been used to evaluate habitat quality and
the nutritional status of Alaskan moose (Franzmann and LeResche 1978), none of these
parameters were correlated with rump fat depth of Shiras moose in this study. My results
suggest that the serum enzymes AST and LDH may be good predictors of Shiras moose
82

condition as indexed by ultrasonic rump fat measurements. Similar to my study, AST
was found to be negatively correlated with rump fat of Alaskan moose (Keech et al.
1998). The authors suggested that decreased AST levels reduced moose susceptibility to
disease since they were generally in better physical condition. Although this may be true,
AST and LDH are indicators of muscle or organ damage generally associated with
exertional myopathy (EM; Williams and Thorne 1996). Levels of AST for Shiras moose
were not indicative of EM and were well below values reported for bighorn sheep (Ovis
canadensis) that were stressed or subsequently developed EM (Kock et al. 1987).
Additionally, levels of AST were well below values reported for normal moose (Haigh et
al. 1977) which suggests that EM had little influence on these relationships. The inverse
relationships that I observed between AST, LDH, and rump fat are consistent with
increased utilization of body proteins from muscle and organ tissues as lipid reserves
decline in lean animals. Indeed, Cherel et al. (1992) observed a similar trend in that lean
rats utilized greater amounts of muscle protein during phase II fasting (i.e., protein
sparing) than did obese rats. While I observed a significant relationship between two
serum enzymes and rump fat depth, similar to research conducted on caribou (Rangifer
tarandus; Messier et al. 1987), elk (Cook et al. 2001) and moose (Keech et al. 1998), I
cannot conclude that a set of blood parameters has been identified that accurately reflects
Shiras moose nutritional status as indexed by rump fat at this time.
Maximum rump fat depth indicated that moose in the study area were in relatively
good physical condition. When compared to rump fat of moose captured during early to
mid-March in Alaska (Keech et al. 1998, Bertram and Vivion 2002, Boertje et al. 2007),
the study population displayed nearly two times more rump fat. Although I was unable to
83

compare rump fat for moose with and without calves at side, several studies have
reported that cow moose with greater amounts of rump fat were not tending calves (Testa
and Adams 1998, Keech et al. 2000). Therefore, it might be that fewer cows had calves
at side which resulted in the higher rump fat depths observed in the study area. While
rump fat may be a useful predictor of reproductive success within moose populations, it
appears to be an insensitive index of fitness when compared across populations (Boertje
et al. 2007). Heard et al. (1997) suggested that moose populations living in relatively
harsh environments or in areas with low forage quality or quantity may have a higher fat-
fertility threshold than moose populations living in milder climates with good quality
forage. Thus, the higher rump fat depths observed for the study population may be a
result of a lack of quality forage and a need for moose to maintain a greater fat threshold
so that reproductive potential was maximized. Nonetheless, a larger sample of rump fat
measurements collected across multiple locations may provide a more accurate
assessment of baseline rump fat levels and the subsequent impacts on reproductive
performance for moose in Wyoming. Similar to evaluations of elk condition (Cook et al.
2001), the thickness of specific muscles measured via ultrasonography could provide an
additional index that may be used in association with rump fat depth to provide a more
accurate assessment of the physical condition (i.e., protein versus fat catabolism) of
Shiras moose populations.
Moose in the study area appeared to be in moderate physical condition based on
the five blood parameters (PCV, Hb, TSP, Ca, and P) considered to be good predictors of
moose nutritional status (Franzmann and LeResche 1978). This indicated that habitat
conditions may be slightly suboptimal, but it is not very good or very poor. When
84

compared to Alaskan moose considered to be in good to excellent condition (Franzmann
and LeResche 1978), most adult female moose sampled were below reference values for
PCV, Hb, Ca, and P and above the reference value for TSP. When these five blood
parameters were further compared to an expanding, highly productive population and one
that was in poor condition from Alaska (i.e., populations on the extremes; Franzmann et
al. 1987), moose from the study area were intermediate. Due to the high variability in
these blood parameters for populations that fall within the extremes and annual variation
potentially caused by the severity of winters (Ballard et al. 1996), ranking one population
against another may be impractical (Franzmann et al. 1987).
Macro- and Micronutrients
Adult female moose in the study area exhibited annual variation in nearly all
macro- and micronutrients. These results indicate that the nutritional quality of moose
browse exhibits similar annual variation. Indeed, researchers in Alaska and Sweden have
reported high annual variation in the mineral content of moose browse even in the same
plant (Oldemeyer et al. 1977, Ohlson and Staaland 2001). It has been suggested that a
diversity of browse species can better meet the nutritional requirements of moose than a
single, highly abundant species (Oldemeyer et al. 1977, Miquelle and Jordan 1979,
Ohlson and Staaland 2001). Moose in the study area utilized low-elevation, riparian
habitats dominated by large communities of willow intermixed with small stands of
conifers and aspen during winter (Chapter 2), thus it may be assumed that willow
composed a high proportion of the winter diet as well. Therefore, if willows are deficient
in certain nutrients, moose that consume high quantities of willow will also be deficient
85

in these elements. Analysis of forage quality is a more precise indicator of deficiency in
most cases (McDowell 2003), thus future investigations that explore potential links
between diet diversity and nutritional deficiencies in Shiras moose will likely be
informative.
Since moose acquire nutrients directly from the plants they consume (McDowell
2003), low concentrations of some minerals in serum and hair indicated nutritional
limitations associated with moose habitat in the study area. My results indicated that
moose winter forage may have been limited in Cu, Zn, Mn, and P. Deficiencies in any
nutrient are most likely to occur during winter when the availability and mineral content
of forage is most limited (Kubota et al. 1970, Oldemeyer et al. 1977, Ohlson and Staaland
2001). Furthermore, increased intra- and interspecific competition for limited winter
forage (O’Hara et al. 2001) may exacerbate existing nutritional deficiencies due to
overutilization of resources (Barboza et al. 2003). Moose may be highly susceptible to
nutritional deficiencies (Murray et al. 2006) and, although Cu, Zn, Mn, and P deficiencies
are difficult to diagnose in wild populations, the physiological imbalances that they may
create could have had a considerable impact on the performance of the population,
particularly for the developing fetus and calf.
While I cannot conclude that low or marginal Cu has contributed to recent moose
declines, it remains a possibility. Copper concentrations in serum and hair indicated a
potential deficiency among moose in the study area. Most Cu is stored in the liver, but
when levels fall below 20 μg/g, serum and hair become sensitive indicators of Cu
deficiency among domestic ruminants (Combs 1987, Blakley et al. 1992, McDowell
2003). Copper is an essential nutrient for the developing fetus and fetal Cu demands
86
greatly increase during the final trimester of pregnancy (Puls 1994, McArdle 1995,
Rombach et al. 2003), which could increase the likelihood of reproductive failure if
maternal Cu is deficient (Hidiroglou and Knipfel 1981, McDowell 2003). Serum Cu
levels in moose from the study population were similar to levels observed by Gogan et al.
(1989) in Cu deficient elk that experienced decreased adult survival and poor recruitment.
Although direct comparisons cannot be made due to differences in dates of sample
collection, faulty hoof keratinization and decreased reproductive output have been linked
to a Cu deficiency in moose from the Kenai Peninsula, Alaska (Flynn et al. 1977).
Several other studies have also suggested the possibility of reduced Cu intake as a cause
of moose population declines in Sweden (Frank et al. 1994), Alaska (O’Hara et al. 2001),
and Minnesota (Custer et al. 2004).
There was no relationship between low or marginal serum and hair Cu levels and
the reproductive output of pregnant moose captured during winter. This contrasts with
the hypothesis proposed by O’Hara et al. (2001) who suggested that populations
experiencing marginal Cu deficiencies may not exhibit clinical symptoms (i.e., decreased
reproductive success) unless an additional stressful event occurred. Moose captured in
southeast Wyoming with similar Cu concentrations did not experience decreased
reproductive performance (E. Wald, University of Wyoming, unpublished data), but they
were captured two months prior to moose in my study. It may be that the cumulative
effects of stressors (i.e., low quality forage, moderate physical condition, environmental
conditions) near the third trimester of pregnancy combined with potential deficiencies in
several other nutrients (i.e, Mn, Zn, P) create physiological imbalances (Frank et al.
1994) that compromised reproductive performance.
87

Concentrations of Mn in hair and Zn in serum and hair indicated a potential
deficiency among moose within the study area. All moose hair samples indicated a
deficiency in these nutrients while approximately two-thirds of moose were serum Zn
deficient. All moose that were above serum Zn deficiency thresholds for domestic
ruminants were sampled in 2006 and the higher levels observed were likely a result of
sample contamination from incorrect collection procedures (Puls 1994). In domestic
ruminants, clinical signs of Mn and Zn deficiencies include reduced reproductive
performance and calf survival (Hidiroglou 1979, Hidiroglou and Knipfel 1981,
McDowell 2003). To my knowledge, clinical signs of Zn deficiency have not been
observed in wild moose populations. Although direct comparisons cannot be made to the
current study, Stewart and Flynn (1978) reported low Mn concentrations from moose hair
in Saskatchewan, Canada even though clinical signs of deficiency were not observed.
The reliability of using serum and hair to assess dietary intake of Mn and Zn is relatively
low (Smart et al. 1981, Combs 1987, McDowell 2003), but the possibility remains that
deficiencies may have impacted moose in the study area.
The low serum P observed in the sample population from 2005 and 2007 may
have been partially due to the effects of capture. Although Franzmann and LeResche
(1978) did not observe changes in P concentrations during their study, Karns and
Crichton (1978) did observe a decrease in P from the time of capture to release in
caribou. The capture techniques used during my study may have delayed sample
collection in some moose causing a decrease in P concentrations. Nonetheless,
McDowell (2003) noted that P had to be consistently below the deficiency threshold to
consider a population deficient. Since moose were not deficient in all three years of the
88

study, there is only an indication of a potential deficiency that warrants continued
evaluation.
Parasites and Disease
Insignificant loads of endoparasites were detected in some fecal samples and tick
counts indicated a relatively low infestation of winter ticks in the study area. The low
tick counts observed may have been partially due to inexperience in identifying the
nymph stage which was common during captures in February. However, patterns of hair
discoloration and loss in March and April (Lankester and Samuel 1997, Samuel 2004)
also indicated relatively low tick loads on moose from the northern part of my study area
while moose that occupied ranges to the south appeared to carry higher tick loads. In
Alberta, Canada, Drew and Samuel (1986) noted that snow cover during April adversely
affected tick survival, but warm, dry spring conditions may enhance tick reproductive
success resulting in an increased abundance the following autumn (Delguidice et al.
1997, Samuel 2004). Field observations indicated that snow cover remained longer into
spring on the northern ranges, but disappeared rapidly to the south. Similar to what has
been observed on Isle Royale (Delguidice et al. 1997) and in central Alberta (Samuel and
Baker 1979), an increase in ambient temperatures during spring could reduce snow cover
which may result in an increased number of ticks and, potentially, an increased incidence
of tick-induced mortalities the following spring (Lankester and Samuel 1997, Samuel
2004).
Diseases did not appear to be impacting moose in the study area. Elk
seroprevalence for brucellosis was 12.5% in the Buffalo Valley (Barbknecht 2008), thus
89

there was potential for disease transmission on winter range. However, experimental
studies of brucellosis in moose indicated that they may be a dead-end host for the disease
because infection leads to rapid mortality (Forbes et al. 1996). Deaths associated with
brucellosis infection have not been observed among moose in the GYE (Cook and Rhyan
2003), but clinical symptoms of infection may not be observed prior to death due to the
rapid progression of the disease in moose.
MANAGEMENT IMPLICATIONS
Measures of physiological health of adult female Shiras moose in the study area
indicated that they were in moderate physical condition and appeared to have deficiencies
of several important nutrients. Consequently, they may be more susceptible to
environmental stressors that could result in increased mortality and decreased
reproductive performance. These effects may be most evident during spring following a
severe winter. Indeed, this population has experienced increased spring mortalities
before and it was suspected that the combination of severe winters and habitat quality
may have contributed to population fluctuations from 1950-1966 (Houston 1968).
Therefore, habitat improvement projects could be initiated on primary moose winter
ranges to improve habitat quality. This could be completed on a large-scale over multiple
years so that high numbers of moose do not reduce the growth potential of preferred
forage and the amount of available forage remains sufficient even during high snow
years. In addition to twinning rates and age of first reproduction, the percent utilization
of current annual growth of preferred forage has been identified as an additional measure
90

to assess the nutritional status of a population (Boertje et al. 2007), thus managers could
also expand current habitat monitoring programs to document browse removal rates of
preferred winter forage as well as the nutritional quality of the habitat.
Because the combination of nutritional deficiencies and relatively high rump fat
levels indicated a high fat-fertility threshold for this moose population (Heard et al.
1997), the continued collection of rump fat measurements and reproductive performance
data remains paramount. Only after sufficient baseline data are available on rump fat
depths can interpretation of the fat-fertility threshold for the population be evaluated.
Rump fat measurements could be collected from harvested moose at check stations which
may provide managers with a general index of the nutritional condition within herd units
statewide. Blood samples can also be collected to further examine the relationship
between rump fat depth, AST, and LDH. If after further evaluation this relationship
appears valid, managers may be able to assess the nutritional condition of moose without
the need for an ultrasound.
91
LITERATURE CITED
Arnemo, J. M., T. J. Kreeger, and T. Soveri. 2003. Chemical immobilization of free-
ranging moose. Alces 39: 243-253.
Ballard, W. B., P. J. MacQuarrie, A. W. Franzmann, and P. R. Krausman. 1996. Effects
of winters on physical condition of moose in south-central Alaska. Alces 32: 51-
59.
Barbknecht, A. E. 2008. Ecology of elk parturition across winter feeding opportunities
in the brucellosis endemic area of Wyoming. Thesis, Iowa State University,
Ames, Iowa, USA.
Barboza, P. S., R. P Rombach, J. E. Blake, and J. A. Nagy. 2003. Copper status of
muskoxen: a comparison of wild and captive populations. Journal of Wildlife
Diseases 39: 610-619.
Berger, J., J. W. Testa, T. Roffe, and S. L. Monfort. 1999. Conservation endocrinology:
a noninvasive tool to understand relationships between carnivore colonization and
ecological carrying capacity. Conservation Biology 13: 980-989.
Berger, J., P. B. Stacey, L. Bellis, and M. P. Johnson. 2001. A mammalian predator-prey
imbalance: grizzly bear and wolf extinction affect avian neotropical migrants.
Ecological Applications 11: 947-960.
Bertram, M. R., and M. T. Vivion. 2002. Moose mortality in eastern interior Alaska.
Journal of Wildlife Management 66: 747-756.
Blakley, B. R., J. C. Haigh, and W. D. McCarthy. 1992. Concentrations of copper in
tissues of wapiti raised in Saskatchewan. The Canadian Veterinary Journal 33:
549-550.
92

Boertje, R. D., Kellie, K. A., C. T. Seaton, M. A. Keech, D. D. Young, B. W. Dale, L. G.
Adams, and A. R. Aderman. 2007. Ranking Alaska moose nutrition: Signals to
begin liberal antlerless harvests. Journal of Wildlife Management 71: 1494-1506.
Boyce, M. S. 1989. The Jackson elk herd: intensive wildlife management in North
America. Cambridge University Press, Cambridge, England.
Brimeyer, D. G., and T. P. Thomas. 2004. History of moose management in Wyoming
and recent trends in Jackson Hole. Alces 40: 133-143.
Cherel, Y., J. P. Robin, A. Heitz, C. Calgari, and Y. L. Maho. 1992. Relationships
between lipid availability and protein utilization during prolonged fasting.
Journal of Comparative Physiology B 162: 305-313.
Cole, G. F. 1969. The elk of Grand Teton and south Yellowstone National Parks.
National Park Service Research Report GRTE-N-1. Washington, D.C., USA.
Combs, D. K. 1987. Hair analysis as an indicator of mineral status of livestock. Journal
of Animal Science 65: 1753-1758.
Cook, R. C., J. G. Cook, D. L. Murray, P. Zager, B. K. Johnson, and M. W. Gratson.
2001. Development of predictive models of nutritional condition for Rocky
Mountain elk. Journal of Wildlife Management 65: 973-987.
Cook, W., and J. Rhyan. 2003. Brucellosis vaccines and non-target species. Pages 61-
65 in T. J. Kreeger, ed. Brucellosis in elk and bison in the Greater Yellowstone
Area. Greater Yellowstone Interagency Brucellosis Committee, 17-18 September
2002, Jackson, Wyoming, USA.
93
Custer, T. W., E. Cox, and B. Gray. 2004. Trace elements in moose (Alces alces) found
dead in northwestern Minnesota, USA. The Science of the Total Environment
330: 81-87.
Delgiudice, G. D., R. O. Petersen, and W. M. Samuel. 1997. Trends of winter nutritional
restriction, ticks, and numbers of moose on Isle Royale. Journal of Wildlife
Management 61: 895-903.
Drew, M. L., and W. M. Samuel. 1986. Reproduction of the winter tick, Dermacentor
albipictus, under field conditions in Alberta. Canadian Journal of Zoology 64:
714-721.
Flynn, A., A. W. Franzmann, P. D. Arneson, and J. L. Oldemeyer. 1977. Indications of
copper deficiency in a subpopulation of Alaskan moose. Journal of Nutrition 107:
1182-1189.
Flynn, A., and A. W. Franzmann. 1987. Mineral element studies in North American
moose. Swedish Wildlife Research (Supplement) 1: 289-299.
Forbes, L. B., S. V. Tessaro, and W. Lees. 1996. Experimental studies on Brucella
abortus in moose (Alces alces). Journal of Wildlife Diseases 32: 94-104.
Frank, A., V. Galgon, and L. R. Petersson. 1994. Secondary copper deficiency,
chromium deficiency and trace element imbalance in the moose (Alces alces L.):
Effect of anthropogenic activity. Ambio 23: 315-317.
Franzmann, A. W., A. Flynn, P. D. Arneson, and J. L. Oldemeyer. 1974. Monitoring
moose mineral metabolism via hair element analysis. Proceedings of the North
American Moose Conference and Workshop 10: 1-21.
94
Franzmann, A.W. 1977. Condition assessment of Alaskan moose. Proceedings of the
North American Moose Conference and Workshop 13: 119-127.
Franzmann, A. W., and R. E. LeResche. 1978. Alaskan moose blood studies with
emphasis on condition evaluation. Journal of Wildlife Management 42: 334-351.
Franzmann, A. W. 1985. Assessment of nutritional status. Pages 239-259 in R. J.
Hudson and R. G. White, eds. Bioenergetics of wild herbivores. CRC Press.
Boca Raton, Florida, USA.
Franzmann, A. W., and C. C. Schwartz. 1985. Moose twinning rates: a possible
population condition assessment. Journal of Wildlife Management 49: 394-396.
Franzmann, A. W., C. C. Schwartz, and D. C. Johnson. 1987. Monitoring status
(condition, nutrition, health) of moose via blood. Swedish Wildlife Research
(Supplement) 1: 281-287.
Gogan, P. J. P., D. A. Jessup, and M. Akeson. 1989. Copper deficiency in tule elk at
Point Reyes, California. Journal of Range Management 42: 233-238.
Haigh, J. C., R. R. Stewart, G. Wobeser, and P. S. MacWilliams. 1977. Capture
myopathy in a moose. Journal of the American Veterinary Medical Association
171: 924-926.
Heard, D., S. Barry, G. Watts, and K. Child. 1997. Fertility of female moose (Alces
alces) in relation to age and body composition. Alces 33: 165-176.
Hidiroglou, M. 1979. Trace element deficiencies and fertility in ruminants: a review.
Journal of Dairy Science 62: 1195-1206.
95

Hidiroglou, M., and J. E. Knipfel. 1981. Maternal-fetal relationships of copper,
manganese, and sulfur in ruminants. A review. Journal of Dairy Science 64:
1637-1647.
Hosmer, D. W., and S. Lemeshow. 2000. Applied logistic regression. Second edition.
John Wiley and Sons, New York, New York, USA.
Houston, D. B. 1968. The Shiras moose in Jackson Hole, Wyoming. Technical Bulletin
No. 1. Grand Teton Natural History Association.
Houston, D. B. 1969. A note on the blood chemistry of Shiras moose. Journal of
Mammalogy 50: 826.
Karns, P. D., and V. F. J. Crichton. 1978. Effects of handling and physical restraint on
blood parameters of woodland caribou. Journal of Wildlife Management 42: 904-
908.
Keech, M. A., T. R. Stephenson, R. T. Bowyer, V. Van Ballenberghe, and J. M. Ver
Hoef. 1998. Relationships between blood-serum variables and depth of rump fat
in Alaskan moose. Alces 34: 173-179.
Keech, M. A., R. T. Bowyer, J. M. Ver Hoef, R. D. Boertje, B. W. Dale, and T. R.
Stephenson. 2000. Life history consequences of maternal condition in Alaskan
moose. Journal of Wildlife Management 64: 450-462.
Knight, D. L. 1994. Mountains and plains: the ecology of Wyoming landscapes. Yale
University Press. New Haven, Connecticut, USA.
Kock, M. D., R. K. Clark, C. E. Franti, D. A. Jessup, and J. D. Wehausen. 1987. Effects
of capture on biological parameters in free-ranging bighorn sheep (Ovis
96

canadensis): evaluation of normal, stressed and mortality outcomes and
documentation of postcapture survival. Journal of Wildlife Diseases 23: 652-662.
Kreeger, T. J., W. H. Edwards, E. J. Wald, S. A. Becker, D. Brimeyer, G. Fralick, and J.
Berger. 2005. Health assessment of Shiras moose immobilized with thiafentanil.
Alces 41: 121-128.
Kubota, J., S. Rieger, and V. A. Lazar. 1970. Mineral composition of herbage browsed
by moose in Alaska. Journal of Wildlife Management 34: 565-569.
Lankester, M. W., and W. M. Samuel. 1997. Pests, parasites, and diseases. Pages 479-
517 in A. W. Franzmann and C. C. Schwartz, eds. Ecology and management of
North American moose. Smithsonian Institute Press, Washington, D.C., USA.
McArdle, H. J. 1995. The metabolism of copper during pregnancy – a review. Food
Chemistry 54: 79-84.
McDowell, L. R. 2003. Minerals in animal and human nutrition. Second Edition.
Elsevier Science B.V., Amsterdam, The Netherlands.
McJames, S. W., J. F. Kimball, and T. H. Stanley. 1994. Immobilization of moose with
A-3080 and reversal with nalmefene HCl or naltrexone HCl. Alces 30: 21-24.
Messier, F., J. Huot, F. Goudreault, and A. V. Tremblay. 1987. Reliability of blood
parameters to assess the nutritional status of caribou. Canadian Journal of
Zoology 65: 2413-2416.
Miquelle, D. G., and P. A. Jordan. 1979. The importance of diversity in the diet of
moose. Proceedings of the North American Moose Conference and Workshop
15: 54-79.
97

Murray, D. L., E. W. Cox, W. B. Ballard, M. S. Lenarz, T. W. Custer, T. Barnett, and T.
K. Fuller. 2006. Pathogens, nutritional deficiency, and climate influences on a
declining moose population. Wildlife Monographs 166.
O’Hara, T. M., G. Carroll, P. Barboza, K. Mueller, J. Blake, V. Woshner, and C.
Willetto. 2001. Mineral and heavy metal status as related to a mortality event
and poor recruitment in a moose population in Alaska. Journal of Wildlife
Diseases 37: 509-522.
Ohlson, M., and H. Staaland. 2001. Mineral diversity in wild plants: benefits and bane
for moose. Oikos 94: 442-454.
Oldemeyer, J. L., A. W. Franzmann, A. L. Brundage, P. D. Arneson, and A. Flynn. 1977.
Browse quality and the Kenai moose population. Journal of Wildlife
Management 41: 533-542.
Puls, R. 1994. Mineral levels in animal health: diagnostic data. Sherpa International,
Clearbrook, British Columbia, Canada.
Rombach, E. P., P. S. Barboza, and J. E. Blake. 2003. Costs of gestation in an Arctic
ruminant: copper reserves in muskoxen. Comparative Biochemistry and
Physiology Part C 134: 157-168.
Samuel, W. M, and M. J. Barker. 1979. The winter tick, Dermacentor albipictus
(Packard, 1969) on moose, Alces alces (L.), of central Alberta. Proceedings of the
North American Moose Conference and Workshop 15: 303-348.
Samuel, W. M. 2004. White as a ghost: winter ticks and moose. Federation of Alberta
Naturalists. Edmonton, Alberta, Canada.
98

Seal, U. S., and R. L. Hoskinson. 1978. Metabolic indicators of habitat condition and
capture stress in pronghorns. Journal of Wildlife Management 42: 755-763.
Seal, U. S., M. E. Nelson, L. D. Mech, and R. L. Hoskinson. 1978. Metabolic indicators
of habitat differences in four Minnesota deer populations. Journal of Wildlife
Management 42: 746-754.
Smart, M. E., J. Gudmundson, and D. A. Christiensen. 1981. Trace mineral deficiencies
in cattle: a review. The Canadian Veterinary Journal 22: 372-376.
Stephenson, T. R., K. J. Hundertmark, C. C. Schwartz, and V. Van Ballenberghe. 1993.
Ultrasonic fat measurements of captive yearling bull moose. Alces 29: 115-123.
Stephenson, T. R., K. J. Hundertmark, C. C. Schwartz, and V. Van Ballenberghe. 1998.
Predicting body fat and body mass in moose with ultrasonography. Canadian
Journal of Zoology 76: 717-722.
Stephenson, T. R. 2003. Physiological ecology of moose: nutritional requirements for
reproduction with respect to body condition thresholds. Federal Aid in Wildlife
Restoration Research Final Performance Report. Project 1.52. Alaska
Department of Fish and Game, Juneau, Alaska, USA.
Stewart, R. R., and A. Flynn. 1978. Mineral element levels in Saskatchewan moose hair.
Proceedings of the North American Moose Conference and Workshop 14: 141-
156.
Testa, J. W., and G. P. Adams. 1998. Body condition and adjustments to reproductive
effort in female moose (Alces alces). Journal of Mammalogy 79: 1345-1354.
WallisDeVries, M. F. 1998. Habitat quality and the performance of large herbivores.
Pages 275-320 in M. F. WallisDeVries, J. P. Bakker, and S. E. Van Wieren, eds.
99

Grazing and conservation management. Kluwer Academic Publishers, Dordrecht,
The Netherlands.
Weber, B. J., M. L. Wolfe, G. C. White, and M. M. Rowland. 1984. Physiologic
response of elk to differences in winter range quality. Journal of Wildlife
Management 48: 248-253.
Whitlock, C. 1993. Postglacial vegetation and climate of Grand Teton and southern
Yellowstone National Parks. Ecological Monographs 63: 173-198.
Wigglesworth, R. R., and D. G. Wachob. 2004. Historical and present habitat conditions
on the Jackson Hole, Wyoming moose winter range. Teton Science Schools
Conservation Research Center, Jackson, Wyoming, USA.
Williams, E. S., and E. T. Thorne. 1996. Exertional myopathy (capture myopathy).
Pages 181-193 in A. Fairbrother, L. N. Locke, and G. L. Hoff, eds. Noninfectious
diseases of wildlife. Second Edition. Iowa State University Press, Ames, Iowa,
USA.
100

101
Table 3.1. Reference values used in application of the animal indicator concept for
Shiras moose in northwest Wyoming.
Parameter (units) Sample type Reference
Packed cell volume (%) Blood 50.0a
Hemoglobin (g/dl) Blood 18.6a
Total serum protein (g/dl) Serum 7.5a
Calcium (mg/dl) Serum 10.4a
Serum < 8.0c
Phosphorous (mg/dl) Serum 5.2a
Serum < 4.5b
Copper (ppm) Serum < 0.6b,c
Hair < 6.7c
Iron (ppm) Serum < 1.1b
Hair ≤ 40.0c
Magnesium (mg/dl) Serum < 1.8b
Manganese (ppm) Hair < 5.0b
Zinc (ppm) Serum < 1.0b
Hair < 100.0b
a Values for Alaskan moose in average to above average condition (Franzmann and LeResche 1978).
b Deficiency level for cattle and sheep; Mn levels are indicative of slight deficiency, lower normal limit for serum Mg and may not be indicative of true deficiency (McDowell 2003).
c Deficiency level for cattle; lower normal limit for serum Ca and may not be indicative of true deficiency (Puls 1994).
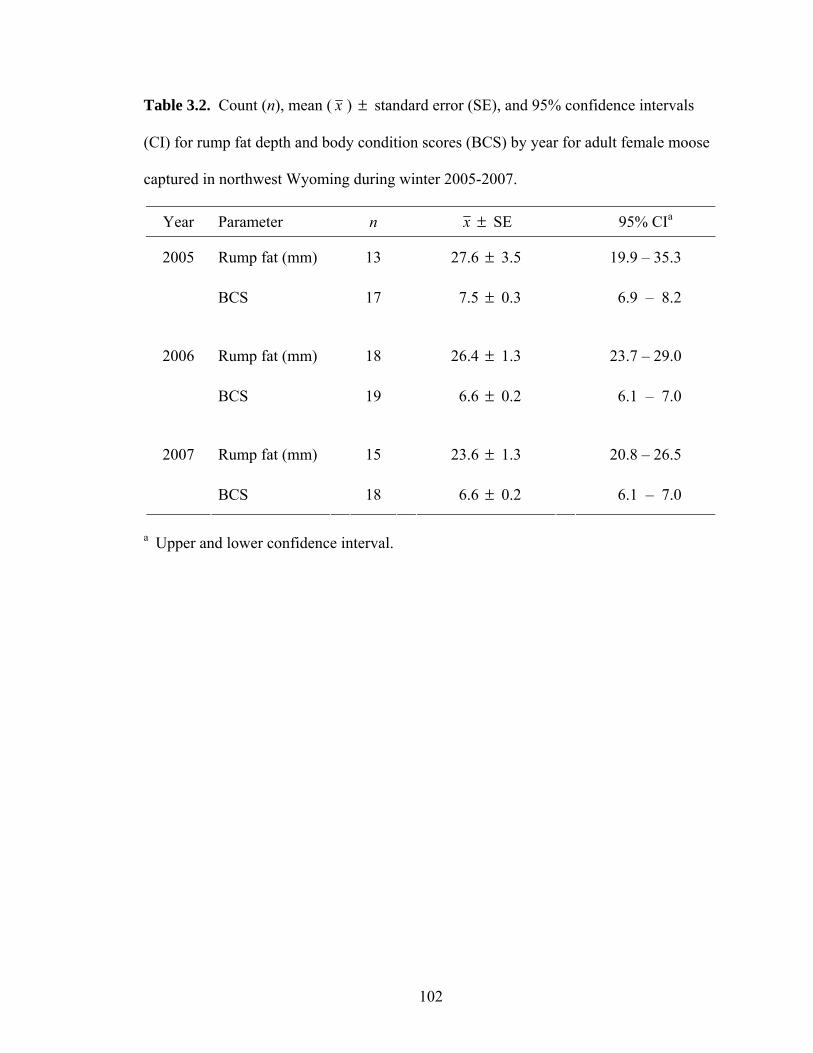
Table 3.2. Count (n), mean ( x ) standard error (SE), and 95% confidence intervals
(CI) for rump fat depth and body condition scores (BCS) by year for adult female moose
captured in northwest Wyoming during winter 2005-2007.
±
Year Parameter n x ± SE 95% CIa
2005 Rump fat (mm) 13 27.6 3.5 ± 19.9 – 35.3
BCS 17
7.5 0.3 ±
6.9 – 8.2
2006 Rump fat (mm) 18 26.4 1.3 ± 23.7 – 29.0
BCS
19
6.6 0.2 ±
6.1 – 7.0
2007 Rump fat (mm) 15 23.6 1.3 ± 20.8 – 26.5
BCS
18
6.6 0.2 ±
6.1 – 7.0
a Upper and lower confidence interval.
102

103
Table 3.3. Mean standard deviation for hematological analyses of adult female moose captured in northwest Wyoming during
winter 2005-2007.
±
Year
Parametera (units) 2005 (n = 19) 2006 (n = 16) 2007 (n = 16)
PCV (%) 54.7 7.9 ± 45.6 4.5 ± 49.7 5.2 ±
Hb (g/dl) 16.5 2.1 ± 15.6 1.6 ± 17.2 1.7 ±
MCHC (g/dl) 30.6 4.8 ± 34.2 1.9 ± 34.7 2.0 ±
RBC (x 106/μl) 7.9 1.3 ± 6.8 0.6 ± 7.3 0.7 ±
Total WBC (/μl) 5296.8 1581.2 ± 5967.5 1466.2 ± 6952.5 1706.7 ±
Lymphocytes (%) 56.1 9.6 ± 56.4 9.9 ± 63.7 13.2 ±
Neutrophils (%) 36.2 8.7 ± 37.3 8.9 ± 27.9 11.2 ±
Eosinophils (%) 4.4 3.2 ± 3.7 2.9 ± 5.4 4.1 ±
Monocytes (%) 3.3 1.8 ± 2.7 1.1 ± 2.4 1.0 ±
Platelets (x 103/μl) 189.4 53.0 ± 148.4 58.5 ± 177.8 58.7 ±
a PCV = packed cell volume; Hb = hemoglobin; MCHC = mean corpuscular hemoglobin concentration; RBC = red blood cell; WBC
= white blood cell.
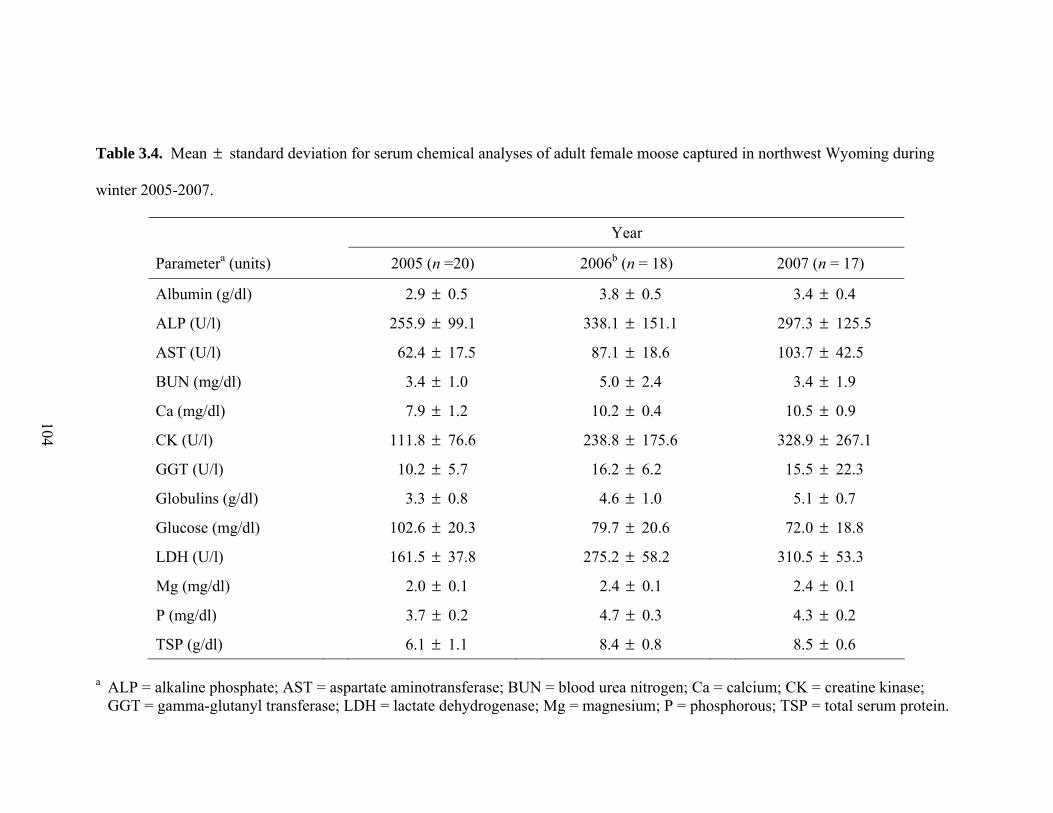
Table 3.4. Mean standard deviation for serum chemical analyses of adult female moose captured in northwest Wyoming during
winter 2005-2007.
±
Year
Parametera (units) 2005 (n =20) 2006b (n = 18) 2007 (n = 17)
Albumin (g/dl) 2.9 0.5 ± 3.8 0.5 ± 3.4 0.4 ±
ALP (U/l) 255.9 99.1 ± 338.1 151.1 ± 297.3 125.5 ±
AST (U/l) 62.4 17.5 ± 87.1 18.6 ± 103.7 42.5 ±
BUN (mg/dl) 3.4 1.0 ± 5.0 2.4 ± 3.4 1.9 ±
Ca (mg/dl) 7.9 1.2 ± 10.2 0.4 ± 10.5 0.9 ±
CK (U/l) 111.8 76.6 ± 238.8 175.6 ± 328.9 267.1 ±
GGT (U/l) 10.2 5.7 ± 16.2 6.2 ± 15.5 22.3 ±
Globulins (g/dl) 3.3 0.8 ± 4.6 1.0 ± 5.1 0.7 ±
Glucose (mg/dl) 102.6 20.3 ± 79.7 20.6 ± 72.0 18.8 ±
LDH (U/l) 161.5 37.8 ± 275.2 58.2 ± 310.5 53.3 ±
Mg (mg/dl) 2.0 0.1 ± 2.4 0.1 ± 2.4 0.1 ±
P (mg/dl) 3.7 0.2 ± 4.7 0.3 ± 4.3 0.2 ±
TSP (g/dl) 6.1 1.1 ± 8.4 0.8 ± 8.5 0.6 ±
104
a ALP = alkaline phosphate; AST = aspartate aminotransferase; BUN = blood urea nitrogen; Ca = calcium; CK = creatine kinase;
GGT = gamma-glutanyl transferase; LDH = lactate dehydrogenase; Mg = magnesium; P = phosphorous; TSP = total serum protein.

Table 3.4. Continued.
b ALP, CK, and Mg (n = 17).
105
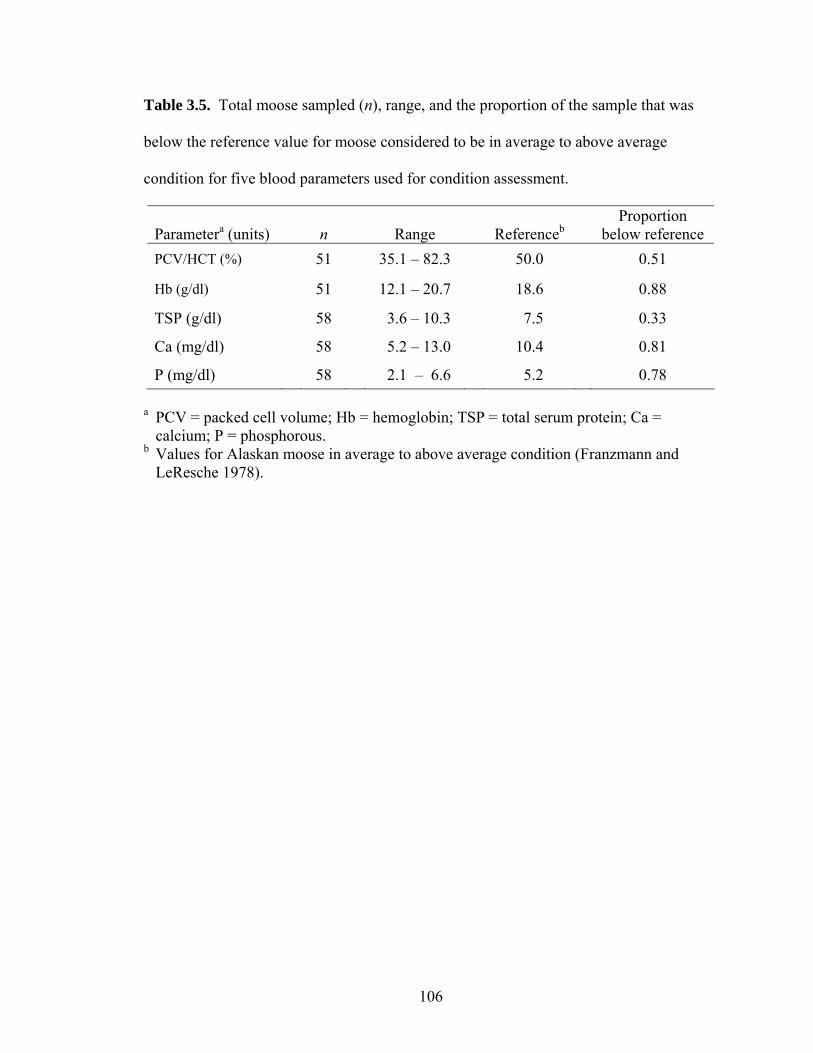
106
Table 3.5. Total moose sampled (n), range, and the proportion of the sample that was
below the reference value for moose considered to be in average to above average
condition for five blood parameters used for condition assessment.
Parametera (units) n Range Referenceb Proportion
below reference
PCV/HCT (%) 51 35.1 – 82.3 50.0 0.51
Hb (g/dl) 51 12.1 – 20.7 18.6 0.88
TSP (g/dl) 58 3.6 – 10.3 7.5 0.33
Ca (mg/dl) 58 5.2 – 13.0 10.4 0.81
P (mg/dl) 58 2.1 – 6.6 5.2 0.78
a PCV = packed cell volume; Hb = hemoglobin; TSP = total serum protein; Ca =
calcium; P = phosphorous. b Values for Alaskan moose in average to above average condition (Franzmann and
LeResche 1978).

107
Table 3.6.
were deficient in m
published d
Year
Element (units) Sample
type 2005 2006 2007
Published deficiency
levels (ppm)
Proportion below
deficiency level
Copper (ppm) Serum 0.51 0.09± 0.46 0.14± 0.45 0.10± < 0.6a,b 0.84
Hair 4.76 0.72± 4.63 0.56± 4.43 0.65± < 6.7b 1.00
Iron (ppm) Serum 2.78 0.38± 2.33 0.74± 2.32 0.46± < 1.1a 0.02
Hair 26.35 16.7± 19.12 8.32± 15.37 6.54± ≤ 40b 0.95
Zinc (ppm) Serum 0.58 0.13± 1.42 0.60± 0.71 0.09± < 1.0a 0.70
Hair 82.64 7.74± 89.49 3.52± 89.86 2.98± < 100a 1.00
Manganese (ppm) Hair 1.09 0.16± 0.79 0.08± 1.00 0.25± < 5.0a 1.00
Barium (ppm) Hair 1.29 0.74± 1.79 0.63± 1.73 0.64±
Chromium (ppm) Hair 1.73 0.55± 1.39 0.20± 1.57 0.29±
Lead (ppm) Hair 0.17 0.09± 0.11 0.06± 0.26 0.35±
Annual mean standard deviation, published deficiency levels, and the proportion of sampled adult female moose that
acro- and micronutrients analyzed in serum and hair from northwest Wyoming during winter 2005-2007. No
eficiency levels are reported for barium, chromium, and lead.
±
Deficiency level for cattle and sheep; Mn levels are indicative of slight deficiency (McDowell 2003). Deficiency level for cattle (Puls 1994).
P
a
P
b
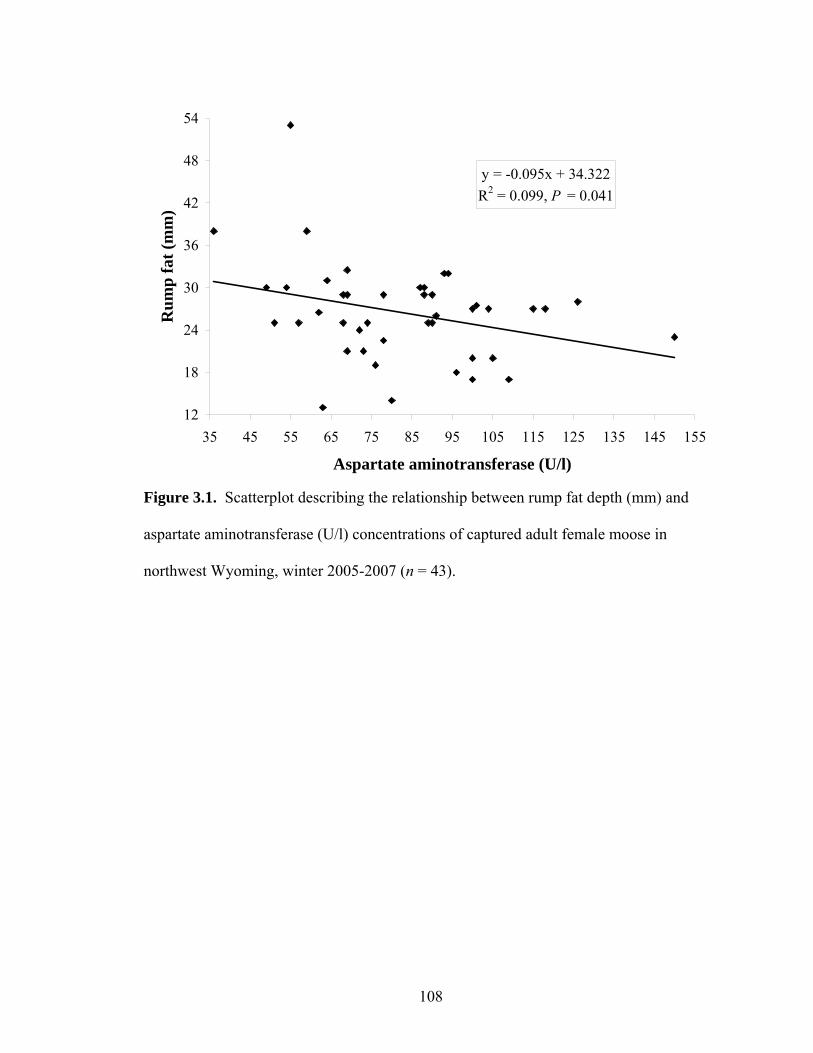
108
y = -0.095x + 34.322
R2 = 0.099, P = 0.041
24
30
36
42
48
54
115 125 135 145 155
nsferase (U/l)
Ru
mp
fat
(m
m)
Figure 3.1.
aspartate aminotransferase (U
northwest Wyom
12
18
35 45 55 65 75 85 95 105
Aspartate aminotra
Scatterplot describing the relationship between rump fat depth (mm) and
/l) concentrations of captured adult female moose in
ing, winter 2005-2007 (n = 43).

y = -0.027x + 33.218
R2 = 0.083, P = 0.049
12
18
24
30
36
42
48
54
50 100 150 200 250 300 350 400 450
Lactate dehydrogenase (U/l)
Ru
mp
fat
(m
m)
Figure 3.2. Scatterplot describing the relationship between rump fat depth (mm) and
lactate dehydrogenase (U/l) concentrations of captured adult female moose in northwest
Wyoming, winter 2005-2007 (n = 43).
109

y = -0.007x + 28.079
R2 = 0.043, P = 0.057
12
18
24
30
36
42
48
54
0 200 400 600 800 1000 1200
Creatine kinase (U/l)
Ru
mp
fat
(m
m)
Figure 3.3. Scatterplot describing the relationship between rump fat depth (mm) and
creatine kinase (U/l) concentrations of captured adult female moose in northwest
Wyoming, winter 2005-2007 (n = 43). When the outlier was removed, this relationship
became insignificant (P = 0.130).
110

0.20 0.30 0.40 0.50 0.60 0.70 0.80
Serum Cu (ppm)
Ob
serv
ed w
ith
cal
f in
sp
rin
g
No
Yes
Figure 3.4. Regression of calf presence in spring on serum Cu concentration (ppm) for
pregnant adult female moose captured in northwest Wyoming, 2005-2007. The top row
represents Cu concentrations for cows observed with a calf in the spring (n = 9) and the
bottom row represents Cu concentrations for cows not observed with a calf in the spring
(n = 28).
111

3.00 3.50 4.00 4.50 5.00 5.50 6.00 6.50 7.00
Hair Cu (ppm)
Ob
serv
ed w
ith
cal
f in
sp
rin
g
No
Yes
Figure 3.5. Regression of calf presence in spring on hair Cu concentration (ppm) for
pregnant adult female moose captured in northwest Wyoming, 2005-2007. The top row
represents Cu concentrations for cows observed with a calf in the spring (n = 11) and the
bottom row represents Cu concentrations for cows not observed with a calf in the spring
(n = 35).
112

CHAPTER 4
THE DYNAMICS OF A SHIRAS MOOSE POPULATION IN A MULTIPLE
PREDATOR AND PREY ECOSYSTEM IN NORTHWEST WYOMING
In the format of a paper in the Journal of Wildlife Management
INTRODUCTION
Estimating population growth and demographic rates are fundamental to the study
of animal populations. By understanding demographic parameters, managers can make
more informed decisions regarding management practices that may reduce the effects of
factors limiting population growth. Limiting factors can be broadly defined as aspects of
the environment or interactions among species that alter vital rates resulting in a change
in the observed population growth rate (Messier 1991, Messier 1994, Van Ballenberghe
and Ballard 1994). While experimental determination of the relative forces that control
population growth is difficult, insights into causal mechanisms may be inferred by
detailed demographic studies. In comparison to analyses of population trend data,
demographic studies (i.e., estimation of individual vital rates) can reveal the proximal
factors that may influence population growth such as resource limitation, predation,
disease, competition, or several factors working in combination. Although controversy
remains in regards to population limitation or regulation of ungulates (Boutin 1992, Van
Ballenberghe and Ballard 1994), the two factors most often identified as influencing the
rate of population growth, either singly or in combination, are habitat and predation
(Messier 1991, Testa 2004).
113

Moose (Alces alces) are an important game species and play a vital role in
complex ecosystems with multiple predator and prey assemblages. While much research
has been devoted to the population dynamics of moose, including some of the seminal
work in population ecology (Peterson 1977), there is considerable variation regarding the
relative influence of habitat and predation as limiting factors. For example, in interior
Alaska, one moose population appeared to be limited primarily by density-dependent
factors (Keech et al. 2000), while an adjacent population appeared to be limited by
predation on calves (Bowyer et al. 1998).
Much of the research conducted in North America on the dynamics of moose
populations has involved ecosystems where moose were the dominant prey for large
predators (Bergerud et al. 1983, Gasaway et al. 1992, Bertram and Vivion 2002).
However, where moose are not the dominant prey, the factors influencing population
dynamics may vary considerably (Gasaway et al. 1983, Ballard and Larsen 1987, Van
Ballenberghe 1987, Kunkel and Pletscher 1999). The complexity of systems with
multiple prey and predator species makes inferences about single species interactions
more difficult. Nonetheless, through the examination of demographic rates, researchers
can infer potential mechanisms that may limit population growth. For example, moose
twinning rates and the age of first reproduction are two parameters used by managers as a
measure of the nutritional status of moose populations (Franzmann and Schwartz 1985,
Keech et al. 2000, Boertje et al. 2007). Furthermore, the selective behavior of certain
predators during specific life stages can be used to infer the potential effects of predation
on a population. For example, predation by either black bears (Ursus americanus) or
grizzly bears (U. arctos) typically accounts for the majority of neonatal moose calf
114

mortalities (Ballard et al. 1991, Osborne et al. 1991, Bertram and Vivion 2002, Swenson
et al. 2007), whereas the impact of wolf (Canis lupus) and cougar (Puma concolor)
predation occurs primarily after the neonate phase (Larsen et al. 1989, Ross and Jalkotzy
1996).
Relatively little research has been conducted on the demography and population
dynamics of Shiras moose (A. a. shirasi) in the Intermountain West. Kufeld and Bowden
(1996) estimated Shiras moose survival in northcentral Colorado where legal and illegal
harvest accounted for 91% of all mortalities. Olterman and Kenvin (1998) described the
reproduction and survival of Shiras moose transplanted to southwestern Colorado where
black bears and cougars occurred at relatively low densities. Kunkel and Pletscher
(1999) studied the dynamics of elk (Cervus elaphus), white-tailed deer (Odocoileus
virginianus), and moose in a multipredator ecosystem in and near Glacier National Park,
Montana, USA. They reported that moose survival rates were higher where alternate
prey was abundant. The Greater Yellowstone Ecosystem (GYE) provides an opportunity
to explore further the complex dynamics of a population of Shiras moose where alternate
prey is abundant (Boyce 1989, Lubow and Smith 2004), grizzly bears continue to expand
their range (Schwartz et al. 2006), and gray wolves were recently reintroduced (Bangs
and Fritts 1996).
Indices of population density and calf-cow ratios since the late 1980s have
suggested a declining trend in Shiras moose numbers in northwest Wyoming, USA
(Chapter 1). This population was previously thought to be limited by density-dependent
factors (Berger et al. 1999, Berger et al. 2001), but the recent expansion of grizzly bears
and gray wolves into the area has led to questions regarding the relative influence of
115
predation (Brimeyer and Thomas 2004). Therefore, my goal was to estimate the
reproductive parameters and demographic rates of the north Jackson moose herd and use
these estimates to evaluate the relative influence of factors that may be limiting
population growth. My objectives were to: (1) estimate reproductive parameters, neonate
survival, and annual calf survival, (2) estimate adult (≥ 2 years) female and male annual
survival rates, (3) use the estimated vital rates to calculate the finite rate of growth and
conduct associated sensitivity analyses, and (4) make inferences as to the relative
influence of limiting factors based on study results and information from previous
research. My results may assist managers with decisions regarding the management of
Shiras moose populations in multiple predator and prey ecosystems.
STUDY AREA
The study area encompassed approximately 6,400 km2 of predominately public
land in northwest Wyoming (Figure 4.1). It was north of the town of Jackson, Wyoming
and included portions of Grand Teton National Park (GTNP), Yellowstone National Park
(YNP), and the Bridger-Teton National Forest (BTNF) where elevations ranged from
1,866 to 4,197 m. The study area included the upper Snake River and upper Yellowstone
River watersheds. Moose wintered in low-elevation, riparian-dominated habitats along
the Snake River and its primary tributaries (i.e., Pacific Creek, Buffalo Fork River, Gros
Ventre River; Houston 1968, Chapter 2). During summer, migratory moose traveled to
more dispersed, mid-elevation ranges (Chapter 2), whereas nonmigratory individuals
remained on low-elevation ranges (Houston 1968). Dominant vegetation types varied
116
with elevation and aspect (Whitlock 1993, Knight 1994) and were described in Chapter 2
of this thesis.
The climate was characterized by short, cool summers and long, cold winters.
From 1975 to 2004, annual precipitation averaged 56 cm (range 38-79 cm;
http://www.cdc. noaa.gov/cgi-bin/Timeseries/timeseries1.pl; accessed 16 October 2005),
with most of the annual precipitation falling as snow between November and May. The
Teton Mountains to the west and the northern highlands along the southern boundary of
YNP typically received the greatest amounts of precipitation (Houston 1968, Cole 1969,
Boyce 1989).
The study area contained several other populations of large ungulates. The
Jackson elk herd consisted of 14,000-18,000 elk, of which approximately 70% were
supplementally fed on the National Elk Refuge or state-run feedgrounds during winter.
These elk migrated to more dispersed ranges during summer (Boyce 1989, Lubow and
Smith 2004). Resident populations of bison (Bison bison) and mule deer (Odocoileus
hemionus) inhabited the Jackson Valley and a migratory population of pronghorn
(Antilocapra americana) traveled to the area during summer (Sawyer et al. 2005).
Grizzly bears occurred throughout the study area and have steadily expanded their range
in the GYE since the early 1990s (Schwartz et al. 2006). Gray wolves dispersed from
YNP to the Jackson Valley during the winter of 1997-1998 (Smith et al. 1999) and as of
2007, seven packs (n ≈ 82 wolves), consisting of at least six breeding pairs, inhabited
portions of the study area (Jimenez et al. 2008). It was suspected that cougar populations
also increased in recent years (Wyoming Game and Fish Department [WGFD] 2006, H.
117

Quigley, Beringia South, personal communication) while harvest data indicated that
black bear populations in the study area remained relatively stable (WGFD 2007a).
The study area included the northern portion of the Jackson moose herd unit and
encompassed WGFD hunt areas 7, 14, 15, 17, and 32 (Figure 4.1), as well as hunt area 8
in the Absaroka moose herd unit. Hunt areas 7, 14, and 32 in the Teton Wilderness were
closed to all moose harvest during the 2005 and 2006 hunting seasons and in 2007, these
areas were opened to limited quota, antlered only moose harvest (WGFD 2007b). The
remaining hunt areas in the study area allowed antlered only, limited quota harvest for the
duration of the study. At the end of biological year 2006, the population estimate for
Jackson moose herd unit was 1,785 moose and the population objective for the entire
herd unit was 3,600 moose (WGFD 2007b).
METHODS
Moose Captures
Adult moose were captured on winter range between January and March 2005-
2008. Moose were darted from the ground or a helicopter and immobilized with 10-mg
thiafentanil (A-3080, Wildlife Pharmaceuticals, Fort Collins, Colorado, USA; McJames
et al. 1994, Arnemo et al. 2003, Kreeger et al. 2005) in 2005 and 2006 and 10-mg
carfentanil (Wildnil, Wildlife Pharmaceuticals, Fort Collins, Colorado, USA) in 2007.
Immobilization drugs were delivered in a 1-ml dart (Pneu-dart, Williamsport,
Pennsylvania, USA) fired from a CO2-powered dart rifle (Dan-Inject North America,
Fort Collins, Colorado, USA) or a 0.22-caliber-blank dart rifle (Model 193, Pneu-dart,
118

Williamsport, Pennsylvania, USA). Once handling was completed, thiafentanil or
carfentanil were antagonized with an intramuscular injection of 300-mg naltrexone
(Trexonil, Wildlife Pharmaceuticals, Fort Collins, Colorado, USA; Kreeger et al. 2005)
administered at multiple sites. In 2008, adult female moose were captured via helicopter
net-gunning. Age was estimated from incisor tooth wear (Hindelang and Peterson 1994)
and numbered, aluminum ear tags were affixed to each ear. Approximately 50-ml of
blood were collected from all moose via jugular venipuncture and fecal samples were
collected from adult females in 2007. Adult females were fitted with either global
positioning system (GPS; model TGW-3700, Telonics, Mesa, Arizona, USA) or very
high frequency (VHF) radio transmitters (model M2710, Advanced Telemetry Systems,
Isanti, Minnesota, USA) and all adult males were fitted with VHF collars. All radio
collars were equipped with mortality-sensing options and VHF collars were fitted with a
cotton spacer that would rot away in 3-4 years which allowed for collar retrieval prior to
termination of battery life. Captures were performed in accordance with approved
University of Wyoming Animal Care and Use Committee protocols.
Adult Survival
In addition to moose captured during this study, I monitored 18 adult female
moose that had been fitted with VHF collars in previous years (Berger et al. 1999, Berger
et al. 2001). Radio-collared moose were monitored monthly from fixed-wing aircraft
during May to December of each year. While moose were concentrated on winter range,
ground surveys were conducted to monitor survival from January to May. Although
cause of mortality was not a primary study objective, all mortality signals were
119

investigated on foot and site investigations and field necropsies were performed to
determine cause of death where possible. I assessed moose condition at time of death
based on the color and consistency of femur bone marrow and scored the moose into 1 of
3 classes that generally represented percent femur marrow fat (Peterson 1977:30). I
examined all available bones for evidence of abnormalities (i.e., arthritis, healed breaks,
jaw necrosis). If available, two incisors were collected and age was determined by
cementum annuli (Sargeant and Pimlott 1959) at the WGFD Laboratory (Laramie,
Wyoming, USA). I considered predation to be the cause of death when subcutaneous
hemorrhaging and evidence of a chase or struggle were present (Kunkel et al. 1999,
Atwood et al. 2007). I identified the predator species responsible for the mortality using
predator-specific characteristics such as injury patterns, point of attack, method of killing,
and carcass location (Atwood et al. 2007) and used a key adapted from Kunkel et al.
(1999) to categorize predator-related mortalities as being possible, probable, or positive
predation by cougar, wolf, or bear (black or grizzly). If evidence of predation was not
present, mortalities were characterized as being of natural causes and were classified as
malnutrition, disease, or other natural cause. Mortalities were classified as unknown if
site evidence and carcass inspection were inconclusive as to cause of death. If mortalities
occurred within 30 days post-capture and no cause of death could be determined, the
death was classified as a capture-related mortality (Kreeger et al. 2005). If the date of
death was unknown, it was estimated using the midpoint between the last time the signal
was active and the first time a mortality signal was heard (Modafferi and Becker 1997).
Dates of death for moose fitted with GPS collars were estimated by downloading the
120

collar and locating the first known location in a point cluster where the carcass was
found.
I attempted to maintain 20-25 radio-collared females and males at the beginning
of each biological year (BY; 1 June – 31 May) during the study (Garton et al. 2001). I
used the staggered entry Kaplan-Meier procedure to estimate annual survival rates of
adult females and males on a monthly basis for each BY and used log-rank tests to
compare sex-specific survival among BYs (Kaplan and Meier 1958, Pollock et al. 1989).
Capture-related mortalities were censored from survival analyses and all moose censored
due to radio failure were removed the month that radio contact was lost. Adult male
survival rates were estimated with harvest censored and with all forms of mortality
included to examine differences in survival with and without harvest. The number of
moose at risk at the beginning of each month was pooled across BYs to estimate sex-
specific survival rates for the duration of the study even if annual differences were
observed. The adult female survival rate estimate was used to evaluate the population
growth rate during the entire study period (see below). I then used a log-rank test to
compare female and male survival rates for the duration of the study (Pollock et al.
1989).
Reproduction and Calf Survival
Pregnancy status was determined by analysis of blood sera for concentrations of
pregnancy-specific protein B (PSPB) by BioTracking (Moscow, Idaho, USA; Stephenson
et al. 1995, Huang et al. 2000). Fecal samples were analyzed for progestagen
concentration at the Smithsonian Institute Conservation Research Center (Front Royal,
121
Virginia, USA) following methods described by Monfort et al. (1993) and Schwartz et al.
(1995). Due to differences among populations in fecal progestagen cutoff values for
pregnant and nonpregnant moose (Muir 2006), I used a regression tree analysis (De’ath
and Fabricius 2000) to estimate a fecal progestagen cutoff value from fecal samples
collected at capture in 2007. For this analysis, the dependent variable was the fecal
progestagen value and the response variable was pregnancy status based on PSPB. This
gave an estimated fecal progestagen cutoff value and the probability that this value would
accurately predict pregnant and non-pregnant status. To estimate the timing of potential
fetal mortalities and the efficacy of progestagen in determining pregnancy status,
additional fecal samples were collected from handled and unhandled moose 1-2 months
post-capture in 2006 and 2007. Fecal progestagen concentrations were compared to the
pregnancy cutoff value to determine if losses occurred prior to or after the date of
collection.
All radio-collared adult female moose were surveyed from the ground or air
during late May to early June of each year (Van Ballenberghe and Ballard 1997, Boertje
et al. 2007) to assess parturition rates because peak parturition typically occurs around 25
May across much of North America (Hauge and Kieth 1981, Schwartz and Hundertmark
1993, Bowyer et al. 1998, Testa et al. 2000, Bertram and Vivion 2002). Helicopter
surveys were conducted with the pilot and two observers between 31 May and 7 June
2005-2007. Radio-collared cows not observed with a calf during initial aerial
observations were surveyed again from the air usually within 1 or 2 days. Prior to
concluding that a cow was not accompanied by a calf, attempts were made to obtain the
clearest view of the cow possible on the second survey and the behavior of the cow (i.e.,
122

standing, running, or aggressiveness) was noted. If I was unable to conclude from aerial
observations that a cow was accompanied by a calf, a ground search was conducted on
foot or horseback. To assess parturition rates for moose that were not captured during
winter (i.e., unhandled), I first estimated the number of pregnant unhandled moose by
multiplying the known pregnancy rate of captured moose by the total number of
unhandled moose surveyed in each year. Parturition rates were calculated by dividing the
total number of unhandled cows observed with calves by the total number surveyed that
were assumed to be pregnant. Twinning rates were assessed by dividing the number of
cows observed with twins by the total number of cows with calves.
All radio-collared females were surveyed from the ground or air approximately 8
weeks after parturition surveys to estimate neonate survival. Protocols for these surveys
were the same as parturition surveys. I chose to survey all radio-collared females so that
late births could be observed. Late births were included in estimates of parturition rates,
but neonate survival was estimated only from those calves that were observed in June.
Ground surveys of all radio-collared females observed with calves during neonate
surveys were conducted during late March and April 2006-2008 to assess annual calf
survival. Since calves were not collared, the fate of calves that were lost due to death or
radio failure of the collared cow were unknown, thus, these calves were censored from
analyses. Surveys of females that lost calves between parturition and neonate surveys
were also made to assess the efficacy of neonate surveys.
I used the Kaplan-Meier procedure and the log-rank test (Kaplan and Meier 1958,
Pollock et al. 1989) to estimate neonate and annual calf survival rates and to test for
differences among years. I also used the log-rank test (Pollock et al. 1989) to assess
123

among-year variation in pregnancy rates. To determine if capture had an effect on
parturition rates, neonate survival, and annual calf survival, I used the log-rank test
(Pollock et al. 1989) to compare these parameters between the handled and unhandled
samples of moose within years.
Population Modeling
I used a simple post-birth, Lefkovich matrix model for females that assumed
constant vital rates over time to characterize moose population growth during the study
period (Caswell 2001, Skalski et al. 2005). The matrix was parameterized into 3 stage
classes (i.e., calf, yearling, adult). The top row of the matrix (i.e., productivity elements)
was the product of survival, parturition, and fecundity rates for yearlings and adults.
Because calves do not reach sexual maturity by autumn (Edwards and Ritcey 1958,
Schladweiler and Stevens 1973, Schwartz and Hundertmark 1993), they were not allowed
to breed in the model. The adult fecundity rate was calculated by dividing the total
number of calves produced by the total number of parturient, radio-collared females. In
Alaska, calf sex ratios at birth did not differ (Schwartz and Hundertmark 1993), so I
assumed a 50:50 sex ratio and divided fecundity by 2 to estimate the number of female
calves produced per parturient female. Since yearlings were not monitored, I assumed
yearling parturition and survival from the literature. Houston (1968) estimated a yearling
pregnancy rate of 0.057 in the Jackson Valley, Wyoming based on corpora lutea counts
of 35 harvested 2.5-year-old moose. I used this pregnancy rate for yearlings and assumed
that yearling parturition rates were a similar fraction of the adult parturition rate.
Yearling fecundity was assumed to be 0.50 because yearlings rarely produce twins
124

(Pimlott 1959, Schwartz 1997). Although several researchers have described lower
yearling survival rates when compared to adults (Dodge et al. 2004, Testa 2004, Murray
et al. 2004), researchers in Alaska indicated that yearling survival rates were similar to
adult survival rates (Ballard et al. 1991), thus, I assumed that yearling and adult survival
rates were equal.
From the parameterized matrix, I calculated a deterministic estimate of the finite
rate of population growth (λ; Caswell 2001, Skalski et al. 2005). To examine the
influence of each vital rate on λ, I calculated the elasticity of each matrix element using
PopTools (G. M. Hood, 2004; PopTools version 3.0.2. http://www.cse.csiro.au/
poptools). I used a parametric bootstrap procedure to estimate 95% confidence intervals
(CI) for λ. I assumed a binomial distribution of vital rates and generated 1,000 random
replicates of each vital rate based on the mean and the total number of experimental units
used to estimate each vital rate during the study. I then generated 1,000 simulated
Lefkovich matrix replicates to estimate λ from random combinations of each vital rate.
The mean λ estimate was calculated from the simulated data and 95% CI were estimated
from the distribution of resulting λ values.
RESULTS
Moose Captures
Eighty adult female moose were captured 93 times during the course of the study.
From 2005 to 2007, 53 of 61 adult females were darted from a helicopter. Thirty-two
females were captured with helicopter net-gunning in 2008. Most adult males were
125

darted from a helicopter (n = 21) and radio-collared in 2005 (n = 27) and 2006 (n = 4).
Four suspected capture-related mortalities (2 female, 2 male) occurred during the study
and these individuals were censored from survival analysis. One female moose died 9
days post-capture in 2005. Field necropsy was unable to reveal an apparent cause of
death and no problems were recorded during handling. One male died at 3 weeks and
another at 4 weeks post-capture in 2005 after being darted from the ground. The first
male that died was relatively old (12 yrs) and field necropsy revealed severe malnutrition
(i.e., no body or organ fat, depleted femur marrow). Necropsy revealed gross lesions on
the lungs of the second male consistent with pneumonia that was possibly caused by
aspirated rumen contents during handling. In 2006, a single female was euthanized 1 day
post-capture. Although serum enzymes (i.e., aspartate aminotransferase, creatine kinase,
and lactate dehydrogenase) did not reveal exertional myopathy as the cause, it was
suspected due to partial paralysis of the front limbs.
Pregnancy and Reproduction
Analyses of PSPB from moose captured during winters 2005-2007 indicated a
high annual pregnancy rate that was not different among years (P > 0.05; Table 4.1). To
assess parturition rates, all radio-collared adult female moose were surveyed from the
ground or air between 25 May and 19 June 2005-2007. Two sets of twins in 2006 and
one set of twins in 2007 were observed, while no twins were observed in 2005 (Table
4.1). When years were pooled, the average twinning rate was 0.07 (SE = 0.04, n = 45).
The fecundity rate was estimated as 1.07 calves per parturient female. There was a
significant difference in parturition rates between moose that were captured (i.e.,
126

handled) in winter and those that were not captured (i.e., unhandled) in 2005 (χ2 = 5.01, 1
df, P = 0.025) and 2006 (χ2 = 5.53, 1 df, P = 0.019), but a significant difference was not
observed in 2007 (χ2 = 2.86, 1 df, P = 0.091), possibly due to high variance in the
estimates (Table 4.1). When compared within groups (i.e., handled and unhandled)
among years, parturition rates did not differ (P > 0.05; Table 4.1). Therefore, within
group estimates were pooled among years and a significant difference was observed in
the estimated parturition rates between handled and unhandled females (χ2 = 13.43, 1 df,
P < 0.001; Table 4.1).
Because of differences in parturition rates between handled and unhandled
females, a second parturition survey was conducted from the helicopter two weeks after
the initial survey in 2005, but no additional calves were observed. Furthermore, no
additional calves were observed during neonate survival surveys in July 2005 or annual
calf survival surveys in March and April 2006 indicating that survey protocols adequately
detected calf presence. To test the effects of capture techniques using the same
immobilization drug (i.e., thiafentanil), 7 adult females were darted from the ground and
13 were darted from a helicopter in 2006. Sample sizes were small, but no females
captured from the ground were observed with a calf (0 of 5), whereas 36% (4 of 11) of
adult female moose immobilized by helicopter were observed with a calf. In 2007, all
moose were captured via helicopter with a different immobilization drug (i.e., carfentanil)
and a similar trend was observed (Table 4.1).
Using pregnancy status as determined by PSPB and the fecal samples collected at
capture in 2007 (n = 19), the regression tree analysis indicated that the pregnancy cutoff
value for fecal progestagen was 2.52 μg/g (Figure 4.2). The probability that this value
127

would accurately predict pregnancy at capture from fecal progestagen was 100%,
whereas the probability that it would predict non-pregnancy was 60% (Figure 4.2).
During 2006 and 2007, fecal samples were collected from 21 handled and 12 unhandled
females > 1 month post-capture. Of the 14 pregnant, handled moose that were not
observed with calves the following spring, 79% (n = 11) were determined not to be
pregnant when fecal samples were collected based on the fecal progestagen cutoff value
(Figure 4.3). The fecal progestagen cutoff value accurately predicted whether an
unhandled female would be observed with a calf the following spring 92% (11 of 12) of
the time (Figure 4.3). One unhandled and 3 handled moose appeared to lose their fetus or
calf at a later date because progestagen indicated that these females were pregnant at time
of sample collection. One handled female observed with a calf in the spring was
misclassified as not pregnant (Figure 4.3).
For moose that were handled and lost a calf in the year of capture, the probability
that they would be observed with a calf the following year after not being captured was
80% (8 of 10). For unhandled moose observed with a calf in any given year, the
probability that they would be observed with a calf the following year was 33% (6 of 18).
When all moose were pooled regardless of being handled or unhandled, the probability
that they would be observed with a calf in consecutive years was 31% (13 of 42).
Neonate and Annual Calf Survival
Because of small sample sizes for handled moose observed with calves, no
comparisons were made of neonate and annual calf survival between handled and
unhandled moose, thus all calves produced each year were pooled to examine annual
128

differences. All radio-collared adult female moose were surveyed from the ground or air
between 17 and 24 July 2005-2007 to document neonate survival and late births. There
were 3 late births observed in 2006 and 1 in 2007. One calf was censored in 2006 due to
loss of radio contact with the cow between parturition and neonate surveys. No
significant differences were observed in neonate survival among years (P > 0.05; Table
4.1). When years were pooled, 16 of 42 calves were lost between parturition and neonate
surveys for an average survival rate of 0.62 (SE = 0.08; Table 4.1).
In March and April 2006-2008, radio-collared cows observed with calves in June
and July of the previous year were surveyed on winter range to estimate annual calf
survival rates. No calves that were lost between parturition and neonate surveys were
observed with the cow on winter range. Six calves were censored from analysis due to
radio failure (1 in 2006, 3 in 2007) or death of the radio-collared cow prior to surveys (2
in 2008). All late births observed were included in analyses of calf survival and 2 of 3
successfully returned to winter range while 1 was lost due to radio collar failure of the
cow. No significant differences were observed in annual calf survival among years (P >
0.05; Table 4.1). When years were pooled, 19 of 41 calves successfully returned to
winter range yielding an average annual calf survival rate of 0.46 (SE = 0.08; Table 4.1).
Of 28 adult female moose monitored for ≥ 2 years, 11% returned to winter range with a
calf at side 2 years in a row.
Adult Survival
To estimate annual survival rates, adult female moose were monitored for four
consecutive BYs (i.e., 2004, 2005, 2006, 2007). Annual female survival rates ranged
from 0.77 (SE = 0.07) in BY 2006 to 0.94 (SE = 0.04) in BY 2005 (Table 4.2). The
129

survival rate estimate for BY 2005 was significantly different from estimates for BY
2006 (χ2 = 4.34, 1 df, P = 0.037) and BY 2007 (χ2 = 3.92, 1 df, P = 0.048; Table 4.2). No
significant differences were observed in annual survival rates among any other years (P >
0.05; Table 4.2).
Survival rates were estimated for adult male moose for all BYs (i.e., 2004, 2005,
2006, 2007), but comparisons and interpretations were limited to BY 2005 and BY 2006
because these years contained a full year of data and adequate sample sizes. There were
no significant differences in survival rate estimates between BY 2005 and BY 2006 when
harvest was included as a mortality factor (χ2 = 0.01, 1 df, P = 0.92) or when harvest was
censored (χ2 = 0.00, 1 df, P > 0.99; Table 4.2). When survival rates were compared
between harvest included and harvest censored males within years, no significant
differences were observed in estimated survival rates for BY 2005 (χ2 = 0.82, 1 df, P =
0.365) or BY 2006 (χ2 = 0.50, 1 df, P = 0.48; Table 4.2).
When years were pooled, the adult female survival rate estimate was 0.83 (SE =
0.03; Table 4.2). Pooled annual (i.e., all years) survival rate estimates for males with
harvest included was 0.82 (SE = 0.05) and with harvest censored it was 0.89 (SE = 0.04;
Table 4.2). There was no significant difference between annual survival rates of females
and males when harvest was included (χ2 = 0.06, 1 df, P = 0.806) or when harvest was
censored (χ2 = 2.18, 1 df, P = 0.140; Table 4.2).
Adult female mortalities peaked during late winter and early spring with 85% (22
of 26) of the observed mortalities occurring during the months of March, April, and May
(Figure 4.4). Most female mortalities were classified as unknown due to high levels of
scavenging or lack of site evidence. Predation accounted for 8 mortalities while 5
130

females appeared to have died of natural causes not related to predation (3 malnutrition, 1
disease, 1 other natural causes; Figure 4.5). One female moose killed by a cougar in
March 2005 had evidence of jaw necrosis, but no evidence of any other bone
abnormalities were found on the remaining individuals, whether female or male. There
was no apparent temporal pattern to nonharvest-related adult male mortalities, but when
harvest was included as a mortality factor, survival declined from September to
November (Figure 4.6). Most male mortalities were classified as unknown primarily due
to the remote locations of the mortality sites (Figure 4.5). The mean age of adult female
and male mortalities was 7.1 years (SE = 0.84; n = 11) and 9.3 years (SE = 2.25; n = 2),
respectively. The mean female bone marrow class was 1.8 (n = 15) and male bone
marrow class was 2.40 (n = 5).
Population Modeling
Due to the differences observed in parturition rates between handled and
unhandled moose, I used the unhandled moose parturition rates to estimate calf
production. Based on adult pregnancy and parturition rates, the expected yearling
parturition rate was 0.05 and this was used to estimate yearling productivity. Using
pooled vital rates estimated during the study, λ was calculated to be 0.973 (Figure 4.7).
This indicated that the moose population may be subject to a modest decline of
approximately 2.7% annually. The mean λ estimate derived from 1,000 matrix replicates
of randomly generated vital rates was 0.972 (SE = 0.002) with 95% CI of 0.907-1.062
(Figure 4.9). This indicated that the moose population was slightly decreasing to stable
during the study period, but there was some uncertainty in the estimate. Based on
131
simulations, there was a 17% chance that the population had a positive growth rate and a
76% chance that it had a negative growth rate in any given year. Adult female survival
had the highest elasticity (0.658), followed by calf survival (0.114), adult fecundity and
yearling survival (0.113), and yearling fecundity (0.001; Figure 4.8).
DISCUSSION
Demographic data from this study indicated that the north Jackson moose herd
may be limited by habitat quality or availability, and its effects on the survival and
reproductive performance of adult females, more than predation by grizzly bears and
wolves. However, my findings do not support the classic concept of density-dependence
as a limiting factor for this population as proposed by Berger et al. (1999, 2001). Indices
of moose density indicated that the north Jackson moose herd has been declining since
the late 1980s (Chapter 1) and evidence from the current study suggested that continued
population declines appear to be more likely than a stable or increasing population (λ =
0.972, 95% CI = 0.907-1.062). This indicated that the nutritional quality, rather than the
availability, of habitat may be the most important determinant limiting population growth
because a reduction in moose numbers, no matter the cause, should have resulted in
increased physical condition and reproductive success if this population occupied
productive habitat (Bowyer et al. 2005). Potential moose population declines may have
occurred concurrently with a reduction in habitat quality, due to unidentified causes,
which might explain the marginal nutritional condition (Chapter 3) and low reproductive
output observed in the study population. Because my study was not designed to evaluate
132

cause-specific mortality, I could not rule out the potential additive effects of gray wolf or
grizzly bear predation on adults and calves. But such effects, if present, appeared to be
secondary to the influence of habitat quality possibly due to the abundance of alternate
prey in the GYE.
The pattern of adult female mortality in this study was indicative of a population
that is nutritionally limited. Consistent with other demographic studies of ungulates,
adult female survival had the most significant influence on population growth, but
contrary to these studies, there was high annual variation in survival rates (Gaillard et al.
2000) primarily due to variation in mortality during late winter and early spring (March-
May). Increased spring mortality was suggestive of habitat limitations because the
nutritional demands of female moose increase as winter progresses and peaks during late
winter in association with parturition and lactation (Schwartz et al. 1984, Schwartz et al.
1987). Therefore, if the nutritional demands of females were not met during this critical
period or environmental factors increase the energetic demands of locomotion and reduce
the availability of forage, decreased survival may occur. Bender et al. (2007) observed
increased spring mortality in a mule deer population following a dry spring that reduced
the availability of quality forage. Likewise, Modafferi and Becker (1997) observed
decreased female moose survival in late winter following years with heavy and persistent
snow accumulation in Alaska. In the Jackson Valley, Houston (1968) suggested that
moose populations fluctuated from 1950 to 1966 in response to willow conditions and
periodic die-offs that occurred during severe winters. This indicated that moose in good
physical condition were likely buffered against the effects of increased winter severity,
whereas moose in poor physical condition were more susceptible (Bowyer et al. 2000).
133

While this study was not designed to evaluate cause-specific mortality, I did
observe a relatively-high proportion of deaths due to natural causes that were not related
to predation (19%, see Figure 4.5) which was indicative of poor habitat quality resulting
in reduced physical condition. In other moose populations where predation was found to
be a significant mortality factor for adults, no deaths associated with natural causes were
reported (Bergerud et al. 1983, Gasaway et al. 1992). Similar to other studies (Boertje et
al. 1988, Larsen et al. 1989), I observed some spring grizzly bear predation on adult
female moose, but a reduction in physical condition due to poor habitat quality may have
predisposed moose to predator-related mortalities. Therefore, it is likely that if habitat
quality were improved, the physical condition of moose would also improve which may
result in increased survival rates.
Although my modeling indicated that the Jackson moose population may be in a
slow rate of decline (λ = 0.973), consistent with trends since the late 1980s (Chapter 1),
the low twinning rates observed during the study (see Table 4.1) indicated that habitat
quality had not improved as moose numbers declined. Moose twinning rates are used by
managers as an indicator of the nutritional status of the population (Franzmann and
Schwartz 1985, Boertje et al. 2007). Twinning rates have been reported to be as high as
70% for moose populations that occupy highly productive habitat (Franzmann and
Schwartz 1985) and as low as < 1% for moose that occupy poor quality habitat (Albright
and Keith 1987). When Shiras moose were expanding in the GYE during the early 20th
century, twins were more common than singletons (Bailey 1930), but, in the Jackson
Valley, twinning rates declined to approximately 15% by the 1940s (Denniston 1956) and
were 4.5% in the 1960s (Houston 1968). High moose densities during the 1950s may
134

have resulted in overutilization of resources (Harry 1957) which may have reduced
female condition and, thus, twinning rates. The low twinning rates observed for this
Shiras moose population may have been due to the relatively stable environments (i.e.,
lack of disturbances) that these moose inhabit (Peek 1974, Schwartz 1997). The lack of
disturbance may result in high forage biomass, but that forage may be of low nutritional
value. Additionally, twinning rates during this study were also much lower than those
observed for moose populations that appeared to be held at low densities by predation in
Alaska (range 39-63%; Ballard et al. 1991, Osborne et al. 1991, Gasaway et al. 1992,
Bertram and Vivion 2002) and Canada (54%; Bergerud et al. 1983) which again
suggested nutritional constraints that limit reproductive output in this population.
There appeared to be a low probability (0.33) that unhandled moose in the study
population would be observed with a calf in consecutive years, which was indicative of
nutritional limitations that may have resulted in reproductive pauses. Successful
reproduction in ungulates is highly dependent on maternal condition and, in turn,
maternal condition may be affected by habitat quality and past reproductive performance
(Clutton-Brock et al. 1983, Testa and Adams 1998, Keech et al. 2000, Reynolds 2001).
Thus, if habitat quality in the study area was inadequate to support both lactation and fat
accretion in consecutive years, successful reproduction may have been compromised
(Clutton-Brock et al. 1983, Cook et al. 2004a). Reproductive pauses (whether caused by
an inability to conceive, lost pregnancy, or neonatal calf mortality) may benefit this
moose population by allowing the female to accrue sufficient body fat to produce a viable
offspring that has a greater chance of survival the following year (Cameron et al. 1993,
Testa 1998, Testa and Adams 1998, Keech et al. 2000). Similar to the current study, a
135

low percentage (18%) of consecutive-year calf production was observed for a population
of moose in Newfoundland, Canada affected by poor winter nutrition and severe winter
weather. Additionally, Reynolds (2001) observed an increased reproductive interval
(from 1 to every 2-3 years) in musk-oxen (Ovibos moschatus) resulting from increased
densities that likely affected forage. Although direct comparisons cannot be made,
Cameron (1994) observed a 24% frequency of reproductive pauses in caribou and
Clutton-Brock (1983) observed lower calf production in red deer the year following
successful reproduction (68.9%) than in years following failed reproduction (89.5%).
The mechanisms responsible for the decreased reproductive success of pregnant
female moose captured during winter may have been related to marginal physical
condition more than capture and handling techniques. The observed difference in
parturition rates between handled (24%) and unhandled females (79%) as well as the high
proportion of females known to be pregnant at capture that lost their fetuses at some point
1-2 months post-capture (79%) was somewhat unique among documented moose
captures. My findings contrast with those from an expanding moose population in
southeast Wyoming where 9 pregnant adult female moose were captured 2 months prior
to the current study using the same immobilization techniques, but 8 were observed with
calves the following summer (E. Wald, University of Wyoming, personal
communication). My results also contrasted with findings by Larsen and Gauthier (1989)
who reported no decrease in parturition rates when moose were captured during late
pregnancy. Only one other study documented significantly lower parturition rates for
mammals captured during winter and this occurred in moose from Alaska (Ballard and
Tobey 1981). The authors suggested that stress associated with immobilization without
136

the use of a tranquilizer may have increased the incidence of fetal mortality. Although
female moose handled during the first year of the study did not exhibit signs of capture-
related stress (Kreeger et al. 2005), handling moose appeared to artificially induce a
reproductive pause regardless of the immobilizing agent or capture technique. Indeed,
for moose that were captured and lost their calf, there was a high probability (0.80) that
they would be observed with a calf the following year after not being handled. It has
been posited that moose may be highly susceptible to nutritional deficiencies (Murray et
al. 2006), thus, the combination of capture and marginal physical condition with
deficiencies in several nutrients (Chapter 3) may have pushed moose over a physiological
threshold that induced the reproductive pause post-capture.
The reduced reproductive success observed in the study population indicated that
a reduction in the physical condition of adult females as winter progressed may have
contributed to a concurrent reduction in reproductive output. Contrary to previous
research (Berger et al. 1999), the observed pregnancy rate for moose (92%) was
relatively high when compared to the North American average (84%; Boer et al. 1992)
while the mean parturition rate (79% for unhandled moose) was on the lower end of the
distribution (range = 75- 90%; Stenhouse et al. 1995, Keech et al. 2000, Testa 2004,
Berger et al. 2007, Boertje et al. 2007). Although female moose with high body fat are
more likely to become pregnant (Heard et al. 1997, Testa and Adams 1998, Keech et al.
2000) pregnancy rates appear to be relatively constant across a range of geographic areas,
population densities, and environmental conditions (Edwards and Ritcey 1958, Boer et al.
1992). Therefore, high pregnancy rates may only indicate that moose had sufficient body
fat during the breeding season to become pregnant (Cook et al. 2004a, Cook et al.
137
2004b). However, the nutritional deficiencies observed in the study population indicated
that moose may have a higher fat-fertility threshold than other populations (Heard et al.
1997, Chapter 3) and if the lower limit of this threshold was reached prior to parturition,
there may be a greater potential for abortion or resorption. Indeed, during spring 2008
(i.e., BY 2007), WGFD personnel responded to 2 separate instances of female moose
aborting calves and a third cow that died while aborting a calf near the town of Jackson,
Wyoming (S. Kilpatrick, WGFD, personal communication).
The high neonate (62%) and annual calf survival (46%) rates indicated that
predation pressure on moose calves was relatively low. This may be due to the
abundance of alternate prey available in the GYE. Mattson (1997) reported that elk
calves were used more than expected by grizzly bears in the GYE while both black bears
and grizzly bears were significant predators of neonatal elk calves before (Smith et al.
2006) and after (Barber-Meyer et al. 2008) wolf restoration. Since elk calving grounds
contain a relatively high abundance of animals, and the potential nutritional rewards are
high, bears may prefer to forage near these areas during calving season (French and
French 1990). In contrast, moose are solitary by nature, thus the potential nutritional
reward may be less because of the greater search time that might be required by bears to
locate moose calves. The high neonate survival and the abundance of alternate prey
suggest that bear predation on neonatal moose calves may be more opportunistic (Zager
and Beecham 2006). Cougar (Ross and Jalkotzy 1996) and wolf predation (Larsen et al.
1989) on moose calves generally occurs after the neonate life stage. The impact of these
predators on calf survival appeared to be minimal based on the proportion of potential
mortalities that occurred between neonate and annual calf survival surveys (≈ 0.16).
138

Using comparable data where predation on calves was a primary source of mortality,
neonate survival ranged from 17-39% in Alaska (Ballard et al. 1990, Ballard et al. 1991,
Gasaway et al. 1992, Bowyer et al. 1998, Testa et al. 2000, Bertram and Vivion 2002)
and Canada (Larsen et al. 1989). Not surprisingly, annual calf survival was also higher
than observations from Alaska where rates ranged from 13-33% (Ballard et al. 1991,
Osborne et al. 1991, Gasaway et al. 1992, Testa et al. 2000, Bertram and Vivion 2002),
but it was similar to a low-density moose population in Canada where some calf
predation occurred (44%; Stenhouse et al. 1995) and a high-density population that was
influenced primarily by density-dependent processes in Alaska (53%; Keech et al. 2000).
Although wolves did account for some adult female moose mortalities, the effect
of wolf predation on this population appeared to be minimal. This may have been due to
the abundance of alternate prey, specifically elk, in the study area. In a multipredator
ecosystem in northwest Montana, adult female moose survival rates were higher where
alternate ungulate prey were available (Kunkel and Pletscher 1999). Likewise, in
Mantioba, Canada where elk and moose occurred sympatrically, wolves preferred elk
disproportionately more than moose (Carbyn 1983). In the Jackson Valley, elk
represented > 90% of wolf kills (Jimenez et al. 2008), which indicated a similar trend.
The apparent preference for elk by wolves in the GYE was likely due to the greater
abundance of elk in the area. To reduce the potential effects of predation on moose and
other large ungulates, wolves were selected for reintroduction from source populations
where elk or deer were the primary prey (Bangs and Fritts 1996).
When harvest was included in survival analyses, adult male survival appeared to
decline in autumn, but survival exhibited no specific temporal patterns when harvest was
139

censored. The lack of a temporal pattern of male mortality suggested that males were
able to acquire sufficient forage prior to the onset of winter to recoup losses incurred
during autumn rut (Modafferi and Becker 1997). Non-harvest related survival rates were
similar to those observed for males in Colorado (Olterman and Kenvin 1998) and Alaska
(Modafferi and Becker 1997). When all forms of mortality were included, male survival
was slightly higher than a moose population in Alaska where vulnerability to harvest
increased with age (Ballard et al. 1991), but was much greater than a population in
Newfoundland, Canada where harvest was heavily biased towards males (Albright and
Kieth 1987).
Although evidence indicated that a declining moose population was more
probable than a stable or increasing population in the study area, caution should be used
when interpreting the finite rate of growth. All yearling input parameters were estimated
from previous research and I assumed that parturition rates for unhandled moose were
representative of the population. Boer (1992) reported that twinning rates were
significantly correlated with the proportion of pregnant yearlings in a population.
Yearling pregnancy rates were estimated for the study population based on work
conducted in the Jackson Valley by Houston (1968). Twinning rates during my study
were similar to those observed by Houston (1968), thus I assumed that yearling
pregnancy was also similar and that the estimated yearling fecundity rate may be fairly
accurate. Even though it was assumed that yearling survival equaled adult survival,
several studies have reported that yearling survival was lower than adults (Dodge et al.
2004, Testa 2004, Murray et al. 2006). Therefore, my estimate of population growth may
have been biased high. Furthermore, although parturition rate estimates were consistent
140

across years for the handled and unhandled groups of moose, neonatal calf losses that
may have occurred prior to parturition surveys would have biased my parturition
estimates low and my annual calf survival estimates high. Based on the accuracy of fecal
progestagen in predicting whether a female would be observed with a calf in the spring
(see Figure 4.3), the introduction of bias associated with unrecorded neonatal losses
appeared to be minimal and likely had little effect on my estimates of annual calf survival
and population growth.
Additional moose research in northwest Wyoming could be used to further assess
the nutritional status of the population. In addition to multi-year twinning rates that
average < 10%, Boertje et al. (2007) suggested that the nutritional status of moose
populations could be evaluated by obtaining short-yearling (i.e., a moose that has almost
completed its first year of life) mass, age of first reproduction, and annual browse
biomass removal rates. Although the value of using criteria developed in Alaska to
assess the nutritional condition of Shiras moose populations based on short-yearling mass
may be limited due to differences in body size among species, radio-collaring short-
yearling female moose would provide an accurate estimate of the age of first
reproduction. It would also provide estimates of survival for the yearling age class and a
measure of yearling reproductive success that could be used to more accurately assess the
finite rate of growth. Efforts to assess the condition of moose winter ranges may assist
managers in evaluating the quality of the habitat. In addition to research that could
provide more insight into the nutritional status of the population, increased monitoring to
estimate cause-specific mortality for adult female moose, especially in the spring, would
141

be an important step to further evaluate the extent of potential limiting factors resulting
from predation and other causes.
MANAGEMENT IMPLICATIONS
The low reproductive potential and decreased spring survival of adult female
moose in this population indicated that habitat may be the primary limiting factor in the
study area. Therefore, population and habitat management strategies designed to increase
the quality of moose habitat could be evaluated relative to their impacts on reproductive
output and survival of adult females (Bender et al. 2007). Although this population may
be in decline, increased reproductive output and female survival may not be realized until
a disturbance (i.e., fire, mechanical treatment) acts to improve the quality of moose
winter range. Habitat improvement projects could be completed on a large-scale over
multiple years so that high numbers of moose do not reduce the growth potential of
preferred forage and the amount of available forage remains sufficient even during high
snow years. Improvements to moose summer ranges may be limited in scope because
much of the area is managed as a naturally regulated system by the U.S. Forest Service
and the National Park Service. Mature coniferous forests are an important component of
Shiras moose habitat selection in winter (Tyers 2003) and summer (Chapter 2), thus
disturbances that reduce the amount of mature forests (i.e., wildfires, insect outbreaks)
could negatively affect moose population performance. Therefore, large-scale
disturbances and their potential impacts on moose population dynamics could be closely
monitored.
142

Although most elk use feedgrounds (Boyce 1989, Lubow and Smith 2004), there
are relatively high numbers of free-ranging elk in the Jackson Valley that also utilize
moose winter ranges and during periods of heavy and persistent snow accumulation, elk
may compete with moose for browse (Miller 2002). Increasing elk harvest and
improving elk winter ranges may reduce the competitive interactions of these species.
However, caution should be used if elk harvest is increased to alleviate some of the
competitive pressure because a reduction in elk numbers on winter range may increase
the impact of predators on moose (Gasaway et al. 1983, Ballard and Larsen 1987, Kunkel
and Pletscher 1999) potentially creating a predator-pit scenario. Managing wildlife
populations in ecosystems that contain multiple prey and predators is a highly-complex
endeavor that requires active management and long-term research to make informed
decisions. By closely examining long-term demographic data in relation to interactions
with other ungulates, predators, habitat, and environmental factors, managers and
researchers can gain a better understanding of ecosystem dynamics. Nonetheless, this
study provided a framework with which future research can now be directed to answer
more cause-specific questions regarding the dynamics of moose in northwest Wyoming.
143
LITERATURE CITED
Albright, C. A., and L. B. Kieth. 1987. Population dynamics of moose, Alces alces, on
the South-coast Barrens of Newfoundland. Canadian Field-Naturalist 101: 373-
387.
Arnemo, J. M., T. J. Kreeger, and T. Soveri. 2003. Chemical immobilization of free-
ranging moose. Alces 39: 243-253.
Atwood, T. C., E. M. Giese, and K. E. Kunkel. 2007. Comparative patterns of predation
by cougars and recolonizing wolves in Montana’s Madison Range. Journal of
Wildlife Management 71: 1098-1106.
Bailey, V. 1930. Animal life of Yellowstone National Park. C. Thomas and Company.
Springfield, Illinois, USA.
Ballard, W. B., and R. W. Tobey. 1981. Decreased calf production of moose
immobilized with Anectine administered from helicopter. Wildlife Society
Bulletin 9: 207-209.
Ballard, W. B., and D. G. Larsen. 1987. Implications of predator-prey relationships to
moose management. Swedish Wildlife Research (Supplement) 1: 581-602.
Ballard, W. B., S. D. Miller, J. S. Whitman. 1990. Brown and black bear predation on
moose in southcentral Alaska. Alces 26: 1-8.
Ballard, W. B., J. S. Whitman, and D. J. Reed. 1991. Population dynamics of moose in
south-central Alaska. Wildlife Monographs 114.
Bangs, E. E., and S. H. Fritts. 1996. Reintroducing the gray wolf to central Idaho and
Yellowstone National Park. Wildlife Society Bulletin 24: 402-413.
144
Barber-Meyer, S. M., L. D. Mech, and P. J. White. 2008. Elk calf survival and mortality
following wolf restoration to Yellowstone National Park. Wildlife Monographs
169.
Bender, L. C., L. A. Lomas, and J. Browning. 2007. Condition, survival, and cause-
specific mortality of adult female mule deer in north-central New Mexico.
Journal of Wildlife Management 71: 1118-1124.
Berger, J., J. W. Testa, T. Roffe, and S. L. Monfort. 1999. Conservation endocrinology:
a noninvasive tool to understand relationships between carnivore colonization and
ecological carrying capacity. Conservation Biology 13: 980-989.
Berger, J., P. B. Stacey, L. Bellis, and M. P. Johnson. 2001. A mammalian predator-prey
imbalance: grizzly bear and wolf extinction affect avian neotropical migrants.
Ecological Applications 11: 947-960.
Berger, J. 2007. Fear, human shields and the redistribution of prey and predators in
protected areas. Biology Letters 3: 620-623.
Bergerud, A. T., W. Wyett, and B. Snider. 1983. The role of wolf predation in limiting a
moose population. Journal of Wildlife Management 47: 977-988.
Bertram, M. R., and M. T. Vivion. 2002. Moose mortality in eastern interior Alaska.
Journal of Wildlife Management 66: 747-756.
Boer, A. H. 1992. Fecundity of North American moose (Alces alces): a review. Alces
(Supplement) 1: 1-10.
Boertje, R. D., W. C. Gasaway, D. V. Grangaard, and D. G. Kelleyhouse. 1988.
Predation on moose and caribou by radio-collared grizzly bears in east central
Alaska. Canadian Journal of Zoology 66: 2492-2499.
145
Boertje, R. D., K. A. Kellie, C. T. Seaton, M. A. Keech, D. D. Young, B. W. Dale, L. G.
Adams, and A. R. Aderman. 2007. Ranking Alaska moose nutrition: signals to
begin liberal antlerless harvests. Journal of Wildlife Management 71: 1494-1506.
Boutin, S. 1992. Predation and moose population dynamics: a critique. Journal of
Wildlife Management 56: 116-127.
Bowyer, R. T., V. Van Ballenberghe, and J. G. Kie. 1998. Timing and synchrony of
parturition in Alaskan moose: long-term versus proximal effects of climate.
Journal of Mammalogy 79: 1332-1344.
Bowyer, R. T., D. M. Leslie, Jr., and J. L. Rachlow. 2000. Dall’s and Stone’s sheep.
Pages 491-516 in P. R. Krausman and S. Demairais, eds. Ecology and
management of large mammals in North America. Prentice Hall, Upper Saddle
River, New Jersey, USA.
Bowyer, R. T., D. K. Person, and B. M. Pierce. 2005. Detecting top-down versus
bottom-up regulation of ungulates by large carnivores: implications for
conservation of biodiversity. Pages 342-380 in J. C. Ray, K. H. Redford, R. S.
Steneck, and J. Berger, eds. Large carnivores and the conservation of
biodiversity. Island Press, Washington, D.C., USA.
Boyce, M. S. 1989. The Jackson elk herd: intensive wildlife management in North
America. Cambridge University Press, Cambridge, England.
Brimeyer, D. G., and T. P. Thomas. 2004. History of moose management in Wyoming
and recent trends in Jackson Hole. Alces 40: 133-143.
146

Cameron, R. D., W. T. Smith, S. G. Fancy, K. L. Gerhart, and R. G. White. 1993.
Calving success of female caribou in relation to body weight. Canadian Journal
of Zoology 71: 480-486.
Cameron, R. D. 1994. Reproductive pauses by female caribou. Journal of Mammalogy
75: 10-13.
Carbyn, L. N. 1983. Wolf predation on elk in Riding Mountain National Park,
Manitoba. Journal of Wildlife Management 47: 963-976.
Caswell, H. 2001. Matrix population models: construction, analysis, and interpretation.
Second edition. Sinauer Associates, Inc., Sunderland, Massachusetts, USA.
Clutton-Brock, T. H., F. E. Guinness, and S. D. Albon. 1983. The costs of reproduction
to red deer hinds. Journal of Animal Ecology 52: 367-383.
Cole, G. F. 1969. The elk of Grand Teton and south Yellowstone National Parks.
National Park Service Research Report GRTE-N-1. Washington, D.C., USA.
Cook, R. C., J. G. Cook, and L. D. Mech. 2004a. Nutritional condition of northern
Yellowstone elk. Journal of Mammalogy 85: 714-722.
Cook, J. G., B. K. Johnson, R. C. Cook, R. A. Riggs, T. Delcurto, L. D. Bryant, and L. L.
Irwin. 2004b. Effects of summer-autumn nutrition and parturition date on
reproduction and survival of elk. Wildlife Monographs 155.
De’ath, G., and K. E. Fabricius. 2000. Classification and regression trees: a powerful yet
simple technique for ecological data analysis. Ecology 8: 3178-3192.
Denniston, R. H., II. 1956. Ecology, behavior and population dynamics of the Wyoming
or Rocky Mountain moose, Alces alces shirasi. Zoologica 41: 105-118.
147

Dodge, W. B., Jr., S. R. Winterstein, D. E. Beyer, Jr., and H. Campa III. 2004. Survival,
reproduction, and movements of moose in the western Upper Peninsula of
Michigan. Alces 71-85.
Edwards, R. Y., and R. W. Ritcey. 1958. Reproduction in a moose population. Journal
of Wildlife Management 22: 261-268.
Franzmann, A. W., and C. C. Schwartz. 1985. Moose twinning rates: a possible
population condition assessment. Journal of Wildlife Management 49: 394-396.
French, S. P., and M. G. French. 1990. Predatory behavior of grizzly bears feeding on
elk calves in Yellowstone National Park. International Conference on Bear
Research and Management 8: 335-341.
Gaillard, J. M., M. Festa-Blanchet, N. G. Yoccoz, A. Loison, and C. Toïgo. 2000.
Temporal variation in fitness components and population dynamics of large
herbivores. Annual Review of Ecology and Systematics 31: 367-393.
Garton, E. O., M. J. Wisdom, F. A. Leban, and B. K. Johnson. 2001. Experimental
design for radiotelemetry studies. Pages 15-42 in J. J. Millspaugh and J. M.
Marzluff, eds. Radio tracking and animal populations. Academic Press, Inc. San
Diego, California, USA.
Gasaway, W. C., R. O. Stephenson, J. L. Davis, P. E. K. Shepherd, and O. E. Burris.
1983. Interrelationships of wolves, prey, and man in interior Alaska. Wildlife
Monographs 84.
Gasaway, W. C., R. D. Boertje, D. V. Grangaard, D. G. Kelleyhouse, R. O. Stephenson,
and D. G. Larsen. 1992. The role of predation in limiting moose at low densities
148

in Alaska and Yukon and implications for conservation. Wildlife Monographs
120.
Harry, G. B. 1957. Winter food habits of moose in Jackson Hole, Wyoming. Journal of
Wildlife Management 21: 53-57.
Hauge, T. M., and L. B. Kieth. 1981. Dynamics of moose populations in northeastern
Alberta. Journal of Wildlife Management 45: 573-597.
Heard, D., S. Barry, G. Watts, and K. Child. 1997. Fertility of female moose (Alces
alces) in relation to age and body composition. Alces 33: 165-176.
Hindelang, M., and R. O. Peterson. 1994. Moose senescence related to tooth wear.
Alces 30: 9-12.
Houston, D. B. 1968. The Shiras moose in Jackson Hole, Wyoming. Technical Bulletin
No. 1. Grand Teton Natural History Association.
Huang, F., D. C. Cockrell, T. R. Stephenson, J. H. Noyes, and R. G. Sasser. 2000. A
serum pregnancy test with a specific radioimmunoassay for moose and elk
pregnancy-specific protein B. Journal of Wildlife Management 64: 492-499.
Jimenez, M. D., D. W. Smith, D. R. Stahler, D. S. Guernsey, S. P. Woodruff, and R. F.
Krischke. 2008. Wyoming Wolf Recovery 2007 Annual Report. Pages 204-236
in Rocky Mountain Wolf Recovery 2007 Interagency Annual Report. C. A.
Simes and E. E. Bangs, eds. U.S. Fish and Wildlife Service, Ecological Services,
Helena, Montana, USA.
Kaplan, E. L., and P. Meier. 1958. Nonparametric estimation from incomplete
observations. Journal of the American Statistical Association 52: 457-481.
149
Keech, M. A., R. T. Bowyer, J. M. Ver Hoef, R. D. Boertje, B. W. Dale, and T. R.
Stephenson. 2000. Life history consequences of maternal condition in Alaskan
moose. Journal of Wildlife Management 64: 450-462.
Knight, D. L. 1994. Mountains and plains: the ecology of Wyoming landscapes. Yale
University Press. New Haven, Connecticut, USA.
Kreeger, T. J., W. H. Edwards, E. J. Wald, S. A. Becker, D. Brimeyer, G. Fralick, and J.
Berger. 2005. Health assessment of Shiras moose immobilized with thiafentanil.
Alces 41: 121-128.
Kufeld, R. C., and D. C. Bowden. 1996. Survival rates of Shiras moose (Alces alces
shirasi) in Colorado. Alces 32: 9-13.
Kunkel, K. E., and D. H. Pletscher. 1999. Species-specific population dynamics of
cervids in a multipredator ecosystem. Journal of Wildlife Management 63: 1082-
1093.
Kunkel, K. E., T. K. Ruth, D. H. Pletscher, and M. G. Hornocker. 1999. Winter prey
selection by wolves and cougars in and near Glacier National Park, Montana.
Journal of Wildlife Management 63: 901-910.
Larsen, D. G., and D. A. Gauthier. 1989. Effects of capturing pregnant moose and
calves on calf survivorship. Journal of Wildlife Management 53: 564-567.
Larsen, D. G., D. A. Gauthier, and R. L. Markel. 1989. Causes and rates of moose
mortality in the southwest Yukon. Journal of Wildlife Management 53: 548-557.
Lubow, B. C., and B. L. Smith. 2004. Population dynamics of the Jackson elk herd.
Journal of Wildlife Management 68:810-827.
150
Mattson, D. J. 1997. Use of ungulates by Yellowstone grizzly bears (Ursus arctos).
Biological Conservation 81: 161-177.
McJames, S. W., J. F. Kimball, and T. H. Stanley. 1994. Immobilization of moose with
A-3080 and reversal with nalmefene HCl or naltrexone HCl. Alces 30: 21-24.
Messier, F. 1991. The significance of limiting and regulating factors on the demography
of moose and white-tailed deer. Journal of Animal Ecology 60: 377-393.
Messier, F. 1994. Ungulate population models with predation: a case study with the
North American moose. Ecology 75: 478-488.
Miller, W. 2002. Elk interactions with other ungulates. Pages 435-447 in D. E. Toweill
and J. W. Thomas, eds. North American elk: ecology and management.
Smithsonian Institution Press, Washington, D. C., USA.
Modafferi, R. D., and E. F. Becker. 1997. Survival of radiocollared adult moose in
Lower Susitna River Valley, southcentral Alaska. Journal of Wildlife
Management 61: 540-549.
Monfort, S. L., C. C. Schwartz, and S. K. Wasser. 1993. Monitoring reproduction in
captive moose using urinary and fecal steroid metabolites. Journal of Wildlife
Management 57: 400-407.
Muir, J. D. 2006. Habitat selection and reproduction by Shiras moose (Alces alces
shirasi) in anthropogenic landscapes in Idaho. Thesis, University of Idaho,
Moscow, Idaho, USA.
Murray, D. L., E. W. Cox, W. B. Ballard, H. A. Whitlaw, M. S. Lenarz, T. W. Custer, T.
Barnett, and T. K. Fuller. 2006. Pathogens, nutritional deficiencies, and climate
influences on a declining moose population. Wildlife Monographs 166.
151
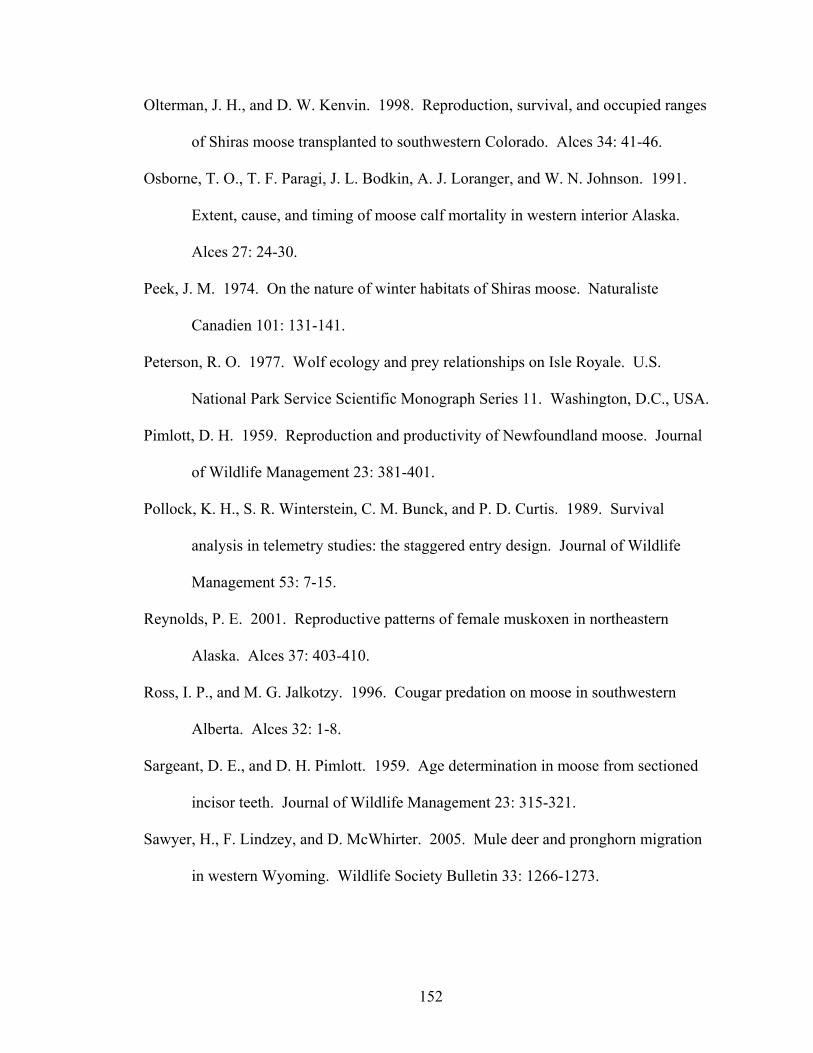
Olterman, J. H., and D. W. Kenvin. 1998. Reproduction, survival, and occupied ranges
of Shiras moose transplanted to southwestern Colorado. Alces 34: 41-46.
Osborne, T. O., T. F. Paragi, J. L. Bodkin, A. J. Loranger, and W. N. Johnson. 1991.
Extent, cause, and timing of moose calf mortality in western interior Alaska.
Alces 27: 24-30.
Peek, J. M. 1974. On the nature of winter habitats of Shiras moose. Naturaliste
Canadien 101: 131-141.
Peterson, R. O. 1977. Wolf ecology and prey relationships on Isle Royale. U.S.
National Park Service Scientific Monograph Series 11. Washington, D.C., USA.
Pimlott, D. H. 1959. Reproduction and productivity of Newfoundland moose. Journal
of Wildlife Management 23: 381-401.
Pollock, K. H., S. R. Winterstein, C. M. Bunck, and P. D. Curtis. 1989. Survival
analysis in telemetry studies: the staggered entry design. Journal of Wildlife
Management 53: 7-15.
Reynolds, P. E. 2001. Reproductive patterns of female muskoxen in northeastern
Alaska. Alces 37: 403-410.
Ross, I. P., and M. G. Jalkotzy. 1996. Cougar predation on moose in southwestern
Alberta. Alces 32: 1-8.
Sargeant, D. E., and D. H. Pimlott. 1959. Age determination in moose from sectioned
incisor teeth. Journal of Wildlife Management 23: 315-321.
Sawyer, H., F. Lindzey, and D. McWhirter. 2005. Mule deer and pronghorn migration
in western Wyoming. Wildlife Society Bulletin 33: 1266-1273.
152
Schladweiler, P., and D. R. Stevens. 1973. Reproduction of Shiras moose in Montana.
Journal of Wildlife Management 37: 535-544.
Schwartz, C. C., W. L. Regelin, and A. W. Franzmann. 1984. Seasonal dynamics of
food intake in moose. Alces 20: 223-244.
Schwartz, C. C., W. L. Regelin, and A. W. Franzmann. 1987. Seasonal weight dynamics
of moose. Swedish Wildlife Research (Supplement) 1: 301-310.
Schwartz, C. C., and K. J. Hundertmark. 1993. Reproductive characteristics of Alaskan
moose. Journal of Wildlife Management 57: 454-468.
Schwartz, C. C., S. L. Monfort, P. H. Dennis, and K. J. Hundertmark. 1995. Fecal
progestagen concentration as an indicator of the estrous cycle and pregnancy in
moose. 59: 580-583.
Schwartz, C. C. 1997. Reproduction, natality, and growth. Pages 141-171 in A.W.
Franzmann and C.C. Schwartz, eds. Ecology and management of North
American moose. Smithsonian Institute Press, Washington, D.C., USA.
Schwartz, C. C., M. A. Haroldson, K. A. Gunther, and D. Moody. 2006. Distribution of
grizzly bears in the Greater Yellowstone Ecosystem in 2004. Ursus 17: 63-66.
Skalski, J. R., K. E. Ryding, and J. J. Millspaugh. 2005. Wildlife demography: analysis
of sex, age, and count data. Elsevier Academic Press, Burlington, Massachusetts,
USA.
Smith, B. L., E. S. Williams, K. C. McFarland, T. L. McDonald, G. Wang, and T. D.
Moore. 2006. Neonatal mortality of elk in Wyoming: environmental, population,
and predator effects. U.S. Fish and Wildlife Service, Biological Technical
Publication, BTP-R6007-2006, Washington, D.C., USA.
153

Smith, D. W., K. M. Murphy, and D. S. Guernsey. 1999. Yellowstone Wolf Project:
Annual Report, 1998. National Park Service, Yellowstone Center for Resources,
Yellowstone National Park, Wyoming, USA, YCR-NR-99-1.
Stenhouse, G. B., P. B. Latour, L. Kutny, N. MacLean, and G. Glover. 1995.
Productivity, survival, and movements of female moose in a low-density
population, Northwest Territories, Canada. Arctic 48: 57-62.
Stephenson, T. R., J. W. Testa, G. P. Adams, R. G. Sasser, C. C. Schwartz, and K. J.
Hundertmark. 1995. Diagnosis of pregnancy and twinning in moose by
ultrasonography and serum assay. Alces 31: 167-172.
Swenson, J. E., B. Dahle, H. Busk, O. Opseth, T. Johansen, A. Söderberg, K. Wallin, and
G. Cederlund. 2007. Predation on moose calves by European brown bears.
Journal of Wildlife Management 71: 1993-1997.
Testa, J. W. 1998. Compensatory responses to changes in calf survivorship:
management consequences of a reproductive cost in moose. Alces 34: 107-115.
Testa, J. W., and G. P. Adams. 1998. Body condition and adjustments to reproductive
effort in female moose (Alces alces). Journal of Mammalogy 79: 1345-1354.
Testa, J. W., E. F. Becker, and G. R. Lee. 2000. Temporal patterns in the survival of
twin and single moose (Alces alces) calves in southcentral Alaska. Journal of
Mammalogy 81: 162-168.
Testa, J. W. 2004. Population dynamics and life history trade-offs of moose (Alces
alces) in south-central Alaska. Ecology 85: 1439-1452.
Tyers, D. B. 2003. Winter ecology of moose on the northern Yellowstone winter range.
Dissertation, Montana State University, Bozeman, Montana, USA.
154
Van Ballenberghe, V. 1987. Effects of predation on moose numbers: a review of recent
North American studies. Swedish Wildlife Research (Supplement) 1: 431-460.
Van Ballenberghe, V., and W. B. Ballard. 1994. Limitation and regulation of moose
populations: the role of predation. Canadian Journal of Zoology 72: 2071-2077.
Van Ballenberghe, V., and W. B. Ballard. 1997. Population dynamics. Pages 223-245
in A.W. Franzmann and C.C. Schwartz, eds. Ecology and Management of North
American Moose. Smithsonian Institute Press, Washington, D.C., USA.
Whitlock, C. 1993. Postglacial vegetation and climate of Grand Teton and southern
Yellowstone National Parks. Ecological Monographs 63: 173-198.
Wyoming Game and Fish Department. 2006. Mountain lion management plan. Trophy
Game Section (Management/Research Branch), Wyoming Game and Fish
Department, Lander, Wyoming, USA.
Wyoming Game and Fish Department. 2007a. Annual black bear mortality summary:
harvest year 2007. Trophy Game Section (Management/Research Branch),
Wyoming Game and Fish Department, Lander, Wyoming, USA.
Wyoming Game and Fish Department. 2007b. Jackson region annual big game herd unit
report 2006. Wyoming Game and Fish Department, Cheyenne, Wyoming, USA.
Zager, P., and J. Beecham. 2006. The role of American black bears and brown bears as
predators on ungulates in North America. Ursus 17: 95-108.
155

156
Table 4.1. Number of moose sampled (n), mean rate ( x ), and 95% confidence intervals (95% CI) for adult female moose
reproductive parameters and calf moose survival in northwest Wyoming, biological years 2004-2006.
2004 2005 2006 Total
Parameter n x 95% CI N x 95% CI n x 95% CI n x 95% CI
Pregnancya 21 0.91 0.78-1.00 19 0.95 0.85-1.00 19 0.90 0.76-1.00 59 0.92 0.84-0.99
Parturition
Handledb 16 0.19 0.00-0.38 16 0.25 0.04-0.46 13 0.31 0.06-0.56 45 0.24 0.12-0.37
Unhandledc 14 0.79 0.57-1.00 19 0.79 0.61-0.97 10 0.80 0.55-1.00 43 0.79 0.67-0.91
Twinningd 14 0.00 0.00-0.00 19 0.11 0.00-0.24 12 0.08 0.00-0.24 45 0.07 0.00-0.14
Neonate survivale
14 0.50 0.24-0.76 17 0.71 0.49-0.92 11 0.64 0.35-0.92 42 0.62 0.47-0.77
Annual calf survivalf
13 0.39 0.12-0.65 18 0.56 0.33-0.79 10 0.40 0.10-0.70 41 0.46 0.31-0.62
a n = number females captured. Pregnancy rate calculated from pregnancy-specific protein B of handled moose only. b n = number of pregnant, handled moose alive at start of parturition surveys. c n = number of parturient females calculated from the number of unhandled, female moose alive at start of parturition surveys
multiplied by the pregnancy rate for handled moose during each year. d n = total number of cows observed with calves. e n = number of calves that were observed during parturition surveys. One calf was censored in 2006 due to radio failure of cow. f n = early and late births combined. Six calves censored (2005 = 1; 2006 = 3; 2007 = 2) due to radio failure or death of cow.

Table 4.2. Adult annual (i.e., biological year [BY]) and study period (i.e., total) survival rates and 95% confidence intervals (CI)
estimated using the Kaplan-Meier staggered entry design for radio-collared female and male Shiras moose in northwest Wyoming.
Male BY 2004 included February, March, April, and May only and was not an estimate for the entire BY. Male survival rates were
estimated separately with harvest included and harvest censored in BY 2005 and BY 2006.
Year Number alive
at start Number added
Number deaths
Number censored
Survival rate 95% CI
Female
BY 2004 18 21 6 1 0.84 0.73-0.96
BY 2005 32 12 2 4 0.94 0.86-1.00
BY 2006 38 15 8 20a 0.77 0.62-0.91
BY 2007 25 32 10 1 0.79 0.66-0.91
Total 113 80 26 26 0.83 0.77-0.89
Male
BY 2004 0 27 0 2 1.00 1.00-1.00
BY 2005
Harvest included 25 4 7 0 0.74 0.57-0.90
Harvest censored 25 4 4 3 0.84 0.70-0.98
BY 2006
Harvest included 22 0 5 1 0.77 0.60-0.95
Harvest censored 22 0 3 3 0.86 0.72-1.00
BY 2007 16 0 0 3 1.00 1.00-1.00
157
Table 4.2. Continued.
Year Number alive
at start Number added
Number deaths
Number censored
Survival rate 95% CI
Male
Total
Harvest included 63 31 12 6 0.82 0.73-0.91
Harvest censored 63 31 7 11 0.89 0.82-0.97 a Fifteen global positioning system collars released from adult female moose on 1 March 2007.
158

Figure 4.1. Study area located in northwest Wyoming. The Buffalo Fork River is
approximately 50 km north of Jackson, Wyoming, USA. Moose hunt areas 7, 14, and 32
were closed to hunting during 2005 and 2006, but opened to limited quota, antlered
harvest in 2007.
159
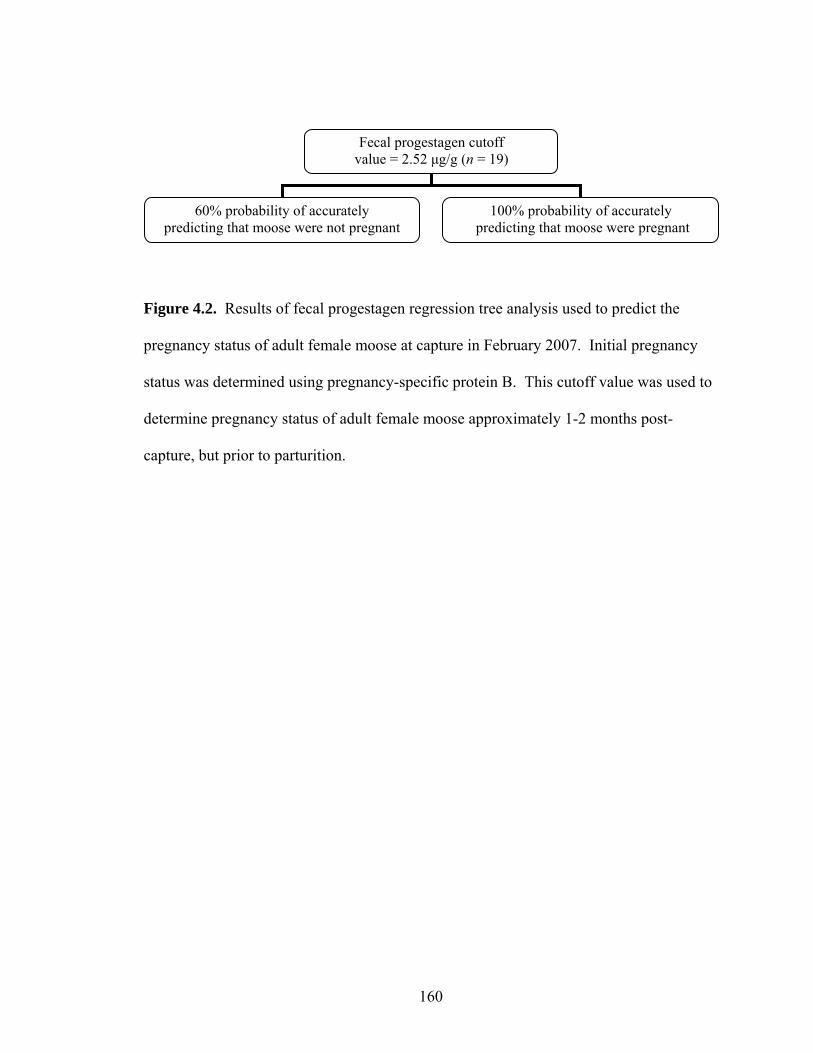
60% probability of accurately predicting that moose were not pregnant
100% probability of accurately predicting that moose were pregnant
Fecal progestagen cutoff value = 2.52 μg/g (n = 19)
Figure 4.2. Results of fecal progestagen regression tree analysis used to predict the
pregnancy status of adult female moose at capture in February 2007. Initial pregnancy
status was determined using pregnancy-specific protein B. This cutoff value was used to
determine pregnancy status of adult female moose approximately 1-2 months post-
capture, but prior to parturition.
160

0.0 1.0 2.0 3.0 4.0 5.0 6.0 7.0 8.0 9.0 10.0
Fecal progestagen (micrograms/gram dry feces)
Ob
serv
ed w
ith
cal
f in
sp
rin
g
HandledUnhandled
= 2.52 μg/g dry feces
PregnantNot pregnant
No
Yes
Figure 4.3. Progestagen concentrations from fecal samples collected > 1 month post-
capture for handled and unhandled adult female moose in northwest Wyoming, 2006-
2007. The handled sample was for moose that were pregnant at capture based on
pregnancy-specific protein B while the pregnancy status of unhandled moose was
estimated using the fecal progestagen cutoff value (vertical line). The top row represents
female moose that were observed with calves (n = 7 handled, n = 9 unhandled) and the
bottom row represents female moose that were not observed with calves (n = 14 handled,
n = 3 unhandled) during spring parturition surveys.
161

0.70
0.75
0.80
0.85
0.90
0.95
1.00
1.05
Jun Jul Aug Sep Oct Nov Dec Jan Feb Mar Apr May
Month
Fem
ale
surv
ival
Upper 95% CI
Survival
Lower 95% CI
Figure 4.4. Pooled annual survival curve and upper and lower 95% confidence intervals
(CI) by month for radio-collared adult female moose in northwest Wyoming, biological
years 2004-2007.
162
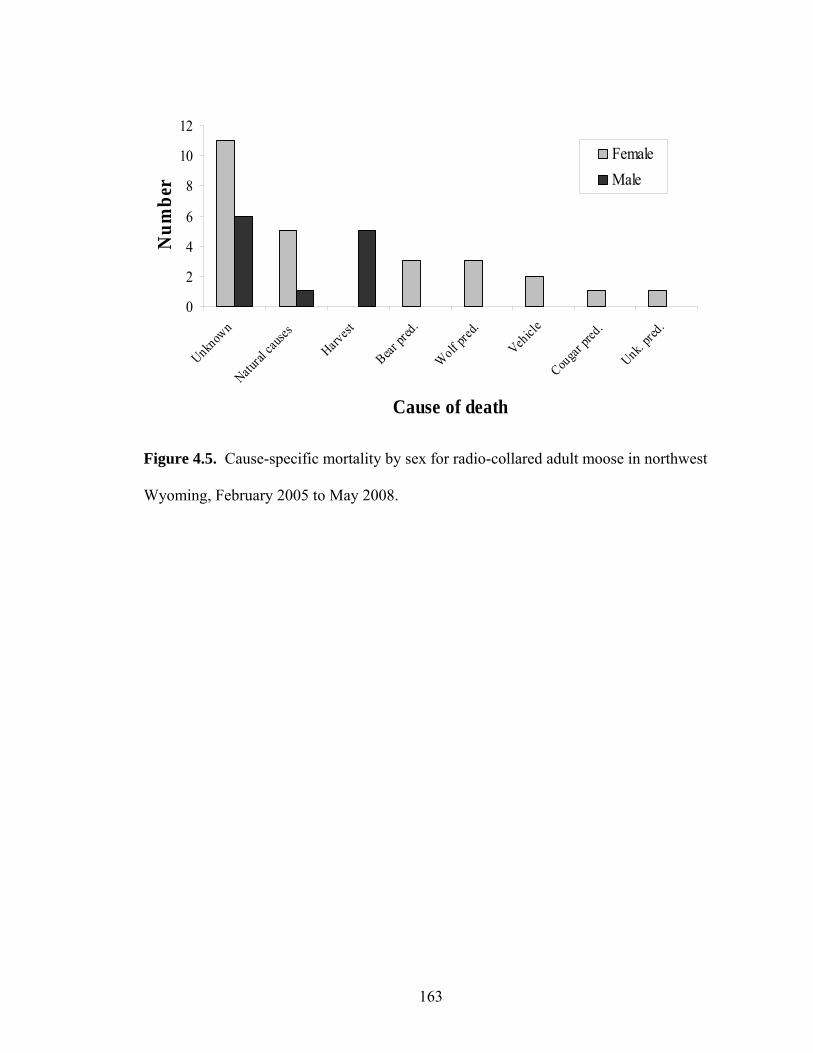
0
2
4
6
8
10
12
Unknow
n
Natural
caus
es
Harves
t
Bear p
red.
Wolf
pred
.
Vehicl
e
Couga
r pred
.
Unk. pr
ed.
Cause of death
Nu
mb
erFemale
Male
Figure 4.5. Cause-specific mortality by sex for radio-collared adult moose in northwest
Wyoming, February 2005 to May 2008.
163

0.70
0.75
0.80
0.85
0.90
0.95
1.00
1.05
Jun Jul Aug Sep Oct Nov Dec Jan Feb Mar Apr May
Month
Mal
e su
rviv
al
Upper 95% CI
Survival
Lower 95% CI
0.70
0.75
0.80
0.85
0.90
0.95
1.00
1.05
Jun Jul Aug Sep Oct Nov Dec Jan Feb Mar Apr May
Month
Mal
e su
rviv
al
Upper 95% CI
Survival
Lower 95% CI
(A)
(B)
Figure 4.6. Pooled annual survival curves and upper and lower 95% confidence intervals
(CI) by month for radio-collared adult male moose when (A) harvest was censored and
(B) harvest was included in survival analyses, biological years 2004-2007.
164
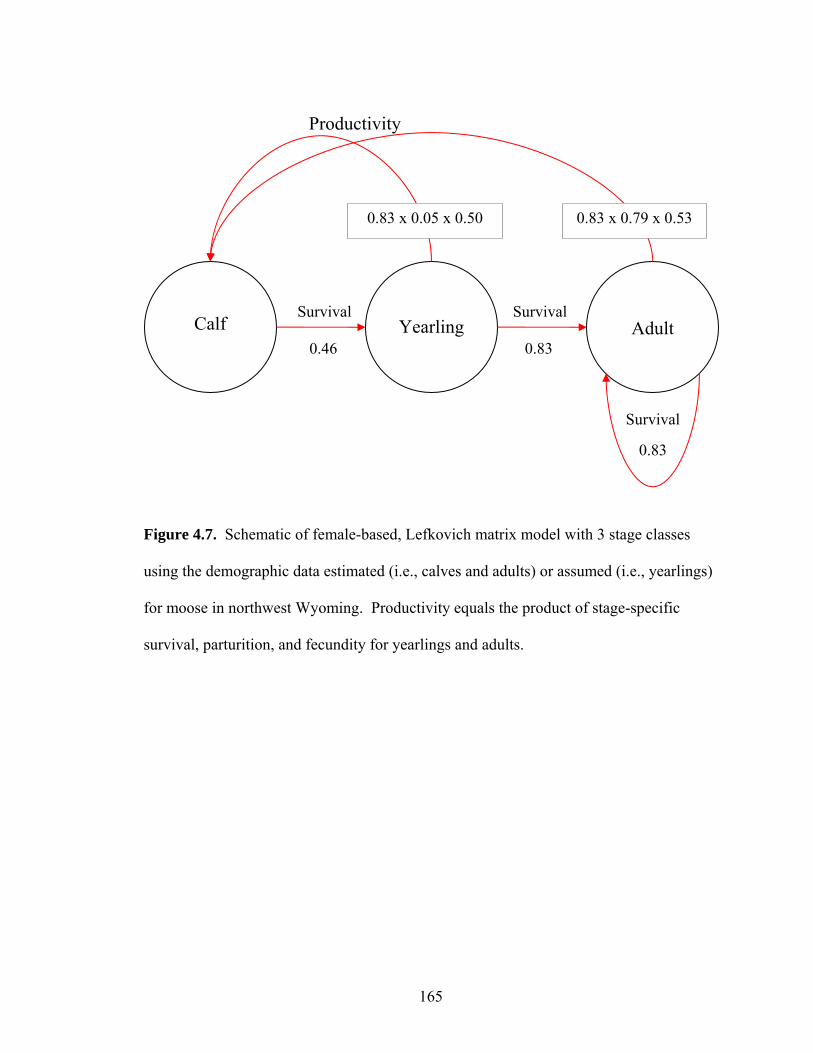
Calf
Yearling
3
Adult Survival
0.83 x 0.79 x 0.530.83 x 0.05 x 0.50
Productivity
0.46
Survival 0.83
Survival
0.83
Figure 4.7. Schematic of female-based, Lefkovich matrix model with 3 stage classes
using the demographic data estimated (i.e., calves and adults) or assumed (i.e., yearlings)
for moose in northwest Wyoming. Productivity equals the product of stage-specific
survival, parturition, and fecundity for yearlings and adults.
165

0.00
0.10
0.20
0.30
0.40
0.50
0.60
0.70
Adult survival Calf survival Yearling survival Adult productivity
Matrix element
Ela
stic
ity
Figure 4.8. The deterministic elasticity of matrix elements calculated from the pooled
vital rates from the demographic study. Adult productivity was the product of adult
survival, parturition, and fecundity rates. The elasticity for yearling productivity was <
0.01.
166

0
50
100
150
200
250
≤0.
87
0.88
-0.8
9
0.90
-0.9
1
0.92
-0.9
3
0.94
-0.9
5
0.96
-0.9
7
0.98
-0.9
9
1.00
-1.0
1
1.02
-1.0
3
1.04
-1.0
5
1.06
-1.0
7
1.08
-1.0
9
1.10
-1.1
1
1.12
-1.1
3
≥1.
14
Finite rate of increase
Num
ber
of r
epli
cate
s
= 0.972
= 0.907 = 1.062
Figure 4.9. Distribution and range of the finite rate of increase (λ) for Shiras moose in
northwest Wyoming, biological year 2004-2007, based on 1,000 replicates of a Leslie
matrix population model with vital rates selected randomly from a binomial distribution.
The middle vertical line represents the mean λ estimate. The left and right vertical lines
represent the lower and upper 95% confidence intervals, respectively.
167

CHAPTER 5
GENERAL CONCLUSIONS
Summary
Throughout their circumpolar distribution, moose (Alces alces) generally seek
winter habitats that provide abundant forage (Peek 1997, Månsson et al. 2007). Shiras
moose (A.a. shirasi) in northwest Wyoming appeared to follow a similar pattern and
selected low-elevation, riparian habitats dominated by willow (Salix spp.) communities.
In Alaska, aspen (Populus tremuloides) ranked as the highest quality winter forage
(Oldemeyer et al. 1977), thus selection for aspen indicated that moose not only preferred
habitats with high forage biomass, but they also selected for the highest quality browse
available during winter. Moose also selected for areas with high habitat diversity which
indicated that they require a variety of resources to meet their nutritional and energetic
requirements during winter. I observed little evidence to support a shift to more closed-
canopy habitats as winter progressed, but winter range conditions may not have been
severe enough to necessitate selection for coniferous habitats during late winter (Poole
and Stuart-Smith 2006).
Summer habitat selection by adult female moose in the study area appeared to be
associated with habitat and landscape features that limited the effects of thermal stress.
Areas classified as high-use during summer were > 300 m higher in elevation and > 100
m closer to cover than areas classified as high-use in winter. Selection for habitats in
close proximity to cover may have provided refugia from high summer temperatures that
typically exceeded the heat stress threshold for moose. Although my data do not prove
168

that mature coniferous forests are critical for moose survival during summer (Balsom et
al. 1996), they do lend support to the notion that these habitats are important in providing
cover and reducing the potential effects of heat stress near the southern extent of their
range.
Moose exhibited a high degree of individual variability in the onset of spring and
autumn migrations. In general, there was a relationship between the onset of spring
migration and the elevation of summer ranges in 2006 which indicated that snow
conditions may be a factor in the timing of migration in some years. There was no
relationship between autumn migration and the elevation of summer range which
indicated that a rapid accumulation of snow initiated migration regardless of summer
range elevation. Photoperiod may also affect the timing of migratory events in the study
population (Garrott et al. 1987).
Based on comparisons of blood parameters compiled for Alaskan moose (A.a.
gigas; Franzmann and LeResche 1978), adult female moose in the study area appeared to
be in moderate physical condition. Ultrasonic rump fat measurements were relatively
high, but there was evidence that moose winter forage was deficient in copper, zinc,
manganese, and phosphorous. Because of nutritional deficiencies, the study population
may require greater fat depths than other moose populations to maximize reproductive
potential (Heard 1997). Rump fat levels indicated that moose were able to obtain
sufficient quantities of forage, but these resources were not of the highest quality. I
observed a significant negative relationship between rump fat levels and two blood
parameters, aspartate aminotransferase and lactate dehydrogenase. Both of these
parameters are indicators of muscle and organ damage generally associated with
169

exertional myopathy (EM; Williams and Thorne 1996), however, concentrations were not
indicative of EM. The negative relationships that I observed were consistent with
increased utilization of body proteins as lipid reserves decline in lean animals. Diseases
and parasites appeared to have minimal population-level effects. However, the impacts
of the winter tick (Dermacentor albipictus) may increase in years following warm, dry
springs.
The north Jackson moose herd appears to have been declining since the late 1980s
based on indices of moose density (Chapter 1) and modeling efforts from my study
indicated that a declining population was more likely than a stable or increasing
population. The population growth rate was influenced by late winter and early spring
adult female mortality. Although increased predation may have partially contributed to
the observed decline, its influence was likely limited by the abundance of alternate prey,
specifically elk (Cervus elaphus), in the Greater Yellowstone Ecosystem. Additionally,
the study population exhibited low reproductive potential in the form of low twinning
rates, reproductive pauses, and relatively low parturition rates. This indicated that the
nutritional quality of available forage may be the most important determinant in limiting
population growth because a reduction in moose numbers over a 20-year period, no
matter the cause, should have resulted in increased physical condition and reproductive
success (Bowyer et al. 2005). Moose populations may have slowly declined in response
to gradually declining habitat quality over this time period.
In addition to the 1988 Yellowstone fires and its effect on moose summer ranges,
another explanation for the declining population performance with reduced moose
numbers could be drought and climate change (Murray et al. 2006). Although a loss of
170
vigor and even death has been observed due to drought in a riparian tree species from
eastern Montana, the plains cottonwood (P. deltoides; Knight 1994), to my knowledge,
no work has been conducted to examine the effects of drought on the growth potential
and nutritional quality of riparian vegetation in the Intermountain West. In northwest
Wyoming, there has been a series of relatively mild winters and dry summers since the
1990s, and if the nutritional quality of riparian vegetation preferred by moose was altered
due to drought, this may have had a negative effect on the physical condition and overall
population performance of the north Jackson moose herd.
While habitat quality and its effects on the physical condition, survival, and
reproductive success of adult female moose appeared to be the primary factor limiting
population growth, I cannot discount the potential effects of predation. Although
evaluating cause-specific mortality was not a primary objective during this study, grizzly
bears (Ursus arctos) and gray wolves (Canis lupus) were responsible for some
mortalities. However, a relatively high proportion of deaths were attributed to natural
causes not related to predation which suggested that predation pressure was insufficient
to account for the nutritional limitations of the habitat.
Management Implications
Shiras moose population declines in northwest Wyoming began shortly after the
1988 Yellowstone fires (Chapter 1) and moose selection for areas in close proximity to
coniferous cover indicated that a reduction in this habitat feature may have been
detrimental to moose. Similar patterns were observed on the northern Yellowstone
winter range after the 1988 wildfires (Tyers 2003). A reduction in coniferous cover on
171

summer range may have reduced the amount of available forage and increased thermal
stress that, ultimately, resulted in reduced physical condition and lower reproductive
potential. The continued threat of disturbances (i.e., wildfires, insect outbreaks) that have
the potential to greatly reduce the availability of coniferous forests may negatively affect
moose populations near the southern extent of their range. Because much of the summer
range used by moose in northwest Wyoming is managed for natural regulation, little can
be done to improve these habitats. Therefore, continued monitoring of moose
populations and the potential effects of reduced coniferous cover appear warranted.
Although winter range habitat improvements occurred during the early 1990s in
the Jackson Valley, these were relatively small in scale. Thus, improvements in fitness
may only have been observed at the individual rather than the population-level. To
benefit moose at the population-level, large-scale improvement projects could be
initiated. However, because of differences in management strategies among state and
federal agencies in the Jackson Valley, this may be a difficult task. Nonetheless, through
cooperation and planning, efforts to improve moose winter ranges on a large-scale could
be implemented. Prescribed burns or mechanical treatment of preferred riparian shrubs
would improve growth as well as the nutritive value of forage for moose and other
ungulates. Aspen was also an important component of moose winter range and projects
that encourage growth and regeneration could benefit this population. Habitat
improvements would likely lead to improved herd health and may result in increased
adult female survival, reproductive success, and population growth.
172

Future Research
Given insights from this study, future research can be directed to answer more
specific questions in regards to the ecology and dynamics of moose populations in
northwest Wyoming. Global positioning system collars could be used to further assess
the importance of coniferous cover for moose on summer ranges by examining habitat
selection patterns between day and night. If thermal stress during summer influences
habitat selection, one would expect to see more use of coniferous cover during the day
when temperatures are high and less use during night (Muir 2006). This could also be
evaluated during late winter and early spring because moose may select habitats that
reduce thermal stress as spring temperatures increase. Although the predictive-
probability-of-use map provided a framework to estimate where moose are most likely to
be located during winter, it did not take into account environmental factors such as snow
depths or ambient temperatures. Some areas classified as high-use during winter may not
support moose because of greater snow depths than what occurs in the Buffalo Valley.
This would greatly reduce the availability of forage and increase the energetic cost of
locomotion which would likely result in reduced physical condition. Areas in and around
Pacific Creek in Grand Teton National Park may need to be reassessed due to this factor.
Further evaluation of the physiological health of this population appears
warranted. By evaluating blood parameters in relation to individual habitat selection
patterns, researchers may have a clearer picture of habitat components that could reduce
moose fitness. Continued evaluation of blood parameters that are correlated with rump
fat depth may provide managers with an easy assessment of physical condition without
the need for an ultrasound. Rump fat depths or blood parameters can be used to assess
173

the health of moose herds statewide by collecting this information at check stations
during the autumn. This would provide managers with a relative index of the nutritional
status of moose populations entering winter. This information could also be used to
assess fat catabolism as a function of winter severity or reproductive status if moose were
to be captured again during mid to late winter. To gain a better understanding of the
relationship and utilization rates between protein and fat reserves during winter, I would
strongly recommend using ultrasonography to measure the thickness of specific muscles
from captured moose (Cook et al. 2001). Preferably, this would be accomplished at the
beginning and near the end of each winter season so that accurate assessments of
utilization rates could be conducted. Nutritional deficiencies are best examined through
direct evaluation of the mineral content of forage (McDowell 2003). Therefore, future
research could assess the mineral content of preferred moose forage, both during winter
and summer. This could also provide information that may be used to assess the potential
effects of drought and climate change on moose browse in the Jackson Valley.
Furthermore, estimating annual browse biomass removal rates could provide an
additional assessment of the nutritional status of this population. Boertje et al. (2007)
suggested that, in addition to multi-year twinning rates < 10%, annual browse biomass
removal rates of > 35% may be indicative of low nutritional status of a moose population.
Long-term studies of the dynamics of this moose population appear warranted.
Because of the reduced parturition rates of moose captured during this study, capturing
and radio-collaring a large sample of moose at once, then not handling them again for the
duration of the study, could provide estimates of survival and reproductive success over a
very long time period. This could be used to further assess the reproductive output (i.e.,
174

parturition rates, twinning rates, reproductive pauses) of this population on an annual
basis by removing capture effects completely. Additionally, capturing a sample of short-
yearlings over the course of 2-3 years could be used to estimate yearling survival and
parturition rates as well as the age of first reproduction. Yearling survival and parturition
rates could be used to estimate more accurately the growth rate of this population. The
age of first reproduction could be used to evaluate further the nutritional status of the
population (Boertje et al. 2007).
More effort could be made to estimate cause-specific mortality and further
evaluate the potential effects of grizzly bear and gray wolf predation as well as the
impacts of condition in predisposing moose to predator-related mortality. Although I
used a simple technique to evaluate condition at time of death, it did not appear to be very
useful because it was too general. Collecting marrow samples and evaluating percent
marrow fat would be a better assessment of condition at time of death (Neiland 1970,
Ballard 1995). Increasing the frequency of aerial relocations, especially during spring,
could expedite the ability of researchers to determine cause of death prior to significant
scavenging. Bear sign was evident at mortality sites, but there was an insufficient
amount of moose remains to determine cause-specific mortality. Thus, in many cases, I
was unable to determine if the moose died due to some other factor prior to the arrival of
the bear or if the bear was the proximate cause of death.
175

LITERATURE CITED
Ballard, W. B. 1995. Bone marrow fat as an indicator of ungulate condition – how good
is it? Alces 31: 105-109.
Balsom, S., W. B. Ballard, and H. A. Whitlaw. 1996. Mature coniferous forests as
critical moose habitat. Alces 32: 131-140.
Boertje, R. D., K. A. Kellie, C. T. Seaton, M. A. Keech, D. D. Young, B. W. Dale, L. G.
Adams, and A. R. Aderman. 2007. Ranking Alaska moose nutrition: signals to
begin liberal antlerless harvests. Journal of Wildlife Management 71: 1494-1506.
Bowyer, R. T., D. K. Person, and B. M. Pierce. 2005. Detecting top-down versus
bottom-up regulation of ungulates by large carnivores: implications for
conservation of biodiversity. Pages 342-380 in J. C. Ray, K. H. Redford, R. S.
Steneck, and J. Berger, eds. Large carnivores and the conservation of
biodiversity. Island Press, Washington, D.C., USA.
Cook, R. C., J. G. Cook, D. L. Murray, P. Zager, B. K. Johnson, and M. W. Gratson.
2001. Development of predictive models of nutritional condition for Rocky
Mountain elk. Journal of Wildlife Management 65: 973-987.
Franzmann, A. W., and R. E. LeResche. 1978. Alaskan moose blood studies with
emphasis on condition evaluation. Journal of Wildlife Management 42: 334-351.
Garrott, R. A., G. C. White, R. M. Bartmann, L. H. Carpenter, and A. W. Alldredge.
1987. Movements of female mule deer in northwest Colorado. Journal of
Wildlife Management 51: 634-643.
Heard, D., S. Barry, G. Watts, and K. Child. 1997. Fertility of female moose (Alces
alces) in relation to age and body composition. Alces 33: 165-176.
176

Knight, D. L. 1994. Mountains and plains: the ecology of Wyoming landscapes. Yale
University Press. New Haven, Connecticut, USA.
Månsson, J., H. Andrén, A. Pehrson, R. Bergström. 2007. Moose browsing and forage
availability: a scale-dependent relationship? Canadian Journal of Zoology 85:
372-380.
McDowell, L. R. 2003. Minerals in animal and human nutrition. Second Edition.
Elsevier Science B.V., Amsterdam, The Netherlands.
Muir, J. D. 2006. Habitat selection and reproduction by Shiras moose (Alces alces
shirasi) in anthropogenic landscapes in Idaho. Thesis, University of Idaho,
Moscow, Idaho, USA.
Murray, D. L., E. W. Cox, W. B. Ballard, H. A. Whitlaw, M. S. Lenarz, T. W. Custer, T.
Barnett, and T. K. Fuller. 2006. Pathogens, nutritional deficiencies, and climate
influences on a declining moose population. Wildlife Monographs 166.
Neiland, K. A. 1970. Weight of dried marrow as an indicator of fat in caribou femurs.
Journal of Wildlife Management 34: 904-907.
Oldemeyer, J. L., A. W. Franzmann, A. L. Brundage, P. D. Arneson, and A. Flynn. 1977.
Browse quality and the Kenai moose population. Journal of Wildlife
Management 41: 533-542.
Peek, J. M. 1997. Habitat relationships. Pages 351-375 in A.W. Franzmann and C.C.
Schwartz, eds. Ecology and management of North American moose.
Smithsonian Institute Press, Washington, D.C., USA.
Poole, K. G., and K. Stuart-Smith. 2006. Winter habitat selection by female moose in
western interior montane forests. Canadian Journal of Zoology 84: 1823-1832.
177

Tyers, D. B. 2003. Winter ecology of moose on the northern Yellowstone winter range.
Dissertation, Montana State University, Bozeman, Montana, USA.
Williams, E. S., and E. T. Thorne. 1996. Exertional myopathy (capture myopathy).
Pages 181-193 in A. Fairbrother, L. N. Locke, and G. L. Hoff, eds. Noninfectious
diseases of wildlife. Second Edition. Iowa State University Press, Ames, Iowa,
USA.
178

179
APPENDIX A
SPATIAL AND TEMPORAL CHARACTERISTICS OF MOOSE HIGHWAY
CROSSINGS IN THE BUFFALO FORK VALLEY, WYOMING
A final report submitted to the Wyoming Department of Transportation
State of Wyoming artment of Transportation
U.S. Department of Transportation Federal Highway Administration
FINAL REPORT FHWA-WY-08/03F
Dep
SPATIAL AND TEMPORAL CHARACTERISTICS OF MOOSE HIGHWAY CROSSINGS IN THE BUFFALO FORK VALLEY,
WYOMING
Prepared by:
U.S. Geological Survey Wyoming Cooperative Fish and Wildlife Research Unit
University of Wyoming Department 3166, 1000 East University Avenue
Laramie, Wyoming 82071
February 2008
180

Notice This document is disseminated under the sponsorship of the U.S. Department of Transportation in the interest of information exchange. The U.S. Government assumes no liability for the use of the information contained in this document. The contents of this report reflect the views of the author(s) who are responsible for the facts and accuracy of the data presented herein. The contents do not necessarily reflect the official views or policies of the Wyoming Department of Transportation or the Federal Highway Administration. This report does not constitute a standard, specification, or regulation. The United States Government and the State of Wyoming do not endorse products or manufacturers. Trademarks or manufacturers’ names appear in this report only because they are considered essential to the objectives of the document.
Quality Assurance Statement The Federal Highway Administration (FHWA) provides high-quality information to serve Government, industry, and the public in a manner that promotes public understanding. Standards and policies are used to ensure and maximize the quality, objectivity, utility, and integrity of its information. FHWA periodically reviews quality issues and adjusts its programs and processes to ensure continuous quality improvement.
181

Technical Report Documentation Page Report No.
FHWA-WY-08/03F
Government Accession No.
Recipients Catalog No.
Report Date
February 2008
Title and Subtitle: Spatial and temporal characteristics of moose highway crossings in the Buffalo Fork Valley, Wyoming
Performing Organization Code
Author(s)
Scott Becker, Matthew Kauffman, and Wayne Hubert
Performing Organization Report No.
Work Unit No.
RS01(205) Job No. B29Y
Performing Organization Name and Address
U.S. Geological Survey
Wyoming Cooperative Fish and Wildlife Research Unit University of Wyoming
Department 3166, 1000 East University Avenue Laramie, WY 82071
Contact or Grant No.
Type of Report and Period Covered
Final Report
February 2005 – February 2008
Sponsoring Agency Name and Address
Wyoming Department of Transportation 5300 Bishop Blvd.
Cheyenne, WY 82009-3340 WYDOT Research Center (307) 777-4182
Sponsoring Agency Code
Supplementary Notes
WYDOT Technical Contact: Cody Beers, Public Involvement Specialist, District 5, Riverton. Abstract: The purpose of this study was to provide the Wyoming Department of Transportation (WYDOT) and the Wyoming Game and Fish Department (WGFD) with information that could be used to assess the importance of habitat, landscape, and anthropogenic features that are essential determinants in evaluating moose crossing locations in northwest Wyoming. Approximately 30 moose were captured, tranquilized, and collared using global positioning system (GPS) collars. The collars were programmed to provide a fix every hour from 15 November to 15 June, and every five hours from 16 June to 14 November. The results of this study demonstrated that models developed to assess adult female moose winter habitat selection could be used at a finer spatial scale to accurately identify areas where moose are most likely to cross U.S. Highway 26/287 in the Buffalo Valley. The moose crossing events were not randomly distributed, but occurred at predictable locations that could be estimated by examining winter habitat selection parameters that contained an abundance of forage provided by aspen and willow-dominated, riparian habitats, on either side of the road.
Key Words Wyoming, GPS, collar, moose, habitat, vegetation, structure, roadway design, crossing, migration.
Distribution Statement
Unlimited
Security Classif. (Of this report)
Unclassified
Security Clasif. (Of this page)
Unclassified
No. of Pages
35
Price
Form DOT F 1700.7 (8-72) Reproduction of form and completed page is authorized.
182

SI* (Modern Metric) Conversion Factors
Approximate Conversions from SI Units Approximate Conversions to SI Units Symbol When You Know Multiply By To Find Symbol Symbol When You Know Multiply By To Find Symbol
Length Length
mm millimeters 0.039 inches in in inches 25.4 millimeters mm m meters 3.28 feet ft ft feet 0.305 meters m m meters 1.09 yards yd yd yards 0.914 meters m
km kilometers 0.621 miles mi mi miles 1.61 kilometers km
Area Area mm2 square millimeters 0.0016 square inches in2 in2 square inches 645.2 square millimeters mm2 m2 square meters 10.764 square feet ft2 ft2 square feet 0.093 square meters m2 m2 square meters 1.195 square yards yd2 yd2 square yards 0.836 square meters m2 ha hectares 2.47 acres ac ac acres 0.405 hectares ha
km2 square kilometers 0.386 square miles mi2 mi2 square miles 2.59 square kilometers km2
Volume Volume ml milliliters 0.034 fluid ounces fl oz fl oz fluid ounces 29.57 milliliters ml l liters 0.264 gallons gal gal gallons 3.785 liters l
m3 cubic meters 35.71 cubic feet ft3 ft3 cubic feet 0.028 cubic meters m3 m3 cubic meters 1.307 cubic yards yd3 yd3 cubic yards 0.765 cubic meters m3
Mass Mass
g grams 0.035 ounces oz oz ounces 28.35 grams g kg kilograms 2.202 pounds lb lb pounds 0.454 kilograms kg Mg megagrams 1.103 short tons (2000 lbs) T T short tons (2000 lbs) 0.907 megagrams Mg
Temperature (exact) Temperature (exact)
°C Centigrade 1.8 C + 32 Fahrenheit °F °F Fahrenheit 5(F-32)/9 Celsius °C temperature temperature temperature or (F-32)/1.8 temperature
Illumination Illumination lx lux 0.0929 foot-candles fc fc foot-candles 10.76 lux lx
cd/m2 candela/m2 0.2919 foot-Lamberts fl fl foot-Lamberts 3.426 candela/m2 cd/m2
Force and Pressure or Stress Force and Pressure or Stress N newtons 0.225 poundforce lbf lbf pound-force 4.45 newtons N
kPa kilopascals 0.145 pound-force per square inch psi psi pound-force per square inch 6.89 kilopascals kPa
183
184
Awould faccomthe mmdiscussions and for providing helpful edits to have been possible without the funding Conservation District, WyomDepartm(WGFD), and the WF Tindividuand Michael Patritch, WYDOT research massisSawyer of Western Ecosystemhabitat selection mhighway crossing mKreeger, Andrea Barbknecht, and mbe thanked enough for providing guidance, support,like to thank the mPark emof this study. Finally, but cerLust (retired) of Mountain Air Research, DaveAir Services, and Dave Stinson of Sky Aviatia
ACKNOWLEDGMENTS
project of this magnitude could not have been accomplished alone. Scott Becker irst like to thank the late Dr. Stanley H. Anderson for his belief in my abilities to
plish this task and for providing me the opportunity to study a fascinating critter, oose. Scott Becker would also like to thank my three remaining committee
embers Dr. Fred Lindzey, Dr. Chuck Anderson, and Dr. Tom Thurow for stimulating this final report. This project would not
and support provided by the Teton County ing Animal Damage Management Board, Wyoming
ent of Transportation (WYDOT), Wyoming Game and Fish Department yoming Governor’s Big Game License Coalition/Wildlife Heritage
oundation of Wyoming.
he success of this project was also due in large part to the contributions of many als from multiple agencies. Cody Beers, WYDOT public involvement specialist,
anager, provided needed data, guidance, tance, and were always available to answer questions. Ryan Nielson and Hall
s Technology, Inc. for discussions and assistance with the odeling procedures and for providing data used to validate the odel. Doug Brimeyer, Steve Kilpatrick, Sarah Dewey, Terry
embers of the WGFD Moose Working Group cannot and field assistance. We would also
any WGFD, Bridger-Teton National Forest, and Grand Teton National ployees who assisted with housing, moose captures, and flights during the course
tainly not least, we would like to thank our pilots – Gary (and Nora and Ashes) Savage of Savage
on. Without your skills and abilities in the ir, we would not have been able to accomplish half of what we set out to do.

EXECUTIVE SUMMARY
To accommodate rises in traffic volume and to address highway safety concerns, transportation managers often need to expand existing travel corridors which may result in an increased risk of wildlife-vehicle collisions. Wildlife-vehicle collisions are not random events and appear to be related to the daily and seasonal activity patterns of animals. By examining the spatial and temporal patterns of wildlife crossings, managers can apply appropriate mitigation to reduce collision risk and maintain highway safety. The U.S. Highway 26/287 reconstruction project provided an opportunity to examine the influence of habitat, landscape, and man-made features that determine moose crossing locations in northwest Wyoming. A previous model developed to assess moose winter habitat selection was used at a smaller spatial scale to determine if it could accurately identify moose crossing locations along a 9.7 km (6.0-mi) section of U.S. Highway 26/287 that bisects a high-density moose winter range in the Buffalo Fork Valley. We used an independent sample of moose crossing locations to validate the predictive highway crossing map. We also examined temporal patterns of moose crossings and the influence of fence types. The predictive map indicated that areas classified as high or medium-high predicted probabilities of use occurred between mileposts 3.2-4.5, 6.1-6.7, and 7.0-9.0. These areas were characterized by a high proportion of aspen and riparian/deciduous shrub habitat with little coniferous cover, low elevation, relatively flat slope, and moderate distance to cover. Of the 201 moose crossings recorded from the independent sample, 81% (n = 162) occurred in high to medium-high probability of use areas. Moose used high-use areas more than expected, medium-high and medium-low use areas as expected, and low-use areas less than expected. Although we were unable to directly measure the use of the Buffalo Fork and Blackrock Creek bridges, mileposts on either side of these structures were classified as high-use areas which suggest a high likelihood that moose utilized these structures to cross U.S. Highway 26/287. Moose crossed the highway more than expected during afternoon to early evening and less than expected during mid-day. A high proportion of fencing occurred along private lands adjacent to the highway that were not preferred moose habitat, therefore, moose crossed the highway more than expected in areas that contained no fencing and less than expected in areas that contained fencing. Fencing along the highway was not constructed to prevent moose movements and preferred habitat and landscape features appeared to have more influence in determining crossing locations than the presence of fencing. Because aggregations of moose crossings occurred at predictable locations and the risk of collisions were highest during periods of limited visibility, managers could reduce speed limits and erect temporary warning signs during winter in areas classified as high and medium-high predicted probabilities of use to warn motorists of the increased risk of encountering a moose on the highway. Due to the low number of moose-vehicle collisions during this study (n = 1), major and costly mitigation may not be justified in the Buffalo Fork Valley unless collisions increase following highway reconstruction. Lengthening existing bridges over rivers and streams may facilitate animal movements
185

under these structures. Moose are not the only animals that inhabit the Buffalo Fork Valley, thus, managers could develop mitigation to benefit multiple species while continuing to maintain motorist safety.
186

TABLE OF CONTENTS CHAPTER 1. PROBLEM DESCRIPTION ...................................................................190 CHAPTER 2. OBJECTIVES..........................................................................................192 CHAPTER 3. TASK DESCRIPTION............................................................................194 Study Area 194 Moose Captures and Data Management 195 Frequency and Timing of Highway Crossing Events 196 Predicting Moose Crossing Locations in the Buffalo Fork Valley 196 Fence Types and Moose Crossings 197 CHAPTER 4. RESULTS................................................................................................200 Frequency and Timing of Highway Crossing Events 200 Predicting Moose Crossing Locations in the Buffalo Fork Valley 201 Fence Types and Moose Crossings 204 CHAPTER 5. DISCUSSION AND RECOMMENDATIONS ......................................206 Discussion 206 Recommendations 209 REFERENCES ................................................................................................................212
187
LIST OF FIGURES FIGURE 1. Study area in northwest Wyoming defined by the winter
distribution of GPS-collared adult female moose (n = 22), 2005-2007 ...................................................................................................194
FIGURE 2. Bighorn fence (view facing west). This was the primary type
of fence found east of the Grand Teton National Park boundary within the highway study area ....................................................................199
FIGURE 3. Radio-collared adult female moose crossing buck-and-rail
fencing. This type of fence was found west of the Buffalo Fork bridge and the Grand Teton National Park boundary in the highway study area .....................................................................................199
FIGURE 4. Highway study area in the Buffalo Fork Valley, Wyoming,
used to measure habitat and landscape variables when creating a predictive map of winter habitat selection along a 9.7-km (6.0-mi) stretch U.S. Highway 26/287 during winter 2005-2007...............201
FIGURE 5. Relative predicted probabilities and associated categories (low
= 0-25%, medium-low = 26-50%, medium-high = 51-75%, high = 76-100%) of habitat use for the highway study area developed from a model of winter habitat selection for adult female moose in northwest Wyoming during winter 2005-2007 ...............202
188

LIST OF TABLES TABLE 1. Coefficients (β) and standard errors (SE) for a population-level
winter habitat selection model developed from global-positioning system (GPS)-collared adult female moose in northwest Wyoming, 2005-2007 ................................................................198
TABLE 2. Comparison of observed and expected moose highway
crossings by time of day in the Buffalo Fork Valley, Wyoming, winter 2005-2007........................................................................................200
TABLE 3. Comparison of observed and expected moose highway
crossings associated with the mean predicted probability of use for each 0.16-km (0.1-mi) mile marker along U.S. Highway 26/287 in the Buffalo Fork Valley, Wyoming, winter 2005-2007. The predicted probability of use was calculated by extracting RSPF class values from an 80-m buffer around each milemarker and averaging these values. Markers with mean RSPF classes from 1.00 to 1.50 were classified as high-use areas, markers with mean RSPF classes from 1.51 to 2.50 were classified as medium-high-use areas, markers with mean RSPF classes from 2.51 to 3.50 were classified as medium-low-use areas, and markers with classes from 3.51 to 4.00 were classified as low-use areas ..........................................................................203
TABLE 4. Comparison of observed and expected moose highway
crossings by fence type crossed in the Buffalo Fork Valley, Wyoming, winter 2005-2007. The number of fence crossings were calculated for the north and south side of U.S. Highway 26/287 separately and then combined to estimate significance ..................205
189
190
CHAPTER 1
PROBLEM DESCRIPTION Rising human populations create an increasing need to expand transportation corridors to accommodate the concurrent rise in traffic volume. This can lead to sharp increases in the number of wildlife-vehicle collisions (McDonald 1991, Oosenbrug et al. 1991, Groot Bruinderink and Hazebroek 1996, Farrell and Tappe 2007). In the United States, Conover et al. (1995) estimated that approximately 726,000 deer (Odocoileus spp.)-vehicle collisions occurred in 1991 resulting in an estimated 211 human fatalities. In 1991, deer-vehicle collisions cost an estimated $1,500 (U.S.) per accident and human injuries occurred in approximately 4% of collisions (Conover et al. 1995). Because not all accidents are reported, the actual number of deer-vehicle collisions may be much higher (Conover et al. 1995). When collisions occur with larger animals (i.e., moose [Alces alces]), the risk of human injury and increased property damage rises significantly (Joyce and Mahoney 2001). Methods to reduce wildlife-vehicle collisions have had mixed results. Mitigation to reduce the number of collisions or prevent animals from entering the roadway (i.e., roadside clearing, fencing, overpasses and underpasses) appear to be the most effective, but maintenance and repair costs often limit their implementation (Bashore et al. 1985, Feldhammer et al. 1986). Wildlife-vehicle collisions can rarely be associated with a single factor, but the spatial and temporal patterns of accidents are not random events and appear to be related to daily and seasonal activity patterns of animals (Bashore et al. 1985, Belant 1995, Waller and Servheen 2005). In addition, traffic volume, speed limits, driver awareness, and weather conditions have been implicated as influencing the risk of collisions (Lavsund and Sandegren 1991, Modafferi 1991, Joyce and Mahoney 2001, Seiler 2005). Numerous studies have used modeling approaches to identify habitat, landscape, and anthropogenic (i.e., man-made) features that predict high collision risk areas (Hubbard et al. 2000, Nielsen et al. 2003, Malo et al. 2004, Seiler 2005, Dussault et al. 2007). These models aid managers in determining where animal travel corridors occur and where appropriate mitigation can be applied so that collision risk is reduced and habitat linkages are maintained (Clevenger et al. 2002, Ng et al. 2004, Kindall and Van Manen 2007). Most studies of wildlife-vehicle collisions examined habitat and landscape characteristics once the frequency of accidents became socially unacceptable. Many roads in North America bisect important seasonal ranges of ungulates where few collisions have recently occurred, but the importance of identifying areas of potential increased collision risk can be valuable in addressing possible problem locations before they become chronic. By examining spatial and temporal patterns of animal movements associated with a roadway, proactive engineering can be implemented into existing roadway design or incorporated into the design phase of proposed highway reconstruction projects to reduce the chances that wildlife-vehicle collisions will reach a socially unacceptable level (Groot Bruinderink and Hazebroek 1996, Finder et al. 1999). The U.S. Highway 26/287 reconstruction project from Moran Junction to Dubois, Wyoming (Young and Sawyer
2006) is an example where mitigation can be incorporated into the design phase. A portion of this highway bisects a high-density moose winter range in the Buffalo Fork Valley (Houston 1968, Brimeyer and Thomas 2004) in northwest Wyoming. Core moose crossing areas have been identified by snow-track surveys in the Buffalo Fork section of the U.S. Highway 26/287 reconstruction project (Young and Sawyer 2006). However, the influence of habitat, landscape, and anthropogenic features in determining crossing locations has not been investigated. We used global positioning system (GPS) collars to collect fine scale movement data for adult (≥ 2 years) female moose that winter adjacent to U.S. Highway 26/287 in the Buffalo Fork Valley during winter 2005-2007. Using habitat and landscape variables that were deemed important predictors of winter habitat use, we developed a model to estimate habitat selection by adult female moose over the entire winter range (Chapter 2). We used this model at a smaller spatial scale to determine whether winter habitat selection patterns of moose could accurately identify crossing locations by moose along a 9.7-km (6.0-mi) section of U.S. Highway 26/287 that bisects winter range in the Buffalo Fork Valley. We also examined temporal patterns of moose crossing events and the influence of fence type in determining crossing locations.
191

CHAPTER 2
OBJECTIVES The purpose of this study was to provide the Wyoming Department of Transportation (WYDOT) and the Wyoming Game and Fish Department (WGFD) with information that could be used to assess the importance of habitat, landscape, and anthropogenic features that are essential determinants in evaluating moose crossing locations in northwest Wyoming. The results will assist WYDOT in identifying, evaluating, and implementing highway designs and mitigation that improve safety to moose and motorists by reducing the risk of moose-vehicle collisions while maintaining highway permeability for moose. With an improved understanding of the spatial and temporal characteristics of moose crossings, a more efficient approach to mitigation can be applied to future highway redevelopment projects. The primary objective of this study was to apply a model developed to estimate winter habitat selection by adult female moose to a 9.7-km (6.0-mi) stretch of U.S. Highway 26/287 in the Buffalo Fork Valley to determine if the model could be used to accurately identify crossing locations for a migratory moose population that winters adjacent to the highway. We also quantified the influence of fence types associated with moose crossing events and estimated the frequency and timing of crossings that occurred along U.S. Highway 26/287 and U.S. Highway 26/89/187 during the study period. To formally address the above objectives, we tested the following hypotheses: (1) moose crossing events are randomly distributed and occur in equal proportions throughout the day, (2) the location of moose crossings occur in equal proportion to the predicted probability of use (i.e., preferred habitat) within the highway study area, and (3) fence types are crossed in proportion to availability by moose.
192

This page is intentionally left blank.
193

CHAPTER 3
TASK DESCRIPTION Study Area
The study area was located about 50 km (30 mi) north of the town of Jackson, Wyoming and encompassed approximately 1,100 km2 (425 mi2; Chapter 2) of predominately public land in northwest Wyoming (Figure 1). It was defined by the winter distribution of GPS-collared adult female moose (Chapter 2) and included portions of Grand Teton National Park (GTNP) and Bridger-Teton National Forest (BTNF). Primary moose winter ranges occurred along the Buffalo Fork River, the Snake River, and Pacific Creek. Major roads within the study area included U.S. Highway 26/287, U.S. Highway 26/89/187, and U.S. Highway 89/287 (Figure 1). All were two-lane highways with speed limits ranging from 88 km/h (55 mi/h) in GTNP to 105 km/h (65 mi/h) outside of Park boundaries. From January 2005 to December 2007, mean daily traffic was estimated to be 952 vehicles/day along U.S. Highway 26/287 with a peak in traffic volume occurring during the tourist season from June through September (WYDOT 2006, 2007, 2008).
Figure 1. Study area in northwest Wyoming defined by the winter distribution of GPS-collared adult female moose (n = 22), 2005-2007.
194

Vegetation types occur along an elevational gradient (Whitlock 1993, Knight 1994) within the study area. Lower elevations and many south-facing slopes at higher elevations are dominated by big sagebrush (Artemisia tridentata). Mid-elevations are characterized by large stands of lodgepole pine (Pinus contorta) intermixed with Douglas fir (Psuedotsugia menziesii) and aspen (Populus tremuloides). Engelmann spruce (Picea engalmanni) and subalpine fir (Abies lasiocarpa) are found on north slopes and more mesic sites at lower elevations. Engelmann spruce, subalpine fir, and lodgepole pine intermixed with smaller stands of whitebark pine (Pinus albicaulis), limber pine (Pinus flexilis), and aspen dominate higher elevations. Alpine tundra occurs at the highest elevations while open forest parks and subalpine meadows dominated by grasses and forbs (i.e., flowering plants) occur at all elevations. Riparian areas are dominated by willows (Salix spp.) intermixed with narrowleaf cottonwood (Populus angustifolia) and occur in large, flooplain environments at lower elevations and along nearly all streams within the study area (Wigglesworth and Wachob 2004). The climate is characterized by short, cool summers and cold winters. From 1975-2004, annual precipitation averaged 56.2 cm (22.1 in; range = 37.9 cm [14.9 in] – 79.1 cm [31.1 in]; http://www.cdc.noaa.gov/cgi-bin/Timeseries/timeseries1.pl; accessed 16 October 2005), but most of the annual precipitation falls as snow between November and May. The Teton Mountains to the west and the northern highlands along the Yellowstone National Park (YNP) boundary typically receive the greatest amounts of precipitation (Houston 1968, Cole 1969, Boyce 1989). Moose Captures and Data Management Adult female moose were captured from a helicopter on winter range in the Buffalo Fork Valley of northwest Wyoming during February 2005 and 2006. Moose were darted and immobilized with 10-mg thiafentanil oxalate (A-3080, Wildlife Pharmaceuticals, Fort Collins, Colorado, USA; McJames et al. 1994, Arnemo et al. 2003, Kreeger et al. 2005). Once handling was completed, thiafentanil was antagonized with an intramuscular injection of 300-mg naltrexone (Trexonil, Wildlife Pharmaceuticals, Fort Collins, Colorado, USA). All captured moose were fitted with TGW-3700 GPS collars with store-on-board technology (Telonics, Mesa, Arizona, USA) that were programmed to attempt a location fix every hour from 15 November to 15 June and every 5 hours from 16 June to 14 November. Location data were collected until 1 March 2007 when the collars were programmed to release from the moose. Upon retrieval of GPS collars, location data were examined and all unsuccessful fixes and obvious location errors were removed (D’Eon et al. 2002, D’Eon and Serrouya 2005). Data were not corrected for fix-rate bias because of the high fix-rate success observed (Chapter 2; D’Eon 2003, Friar et al. 2004, Hebblewhite et al. 2007). Three-dimensional fixes accounted for a high proportion of winter locations (Chapter 2), therefore, data were not differentially corrected because 3-dimensional locations generally have < 20 m error (Di Orio et al. 2003). Captures were performed in accordance with approved University of Wyoming Animal Care and Use Committee protocols.
195

Frequency and Timing of Highway Crossing Events To estimate the number of highway crossing events during winter within the study area, we mapped winter locations of moose from 2005 to 2007 in ArcMap 9.2 (Environmental Systems Research Institute, Redlands, California, USA) and used the HOME RANGE TOOLS extension for ArcGIS (Rodgers et al. 2007) to create movement paths for each individual. We determined that a crossing occurred when the straight line between 2 consecutive locations crossed either U.S. Highway 26/287 or U.S. Highway 26/89/187. We did not investigate crossings that occurred along U.S. Highway 89/287 between Moran Junction and YNP because of limited traffic volume due to seasonal road closures within GTNP. Because winter locations were collected every hour, the timing of crossing events were estimated to have occurred within the time period between 2 consecutive locations. The timing of moose crossings were grouped into 4 distinct time periods to reflect when moose-vehicle collisions were most likely to occur. These time periods were 0300 – 0859 hrs (early to mid-morning), 0900 – 1459 hrs (mid-day), 1500 – 2059 hrs (afternoon to early evening), and 2100 – 0259 hrs (night). A chi-square test (P ≤ 0.05) was used to determine if crossing events occurred at random during each time period throughout the day. Predicting Moose Crossing Locations in the Buffalo Fork Valley To create the highway study area, we used a hand-held GPS unit to mark the location of mileposts 3 through 9 and plotted these in ArcGIS. We digitized a 9.7-km (6.0-mi) stretch of U.S. Highway 26/287 from a U.S. Geological Survey 1:24,000 scale digital orthophoto quarter quadrangle map and divided each 1.6-km (1.0-mi) section into 10 equal segments that represented secondary mile markers to the nearest 0.16-km (0.1-mi). The highway study area was defined as that area within a 1.5-km (0.9-mi) buffer around the highway, which represented the average daily distance moved by radio-collared adult female moose during winter (Chapter 2). The final population-level model developed to estimate adult female moose winter habitat selection included coefficients for the proportion of riparian/deciduous shrub, mixed/other conifer, and aspen habitats, elevation, habitat diversity, slope, and distance to coniferous cover (Chapter 2). To measure these variables, we created circular sample units with 25-m (82-ft) radii that were systematically distributed across the highway study area. We extracted vegetation data from each sample unit with HAWTHs ANALYSIS TOOLS (Beyer 2004) and calculated the proportion of each vegetation type that occurred within each unit. We used SPATIAL ANALYST to estimate slope from a 26 x 26-m digital elevation model (U.S. Geological Survey 1999) and to create a distance to cover layer from the existing vegetation map. Cover was defined strictly as coniferous habitats that could potentially provide thermal cover during winter. Estimates for elevation, slope, and distance to cover were extracted from the midpoint of each sample unit. We used 250-m (820-ft) radii circular units centered on the midpoint of each
196

sample unit to calculate a Shannon-Weiner habitat diversity index based on the proportion of spruce/fir, lodgepole pine, mixed/other conifer, aspen, riparian/deciduous shrub, and other habitat types that occurred within each circular sample unit. We used the R statistical software package (R Core Development Team 2006) to estimate resource selection probability functions (RSPF; Manly et al. 2002) for each sample unit using population-level coefficients developed to assess winter habitat selection by adult female moose (Table 1; Chapter 2). The RSPF predictions were mapped across 50 x 50-m pixels for the highway study area. The RSPFs were assigned to 1 of 4 categories based on the quartiles of the distribution of predictions (Sawyer et al. 2006, Sawyer et al. 2007). Pixels were assigned values from 1 to 4 representing the highest to lowest estimated use probabilities in 25% increments (i.e., highest use probability = 1 [highest 25%], lowest use probability = 4 [lowest 25%]). To determine the validity of the predictive map in delineating moose crossing locations in the highway study area, we used an independent sample of 201 crossing events collected during winter 2003-2004 and 2004-2005 that were recorded to the nearest 0.16-km (0.1-mi) marker (Young and Sawyer 2006). Since it was unknown exactly where the moose crossed the highway relative to the nearest mile marker, we created 80-m buffers around each 0.16-km (0.1-mi) marker and estimated an average RSPF class from all the predicted probability-of-use classes within each buffer. The 80-m buffer represented the mean probability-of-use for each mile marker given that a moose could have crossed anywhere within that buffer and still be classified as having crossed at the mile marker. Markers with mean RSPF classes from 1.00 to 1.50 were assigned to class 1 and were classified as high-use areas, markers with mean RSPF classes from 1.51 to 2.50 were assigned to class 2 and were classified as medium-high-use areas, markers with mean RSPF classes from 2.51 to 3.50 were assigned to class 3 and were classified as medium-low-use areas, and markers with classes from 3.51 to 4.00 were assigned to class 4 and were classified as low-use areas. We joined the RSPF class and the number of crossing events associated with each secondary mile marker from the independent sample and calculated the proportion of crossing events that occurred within each RSPF class. We estimated a chi-square statistic (P ≤ 0.05) for each RSPF class to determine if moose selected highway crossings associated with preferred habitat. Fence Types and Moose Crossings To determine if fence type influenced moose movement across U.S. Highway 26/287 in the Buffalo Fork Valley, we created a GIS layer that depicted three different fence types that occurred within the highway study area: (1) bighorn fence, (2) four-strand, barbed wire fence, and (3) buck-and-rail fence. The bighorn fence was a two-pole, two-wire fence that stands approximately 1.1 m (43 in) in height (Figure 2). Sections of four-strand, barbed-wire fence were primarily located along stretches with permanent standing water. A small section of buck-and-rail fencing was located west of the GTNP boundary (Figure 3). No fencing occurred within GTNP, from the bridge over Blackrock Creek (milepost 8.45) to milepost 9 on the north side of the highway, and from mileposts 8 to 9 on the south side of the highway.
197
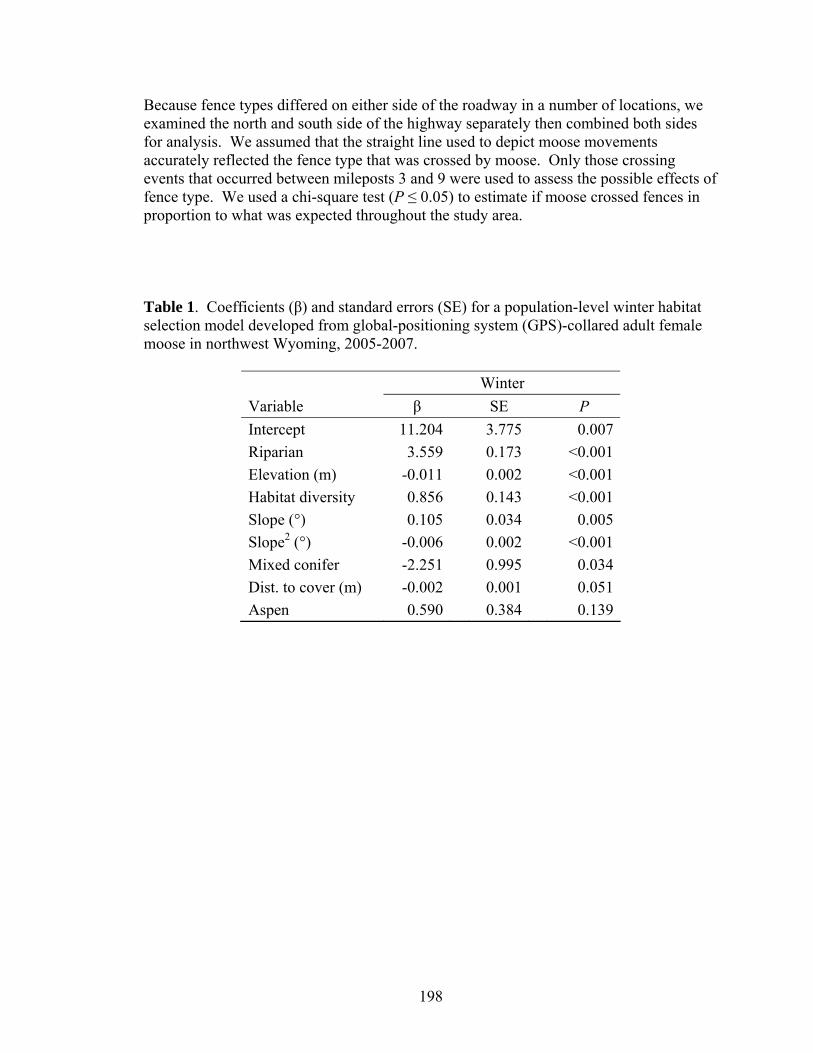
198
Because fence types differed on either side of the roadway in a number of locations, we examined the north and south side of the highway separately then combined both sides for analysis. We assumed that the straight line used to depict moose movements accurately reflected the fence type that was crossed by moose. Only those crossing events that occurred between mileposts 3 and 9 were used to assess the possible effects of fence type. We used a chi-square test (P ≤ 0.05) to estimate if moose crossed fences in proportion to what was expected throughout the study area. Table 1. Coefficients (β) and standard errors (SE) for a population-level winter habitat selection model developed from global-positioning system (GPS)-collared adult female moose in northwest Wyoming, 2005-2007.
Winter
Variable β SE P
Intercept 11.204 3.775 0.007
Riparian 3.559 0.173 <0.001
Elevation (m) -0.011 0.002 <0.001
Habitat diversity 0.856 0.143 <0.001
Slope (°) 0.105 0.034 0.005
Slope2 (°) -0.006 0.002 <0.001
Mixed conifer -2.251 0.995 0.034
Dist. to cover (m) -0.002 0.001 0.051
Aspen 0.590 0.384 0.139

Figure 2. Bighorn fence (view facing west). This was the primary type of fence found east of the Grand Teton National Park boundary within the highway study area.
Figure 3. Radio-collared adult female moose crossing buck-and-rail fencing. This type of fence was found west of the Buffalo Fork bridge and the Grand Teton National Park boundary in the highway study area.
199

CHAPTER 4
RESULTS Frequency and Timing of Highway Crossing Events Twenty-two adult female moose were monitored to estimate the frequency and timing of crossing events within the winter study area. A total of 257 crossing events were recorded with 19 moose crossing U.S. Highway 26/287 or U.S. Highway 26/89/187 at some point during the study period. Only 8 moose crossed the highway ≥ 10 times and these moose accounted for 84% of all crossing events (n = 217). Adult female moose crossed the highway more than expected during afternoon to early evening (χ2 = 10.32, df = 1, P = 0.001), less than expected during mid-day (χ2 = 18.26, df = 1, P < 0.001), and as expected during the night (χ2 = 0.52, df = 1, P = 0.473) and early to mid-morning (χ2 = 0.12, df = 1, P = 0.732; Table 2). Table 2. Comparison of observed and expected moose highway crossings by time of day in the Buffalo Fork Valley, Wyoming, winter 2005-2007.
Time
Observed number of highway crossings
Expected number of highway crossings χ2 P
Observed/ expecteda
Afternoon to early evening
90 64.25 10.32
0.001
>
Night 70 64.25 0.52
0.473
=
Early to mid-morning
67 64.25 0.12
0.732
=
Mid-day 30 64.25 18.26
<0.001
<
a “>”: use greater than expected; “=”: use equal to expected; “<”: use less than expected.
200

Predicting Moose Crossing Locations in the Buffalo Fork Valley The highway study area covered approximately 34 km2 (13 mi2; Figure 4) within the Buffalo Fork Valley moose winter range. Private land encompassed approximately 11 km2 (4 mi2) with the remaining area managed by GTNP and BTNF. The predictive map indicated that areas classified as high or medium-high probabilities of use occurred between mileposts 3.2 and 4.5, 6.1 and 6.7, and 7.0 and 9.0 (Figure 5). These areas were characterized by a high proportion of aspen and riparian/deciduous shrub habitat with little coniferous cover, low elevation, relatively flat slope, and moderate distance to cover. Private land used for cattle and horse grazing occurred between mile markers 4.5 and 6.1, while private land held in conservation easements occurred between mile markers 6.1 and 6.9. The predictive map indicated that moose were less likely to cross private land that was used for grazing, but were more likely to cross on private land that was held in a conservation easement (Figure 5). Mileposts that occurred on either side of the Buffalo Fork bridge and the Blackrock Creek bridge were each classified as high-use areas. This indicates a high likelihood that moose may have utilized bridges to cross U.S. Highway 26/287 because preferred habitat occurred on either side.
Figure 4. Highway study area in the Buffalo Fork Valley, Wyoming, used to measure habitat and landscape variables when creating a predictive map of winter habitat selection along a 9.7-km (6.0-mi) stretch U.S. Highway 26/287 during winter 2005-2007.
201

Figure 5. Relative predicted probabilities and associated categories (low = 0-25%, medium-low = 26-50%, medium-high = 51-75%, high = 76-100%) of habitat use for the highway study area developed from a model of winter habitat selection for adult female moose in northwest Wyoming during winter 2005-2007. Of the 201 moose crossings recorded from the independent sample, the highest proportion of crossing events occurred in areas classified as high or medium-high predicted probabilities of use (81%, n = 162), while fewer crossings occurred in areas classified as medium-low or low predicted probabilities of use (19%, n = 39; Table 3). Moose crossed the highway in areas categorized as high-use areas more than expected (χ2 = 6.92, df = 1, P = 0.009), as low-use areas less than expected (χ2 = 5.40, df = 1, P = 0.020), and in proportion to what was expected in medium-high-use (χ2 = 0.36, df = 1, P = 0.550) and medium-low-use (χ2 = 3.64, df = 1, P = 0.056) areas (Table 3). Although areas classified as medium-low were used approximately as expected, the actual number of crossings (n = 22) were lower than the number of expected crossings (n = 33).
202

Table 3. Comparison of observed and expected moose highway crossings associated with the mean predicted probability of use for m (0.1-mi) mile marker along U.S. Highway 26/287 in the Buffalo Fork Valley, Wyoming, winter 2005-2007. The
ted by extracting RSPF class values from an 80-m buffer around each milemarker and rkers with mean RSPF classes from 1.00 to 1.50 were classified as high-use areas, markers with mean
m 1.51 to 2.50 were classified as medium-high-use areas, markers with mean RSPF classes from 2.51 to 3.50 were edium-low-use areas, and markers with classes from 3.51 to 4.00 were classified as low-use areas.
each 0.16-kpredicted probability of use was calculaaveraging these values. MaRSPF classes froclassified as m
Predicted probability of use
Proportion of mile markers
Number highway
crossingsa
Proportion of highway crossings χ2 P
Observed/ expectedb
High 0.23 64 0.32 6.921 0.009 >
Medium-high 0.46 98 0.49 0.357 0.550 =
Medium-low 0.16 22 0.11 3.639 0.056 =
Low 0.15 17 0.08 5.401 0.020 <
Total 1.00 201 1.00
P
a
P
b
203
Data from an independent sample collected during winter 2003-2005 (Young and Sawyer 2006). “>”: use greater than expected; “=”: use equal to expected; “<”: use less than expected.
204
Fence Types and Moose Crossings Akmkmwithin GTNP and east oless than 0.16 kmBighorn fence was the prima AU.S. Highway 26/287 at somfences fe((w
long the 9.7-km (6.0-mi) stretch of U.S. Highway 26/287, there was approximately 6.4 (4.0 mi) of fencing on the north and the south side of the highway for a total of 12.9 (8.0 mi). About 6.6 km (4.1 mi) of highway was fence free with most occurring
f Blackrock Creek. One section of barbed-wire fence that was (0.1 mi) in length was assumed to be bighorn fence in this analysis.
ary fence type within the study area while buck-and-rail fence nd barbed-wire fence each occurred along equal proportions of highway (Table 4).
total of 311 fence crossings were recorded with 19 of 22 moose crossing fences along e point during the study period. Only 9 moose crossed
≥ 10 times and these accounted for 87% of all crossing events (n = 269). Adult male moose crossed sections of highway that contained no fencing more than expected χ2 = 41.55, df = 1, P < 0.001) and crossed less than expected along sections with bighorn χ2 = 11.47, df = 1, P < 0.001), buck-and-rail (χ2 = 5.87, df = 1, P = 0.004), and barbed-ire (χ2 = 8.33, df = 1, P = 0.015) fence types (Table 4).

Table 4Wyomsepara
Fence type
Proportion fence
type Number of
fence crossings Proportion fence
crossings χ2 P Observed/ expecteda
No fencing 0.34 171 0.55 41.548 <0.001 >
Bighorn 0.56 129 0.41 11.477 <0.001 <
Buck and rail 0.05 6 0.02 5.865 0.015 <
Barbed wire 0.05 5 0.02 8.330 0.004 <
Total 1.00 311 1.00
. Comparison of observed and expected moose highway crossings by fence type crossed in the Buffalo Fork Valley, ing, winter 2005-2007. The number of fence crossings were calculated for the north and south side of U.S. Highway 26/287 tely and then combined to estimate significance.
P
a
205 “>”: use greater than expected; “<”: use less than expected.

206
Discussion ThabitaHighway 26/287 in the Buffalo Fork Valley. distributed along the highway. Aggregations that could be predicted by examnumand Montana (Wwildlife-vehicle collisions typically occuroadway (Bashore et al. 1985, Joyce and MaThe spatial aggregation oand mMitighighway perl Moccurred on either side of the highway. selected for low-elevation haprovided by aspen and willow-domhave noted the imcrossing locations and collis(et al. 1975, Feldhammbear (et al. (2007) indicated that roads in Quebec, Canada, yet mcover rather than food resources. However,somthat, when the availability of forage decrincreases due to increased snow depths, mconiferous forests (Matchett 1985, HStephenson et al. 2006). In norfood which in turn influenced the peak in(Lavsund and Sandegren 1991). In Norway concerning moose-train collisions (ModaffeBuffalo Fork Valley, snshift in use to closed canprovided abundant winter forage t
CHAPTER 5
DISCUSSION AND RECOMMENDATIONS
his study demonstrated that models developed to assess adult female moose winter t selection can be used to identify areas where moose are most likely to cross U.S.
Moose crossing events were not randomly of moose crossings occurred at locations
ining winter habitat selection parameters. Similarly, the ber of grizzly bear (Ursus arctos) highway crossings in Alaska (Graves et al. 2006)
aller and Servheen 2005) were clustered at specific locations while most r along a relatively small proportion of the
honey 2001, Malo et al. 2004, Seiler 2005). f crossings may increase the risk of collisions between motorists
oose in areas identified as high or medium-high predicted probabilities of use. ation that may potentially increase highway safety for motorists, as well as maintain
meability for moose, can be applied to sections of highway where crossing ocations are most likely to occur.
oose crossings were aggregated in areas where preferred habitat and landscape features In northwest Wyoming, adult female moose
bitats during winter that contain an abundance of forage inated, riparian habitats (Chapter 2). Other studies
portance of preferred habitat and landscape features in predicting ion risk for moose (Gundersen et al. 1998, Seiler 2005), elk
Cervus elaphus; Dodd et al. 2007), white-tailed deer (Odocoileus virginianus; Carbaugh er et al. 1986, Finder et al. 1999, Hubbard et al. 2000), and black
Ursus americanus; Clevenger et al. 2002, Kindall and Van Manen 2007). Dussault the proportion of forage was greatest where moose crossed
oose selected crossing locations that provided abundant snow accumulations during their study were
e of the highest in the world (Dussault et al. 2007) and it has been well documented eases and the energetic cost of locomotion
oose generally seek cover provided by mature undertmark et al. 1990, MacCracken et al. 1997,
thern Sweden, snow depth influenced the availability of moose-vehicle collisions during winter
and Alaska, a similar trend was observed ri 1991, Andreassen et al. 2005). In the
ow accumulations may not have been severe enough to cause a opy coniferous forests. Additionally, the Buffalo Fork Valley
and moose may have utilized tracks of other individuals o reduce the cost of locomotion in deep snow (Ball et al. 2001), thus crossing locations

may be consistent among years even with varied degrees of winter severity. Nonetheless, in years of deep snow, increased monitoring of moose crossing locations may be warranted to determine if there is a shift in preferred habitat and, consequently, highway crossing locations. Although moose crossings typically occurred in low elevation areas that contained a high proportion of aspen and riparian habitats, moose selected for areas with high habitat diversity. This suggests that moose require a mix of riparian, aspen, and coniferous habitats to meet forage and cover requirements and that the distribution of all habitat types across the landscape likely influenced the probability that a crossing event occurred in a specific location. Private lands used for grazing adjacent to the highway were composed primarily of herbaceous cover and contained little habitat diversity or preferred forage, thus very few moose crossings occurred in these areas. In contrast, private lands held in conservation easements were composed of a mix of riparian and coniferous habitats and, not surprisingly, moose use and crossing events associated with these areas were relatively high. Areas of high habitat diversity have also been implicated with the increased risk of vehicle collisions for white-tailed deer in Illinois (Finder et al. 1999), Iowa (Hubbard et al. 2000), and Minnesota (Nielsen et al. 2003) and roe deer (Capriolus capriolus), wild boar (Sus scrofa), and red deer (Cervus elaphus) in Spain (Malo et al. 2004). However, in areas where preferred habitat is common and habitat diversity is relatively low, highway crossings, and thus wildlife-vehicle collisions, were more randomly distributed (Allen and McCullough 1976, Bashore et al. 1985, Feldhammer et al. 1986). Bridges over the Buffalo Fork River and Blackrock Creek were both identified as having a high probability of use suggesting that moose may utilize these structures to cross beneath the highway. Young and Sawyer (2006) documented and photographed several moose crossing the highway underneath these structures. Bridges may facilitate wildlife crossings which could ultimately reduce the risk of wildlife-vehicle collisions along short sections of highway near these structures (Seiler 2004, Seiler 2005). However, Hubbard et al. (2000) indicated that bridges acted as “major edge-creating landscape features” that increased the risk of collisions with white-tailed deer in Iowa. Furthermore, low to intermittent traffic volume caused a reduction in passage rates for elk using wildlife underpasses in Arizona that was possibly caused by the sudden auditory and visual stimuli created by a vehicle crossing over the underpass during an otherwise quiet period (Gagnon et al. 2007a). Even though moose relocations were obtained every hour during the winter period, this location frequency was insufficient to confirm whether or not a moose actually used bridges to cross the highway. All that could be determined is that habitat and landscape features on either side of the bridges were classified as high use areas and the probability that a moose used these habitats, and thus the bridges, was also high. Moose crossed the highway more frequently in areas that were not fenced when compared to areas that contained any of the three other fence types. Although fences within the Buffalo Fork Valley were not designed to prevent moose from crossing the highway, these results concur with those of Seiler (2005) who described the risk of
207

moose-vehicle collisions being greatest along sections of road that did not contain moose-proof fencing. Furthermore, in South Africa, the ratio of total accidents to animal-related accidents was significantly less along sections of highway that had a higher proportion of fencing (Eloff and Van Niekerk 2005). In contrast, fencing along an interstate highway in Pennsylvania reduced the number of deer observed in the right-of-way, but it did little to reduce the number of deer-vehicle collisions (Feldhammer et al. 1986). We suggest that preferred habitat and landscape features had much more influence in determining moose crossing locations given that the fence-types present in the Buffalo Fork Valley were not high enough to prevent moose crossings. The predictive map indicated that the unfenced section of highway, located within GTNP, contained a high proportion of preferred habitat on either side of the roadway. Likewise, from mile marker 7 to approximately 8.5 (i.e., Blackrock Creek), preferred habitat can be found on both sides of the highway even though the majority of this area primarily contains bighorn fence. Approximately 8.1 km (5.0 mi) of fence, nearly two-thirds of the total length of fencing along the highway, was along private land that was not preferred moose winter habitat. Thus, the likelihood that a moose would cross a fence in these areas was significantly reduced due to habitat features rather than fence presence. Lack of fence structures in areas of quality moose habitat may have inhibited our assessment of the influence of fence type on moose movements associated with U.S. Highway 26/287. Approximately 88% of all moose crossing events in the Buffalo Fork Valley occurred from afternoon to mid-morning (i.e., 1500 – 0859 hours), which coincided with peaks in daily moose activity patterns (Renecker 1986). Light conditions during these time periods are relatively poor or non-existent which can increase the risk of moose-vehicle collisions. In Newfoundland, approximately 75% of all moose-vehicle collisions were observed between sunset and sunrise while severe injuries or death to motorists were twice as likely to occur after dark (Joyce and Mahoney 2001). Similarly, other studies have demonstrated that highway crossings and the potential of collisions increased significantly from dusk to dawn for ungulates (Carbaugh et al. 1975, Belant 1995, Groot Bruinderink and Hazebroek 1996) and grizzly bears (Waller and Servheen 2005, Graves et al. 2006). In contrast, caribou (Rangifer tarandus) were observed to cross roads more frequently during the day (Dyer et al. 2002), which may minimize collision-risk due to increased motorist visibility. Concurrent with increased highway crossings during evening and early morning hours is a reduction in traffic volume during these time periods. Grizzly bears have been observed to cross more frequently at night when traffic volume was low (Waller and Servheen 2005, Graves et al. 2006). Elk shifted use away from highways during the day when traffic volume was high and returned to areas near the highway at night when traffic volumes decreased (Gagnon et al. 2007b). Furthermore, research along the Trans-Canada Highway in Banff National Park, Canada, has shown reduced permeability of the highway for all wildlife due to very high traffic volume (Alexander and Waters 2000, Alexander et al. 2005). Increased traffic volume has also been implicated in preventing bighorn sheep (Ovis canadensis) from reaching important mineral sites in Rocky Mountain National Park, Colorado (Keller and Bender 2007) and with an increased risk of deer-vehicle collisions in Arkansas (Farrell and Tappe 2007). Although traffic volume
208
was not analyzed within the context of moose crossing probabilities in our study, when compared to other studies, the relatively low number of vehicles on U.S. Highway 26/287 during winter does not appear to impede moose movements across the road at the present time. However, the risk of moose-vehicle collisions is likely increased at night due to reduced motorist visibility and a concurrent increase in moose crossing events. Recommendations Application of the winter habitat selection model developed for moose in northwest Wyoming should be used with caution if applied to other sections of highway in the state. The model worked well to identify areas along U.S. Highway 26/287 that have a high risk of moose-vehicle collisions, but the model may not work well if habitats available to moose differ from those found in the Buffalo Fork Valley. If the model is to be used in other areas, it should be tested using an independent sample of crossing locations for validation prior to making assumptions concerning potential mitigation. Snow-track surveys, similar to those conducted by Western Ecosystems Technology, Inc. (Young and Sawyer 2006), would work well in determining the efficacy of the model for other locations. If this is done and model performance is not satisfactory, the results of the snow-track survey may be used because areas identified as core moose crossing locations in the Buffalo Fork Valley by Young and Sawyer (2006) were basically the same as those identified in the present study. However, if a more complete understanding of habitat, landscape, and anthropogenic features used by moose to select highway crossings is needed, a new study utilizing GPS technology may be warranted if the risk of moose-vehicle collisions is high. Although numerous moose crossing events were observed in the Buffalo Fork Valley, only one moose-vehicle collision was recorded during the study. This occurred near milepost 7.4 which was classified as a high probability of use area. The collision occurred on 12 June 2005 and involved an uncollared, adult female moose that died as a result of the accident. While some accidents may go unreported, moose-vehicle collisions are relatively rare events in the Buffalo Fork Valley with only 5 collisions reported from 1995 to 2004 (Young and Sawyer 2006). All radio-collared moose that wintered in the Buffalo Valley were migratory and most summered at higher elevations to the north (Chapter 2). Thus, the greatest risk of collisions occurred during winter when traffic volume was much lower than during summer. Within the Buffalo Fork Valley, speed limits could be reduced and seasonal use of large, temporary warning signs with flashing lights could be erected in areas classified as high or medium-high predicted probabilities of use during winter to warn motorists of the increased risk of encountering moose on the highway (Groot Bruinderink and Hazebroek 1996, Gordon et al. 2004, Sullivan et al. 2004). Speed limits have been identified as an important determinant in the number and severity of moose-vehicle collisions, especially during night when motorist visibility is reduced (Joyce and Mahoney 2001, Seiler 2004, Seiler 2005), but they have also been difficult to enforce (Lavsund and Sandegren 1991, Joyce and Mahoney 2001). Since local residents primarily drive the road during winter, a
209
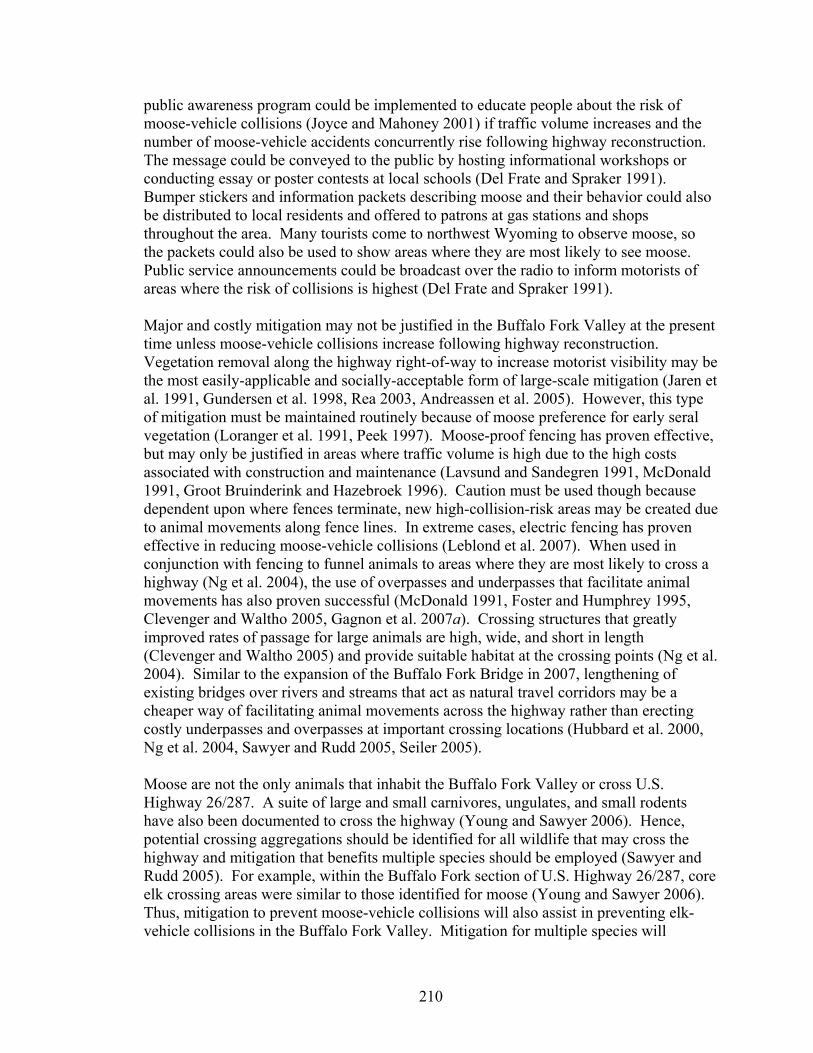
public awareness program could be implemented to educate people about the risk of moose-vehicle collisions (Joyce and Mahoney 2001) if traffic volume increases and the number of moose-vehicle accidents concurrently rise following highway reconstruction. The message could be conveyed to the public by hosting informational workshops or conducting essay or poster contests at local schools (Del Frate and Spraker 1991). Bumper stickers and information packets describing moose and their behavior could also be distributed to local residents and offered to patrons at gas stations and shops throughout the area. Many tourists come to northwest Wyoming to observe moose, so the packets could also be used to show areas where they are most likely to see moose. Public service announcements could be broadcast over the radio to inform motorists of areas where the risk of collisions is highest (Del Frate and Spraker 1991). Major and costly mitigation may not be justified in the Buffalo Fork Valley at the present time unless moose-vehicle collisions increase following highway reconstruction. Vegetation removal along the highway right-of-way to increase motorist visibility may be the most easily-applicable and socially-acceptable form of large-scale mitigation (Jaren et al. 1991, Gundersen et al. 1998, Rea 2003, Andreassen et al. 2005). However, this type of mitigation must be maintained routinely because of moose preference for early seral vegetation (Loranger et al. 1991, Peek 1997). Moose-proof fencing has proven effective, but may only be justified in areas where traffic volume is high due to the high costs associated with construction and maintenance (Lavsund and Sandegren 1991, McDonald 1991, Groot Bruinderink and Hazebroek 1996). Caution must be used though because dependent upon where fences terminate, new high-collision-risk areas may be created due to animal movements along fence lines. In extreme cases, electric fencing has proven effective in reducing moose-vehicle collisions (Leblond et al. 2007). When used in conjunction with fencing to funnel animals to areas where they are most likely to cross a highway (Ng et al. 2004), the use of overpasses and underpasses that facilitate animal movements has also proven successful (McDonald 1991, Foster and Humphrey 1995, Clevenger and Waltho 2005, Gagnon et al. 2007a). Crossing structures that greatly improved rates of passage for large animals are high, wide, and short in length (Clevenger and Waltho 2005) and provide suitable habitat at the crossing points (Ng et al. 2004). Similar to the expansion of the Buffalo Fork Bridge in 2007, lengthening of existing bridges over rivers and streams that act as natural travel corridors may be a cheaper way of facilitating animal movements across the highway rather than erecting costly underpasses and overpasses at important crossing locations (Hubbard et al. 2000, Ng et al. 2004, Sawyer and Rudd 2005, Seiler 2005). Moose are not the only animals that inhabit the Buffalo Fork Valley or cross U.S. Highway 26/287. A suite of large and small carnivores, ungulates, and small rodents have also been documented to cross the highway (Young and Sawyer 2006). Hence, potential crossing aggregations should be identified for all wildlife that may cross the highway and mitigation that benefits multiple species should be employed (Sawyer and Rudd 2005). For example, within the Buffalo Fork section of U.S. Highway 26/287, core elk crossing areas were similar to those identified for moose (Young and Sawyer 2006). Thus, mitigation to prevent moose-vehicle collisions will also assist in preventing elk-vehicle collisions in the Buffalo Fork Valley. Mitigation for multiple species will
210

certainly increase the difficulty in planning appropriate, and potentially expensive, mitigation, but it will ultimately benefit motorists by increasing highway safety and wildlife by maintaining habitat linkages (Ng et al. 2004). Numerous studies have demonstrated the effects of transportation corridors on wildlife, but some animals appear to have a higher tolerance of traffic than others. Alexander et al. (2005) noted that highway permeability was much lower for large carnivores than ungulates along the Trans-Canada Highway in Banff National Park, Canada. They indicated that 300-500 vehicles/day decreased highway permeability for large carnivores whereas ungulates demonstrated a higher tolerance to increased traffic volume. They also suggested that mitigation should be implemented at the threshold for carnivores to maintain habitat linkages and reduce habitat fragmentation for all wildlife (Alexander et al. 2005). Carnivores may be impacted by current traffic volume along U.S. Highway 26/287 during all seasons while ungulates may be affected during the summer months. Coordination with state and federal land and wildlife management agencies should continue after highway reconstruction so the impacts of the traffic corridor on wildlife can be determined and appropriate mitigation can be implemented to maintain motorist safety and highway permeability for wildlife.
211

REFERENCES
Alexander, S. M., and N. M. Waters. 2000. The effects of highway transportation corridors on wildlife: a case study in Banff National Park. Transportation Research Part C 8: 307-320.
Alexander, S. M., N. M. Waters, and P. C. Paquet. 2005. Traffic volume and highway
permeability for a mammalian community in the Canadian Rocky Mountains. The Canadian Geographer 49: 321-331.
Allen, R., and A. McCullough. 1976. Deer-car accidents in southern Michigan. Journal
of Wildlife Management 40: 317-325. Andreassen, H. P., H. Gundersen, and T. Storaas. 2005. The effect of scent-marking,
forest clearing, and supplemental feeding on moose-train collisions. Journal of Wildlife Management 69: 1125-1132.
Arnemo, J. M., T. J. Kreeger, and T. Soveri. 2003. Chemical immobilization of free-
ranging moose. Alces 39: 243-253. Ball, J. P., C. Nordengren, and K. Wallin. 2001. Partial migration by large ungulates:
characteristics of seasonal moose Alces alces ranges in northern Sweden. Wildlife Biology 7: 39-47.
Bashore, T. L., W. M. Tzilkowski, and E. D. Bellis. 1985. Analysis of deer-vehicle
collision sites in Pennsylvania. Journal of Wildlife Management 49: 769-774. Belant, J. L. 1995. Moose collisions with vehicles and trains in northeastern Minnesota.
Alces 31: 45-52. Beyer, H. L. 2004. Hawth’s Analysis Tools for ArcGIS version 3.26.
<http://www.spatial ecology.com/htools>. Accessed 1 August 2006. Boyce, M. S. 1989. The Jackson elk herd: intensive wildlife management in North
America. Cambridge University Press, Cambridge, England. Brimeyer, D. G., and T. P. Thomas. 2004. History of moose management in Wyoming
and recent trends in Jackson Hole. Alces 40: 133-143. Carbaugh, B., J. P. Vaughan, E. D. Bellis, and H. B. Graves. 1975. Distribution and
activity of white-tailed deer along an interstate highway. Journal of Wildlife Management 39: 570-581.
212

Clevenger, A. P., J. Wierzchowski, B. Chruszcz, and K. Gunson. 2002. GIS-generated, expert-based models for identifying wildlife habitat linkages and planning mitigation passages. Conservation Biology 16: 503-514.
Clevenger, A. P., and N. Waltho. 2005. Performance indices to identify attributes of
highway crossing structures facilitating movement of large animals. Biological Conservation 121: 453-464.
Cole, G. F. 1969. The elk of Grand Teton and south Yellowstone National Parks.
National Park Service Research Report GRTE-N-1. Washington, D.C., USA. Conover, M. R., W. C. Pitt, K. K. Kessler, T. J. Dubow, and W. A. Sanborn. 1995.
Review of human injuries, illness, and economic losses caused by wildlife in the United States. Wildlife Society Bulletin 23: 407-414.
Del Frate, G. G., and T. H. Spraker. 1991. Moose vehicle interactions and an associated
public awareness program on the Kenai Peninsula, Alaska. Alces 27: 1-7. D’Eon, R. G., R. Serrouya, G. Smith, and C. O. Kochany. 2002. GPS radiotelemetry
error and bias in mountainous terrain. Wildlife Society Bulletin 30: 430-439. D’Eon, R. G. 2003. Effects of a stationary GPS fix-rate bias on habitat-selection
analyses. Journal of Wildlife Management 67: 858-863. D’Eon, R. G., and R. Serrouya. 2005. Mule deer seasonal movements and multiscale
resource selection using global positioning system radiotelemetry. Journal of Mammalogy 86: 736-744.
Di Orio, A. P., R. Callas, and R. J. Schaefer. 2003. Performance of two GPS telemetry
collars under different habitat conditions. Wildlife Society Bulletin 31: 372-379. Dodd, N. L., J. W. Gagnon, S. Boe, and R. E. Schweinsburg. 2007. Assessment of elk
highway permeability by using global positioning system technology. Journal of Wildlife Management 71: 1107-1117.
Dussault, C., J. P. Ouellet, C. Laurian, R. Courtois, M. Poulin, and L. Breton. 2007.
Moose movement rates along highways and crossing probability models. Journal of Wildlife Management 71: 2338-2345.
Dyer, S. J., J. P. O’Neill, S. M. Wasel, and S. Boutin. 2002. Quantifying barrier effects
of roads and seismic lines on movements of female woodland caribou in northeastern Alberta. Canadian Journal of Zoology 80: 839-845.
Eloff, P. J., and A. Van Niekerk. 2005. Game, fences and motor vehicle accidents:
spatial patterns in the Eastern Cape. South African Journal of Wildlife Research 35: 125-130.
213

Farrell, M. C., and P. A. Tappe. 2007. County-level factors contributing to deer-vehicle
collisions in Arkansas. Journal of Wildlife Management 71: 2727-2731. Feldhammer, G. A., J. E. Gates, D. M. Harman, A. J. Loranger, and K. R. Dixon. 1986.
Effects of interstate highway fencing on white-tailed deer activity. Journal of Wildlife Management 50: 497-503.
Finder, R. A., J. L. Roseberry, and A. Woolf. 1999. Site and landscape conditions at
white-tailed deer/vehicle collisions in Illinois. Landscape and Urban Planning 44: 77-85.
Foster, M. L., and S. R. Humphrey. 1995. Use of highway underpasses by Florida
panthers and other wildlife. Wildlife Society Bulletin 23: 95-100. Friar, J. L., S. E. Nielsen, E. H. Merrill, S. R. Lele, M. S. Boyce, R. H. M. Munro, G. B.
Stenhouse, and H. L. Beyer. 2004. Removing GPS collar bias in habitat selection studies. Journal of Applied Ecology 41: 201-212.
Gagnon, J. W., T. C. Theimer, N. L. Dodd, A. L. Manzo, and R. E. Schweinsburg.
2007a. Effects of traffic on elk use of wildlife underpasses in Arizona. Journal of Wildlife Management 71: 2324-2328.
Gagnon, J. W., T. C. Theimer, N. L. Dodd, S. Boe, and R. E. Schweinsburg. 2007b.
Traffic volume alters elk distribution and highway crossings in Arizona. Journal of Wildlife Management 71: 2318-2323.
Gordon, K. M., M. C. McKinstry, and S. H. Anderson. 2004. Motorist response to a
deer-sensing warning system. Wildlife Society Bulletin 32: 565-573. Graves, T. A., S. Farley, and C. Servheen. 2006. Frequency and distribution of highway
crossings by Kenai Peninsula brown bears. Wildlife Society Bulletin 34: 800-808.
Groot Bruinderink, G. W. T. A., and E. Hazebroek. 1996. Ungulate traffic collisions in
Europe. Conservation Biology 10: 1059-1067. Gundersen, H., H. P. Andreassen, and T. Storaas. 1998. Spatial and temporal correlates
to Norwegian moose-train collisions. Alces 34: 385-394. Hebblewhite, M., M. Percy, and E. H. Merrill. 2007. Are all global positioning system
collars created equal? Correcting habitat-induced bias using three brands in the central Canadian Rockies. Journal of Wildlife Management 71: 2026-2033.
Houston, D. B. 1968. The Shiras moose in Jackson Hole, Wyoming. Technical Bulletin
No. 1. Grand Teton Natural History Association.
214

Hubbard, M. W., B. J. Danielson, and R. A. Schmitz. 2000. Factors influencing the
location of deer-vehicle accidents in Iowa. Journal of Wildlife Management 64: 707-713.
Hundertmark, K. J., W. L. Eberhardt, and R. E. Ball. 1990. Winter habitat use by moose
in southeastern Alaska: implications for forest management. Alces 26: 108-114. Jaren, V., R. Andersen, M. Ulleberg, P. H. Pedersen, and B. Wiseth. 1991. Moose-train
collisions: the effects of vegetation removal with a cost-benefit analysis. Alces 27: 93-99.
Joyce, T. L., and S. P. Mahoney. 2001. Spatial and temporal distributions of moose-
vehicle collisions in Newfoundland. Wildlife Society Bulletin 29: 281-291. Kellar, B. J., and L. C. Bender. 2007. Bighorn sheep response to road-related
disturbance in Rocky Mountain National Park, Colorado. Journal of Wildlife Management 71: 2329-2337.
Kindall, J. L., and F. T. Van Manen. 2007. Identifying habitat linkages for American
black bears in North Carolina, USA. Journal of Wildlife Management 71: 487-495.
Knight, D. L. 1994. Mountains and plains: the ecology of Wyoming landscapes. Yale
University Press. New Haven, Connecticut, USA. Kreeger, T. J., W. H. Edwards, E. J. Wald, S. A. Becker, D. Brimeyer, G. Fralick, and J.
Berger. 2005. Health assessment of Shiras moose immobilized with thiafentanil. Alces 41: 121-128.
Lavsund, S., and F. Sandegren. 1991. Moose-vehicle relations in Sweden: a review.
Alces 27: 118-126. Leblond, M., C. Dussault, J. P. Ouellet, M. Poulin, R. Courtois, and J. Fortin. 2007.
Electric fencing as a measure to reduce moose-vehicle collisions. Journal of Wildlife Management 71: 1695-1703.
Loranger, A. J., T. N. Bailey, and W. W. Larned. 1991. Effects of forest succession after
fire in moose wintering habitats on the Kenai Peninsula, Alaska. Alces 27: 100-109.
MacCracken, J. G., V. Van Ballenberghe, and J. M. Peek. 1997. Habitat relationships of
moose on the Copper River delta in coastal south-central Alaska. Wildlife Monographs 136.
215

Malo, J. E., F. Suárez, and A. Díez. 2004. Can we mitigate animal-vehicle accidents using predictive models? Journal of Applied Ecology 41: 701-710.
Manly, B. F., L, McDonald, D. Thomas, T. McDonald, and W. Erickson. 2002.
Resource selection by animals: statistical design and analysis for field studies. Second edition. Kluwer Academic, Boston, Massachusetts, USA.
Matchett, M. R. 1985. Habitat selection by moose in the Yak River drainage,
northwestern Montana. Alces 21: 161-190. McDonald, M. G. 1991. Moose movement and mortality associated with the Glenn
Highway expansion, Anchorage, Alaska. Alces 27: 208-219. McJames, S. W., J. F. Kimball, and T. H. Stanley. 1994. Immobilization of moose with
A-3080 and reversal with nalmefene HCl or naltrexone HCl. Alces 30: 21-24. Modafferi, R. D. 1991. Train moose-kill in Alaska: characteristics and relationships
with snowpack depth and moose distribution in lower Susitna Valley. Alces 27: 193-207.
Ng, S. J., J. W. Dole, R. M. Sauvajot, S. P. D. Riley, and T. J. Valone. 2004. Use of
highway undercrossings by wildlife in southern California. Biological Conservation 115: 499-507.
Nielsen, C. K., R. G. Anderson, and M. D. Grund. 2003. Landscape influences on deer-
vehicle accident areas in an urban environment. Journal of Wildlife Management 67: 46-51.
Oosenbrug, S. M., E. W. Mercer, and S. H. Ferguson. 1991. Moose-vehicle collisions in
Newfoundland – management considerations for the 1990s. Alces 27: 220-225. Peek, J. M. 1997. Habitat relationships Pages 351-375 in A.W. Franzmann and C.C.
Schwartz, eds. Ecology and Management of North American Moose. Smithsonian Institute Press, Washington, D.C., USA.
R Core Development Team. 2006. R 2.4.0 – a language and environment. R Foundation
for Statistical Computing, Vienna, Austria. <http://www.R-project.org>. Accessed 6 Oct 2006.
Rea, R. V. 2003. Modifying roadside vegetation management practices to reduce
vehicular collisions with moose Alces alces. Wildlife Biology 9: 81-91. Renecker, L. A. 1986. Bioenergetics and behavior of moose (Alces alces) in the aspen
boreal forest. Dissertation, University of Alberta, Edmonton, Alberta, Canada.
216

Rodgers, A. R., A. P. Carr, H. L. Beyer, L. Smith, and J. G. Kie. 2007. HRT: Home Range Tools for ArcGIS. Version 1.1. Ontario Ministry of Natural Resources, Centre for Northern Forest Ecosystem Research, Thunder Bay, Ontario, Canada.
Sawyer, H., and B. Rudd. 2005. Pronghorn roadway crossings: a review of available
information and potential options. Western Ecosystems Technology, Inc., Cheyenne, Wyoming, USA.
Sawyer, H., R. M. Nielsen, F. Lindzey, and L. L. McDonald. 2006. Winter habitat
selection of mule deer before and during development of a natural gas field. Journal of Wildlife Management 70: 396-403.
Sawyer, H., R. M. Nielsen, F. G. Lindzey, L. Keith, J. H. Powell, and A. A. Abraham.
2007. Habitat selection of Rocky Mountain elk in a nonforested environment. Journal of Wildlife Management 71: 868-874.
Seiler, A. 2004. Trends and spatial patterns in ungulate-vehicle collisions in Sweden.
Wildlife Biology 10: 301-313. Seiler, A. 2005. Predicting locations of moose-vehicle collisions in Sweden. Journal of
Applied Ecology 42: 371-382. Stephenson, T. R., V. Van Ballenberghe, J. M. Peek, and J. G. MacCracken. 2006.
Spatio-temporal constraints on moose habitat and carrying capacity in coastal Alaska: vegetation succession and climate. Rangeland Ecology and Management 59: 359-372.
Sullivan, T. L., A. F. Williams, T. A. Messmer, L. A. Hellinga, and S. Y. Kyrychenko.
2004. Effectiveness of temporary warning signs in reducing deer-vehicle collisions during mule deer migrations. Wildlife Society Bulletin 32: 907-915.
U.S. Geological Survey. 1999. 30-meter National Elevation Dataset (tiled for
Wyoming). U.S. Geological Survey EROS Data Center, Sioux Falls, South Dakota, USA.
Waller, J. S., and C. Servheen. 2005. Effects of transportation infrastructure on grizzly
bears in northwestern Montana. Journal of Wildlife Management 69: 985-1000. Whitlock, C. 1993. Postglacial vegetation and climate of Grand Teton and southern
Yellowstone National Parks. Ecological Monographs 63: 173-198. Wigglesworth, R. R., and D. G. Wachob. 2004. Historical and present habitat conditions
on the Jackson Hole, Wyoming moose winter range. Teton Science Schools Conservation Research Center, Jackson, Wyoming, USA.
217

218
Wyoming Department of Transportation. 2006. Automatic traffic recorder report for Togwotee Pass, 2005. Wyoming Department of Transportation, Cheyenne, Wyoming, USA.
Wyoming Department of Transportation. 2007. Automatic traffic recorder report for
Togwotee Pass, 2006. Wyoming Department of Transportation, Cheyenne, Wyoming, USA.
Wyoming Department of Transportation. 2008. Automatic traffic recorder report for
Togwotee Pass, 2007. Wyoming Department of Transportation, Cheyenne, Wyoming, USA.
Young, D., and H. Sawyer. 2006. Wildlife crossing study: U.S. Highway 287/26, Moran
Junction – Dubois. Western Ecosystems Technology, Inc. Cheyenne, Wyoming, USA.