naval postgraduate school · robert n. beck dean, graduate ... jeff sierpien went out of his way on...
TRANSCRIPT
NAVAL
POSTGRADUATE SCHOOL
MONTEREY, CALIFORNIA
THESIS
Approved for public release; distribution is unlimited
AN ANALYSIS OF THE MARINE CORPS ENLISTMENT BONUS PROGRAM
by
Billy H. Ramsey
March 2008
Thesis Co-Advisors: Samuel E. Buttrey Bill Hatch

THIS PAGE INTENTIONALLY LEFT BLANK

i
REPORT DOCUMENTATION PAGE Form Approved OMB No. 0704-0188Public reporting burden for this collection of information is estimated to average 1 hour per response, including the time for reviewing instruction, searching existing data sources, gathering and maintaining the data needed, and completing and reviewing the collection of information. Send comments regarding this burden estimate or any other aspect of this collection of information, including suggestions for reducing this burden, to Washington headquarters Services, Directorate for Information Operations and Reports, 1215 Jefferson Davis Highway, Suite 1204, Arlington, VA 22202-4302, and to the Office of Management and Budget, Paperwork Reduction Project (0704-0188) Washington DC 20503. 1. AGENCY USE ONLY (Leave blank)
2. REPORT DATE March 2008
3. REPORT TYPE AND DATES COVERED Master’s Thesis
4. TITLE AND SUBTITLE An Analysis of the Marine Corps Enlistment Bonus Program 6. AUTHOR(S) Captain Ramsey B.H.
5. FUNDING NUMBERS
7. PERFORMING ORGANIZATION NAME(S) AND ADDRESS(ES) Naval Postgraduate School Monterey, CA 93943-5000
8. PERFORMING ORGANIZATION REPORT NUMBER
9. SPONSORING /MONITORING AGENCY NAME(S) AND ADDRESS(ES)
N/A
10. SPONSORING/MONITORING AGENCY REPORT NUMBER
11. SUPPLEMENTARY NOTES The views expressed in this thesis are those of the author and do not reflect the official policy or position of the Department of Defense or the U.S. Government. 12a. DISTRIBUTION / AVAILABILITY STATEMENT Approved for public release; distribution is unlimited
12b. DISTRIBUTION CODE
13. ABSTRACT The Marine Corps has been very successful at meeting its yearly recruiting goal.
However, the Marine Corps does struggle to recruit the correct number of applicants into each enlistment program. Enlistment bonuses are used to attract highly qualified applicants into critically short enlistment programs and the enlistment bonus budget has increased significantly in the past 3 years. The Marine Corps has the ability to determine what enlistment programs are considered “difficult to fill” and the capability to increase the number of allocations and the dollar amount of enlistment bonuses. However, the Marine Corps does not have the ability to determine the optimal dollar amount for an enlistment bonus. This research begins by analyzing methods used in previous studies to estimate the optimal enlistment incentive. This research found that choice-based surveys administered to recruits could be used to determine optimal enlistment incentives. Then the study analyzed eight years of recruiting data obtained from the Total Force Data Warehouse and the Marine Corps Recruiting Command. Results show that the enlistment bonus program (EBP) was unchanged for several years and other factors identified could be decreasing the effectiveness of the EBP. With the information provided by this thesis, the Marine Corps can increase the effectiveness of the EBP.
15. NUMBER OF PAGES
111
14. SUBJECT TERMS Marine Corps, Enlistment Bonus, Recruiting.
16. PRICE CODE
17. SECURITY CLASSIFICATION OF REPORT
Unclassified
18. SECURITY CLASSIFICATION OF THIS PAGE
Unclassified
19. SECURITY CLASSIFICATION OF ABSTRACT
Unclassified
20. LIMITATION OF ABSTRACT
UU NSN 7540-01-280-5500 Standard Form 298 (Rev. 2-89) Prescribed by ANSI Std. 239-18

ii
THIS PAGE INTENTIONALLY LEFT BLANK
iii
Approved for public release; distribution is unlimited
AN ANALYSIS OF THE MARINE CORPS ENLISTMENT BONUS PROGRAM
Billy H. Ramsey Captain, United States Marine Corps B.A., Concordia University, 1999
Submitted in partial fulfillment of the requirements for the degree of
MASTER OF SCIENCE IN MANAGEMENT
from the
NAVAL POSTGRADUATE SCHOOL March 2008
Author: Billy H. Ramsey
Approved by: Samuel E. Buttrey Thesis Co-Advisor
Bill Hatch Thesis Co-Advisor
Robert N. Beck Dean, Graduate School of Business and Public Policy

iv
THIS PAGE INTENTIONALLY LEFT BLANK
v
ABSTRACT
The Marine Corps has been very successful at meeting
its yearly recruiting goal. However, the Marine Corps does
struggle to recruit the correct number of applicants into
each enlistment program. Enlistment bonuses are used to
attract highly qualified applicants into critically short
enlistment programs and the enlistment bonus budget has
increased significantly in the past 3 years. The Marine
Corps has the ability to determine what enlistment programs
are considered “difficult to fill” and the capability to
increase the number of allocations and the dollar amount of
enlistment bonuses. However, the Marine Corps does not have
the ability to determine the optimal dollar amount for an
enlistment bonus. This research begins by analyzing methods
used in previous studies to estimate the optimal enlistment
incentive. The research found that choice-based surveys
administered to recruits could be used to determine optimal
enlistment incentives. Then the study analyzed eight years
of recruiting data obtained from the Total Force Data
Warehouse and the Marine Corps Recruiting Command. Results
show that the enlistment bonus program (EBP) was unchanged
for several years and other factors identified could be
decreasing the effectiveness of the EBP. With the
information provided by this thesis, the Marine Corps can
increase the effectiveness of the EBP.

vi
THIS PAGE INTENTIONALLY LEFT BLANK

vii
TABLE OF CONTENTS
I. INTRODUCTION ............................................1 A. BACKGROUND .........................................1 B. PROBLEM ............................................5 C. PURPOSE ............................................7 D. RESEARCH QUESTIONS .................................7
1. Primary Research Question .....................7 2. Secondary Research Questions ..................8
E. SCOPE AND LIMITATIONS ..............................8 F. ORGANIZATION OF THE STUDY ..........................8
II. MARINE CORPS ENLISTMENT BONUS PROGRAM ..................11 A. ORDERS AND INSTRUCTIONS GOVERNING THE ENLISTMENT
BONUS PROGRAM .....................................11 B. INCORPORATION OF THE ENLISTMENT BONUS PROGRAM .....16
III. LITERATURE REVIEW ......................................29 A. METHODOLOGIES OF PREVIOUS STUDIES .................29 B. SURVEYS ...........................................30
1. Survey Data from Marine Corps Enlistees ......31 2. Surveys from the Civilian Youth Population ...36
C. HISTORICAL DATA ...................................49 1. Pay Elasticity ...............................49 2. Multiple Regression Analysis .................51
D. SUMMARY ...........................................58 IV. DATA ...................................................61
A. DATA SOURCES ......................................61 1. TFDW & MCRC ..................................61
B. VARIABLES .........................................62 C. ANALYSIS OF DATA ..................................64
1. Predicting the Optimal Incentive for an Enlistment Bonus .............................64
2. Meeting Enlistment Program Requirements ......67 3. EB Programs ..................................78
V. SUMMARY, CONCLUSIONS, AND RECOMMENDATIONS ..............85 A. SUMMARY ...........................................85 B. CONCLUSION AND RECOMMENDATIONS ....................86
1. Primary Research Question ....................86 a. How can MPP-20 Effectively Predict the
Optimal Dollar Amount for Enlistment Bonuses? ................................86
2. Secondary Research Questions .................87
viii
a. Can Data from the TFDW be used to Effectively Predict the Optimal Dollar Amount for Enlistment Bonuses? ..........87
b. Do Minimum AFQT Requirements for Enlistment Bonus Programs Decrease the Effectiveness of the Enlistment Bonus Program? ................................88
c. What Factors Could be Decreasing the Effectiveness of the EBP. ...............88
C. AREAS FOR FURTHER RESEARCH AND STUDY ..............90 LIST OF REFERENCES ..........................................93 INITIAL DISTRIBUTION LIST ...................................95

ix
LIST OF FIGURES
Figure 1. Manpower & Reserve Affairs Task organization.....2 Figure 2. MP Task Organization.............................3 Figure 3. Electronics Maintenance Enlistment Program......13 Figure 4. Relative preferences for actuarially equivalent
incentives (EB vs. NCF).........................43 Figure 5. Probabilities of choice for occupation..........44 Figure 6. Enlistment bonuses that yield equal
probabilities of choice.........................45 Figure 7. Trade-offs between EBs and service terms........46 Figure 8. Enlistment Bonus Budget........................65

x
THIS PAGE INTENTIONALLY LEFT BLANK
xi
LIST OF TABLES
Table 1. Marine Corps Monetary Incentive Programs.........5 Table 2. Marine Corps FY 2006-2008 EBP Budget.............6 Table 3. Marine Corps EBP eligibility requirements.......15 Table 4. Circumstances for disqualification from EBP.....15 Table 5. Monetary value of TB and CB programs............17 Table 6. Bonus attainment/allocation by year.............17 Table 7. Eligibility Requirements for the CB and TB......18 Table 8. EBP budget (FY78-FY81 & FY94-FY05)..............19 Table 9. FY 2005 Enlistment Programs with Bonuses........20 Table 10. FY 1999 – FY 2005 EBP (Shipping Bonus)..........21 Table 11. Marine Corps end strength and accession
missions........................................21 Table 12. FY 2005 through FY 2008 EBP budget..............22 Table 13. FY05-FY08 Enlistment Programs with Bonus........23 Table 14. FY05-FY08 Shipping Bonuses......................25 Table 15. FY 2008 EBP minimum AFQT/line score (individual
components of the AFQT) requirements............26 Table 16. Survey Questions................................31 Table 17. Responses to Question 1.........................32 Table 18. Responses to Question 2.........................33 Table 19. Responses to Question 3 (Alternatives to Bonus
Enlistment).....................................33 Table 20. Responses to question 4.........................35 Table 21. Survey response rates...........................38 Table 22. Logit output for medium-propensity..............40 Table 23. Calculating predicted probabilities of choice...41 Table 24. Enlistments per 100 bonuses.....................51 Table 25. Incentive Frequencies (FY 1987-96 Data).........53 Table 26. Model percent change in number of contracts.....54 Table 27. Model 2 percent change in number of contracts...55 Table 28. Summary statistics for knot values..............57 Table 29. Recommended four-year bonus values..............58 Table 30. TFDW VARIABLES..................................62 Table 31. Enlistment Programs.............................63 Table 32. Marine Corps Enlistment Bonuses.................66 Table 33. Percentage of Marine Corps Enlistment Programs
attained........................................67 Table 34. Number of Marine Corps Enlistment Programs
short or over annual requirement................68 Table 35. Percentage of Enlistment Programs attained for
EB programs.....................................70 Table 36. Enlistment Programs identified as consistently
not meeting annual requirement..................71

xii
Table 37. Enlistment Program line Score Requirements......72 Table 38. Percentage of Bravos............................74 Table 39. Number of Marine Corps Enlistment Programs
short or over annual requirement................75 Table 40. Cumulative number of enlistment programs over
or short of annual requirement..................77 Table 41. Average ASVAB Scores............................78 Table 42. Percentage of Bravos............................79 Table 43. Percentage of allocated bonuses used............81
xiii
ACKNOWLEDGMENTS
This thesis would not have been possible without the
support from my wife and children. My wife stated on
numerous occasions that she enjoyed having me home, but I
never truly seemed to be home. If I was not working on my
thesis, I was thinking about it. Despite being pregnant, my
wife remained supportive and provided assistance on
numerous occasions.
Aside from my wife and children, I would like to thank
my two advisors for their patience, guidance, and wisdom.
CDR Hatch ensured I stayed on task and kept me motivated
through the process. Professor Buttrey provided insightful
wisdom and assisted tremendously in the accomplishment of
this thesis.
I would also like to thank the representatives at MPP-
20 and Marine Corps Recruiting Command for answering
countless questions and providing timely responses. Captain
Jeff Sierpien went out of his way on many occasions to
ensure I had the information I needed to complete this
research.

xiv
THIS PAGE INTENTIONALLY LEFT BLANK

1
I. INTRODUCTION
This research analyzed the Marine Corps enlistment
bonus program. The objective is to determine how the Marine
Corps can optimally predict the amount to allocate for
enlistment bonuses. The Marine Corps uses enlistment
bonuses to attract highly qualified applicants into
enlistment programs for critically short military
occupational skills.1
A. BACKGROUND
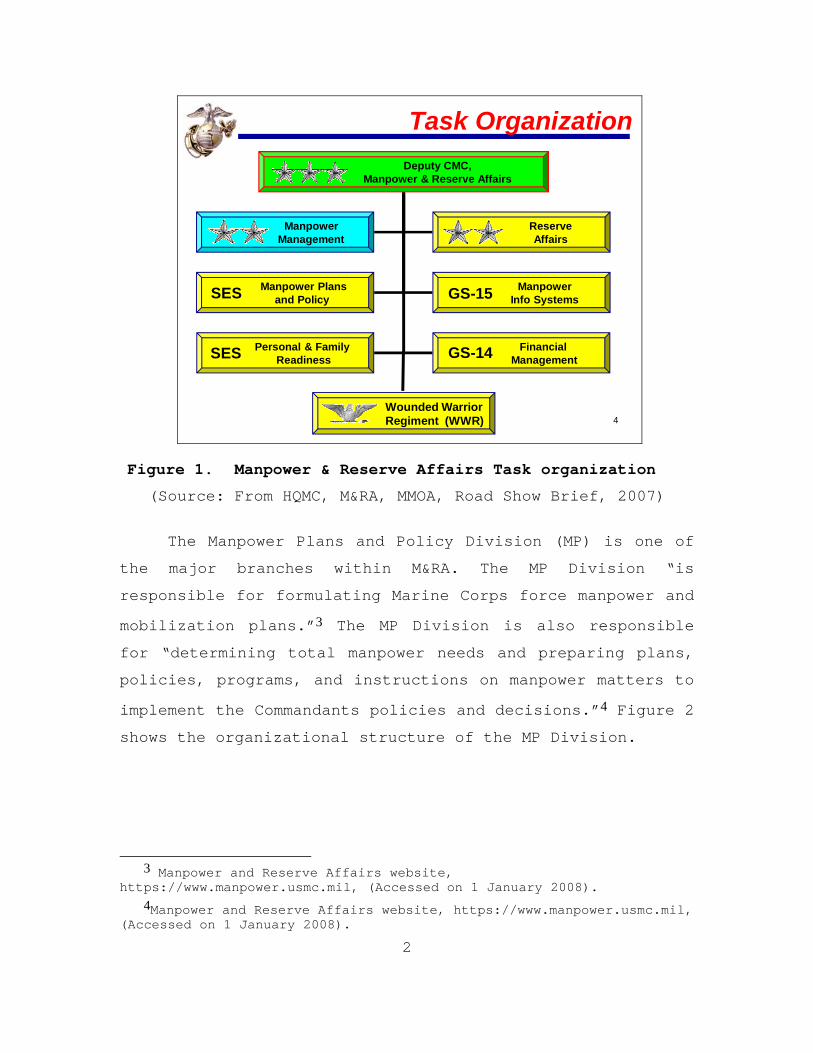
Manpower and Reserve Affairs (M&RA) is the largest
department within Head Quarters Marine Corps (HQMC). “This
organization “assists the Commandant by planning,
directing, coordinating, and supervising both active and
reserve forces.”2 M&RA in the Marine Corps could be compared
to a human resource department within a major corporation.
M&RA consists of seven branches as shown in the
organizational structure in Figure 1.
Enlisted Manpower Plans section, in response to a
significant increase in the enlistment bonus budget,
requested that the Naval Postgraduate School analyze the
Marine Corps enlistment bonus program to ensure that the
section was maximizing the effectiveness of the program.
1 Marine Corps Order 1130.53P dated 11 June 2002.
2 Manpower and Reserve Affairs website, https://www.manpower.usmc.mil, (Accessed on 10 October 2007).
2
4
Task OrganizationDeputy CMC,
Manpower & Reserve Affairs
ManpowerManagement
ReserveAffairs
Manpower Plansand Policy
ManpowerInfo Systems
Personal & FamilyReadiness
FinancialManagementSES
GS-15
GS-14
Wounded WarriorRegiment (WWR)
SES
Figure 1. Manpower & Reserve Affairs Task organization (Source: From HQMC, M&RA, MMOA, Road Show Brief, 2007)
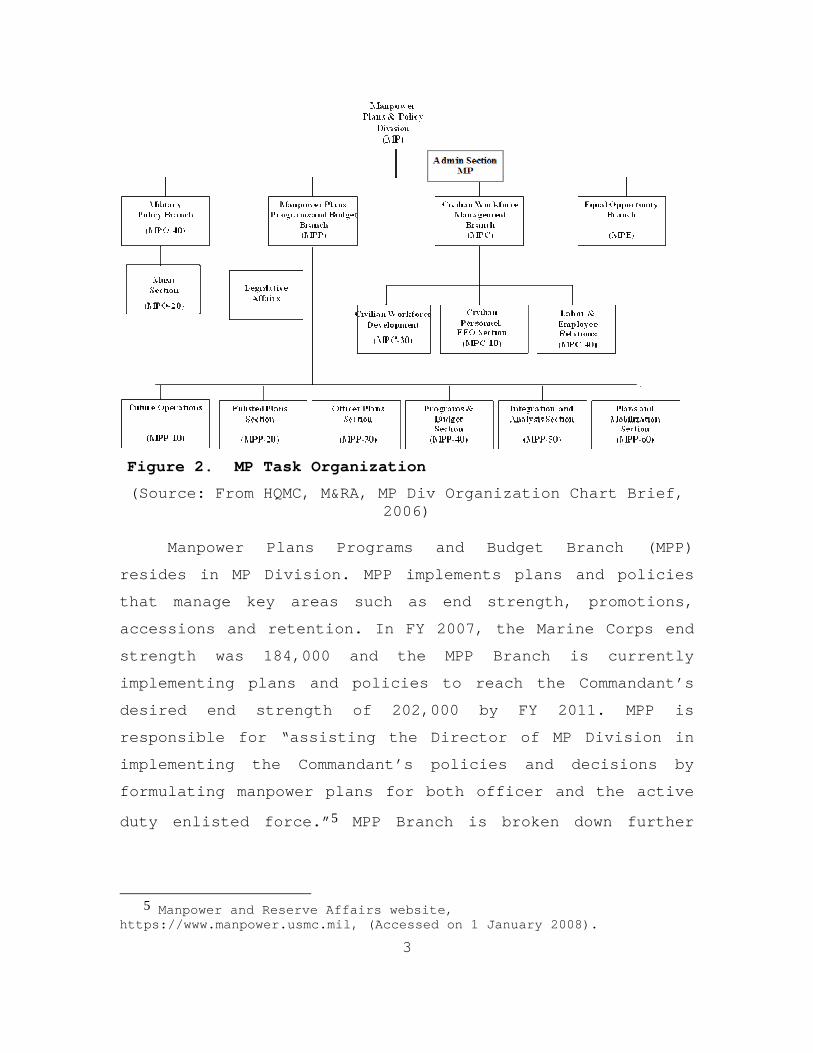
The Manpower Plans and Policy Division (MP) is one of
the major branches within M&RA. The MP Division “is
responsible for formulating Marine Corps force manpower and
mobilization plans.”3 The MP Division is also responsible
for “determining total manpower needs and preparing plans,
policies, programs, and instructions on manpower matters to
implement the Commandants policies and decisions.”4 Figure 2
shows the organizational structure of the MP Division.
3 Manpower and Reserve Affairs website,
https://www.manpower.usmc.mil, (Accessed on 1 January 2008). 4Manpower and Reserve Affairs website, https://www.manpower.usmc.mil,
(Accessed on 1 January 2008).
3
Figure 2. MP Task Organization (Source: From HQMC, M&RA, MP Div Organization Chart Brief,
2006)
Manpower Plans Programs and Budget Branch (MPP)
resides in MP Division. MPP implements plans and policies
that manage key areas such as end strength, promotions,
accessions and retention. In FY 2007, the Marine Corps end
strength was 184,000 and the MPP Branch is currently
implementing plans and policies to reach the Commandant’s
desired end strength of 202,000 by FY 2011. MPP is
responsible for “assisting the Director of MP Division in
implementing the Commandant’s policies and decisions by
formulating manpower plans for both officer and the active
duty enlisted force.”5 MPP Branch is broken down further
5 Manpower and Reserve Affairs website,
https://www.manpower.usmc.mil, (Accessed on 1 January 2008).

4
into six sections as shown in Figure 2. One of the sections
in MPP Branch is the Enlisted Plans Section (MPP-20).
MPP-20 is a key player in managing the enlisted force.
MPP-20 is responsible for “assisting the director of MP
Division in implementing the Commandant policies and
decisions by formulating Manpower plans for the active duty
enlisted force.”6 In FY 2007, enlisted end strength was
166,783 active duty Marines but it will increase to more
than 180,000 active duty Marines by FY 2011. MPP-20
implements policies and plans to ensure the successful
shaping of the enlisted force into the 233 primary Military
Occupational Specialties (MOS). MPP-20 manages the career
force and first-term inventory by implementing plans and
policies that control retention, promotion and accessions
for each MOS. Retention and promotion are critical aspects
in managing the enlisted force, but this research will
focus on using monetary incentives to assist managing
accessions.
Each year MPP-20 determines the number of applicants
the Marine Corps needs to recruit into each MOS. After MPP-
20’s recommendation is approved, the accession mission is
assigned to the Marine Corps Recruiting Command (MCRC). In
addition, MPP-20 evaluates the Marine Corps’ monetary
incentives and recommends changes to assist MCRC in meeting
its recruiting goal. The Marine Corps has three types of
monetary incentive programs: the college fund, enlistment
bonuses, and shipping bonuses, as shown in Table 1.
6 Manpower and Reserve Affairs website,
https://www.manpower.usmc.mil, (Accessed on 1 January 2008).

5
Table 1. Marine Corps Monetary Incentive Programs
Current Monetary Incentive Programs Program Term (years) Monetary ValueEnlistment Bonus Program (Specific job Skill)
2-6 $3,000-$15,000
Marine Corps College Fund (Any job skill)
4-6 $50,000+
Shipping Bonus (Any job skill)
4-6 $5,000
(Source: HQMC, M&RA, Enlisted Plans Section)
The Marine Corps has been very successful at meeting
its yearly recruiting goal. However, Marine Corps
Recruiting data has not been available since the inception
of the All-Volunteer Force. An official at MCRC stated that
the Marine Corps has met its recruiting goal every year for
the past ten years.7 Meeting the recruiting goal means that
if MCRC was tasked to recruit 32,000 applicants in FY 2005,
then MCRC recruited a total of 32,000 or more applicants.
B. PROBLEM
The nature of the problem lies in recruiting the
correct number of applicants into each enlistment program
and shipping the applicants to recruit training at a
specified time. In FY 2002, MCRC made its annual recruiting
goal, but the Marine Corps was short, for example, 321
applicants designated to the transportation program and 527
applicants designated to the supply and accounting program.8
MCRC does recruit some recruits with “open contracts” who
can be assigned to critically short MOSs, but recruits with
7 Phone Interview with Mike Styka, MCRC Deputy Head Enlisted
Recruiting, 29 November 2007. 8 MCRC end of the year recruiting report.

6
open contracts often fall short of being fully qualified
and may not meet the shipping time-line to be assigned to a
critically short enlistment program. Failing to recruit the
correct number of applicants into each MOS makes it
difficult to ensure the successful shaping of the enlisted
force to meet MOS requirements of fleet units. Even though
MPP-20 determines the requirement for each MOS, certain
MOSs are critically short due to their high prerequisites
or perceived undesirability. In order to entice high-
quality applicants to select critically short enlistment
programs, the Marine Corps provides enlistment bonuses.
MPP-20 has the ability to determine what enlistment
programs are considered “difficult to fill.” The enlistment
bonus budget has increased significantly over the last 3
years as shown in Table 2. MPP-20 has the capability to
increase the number of allocations and the dollar amount of
enlistment bonuses.
Table 2. Marine Corps FY 2006-2008 EBP Budget Fiscal Year Budget in millions
FY06 6.257
FY07 47a
FY08 81 a Initial budget was 10.6, increased to 47 in January 2007.
(Source: HQMC, M&RA, Enlisted Plans Section)
However, MPP-20 does not have the ability to determine the
optimal dollar amount for an enlistment bonus. What bonus
incentive will level the playing field between a popular
enlistment program and an unpopular one? In order for the
Marine Corps to maximize the effectiveness of enlistment
7
programs, it needs a means to predict which monetary
incentives will be the most effective. In addition,
enlistment bonuses require applicants to meet minimum
requirements that may be higher than the minimum
requirements for the enlistment program. As a result
applicants who are qualified for a hard-to-fill enlistment
program, but not qualified for an enlistment bonus, have no
incentive to select a hard-to-fill enlistment program. As
the Marine Corps increases end strength, a key factor in
successfully shaping the enlisted force will be recruiting
the optimal mix of applicants into the 233 MOSs.
C. PURPOSE
The purpose of this research is to provide MPP-20
alternatives for increasing the effectiveness of the
enlistment bonus program. This research identifies and
recommends tools that can be used to determine the optimal
incentive amount for enlistment bonuses. Additionally, this
research identifies factors that are significant to the
Marine Corps ability to man hard-to-fill enlistment
programs. The results are relevant to MPP-20 and can assist
them in effectively allocating monetary incentives to
attract high quality applicants into critical enlistment
programs.
D. RESEARCH QUESTIONS
1. Primary Research Question
How can MPP-20 effectively predict the optimal dollar
amount for enlistment bonuses?

8
2. Secondary Research Questions
a. What factors could be decreasing the
effectiveness of the enlistment bonus program?
b. Can the Marine Corps Total Force Data Warehouse
be used to effectively predict the incentives for
enlistment bonuses?
c. Do minimum AFQT requirements for enlistment
bonus programs decrease the effectiveness of the program?
E. SCOPE AND LIMITATIONS
The scope includes: (1) a review of the Marine Corps
enlistment bonus program order; (2) an in-depth review of
the literature on prior enlistment programs assigned an
enlistment bonus; and (3) an evaluation of the Marine Corps
Recruiting data contained within the Total Force Data
Warehouse (TFDW). The thesis concludes with recommendations
for incorporating alternatives to assist MPP-20 in
effectively allocating enlistment incentives to attract
high quality applicants into critical enlistment programs.
The methodology for this research is qualitative. The
research also utilizes recruiting data from the TFDW and
from MCRC. The data in the research focuses on the active
duty enlisted applicants that have shipped to recruit
training over the past eight years.
F. ORGANIZATION OF THE STUDY
This research is organized into five separate
chapters. Chapter I gives an introduction and background on
the research issue. Chapter II provides information on the
enlistment bonus programs used in the past and the

9
enlistment bonus programs currently being used. Chapter III
reviews prior studies on enlistment bonus programs. Chapter
IV describes the data and variables used in study. Chapter
V is a summary, and gives conclusions and recommendations.

10
THIS PAGE INTENTIONALLY LEFT BLANK
11
II. MARINE CORPS ENLISTMENT BONUS PROGRAM
The United States Marine Corps enlistment bonus
program (EBP) has two primary objectives:
1. Attract highly qualified applicants to select
designated enlistment programs;9 and
2. Encourage applicants to ship to recruit training
during certain times of the year.
The EBP serves as a vital tool in shaping the
structure of the enlisted force. The theory is that
offering a monetary incentive is the most cost-effective
means to fill enlistment programs that otherwise would not
be filled. While generating new enlistments is not an
objective of the EBP, previous studies have shown that the
EBP has been responsible for generating new enlistments.
(Palomba, 1983)
A. ORDERS AND INSTRUCTIONS GOVERNING THE ENLISTMENT BONUS PROGRAM
Enlistment bonuses are governed by section 309(a) of
title 37 United States Code, Department of Defense (DOD)
Directive 1304.21, and Marine Corps Order 1130.53P.
According to DoD Directive 1304.21, the Secretary of the
Military Department establishes the standards for awarding
an enlistment bonus and the value of enlistment bonuses,
but enlistment bonuses may not exceed the maximum amount
prescribed in section 309(a) of Title 37.10 “The intent of
9 Highly qualified applicants are generally considered to be high
school graduates that score a 50 or higher on the Armed forces Qualification test.
10 DoD Dir 1304.21
12
enlistment bonuses is to influence personnel inventories in
specific situations in which less costly methods have
proven inadequate or impractical.”11
In accordance with MCO 1130.53P, “The EBP provides
monetary enlistment incentives to attract highly qualified
applicants into designated programs containing critically
short MOSs, to fill those technical fields with high
prerequisites, and to entice applicants to ship to recruit
training during certain times of the year.”12 The award
levels of enlistment bonuses and programs eligible for a
bonus are determined by MPP-20 and published via MARADMIN
message before the beginning of each fiscal year. Within
the EBP, there are two categories of bonuses: a bonus tied
to an enlistment program and a bonus tied to shipping to
recruit training during certain times of the year.
Enlistment programs apply to several different MOSs.
Applicants who enlist in the Marine Corps are not
guaranteed a specific MOS. They are guaranteed an
enlistment program and the Marine Corps will assign the
applicant one of the MOSs within the enlistment program.
The number and type of enlistments programs has varied over
time, but currently the Marine Corps has approximately 35
different enlistment programs. The Marine Corps’ 233
enlisted MOSs are divided up amongst the 35 different
enlistment programs. For example if an applicant enlists in
the Electronics Maintenance program, he or she would be
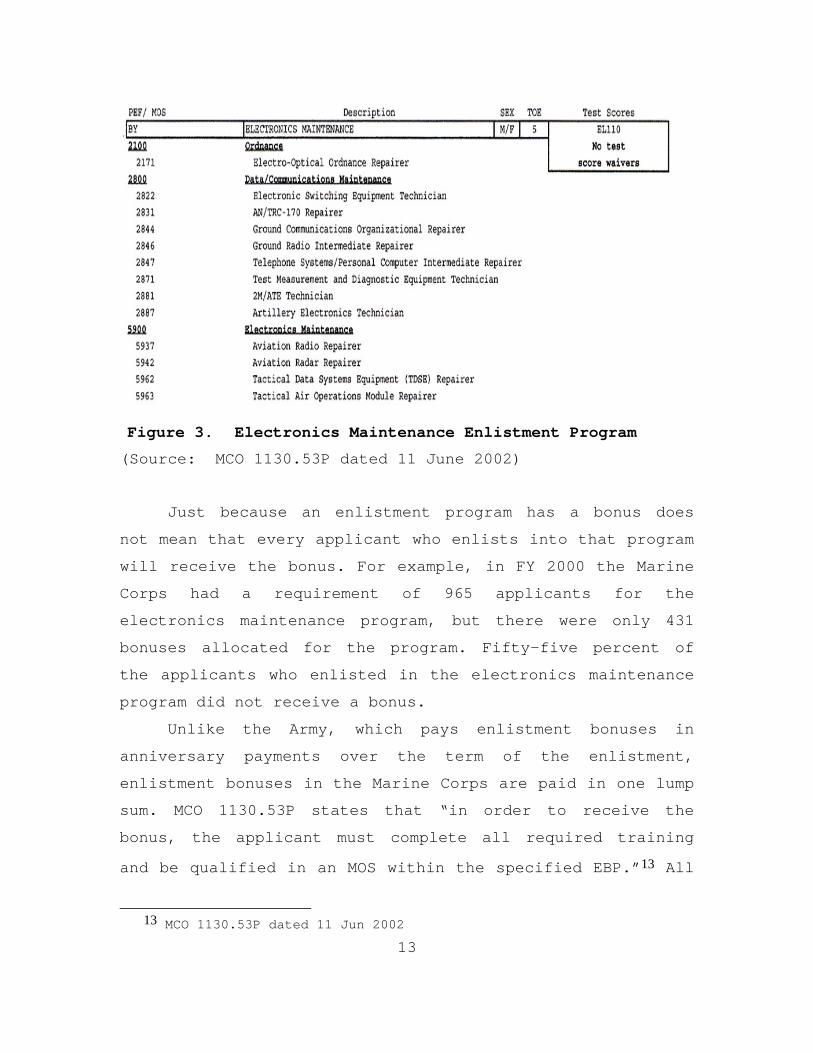
assigned one of the 13 different MOSs as shown in Figure 3.
11 DoD Dir 1304.21 12 MCO 1130.53P dated 11 Jun 2002
13
Figure 3. Electronics Maintenance Enlistment Program (Source: MCO 1130.53P dated 11 June 2002)
Just because an enlistment program has a bonus does
not mean that every applicant who enlists into that program
will receive the bonus. For example, in FY 2000 the Marine
Corps had a requirement of 965 applicants for the
electronics maintenance program, but there were only 431
bonuses allocated for the program. Fifty-five percent of
the applicants who enlisted in the electronics maintenance
program did not receive a bonus.
Unlike the Army, which pays enlistment bonuses in
anniversary payments over the term of the enlistment,
enlistment bonuses in the Marine Corps are paid in one lump
sum. MCO 1130.53P states that “in order to receive the
bonus, the applicant must complete all required training
and be qualified in an MOS within the specified EBP.”13 All
13 MCO 1130.53P dated 11 Jun 2002
14
Marines who receive an enlistment bonus that is tied to an
MOS are required to serve in billets requiring their
primary MOS. Additionally, the Marine must maintain the
MOS throughout his or her entire term of enlistment. A
Marine who fails to complete the full term of enlistment is
required to repay a pro rata share of the enlistment
bonus.14
Applicants must meet certain eligibility requirements
to qualify for an enlistment bonus program. The eligibility
requirements tend to remain constant, but there have been
changes over time. An overview of the eligibility
requirements for the EBP is shown in Table 3. Applicants
that enlist in EBP are required to fill out a Statement of
Understanding (SOU). The SOU serves as a contract between
the applicant and the United States Marine Corps. The SOU
lays out in detail the eligibility requirements for the
program, the value of the bonus, the term of enlistment,
the MOSs within that EBP, and the reasons for
disqualification from the EBP.
14 MCO 1130.53P dated 11 Jun 2002
15
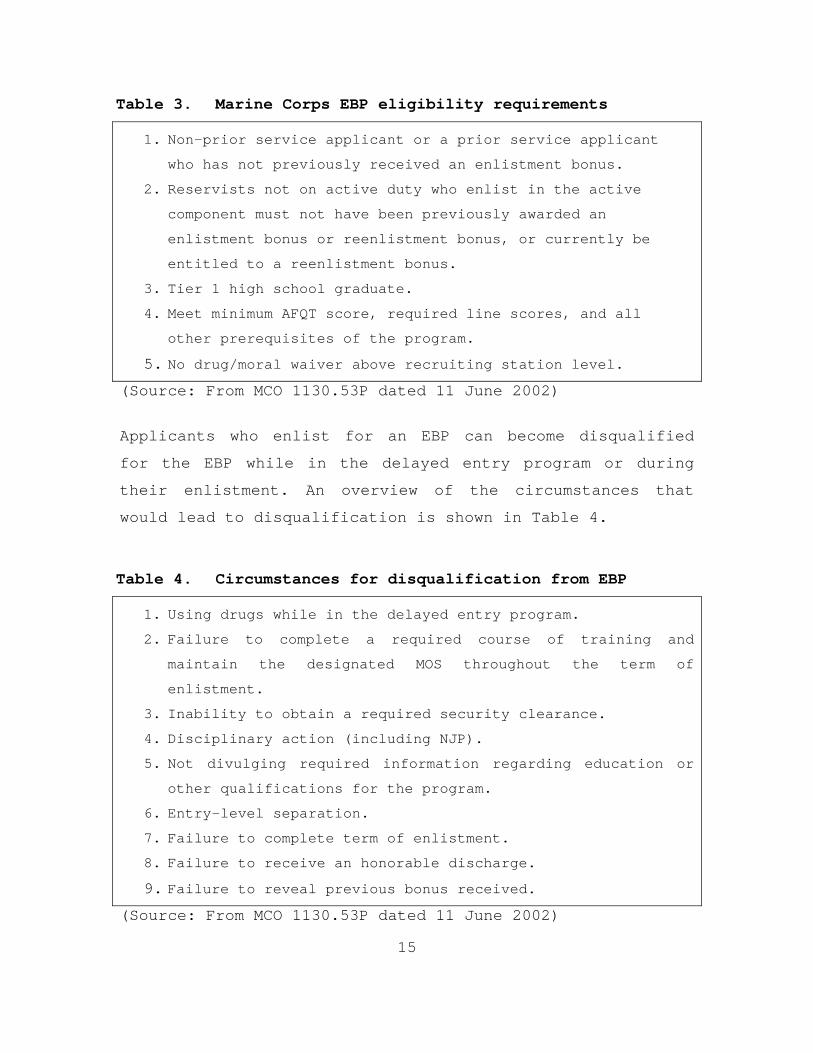
Table 3. Marine Corps EBP eligibility requirements
1. Non-prior service applicant or a prior service applicant
who has not previously received an enlistment bonus.
2. Reservists not on active duty who enlist in the active
component must not have been previously awarded an
enlistment bonus or reenlistment bonus, or currently be
entitled to a reenlistment bonus.
3. Tier 1 high school graduate.
4. Meet minimum AFQT score, required line scores, and all
other prerequisites of the program.
5. No drug/moral waiver above recruiting station level.
(Source: From MCO 1130.53P dated 11 June 2002)
Applicants who enlist for an EBP can become disqualified
for the EBP while in the delayed entry program or during
their enlistment. An overview of the circumstances that
would lead to disqualification is shown in Table 4.
Table 4. Circumstances for disqualification from EBP
1. Using drugs while in the delayed entry program.
2. Failure to complete a required course of training and
maintain the designated MOS throughout the term of
enlistment.
3. Inability to obtain a required security clearance.
4. Disciplinary action (including NJP).
5. Not divulging required information regarding education or
other qualifications for the program.
6. Entry-level separation.
7. Failure to complete term of enlistment.
8. Failure to receive an honorable discharge.
9. Failure to reveal previous bonus received.
(Source: From MCO 1130.53P dated 11 June 2002)

16
B. INCORPORATION OF THE ENLISTMENT BONUS PROGRAM
The Marine Corps EBP program has been around for many
years, but until recently only a fraction of the enlistment
programs qualified for a bonus. This research found that
historical information on the EBP is limited, so it is
difficult to determine the exact date that the Marine Corps
incorporated the EBP. It could be stated that the first
Marine Corps enlistment bonus was offered in 1775, when
Captain Robert Mullen offered a recruit a free tankard of
ale for enlisting in the Marine Corps.15 For the purposes of
this study it will be determined that the Marine Corps
incorporated the EBP around 1972. In June 1972, the Marine
Corps began offering a $1,500 combat arms enlistment bonus
(CB) (Palomba, 1983). The CB program was used to fill MOSs
within the infantry, artillery, and tank communities. The
monetary incentive of the CB program was increased to
$2,500 in FY 1974. In addition, the Marine Corps
incorporated a $2,500 technical bonus (TB) program in FY
1975 that was reduced to $1,500 in FY 1976. The monetary
values of the programs from FY 1973- FY 1981 are shown in
Table 5.
15 Captain Robert Mullen was the first Marine Corps Recruiter
(Source: www.recruitknowledge.com/pages/history/mch1.htm).
17
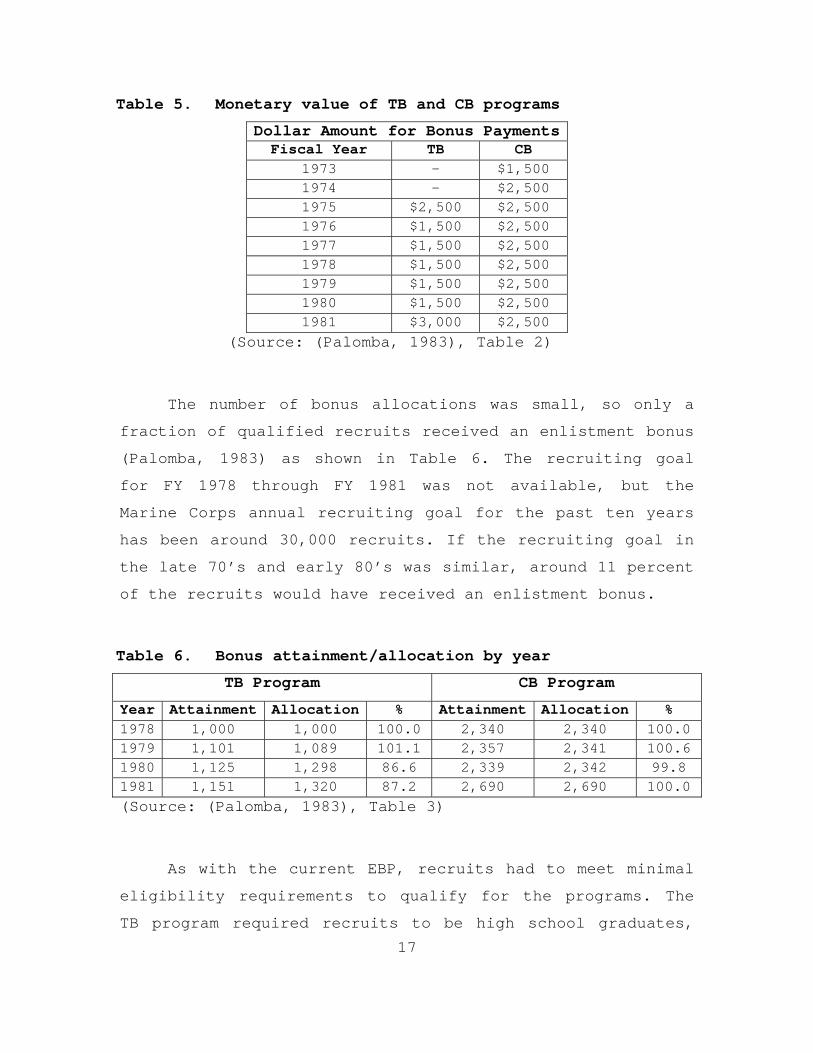
Table 5. Monetary value of TB and CB programs Dollar Amount for Bonus PaymentsFiscal Year TB CB
1973 - $1,500 1974 - $2,500 1975 $2,500 $2,500 1976 $1,500 $2,500 1977 $1,500 $2,500 1978 $1,500 $2,500 1979 $1,500 $2,500 1980 $1,500 $2,500 1981 $3,000 $2,500
(Source: (Palomba, 1983), Table 2)
The number of bonus allocations was small, so only a
fraction of qualified recruits received an enlistment bonus
(Palomba, 1983) as shown in Table 6. The recruiting goal
for FY 1978 through FY 1981 was not available, but the
Marine Corps annual recruiting goal for the past ten years
has been around 30,000 recruits. If the recruiting goal in
the late 70’s and early 80’s was similar, around 11 percent
of the recruits would have received an enlistment bonus.
Table 6. Bonus attainment/allocation by year TB Program CB Program
Year Attainment Allocation % Attainment Allocation % 1978 1,000 1,000 100.0 2,340 2,340 100.0 1979 1,101 1,089 101.1 2,357 2,341 100.6 1980 1,125 1,298 86.6 2,339 2,342 99.8 1981 1,151 1,320 87.2 2,690 2,690 100.0 (Source: (Palomba, 1983), Table 3)
As with the current EBP, recruits had to meet minimal
eligibility requirements to qualify for the programs. The
TB program required recruits to be high school graduates,
18
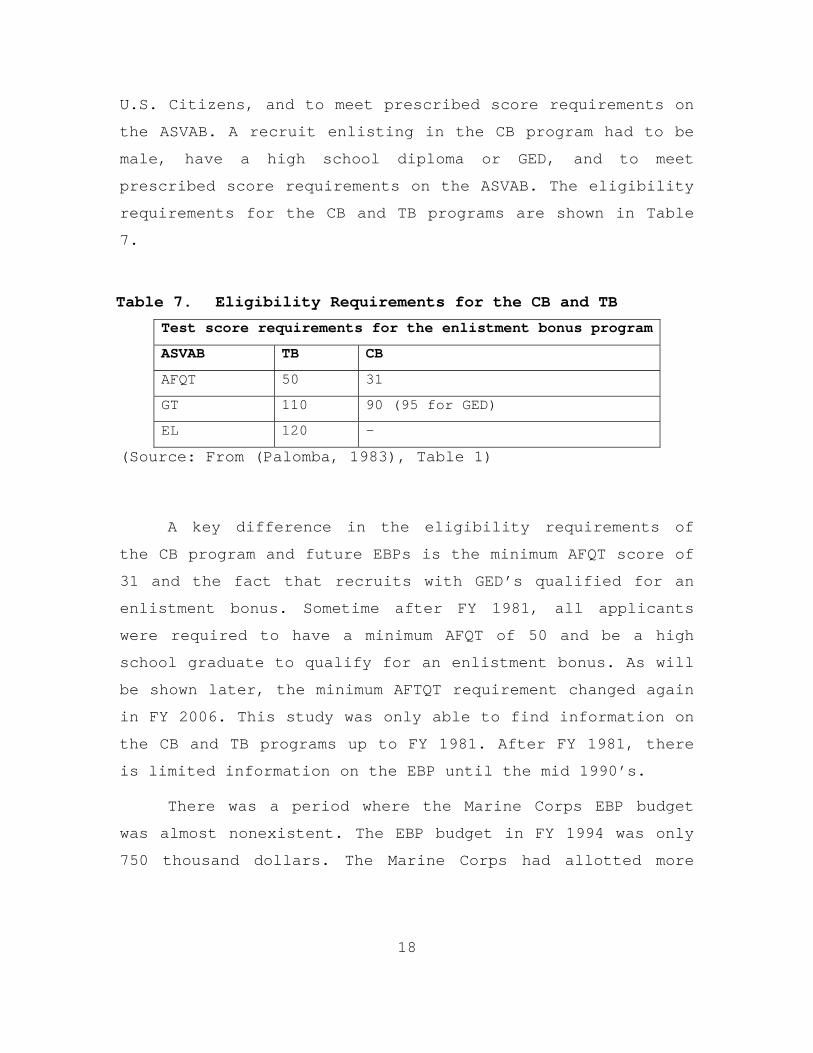
U.S. Citizens, and to meet prescribed score requirements on
the ASVAB. A recruit enlisting in the CB program had to be
male, have a high school diploma or GED, and to meet
prescribed score requirements on the ASVAB. The eligibility
requirements for the CB and TB programs are shown in Table
7.
Table 7. Eligibility Requirements for the CB and TB Test score requirements for the enlistment bonus program
ASVAB TB CB
AFQT 50 31
GT 110 90 (95 for GED)
EL 120 -
(Source: From (Palomba, 1983), Table 1)
A key difference in the eligibility requirements of
the CB program and future EBPs is the minimum AFQT score of
31 and the fact that recruits with GED’s qualified for an
enlistment bonus. Sometime after FY 1981, all applicants
were required to have a minimum AFQT of 50 and be a high
school graduate to qualify for an enlistment bonus. As will
be shown later, the minimum AFTQT requirement changed again
in FY 2006. This study was only able to find information on
the CB and TB programs up to FY 1981. After FY 1981, there
is limited information on the EBP until the mid 1990’s.
There was a period where the Marine Corps EBP budget
was almost nonexistent. The EBP budget in FY 1994 was only
750 thousand dollars. The Marine Corps had allotted more

19
money for the EBP program in 1978.16 After FY 1994, the EBP
budget increased each year until it reached more than 6
million dollars in FY 2000. The EBP budget for FY 1978
through FY 1981 and FY 1994 through FY 2005 are shown in
Table 8.
Table 8. EBP budget (FY78-FY81 & FY94-FY05)
(Source: HQMC, M&RA, Enlisted Plans Section)
In FY 1999 the EBP offered two types of shipping
bonuses: a 2,000 dollar bonus for shipping in the months of
June through November and a 3,000 dollar bonus for shipping
in the months of December through May. The intent was that
recruiters typically had more difficulty finding applicants
to ship to recruit training between December and May, so a
16 The actual budgets for the EBP in the late 1970’s were not
available, so this study multiplied the bonus amounts by the number of allocations to determine the EBP budgets in the late 1970’s. The EBP budgets in the late 1970’s were more than 6 million dollars.
Budget for Enlisted Bonus Program
Fiscal Year Budget (millions) Fiscal Year Budget (millions)
FY78 7.350a FY98 2.75
FY79 7.486a FY99 5.204
FY80 7.80a FY00 6.729
FY81 10.685a FY01 6.655
FY94 .750 FY02 6.995
FY95 1.355 FY03 8.49
FY96 3.12 FY04 9.416
FY97 3.615 FY05 5.802
a: The actual budget for the EBP was not available, so the bonus amountwas multiplied by the number of allocations to determine the EBP budget.

20
higher shipping bonus was offered in those months. In
addition there were five enlistment programs that qualified
for a bonus in FY 1999: the Aircrew Enlistment program,
Electronics Maintenance program, Aviation Operations
program, Fire Direction & Control Specialist program, and
the Cryptologic Linguist program. In FY 2000 the Aircrew
Enlistment program was dropped and the Public Affairs
program and the Aviation Electronics Technician program
were added to the EBP. The Marine Corps EBP program
remained virtually unchanged for several years, as shown in
Tables 9 and 10. The only change was the number of bonuses
allocated each year. According to an official at MCRC, the
Marine Corps was consistently meeting its recruiting goal
and the EBP had a limited budget, so manpower officials
chose not to make any changes to EBP.
Table 9. FY 2005 Enlistment Programs with Bonuses
(Source: MCRC, End of FY recruiting report)
Allocations per fiscal year Bonus
Program
Dollar
Value Term
FY99 FY00 FY01 FY02 FY03 FY04 FY05
Electronic
Maintenance 5,000 5 b 431 500 529 578 412 644
Aviation
Operations 4,000 5 b 85 120 118 124 108 134
Public
Affairs 4,000 4 _ 15 15 12 35 18 31
Fire Dir &
Ctrl Spec 6,000 4 b 187 210 196 178 143 192
Crypto
Linguist 4,000 5 b 24 50 50 109 71 106
Aviation
Elect Tech 3,000 5 _ 539 650 594 490 475 543
Aircrew Opt 3,000 a b _ _ _ _ _ _
National
Call to
Service
c 2 _ _ _ _ _ _ 240
a Length of term not available. b Bonus offered, but number of allocation not available. c Applicants selected one of the following four incentives: $5,000 bonus or $10,000 student loan repayment or 12 month education allowance or 36 month education allowance at ½ monthly rate.

21
Table 10. FY 1999 – FY 2005 EBP (Shipping Bonus)
(Source: MCRC, End of FY recruiting report)
Major revisions were made in the EBP in FY 2006
through FY 2008. There are several reasons that led to
revising the EBP, but the main contributor was the increase
in recruiting goals to meet the Marine Corps’ new end
strength. In 2006 plans were made to increase the Marine
Corps end strength from approximately 181,000 in FY 2006 to
202,000 in FY 2011. Increasing end strength required
increasing the annual recruiting goals, as shown in Table
11.
Table 11. Marine Corps end strength and accession missions.
Marine Corps Active
Duty Force
FY07 FY08 FY09 FY10 FY11
End Strength Goal 184,000 189,000 194,000 199,000 202,000
Enlisted Strength 166,783 172,489 178,663 181,180 180,865
Enlisted Accession
Mission 35,576 37,967 39,800 40,400 41,400
Officer Accession
Mission 1,975 2,220 2,370 2,428 2,277
Reenlistment
Mission 16,098 17,631 18,100 18,400 18,700
(Source: HQMC, M&RA, Enlisted Plans Section)
Shipping Bonus
Allocations per fiscal year
Time Period Dollar Amount FY99 FY00 FY01 FY02 FY03 FY04 FY05
Dec-May $3,000 a 1327 a 1154 1248 1480 456
Jun–Nov $2,000 a 555 a 956 161 56 35 a Shipping bonus offered, but number of allocations not available.

22
Increasing the recruiting goals encouraged officials
at MPP-20 and MCRC to take a hard look at the current
incentive programs, which led to increases in the EBP
budget. At the end of FY 2006, MPP-20 and MCRC determined
that changes needed to be made in the EBP to increase its
effectiveness. One requirement was that MPP-20 and MCRC
conduct an annual review of the EBP. This ensured that MPP-
20 received adequate feedback from the recruiters. In
addition, recruiters were given the opportunity to
recommend incentives they thought would be most beneficial
in meeting recruiting goals. Furthermore, increasing the
EBP budget gave MPP-20 the flexibility to develop a more
versatile program. The FY 2007 EBP budget increased from
10.6 million dollars to 47 million dollars in January 2007,
as shown in Table 12.
Table 12. FY 2005 through FY 2008 EBP budget
Marine Corps EBP Budget
Fiscal Year Budget in millions
FY05 5.802
FY06 6.257
FY07 47a
FY08 81 a Initial budget was 10.6, increased to 47 in January 2007.
(Source: HQMC, M&RA, Enlisted Plans Section)
The end of FY 2005 marked the beginning of the major
revisions in the Marine Corps’ EBP. The EBP went from seven
enlistment programs in FY 2005 to fourteen enlistment
programs eligible for a bonus in FY 2007. The maximum value
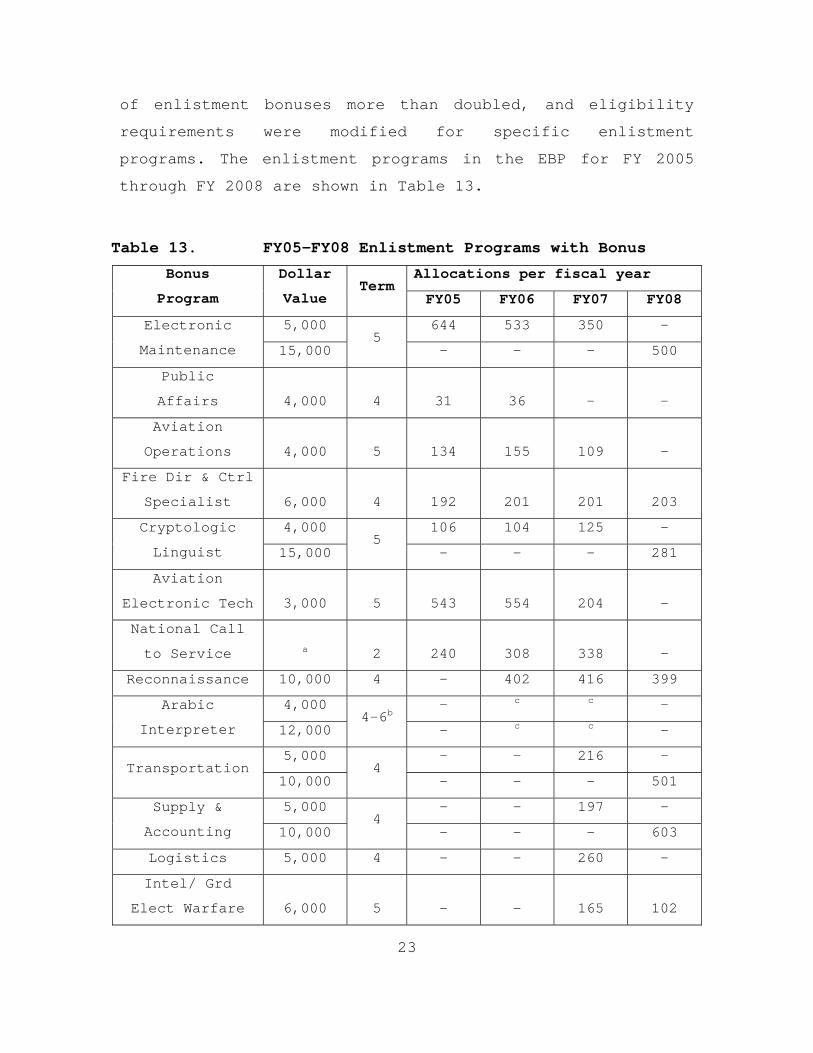
23
of enlistment bonuses more than doubled, and eligibility
requirements were modified for specific enlistment
programs. The enlistment programs in the EBP for FY 2005
through FY 2008 are shown in Table 13.
Table 13. FY05-FY08 Enlistment Programs with Bonus
Allocations per fiscal year Bonus
Program
Dollar
Value Term
FY05 FY06 FY07 FY08
5,000 644 533 350 - Electronic
Maintenance 15,000 5
- - - 500
Public
Affairs 4,000 4 31 36 - -
Aviation
Operations 4,000 5 134 155 109 -
Fire Dir & Ctrl
Specialist 6,000 4 192 201 201 203
4,000 106 104 125 - Cryptologic
Linguist 15,000 5
- - - 281
Aviation
Electronic Tech 3,000 5 543 554 204 -
National Call
to Service a 2 240 308 338 -
Reconnaissance 10,000 4 - 402 416 399
4,000 - c c - Arabic
Interpreter 12,000 4-6b
- c c -
5,000 - - 216 - Transportation
10,000 4
- - - 501
5,000 - - 197 - Supply &
Accounting 10,000 4
- - - 603
Logistics 5,000 4 - - 260 -
Intel/ Grd
Elect Warfare 6,000 5 - - 165 102
24
Allocations per fiscal year Bonus
Program
Dollar
Value Term
FY05 FY06 FY07 FY08
Command & Ctrl
Electrician 10,000 4 - - - 625
7,500 5 - - - 900 Infantry
15,000 6 - - - 300
Marine Corps
Music 10,000 4 - - c 36
X1d 10,000 - - 1028 - a Four incentives to choose from: $5,000 bonus or $10,000 student ln
repayment or 12 month education allowance or 36 month education
allowance (½ monthly rate). b Term of enlistment depended on enlistment program selected. c Bonus offered, but number of allocations not available. d Targeted bonus to entice applicants to enlist in critically low
programs (Supply/Acct, Transportation, Communications, Electronic/Data
program) and ship to recruit training in Aug-Sep 2007.
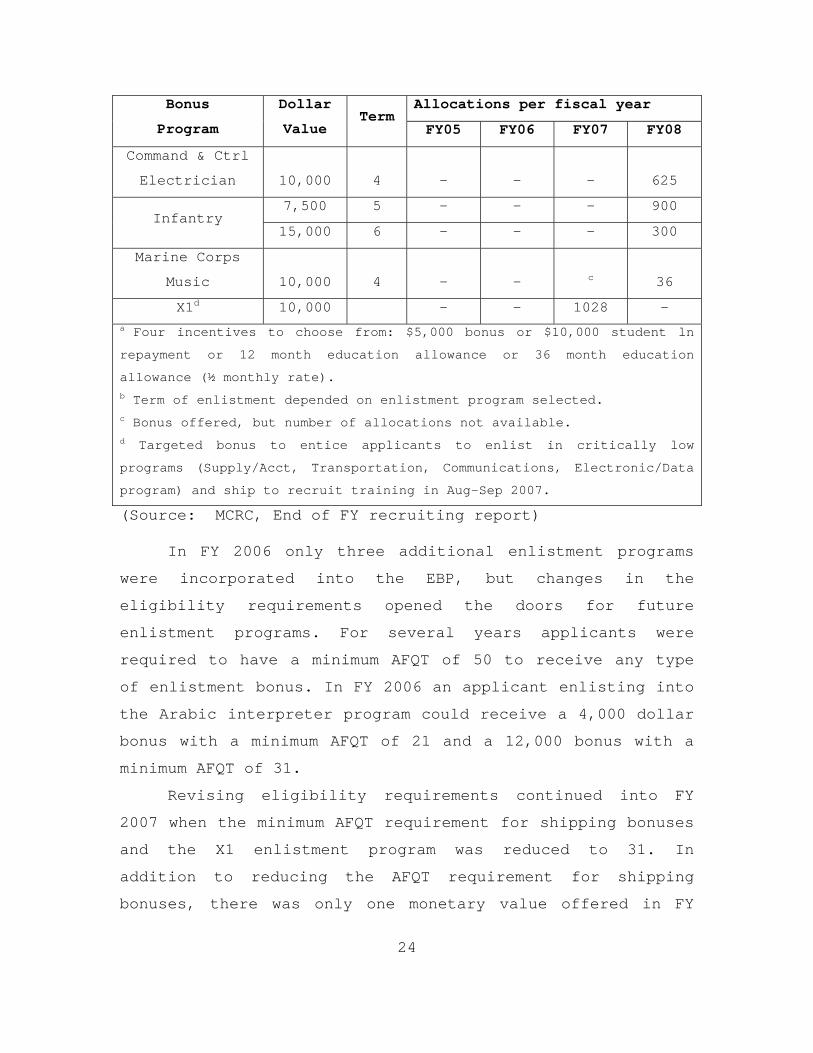
(Source: MCRC, End of FY recruiting report) In FY 2006 only three additional enlistment programs
were incorporated into the EBP, but changes in the
eligibility requirements opened the doors for future
enlistment programs. For several years applicants were
required to have a minimum AFQT of 50 to receive any type
of enlistment bonus. In FY 2006 an applicant enlisting into
the Arabic interpreter program could receive a 4,000 dollar
bonus with a minimum AFQT of 21 and a 12,000 bonus with a
minimum AFQT of 31.
Revising eligibility requirements continued into FY
2007 when the minimum AFQT requirement for shipping bonuses
and the X1 enlistment program was reduced to 31. In
addition to reducing the AFQT requirement for shipping
bonuses, there was only one monetary value offered in FY

25
2007.17 It was a 3,000 dollar shipping bonus that could be
offered for any month in FY 2007. Furthermore, the number
of shipping bonuses allocated in FY 2007 was significantly
higher than in previous years. Table 14 provides the
shipping bonuses for FY 2005 through FY 2008.
Table 14. FY05-FY08 Shipping Bonuses
Allocations per fiscal year Time
Period
Dollar
Amount FY05 FY06 FY07 FY08
Dec-May $3,000 456 562 - -
Jun–Nov $2,000 35 323 - -
$3,000 - - 10945 - All Year
$5,000 - - - 7300
(Source: MCRC, End of FY recruiting report) The X1 program in FY 2007 was unique. It was a 10,000
dollar targeted enlistment bonus incorporated mid-year to
entice applicants to enlist into critically low enlistment
programs and ship to recruit training in August through
September 2007. The programs offering the bonus were Supply
and Accounting, Transportation, Communications, and
Electronic Data. The Supply and Accounting program and
Transportation program already offered a 5,000 dollar bonus
in FY 2007, but the programs required a minimum AFQT of 50.
The X1 program aided in enlisting 935 applicants into four
critically short enlistment programs. In addition to the X1
program, three more enlistment programs were incorporated
into the EBP in FY 2007, as shown in Table 13.
17 In previous years there was a 3,000 dollar shipping bonus for
shipping to recruit training in December through May and a 2,000 dollar shipping bonus for shipping to recruit training in June through November (MCRC, End of year reports).
26
In FY 2008, MPP-20 and MCRC continued to revise the
EBP. Enlistment programs that they determined did not
require an enlistment bonus for FY 2008 was removed from
the EBP and that money was diverted to other enlistment
programs, as shown in Table 12. MPP-20 and MCRC also
reviewed the requirements for all enlistment programs in
the EBP and decided to revise the enlistment bonus
requirements for three enlistment programs. The minimum
AFQT requirement was reduced for the Transportation, Supply
and Accounting and the Command and Control/Electrician
programs. The intent behind the revision is to give
applicants who are qualified for a critically low
enlistment program, but not qualified for an enlistment
bonus, an incentive to select critically low enlistment
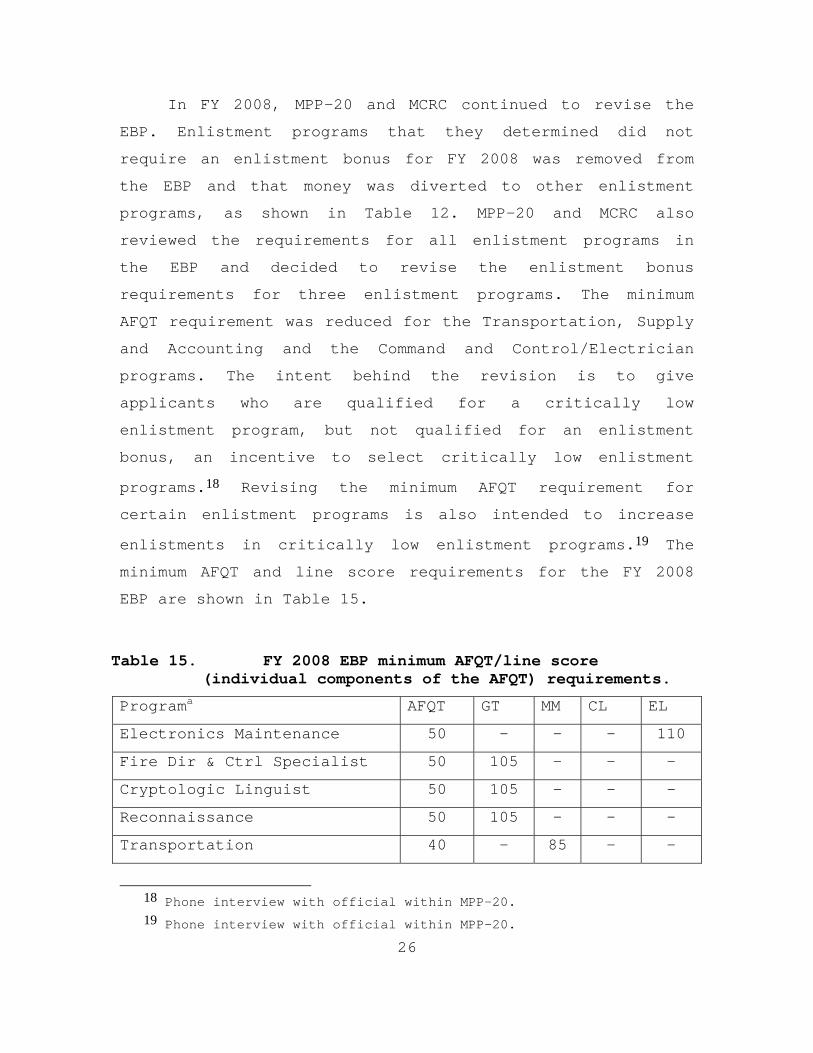
programs.18 Revising the minimum AFQT requirement for
certain enlistment programs is also intended to increase
enlistments in critically low enlistment programs.19 The
minimum AFQT and line score requirements for the FY 2008
EBP are shown in Table 15.
Table 15. FY 2008 EBP minimum AFQT/line score (individual components of the AFQT) requirements.
Programa AFQT GT MM CL EL
Electronics Maintenance 50 - - - 110
Fire Dir & Ctrl Specialist 50 105 - - -
Cryptologic Linguist 50 105 - - -
Reconnaissance 50 105 - - -
Transportation 40 - 85 - -
18 Phone interview with official within MPP-20. 19 Phone interview with official within MPP-20.

27
Supply/Acct. 40 - - 105 -
Intel/ Grd Elect Warfare 50 100 - - -
Command & Ctrl Electrician 40 - - - 95
Infantry ($15,000) 50 100 - - -
Infantry ($7,500) 50 90 - - -
Music 50 - - - -
Shipping Bonus 31 - - - - a This table only provides the ASVAB requirements. There are additional requirements
specific to each enlistment program an applicant must meet to be eligible for the EBP.
(Source: MCRC, Statement of Understanding for Enlistment Incentives)

28
THIS PAGE INTENTIONALLY LEFT BLANK

29
III. LITERATURE REVIEW
Since the inception of the all-volunteer force in
1973, the United States Armed Forces has been offering
competitive compensation packages in order to recruit
enough volunteers (Warner & Asch, 2001). Aside from
increasing military basic pay, the services increased the
use of monetary incentives to attract recruit-age youths.20
There have been numerous studies on military enlistment
bonuses, but this study found only one study on Marine
Corps enlistment bonuses. The lack of Marine Corps studies
could be due to the fact that the incentive programs in the
Marine Corps have been relatively small, making it
difficult to estimate bonus effects.
A. METHODOLOGIES OF PREVIOUS STUDIES
The methodologies of previous studies have varied, but
generally they used regression analysis on historical data
or analysis of survey responses. The advantage of
historical data is that it tends to be readily available
and it captures real choices with binding decisions. In
addition, researchers can infer which of the available
incentives is the most popular by analyzing the choices of
enlistees (Kraus, Griffis, & Golfin, 2000). One drawback is
that historical data provides information only on people
who joined the military and cannot be used to evaluate the
effectiveness of incentives never accepted. The drawback to
surveys is that applicable surveys are not always
available; and developing surveys and collecting the data
20 Recruit age youths are normally categorized as 17-21.

30
can be time-intensive and costly. The benefit of surveys is
that researchers can learn which incentives are preferred
by recruit-age youths. Because only opinions rather than
actions are involved, surveys can include incentives not
offered as well as those already in use (Palomba, 1983).
The remainder of this chapter will provide summaries of the
results of previous studies on enlistment bonuses.
B. SURVEYS
Surveys used to analyze monetary incentives vary in
complexity, but they typically gather data from either the
civilian youth population or military recruits. An
advantage to collecting information from military recruits
or enlistees is that they are more accessible and they are
familiar with military programs. Recruits and enlistees can
also provide insight into why they chose to enlist, what
they would have done in the absence of an incentive, and
what decisions they would have made if other incentives had
been offered. Information from military recruits is
beneficial when trying to determine how to channel
applicants into critically short enlistment programs
(Kraus, Griffis, & Golfin, 2000). However, since military
recruits chose to enlist they can not provide information
as to why others chose not to enlist. The advantage to
collecting information from the civilian youth population
is that they can provide insight into why people choose not
to enlist and what incentives would encourage them to
consider enlisting in the military. Collecting information
from the civilian youth population is very useful when
military services are trying to expand their recruiting
market (Kraus, Griffis, & Golfin, 2000).

31
1. Survey Data from Marine Corps Enlistees
Catherine A. Palomba conducted a study on the Marine
Corps enlistment bonus program in 1983. By analyzing survey
data the author was able to determine the effect of the EBP
on enlistment supply. The survey was conducted by the Rand
Corporation in 1979 and administered to Marine Corps
enlistees at the military entrance processing station
(Palomba, 1983). The survey consisted of four different
forms with three to four questions on each form. The author
chose to use form-1 and form-3 because they were deemed
most relevant to the study (Palomba, 1983). The questions
on form-1 and form-3 were identical except form-1 had one
additional question. Approximately 937 enlistees completed
form-1 and 898 enlistees completed form-3 (Palomba, 1983).
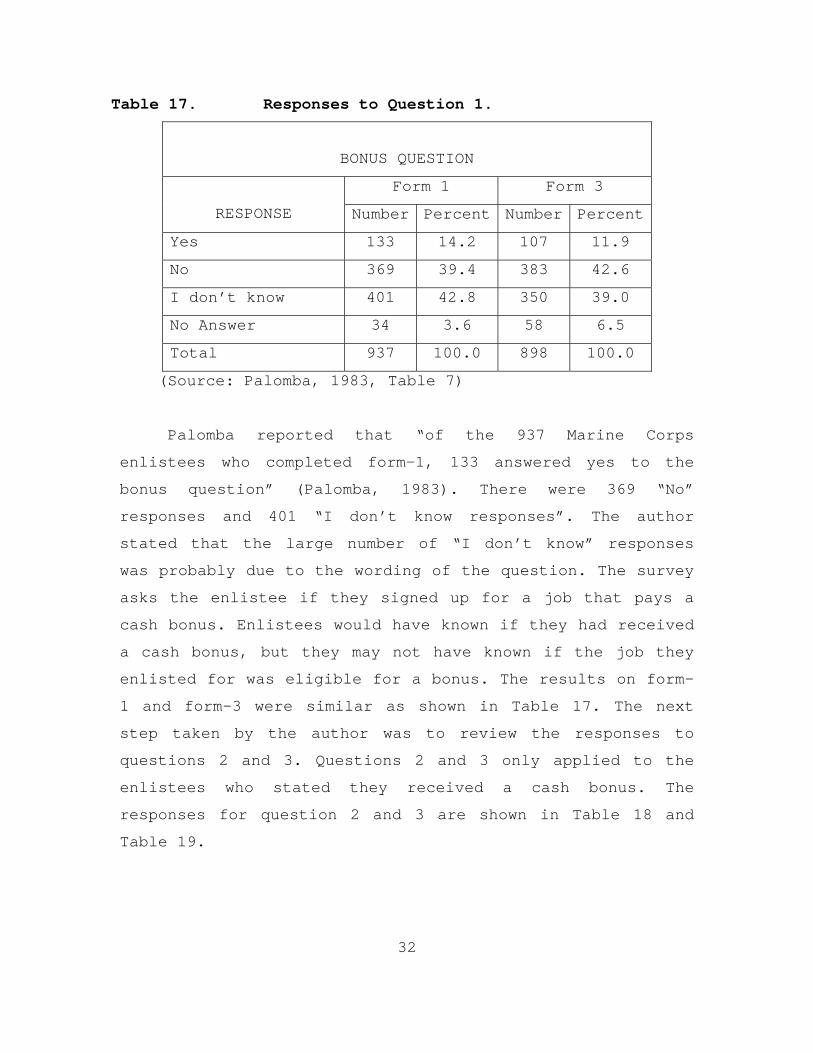
The survey questions used in the study are provided in
Table 16 and the responses to the first question are
provided in Table 17.
Table 16. Survey Questions
1. Did you sign up for a job which pays a cash enlistment bonus when you complete your job training? (Yes, No, I don’t know) 2. How much is your bonus? (500, 1000, 1500, 2000, 2500, 3000) 3. Suppose the job you signed up for did not pay a cash bonus. What would you have done? (Same service/same job, Same service/different job, Different service, Not enlisted) 4. If you could choose the length of your first enlistment how many years of active duty would you sign up for?a
(Less than 4 years, 4 years or more) a Question 4 was only on form-1. (Source: Palomba, 1983)
32
Table 17. Responses to Question 1.
BONUS QUESTION
Form 1 Form 3
RESPONSE Number Percent Number Percent
Yes 133 14.2 107 11.9
No 369 39.4 383 42.6
I don’t know 401 42.8 350 39.0
No Answer 34 3.6 58 6.5
Total 937 100.0 898 100.0
(Source: Palomba, 1983, Table 7)
Palomba reported that “of the 937 Marine Corps
enlistees who completed form-1, 133 answered yes to the
bonus question” (Palomba, 1983). There were 369 “No”
responses and 401 “I don’t know responses”. The author
stated that the large number of “I don’t know” responses
was probably due to the wording of the question. The survey
asks the enlistee if they signed up for a job that pays a
cash bonus. Enlistees would have known if they had received
a cash bonus, but they may not have known if the job they
enlisted for was eligible for a bonus. The results on form-
1 and form-3 were similar as shown in Table 17. The next
step taken by the author was to review the responses to
questions 2 and 3. Questions 2 and 3 only applied to the
enlistees who stated they received a cash bonus. The
responses for question 2 and 3 are shown in Table 18 and
Table 19.
33
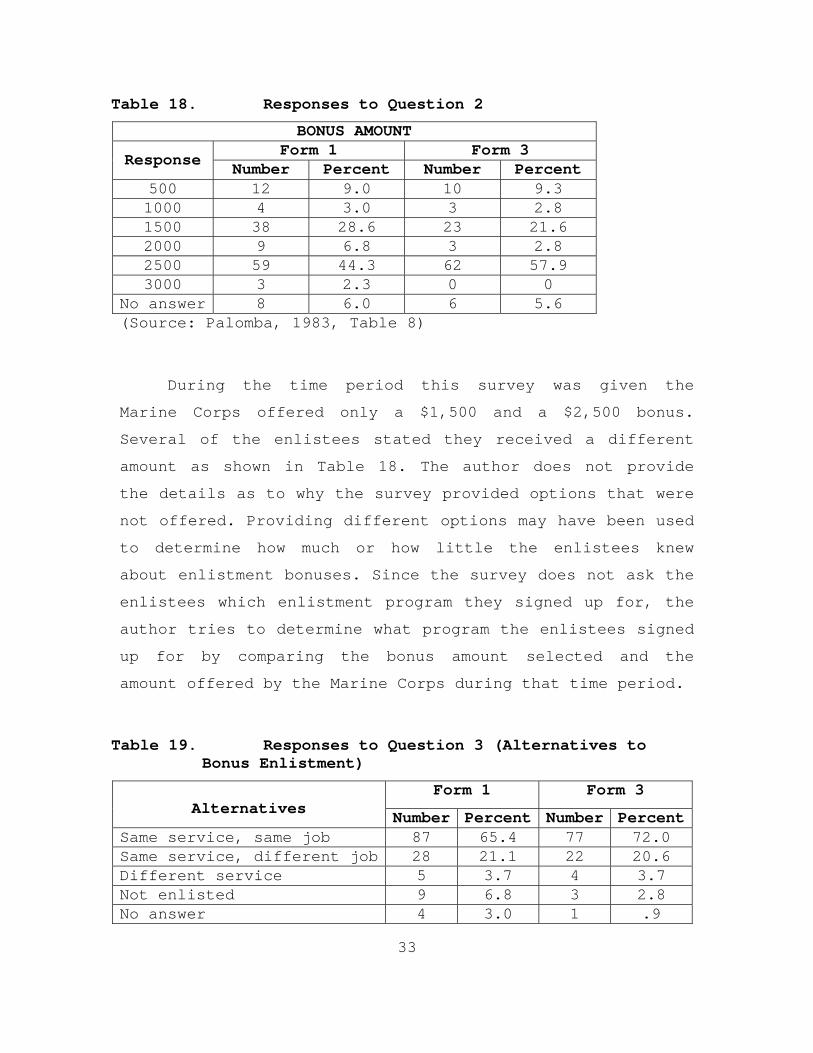
Table 18. Responses to Question 2
BONUS AMOUNTForm 1 Form 3
Response Number Percent Number Percent 500 12 9.0 10 9.3 1000 4 3.0 3 2.8 1500 38 28.6 23 21.6 2000 9 6.8 3 2.8 2500 59 44.3 62 57.9 3000 3 2.3 0 0
No answer 8 6.0 6 5.6 (Source: Palomba, 1983, Table 8)
During the time period this survey was given the
Marine Corps offered only a $1,500 and a $2,500 bonus.
Several of the enlistees stated they received a different
amount as shown in Table 18. The author does not provide
the details as to why the survey provided options that were
not offered. Providing different options may have been used
to determine how much or how little the enlistees knew
about enlistment bonuses. Since the survey does not ask the
enlistees which enlistment program they signed up for, the
author tries to determine what program the enlistees signed
up for by comparing the bonus amount selected and the
amount offered by the Marine Corps during that time period.
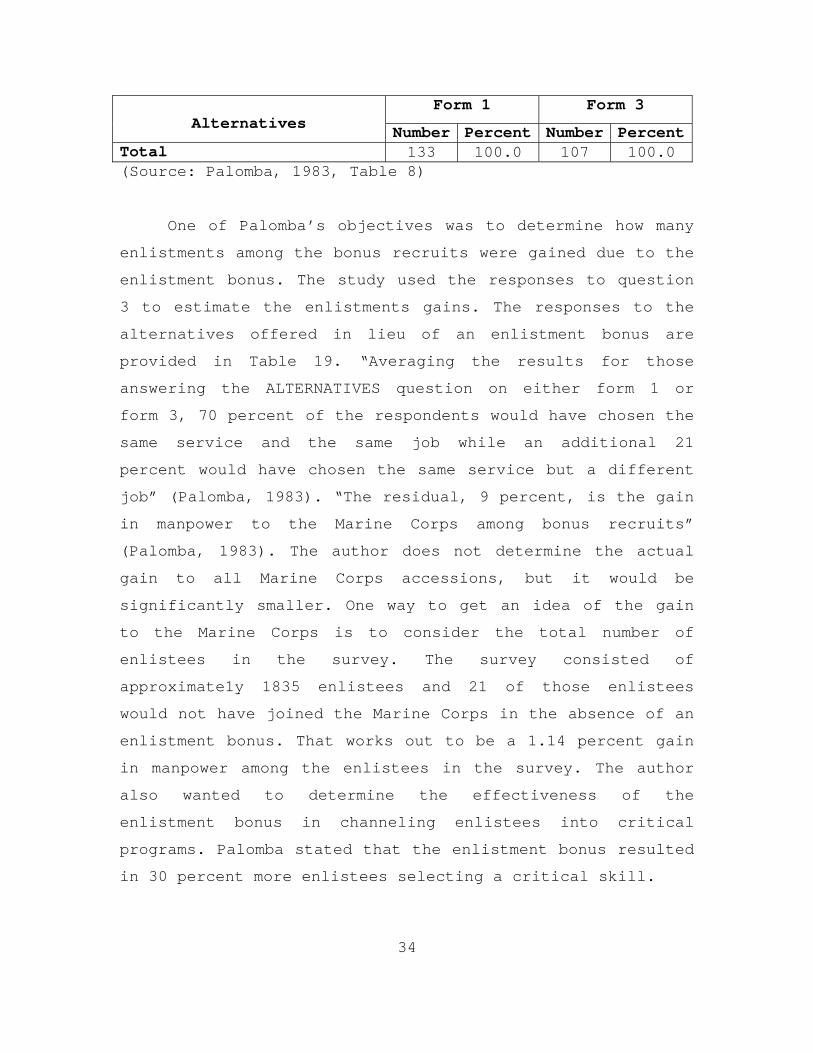
Table 19. Responses to Question 3 (Alternatives to Bonus Enlistment)
Form 1 Form 3 Alternatives Number Percent Number Percent
Same service, same job 87 65.4 77 72.0 Same service, different job 28 21.1 22 20.6 Different service 5 3.7 4 3.7 Not enlisted 9 6.8 3 2.8 No answer 4 3.0 1 .9
34
Form 1 Form 3 Alternatives Number Percent Number Percent
Total 133 100.0 107 100.0 (Source: Palomba, 1983, Table 8)
One of Palomba’s objectives was to determine how many
enlistments among the bonus recruits were gained due to the
enlistment bonus. The study used the responses to question
3 to estimate the enlistments gains. The responses to the
alternatives offered in lieu of an enlistment bonus are
provided in Table 19. “Averaging the results for those
answering the ALTERNATIVES question on either form 1 or
form 3, 70 percent of the respondents would have chosen the
same service and the same job while an additional 21
percent would have chosen the same service but a different
job” (Palomba, 1983). “The residual, 9 percent, is the gain
in manpower to the Marine Corps among bonus recruits”
(Palomba, 1983). The author does not determine the actual
gain to all Marine Corps accessions, but it would be
significantly smaller. One way to get an idea of the gain
to the Marine Corps is to consider the total number of
enlistees in the survey. The survey consisted of
approximate1y 1835 enlistees and 21 of those enlistees
would not have joined the Marine Corps in the absence of an
enlistment bonus. That works out to be a 1.14 percent gain
in manpower among the enlistees in the survey. The author
also wanted to determine the effectiveness of the
enlistment bonus in channeling enlistees into critical
programs. Palomba stated that the enlistment bonus resulted
in 30 percent more enlistees selecting a critical skill.
35
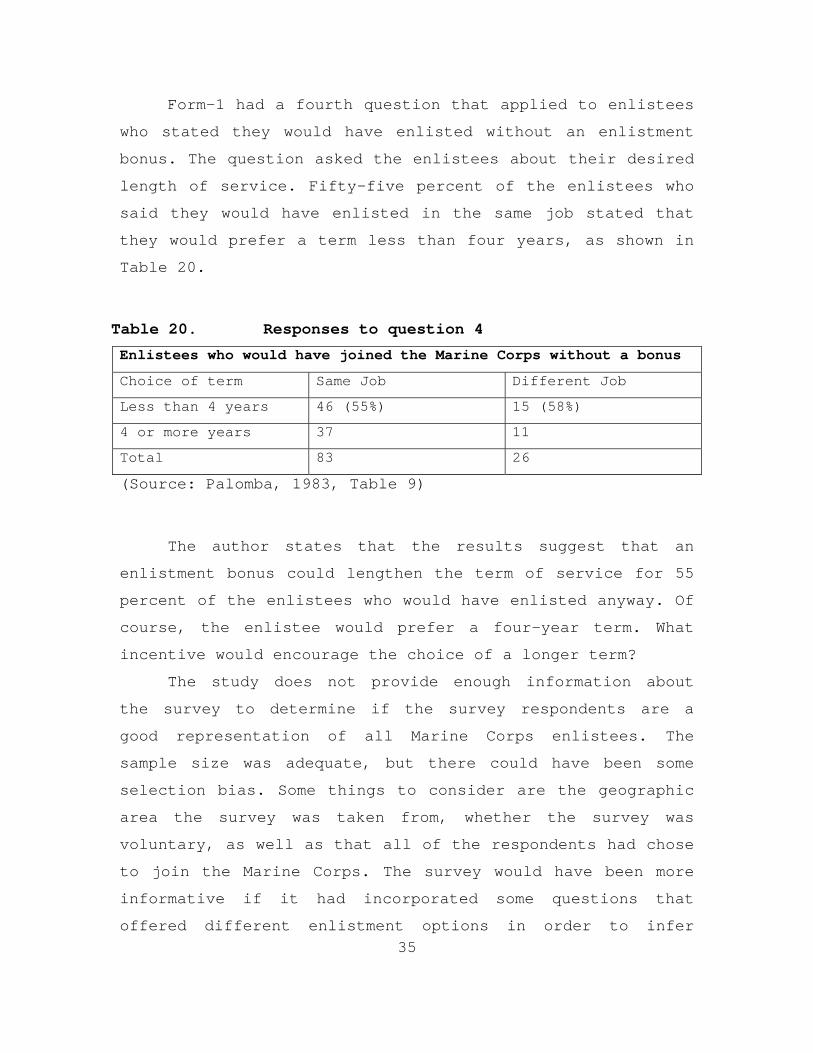
Form-1 had a fourth question that applied to enlistees
who stated they would have enlisted without an enlistment
bonus. The question asked the enlistees about their desired
length of service. Fifty-five percent of the enlistees who
said they would have enlisted in the same job stated that
they would prefer a term less than four years, as shown in
Table 20.
Table 20. Responses to question 4
Enlistees who would have joined the Marine Corps without a bonus
Choice of term Same Job Different Job
Less than 4 years 46 (55%) 15 (58%)
4 or more years 37 11
Total 83 26
(Source: Palomba, 1983, Table 9)
The author states that the results suggest that an
enlistment bonus could lengthen the term of service for 55
percent of the enlistees who would have enlisted anyway. Of
course, the enlistee would prefer a four-year term. What
incentive would encourage the choice of a longer term?
The study does not provide enough information about
the survey to determine if the survey respondents are a
good representation of all Marine Corps enlistees. The
sample size was adequate, but there could have been some
selection bias. Some things to consider are the geographic
area the survey was taken from, whether the survey was
voluntary, as well as that all of the respondents had chose
to join the Marine Corps. The survey would have been more
informative if it had incorporated some questions that
offered different enlistment options in order to infer
36
enlistee preferences. In all, the study did show that a
simple survey given to Marine Corps enlistees could provide
some useful feedback.
The nine percent gain to manpower among bonus
enlistees may show that enlistment bonuses are not a key
deciding factor to people joining the Marine Corps. This
supports the results of other studies. For example, a RAND
study conducted in 2000 looked at the effects of military
pay on high quality contracts. The RAND study determined
that the Marine Corps pay elasticity in relation to
accessions was significantly lower than that of the other
services (Asch, Hosek, Arkes, Fair, Sharp, and Totten,
2002)21. The authors’ results of a 30 percent gain in
critical enlistment programs shows that enlistment bonuses
can be a effective tool in channeling enlistees into
critically short enlistment programs. The study conducted
by Palomba also used pay elasticity to analyze Marine Corps
enlistment bonuses. That method will be discussed later in
the chapter.
2. Surveys from the Civilian Youth Population
CNA conducted a choice-based conjoint study of
recruitment incentives for the Navy Recruiting Command
(NRC) in 2000. The purpose of the study was to find new and
innovative incentive packages to attract a greater number
of high-quality applicants (Kraus, Griffis, & Golfin,
2000). CNA chose to use a market research approach over
using historical data because the authors stated that it
21 Table 2.2 of “Military Recruiting and Retention After the Fiscal
Year 2000 Military Pay Legislation” by Asch, Hosek, Arkes, Fair, Sharp, and Totten provides additional information.
37
provided two distinct advantages: “First, NRC wants to know
how to use larger financial incentives and new non-
financial incentives to expand its share of the employment
market” (Kraus, Griffis, & Golfin, 2000). Analysis of new
programs cannot be done using historical data. Second, the
market research approach allowed the authors to collect
information on young people who have not yet made an
enlistment decision (Kraus, Griffis, & Golfin, 2000).
A “conjoint analysis” is “a marketing research tool
that permits the user to analyze customer preferences among
competing products” (Joles, Charbonneau, & Barr, 1998). A
choice-based version has young people repeatedly select,
from a short list, which enlistment package they would
prefer. “The data generated from a survey allow inferences
to be drawn about people’s preferences for different
product attributes based on the choices they made on each
task” (Kraus, Griffis, & Golfin 2000).
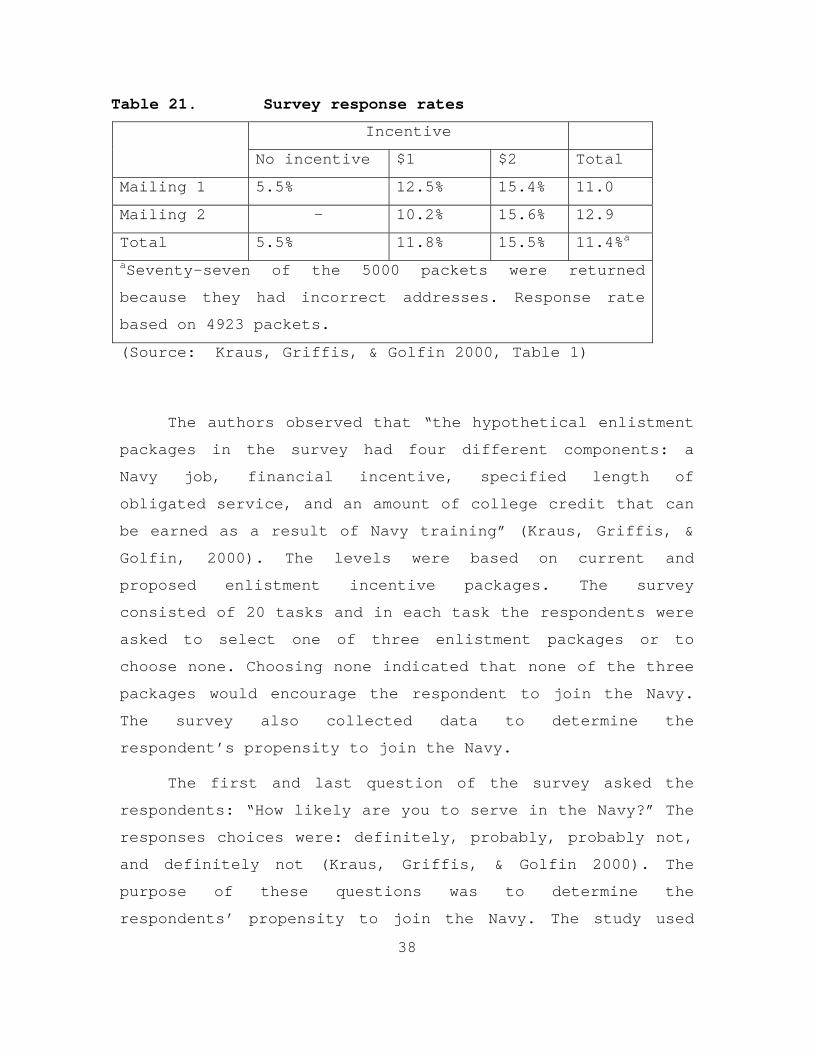
The survey was delivered in two mailings to 4,400 high
school students and 600 community college students. In
order to encourage response rates the authors offered a
monetary incentive. The first mailing consisted of 1,500
packets with a two-dollar incentive, 1000 packets with a
one-dollar incentive and 500 packets with no incentive
(Kraus, Griffis, & Golfin 2000). The authors decided to
offer an incentive for all of the packets in the second
mailing due to the low response rate of the no incentive
group in the first mailing. The response rates are provided
in Table 21.
38
Table 21. Survey response rates
Incentive
No incentive $1 $2 Total
Mailing 1 5.5% 12.5% 15.4% 11.0
Mailing 2 - 10.2% 15.6% 12.9
Total 5.5% 11.8% 15.5% 11.4%a
aSeventy-seven of the 5000 packets were returned
because they had incorrect addresses. Response rate
based on 4923 packets.
(Source: Kraus, Griffis, & Golfin 2000, Table 1)
The authors observed that “the hypothetical enlistment
packages in the survey had four different components: a
Navy job, financial incentive, specified length of
obligated service, and an amount of college credit that can
be earned as a result of Navy training” (Kraus, Griffis, &
Golfin, 2000). The levels were based on current and
proposed enlistment incentive packages. The survey
consisted of 20 tasks and in each task the respondents were
asked to select one of three enlistment packages or to
choose none. Choosing none indicated that none of the three
packages would encourage the respondent to join the Navy.
The survey also collected data to determine the
respondent’s propensity to join the Navy.
The first and last question of the survey asked the
respondents: “How likely are you to serve in the Navy?” The
responses choices were: definitely, probably, probably not,
and definitely not (Kraus, Griffis, & Golfin 2000). The
purpose of these questions was to determine the
respondents’ propensity to join the Navy. The study used
39
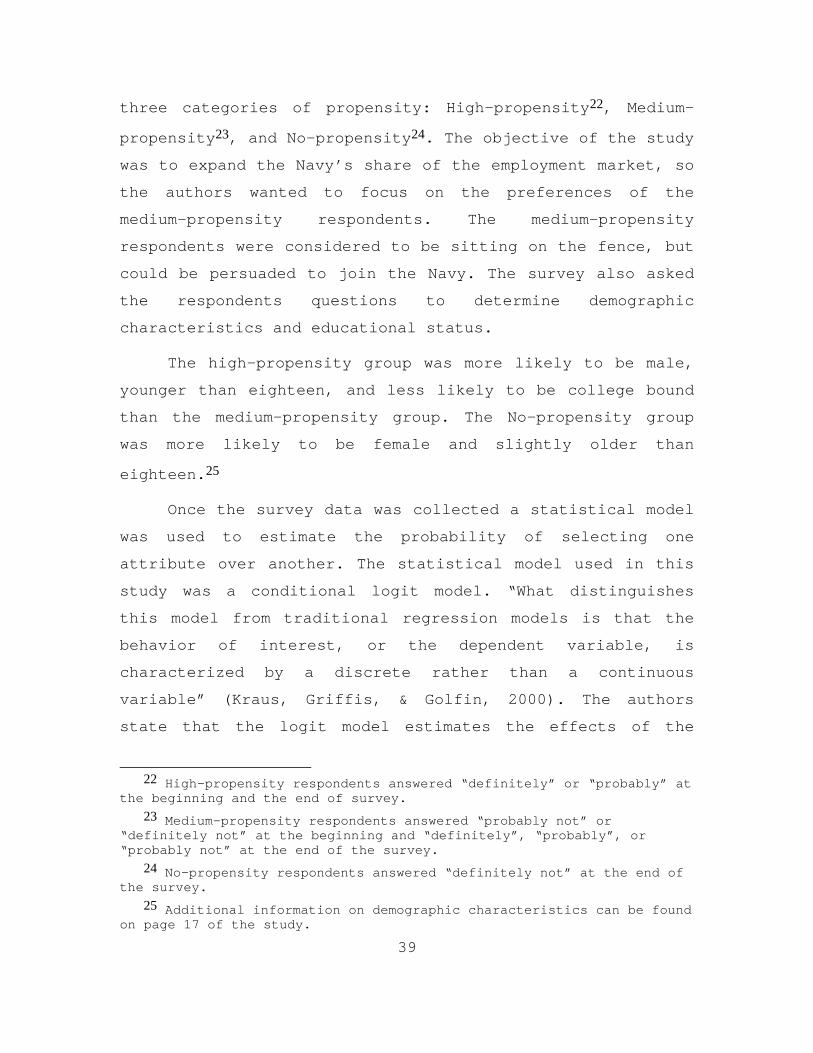
three categories of propensity: High-propensity22, Medium-
propensity23, and No-propensity24. The objective of the study
was to expand the Navy’s share of the employment market, so
the authors wanted to focus on the preferences of the
medium-propensity respondents. The medium-propensity
respondents were considered to be sitting on the fence, but
could be persuaded to join the Navy. The survey also asked
the respondents questions to determine demographic
characteristics and educational status.
The high-propensity group was more likely to be male,
younger than eighteen, and less likely to be college bound
than the medium-propensity group. The No-propensity group
was more likely to be female and slightly older than
eighteen.25
Once the survey data was collected a statistical model
was used to estimate the probability of selecting one
attribute over another. The statistical model used in this
study was a conditional logit model. “What distinguishes
this model from traditional regression models is that the
behavior of interest, or the dependent variable, is
characterized by a discrete rather than a continuous
variable” (Kraus, Griffis, & Golfin, 2000). The authors
state that the logit model estimates the effects of the
22 High-propensity respondents answered “definitely” or “probably” at
the beginning and the end of survey. 23 Medium-propensity respondents answered “probably not” or
“definitely not” at the beginning and “definitely”, “probably”, or “probably not” at the end of the survey.
24 No-propensity respondents answered “definitely not” at the end of the survey.
25 Additional information on demographic characteristics can be found on page 17 of the study.
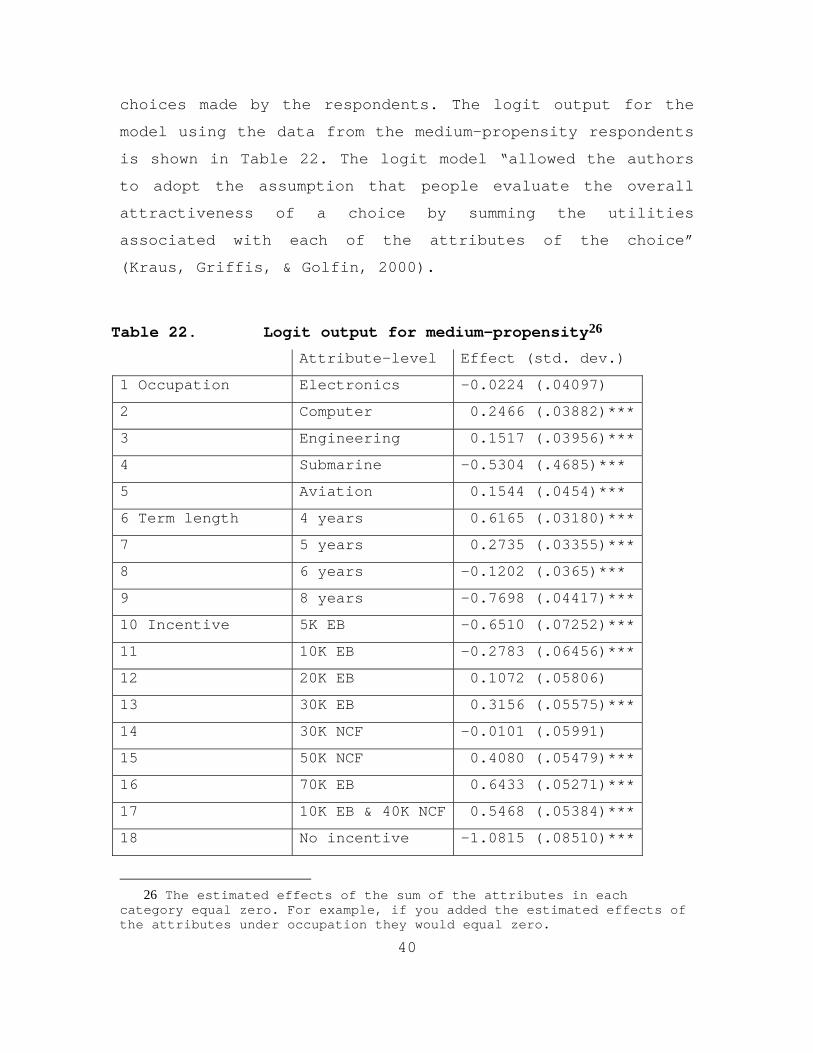
40
choices made by the respondents. The logit output for the
model using the data from the medium-propensity respondents
is shown in Table 22. The logit model “allowed the authors
to adopt the assumption that people evaluate the overall
attractiveness of a choice by summing the utilities
associated with each of the attributes of the choice”
(Kraus, Griffis, & Golfin, 2000).
Table 22. Logit output for medium-propensity26
Attribute-level Effect (std. dev.)
1 Occupation Electronics -0.0224 (.04097)
2 Computer 0.2466 (.03882)***
3 Engineering 0.1517 (.03956)***
4 Submarine -0.5304 (.4685)***
5 Aviation 0.1544 (.0454)***
6 Term length 4 years 0.6165 (.03180)***
7 5 years 0.2735 (.03355)***
8 6 years -0.1202 (.0365)***
9 8 years -0.7698 (.04417)***
10 Incentive 5K EB -0.6510 (.07252)***
11 10K EB -0.2783 (.06456)***
12 20K EB 0.1072 (.05806)
13 30K EB 0.3156 (.05575)***
14 30K NCF -0.0101 (.05991)
15 50K NCF 0.4080 (.05479)***
16 70K EB 0.6433 (.05271)***
17 10K EB & 40K NCF 0.5468 (.05384)***
18 No incentive -1.0815 (.08510)***
26 The estimated effects of the sum of the attributes in each
category equal zero. For example, if you added the estimated effects of the attributes under occupation they would equal zero.
41
Attribute-level Effect (std. dev.)
19 College credit <1 semester -0.3842 (.04487)***
20 1 semester -0.1743 (.04236)***
21 2 semesters -0.0608 (.04146)
22 3 semesters 0.2258 (.03896)***
23 4 semesters 0.3936 (.04041)***
24 None option None 0.7271 (.03313)***
*** indicates significance at the .01 level
(Source: Kraus, Griffis, & Golfin, 2000, Table 7)
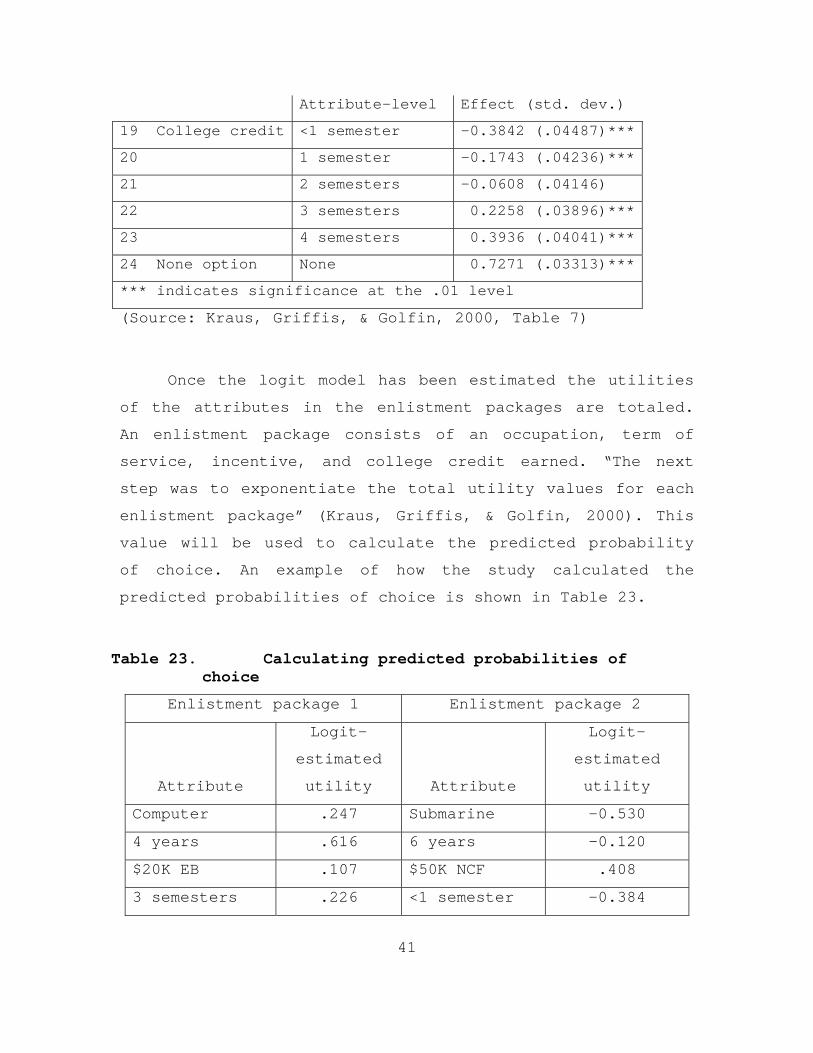
Once the logit model has been estimated the utilities
of the attributes in the enlistment packages are totaled.
An enlistment package consists of an occupation, term of
service, incentive, and college credit earned. “The next
step was to exponentiate the total utility values for each
enlistment package” (Kraus, Griffis, & Golfin, 2000). This
value will be used to calculate the predicted probability
of choice. An example of how the study calculated the
predicted probabilities of choice is shown in Table 23.
Table 23. Calculating predicted probabilities of choice
Enlistment package 1 Enlistment package 2
Attribute
Logit-
estimated
utility Attribute
Logit-
estimated
utility
Computer .247 Submarine -0.530
4 years .616 6 years -0.120
$20K EB .107 $50K NCF .408
3 semesters .226 <1 semester -0.384
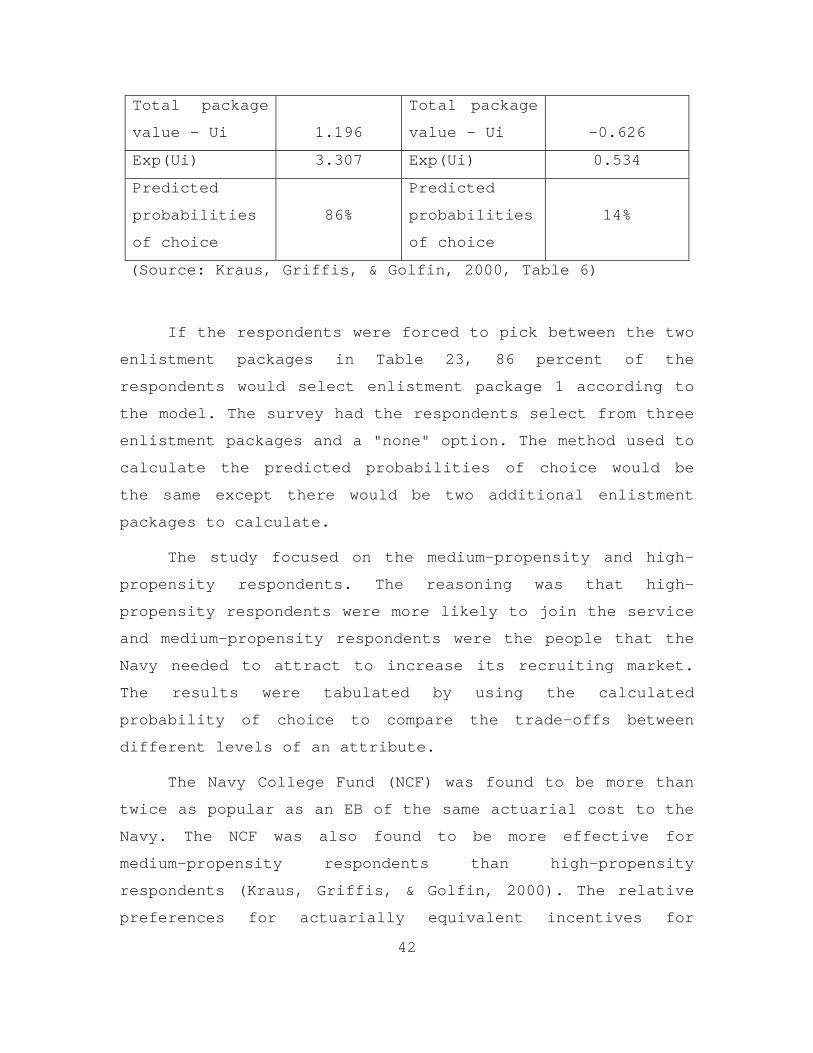
42
Total package
value – Ui 1.196
Total package
value – Ui -0.626
Exp(Ui) 3.307 Exp(Ui) 0.534
Predicted
probabilities
of choice
86%
Predicted
probabilities
of choice
14%
(Source: Kraus, Griffis, & Golfin, 2000, Table 6)
If the respondents were forced to pick between the two
enlistment packages in Table 23, 86 percent of the
respondents would select enlistment package 1 according to
the model. The survey had the respondents select from three
enlistment packages and a "none" option. The method used to
calculate the predicted probabilities of choice would be
the same except there would be two additional enlistment
packages to calculate.
The study focused on the medium-propensity and high-
propensity respondents. The reasoning was that high-
propensity respondents were more likely to join the service
and medium-propensity respondents were the people that the
Navy needed to attract to increase its recruiting market.
The results were tabulated by using the calculated
probability of choice to compare the trade-offs between
different levels of an attribute.
The Navy College Fund (NCF) was found to be more than
twice as popular as an EB of the same actuarial cost to the
Navy. The NCF was also found to be more effective for
medium-propensity respondents than high-propensity
respondents (Kraus, Griffis, & Golfin, 2000). The relative
preferences for actuarially equivalent incentives for
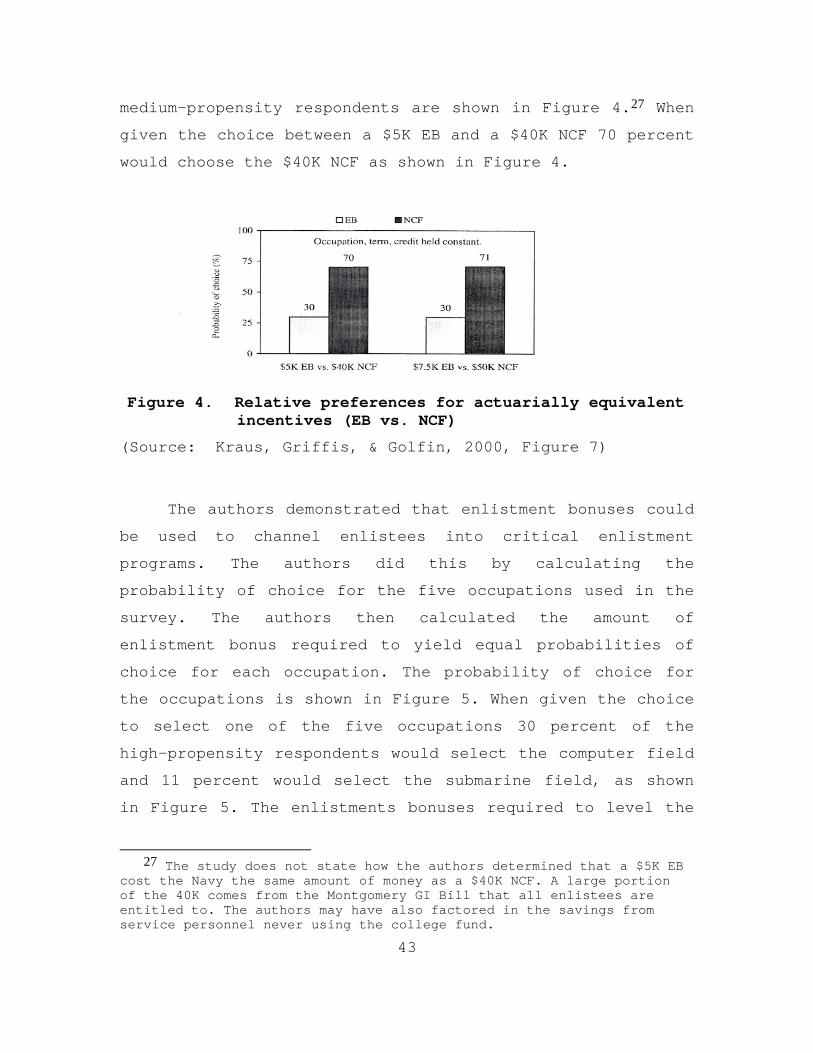
43
medium-propensity respondents are shown in Figure 4.27 When
given the choice between a $5K EB and a $40K NCF 70 percent
would choose the $40K NCF as shown in Figure 4.
Figure 4. Relative preferences for actuarially equivalent incentives (EB vs. NCF)
(Source: Kraus, Griffis, & Golfin, 2000, Figure 7)
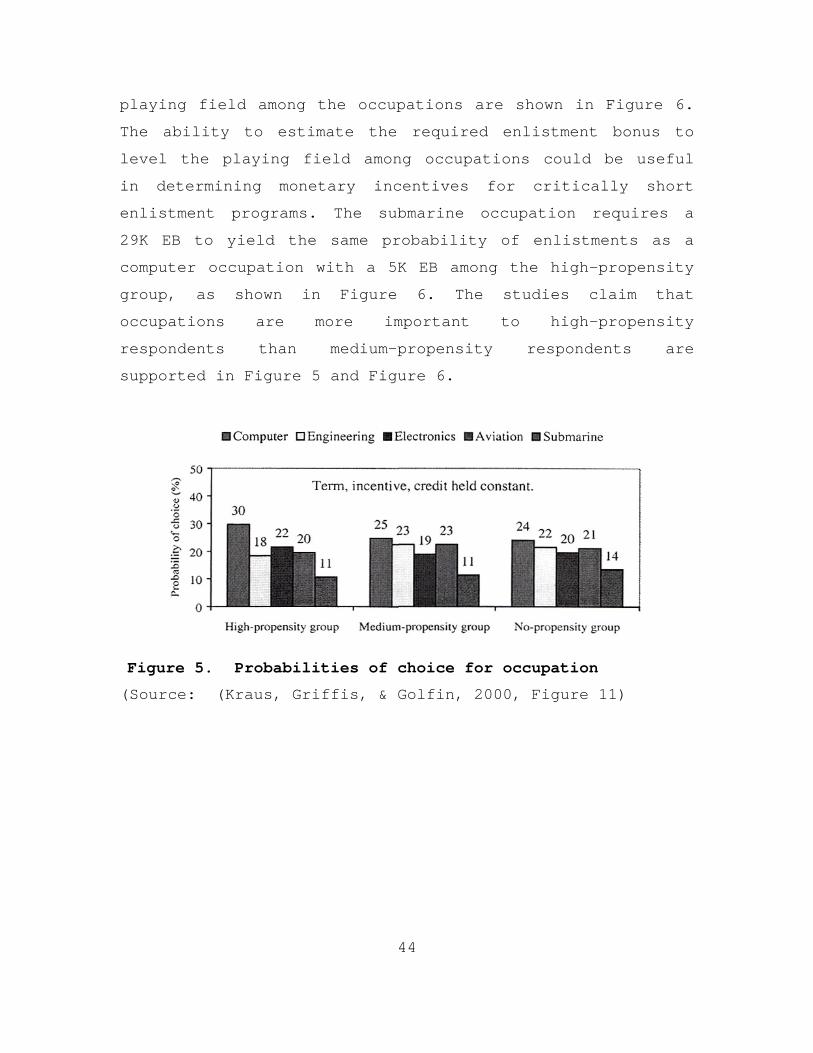
The authors demonstrated that enlistment bonuses could
be used to channel enlistees into critical enlistment
programs. The authors did this by calculating the
probability of choice for the five occupations used in the
survey. The authors then calculated the amount of
enlistment bonus required to yield equal probabilities of
choice for each occupation. The probability of choice for
the occupations is shown in Figure 5. When given the choice
to select one of the five occupations 30 percent of the
high-propensity respondents would select the computer field
and 11 percent would select the submarine field, as shown
in Figure 5. The enlistments bonuses required to level the
27 The study does not state how the authors determined that a $5K EB
cost the Navy the same amount of money as a $40K NCF. A large portion of the 40K comes from the Montgomery GI Bill that all enlistees are entitled to. The authors may have also factored in the savings from service personnel never using the college fund.
44
playing field among the occupations are shown in Figure 6.
The ability to estimate the required enlistment bonus to
level the playing field among occupations could be useful
in determining monetary incentives for critically short
enlistment programs. The submarine occupation requires a
29K EB to yield the same probability of enlistments as a
computer occupation with a 5K EB among the high-propensity
group, as shown in Figure 6. The studies claim that
occupations are more important to high-propensity
respondents than medium-propensity respondents are
supported in Figure 5 and Figure 6.
Figure 5. Probabilities of choice for occupation (Source: (Kraus, Griffis, & Golfin, 2000, Figure 11)

45
Figure 6. Enlistment bonuses that yield equal probabilities of choice
(Source: (Kraus, Griffis, & Golfin, 2000, Figure 12)
The study also compared the trade-offs between
offering larger enlistment bonuses and increasing the
length of obligated service. A six-year term required a
$20K EB to yield the same probability of choice as a four-
year term with a $5K EB among medium-propensity
respondents. The cost per year for a four-year term was
$1250 per year and the cost for a six-year term was $3333
per year. The trade-offs between larger EBs and one
additional year of service for the medium-propensity group
are provided in Figure 7.

46
Figure 7. Trade-offs between EBs and service terms (Source: (Kraus, Griffis, & Golfin, 2000, Figure 10)
The study also calculated the probability of choice
for college credit earned through Navy training. The study
stated that earning college credit was more important to
medium-propensity respondents than high-propensity
respondents. The study found that offering appropriate
college credit for Navy training had a large positive
effect on enlistment propensity (about 3 percent) and
increasing obligations by just one year had a substantial
negative effect on enlistment propensity (about 2
percentage points) (Kraus, Griffis, & Golfin, 2000). The
study recommended offering college-related incentives and
short obligations to target medium propensity youth (Kraus,
Griffis, & Golfin, 2000).
The results and findings of the study led to some
broad recommendations. The study provides some useful
insight on what type of enlistment packages would be
preferred by the respondents, but it does not state that
offering a certain EB or NCF would increase or decrease
47
enlistments by a given percentage. The authors stated that
they could predict enlistment propensity, but not the
changes in the number of enlistments. This study was
limited to five military occupations, however; actual
enlistees have many occupations to choose from.
Incorporating all of the occupations into the survey would
have increased the complexity of the study. The estimations
of this study were based on survey results from 497
respondents with 243 respondents considered to be medium-
propensity and 43 respondents considered to be high-
propensity respondents. The authors state that the
estimates for the medium-propensity respondents were
significant at the 1 percent level, but the authors do not
comment on the significance level of the estimations for
high-propensity respondents. The study did a lot of
comparisons between the medium-propensity and high-
propensity without commenting on the significance of the
estimates for the high-propensity respondents.
In all, the study demonstrated that the choice-based
conjoint analysis can be an effective tool in estimating
relative preferences. The ability to calculate the
incentives required to level the playing field among
occupations or terms would be beneficial to the Marine
Corps. The authors also demonstrated how the market
research approach allows researchers to analyze new and
existing incentives. This would be beneficial when trying
to expand the recruiting market.
Another study (An Enlistment Bonus Distribution Model
1988) conducted by Joles, Charboneau, and Barr used choice-
based conjoint analysis to develop an optimization model.
The objective was to use a mixed-integer programming model
48
to assist decision-makers in the efficient and effective
allocation of EB incentives (Joles, Charbonneau, & Barr,
1998).
This study used a survey conducted by the Urban
Studies Institute at the University of Louisville. “In 1996
the Army recruiting command contracted the University to
conduct a conjoint analysis study in order to better
understand the relationship of a mix of attributes in
recruitment packages” (Joles, Charbonneau, & Barr, 1998).
The Urban Studies Institute subcontracted with malls in
several cities to conduct mall-intercept surveys (Joles,
Charbonneau, & Barr, 1998). The authors stated that the
data obtained from the study demonstrated the potential of
choice-based analysis, but could not be used to make
reliable estimations of youth preferences.
The authors stated that non-feasible incentives were
offered and it was not clear if the subjects or even the
survey administrators understood the various enlistment
alternatives (Joles, Charbonneau, & Barr, 1998). The
authors also stated that illogical inferences were drawn
from the data collected (analysis suggests, for example
that, for an equivalent incentive package and MOS,
applicants would prefer a five-year term over a four-year
term) (Joles, Charbonneau, & Barr, 1998). In addition, the
survey consisted of only seven MOS choices.
The authors went ahead and developed an optimization
model to demonstrate the capability of integer programming
to predict optimal enlistment incentives. The software
available in this study limited the number of variables
that could be used. The available software and the lack of
adequate data prevented the authors from developing a model
49
that could predict optimal solutions. For this reason, this
study will not go into the details of the optimization
model used.
This study demonstrates the difficulty in obtaining
accurate survey data. One of the many challenges in
collecting survey data from the civilian population is the
lack of knowledge of military programs. Participants
understand the different lengths of terms, and college
program versus enlistment bonus, but occupational choices
can be more challenging. The study also shows that time and
resources invested in surveys can produce less than desired
results. This is another reason that some researchers
prefer to use historical data when analyzing enlistment
incentives.
C. HISTORICAL DATA
Researchers have used various regression analysis
methods to analyze the cost effectiveness and to estimate
the increase in accessions due to monetary incentives. The
pay elasticity approach is a common method used by
researchers to determine cost effectiveness and gains in
accessions due to monetary incentives. Researches also use
regression models to analyze the variation in monetary
incentives. This allows researchers to estimate the effect
that increasing the value or allocations of an enlistment
bonus will have on a particular enlistment program.
1. Pay Elasticity
As discussed previously, Catherine Palomba conducted a
study on Marine Corps enlistment bonuses in 1983, and in
addition to analyzing survey data, the study used pay

50
elasticity to determine the effect of enlistment bonuses.
The study estimated the effects of the TB and CB bonus on
enlistments in FY 1979. The author chose FY 1979 because
the survey data was collected in 1979 (Palomba, 1983).
The objective was to determine how many enlistments
were gained due to enlistment bonuses. The author started
by stating that the most recent estimates of pay elasticity
for the Marine Corps were in the range of .5 to .7 (Palomba
1983).28 Then the study determined the increment to pay
which, if received over 4 years, would have the same
discounted present value as the discounted present value of
the bonus (Palomba 1983). The pay increment was added to FY
1979 military and civilian pay figures to determine the
effect of the bonus on the military-to-civilian pay ratio.
Then the pay increment was multiplied by the pay elasticity
to obtain estimates of the enlistment supply effects
(Palomba 1983). The study chose to use .5 and 1 as the pay
elasticity for the Marine Corps. Assuming pay elasticity
equals 1, the estimated percentage increase in enlistments
were 0.69 percent for the TB and 0.84 percent for the CB.
The estimated percentage increase in enlistments was used
to calculate the number of new enlistments per 100 bonuses.
The calculations used to estimate the number of enlistments
per 100 bonuses is shown in Table 24. The TB resulted in an
additional 7 enlistments per 100 bonuses and the CB
resulted in an additional 12 enlistments per 100 bonuses as
shown in Table 24. Using a pay elasticity of .5 would
result in 3 to 4 new enlistments for the TB and 6 new
enlistments for the CB.
28 The author referenced a CNA study conducted in 1981.

51
Table 24. Enlistments per 100 bonuses
Bonus Typical
# of
recruits
Estimated
percentage
increase in
accessions
# of
recruits
gained
from
bonuses
Total #
of
bonuses
# of
recruits
gained
per 100
bonuses
1500
TB 10,000 .69% 69 1,000 7
2500
CB 10,000 .84% 84 700 12
The calculations were made using pay elasticity equals 1.
(Source: Palomba, Table c-2)
The pay elasticity method used in this study supports
the results of previous studies that suggest that monetary
incentives do not have a large impact on Marine Corps
enlistments. What the estimates do not show is the effect
the bonus had on channeling enlistees into the bonus
programs. The method also limits itself by looking at only
one year. Looking at more than one year may have produced
different results.
2. Multiple Regression Analysis
John Warner, Curtis Simon and Deborah Payne conducted
a study in 2001 that analyzed the college fund and other
enlistment incentives. Data for all four services was
collected for the period FY 1987 through FY 1996. This
research stated that during the time period studied, less
than 10 percent of Marine Corps enlistees received an
enlistment bonus and less than 5 percent benefitted from

52
the Marine Corps College Fund. (Warner, Simon, and Payne,
2001). Since the incentive program in the Marine Corps was
relatively small over the time period studied, the authors
stated that it was not feasible to obtain precise estimates
of the effects (Warner, Simon, and Payne, 2001).
In Chapter 7 of the study the authors looked at the
skill-channeling effects of enlistment bonuses. The authors
used multiple regression analysis to evaluate the
enlistment effects of a MOS being eligible or ineligible
for a monetary incentive. At the time this study was
conducted, Army enlistees could not receive both an
enlistment bonus and Army college fund benefit. The
analysis of skill channeling used 10 years of data and
within this period there were 16 period-to-period policy
combinations (Warner, Simon, and Payne, 2001).29 The number
of cells and contracts in each category are provided in
Table 25. Each cell represented a combination of MOS and
term of service. “Cells that had fewer than five contracts
were excluded from the database to eliminate scale effects
of small cells” (Warner, Simon, and Payne, 2001). This
reduced the observations in the database to 10,758.
29 “Example of policy combinations: ACF-on to ACF-off, EB-on to EB-
off, ACF-on to EB-on, and so on.” (Warner, Simon, and Payne 2001)
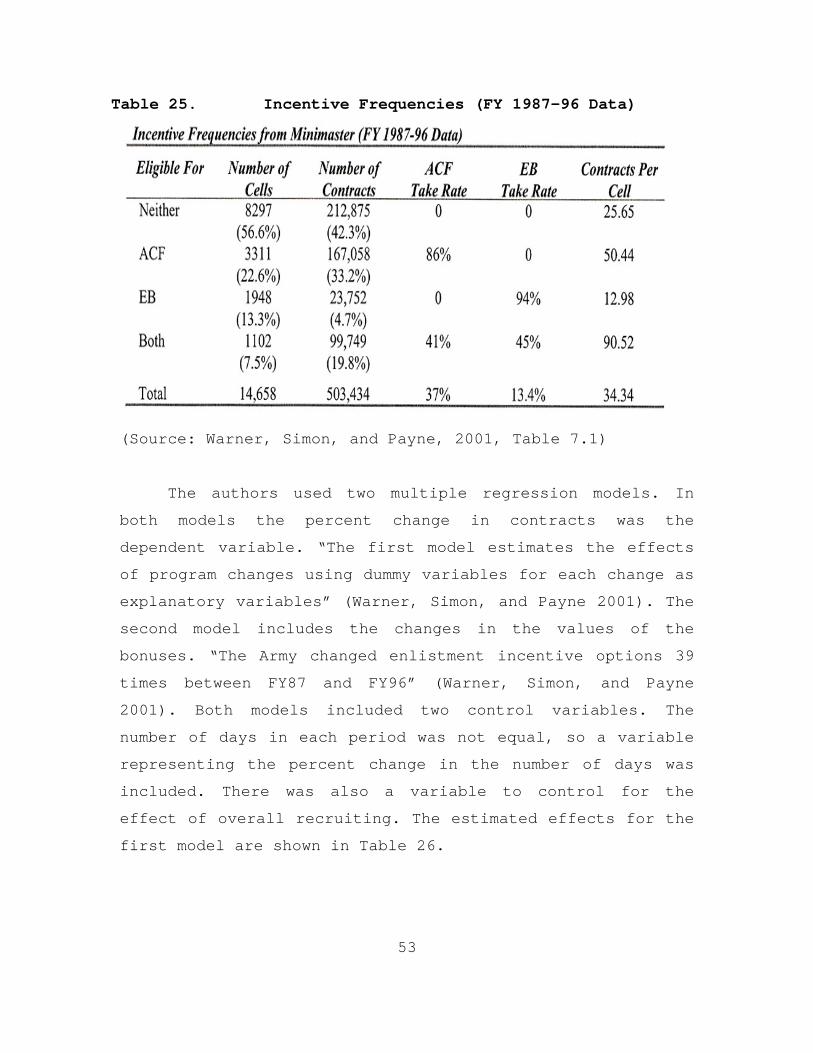
53
Table 25. Incentive Frequencies (FY 1987-96 Data)
(Source: Warner, Simon, and Payne, 2001, Table 7.1)
The authors used two multiple regression models. In
both models the percent change in contracts was the
dependent variable. “The first model estimates the effects
of program changes using dummy variables for each change as
explanatory variables” (Warner, Simon, and Payne 2001). The
second model includes the changes in the values of the
bonuses. “The Army changed enlistment incentive options 39
times between FY87 and FY96” (Warner, Simon, and Payne
2001). Both models included two control variables. The
number of days in each period was not equal, so a variable
representing the percent change in the number of days was
included. There was also a variable to control for the
effect of overall recruiting. The estimated effects for the
first model are shown in Table 26.
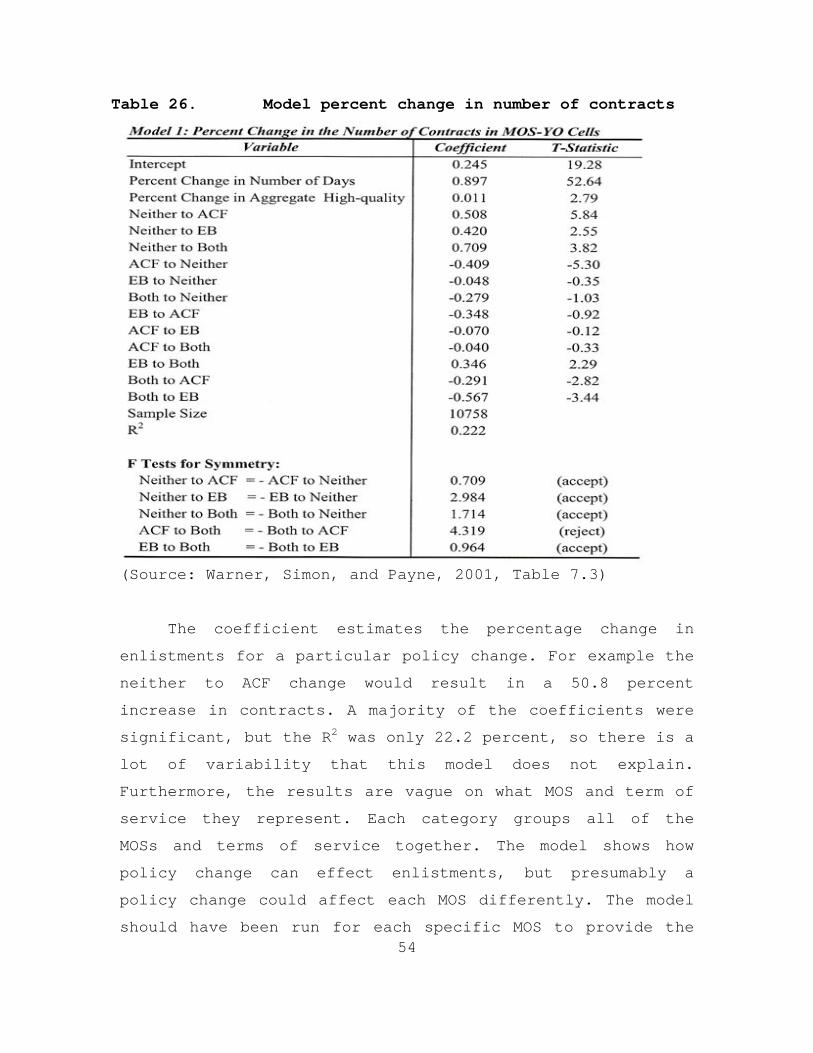
54
Table 26. Model percent change in number of contracts
(Source: Warner, Simon, and Payne, 2001, Table 7.3)
The coefficient estimates the percentage change in
enlistments for a particular policy change. For example the
neither to ACF change would result in a 50.8 percent
increase in contracts. A majority of the coefficients were
significant, but the R2 was only 22.2 percent, so there is a
lot of variability that this model does not explain.
Furthermore, the results are vague on what MOS and term of
service they represent. Each category groups all of the
MOSs and terms of service together. The model shows how
policy change can effect enlistments, but presumably a
policy change could affect each MOS differently. The model
should have been run for each specific MOS to provide the
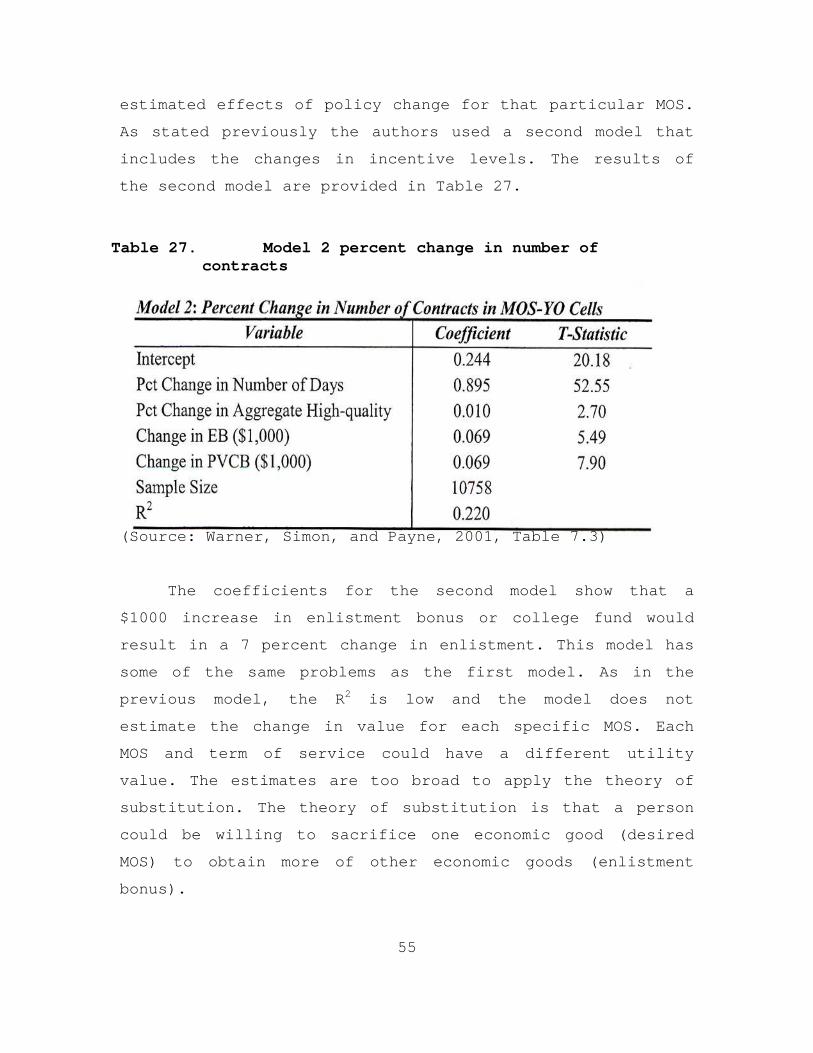
55
estimated effects of policy change for that particular MOS.
As stated previously the authors used a second model that
includes the changes in incentive levels. The results of
the second model are provided in Table 27.
Table 27. Model 2 percent change in number of contracts
(Source: Warner, Simon, and Payne, 2001, Table 7.3)
The coefficients for the second model show that a
$1000 increase in enlistment bonus or college fund would
result in a 7 percent change in enlistment. This model has
some of the same problems as the first model. As in the
previous model, the R2 is low and the model does not
estimate the change in value for each specific MOS. Each
MOS and term of service could have a different utility
value. The estimates are too broad to apply the theory of
substitution. The theory of substitution is that a person
could be willing to sacrifice one economic good (desired
MOS) to obtain more of other economic goods (enlistment
bonus).
56
Harold Larson also used regression analysis on
historical data in 1995 to analyze Army enlistment bonuses.
The study analyzed eight different MOS categories over six
fiscal years (1988-1993). The goal was to determine the
optimal enlistment bonus to offer for each MOS category.
The methodology used by the author was called a linear
spline with one knot.
The linear spline with one knot is a straight line
which has been bent at one location (the knot). The knot
was considered to be the optimal value for an enlistment
bonus. The author used a simple model. The dependent
variable was the average number of contracts per day for
the month and the explanatory variable was the CPI-adjusted
enlistment bonus. Using this method to estimate the effects
of enlistment bonuses requires a large variance in
enlistment bonuses offered.
There were several different bonus amounts offered
during the time period of the sample. For example the
infantry MOS offered bonuses ranging from $3000 to $8000.
To ensure that bonuses were the same for each period, the
time frame used was broken down into 28 periods. The
periods varied from 26 to 171 days. Since the number of
days and contracts varied per period the author weighted
the values in the model. “The weights applied were
estimated from the observed data by the reciprocals of the
standard errors of the mean number of contracts per month”
(Larson, 1995). Then the author ran a regression for each
of the eight different MOSs. The regressions included all
contracts for the given MOS, not just the contracts that
were assigned bonuses. F-tests were used to determine the
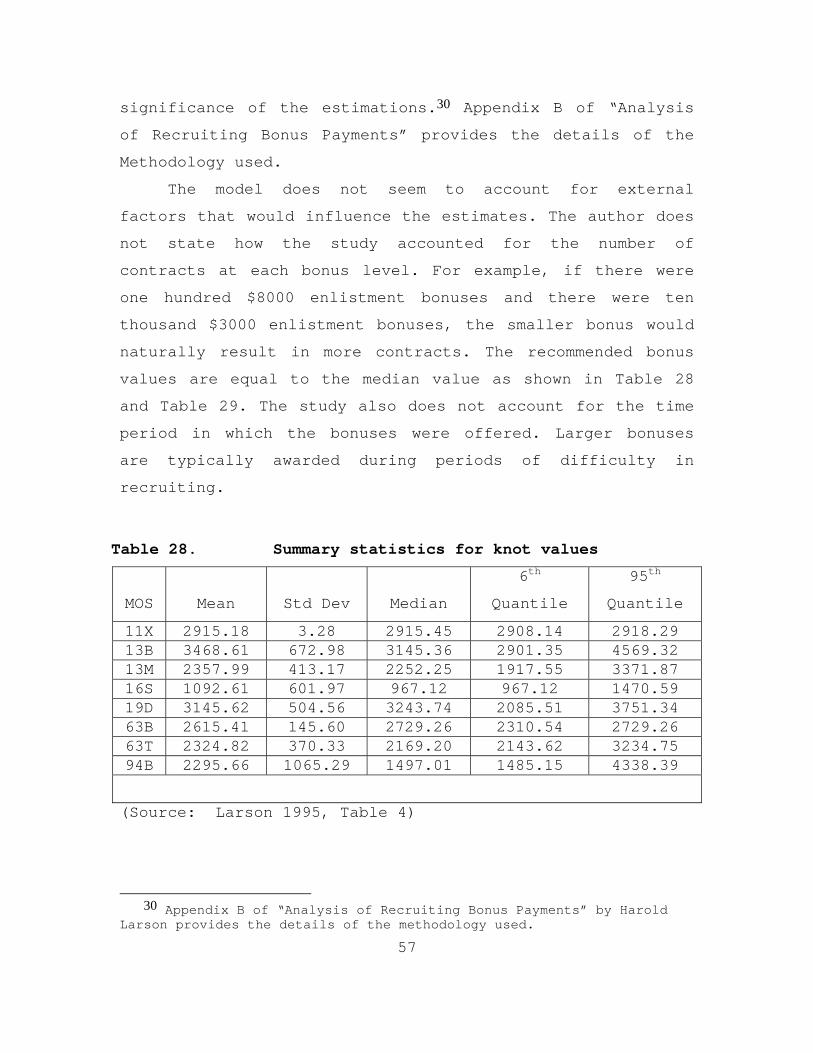
57
significance of the estimations.30 Appendix B of “Analysis
of Recruiting Bonus Payments” provides the details of the
Methodology used.
The model does not seem to account for external
factors that would influence the estimates. The author does
not state how the study accounted for the number of
contracts at each bonus level. For example, if there were
one hundred $8000 enlistment bonuses and there were ten
thousand $3000 enlistment bonuses, the smaller bonus would
naturally result in more contracts. The recommended bonus
values are equal to the median value as shown in Table 28
and Table 29. The study also does not account for the time
period in which the bonuses were offered. Larger bonuses
are typically awarded during periods of difficulty in
recruiting.
Table 28. Summary statistics for knot values
MOS Mean Std Dev Median
6th
Quantile
95th
Quantile
11X 2915.18 3.28 2915.45 2908.14 2918.29 13B 3468.61 672.98 3145.36 2901.35 4569.32 13M 2357.99 413.17 2252.25 1917.55 3371.87 16S 1092.61 601.97 967.12 967.12 1470.59 19D 3145.62 504.56 3243.74 2085.51 3751.34 63B 2615.41 145.60 2729.26 2310.54 2729.26 63T 2324.82 370.33 2169.20 2143.62 3234.75 94B 2295.66 1065.29 1497.01 1485.15 4338.39
(Source: Larson 1995, Table 4)
30 Appendix B of “Analysis of Recruiting Bonus Payments” by Harold
Larson provides the details of the methodology used.

58
Table 29. Recommended four-year bonus values
MOS Amount Comments
11X $2915 Very strong recommendation
13B $3145 Strong recommendation
13M $2252 Strong recommendation
16S - Not appropriate model
19D $3244 Weak recommendation
63B $2729 Moderately strong recommendation
63T - Not appropriate model
94B $1497 Weak recommendation
(Source: Larson 1995, Table 5)
D. SUMMARY
As shown in this chapter researchers have used
different methods to analyze monetary incentives. The
methodology of choice depends on the objective and the
resources available.
Surveys are beneficial when trying to infer what
decisions individuals would make when new incentives are
incorporated or in the absence of current incentives. As
shown in the “Choice-Based Conjoint Study of Recruitment
Incentives,” using civilian youth as survey participants is
informative when trying to expand the recruiting market.
Survey data from military enlistees is beneficial when
trying to estimate how to channel enlistees into critically
short enlistment programs. The downfalls to survey data are
that it is not always readily available and collecting
survey data can be time-intensive and costly.
Historical data is typically more accessible and it
provides researchers with real-life decisions with binding

59
actions. Historical data can be beneficial when trying to
estimate cost-effectiveness and enlistments gained due to
monetary incentives. The pay elasticity approach is a
method preferred by researchers when estimating cost
effectiveness. Combined with multiple regression analysis,
historical data can be used to estimate what incentives
were preferred by enlistees. If there is adequate variance
in the data, multiple regression analysis could be used to
estimate the optimal value of enlistment bonuses.

60
THIS PAGE INTENTIONALLY LEFT BLANK

61
IV. DATA
The purpose of this chapter is to describe the data
used in this research and explain the process for selecting
the variables. Additionally, a preliminary analysis will
examines the applicability of using the data to effectively
estimate the optimal incentive for enlistment bonuses. The
analysis also tries to identify any factors that might
influence the effectiveness of the enlistment bonus (EB)
program.
A. DATA SOURCES
The recruiting data used in this research was obtained
from two sources. The first source was the Total Force Data
Warehouse (TFDW), and the second source was the Marine
Corps Recruiting Command (MCRC).
1. TFDW & MCRC
The recruiting data consisted of cross-sectional and
time series data. The Marine Corps Recruiting Information
Support System (MCRISS) supplies the recruiting data to the
TFDW and it is captured in a monthly “snap shot.” The TFDW
started receiving MCRISS data in July of 2004; data prior
to this was compiled from the previous database.31 Data from
fiscal year (FY) 2004 to present is the most accurate, but
there was sufficient data in the TFDW to go back to FY
2000. The TFDW is missing a large amount of recruiting data
before FY 2000, so this research used recruiting data only
from FY 2000 through FY 2007.
31 As reported by a Marine Corps representative who manages the TFDW
at HQMC.

62
MCRC was used to collect information on the annual
recruiting mission, number of enlistment programs and
bonuses allocated, and the qualification requirements for
enlistment programs. MCRC was also limited on how far back
it could provide recruiting data, but it was able to
provide data from FY 2000 through FY 2007.
B. VARIABLES
The variables selected from the TFDW are shown in
Table 30. This research chose to use the date on which
enlistees shipped to recruit training instead of the date
they enlisted in the delayed entry program (DEP). This was
done to reduce the number of duplicate records. It is less
likely that a recruit be discharged from recruit training
and contracted again in the same FY than for an enlistee to
be discharged from the DEP and contracted again in the same
FY. The data was also restricted to active duty enlistees.
A description of the Marine Corps enlistment program codes
is provided in Table 31.
Table 30. TFDW VARIABLES
TFDW VARIABLES APPLICANT_ID Number assigned to enlistee SKILL_PROGRAM Enlistment program assigned to enlistee TERM_OF_ENLISTMENT Length of obligated service EB_PROGRAM Enlistment bonus assigned to enlistee EB_AMT Amount of enlistment bonus SHIPPING_BONUS Amount of shipping bonus EDUC_ALLOW Education incentive STUDENT_LN Student loan payoff program MCCF_PROGRAM Marine Corps College Fund AFQT_SCORE AFQT Score EL Electronics Score GT General technical knowledge score MM Mechanical score
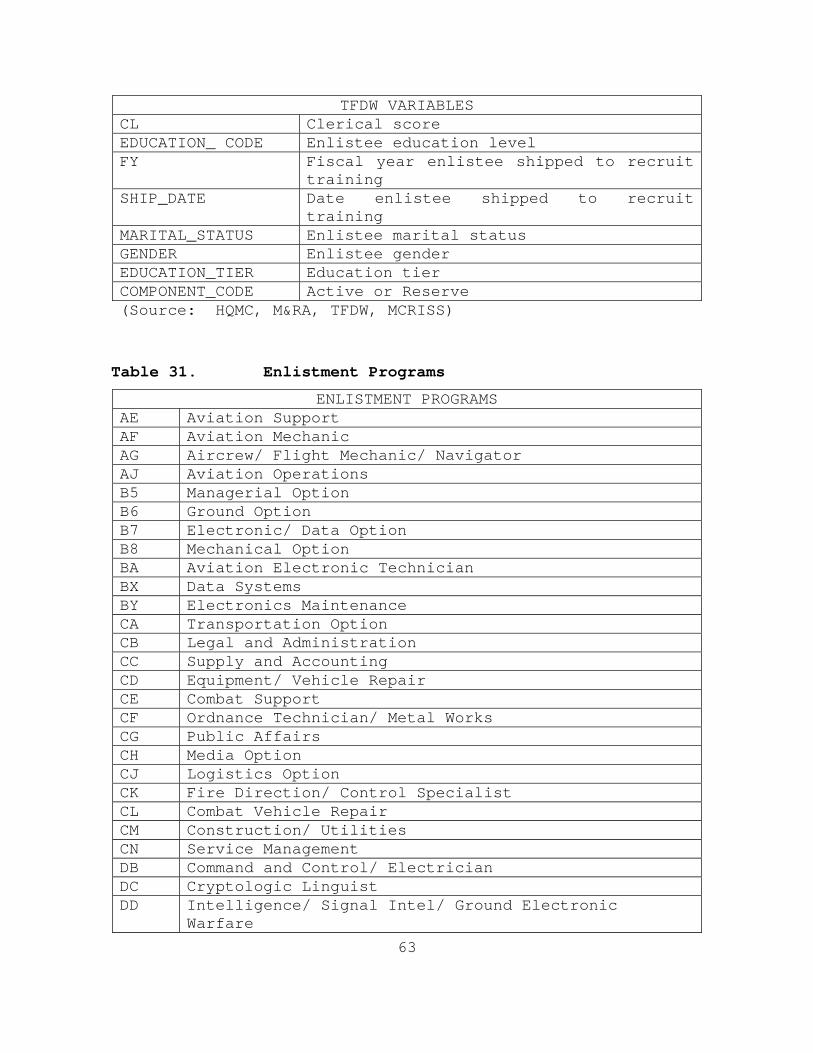
63
TFDW VARIABLES CL Clerical score EDUCATION_ CODE Enlistee education level FY Fiscal year enlistee shipped to recruit
training SHIP_DATE Date enlistee shipped to recruit
training MARITAL_STATUS Enlistee marital status GENDER Enlistee gender EDUCATION_TIER Education tier COMPONENT_CODE Active or Reserve (Source: HQMC, M&RA, TFDW, MCRISS)
Table 31. Enlistment Programs
ENLISTMENT PROGRAMS AE Aviation Support AF Aviation Mechanic AG Aircrew/ Flight Mechanic/ Navigator AJ Aviation Operations B5 Managerial Option B6 Ground Option B7 Electronic/ Data Option B8 Mechanical Option BA Aviation Electronic Technician BX Data Systems BY Electronics Maintenance CA Transportation Option CB Legal and Administration CC Supply and Accounting CD Equipment/ Vehicle Repair CE Combat Support CF Ordnance Technician/ Metal Works CG Public Affairs CH Media Option CJ Logistics Option CK Fire Direction/ Control Specialist CL Combat Vehicle Repair CM Construction/ Utilities CN Service Management DB Command and Control/ Electrician DC Cryptologic Linguist DD Intelligence/ Signal Intel/ Ground Electronic
Warfare
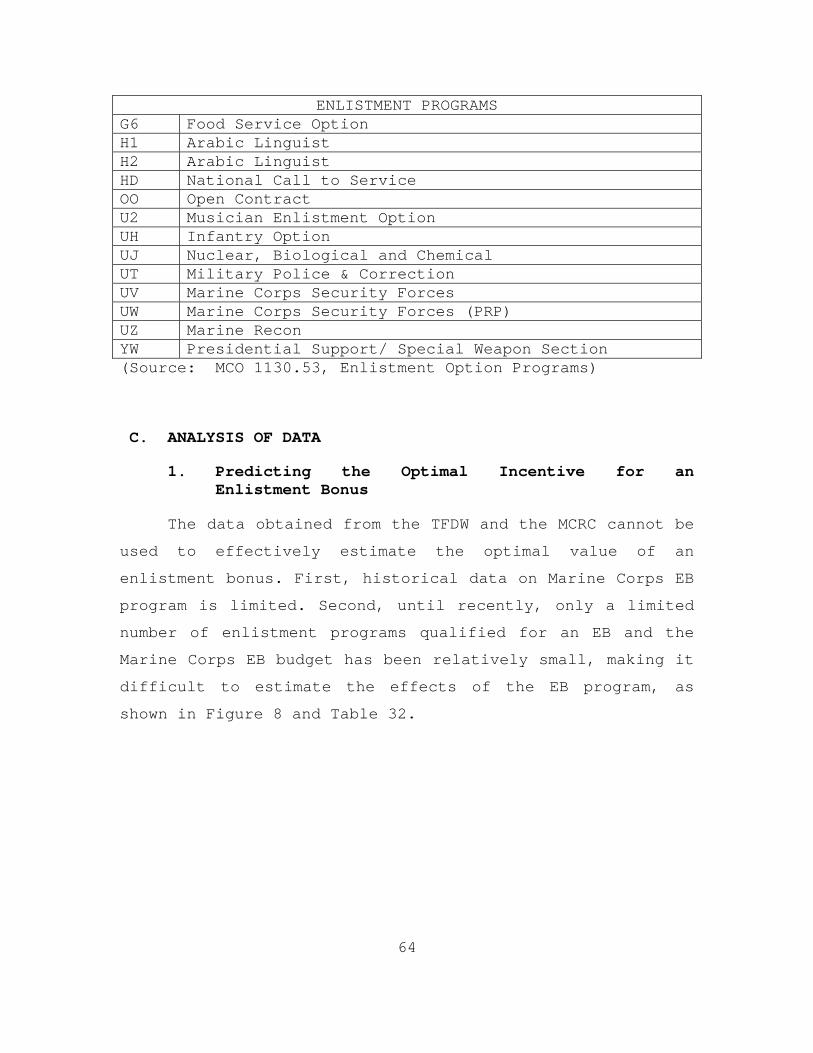
64
ENLISTMENT PROGRAMS G6 Food Service Option H1 Arabic Linguist H2 Arabic Linguist HD National Call to Service OO Open Contract U2 Musician Enlistment Option UH Infantry Option UJ Nuclear, Biological and Chemical UT Military Police & Correction UV Marine Corps Security Forces UW Marine Corps Security Forces (PRP) UZ Marine Recon YW Presidential Support/ Special Weapon Section (Source: MCO 1130.53, Enlistment Option Programs)
C. ANALYSIS OF DATA
1. Predicting the Optimal Incentive for an Enlistment Bonus
The data obtained from the TFDW and the MCRC cannot be
used to effectively estimate the optimal value of an
enlistment bonus. First, historical data on Marine Corps EB
program is limited. Second, until recently, only a limited
number of enlistment programs qualified for an EB and the
Marine Corps EB budget has been relatively small, making it
difficult to estimate the effects of the EB program, as
shown in Figure 8 and Table 32.
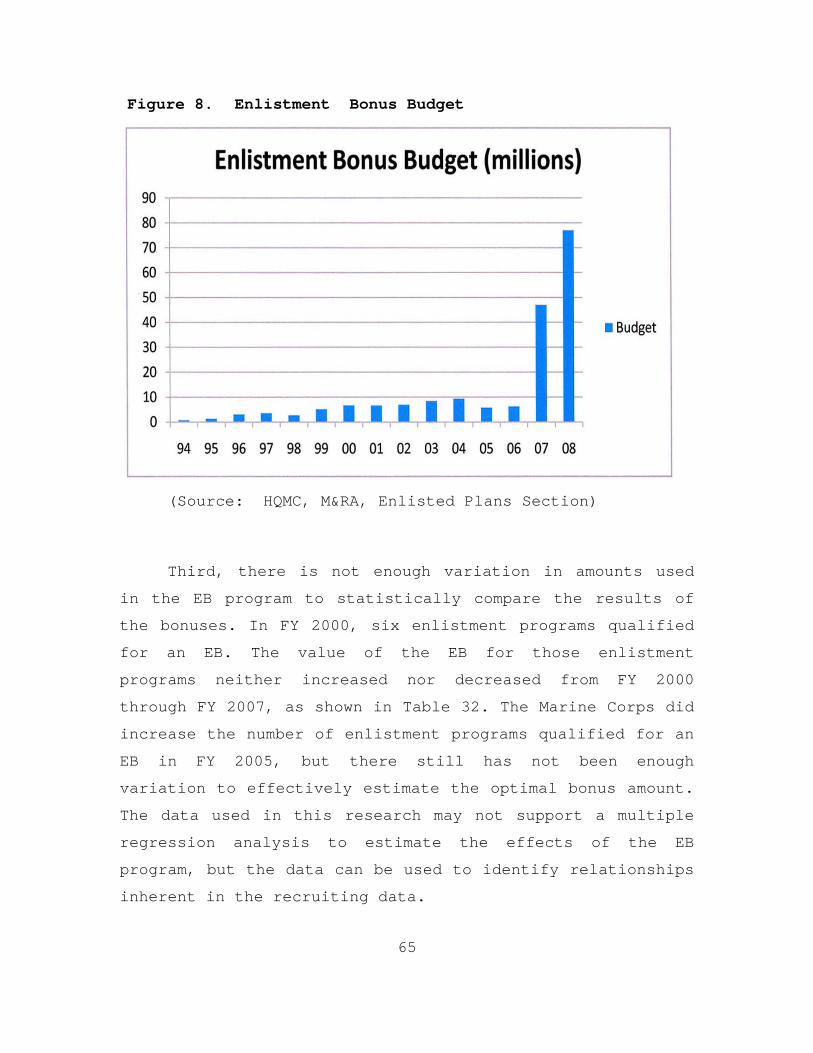
65
Figure 8. Enlistment Bonus Budget
(Source: HQMC, M&RA, Enlisted Plans Section)
Third, there is not enough variation in amounts used
in the EB program to statistically compare the results of
the bonuses. In FY 2000, six enlistment programs qualified
for an EB. The value of the EB for those enlistment
programs neither increased nor decreased from FY 2000
through FY 2007, as shown in Table 32. The Marine Corps did
increase the number of enlistment programs qualified for an
EB in FY 2005, but there still has not been enough
variation to effectively estimate the optimal bonus amount.
The data used in this research may not support a multiple
regression analysis to estimate the effects of the EB
program, but the data can be used to identify relationships
inherent in the recruiting data.
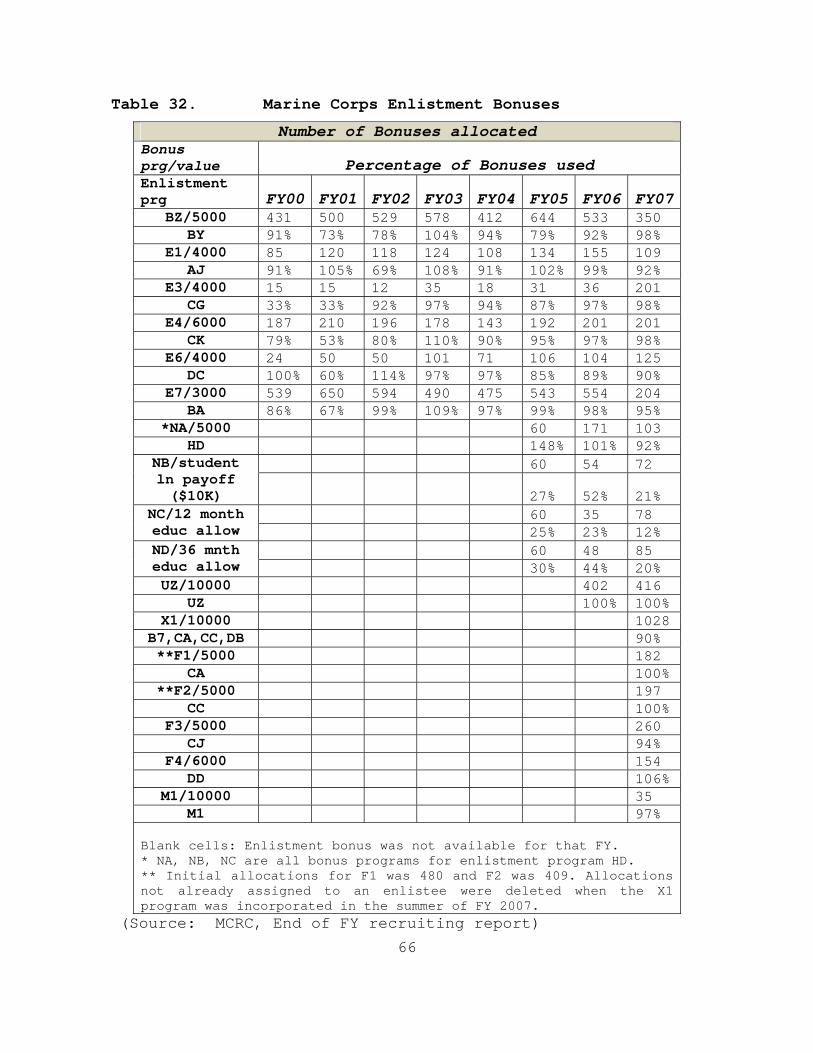
66
Table 32. Marine Corps Enlistment Bonuses
Number of Bonuses allocated Bonus prg/value Percentage of Bonuses used Enlistment prg FY00 FY01 FY02 FY03 FY04 FY05 FY06 FY07
BZ/5000 431 500 529 578 412 644 533 350 BY 91% 73% 78% 104% 94% 79% 92% 98%
E1/4000 85 120 118 124 108 134 155 109 AJ 91% 105% 69% 108% 91% 102% 99% 92%
E3/4000 15 15 12 35 18 31 36 201 CG 33% 33% 92% 97% 94% 87% 97% 98%
E4/6000 187 210 196 178 143 192 201 201 CK 79% 53% 80% 110% 90% 95% 97% 98%
E6/4000 24 50 50 101 71 106 104 125 DC 100% 60% 114% 97% 97% 85% 89% 90%
E7/3000 539 650 594 490 475 543 554 204 BA 86% 67% 99% 109% 97% 99% 98% 95%
*NA/5000 60 171 103 HD 148% 101% 92%
60 54 72 NB/student ln payoff ($10K) 27% 52% 21%
60 35 78 NC/12 month educ allow 25% 23% 12%
60 48 85 ND/36 mnth educ allow 30% 44% 20% UZ/10000 402 416
UZ 100% 100% X1/10000 1028
B7,CA,CC,DB 90% **F1/5000 182
CA 100% **F2/5000 197
CC 100% F3/5000 260
CJ 94% F4/6000 154
DD 106% M1/10000 35
M1 97% Blank cells: Enlistment bonus was not available for that FY. * NA, NB, NC are all bonus programs for enlistment program HD. ** Initial allocations for F1 was 480 and F2 was 409. Allocations not already assigned to an enlistee were deleted when the X1 program was incorporated in the summer of FY 2007.
(Source: MCRC, End of FY recruiting report)
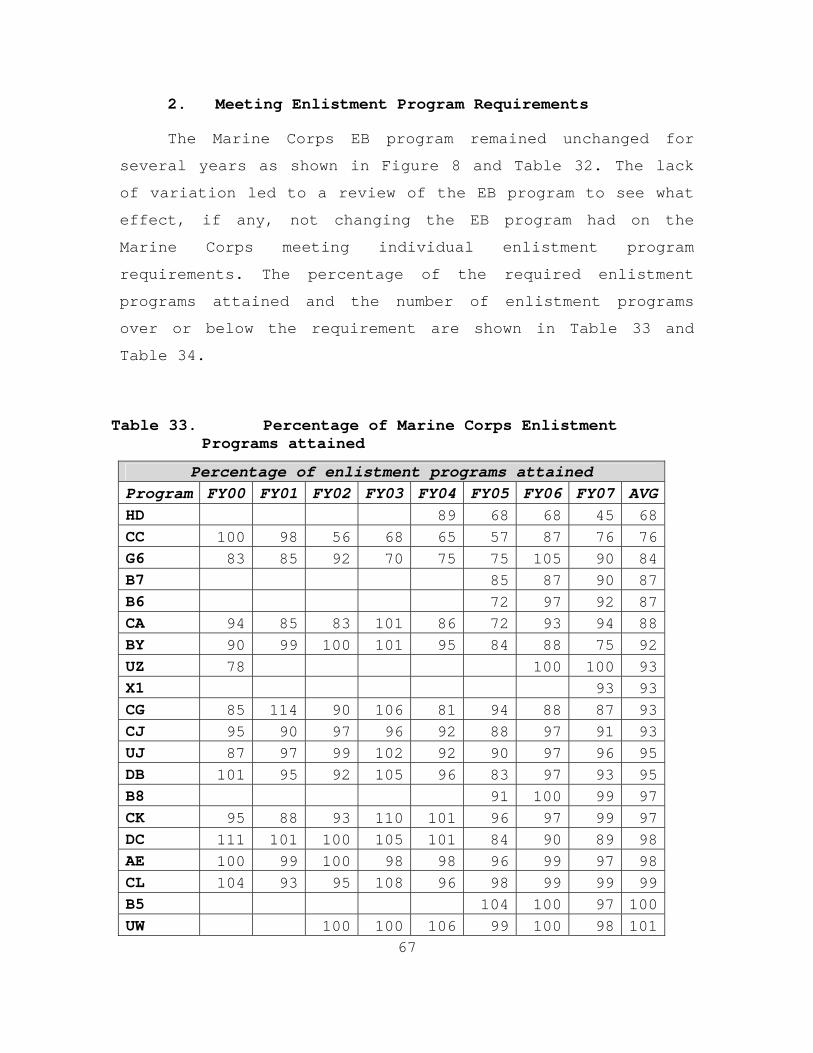
67
2. Meeting Enlistment Program Requirements
The Marine Corps EB program remained unchanged for
several years as shown in Figure 8 and Table 32. The lack
of variation led to a review of the EB program to see what
effect, if any, not changing the EB program had on the
Marine Corps meeting individual enlistment program
requirements. The percentage of the required enlistment
programs attained and the number of enlistment programs
over or below the requirement are shown in Table 33 and
Table 34.
Table 33. Percentage of Marine Corps Enlistment Programs attained
Percentage of enlistment programs attained Program FY00 FY01 FY02 FY03 FY04 FY05 FY06 FY07 AVGHD 89 68 68 45 68CC 100 98 56 68 65 57 87 76 76G6 83 85 92 70 75 75 105 90 84B7 85 87 90 87B6 72 97 92 87CA 94 85 83 101 86 72 93 94 88BY 90 99 100 101 95 84 88 75 92UZ 78 100 100 93X1 93 93CG 85 114 90 106 81 94 88 87 93CJ 95 90 97 96 92 88 97 91 93UJ 87 97 99 102 92 90 97 96 95DB 101 95 92 105 96 83 97 93 95B8 91 100 99 97CK 95 88 93 110 101 96 97 99 97DC 111 101 100 105 101 84 90 89 98AE 100 99 100 98 98 96 99 97 98CL 104 93 95 108 96 98 99 99 99B5 104 100 97 100UW 100 100 106 99 100 98 101
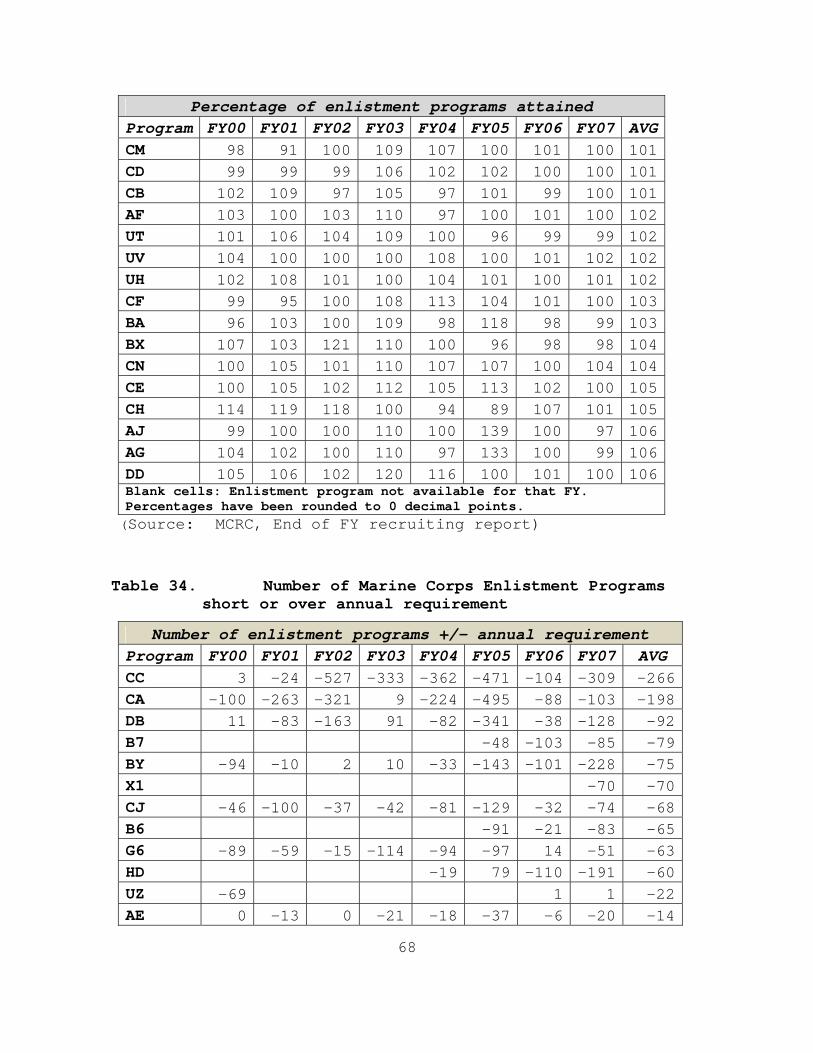
68
Percentage of enlistment programs attained Program FY00 FY01 FY02 FY03 FY04 FY05 FY06 FY07 AVGCM 98 91 100 109 107 100 101 100 101CD 99 99 99 106 102 102 100 100 101CB 102 109 97 105 97 101 99 100 101AF 103 100 103 110 97 100 101 100 102UT 101 106 104 109 100 96 99 99 102UV 104 100 100 100 108 100 101 102 102UH 102 108 101 100 104 101 100 101 102CF 99 95 100 108 113 104 101 100 103BA 96 103 100 109 98 118 98 99 103BX 107 103 121 110 100 96 98 98 104CN 100 105 101 110 107 107 100 104 104CE 100 105 102 112 105 113 102 100 105CH 114 119 118 100 94 89 107 101 105AJ 99 100 100 110 100 139 100 97 106AG 104 102 100 110 97 133 100 99 106DD 105 106 102 120 116 100 101 100 106Blank cells: Enlistment program not available for that FY. Percentages have been rounded to 0 decimal points. (Source: MCRC, End of FY recruiting report)
Table 34. Number of Marine Corps Enlistment Programs short or over annual requirement
Number of enlistment programs +/- annual requirement Program FY00 FY01 FY02 FY03 FY04 FY05 FY06 FY07 AVG CC 3 -24 -527 -333 -362 -471 -104 -309 -266CA -100 -263 -321 9 -224 -495 -88 -103 -198DB 11 -83 -163 91 -82 -341 -38 -128 -92B7 -48 -103 -85 -79BY -94 -10 2 10 -33 -143 -101 -228 -75X1 -70 -70CJ -46 -100 -37 -42 -81 -129 -32 -74 -68B6 -91 -21 -83 -65G6 -89 -59 -15 -114 -94 -97 14 -51 -63HD -19 79 -110 -191 -60UZ -69 1 1 -22AE 0 -13 0 -21 -18 -37 -6 -20 -14
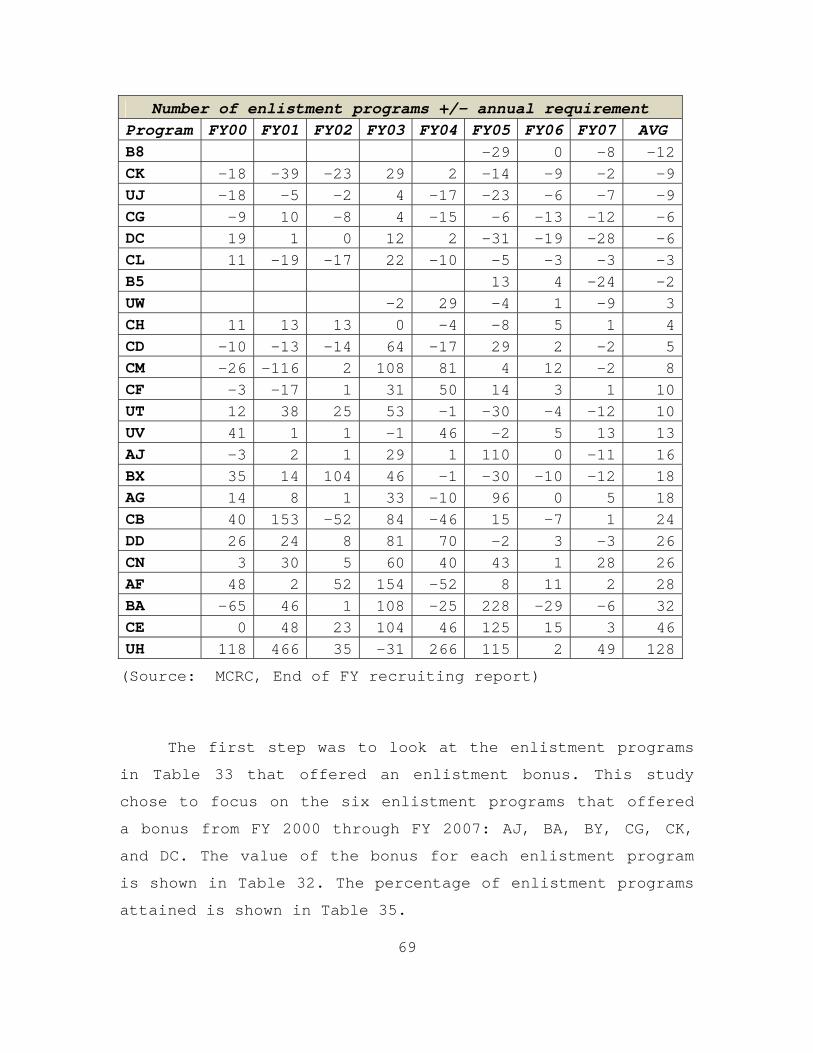
69
Number of enlistment programs +/- annual requirement Program FY00 FY01 FY02 FY03 FY04 FY05 FY06 FY07 AVG B8 -29 0 -8 -12CK -18 -39 -23 29 2 -14 -9 -2 -9UJ -18 -5 -2 4 -17 -23 -6 -7 -9CG -9 10 -8 4 -15 -6 -13 -12 -6DC 19 1 0 12 2 -31 -19 -28 -6CL 11 -19 -17 22 -10 -5 -3 -3 -3B5 13 4 -24 -2UW -2 29 -4 1 -9 3CH 11 13 13 0 -4 -8 5 1 4CD -10 -13 -14 64 -17 29 2 -2 5CM -26 -116 2 108 81 4 12 -2 8CF -3 -17 1 31 50 14 3 1 10UT 12 38 25 53 -1 -30 -4 -12 10UV 41 1 1 -1 46 -2 5 13 13AJ -3 2 1 29 1 110 0 -11 16BX 35 14 104 46 -1 -30 -10 -12 18AG 14 8 1 33 -10 96 0 5 18CB 40 153 -52 84 -46 15 -7 1 24DD 26 24 8 81 70 -2 3 -3 26CN 3 30 5 60 40 43 1 28 26AF 48 2 52 154 -52 8 11 2 28BA -65 46 1 108 -25 228 -29 -6 32CE 0 48 23 104 46 125 15 3 46UH 118 466 35 -31 266 115 2 49 128
(Source: MCRC, End of FY recruiting report)
The first step was to look at the enlistment programs
in Table 33 that offered an enlistment bonus. This study
chose to focus on the six enlistment programs that offered
a bonus from FY 2000 through FY 2007: AJ, BA, BY, CG, CK,
and DC. The value of the bonus for each enlistment program
is shown in Table 32. The percentage of enlistment programs
attained is shown in Table 35.
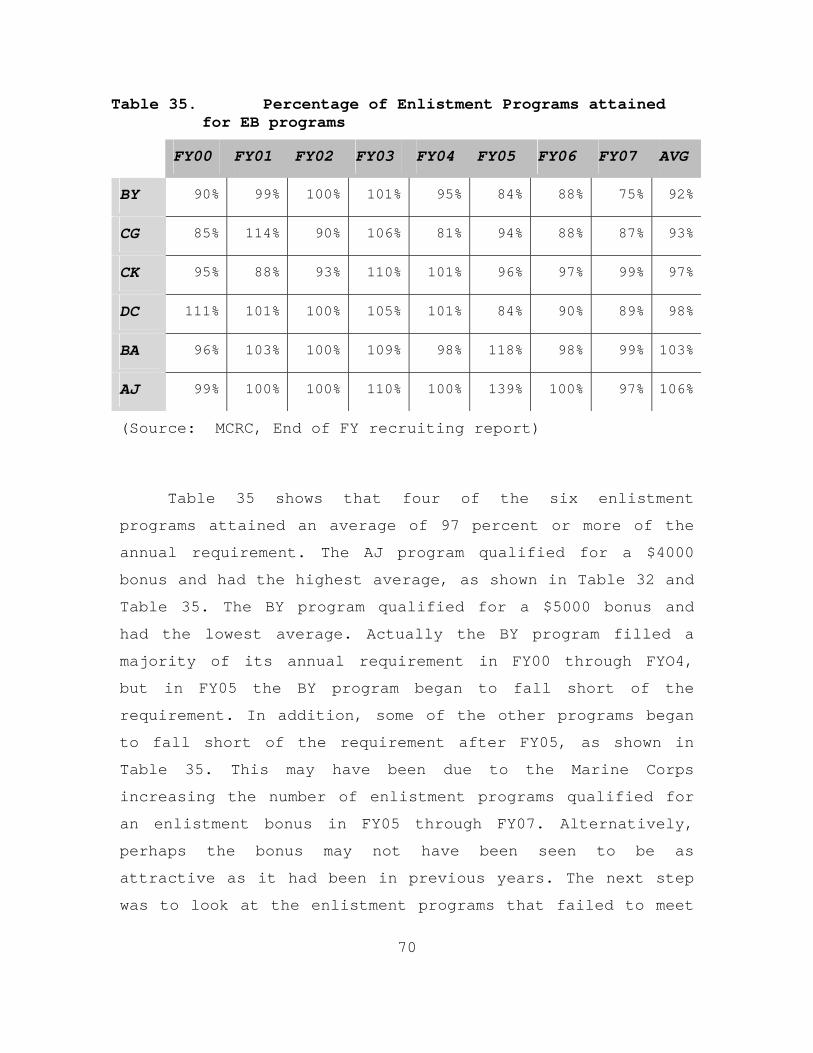
70
Table 35. Percentage of Enlistment Programs attained for EB programs
FY00 FY01 FY02 FY03 FY04 FY05 FY06 FY07 AVG
BY 90% 99% 100% 101% 95% 84% 88% 75% 92%
CG 85% 114% 90% 106% 81% 94% 88% 87% 93%
CK 95% 88% 93% 110% 101% 96% 97% 99% 97%
DC 111% 101% 100% 105% 101% 84% 90% 89% 98%
BA 96% 103% 100% 109% 98% 118% 98% 99% 103%
AJ 99% 100% 100% 110% 100% 139% 100% 97% 106%
(Source: MCRC, End of FY recruiting report)
Table 35 shows that four of the six enlistment
programs attained an average of 97 percent or more of the
annual requirement. The AJ program qualified for a $4000
bonus and had the highest average, as shown in Table 32 and
Table 35. The BY program qualified for a $5000 bonus and
had the lowest average. Actually the BY program filled a
majority of its annual requirement in FY00 through FYO4,
but in FY05 the BY program began to fall short of the
requirement. In addition, some of the other programs began
to fall short of the requirement after FY05, as shown in
Table 35. This may have been due to the Marine Corps
increasing the number of enlistment programs qualified for
an enlistment bonus in FY05 through FY07. Alternatively,
perhaps the bonus may not have been seen to be as
attractive as it had been in previous years. The next step
was to look at the enlistment programs that failed to meet
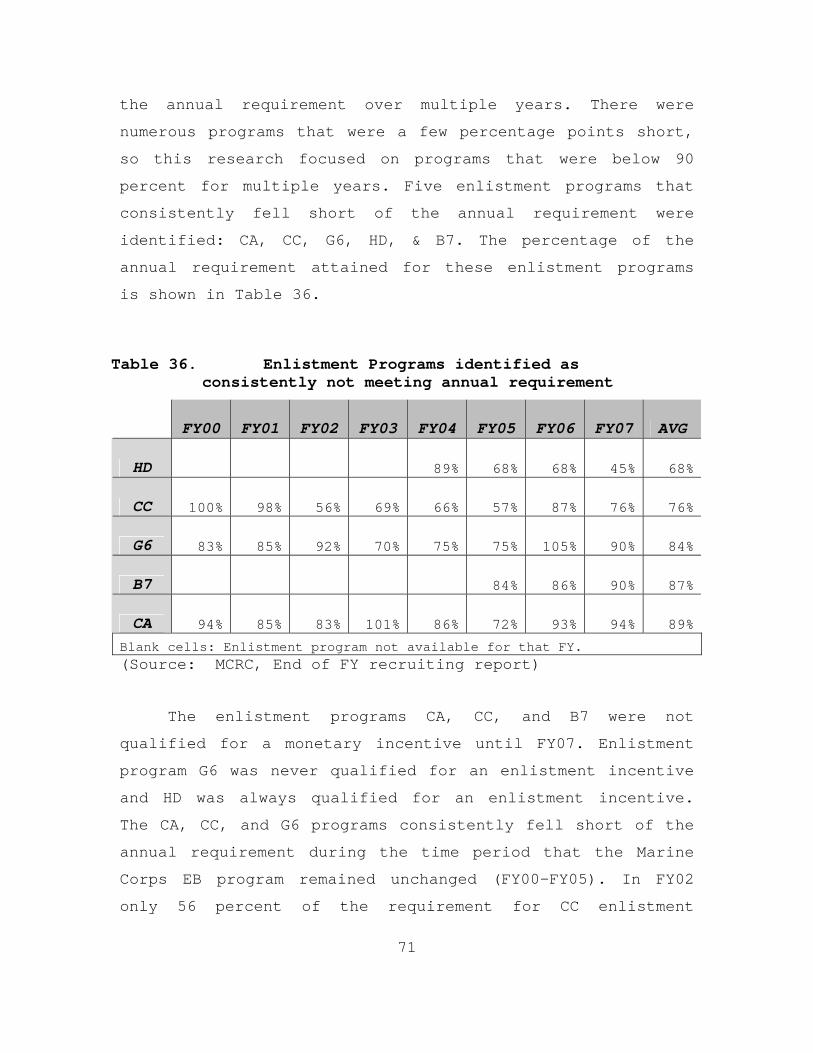
71
the annual requirement over multiple years. There were
numerous programs that were a few percentage points short,
so this research focused on programs that were below 90
percent for multiple years. Five enlistment programs that
consistently fell short of the annual requirement were
identified: CA, CC, G6, HD, & B7. The percentage of the
annual requirement attained for these enlistment programs
is shown in Table 36.
Table 36. Enlistment Programs identified as consistently not meeting annual requirement
FY00 FY01 FY02 FY03 FY04 FY05 FY06 FY07 AVG
HD 89% 68% 68% 45% 68%
CC 100% 98% 56% 69% 66% 57% 87% 76% 76%
G6 83% 85% 92% 70% 75% 75% 105% 90% 84%
B7 84% 86% 90% 87%
CA 94% 85% 83% 101% 86% 72% 93% 94% 89%
Blank cells: Enlistment program not available for that FY. (Source: MCRC, End of FY recruiting report)
The enlistment programs CA, CC, and B7 were not
qualified for a monetary incentive until FY07. Enlistment
program G6 was never qualified for an enlistment incentive
and HD was always qualified for an enlistment incentive.
The CA, CC, and G6 programs consistently fell short of the
annual requirement during the time period that the Marine
Corps EB program remained unchanged (FY00-FY05). In FY02
only 56 percent of the requirement for CC enlistment
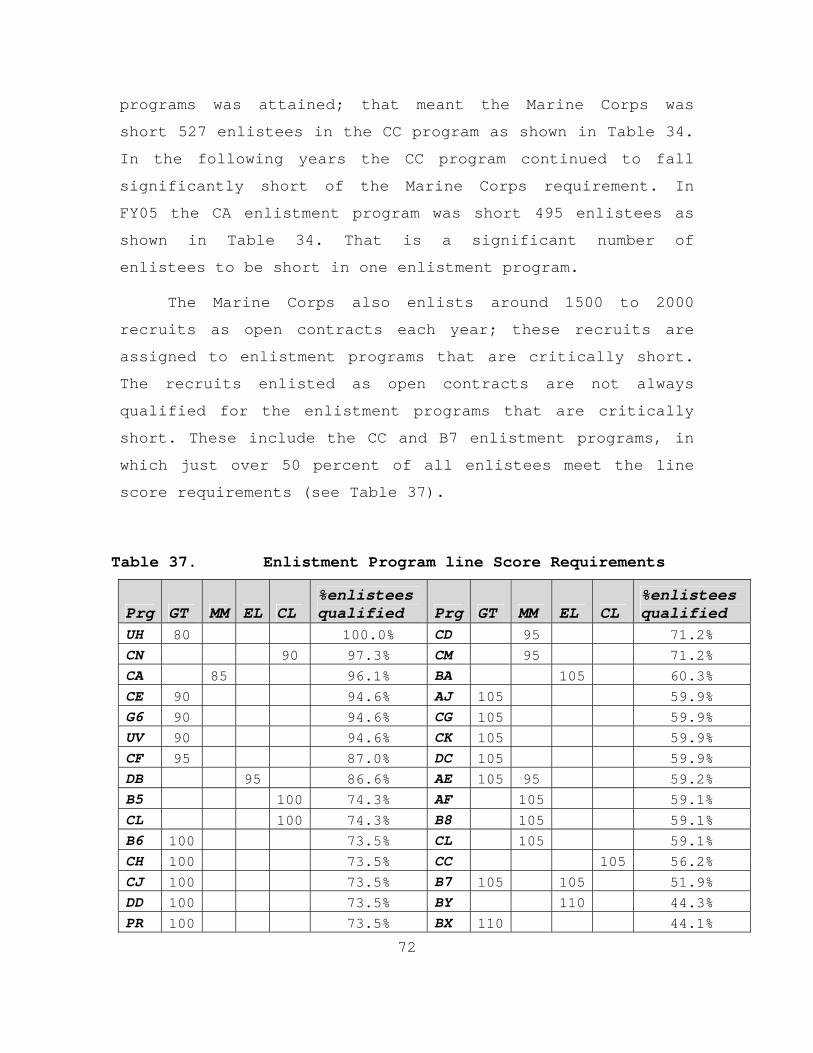
72
programs was attained; that meant the Marine Corps was
short 527 enlistees in the CC program as shown in Table 34.
In the following years the CC program continued to fall
significantly short of the Marine Corps requirement. In
FY05 the CA enlistment program was short 495 enlistees as
shown in Table 34. That is a significant number of
enlistees to be short in one enlistment program.
The Marine Corps also enlists around 1500 to 2000
recruits as open contracts each year; these recruits are
assigned to enlistment programs that are critically short.
The recruits enlisted as open contracts are not always
qualified for the enlistment programs that are critically
short. These include the CC and B7 enlistment programs, in
which just over 50 percent of all enlistees meet the line
score requirements (see Table 37).
Table 37. Enlistment Program line Score Requirements
Prg GT MM EL CL %enlistees qualified Prg GT MM EL CL
%enlistees qualified
UH 80 100.0% CD 95 71.2% CN 90 97.3% CM 95 71.2% CA 85 96.1% BA 105 60.3% CE 90 94.6% AJ 105 59.9% G6 90 94.6% CG 105 59.9% UV 90 94.6% CK 105 59.9% CF 95 87.0% DC 105 59.9% DB 95 86.6% AE 105 95 59.2% B5 100 74.3% AF 105 59.1% CL 100 74.3% B8 105 59.1% B6 100 73.5% CL 105 59.1% CH 100 73.5% CC 105 56.2% CJ 100 73.5% B7 105 105 51.9% DD 100 73.5% BY 110 44.3% PR 100 73.5% BX 110 44.1%
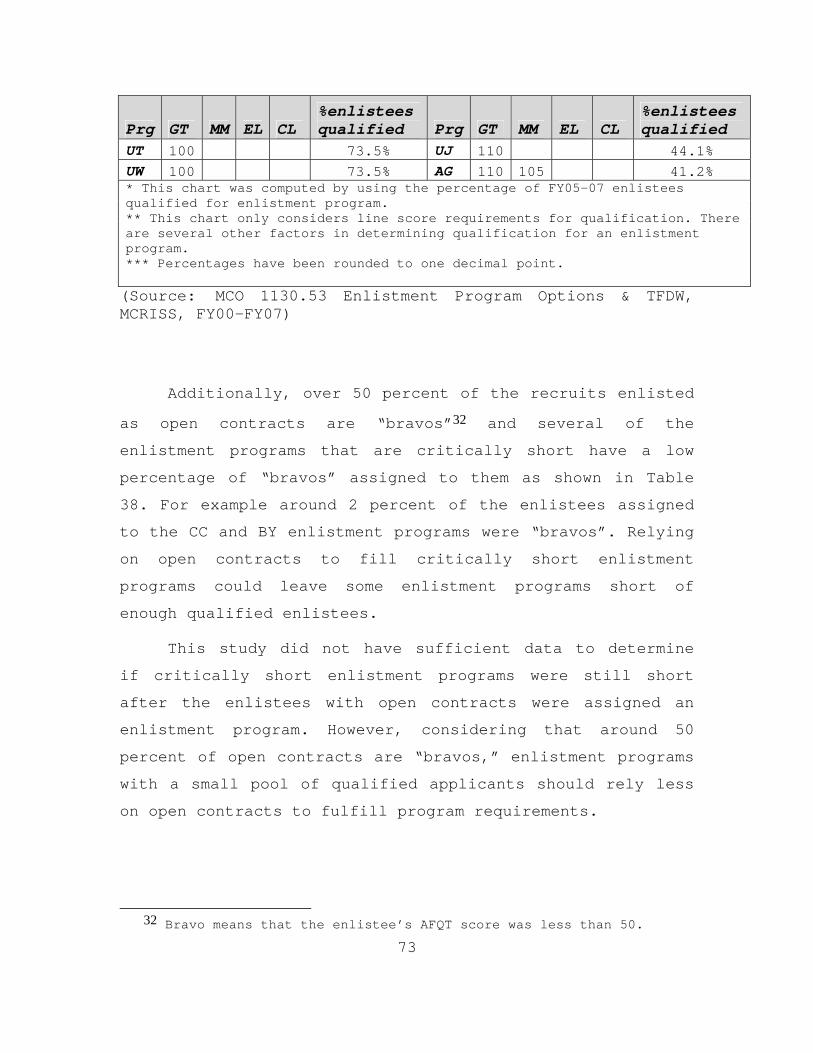
73
Prg GT MM EL CL %enlistees qualified Prg GT MM EL CL
%enlistees qualified
UT 100 73.5% UJ 110 44.1% UW 100 73.5% AG 110 105 41.2% * This chart was computed by using the percentage of FY05-07 enlistees qualified for enlistment program. ** This chart only considers line score requirements for qualification. There are several other factors in determining qualification for an enlistment program. *** Percentages have been rounded to one decimal point. (Source: MCO 1130.53 Enlistment Program Options & TFDW, MCRISS, FY00-FY07)
Additionally, over 50 percent of the recruits enlisted
as open contracts are “bravos”32 and several of the
enlistment programs that are critically short have a low
percentage of “bravos” assigned to them as shown in Table
38. For example around 2 percent of the enlistees assigned
to the CC and BY enlistment programs were “bravos”. Relying
on open contracts to fill critically short enlistment
programs could leave some enlistment programs short of
enough qualified enlistees.
This study did not have sufficient data to determine
if critically short enlistment programs were still short
after the enlistees with open contracts were assigned an
enlistment program. However, considering that around 50
percent of open contracts are “bravos,” enlistment programs
with a small pool of qualified applicants should rely less
on open contracts to fulfill program requirements.
32 Bravo means that the enlistee’s AFQT score was less than 50.
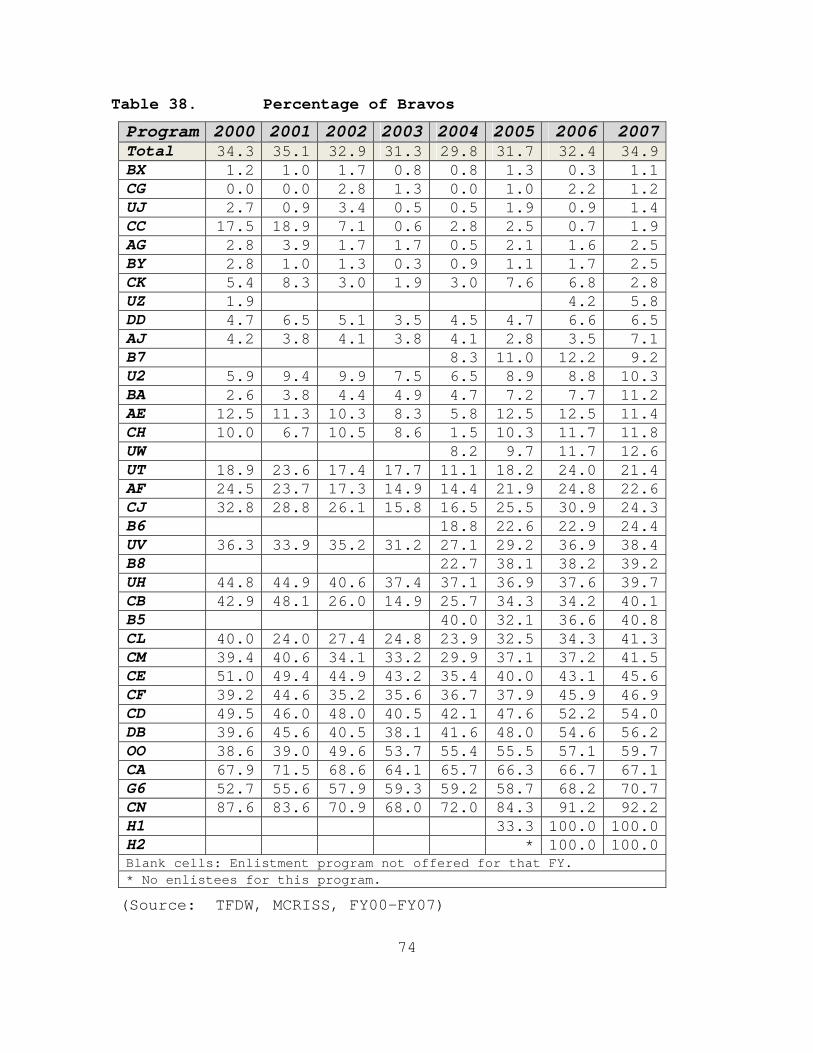
74
Table 38. Percentage of Bravos
Program 2000 2001 2002 2003 2004 2005 2006 2007Total 34.3 35.1 32.9 31.3 29.8 31.7 32.4 34.9BX 1.2 1.0 1.7 0.8 0.8 1.3 0.3 1.1CG 0.0 0.0 2.8 1.3 0.0 1.0 2.2 1.2UJ 2.7 0.9 3.4 0.5 0.5 1.9 0.9 1.4CC 17.5 18.9 7.1 0.6 2.8 2.5 0.7 1.9AG 2.8 3.9 1.7 1.7 0.5 2.1 1.6 2.5BY 2.8 1.0 1.3 0.3 0.9 1.1 1.7 2.5CK 5.4 8.3 3.0 1.9 3.0 7.6 6.8 2.8UZ 1.9 4.2 5.8DD 4.7 6.5 5.1 3.5 4.5 4.7 6.6 6.5AJ 4.2 3.8 4.1 3.8 4.1 2.8 3.5 7.1B7 8.3 11.0 12.2 9.2U2 5.9 9.4 9.9 7.5 6.5 8.9 8.8 10.3BA 2.6 3.8 4.4 4.9 4.7 7.2 7.7 11.2AE 12.5 11.3 10.3 8.3 5.8 12.5 12.5 11.4CH 10.0 6.7 10.5 8.6 1.5 10.3 11.7 11.8UW 8.2 9.7 11.7 12.6UT 18.9 23.6 17.4 17.7 11.1 18.2 24.0 21.4AF 24.5 23.7 17.3 14.9 14.4 21.9 24.8 22.6CJ 32.8 28.8 26.1 15.8 16.5 25.5 30.9 24.3B6 18.8 22.6 22.9 24.4UV 36.3 33.9 35.2 31.2 27.1 29.2 36.9 38.4B8 22.7 38.1 38.2 39.2UH 44.8 44.9 40.6 37.4 37.1 36.9 37.6 39.7CB 42.9 48.1 26.0 14.9 25.7 34.3 34.2 40.1B5 40.0 32.1 36.6 40.8CL 40.0 24.0 27.4 24.8 23.9 32.5 34.3 41.3CM 39.4 40.6 34.1 33.2 29.9 37.1 37.2 41.5CE 51.0 49.4 44.9 43.2 35.4 40.0 43.1 45.6CF 39.2 44.6 35.2 35.6 36.7 37.9 45.9 46.9CD 49.5 46.0 48.0 40.5 42.1 47.6 52.2 54.0DB 39.6 45.6 40.5 38.1 41.6 48.0 54.6 56.2OO 38.6 39.0 49.6 53.7 55.4 55.5 57.1 59.7CA 67.9 71.5 68.6 64.1 65.7 66.3 66.7 67.1G6 52.7 55.6 57.9 59.3 59.2 58.7 68.2 70.7CN 87.6 83.6 70.9 68.0 72.0 84.3 91.2 92.2H1 33.3 100.0 100.0H2 * 100.0 100.0Blank cells: Enlistment program not offered for that FY. * No enlistees for this program.
(Source: TFDW, MCRISS, FY00-FY07)
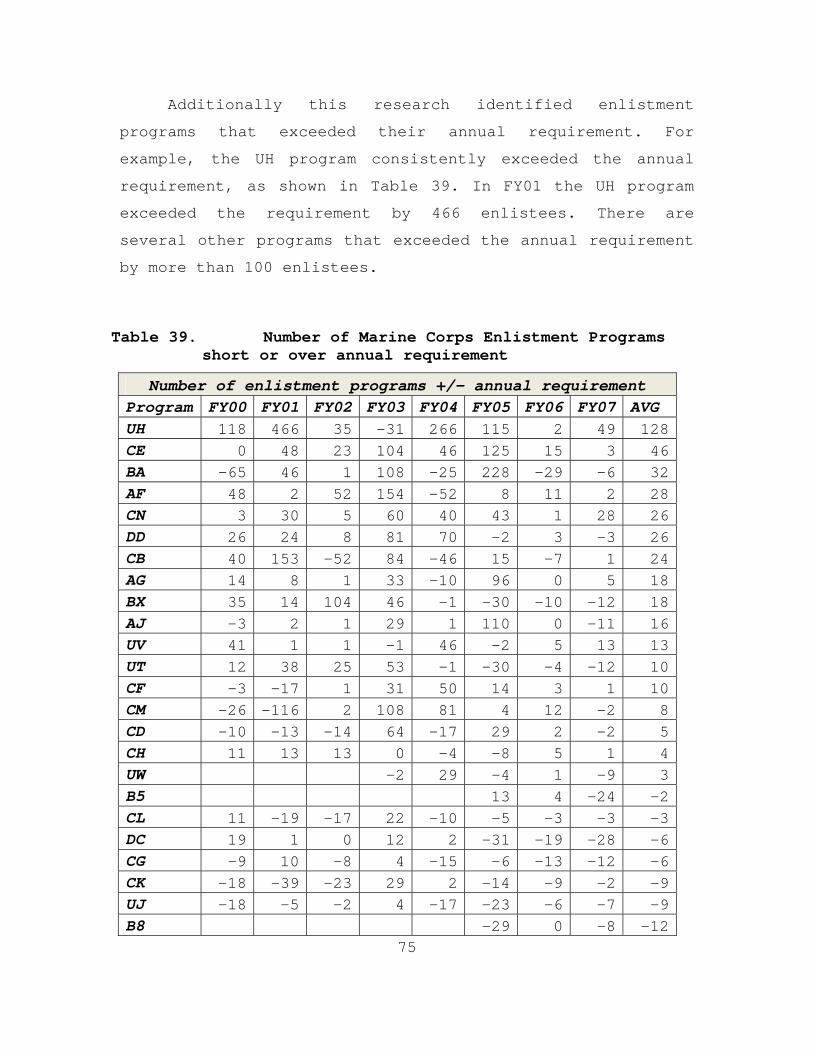
75
Additionally this research identified enlistment
programs that exceeded their annual requirement. For
example, the UH program consistently exceeded the annual
requirement, as shown in Table 39. In FY01 the UH program
exceeded the requirement by 466 enlistees. There are
several other programs that exceeded the annual requirement
by more than 100 enlistees.
Table 39. Number of Marine Corps Enlistment Programs short or over annual requirement
Number of enlistment programs +/- annual requirement Program FY00 FY01 FY02 FY03 FY04 FY05 FY06 FY07 AVG UH 118 466 35 -31 266 115 2 49 128CE 0 48 23 104 46 125 15 3 46BA -65 46 1 108 -25 228 -29 -6 32AF 48 2 52 154 -52 8 11 2 28CN 3 30 5 60 40 43 1 28 26DD 26 24 8 81 70 -2 3 -3 26CB 40 153 -52 84 -46 15 -7 1 24AG 14 8 1 33 -10 96 0 5 18BX 35 14 104 46 -1 -30 -10 -12 18AJ -3 2 1 29 1 110 0 -11 16UV 41 1 1 -1 46 -2 5 13 13UT 12 38 25 53 -1 -30 -4 -12 10CF -3 -17 1 31 50 14 3 1 10CM -26 -116 2 108 81 4 12 -2 8CD -10 -13 -14 64 -17 29 2 -2 5CH 11 13 13 0 -4 -8 5 1 4UW -2 29 -4 1 -9 3B5 13 4 -24 -2CL 11 -19 -17 22 -10 -5 -3 -3 -3DC 19 1 0 12 2 -31 -19 -28 -6CG -9 10 -8 4 -15 -6 -13 -12 -6CK -18 -39 -23 29 2 -14 -9 -2 -9UJ -18 -5 -2 4 -17 -23 -6 -7 -9B8 -29 0 -8 -12
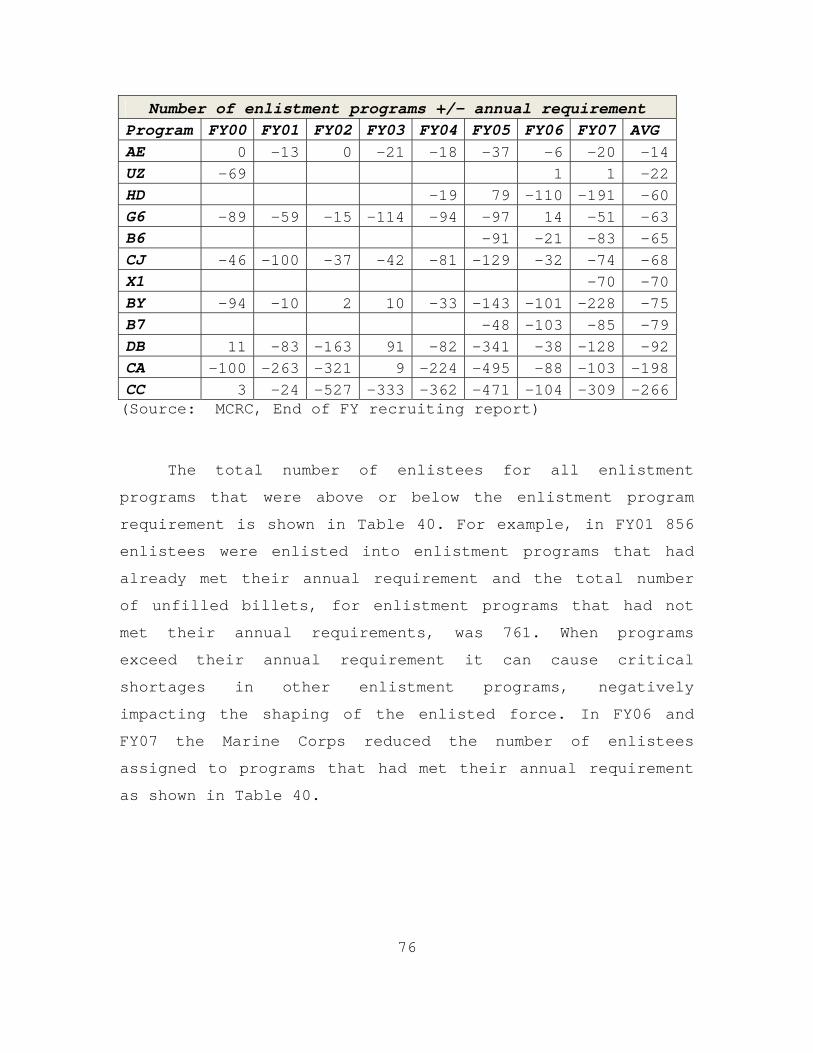
76
Number of enlistment programs +/- annual requirement Program FY00 FY01 FY02 FY03 FY04 FY05 FY06 FY07 AVG AE 0 -13 0 -21 -18 -37 -6 -20 -14UZ -69 1 1 -22HD -19 79 -110 -191 -60G6 -89 -59 -15 -114 -94 -97 14 -51 -63B6 -91 -21 -83 -65CJ -46 -100 -37 -42 -81 -129 -32 -74 -68X1 -70 -70BY -94 -10 2 10 -33 -143 -101 -228 -75B7 -48 -103 -85 -79DB 11 -83 -163 91 -82 -341 -38 -128 -92CA -100 -263 -321 9 -224 -495 -88 -103 -198CC 3 -24 -527 -333 -362 -471 -104 -309 -266(Source: MCRC, End of FY recruiting report)
The total number of enlistees for all enlistment
programs that were above or below the enlistment program
requirement is shown in Table 40. For example, in FY01 856
enlistees were enlisted into enlistment programs that had
already met their annual requirement and the total number
of unfilled billets, for enlistment programs that had not
met their annual requirements, was 761. When programs
exceed their annual requirement it can cause critical
shortages in other enlistment programs, negatively
impacting the shaping of the enlisted force. In FY06 and
FY07 the Marine Corps reduced the number of enlistees
assigned to programs that had met their annual requirement
as shown in Table 40.
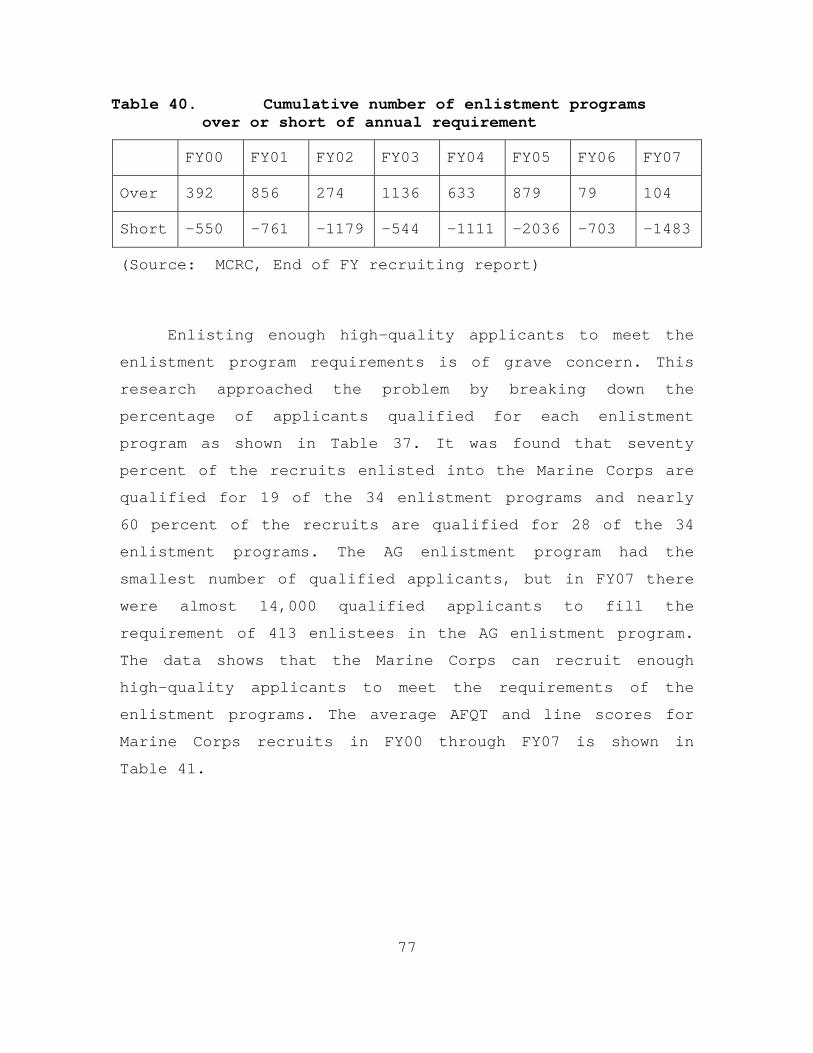
77
Table 40. Cumulative number of enlistment programs over or short of annual requirement
FY00 FY01 FY02 FY03 FY04 FY05 FY06 FY07
Over 392 856 274 1136 633 879 79 104
Short -550 -761 -1179 -544 -1111 -2036 -703 -1483
(Source: MCRC, End of FY recruiting report)
Enlisting enough high-quality applicants to meet the
enlistment program requirements is of grave concern. This
research approached the problem by breaking down the
percentage of applicants qualified for each enlistment
program as shown in Table 37. It was found that seventy
percent of the recruits enlisted into the Marine Corps are
qualified for 19 of the 34 enlistment programs and nearly
60 percent of the recruits are qualified for 28 of the 34
enlistment programs. The AG enlistment program had the
smallest number of qualified applicants, but in FY07 there
were almost 14,000 qualified applicants to fill the
requirement of 413 enlistees in the AG enlistment program.
The data shows that the Marine Corps can recruit enough
high-quality applicants to meet the requirements of the
enlistment programs. The average AFQT and line scores for
Marine Corps recruits in FY00 through FY07 is shown in
Table 41.
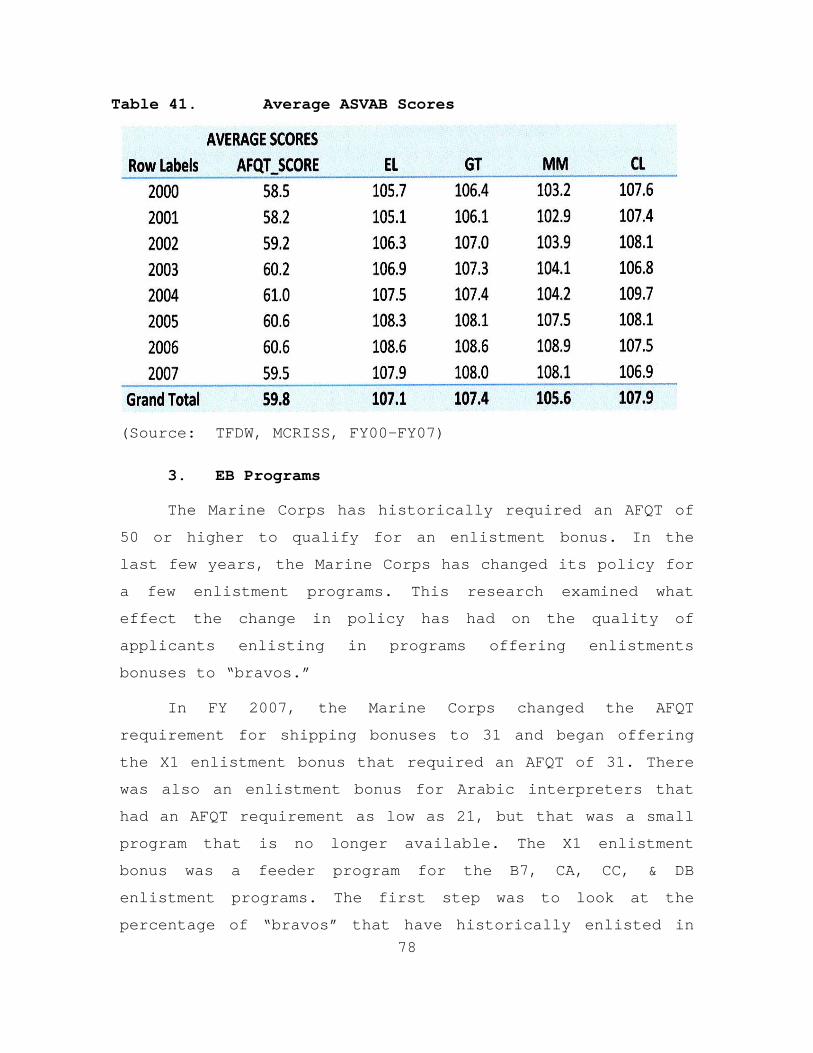
78
Table 41. Average ASVAB Scores
(Source: TFDW, MCRISS, FY00-FY07)
3. EB Programs
The Marine Corps has historically required an AFQT of
50 or higher to qualify for an enlistment bonus. In the
last few years, the Marine Corps has changed its policy for
a few enlistment programs. This research examined what
effect the change in policy has had on the quality of
applicants enlisting in programs offering enlistments
bonuses to “bravos.”
In FY 2007, the Marine Corps changed the AFQT
requirement for shipping bonuses to 31 and began offering
the X1 enlistment bonus that required an AFQT of 31. There
was also an enlistment bonus for Arabic interpreters that
had an AFQT requirement as low as 21, but that was a small
program that is no longer available. The X1 enlistment
bonus was a feeder program for the B7, CA, CC, & DB
enlistment programs. The first step was to look at the
percentage of “bravos” that have historically enlisted in
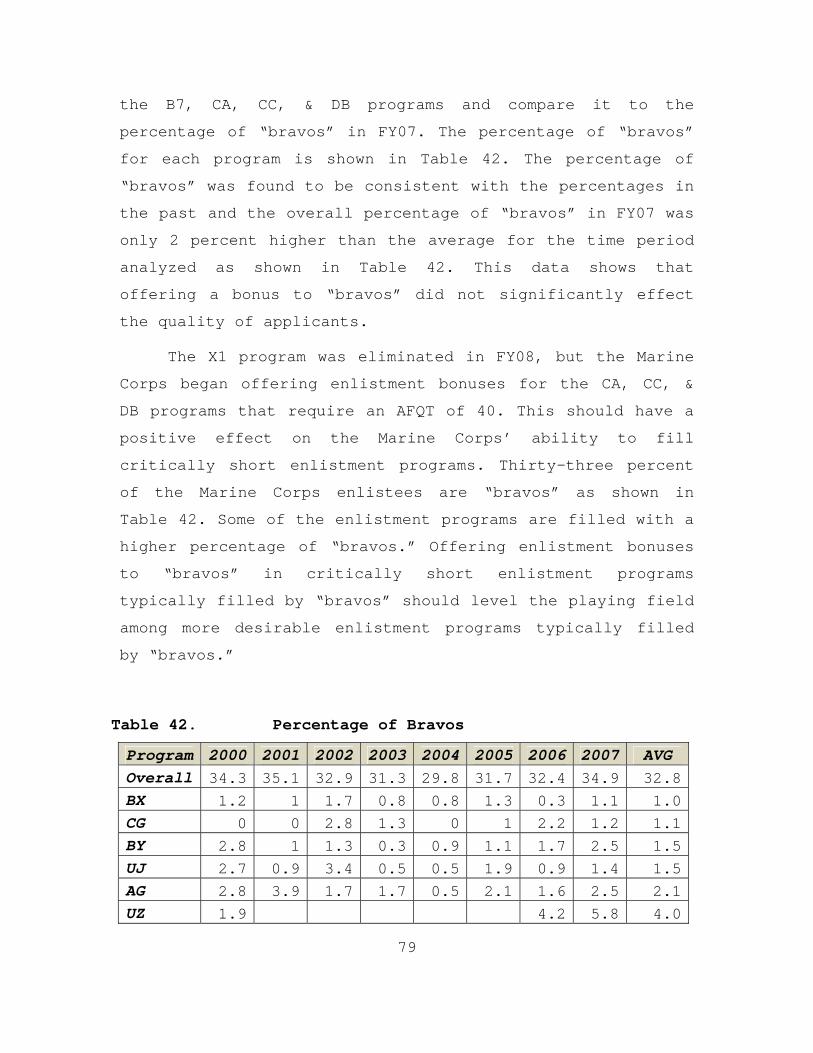
79
the B7, CA, CC, & DB programs and compare it to the
percentage of “bravos” in FY07. The percentage of “bravos”
for each program is shown in Table 42. The percentage of
“bravos” was found to be consistent with the percentages in
the past and the overall percentage of “bravos” in FY07 was
only 2 percent higher than the average for the time period
analyzed as shown in Table 42. This data shows that
offering a bonus to “bravos” did not significantly effect
the quality of applicants.
The X1 program was eliminated in FY08, but the Marine
Corps began offering enlistment bonuses for the CA, CC, &
DB programs that require an AFQT of 40. This should have a
positive effect on the Marine Corps’ ability to fill
critically short enlistment programs. Thirty-three percent
of the Marine Corps enlistees are “bravos” as shown in
Table 42. Some of the enlistment programs are filled with a
higher percentage of “bravos.” Offering enlistment bonuses
to “bravos” in critically short enlistment programs
typically filled by “bravos” should level the playing field
among more desirable enlistment programs typically filled
by “bravos.”
Table 42. Percentage of Bravos
Program 2000 2001 2002 2003 2004 2005 2006 2007 AVG Overall 34.3 35.1 32.9 31.3 29.8 31.7 32.4 34.9 32.8BX 1.2 1 1.7 0.8 0.8 1.3 0.3 1.1 1.0CG 0 0 2.8 1.3 0 1 2.2 1.2 1.1BY 2.8 1 1.3 0.3 0.9 1.1 1.7 2.5 1.5UJ 2.7 0.9 3.4 0.5 0.5 1.9 0.9 1.4 1.5AG 2.8 3.9 1.7 1.7 0.5 2.1 1.6 2.5 2.1UZ 1.9 4.2 5.8 4.0
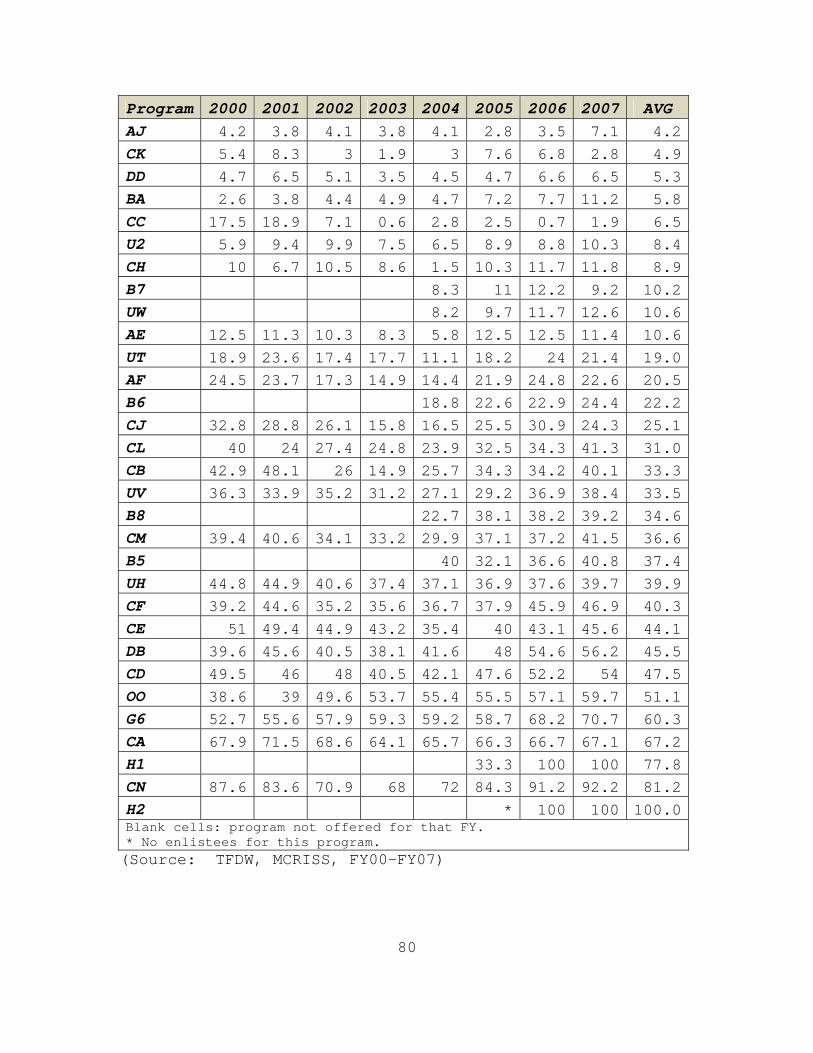
80
Program 2000 2001 2002 2003 2004 2005 2006 2007 AVG AJ 4.2 3.8 4.1 3.8 4.1 2.8 3.5 7.1 4.2CK 5.4 8.3 3 1.9 3 7.6 6.8 2.8 4.9DD 4.7 6.5 5.1 3.5 4.5 4.7 6.6 6.5 5.3BA 2.6 3.8 4.4 4.9 4.7 7.2 7.7 11.2 5.8CC 17.5 18.9 7.1 0.6 2.8 2.5 0.7 1.9 6.5U2 5.9 9.4 9.9 7.5 6.5 8.9 8.8 10.3 8.4CH 10 6.7 10.5 8.6 1.5 10.3 11.7 11.8 8.9B7 8.3 11 12.2 9.2 10.2UW 8.2 9.7 11.7 12.6 10.6AE 12.5 11.3 10.3 8.3 5.8 12.5 12.5 11.4 10.6UT 18.9 23.6 17.4 17.7 11.1 18.2 24 21.4 19.0AF 24.5 23.7 17.3 14.9 14.4 21.9 24.8 22.6 20.5B6 18.8 22.6 22.9 24.4 22.2CJ 32.8 28.8 26.1 15.8 16.5 25.5 30.9 24.3 25.1CL 40 24 27.4 24.8 23.9 32.5 34.3 41.3 31.0CB 42.9 48.1 26 14.9 25.7 34.3 34.2 40.1 33.3UV 36.3 33.9 35.2 31.2 27.1 29.2 36.9 38.4 33.5B8 22.7 38.1 38.2 39.2 34.6CM 39.4 40.6 34.1 33.2 29.9 37.1 37.2 41.5 36.6B5 40 32.1 36.6 40.8 37.4UH 44.8 44.9 40.6 37.4 37.1 36.9 37.6 39.7 39.9CF 39.2 44.6 35.2 35.6 36.7 37.9 45.9 46.9 40.3CE 51 49.4 44.9 43.2 35.4 40 43.1 45.6 44.1DB 39.6 45.6 40.5 38.1 41.6 48 54.6 56.2 45.5CD 49.5 46 48 40.5 42.1 47.6 52.2 54 47.5OO 38.6 39 49.6 53.7 55.4 55.5 57.1 59.7 51.1G6 52.7 55.6 57.9 59.3 59.2 58.7 68.2 70.7 60.3CA 67.9 71.5 68.6 64.1 65.7 66.3 66.7 67.1 67.2H1 33.3 100 100 77.8CN 87.6 83.6 70.9 68 72 84.3 91.2 92.2 81.2H2 * 100 100 100.0Blank cells: program not offered for that FY. * No enlistees for this program. (Source: TFDW, MCRISS, FY00-FY07)
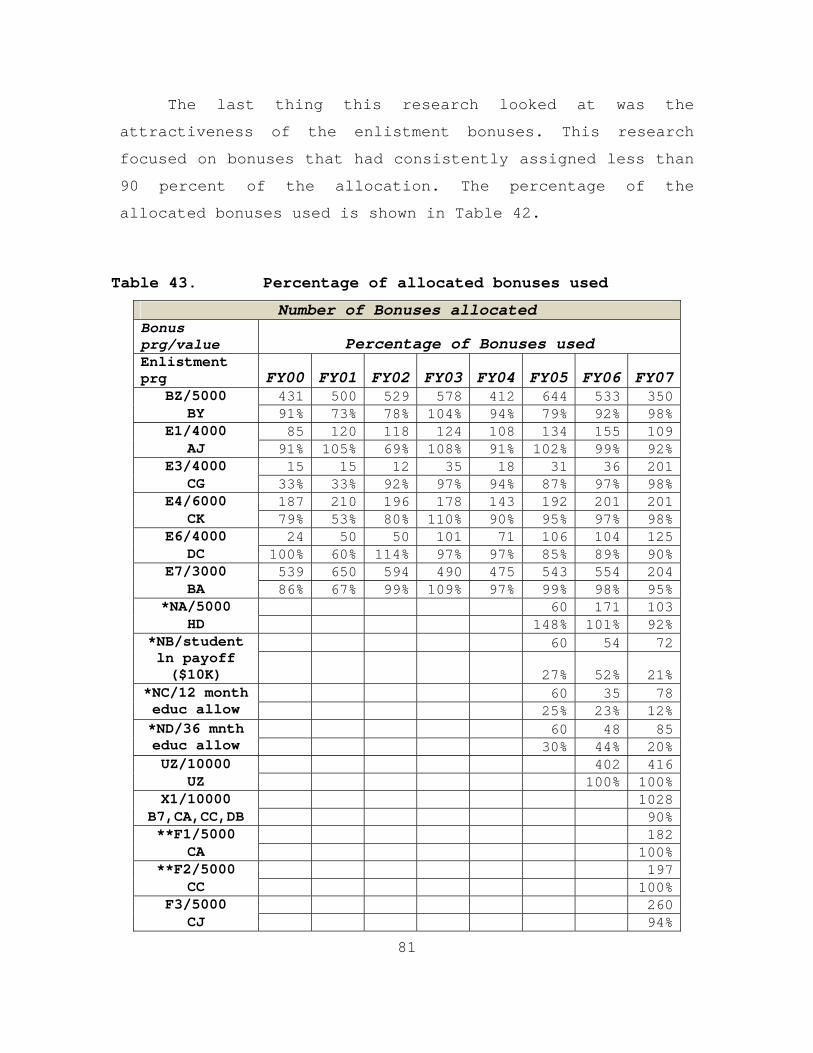
81
The last thing this research looked at was the
attractiveness of the enlistment bonuses. This research
focused on bonuses that had consistently assigned less than
90 percent of the allocation. The percentage of the
allocated bonuses used is shown in Table 42.
Table 43. Percentage of allocated bonuses used
Number of Bonuses allocated Bonus prg/value Percentage of Bonuses used Enlistment prg FY00 FY01 FY02 FY03 FY04 FY05 FY06 FY07
BZ/5000 431 500 529 578 412 644 533 350BY 91% 73% 78% 104% 94% 79% 92% 98%
E1/4000 85 120 118 124 108 134 155 109AJ 91% 105% 69% 108% 91% 102% 99% 92%
E3/4000 15 15 12 35 18 31 36 201CG 33% 33% 92% 97% 94% 87% 97% 98%
E4/6000 187 210 196 178 143 192 201 201CK 79% 53% 80% 110% 90% 95% 97% 98%
E6/4000 24 50 50 101 71 106 104 125DC 100% 60% 114% 97% 97% 85% 89% 90%
E7/3000 539 650 594 490 475 543 554 204BA 86% 67% 99% 109% 97% 99% 98% 95%
*NA/5000 60 171 103HD 148% 101% 92%
60 54 72*NB/student ln payoff ($10K) 27% 52% 21%
60 35 78*NC/12 month educ allow 25% 23% 12%
60 48 85*ND/36 mnth educ allow 30% 44% 20%UZ/10000 402 416
UZ 100% 100%X1/10000 1028
B7,CA,CC,DB 90%**F1/5000 182
CA 100%**F2/5000 197
CC 100%F3/5000 260
CJ 94%
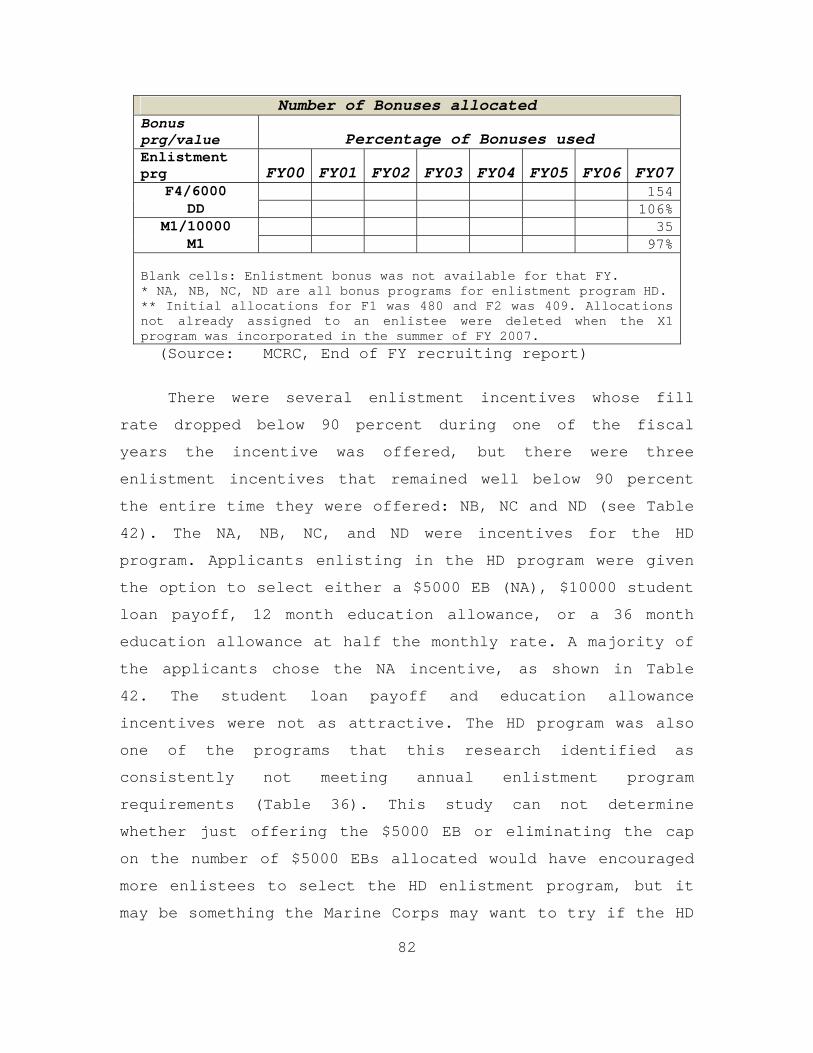
82
Number of Bonuses allocated Bonus prg/value Percentage of Bonuses used Enlistment prg FY00 FY01 FY02 FY03 FY04 FY05 FY06 FY07
F4/6000 154DD 106%
M1/10000 35M1 97%
Blank cells: Enlistment bonus was not available for that FY. * NA, NB, NC, ND are all bonus programs for enlistment program HD. ** Initial allocations for F1 was 480 and F2 was 409. Allocations not already assigned to an enlistee were deleted when the X1 program was incorporated in the summer of FY 2007.
(Source: MCRC, End of FY recruiting report)
There were several enlistment incentives whose fill
rate dropped below 90 percent during one of the fiscal
years the incentive was offered, but there were three
enlistment incentives that remained well below 90 percent
the entire time they were offered: NB, NC and ND (see Table
42). The NA, NB, NC, and ND were incentives for the HD
program. Applicants enlisting in the HD program were given
the option to select either a $5000 EB (NA), $10000 student
loan payoff, 12 month education allowance, or a 36 month
education allowance at half the monthly rate. A majority of
the applicants chose the NA incentive, as shown in Table
42. The student loan payoff and education allowance
incentives were not as attractive. The HD program was also
one of the programs that this research identified as
consistently not meeting annual enlistment program
requirements (Table 36). This study can not determine
whether just offering the $5000 EB or eliminating the cap
on the number of $5000 EBs allocated would have encouraged
more enlistees to select the HD enlistment program, but it
may be something the Marine Corps may want to try if the HD

83
program is incorporated again.33 In addition there were two
incentives offered in FY07 that the Marine Corps identified
as not enticing enough enlistees: F1 and F2 (HQMC, M&RA,
Enlisted Plans Section). The initial allocation for the F1
was 480 bonuses and the F2 was 409 bonuses. Actually, the
Marine Corps used less than 50 percent of the original
allocation. The F1 and F2 both offered a $5000 EB and they
required a minimum AFQT of 50 to qualify for the bonus. The
F1 was a bonus program for the CA enlistment program and
the F2 was a bonus program for the CC enlistment program.
In the summer of 2007, any F1 and F2 allocations that had
not already been assigned were deleted and the Marine Corps
incorporated the X1.34 The X1 EB offered a $10000 EB,
required a minimum AFQT of 31 to qualify, and was a bonus
program for enlistment programs B7, CA, CC, and DB. In the
three-month time period during which the X1 was offered, 90
percent of the 1000 bonuses allocated were used.35 The
question this research can not answer is, did reducing the
AFQT requirement or increasing the monetary incentive have
the larger effect on assigning the bonus? If the AFQT
requirement had been reduced on the F1 program, it might
have attracted more enlistees, since a majority of those
who enlist into the CA program are “bravos,” as shown in
Table 42. As stated previously the Marine Corps began to
offer more enlistment bonuses to “bravos” in FY08.
33 The HD program was not offered in FY08 (HQMC, M&RA, Enlisted Plans
Section) 34 Chapter II, page 26 of this thesis provides additional information
on the X1 program. 35 Phone conversation USMC representative assigned to M&RA, Enlisted
Plans Section.

84
THIS PAGE INTENTIONALLY LEFT BLANK
85
V. SUMMARY, CONCLUSIONS, AND RECOMMENDATIONS
A. SUMMARY
This research analyzed the Marine Corps enlistment
bonus program (EBP). The purpose was to provide MPP-20 with
alternatives to increase the effectiveness of the EBP. The
research was primarily qualitative, but it included a
quantative analysis of the recruiting data from the Total
Force Data Warehouse and the Marine Corps Recruiting
Command.
The Marine Corps uses the EBP to attract high-quality
applicants into enlistment programs for critically short
military occupational skills. The research found that the
Marine Corps has been very successful at meeting its yearly
recruiting goal. The problem lies in recruiting the correct
number of applicants into each enlistment program and
shipping the applicants to recruit training at a specified
time. The research analyzed previous studies to find
methods that could be used to predict the optimal
enlistment incentive in order to level the playing field
between assumed “desirable” enlistment programs and
“undesirable” enlistment programs.
The methodologies of previous studies have varied, but
generally they used regression analysis on historical data
or analysis of survey responses. The advantage of
historical data is that it tends to be readily available
and it captures real choices with binding decisions. One
drawback to historical data is that there has to be
sufficient variation in the data to effectively estimate
the effects of the monetary incentives. Surveys used to

86
analyze monetary incentives vary in complexity, but they
typically gather data from either the civilian youth
population or military recruits. An advantage to collecting
information from military recruits is that they are more
accessible, and are familiar with military programs.
Recruits can also provide insight into why they chose to
enlist, what they would have done in the absence of an
incentive, and what decisions they would have made if other
incentives had been offered. The drawback to surveys is
that applicable surveys are not always available, and
developing surveys and collecting the data can be time-
intensive and costly.
The research analyzed recruiting data from the Total
Force Data Warehouse (TFDW) and the Marine Corps Recruiting
Command. The TFDW was missing a large amount of recruiting
data before FY 2000, so this research used recruiting data
from FY 2000 through FY 2007 only. Marine Corps Recruiting
Command (MCRC) was also limited on how far back it could
provide data, but it was able to provide data from FY 2000
through FY 2007 as well. The data obtained could not be
used to effectively estimate the optimal value of an
enlistment bonus, but the recruiting data was useful in
identifying relationships inherent to the data.
B. CONCLUSION AND RECOMMENDATIONS
1. Primary Research Question
a. How can MPP-20 Effectively Predict the Optimal Dollar Amount for Enlistment Bonuses?
Conclusion: MPP-20 could effectively predict the
optimal dollar amount of enlistment incentives by

87
collecting survey data from enlistees or recruits. The
survey should have the participants repeatedly select from
a short list of enlistment programs and incentives to
determine the participant’s preference. The focus of the
survey should be on determining what incentives will level
the playing field between assumed “desirable” and
“undesirable” enlistment programs. Tabulation of the
choices made by survey participants and multiple regression
analysis can be used to determine the marginal effects of
different enlistment incentives.
Recommendation: This research recommends that
during the first week of recruit training, the Marine Corps
should administer a choice-based survey focused on
enlistment programs and incentives to recruits. The
information gathered could be used to determine the
incentive preferences of recruits that chose to join the
Marine Corps. This would also give feedback on hypothetical
incentives being considered by the Marine Corps.
2. Secondary Research Questions
a. Can Data from the TFDW be used to Effectively Predict the Optimal Dollar Amount for Enlistment Bonuses?
Conclusion: This research determined that data
from the TFDW cannot be used to effectively predict the
optimal dollar amount for enlistment bonuses. The reasons
the TFDW data could not be used as shown in chapter IV are
these. First, the research was limited on how far back data
could be collected on the Marine Corps EBP. Second, until
recently, only a limited number of enlistment programs
qualified for an enlistment bonus, and the budget for the
88
EBP had been relatively small. Third, there is minimal
variation in the values of the bonuses during the time
period used in this research.
Recommendation: Continue to collect and maintain
recruiting data in the TFDW. Recent increases in the
enlistment bonus program may create adequate variation to
permit effective analysis of TFDW data in the future.
b. Do Minimum AFQT Requirements for Enlistment Bonus Programs Decrease the Effectiveness of the Enlistment Bonus Program?
Conclusion: The research was not able to
determine with confidence if minimum AFQT requirements
decrease the effectiveness of the EBP. This research did
identify circumstances where authorizing enlistment bonuses
to “bravos” may have increased the effectiveness of the EBP
as shown in chapter IV. For example, the X1 enlistment
bonus that required a minimum AFQT of 31 was more effective
at attracting enlistees to select the CA program than the
F1 enlistment bonus with a minimum AFQT requirement of 50.
The X1 also offered a larger incentive, so this research
cannot determine whether increasing the incentive or
reducing the minimum AFQT requirement had the larger
effect. There are other factors described in chapter 4 that
support authorizing enlistment bonuses to “bravos.”
Recommendation: MPP-20 should continue
experimenting with EBP requirements.
c. What Factors Could be Decreasing the Effectiveness of the EBP.
Conclusion: The Marine Corps EBP was unchanged
for several years (FY00-FY05). The reasoning behind not
89
changing the EBP was that the budget was relatively small
and the Marine Corps was consistently meeting its annual
recruiting goal, so representatives did not see a need to
modify the EBP.36 Failing to allocate additional funds or
change the enlistment programs that qualified for an
enlistment bonus could be the reason that, as shown in
chapter 4, some enlistment programs were consistently short
of their annual requirement.
Additionally, there were several enlistment
programs that had exceeded their annual requirement. For
example, the UH program exceeded its annual requirement in
FY01 by 466 enlistees. This reduces the pool of applicants
who can be assigned to critically short enlistment
programs. In the past few years, MPP-20 has reduced the
number of enlistees authorized for assignment to enlistment
programs that have met their annual requirement. The fill
rate of enlistment programs needs continuous monitoring to
prevent exceeding annual requirements and reducing the
number of critically short enlistment programs.
The research identified that over 50 percent of
the enlistees with open contracts are “bravos” and, as
shown in Chapter IV, that some enlistment programs have a
very low percentage of “bravos.” Naturally, these are
enlistment programs that have a smaller pool of qualified
applicants. For example, approximately 2 percent of the CC
and BY programs are “bravos.” Relying on open contracts to
36 (Source: phone conversation with representative assigned to M&RA,
Enlisted Plans Section and MCRC).

90
fill all of the critically short enlistment programs could
leave some enlistment programs short of qualified
enlistees.
Recommendation: Change the mandatory annual
meeting with MPP-20 and MCRC to a quarterly meeting. This
will increase the communication between the two
organizations and ensure that the enlistment programs and
the EBP are continuously monitored to ensure the
effectiveness of the program. This will be useful, because
as the market changes, or if the fill rate for an
enlistment program is not progressing as planned, timely
actions can be taken to correct the deficiency.
C. AREAS FOR FURTHER RESEARCH AND STUDY
There are three recommendations for further research
to increase the effectiveness of the EBP.
1. Recommend developing a choice-based survey to
determine the incentive preferences for Marine Corps
enlistees. Determine whether the information gathered from
the survey could be used to predict the optimal incentive
for enlistment bonuses.
2. Examine what effect, if any, enlistment bonuses may
have on the successful completion of military occupational
skills (MOS) training. Is there a higher rate of completion
of initial MOS training among enlistees assigned an
enlistment bonus than among enlistees not assigned an
enlistment bonus?
3. Examine the effectiveness of using open contracts
to fill critically short enlistment programs. A small
percentage of enlistees are not assigned an enlistment

91
program prior to recruit training. Enlistees not assigned
an enlistment program (open contract) are used to fill
critically short enlistment programs. Are there enough
qualified open contracts to fill all of the critically
short enlistment programs?

92
THIS PAGE INTENTIONALLY LEFT BLANK

93
LIST OF REFERENCES
Asch, B., Hosek, J.R., Arkes, J., Fair, C.C., Sharp, J., and Totten, M. (2002). Military Recruiting and Retention After the Fiscal Year 2000 Military Pay Legislation (Technical Report). Santa Monica, CA: RAND Corporation. Department of Defense. (2005, January 31). Policy on Enlistment Bonuses, Accession Bonuses for New Officers in Critical Skills, Selective Reenlistment Bonuses, and Critical Skills Retention Bonuses for Active Members (Department of Defense Directive 1304.21). Washington, DC: Author. Headquarters Marine Corps. (2002, June 2) Enlistment Option Programs (Marine Corps Order 1130.53P). Washington, DC: Author. Headquarters Marine Corps, Marine Corps Recruit Depot, Museum Historical Society. (2005) Recruit knowledge, Washington, DC: Author. Retrieved December 9, 2007 from http://www.recruitknowledge.com/pages/history/ mch1.htm accessed on 9 December 2007. Headquarters Marine Corps, Manpower and Reserve Affairs, Enlisted Plans Section. (2006). Manpower Plans and Policy Division Organization information brief, Washington, DC: Author. Headquarters Marine Corps, Manpower and Reserve Affairs. (2007). Retrieved October 10, 2007, from https://www.manpower.usmc.mil/portal/page?_pageid=278, 1&_dad=portal&_schema=PORTAL, accessed on 10 October 2007. Headquarters Marine Corps, Manpower and Reserve Affairs, Enlisted Plans Section. (2007). FY-07 Marine Corps monetary incentive program information brief, Washington, DC: Author. Headquarters Marine Corps, Manpower and Reserve Affairs, Personnel Management Division. (2007, August 5). Manpower management officer assignments-4, FY-08 road show information brief, Washington, DC: Author.

94
Headquarters Marine Corps, Marine Corps Recruiting Command. (2007, October 1). Statement of Understanding (Marine Corps Order 1130.53). Washington, DC: Author. Headquarters Marine Corps, Manpower and Reserve Affairs. Manpower Plans and Policy Division. (2008). Retrieved January 1, 2008, from https://www.manpower.usmc.mil /portal/page?pageid=278,1938361&_dad=portal&_schema= PORTAL, accessed on 1 January 2008. Headquarters Marine Corps, Marine Corps Recruiting Command. End of year recruiting reports (FY00-FY07), Washington, DC: Author. Joles, Charbonneau, & Barr, (1998, February). An Enlistment Bonus Distribution Model (Technical Report). West Point, NY: West Point. Kraus, Griffis, Golfin, (2000, August). Choice-Based Conjoint Study of Recruitment Incentives (Technical Report). Alexandria, VA: Center for Naval Analysis. Larson, H.J. (1995, February). Analysis of Recruiting Bonus Payments (Technical Report). Montrey, CA: Naval Post Graduate School. Palomba, Catherine A. (1983, January). U.S. Marine Corps Enlistment Bonus Program (Technical Report). Alexandria, VA: Center for Naval Analysis. Warner, J.T. and Asch, B.J. (2001). The Record and Prospects of the All-Volunteer Military in the United States. Journal of Economic Perspectives, volume 15, 169-192. Warner, Simon, and Payne, (2001, April). Enlistment Supply in the 1990s: A Study of the Naval College Fund and Other Enlistment Incentive Programs (Technical Report). Arlington, VA: Defense Manpower Data Center.
95
INITIAL DISTRIBUTION LIST
1. Defense Technical Information Center Ft. Belvoir, Virginia
2. Dudley Knox Library Naval Postgraduate School Monterey, California
3. Professor Steve Mehay Naval Postgraduate School Monterey, California
4. Professor Samuel Buttrey Naval Postgraduate School Monterey, California
5. CDR Bill Hatch Naval Postgraduate School Monterey, California
6. Major Mike Bruno Headquarters Marine Corps Manpower & Reserve Affairs Quantico, Virginia
7. Mr. Wayne Wagner Strategic Affairs Office Arlington Annex Washington, District of Columbia