timber creek field - university of · pdf fileblack oil material balance ... develop a...
TRANSCRIPT

Timber Creek Field: A Case Study in
Successful Exploitation
of a Producing Minnelusa Oil Field
Brad Bauer Jacob Hartgroves, Merit Energy Company

A Simple Formula for Success…
"Rise early. Work late. Strike oil.“
─ J. Paul Getty
“Don’t give me your best geologist… give me your luckiest.”
─ Ace Gutowsky
“Good fields get better.”
─ Merit Energy Company
Acquire + Operate + Exploit = 24 Years of Success

Powder River Basin - Minnelusa Play
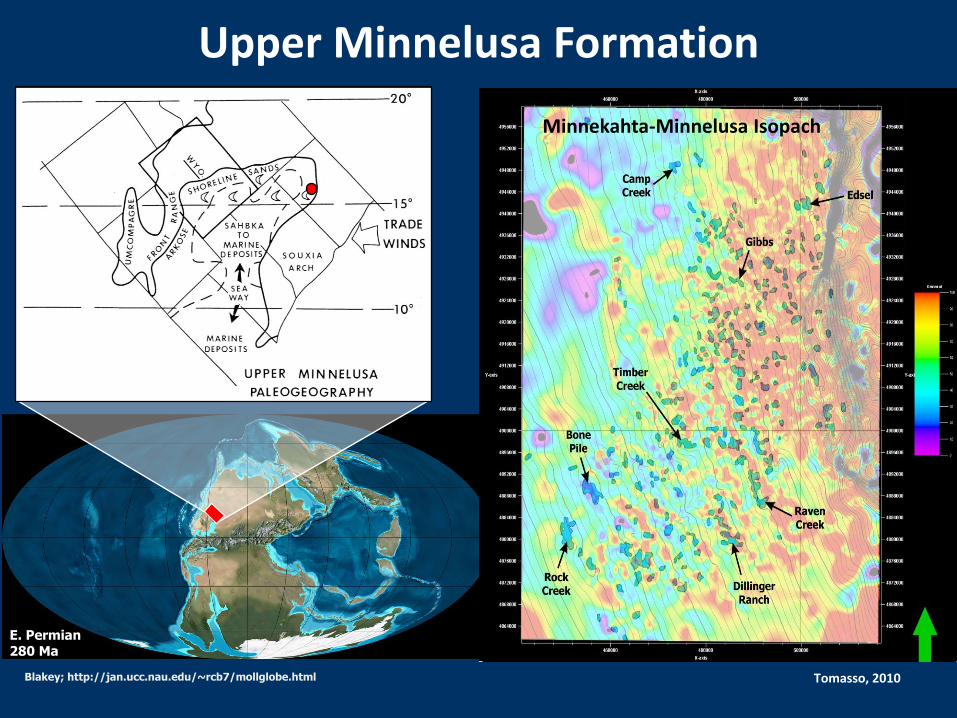
Upper Minnelusa Formation
E. Permian 280 Ma
Minnekahta-Minnelusa Isopach
• PMk-PMl ispach illustrates significant incision in the top PMl.
• Assumption:
• Top PMk was deposited ~flat.
• Opeche-aged drainage, filled with mudstone.
• Most fields found on SW side of large Opeche incisions:
• Excellent strat trap.
Pennsylvanian to Lower Permian in age.
Lateral equivalent to Tensleep, Casper, Ingleside, Weber Ssts.
Coastal dune field with inter-layered non-marine to marine lst.
Blakey; http://jan.ucc.nau.edu/~rcb7/mollglobe.html Tomasso, 2010

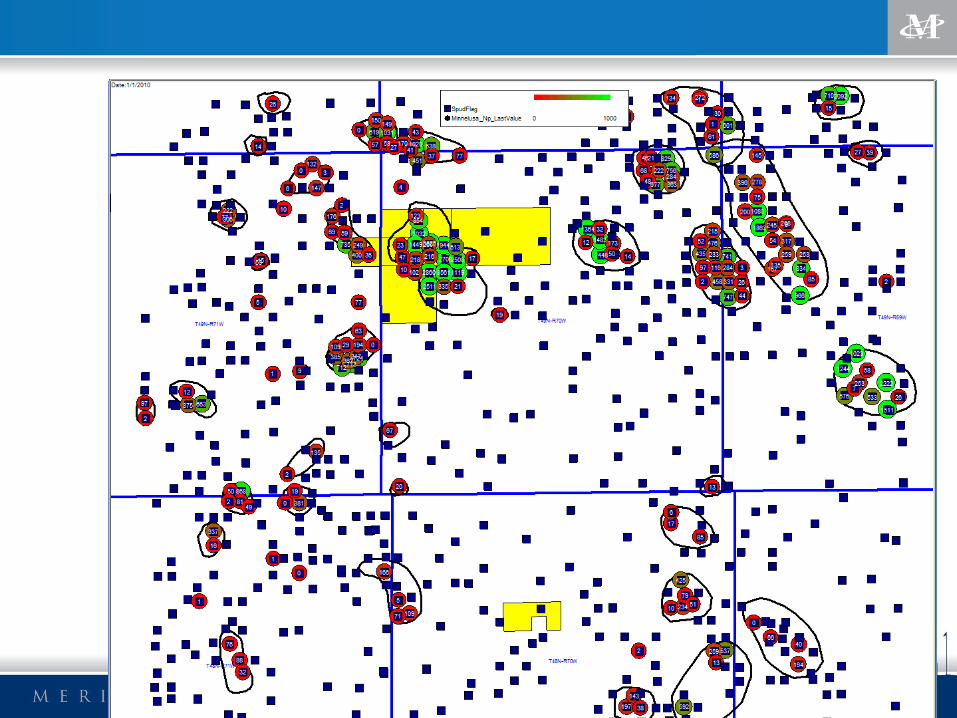
General Overview — Timber Creek Field (Campbell Co., WY) A_BURTBR
Timber Creek TOTAL Minnelusa ‘B’ & ‘C’ 7 Producers / 6 Injectors OOIP ≈ 55 mmbo [37% RF]
Current Rates
1,150 bopd
3,850 bwpd
3,850 bwipd
Outline of Productive
Minnelusa ‘B’

0
5
10
15
20
25
We
ll C
ou
nt
1962: Field Discovery
(LeSueur # 1 – 598 bopd + 6 bwpd)
1963: Primary Development
1966: Water re-injection / disposal initiated
(eastern flank)
1967: Western flank injection begins
1969: Southern flank injection begins
……………………………………………………….
1997: Merit acquired
1998: Field unitized
1998: Waterflood begins (Injection > Withdrawal)
2002: Toro # 3 drilled by Merit Energy
2008: Cook # 4 reactivated;
ESPs installed on Cook # 5 & Toro # 2;
Increased WINJ to ~ 2,500 bwipd
0
1
2
3
4
5
IWR
100
1,000
10,000
1960 1965 1970 1975 1980 1985 1990 1995 2000 2005 2010 2015
Ba
rre
ls P
er
Da
y
Water InjectionWater ProductionOil ProductionGas Production, mcf /d
Production HistoryTimber Creek Unit
Field History
1960 1961 1962 1963 1964
1965
1970
1980
1990
2000
2010
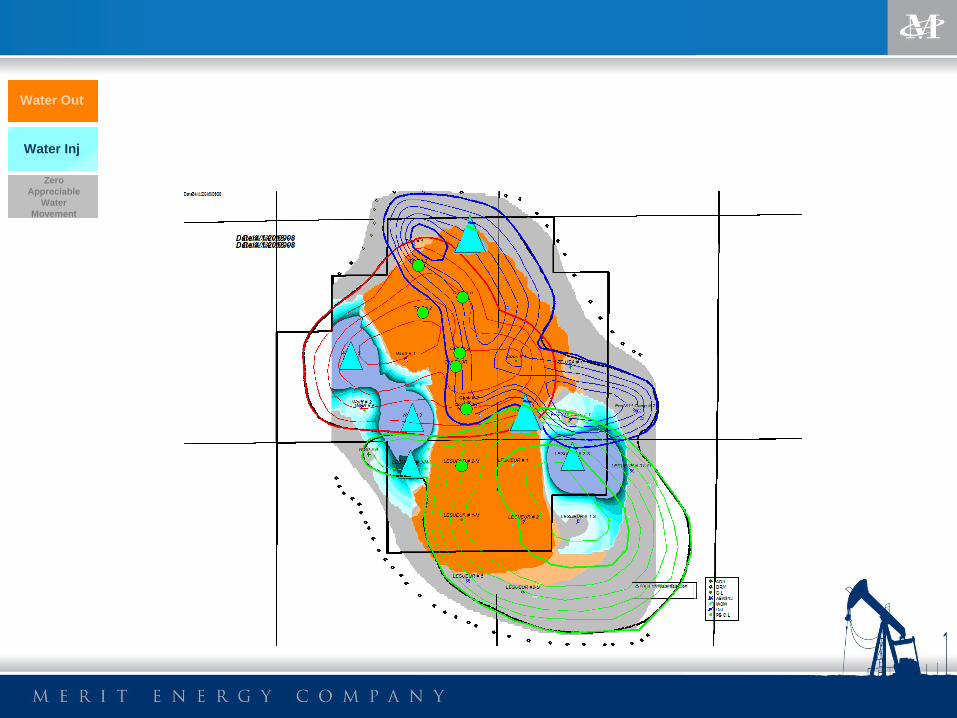
Water Out
Water Inj
Zero
Appreciable
Water
Movement

ModelBoundary
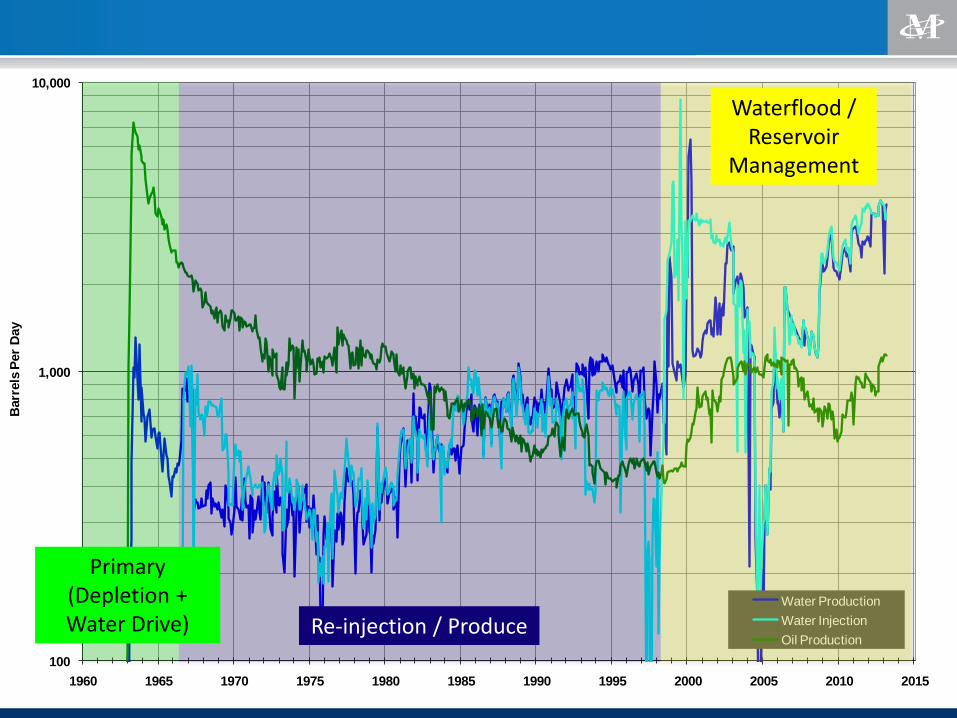
Evolving Geologic Interpretations
1960’s
1990’s
2000’s
CURRENT
100
1,000
10,000
1960 1965 1970 1975 1980 1985 1990 1995 2000 2005 2010 2015
Barr
els
Per
Day
Water Production
Water Injection
Oil ProductionRe-injection / Produce
Waterflood / Reservoir
Management
Primary (Depletion + Water Drive)

Water Out
Water Inj
Zero
Appreciable
Water
Movement
‘Primary’ Period

100
1,000
10,000
1960 1965 1970 1975 1980 1985 1990 1995 2000 2005 2010 2015 2020 2025 2030 2035
bp
d
Water Injection
Water Production
Oil Production
Production / Injection History
Timber Creek Field
(All)

100
1,000
10,000
1960 1965 1970 1975 1980 1985 1990 1995 2000 2005 2010 2015 2020 2025 2030 2035
bp
d
Water Injection
Water Production
Oil Production
Production / Injection History
Timber Creek Field
(All)
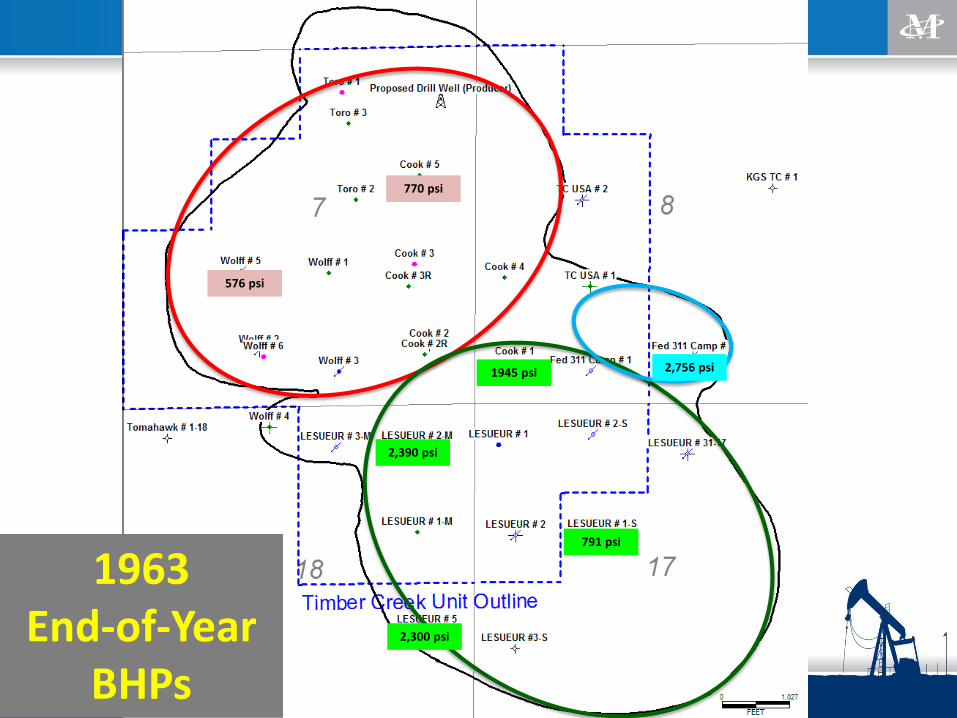
1963 End-of-Year
BHPs
2,756 psi
791 psi
576 psi
2,390 psi
1945 psi
770 psi
2,300 psi

1963 End-of-Year
BHPs
2,756 psi
791 psi
576 psi
2,390 psi
1945 psi
770 psi
2,300 psi

10
100
1,000
10,000
1960 1965 1970 1975 1980 1985 1990 1995 2000 2005 2010
Avera
ge M
on
thly
Rate
s
Gas - mcfpd
GINJ - mcfpd
Water - bwpd
WINJ - bwpd
Oil - bopd
Production / Injection History
Timber Creek Field - Green Pod
(All)

Equations
Black Oil Material Balance
PPS
CSCBmEExpansionWaterFormation
B
BBEExpansionGas
BRRBBEExpansionOil
BWWBRRBNFWithdrawaldUndergroun
BWEEmENFFormGeneral
iwc
fwcwoiwf
gi
goig
gssioioo
wipgspop
wewfgo
11&
1
,
,
Oil Material Balance
Equations
Black Oil Material Balance
PPS
CSCBmEExpansionWaterFormation
B
BBEExpansionGas
BRRBBEExpansionOil
BWWBRRBNFWithdrawaldUndergroun
BWEEmENFFormGeneral
iwc
fwcwoiwf
gi
goig
gssioioo
wipgspop
wewfgo
11&
1
,
,
What are the effects of water influx?

Water (Aquifer)
Influx is the Primary
Driver for Production
in the “Green” Pod
Pi = 3,655 psi N = 15,280,590 stb
P = 1,860 psi G = 993,238 mcf
W = 4,083,474 stb
Np = 1,136,736 stb Bo = 1.081 rb/stb
Gp = 73,888 mcf Boi = 1.070 rb/stb
Rp = 65 scf/stb Rs = 65 scf/stb
Wp = 116,754 stb Rsi = 65 scf/stb
Wi = 0 stb Bg = 0.00144 rb/scf
Oil Recovery = 7.4% Bgi = 0.00080 rb/scf
Gas Recovery = 7.4% Bw = 1.001 rb/stb
Swi = 20.0% Depletion Drive Index = 14%
m = 0 Gas Cap Drive Index = 0%
Cw = 0.00E+00 psi-1 Water Drive Index = 86%
Cf = 0.00E+00 psi-1 Pore Volume Index = 0%
F --- 1346177.494 Cumulatives as of Jan-64
Eo --- 0.011435567
Eg --- 0.852992423
Ef,w --- 0
We --- 1,170,265 stb
Expansion / Withdrawal / Influx Notes / Comments
Production / Injection PVT Properties
Other Expansion Terms Reservoir Indices
Pressures Volumetrics
Assume Volumetric OOIP

Pi = 3,655 psi N = 15,757,830 stb
P = 511 psi G = 1,024,259 mcf
W = 4,211,009 stb
Np = 1,147,774 stb Bo = 1.089 rb/stb
Gp = 74,605 mcf Boi = 1.070 rb/stb
Rp = 65 scf/stb Rs = 52 scf/stb
Wp = 165,965 stb Rsi = 65 scf/stb
Wi = 0 stb Bg = 0.00604 rb/scf
Oil Recovery = 7.3% Bgi = 0.00080 rb/scf
Gas Recovery = 7.3% Bw = 1.001 rb/stb
Swi = 20.0% Depletion Drive Index = 112%
m = 0 Gas Cap Drive Index = 0%
Cw = 0.00E+00 psi-1 Water Drive Index = -12%
Cf = 0.00E+00 psi-1 Pore Volume Index = 0%
F --- 1503782.121 Cumulatives as of Jan-64
Eo --- 0.095430787
Eg --- 7.01479143
Ef,w --- 0
We --- 0 stb
Pressures Volumetrics
Expansion / Withdrawal / Influx Notes / Comments
Production / Injection PVT Properties
Other Expansion Terms Reservoir Indices
But Not in the Other
Pods…
2,756 psi
791 psi
576 psi
2,390 psi
1945 psi
770 psi
2,300 psi

Water Out Water Inj
Zero
Appreciable
Water
Movement
Re-injection Period
1967 1974 1981
1985 1991 1996

100
1,000
10,000
1960 1965 1970 1975 1980 1985 1990 1995 2000 2005 2010 2015 2020 2025 2030 2035
bp
d
Water Injection
Water Production
Oil Production
Production / Injection History
Timber Creek Field
(All)

100
1,000
10,000
1960 1965 1970 1975 1980 1985 1990 1995 2000 2005 2010 2015 2020 2025 2030 2035
bp
d
Water Injection
Water Production
Oil Production
Production / Injection History
Timber Creek Field
(All)

0
100
200
300
400
500
600
700
800
900
1,000
0
200
400
600
800
1,000
1,200
1,400
1,600
1,800
2,000
1980 1981 1982 1983 1984 1985 1986 1987 1988 1989 1990 1991 1992 1993 1994 1995
bo
pd
rbp
d
Total Liquids - rbpd
Total Injection - rbpd
Oil - bopd
Injection / Withdrawal History
Timber Creek Field
(All)

Changing Fluid Rates…
What’s the next step in development?
0
100
200
300
400
500
600
700
800
900
1/3
1/1
98
5
1/3
1/1
98
6
1/3
1/1
98
7
1/3
1/1
98
8
1/3
1/1
98
9
1/3
1/1
99
0
1/3
1/1
99
1
1/3
1/1
99
2
1/3
1/1
99
3
1/3
1/1
99
4
1/3
1/1
99
5
1/3
1/1
99
6
Wolff # 1
Toro # 2
LeSueur # 3-M
LeSueur # 2-M
LeSueur # 1-M
LeSueur # 1
Fed 311 Camp # 1
Cook # 5
Cook # 4
Cook # 3R
Cook # 2R
Cook # 1
0
200
400
600
800
1,000
1,200
1,400
1,600
1,800
2,000
1/3
1/1
98
5
1/3
1/1
98
6
1/3
1/1
98
7
1/3
1/1
98
8
1/3
1/1
98
9
1/3
1/1
99
0
1/3
1/1
99
1
1/3
1/1
99
2
1/3
1/1
99
3
1/3
1/1
99
4
1/3
1/1
99
5
Wolff # 1
Toro # 2
LeSueur # 3-M
LeSueur # 2-M
LeSueur # 1-M
LeSueur # 1
Fed 311 Camp # 1
Cook # 5
Cook # 4
Cook # 3R
Cook # 2R
Cook # 1
Oil Rate, bpd
Total Fluid Rate, bpd

100
1,000
10,000
1960 1965 1970 1975 1980 1985 1990 1995 2000 2005 2010 2015 2020 2025 2030 2035
bp
d
Water Injection
Water Production
Oil Production
Production / Injection History
Timber Creek Field
(All)

Waterflood Implementation
2000

100
1,000
10,000
1960 1965 1970 1975 1980 1985 1990 1995 2000 2005 2010 2015 2020 2025 2030 2035
bp
d
Water Injection
Water Production
Oil Production
Production / Injection History
Timber Creek Field
(All)

100
1,000
10,000
1960 1965 1970 1975 1980 1985 1990 1995 2000 2005 2010 2015 2020 2025 2030 2035
bp
d
Water Injection
Water Production
Oil Production
Production / Injection History
Timber Creek Field
(All)
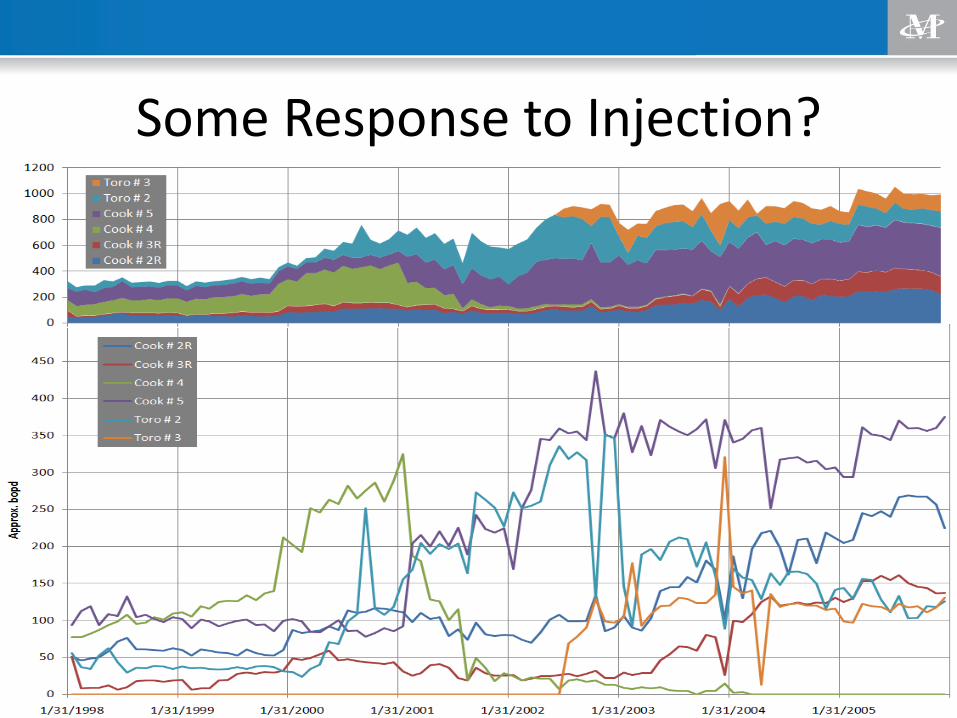
Some Response to Injection?
19
59
19
60
19
61
19
62
19
63
19
64
19
65
19
66 1
96
7 19
68 19
69
19
70
19
71
19
72
19
73
19
74
19
75
19
76
19
77
19
78
19
79
19
80
19
81
19
82
19
83
19
84
19
85
19
86
19
87
19
88
19
89
19
90
19
91
19
92
19
93
19
94
19
95
19
96
19
97
19
98
19
99
20
00
20
01
20
02
0%
5%
10%
15%
20%
25%
30%
35%
40%
45%
50%
-20% -10% 0% 10% 20% 30% 40%
Oil
Re
cove
ry F
acto
r, %
of O
OIP
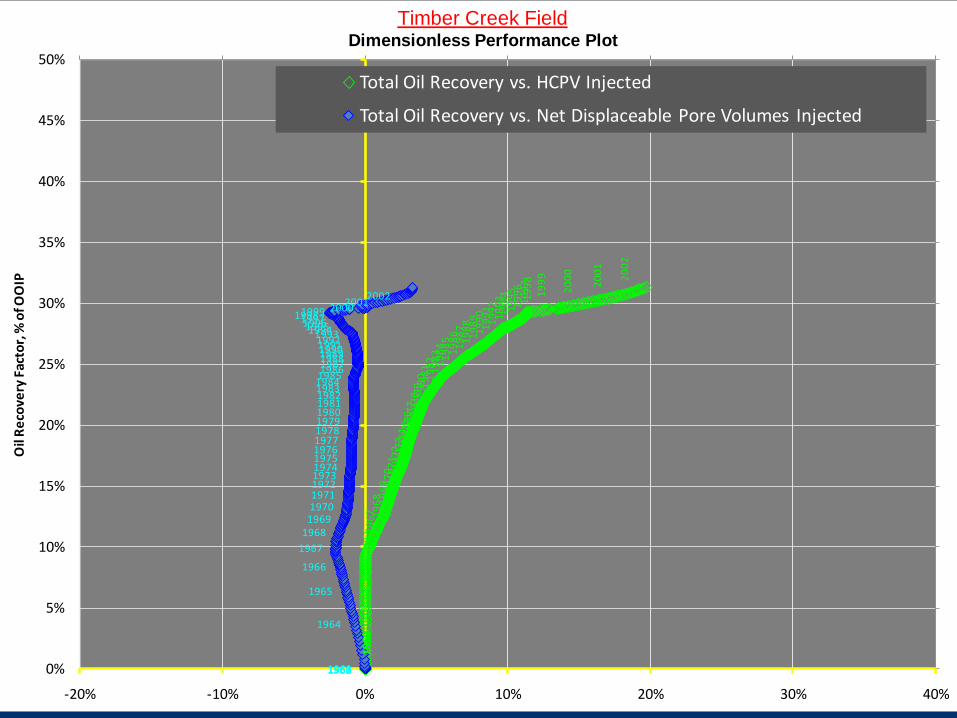
Total Oil Recovery vs. HCPV Injected
Total Oil Recovery vs. Net Displaceable Pore Volumes Injected
Dimensionless Performance Plot
Timber Creek Field
19
59
19
60
19
61
19
62
19
63
19
64
19
65
19
66 1
96
7 19
68 19
69
19
70
19
71
19
72
19
73
19
74
19
75
19
76
19
77
19
78
19
79
19
80
19
81
19
82
19
83
19
84
19
85
19
86
19
87
19
88
19
89
19
90
19
91
19
92
19
93
19
94
19
95
19
96
19
97
19
98
19
99
20
00
20
01
20
02
19591960196119621963
1964
1965
1966
1967
1968196919701971197219731974197519761977197819791980198119821983198419851986198719881989199019911992
1993199419951996199719981999 20002001
2002
0%
5%
10%
15%
20%
25%
30%
35%
40%
45%
50%
-20% -10% 0% 10% 20% 30% 40%
Oil
Re
cove
ry F
acto
r, %
of O
OIP
Total Oil Recovery vs. HCPV Injected
Total Oil Recovery vs. Net Displaceable Pore Volumes Injected
Dimensionless Performance Plot
Timber Creek Field

19
76
19
77
19
78
19
79
19
80
19
81
19
82
19
83
19
84
19
85
19
86
19
87
19
88
19
89
19
90
19
91
19
92
19
93
19
94
19
95
19
96
19
97 19
98
19
99
20
00
20
01
20
02
1%
10%
100%
10,000 15,000 20,000 25,000
Oil
Cu
t
Cumulative Oil Production, mbo
Actuals
Oil Cut vs. Cumulative Oil Production
Timber Creek Field
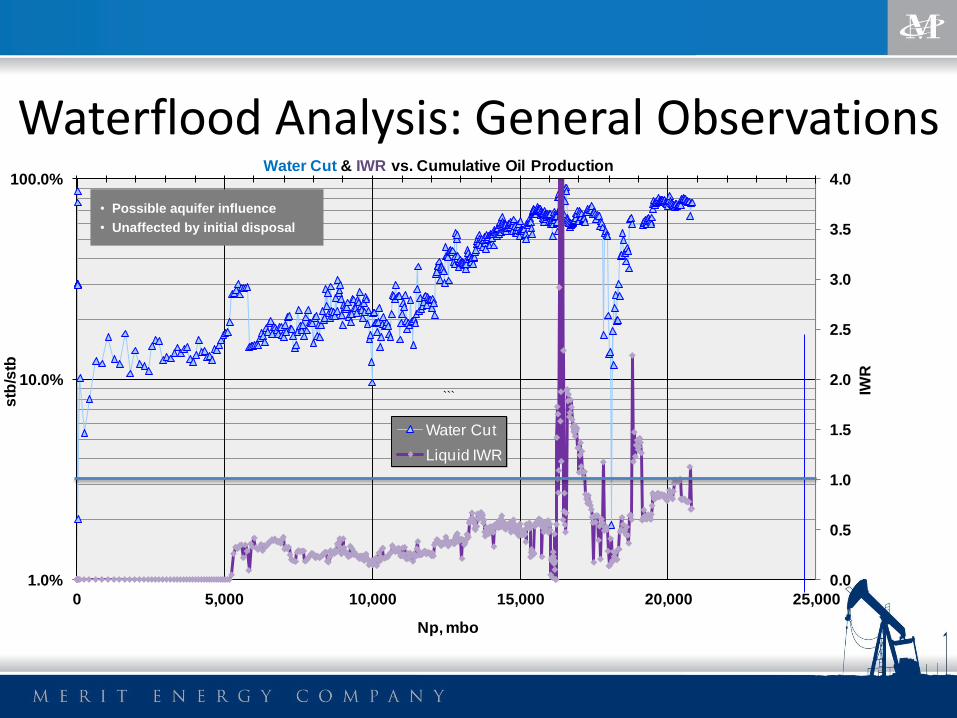
Waterflood Analysis: General Observations
0.0
0.5
1.0
1.5
2.0
2.5
3.0
3.5
4.0
1.0%
10.0%
100.0%
0 5,000 10,000 15,000 20,000 25,000
IWR
stb
/stb
Np, mbo
Water Cut
Liquid IWR
Water Cut & IWR vs. Cumulative Oil Production
```
• Possible aquifer influence
• Unaffected by initial disposal
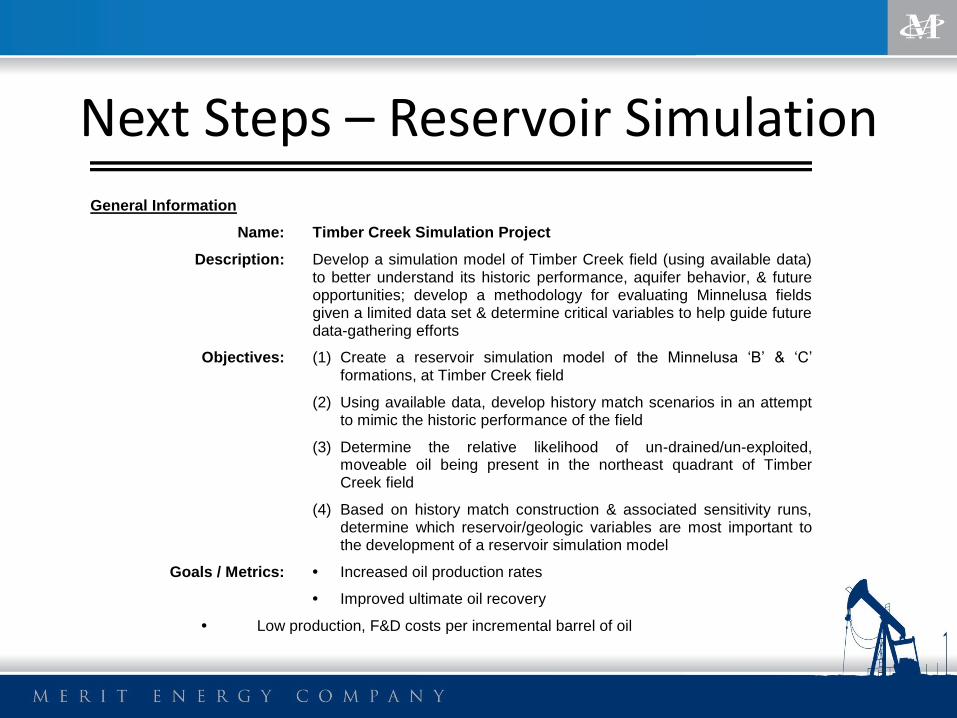
Next Steps – Reservoir Simulation
General Information
Name: Timber Creek Simulation Project
Description: Develop a simulation model of Timber Creek field (using available data) to better understand its historic performance, aquifer behavior, & future opportunities; develop a methodology for evaluating Minnelusa fields given a limited data set & determine critical variables to help guide future data-gathering efforts
Objectives: (1) Create a reservoir simulation model of the Minnelusa ‘B’ & ‘C’ formations, at Timber Creek field
(2) Using available data, develop history match scenarios in an attempt to mimic the historic performance of the field
(3) Determine the relative likelihood of un-drained/un-exploited, moveable oil being present in the northeast quadrant of Timber Creek field
(4) Based on history match construction & associated sensitivity runs, determine which reservoir/geologic variables are most important to the development of a reservoir simulation model
Goals / Metrics: • Increased oil production rates
• Improved ultimate oil recovery
• Low production, F&D costs per incremental barrel of oil

ModelBoundary
B Sand Blue
B Sand Red
B Sand Green
B Dolomite
Upper C Sand
Middle C Sand
Lower C Sand
B Region
Upper C Region
Lower C Region
B Dolomite Region
WY EORI – 2010 Reservoir Simulation
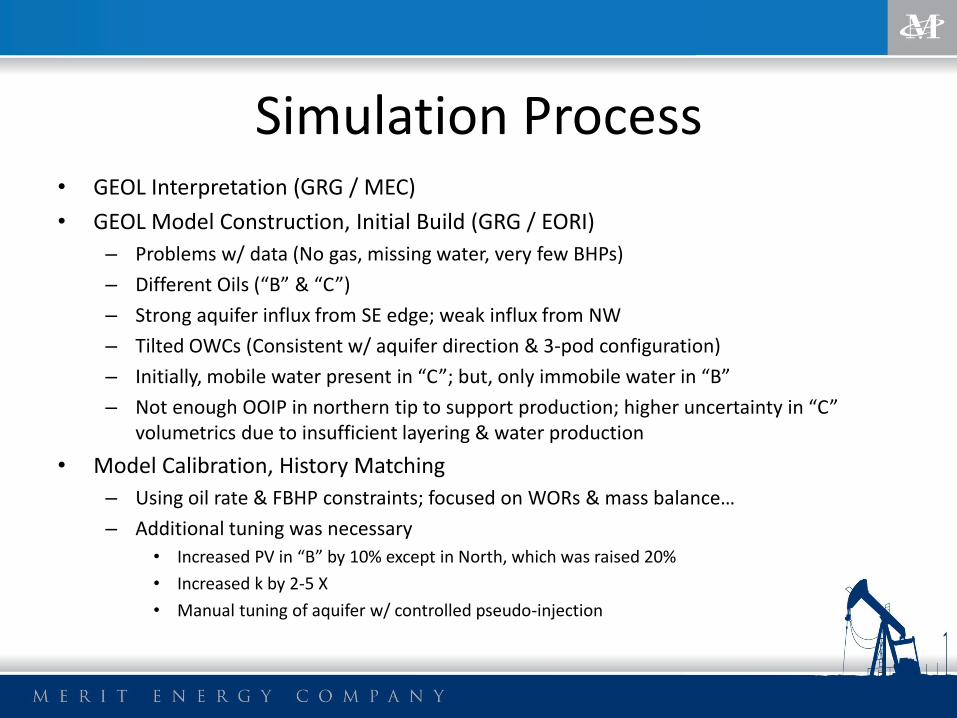
Simulation Process • GEOL Interpretation (GRG / MEC)
• GEOL Model Construction, Initial Build (GRG / EORI)
– Problems w/ data (No gas, missing water, very few BHPs)
– Different Oils (“B” & “C”)
– Strong aquifer influx from SE edge; weak influx from NW
– Tilted OWCs (Consistent w/ aquifer direction & 3-pod configuration)
– Initially, mobile water present in “C”; but, only immobile water in “B”
– Not enough OOIP in northern tip to support production; higher uncertainty in “C” volumetrics due to insufficient layering & water production
• Model Calibration, History Matching
– Using oil rate & FBHP constraints; focused on WORs & mass balance…
– Additional tuning was necessary
• Increased PV in “B” by 10% except in North, which was raised 20%
• Increased k by 2-5 X
• Manual tuning of aquifer w/ controlled pseudo-injection
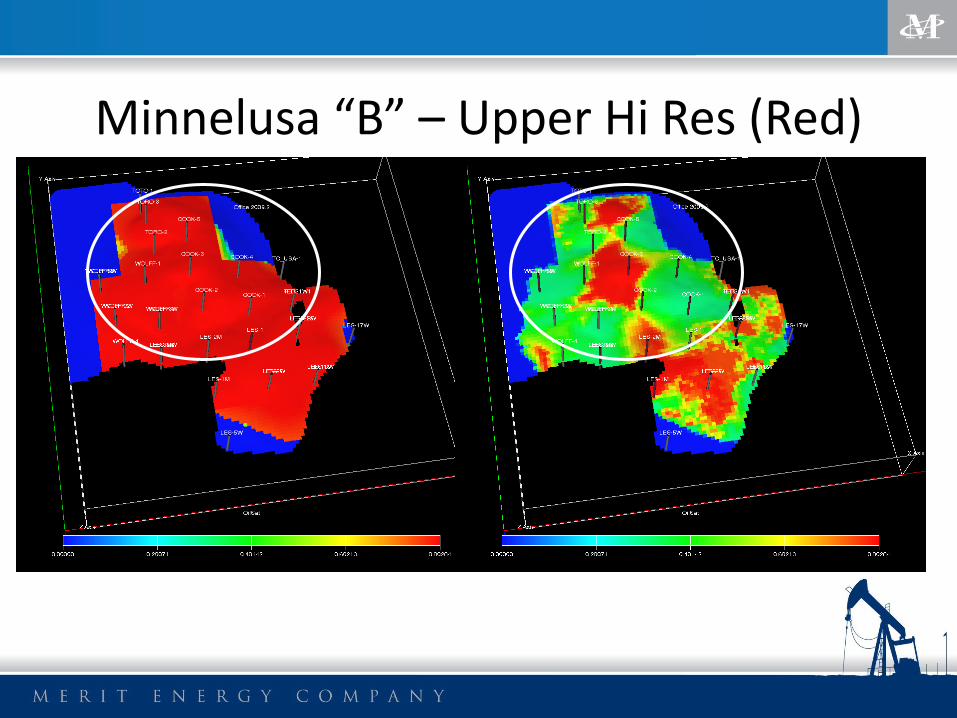
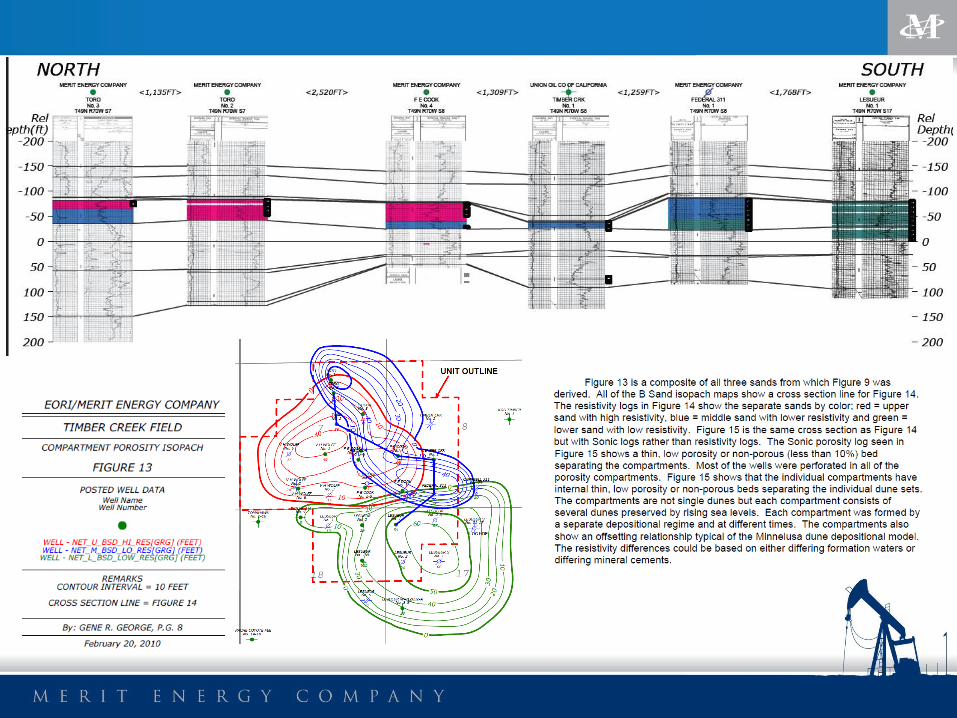
Minnelusa “B” – Upper Hi Res (Red)

Minnelusa “B” – Middle, Mid Res (Blue)
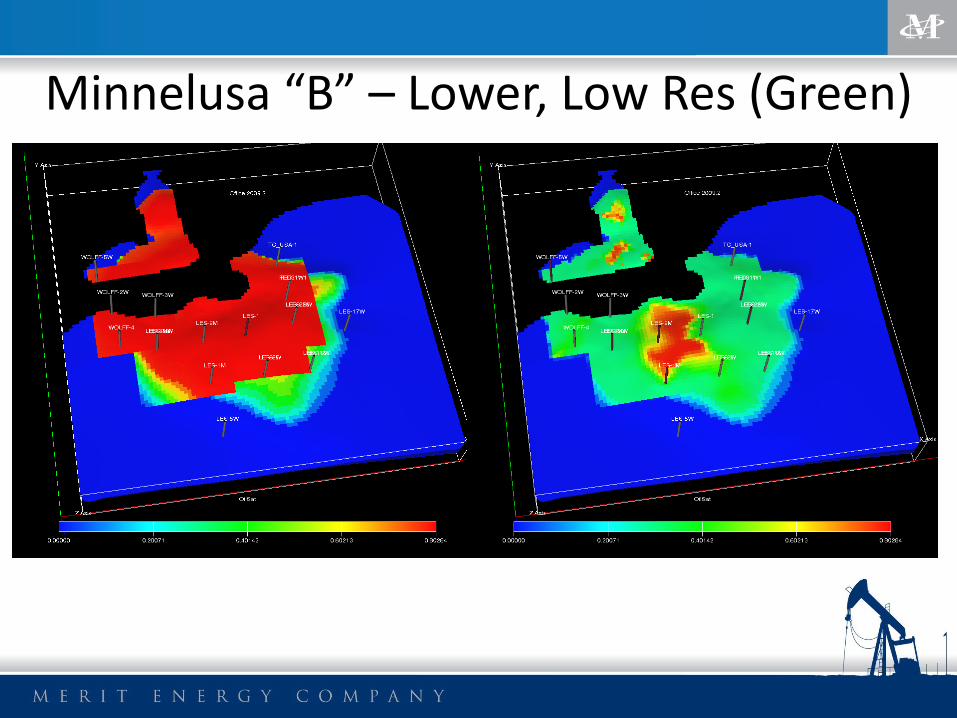
Minnelusa “B” – Lower, Low Res (Green)

Minnelusa “C” - Upper

Minnelusa “C” - Middle

Minnelusa “C” - Lower
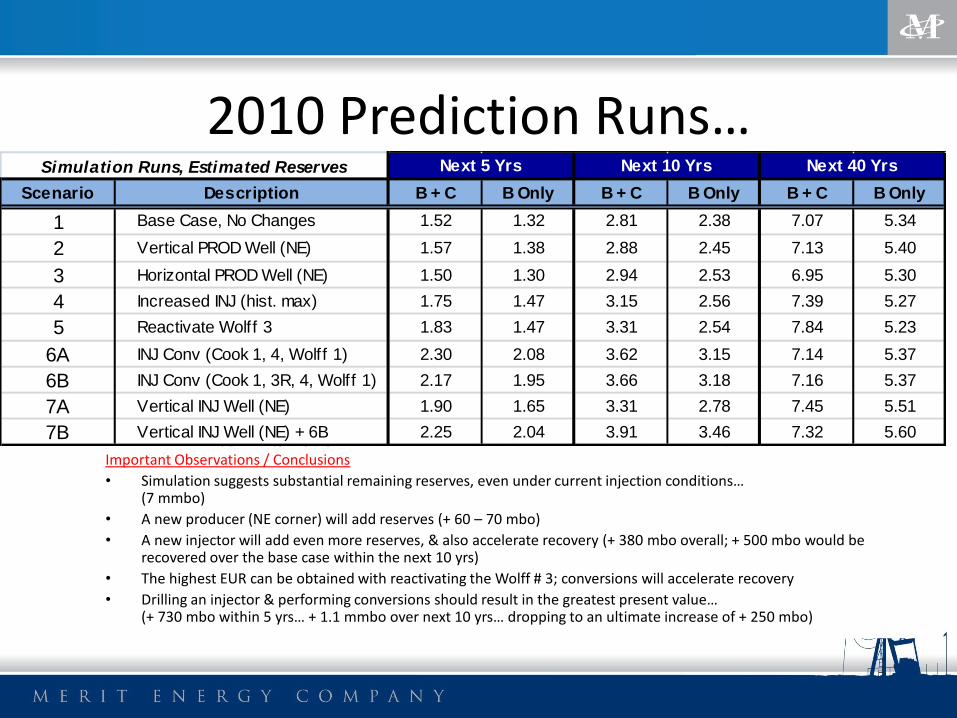
2010 Prediction Runs…
Important Observations / Conclusions
• Simulation suggests substantial remaining reserves, even under current injection conditions… (7 mmbo)
• A new producer (NE corner) will add reserves (+ 60 – 70 mbo)
• A new injector will add even more reserves, & also accelerate recovery (+ 380 mbo overall; + 500 mbo would be recovered over the base case within the next 10 yrs)
• The highest EUR can be obtained with reactivating the Wolff # 3; conversions will accelerate recovery
• Drilling an injector & performing conversions should result in the greatest present value… (+ 730 mbo within 5 yrs… + 1.1 mmbo over next 10 yrs… dropping to an ultimate increase of + 250 mbo)
Scenario Description B + C B Only B + C B Only B + C B Only
1 Base Case, No Changes 1.52 1.32 2.81 2.38 7.07 5.34
2 Vertical PROD Well (NE) 1.57 1.38 2.88 2.45 7.13 5.40
3 Horizontal PROD Well (NE) 1.50 1.30 2.94 2.53 6.95 5.30
4 Increased INJ (hist. max) 1.75 1.47 3.15 2.56 7.39 5.27
5 Reactivate Wolff 3 1.83 1.47 3.31 2.54 7.84 5.23
6A INJ Conv (Cook 1, 4, Wolff 1) 2.30 2.08 3.62 3.15 7.14 5.37
6B INJ Conv (Cook 1, 3R, 4, Wolff 1) 2.17 1.95 3.66 3.18 7.16 5.37
7A Vertical INJ Well (NE) 1.90 1.65 3.31 2.78 7.45 5.51
7B Vertical INJ Well (NE) + 6B 2.25 2.04 3.91 3.46 7.32 5.60
Next 5 Yrs Next 10 Yrs Next 40 YrsSimulation Runs, Estimated Reserves

Exploitation Recommendations… Using the simulation as
a guide to future development… – Drill new well (NE corner) –
Gene George # 1 (WIW) – Reactivate Wolff # 3 for
waterflood support – Convert additional wells…
• Wolff # 1 • Cook # 1 • Cook # 4 (When it waters out)
– ESP / AL Changes (LeSueur # 2M or other…)
– Shut off / divert current injection (address recycling from Fed Campbell #1)

Drill New Well Gene George # 1

PMk
POp
PMl
B sst
B dol
C1 sst
C1 dol C2 sst
Oil over shaker
Gene George #1 Logs

Gene George #1 Fluid Analysis

Gene George #1 Core Analyses 20 plugs for immediate
phi/k measurement (17 horiz, 3 vert).
63 plugs for EORI research analyses (59 horiz, 4 vert).
2 plugs for electrical properties.
Kv ~ factor of 10 lower than Kh.
Samples with lower anhydrite cement have better than average reservoir properties. (Helps explain good injectivity.)
Cored New Well (Gene George # 1)

100
1,000
10,000
1960 1965 1970 1975 1980 1985 1990 1995 2000 2005 2010 2015 2020 2025 2030 2035
bp
d
Water Injection
Water Production
Oil Production
Production / Injection History
Timber Creek Field
(All)

100
1,000
10,000
1960 1965 1970 1975 1980 1985 1990 1995 2000 2005 2010 2015 2020 2025 2030 2035
bp
d
Water Injection
Water Production
Oil Production
Production / Injection History
Timber Creek Field
(All)

19
76
19
77
19
78
19
79
19
80
19
81
19
82
19
83
19
84
19
85
19
86
19
87
19
88
19
89
19
90
19
91
19
92
19
93
19
94
19
95
19
96
19
97 19
98
19
99
20
00
20
01
20
02
20
03
20
04
20
05
20
06
20
08
20
09
20
10
20
11 2
01
2 20
13
1%
10%
100%
10,000 15,000 20,000 25,000 30,000 35,000
Oil
Cu
t
Cumulative Oil Production, mbo
Actuals
Culled Data Set
OUTLOOK13 - All Prvd Rsvs
Outlook13 (Exp. Match)
2010 Simulation Runs
Expon. (Culled Data Set)
Oil Cut vs. Cumulative Oil Production
Timber Creek Field
19
59
19
60
19
61
19
62
19
63
19
64
19
65
19
66
19
67
19
68
19
69
19
70
19
71
19
72
19
73
19
74
19
75
19
76 1
97
7
19
78
19
79
19
80
19
81
19
82
19
83
19
84
19
85
19
86
19
87
19
88
19
89
19
90
19
91
19
92
19
93
19
94
19
95
19
96
19
97
19
98
19
99
20
00 2
00
12
00
2 20
03
20
04
20
05
20
06
20
07
20
08
20
09
20
10
20
11
20
12 20
13
#N
/A#
N/A
#N
/A#
N/A
#N
/A#
N/A
#N
/A#
N/A
#N
/A#
N/A
#N
/A#
N/A
#N
/A#
N/A
#N
/A#
N/A
#N
/A#
N/A
#N
/A#
N/A
#N
/A#
N/A
#N
/A#
N/A
#N
/A#
N/A
#N
/A#
N/A
#N
/A#
N/A
#N
/A#
N/A
#N
/A#
N/A
#N
/A#
N/A
#N
/A#
N/A
#N
/A#
N/A
#N
/A#
N/A
#N
/A#
N/A
#N
/A#
N/A
#N
/A#
N/A
#N
/A#
N/A
#N
/A#
N/A
#N
/A#
N/A
#N
/A#
N/A
#N
/A#
N/A
#N
/A#
N/A
#N
/A#
N/A
#N
/A#
N/A
#N
/A#
N/A
#N
/A#
N/A
#N
/A#
N/A
#N
/A#
N/A
#N
/A#
N/A
#N
/A#
N/A
#N
/A#
N/A
#N
/A#
N/A
#N
/A#
N/A
#N
/A#
N/A
#N
/A#
N/A
#N
/A#
N/A
#N
/A#
N/A
#N
/A#
N/A
#N
/A#
N/A
#N
/A#
N/A
#N
/A#
N/A
#N
/A#
N/A
#N
/A#
N/A
#N
/A#
N/A
#N
/A#
N/A
#N
/A#
N/A
#N
/A#
N/A
#N
/A#
N/A
#N
/A#
N/A
#N
/A#
N/A
#N
/A#
N/A
#N
/A#
N/A
#N
/A#
N/A
#N
/A#
N/A
#N
/A#
N/A
#N
/A#
N/A
#N
/A#
N/A
#N
/A#
N/A
#N
/A#
N/A
#N
/A#
N/A
#N
/A#
N/A
#N
/A#
N/A
#N
/A#
N/A
#N
/A#
N/A
#N
/A#
N/A
#N
/A#
N/A
#N
/A#
N/A
#N
/A#
N/A
#N
/A#
N/A
#N
/A#
N/A
#N
/A#
N/A
#N
/A#
N/A
#N
/A#
N/A
#N
/A#
N/A
#N
/A#
N/A
#N
/A#
N/A
#N
/A#
N/A
#N
/A#
N/A
#N
/A#
N/A
#N
/A#
N/A
#N
/A#
N/A
#N
/A#
N/A
#N
/A#
N/A
#N
/A#
N/A
#N
/A#
N/A
#N
/A#
N/A
#N
/A#
N/A
#N
/A#
N/A
#N
/A#
N/A
#N
/A#
N/A
#N
/A#
N/A
#N
/A#
N/A
#N
/A#
N/A
#N
/A#
N/A
#N
/A#
N/A
#N
/A#
N/A
#N
/A#
N/A
#N
/A#
N/A
#N
/A#
N/A
#N
/A#
N/A
#N
/A#
N/A
#N
/A#
N/A
#N
/A#
N/A
#N
/A#
N/A
#N
/A#
N/A
#N
/A#
N/A
#N
/A#
N/A
#N
/A#
N/A
#N
/A#
N/A
#N
/A#
N/A
#N
/A#
N/A
#N
/A#
N/A
#N
/A#
N/A
#N
/A#
N/A
#N
/A#
N/A
#N
/A#
N/A
#N
/A#
N/A
#N
/A#
N/A
#N
/A#
N/A
#N
/A#
N/A
#N
/A#
N/A
#N
/A#
N/A
#N
/A#
N/A
#N
/A#
N/A
#N
/A#
N/A
#N
/A#
N/A
#N
/A#
N/A
#N
/A#
N/A
#N
/A#
N/A
#N
/A#
N/A
#N
/A#
N/A
#N
/A#
N/A
#N
/A#
N/A
#N
/A#
N/A
#N
/A#
N/A
#N
/A#
N/A
#N
/A#
N/A
#N
/A#
N/A
#N
/A#
N/A
#N
/A#
N/A
#N
/A#
N/A
#N
/A#
N/A
#N
/A#
N/A
#N
/A#
N/A
#N
/A#
N/A
#N
/A#
N/A
#N
/A#
N/A
#N
/A#
N/A
#N
/A#
N/A
#N
/A#
N/A
#N
/A#
N/A
#N
/A#
N/A
#N
/A#
N/A
#N
/A#
N/A
#N
/A#
N/A
#N
/A#
N/A
#N
/A#
N/A
#N
/A#
N/A
#N
/A#
N/A
#N
/A#
N/A
#N
/A#
N/A
#N
/A#
N/A
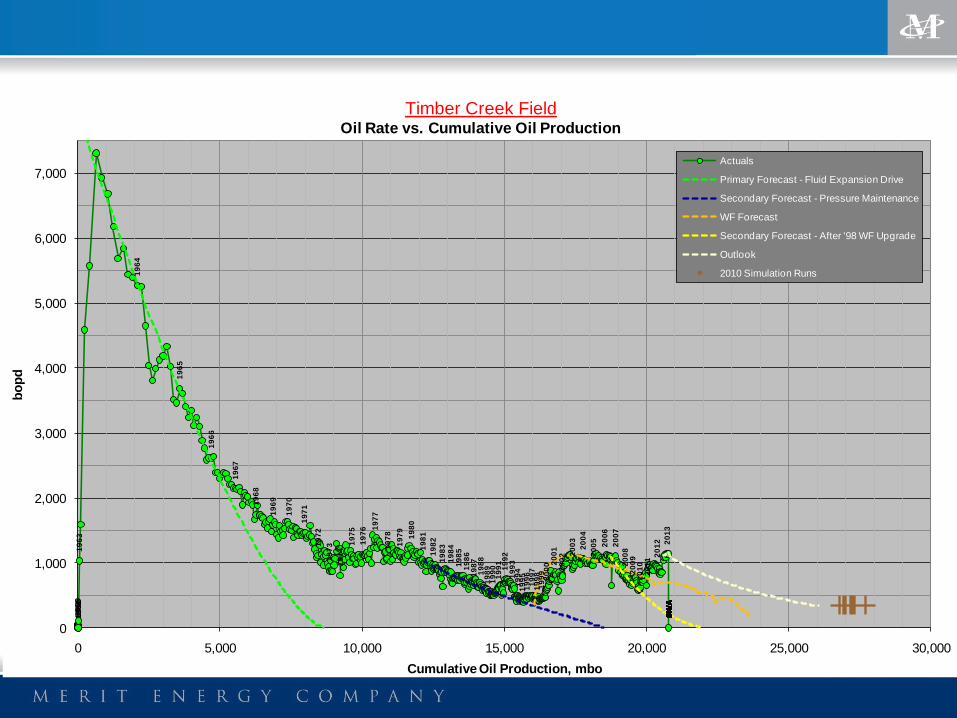
0
1,000
2,000
3,000
4,000
5,000
6,000
7,000
0 5,000 10,000 15,000 20,000 25,000 30,000
bo
pd
Cumulative Oil Production, mbo
Actuals
Primary Forecast - Fluid Expansion Drive
Secondary Forecast - Pressure Maintenance
WF Forecast
Secondary Forecast - After '98 WF Upgrade
Outlook
2010 Simulation Runs
Oil Rate vs. Cumulative Oil Production
Timber Creek Field

Minnelusa Waterflooding Guidelines • Understand the Aquifer!
– Encroachment direction
– Compartmentalization?
– Contribution to oil recovery. Higher aquifer driven reserves => lower waterflood reserves
– Poor waterflood patterns may interfere with aquifer drive
• BHP histories are key
• Good PVT data
• Confidence in production volumes from t=0
• Material balance works if… – Confidence in Volumetric OOIP => Aquifer influx
– Or there is negligible aquifer influx => OOIP
• Must keep wells pumped off – Weekly fluid levels during waterflooding
• Frequent Well Tests
• Inject as much as practical (under formation parting pressure)
– Step rate tests

Any Questions?