thurston edc final report 2013 - artswa
TRANSCRIPT
2012ThursTon Economic
viTaliTy indEx
3 PERSONAL INCOME
PERSONAL INCOME
2
INtROduCtIONThe Thurston Economic Development Council is proud to present the 2012 Thurston Economic Vitality Index (EVI). As in previous years, this fifth anniversary EVI provides an annual snapshot of local economic conditions, and a multi-year trend analysis for selected industry sector activity, residential housing, labor and income, and local business and consumer confidence. It also provides insights into our creative sector vitality and, for the first time, current information and forecasts related to local income, occupations, business establishments and exports. These new data points were derived from the recently-completed Pacific Mountain Region Targeted Industry Cluster Analysis, now available on the EDC website.
The Index is produced by the Thurston Economic Development Council in collaboration with St. Martin’s University and J Robertson and Company on behalf of local business and community leaders, as well as those who may be considering Thurston County as a place to call home in the future. The full annual report and quarterly updates for the leading index indicators and consumer confidence levels can be viewed online at www.thurstonedc.com.
* Trend data are provided for the most recent year available at the time the EVI was assembled.
SO, hOw ARE wE dOINg?Overall, it appears local economic conditions are looking a bit rosier after several difficult years. Results from the most recent Thurston Consumer Confidence Survey provide the strongest indication that we’re moving in the right direction. Consumer confidence as we near the end of 2012 is at the highest level we’ve seen since we began surveying residents in 2008. The small business and CEO indices show equally compelling evidence of an economic resurgence; both ticked up this most recent quarter and show cumulative upward trends since 2008.
Other data points give reason for cheer as well. Although the Thurston Composite Index of leading indicators is ten points lower than its all-time high in 1999, it has steadily grown ten points from its lowest point in 2009. The steep declines in overall taxable sales experienced from 2007 through 2009 have either leveled or reversed course in most Thurston County jurisdictions. Food and accommodation sales have picked up, as have sales related to arts, entertainment and recreation. While construction and real estate have yet to turn the corner, home values and building activity are “less bad” here than in most peer jurisdictions. Our occupational analysis reveals a significant spike in the number of people employed as real estate agents, suggesting we may be nearing recovery.
Unemployment rates have steadily declined and overall household incomes have stabilized. Forecasts indicate strong conditions in the five year period ahead, with the rate of growth in Thurston home ownership and median household income expected to outpace both the statewide and national average. All told, Thurston County’s economic situation has steadily improved over the past several years, consumer confidence is on the upswing and data indicators point to increased vitality as we enter 2013.
1
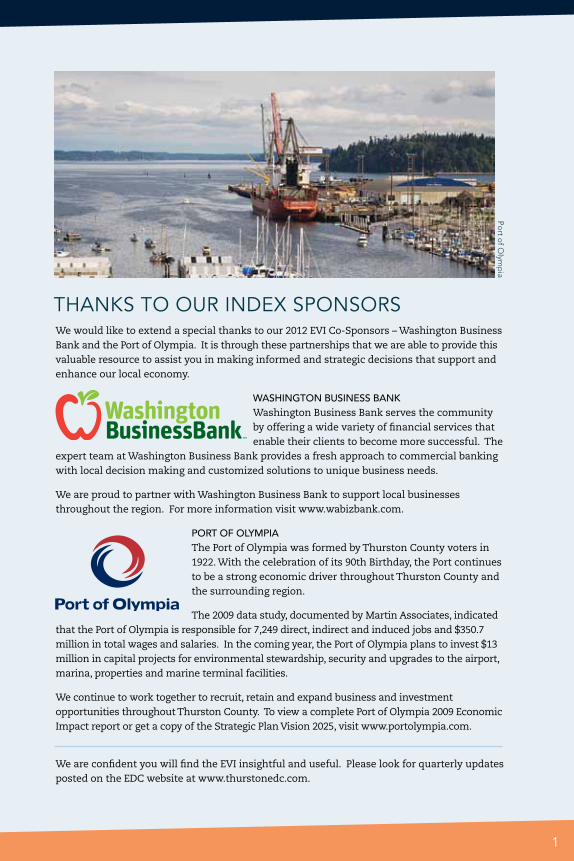
We would like to extend a special thanks to our 2012 EVI Co-Sponsors – Washington Business Bank and the Port of Olympia. It is through these partnerships that we are able to provide this valuable resource to assist you in making informed and strategic decisions that support and enhance our local economy.
WASHINGTON BUSINESS BANK Washington Business Bank serves the community by offering a wide variety of financial services that enable their clients to become more successful. The
expert team at Washington Business Bank provides a fresh approach to commercial banking with local decision making and customized solutions to unique business needs.
We are proud to partner with Washington Business Bank to support local businesses throughout the region. For more information visit www.wabizbank.com.
PORT OF OLYMPIA The Port of Olympia was formed by Thurston County voters in 1922. With the celebration of its 90th Birthday, the Port continues to be a strong economic driver throughout Thurston County and the surrounding region.
The 2009 data study, documented by Martin Associates, indicated that the Port of Olympia is responsible for 7,249 direct, indirect and induced jobs and $350.7 million in total wages and salaries. In the coming year, the Port of Olympia plans to invest $13 million in capital projects for environmental stewardship, security and upgrades to the airport, marina, properties and marine terminal facilities.
We continue to work together to recruit, retain and expand business and investment opportunities throughout Thurston County. To view a complete Port of Olympia 2009 Economic Impact report or get a copy of the Strategic Plan Vision 2025, visit www.portolympia.com.
We are confident you will find the EVI insightful and useful. Please look for quarterly updates posted on the EDC website at www.thurstonedc.com.
thANKS tO OuR INdEX SPONSORS
1
Port o
f Olym
pia
3 PERSONAL INCOME
PERSONAL INCOME
2
CONtENtS
2
1 REtAIL total taxable Sales: 2000-2011 taxable Retail Sales – Construction: 2007-2011 taxable Retail Sales – Accommodations & Food Services: 2007-2011 taxable Retail Sales – Retail trade: 2007-2011 taxable Retail Sales – Manufacturing: 2007-2011 taxable Retail Sales & use – Arts, Entertainment & Recreation: 2007-2011
2 LABOR top Occupations: 2011 Occupation Change: 2010-2011 unemployment trend: 2010-2012 total Business Establishments and total Employment: 2012 total Creative Industry Employment: 2006-2011 Creative Industry Revenue: 2007- 2011 Creative Industry Revenue Source Share: 2007 vs 2011 Core Industry Imports Challenge: 2012
3 INCOME household Income trend: 1991-2011 household Income Forecast by Income Level: 2011 vs 2016 household Income Forecast by type: 2011 vs 2016 Annual Rate of growth: 2011-2016
4 hOuSINg Residential Building Permits: 2004- 2011 Existing home Sales: 2004-2011 housing Inventory: 2004-2011 Median home Prices: 2004-2011 housing Affordability – Middle-Income Families: Q1, 2009-Q1, 2012 housing Affordability – First-time Buyers: Q1, 2009-Q2, 2012
5 LEAdINg INdICAtORS thurston County EVI Leading Indicators: 2000-2012
6 CONFIdENCE SuRVEYS thurston County Consumer Confidence Survey thurston County CEO Confidence Survey thurston County Small Business Confidence Survey

3
1 REtAIL
Taxable Sales – All Sectors: 2000-2011 Taxable sales back on track?
In Thurston County, like most parts of the US, taxable sales experienced a bit of a rough patch from 2007-2009. For most jurisdictions, the decline slowed or reversed over the past two years. For this edition of the EVI, we opened the way-back machine to see how current sales stand in comparison to past years. The good news: since 2000, taxable sales have trended upward for all jurisdictions. Unincorporated Thurston County experienced the greatest growth spurt between 2009 and 2011.
Source: W
ashingto
n State Dep
artment o
f Revenue
3
201120102009200820072006200520042003200220012000
Olympia Lacey Tumwater Unincorporated
$0
$500,000,000
$1,000,000,000
$1,500,000,000
$2,000,000,000
4
REtAIL
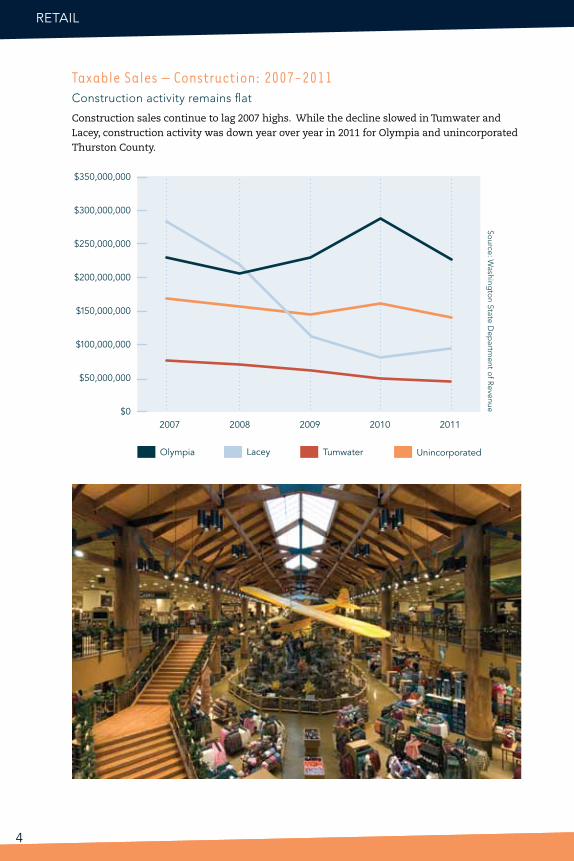
Taxable Sales – Construction: 2007-2011Construction activity remains flat
Construction sales continue to lag 2007 highs. While the decline slowed in Tumwater and Lacey, construction activity was down year over year in 2011 for Olympia and unincorporated Thurston County.
$0
$50,000,000
$100,000,000
$150,000,000
$200,000,000
$250,000,000
$300,000,000
$350,000,000
2009 2010 201120082007
Olympia Lacey Tumwater Unincorporated
Source: W
ashingto
n State Dep
artment o
f Revenue
5REtAIL
Taxable Sales – Retail Trade: 2007-2011 Retail trade holds steady
Retail trade remained fairly stable in 2011 across all jurisdictions. Over the past four years, sales in Lacey and Tumwater remained flat, while unincorporated Thurston County has experienced a modest uptick and Olympia a slight decline.
Taxable Sales – Accommodations and Food Service: 2007-2011Lacey shows strongest growth in accommodation and food sales
Accommodation and food service sales have held steady over the past five years in all jurisdictions. With another strong year in 2011, Lacey has seen nearly $20 million in added sales since 2007.
Source: W
ashingto
n State Dep
artment o
f Revenue
5
$0
$160,000,000
$140,000,000
$120,000,000
$100,000,000
$80,000,000
$60,000,000
$40,000,000
$20,000,000
2009 2010 201120082007
Olympia Lacey Tumwater Unincorporated
$0
$1,200,000,000
$1,000,000,000
$800,000,000
$600,000,000
$400,000,000
$200,000,000
2009 2010 201120082007
Olympia Lacey Tumwater Unincorporated
Source: W
ashingto
n State Dep
artment o
f Revenue
6
REtAIL
Source: W
ashingto
n State Dep
artment o
f Revenue
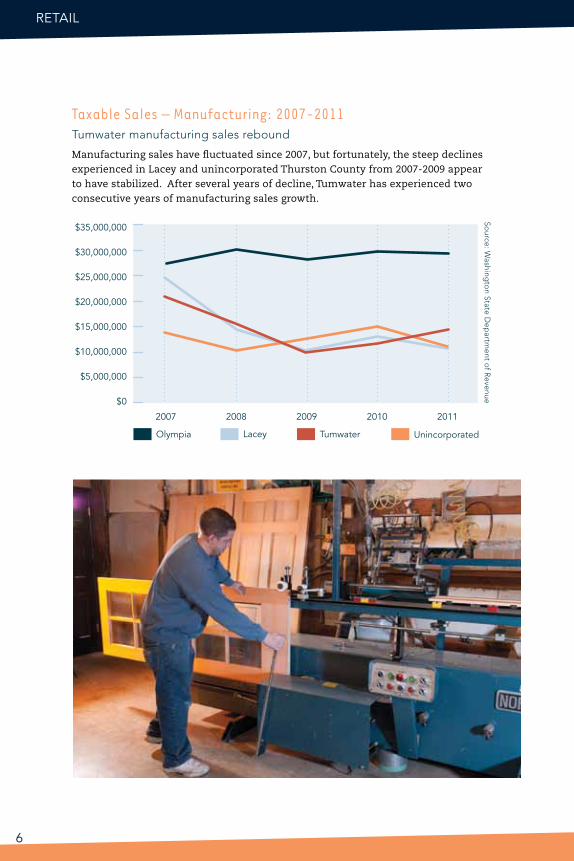
Taxable Sales – Manufacturing: 2007-2011 Tumwater manufacturing sales rebound
Manufacturing sales have fluctuated since 2007, but fortunately, the steep declines experienced in Lacey and unincorporated Thurston County from 2007-2009 appear to have stabilized. After several years of decline, Tumwater has experienced two consecutive years of manufacturing sales growth.
$0
$35,000,000
$30,000,000
$25,000,000
$20,000,000
$15,000,000
$10,000,000
$5,000,000
2009 2010 201120082007
Olympia Lacey Tumwater Unincorporated

REtAIL 7
Taxable Retail Sales and Use – Arts, Entertainment and Recreation: 2007-2011 Arts, entertainment and recreation activity up again in Lacey
Arts, entertainment and recreation spending have remained relatively stable since 2007, except in Lacey, where 2011 taxable sales nearly doubled 2007 levels.
Source: W
ashingto
n State Dep
artment o
f Revenue
$0
$16,000,000
$14,000,000
$12,000,000
$10,000,000
$8,000,000
$6,000,000
$4,000,000
$2,000,000
2009 2010 201120082007
Olympia Lacey Tumwater Unincorporated

8
LABOR2Top Thurston County Occupations: 2011 Occupational snapshot, 2011
For this edition of the EVI, we chose to look at employment through an occupational lens. This approach enables us to account for “1099” workers in addition to covered employees. In other words, we’ve included sole-proprietors, one-person corporations and other independent workers in the labor pool analysis. The chart below shows the most common occupations in Thurston County as of 2011.
18,978
16,388
9,816
9,170
8,457
7,626
5,835
5,628
5,503
5,091
4,640
4,354
4,323
Arts, Design, Entertainment,Sports, and Media
Building and GroundsCleaning and Maintenance
Transportation andMaterial Moving
Office andAdministrative Support
Computer andMathematical
Construction andExtraction
Healthcare Practitionersand Technical
Personal Careand Service
Education, Training,and Library
Food Preparationand Serving Related
Business andFinancial Operations
Management
Sales and Related
8,000 12,000 16,000 20,0004,0000
Source: E
MSI C
om
plete E
mp
loym
ent - 2012.2
PERSONAL INCOME 9LABOR 9
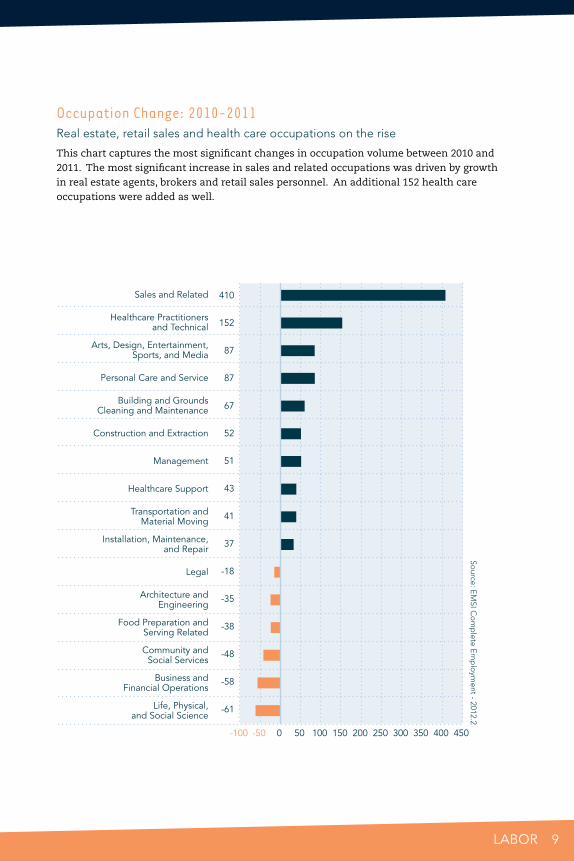
Occupation Change: 2010-2011Real estate, retail sales and health care occupations on the rise
This chart captures the most significant changes in occupation volume between 2010 and 2011. The most significant increase in sales and related occupations was driven by growth in real estate agents, brokers and retail sales personnel. An additional 152 health care occupations were added as well.
410
152
87
87
67
52
51
43
41
37
-18
-35
-38
-48
-58
-61
Food Preparation andServing Related
Architecture andEngineering
Transportation andMaterial Moving
Sales and Related
Community andSocial Services
Business andFinancial Operations
Life, Physical,and Social Science
Legal
Installation, Maintenance,and Repair
Healthcare Support
Management
Construction and Extraction
Building and GroundsCleaning and Maintenance
Personal Care and Service
Arts, Design, Entertainment,Sports, and Media
Healthcare Practitionersand Technical
-100 -50 0 50 100 150 200 250 300 350 400 450
Source: E
MSI C
om
plete E
mp
loym
ent - 2012.2
10
LABOR
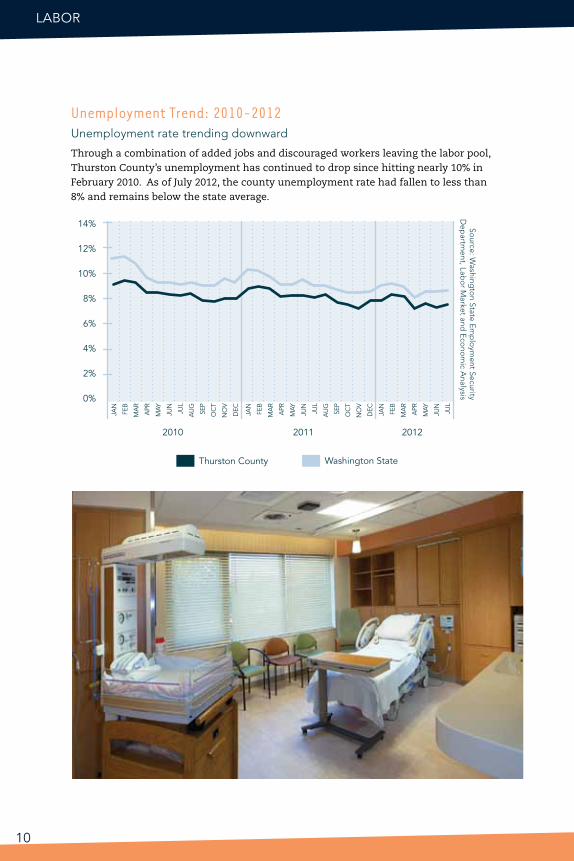
Unemployment Trend: 2010-2012 Unemployment rate trending downward
Through a combination of added jobs and discouraged workers leaving the labor pool, Thurston County’s unemployment has continued to drop since hitting nearly 10% in February 2010. As of July 2012, the county unemployment rate had fallen to less than 8% and remains below the state average.
0%
14%
12%
10%
8%
6%
4%
2%
2011 20122010
Thurston County Washington State
JAN
FEB
MA
R
APR
MAY
JUN
JUL
AU
G
SEP
OC
T
NO
V
DEC
JAN
FEB
MA
R
APR
MAY
JUN
JUL
AU
G
SEP
OC
T
NO
V
DEC
JAN
FEB
MA
R
APR
MAY
JUN
JUL
Source: W
ashingto
n State Em
plo
yment Security
Dep
artment, Lab
or M
arket and E
cono
mic A
nalysis

11LABOR 11
Total Business Establishments and Total Employment: 2012Over 40% local workers employed in service businesses
As of 2012, there are 10,779 businesses operating in Thurston County. Collectively, they employ 113,641 individuals. The graphs below show the proportional representation of those businesses by industry type (SIC Code) and total persons employed. In most cases, the proportional representation of a business type is commensurate with its corresponding share of total employment. Two notable exceptions are “service” and “government” establishments, with the former employing fewer and the latter much higher percentages of the population relative to their presence in the local economy.
Business Type by % of Total Establishments
Business Type by % of Total Employment
Agriculture and Mining - 3.59%
Communication - 0.51%
Construction - 8.92%
Finance, Insurance, Real Estate - 8.71%
Government - 6.16%
Manufacturing - 2.58%
Other - 2.57%
Retail Trade - 18.94%
Services - 41.24%
Transportation - 2.66%
Utilities - 0.23%
Wholesale Trade - 3.89%
Agriculture and Mining - 1.51%
Communication - 0.42%
Construction - 4.71%
Finance, Insurance, Real Estate - 5.47%
Government - 25.29%
Manufacturing - 3.02%
Other - 0.96%
Retail Trade - 20.9%
Services - 33.44%
Transportation - 1.53%
Utilities - 0.23%
Wholesale Trade - 3.03%
Source: E
SRI B
usiness Analysis, 2012

LABOR
12
Total Creative Industry Employment: 2006-2011 Creative sector employment continues to grow
Between 2006 and 2011, creative sector employment has grown by 900 jobs, about 200 of which were added in 2011. The fastest growing creative occupations are: photography; musicians and singers; and graphic designers. Declining occupations include public relations specialists and media and communications workers, likely due to a reduction in State employment.
Creative Industry Revenue: 2007-2011 Overall creative industry revenue dips
Though creative industry revenue dropped slightly year over year in 2011, the decline is the first in six years.
2500
4100
4300
4500
3900
3700
3500
3300
3100
2900
2700
2009 2010 2011200820072006
$0
$50,000,000
$40,000,000
$30,000,000
$20,000,000
$10,000,000
Industry Revenue
2007 2008 2009 2010 2011
$36,400,000$39,756,000
$43,636,000 $44,707,000$42,411,000
Source: W
ESTA
F, EM
SI – Co
mp
lete Em
plo
yment-2012
Source: W
ESTA
F, EM
SI – Co
mp
lete Em
plo
yment-2012

Creative Vitality Index Revenue Source Share: 2006-2011 Art sales driving creative industry revenue
While art gallery and individual artist sales have dropped off over the past two years, they still account for the lion’s share of overall creative industry revenue. Book and record store sales have fallen by nearly $2 million since 2006.
LABOR 13
$0
$20,000,000
$18,000,000
$14,000,000
$10,000,000
$6,000,000
$16,000,000
$12,000,000
$8,000,000
$4,000,000
$2,000,000
20072006 2008 2009 2010 2011
Photography Store Sales
Music Store Sales
Book and Record Store Sales
Art Gallery and Individual Artist Sales
Performing Arts Participation
Arts Organization Revenue
Arts-Active Organization Revenue
Source: W
ESTA
F, EM
SI – Co
mp
lete Em
plo
yment-2012
14
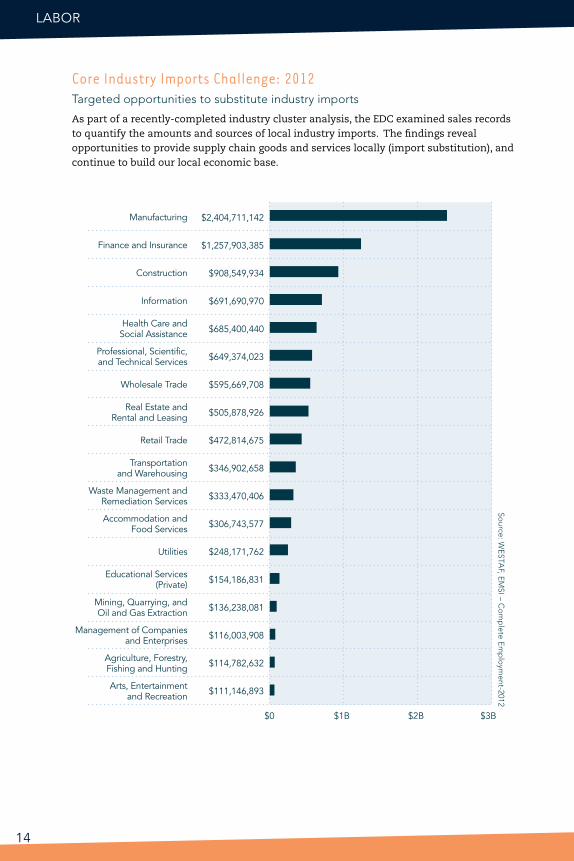
Core Industry Imports Challenge: 2012 Targeted opportunities to substitute industry imports
As part of a recently-completed industry cluster analysis, the EDC examined sales records to quantify the amounts and sources of local industry imports. The findings reveal opportunities to provide supply chain goods and services locally (import substitution), and continue to build our local economic base.
LABOR
$2,404,711,142
$1,257,903,385
$908,549,934
$691,690,970
$685,400,440
$649,374,023
$595,669,708
$505,878,926
$472,814,675
$346,902,658
$333,470,406
$306,743,577
$248,171,762
$154,186,831
$136,238,081
$116,003,908
$114,782,632
$111,146,893 Arts, Entertainmentand Recreation
$0 $1B $2B $3B
Agriculture, Forestry,Fishing and Hunting
Educational Services(Private)
Accommodation andFood Services
Waste Management andRemediation Services
Real Estate andRental and Leasing
Manufacturing
Management of Companiesand Enterprises
Mining, Quarrying, andOil and Gas Extraction
Utilities
Transportationand Warehousing
Retail Trade
Wholesale Trade
Professional, Scientific,and Technical Services
Health Care andSocial Assistance
Information
Construction
Finance and Insurance
Source: W
ESTA
F, EM
SI – Co
mp
lete Em
plo
yment-2012
15INCOME
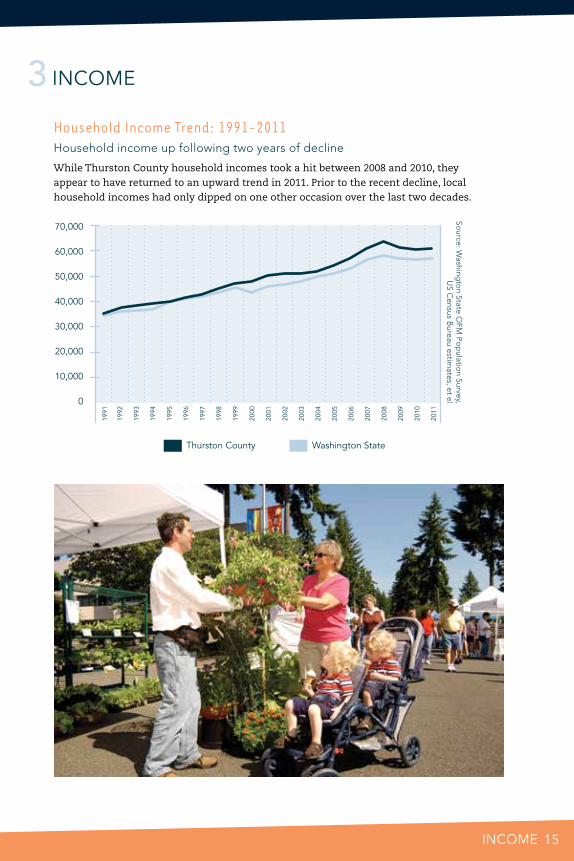
Household Income Trend: 1991-2011 Household income up following two years of decline
While Thurston County household incomes took a hit between 2008 and 2010, they appear to have returned to an upward trend in 2011. Prior to the recent decline, local household incomes had only dipped on one other occasion over the last two decades.
INCOME3So
urce: Washing
ton State O
FM Po
pulatio
n Survey,U
S Census B
ureau estimates, et el0
70,000
60,000
50,000
40,000
30,000
20,000
10,000
Thurston County Washington State
1991
1992
1993
1994
1995
1996
1997
1998
1999
2000
2001
2002
2003
2004
2005
2006
2007
2008
2009
2010
2011
16
INCOME
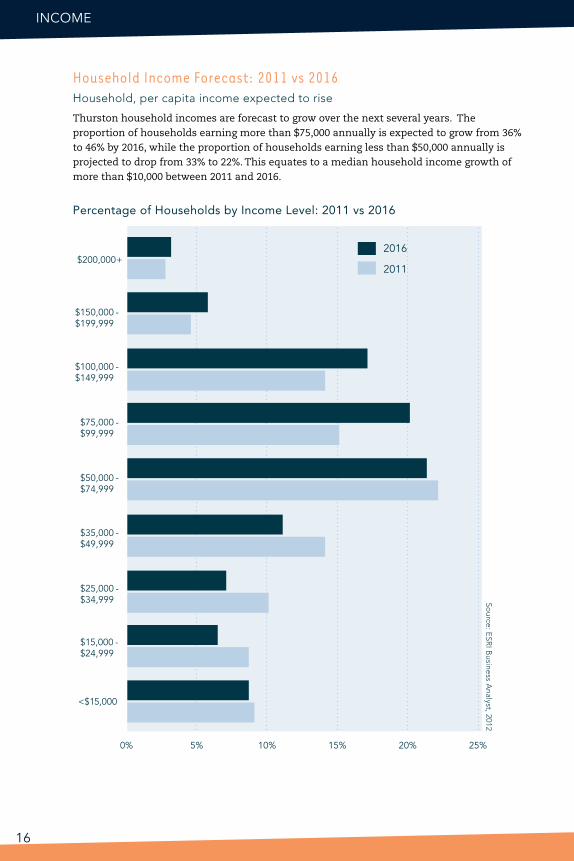
Household Income Forecast: 2011 vs 2016Household, per capita income expected to rise
Thurston household incomes are forecast to grow over the next several years. The proportion of households earning more than $75,000 annually is expected to grow from 36% to 46% by 2016, while the proportion of households earning less than $50,000 annually is projected to drop from 33% to 22%. This equates to a median household income growth of more than $10,000 between 2011 and 2016.
Source: E
SRI B
usiness Analyst, 2012
Percentage of Households by Income Level: 2011 vs 2016
$75,000 - $99,999
$100,000 - $149,999
$150,000 - $199,999
$200,000+
0% 5% 10% 15% 20% 25%
$50,000 - $74,999
$35,000 - $49,999
$25,000 - $34,999
$15,000 - $24,999
<$15,000
2011
2016

INCOME 17
Annual Rate of Growth: 2011-2016Thurston population and income growth forecast to outpace state, nation
Economic modeling suggests the annual rate of income growth in Thurston County will outpace state — and nation-wide averages, along with the rate of growth in population and home ownership.
0
1.0
2.0
3.0
4.0
Population Number ofHouseholds
Number ofFamilies
HouseholdOwnership
MedianHousehold
Income
National Thurston CountyWashington State
$0
$10,000
$20,000
$30,000
$40,000
$50,000
$60,000
$70,000
$80,000
$90,000
Per Capita IncomeMedian Household Income Average Household Income
2011
2016
$56,845
$70,826
$28,810
$68,181
$80,919
$32,966
Household Income Forecast: 2011 vs 2016 (cont.)
Source: E
SRI B
usiness Analyst, 2012
Source: E
SRI B
usiness Analyst, 2012
Income Estimates by Type: 2011 vs 2016

18
Residential Building Permits
0
500
1,000
1,500
2,000
2,500
3,000
3,500
20112010200920082007200620052004
hOuSINg4Residential Building Permits: 2004-2011 Building permits down; multi-family units up
The number of building permits issued in Thurston County declined for the 5th consecutive year in 2011. While the total volume was down, the number of multi-family permits increased from 103 units in 2010 to 169 units in 2011 (or, from 12 to 20 new multi-family structures).
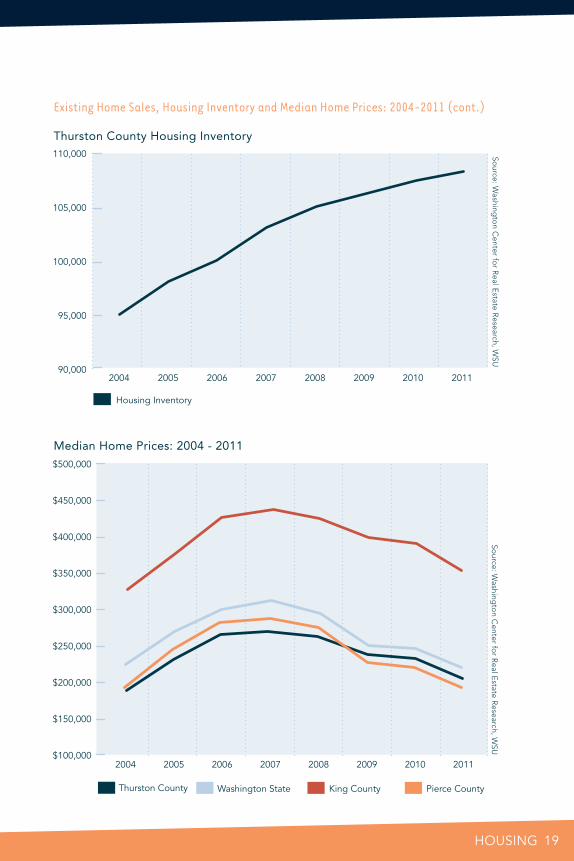
Existing Home Sales, Housing Inventory and Median Home Prices: 2004-2011Home sales and values remain sluggish
Annual home sales also declined for the 5th year in-a-row in 2011. Even as fewer homes sell, the County’s housing inventory continues to rise. The 1% increase in inventory from 2010-11 was the second largest rate of growth for any county in Washington State. The result: median home prices dropped for a fourth consecutive year. The only silver lining is that Thurston home values dropped less than neighboring Pierce County and the state as a whole.
Residential Home Sales
0
1000
2000
3000
4000
5000
6000
7000
8000
20112010200920082007200620052004
Source: U
S Dep
artment o
f Co
mm
erceSo
urce: Washing
ton C
enter for
Real E
state Research, W
SU
Thurston County Annual Home Sales
19hOuSINg 19
Existing Home Sales, Housing Inventory and Median Home Prices: 2004-2011 (cont.)
Source: W
ashingto
n Center fo
r Real E
state Research, W
SUSo
urce: Washing
ton C
enter for R
eal Estate R
esearch, WSU
Thurston County Housing Inventory
Median Home Prices: 2004 - 2011
Housing Inventory
90,000
100,000
110,000
105,000
95,000
2009 2011201020082007200620052004
2009 2011201020082007200620052004$100,000
$150,000
$200,000
$250,000
$300,000
$350,000
$400,000
$450,000
$500,000
Thurston County Washington State King County Pierce County

20
hOuSINg
Housing Affordability – Middle-Income Families: Q1, 2009-Q1, 2012Affordability index continues to rise
As inventory grows, median home prices decline and people return to work, Thurston County housing continues to become more affordable. For the first time since Q1, 2003, the Washington State Center for Real Estate Research Housing Affordability Index revealed equilibrium for first-time buyers in Q4, 2012.
100
120
80
60
140
160
180
200
Q1:2010
Q1:2011
Q4:2009
Q3:2009
Q2:2009
Q1:2009
Q4:2010
Q3:2010
Q2:2010
Q1:2012
Q4:2011
Q3:2011
Q2:2011
Thurston County Washington State
Source: W
ashingto
n Center fo
r Real E
state Research, W
SU
Steven Herp
pich

PERSONAL INCOME 21hOuSINg 21
Housing Affordability — First-Time Buyers: Q1, 2009-Q1, 2012
* Notes on WCRER-WSU Index Methodology: The Housing Affordability Index measures the ability of a middle income family to carry the mortgage payments on a median price home. When the index is "100," there is balance between the family's ability to pay and cost. Higher indices indicate housing is more affordable. First-time buyer's index assumes the purchaser's income is 70% of the median household income. Home purchased by first-time buyer is 85% of the area's median price. All loans are assumed to be 30-year terms at prevailing interest rates. The "all buyer" index assumes down payment of 20%; the first-time buyer index, 10%. It is further assumed that 25% of income can be used for principal and interest payments.
60
80
100
120
Thurston County Washington State
73.3 72.2 72.1 79.6 79.5 77.9 79.1 83.6 84.4 85 87.4 94.1 98.9
Q1:2010
Q1:2011
Q4:2009
Q3:2009
Q2:2009
Q1:2009
Q4:2010
Q3:2010
Q2:2010
Q1:2012
Q4:2011
Q3:2011
Q2:2011
Source: W
ashingto
n Center fo
r Real E
state Research, W
SU
22
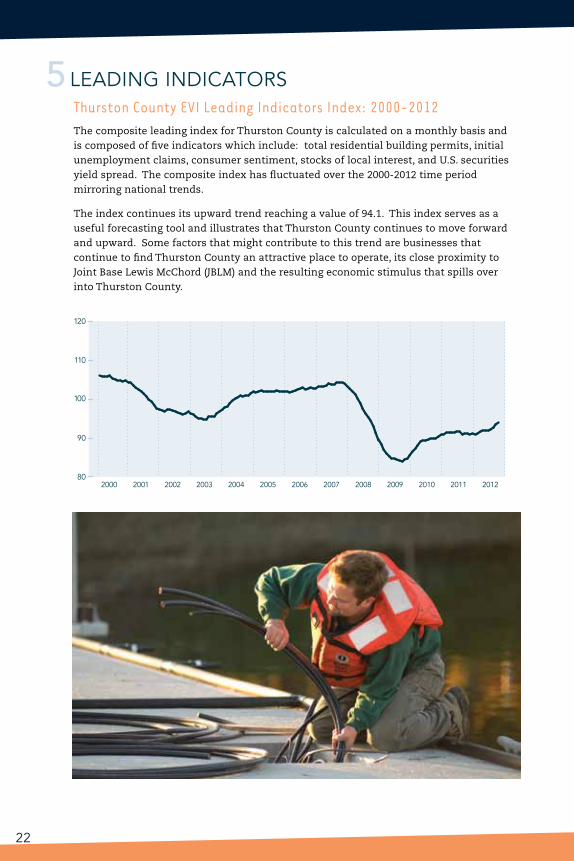
Thurston County EVI Leading Indicators Index: 2000-2012 The composite leading index for Thurston County is calculated on a monthly basis and is composed of five indicators which include: total residential building permits, initial unemployment claims, consumer sentiment, stocks of local interest, and U.S. securities yield spread. The composite index has fluctuated over the 2000-2012 time period mirroring national trends.
The index continues its upward trend reaching a value of 94.1. This index serves as a useful forecasting tool and illustrates that Thurston County continues to move forward and upward. Some factors that might contribute to this trend are businesses that continue to find Thurston County an attractive place to operate, its close proximity to Joint Base Lewis McChord (JBLM) and the resulting economic stimulus that spills over into Thurston County.
5 LEAdINg INdICAtORS
80
90
110
100
120
2000 2001 2002 2003 2004 2005 2006 2007 2008 2009 2010 2011 2012
CONFIdENCE SuRVEYS 23
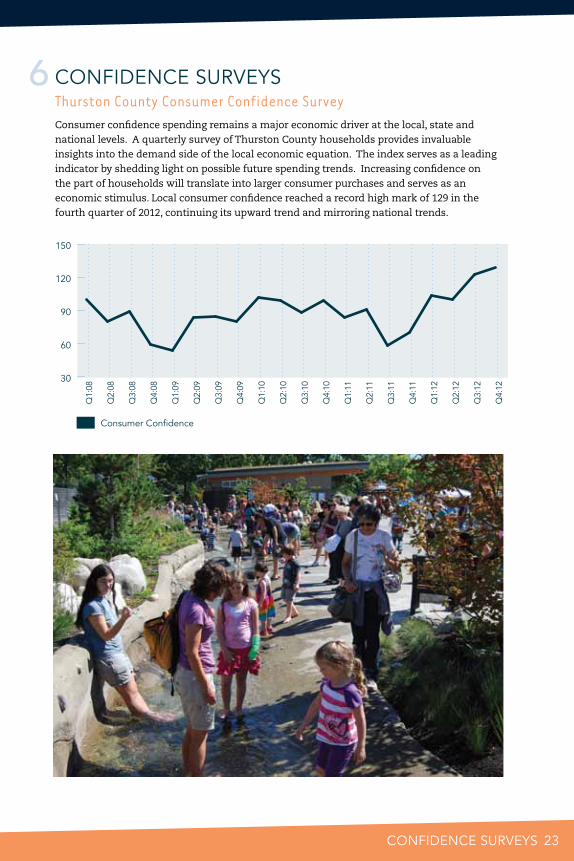
6 CONFIdENCE SuRVEYSThurston County Consumer Confidence SurveyConsumer confidence spending remains a major economic driver at the local, state and national levels. A quarterly survey of Thurston County households provides invaluable insights into the demand side of the local economic equation. The index serves as a leading indicator by shedding light on possible future spending trends. Increasing confidence on the part of households will translate into larger consumer purchases and serves as an economic stimulus. Local consumer confidence reached a record high mark of 129 in the fourth quarter of 2012, continuing its upward trend and mirroring national trends.
Consumer Confidence
30
60
90
120
150
Q4:
12
Q3:
12
Q2:
12
Q1:
12
Q4:
11
Q3:
11
Q2:
11
Q1:
11
Q4:
10
Q3:
10
Q2:
10
Q1:
10
Q4:
09
Q3:
09
Q2:
09
Q1:
09
Q4:
08
Q3:
08
Q2:
08
Q1:
08
Consumer Confidence
30
60
90
120
150
2008 2009 2010 2011 2012
CONFIdENCE SuRVEYS
24
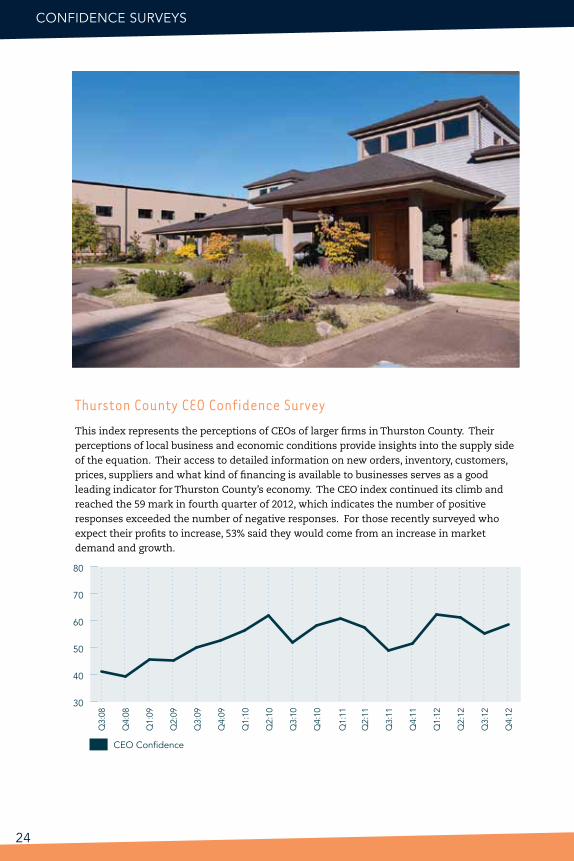
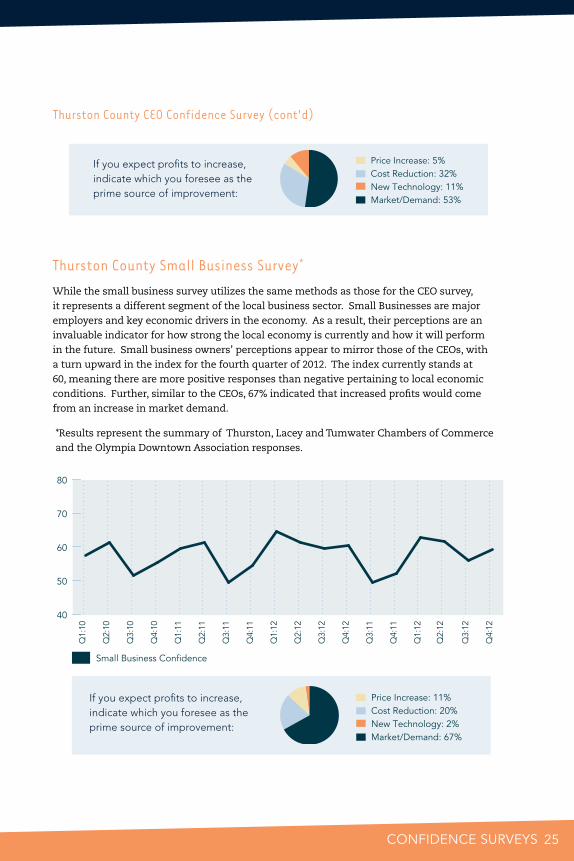
Thurston County CEO Confidence Survey
This index represents the perceptions of CEOs of larger firms in Thurston County. Their perceptions of local business and economic conditions provide insights into the supply side of the equation. Their access to detailed information on new orders, inventory, customers, prices, suppliers and what kind of financing is available to businesses serves as a good leading indicator for Thurston County’s economy. The CEO index continued its climb and reached the 59 mark in fourth quarter of 2012, which indicates the number of positive responses exceeded the number of negative responses. For those recently surveyed who expect their profits to increase, 53% said they would come from an increase in market demand and growth.
CEO Confidence
30
40
50
60
70
80
Q4:
12
Q3:
12
Q2:
12
Q1:
12
Q4:
11
Q3:
11
Q2:
11
Q1:
11
Q4:
10
Q3:
10
Q2:
10
Q1:
10
Q4:
09
Q3:
09
Q2:
09
Q1:
09
Q4:
08
Q3:
08
CONFIdENCE SuRVEYS 25
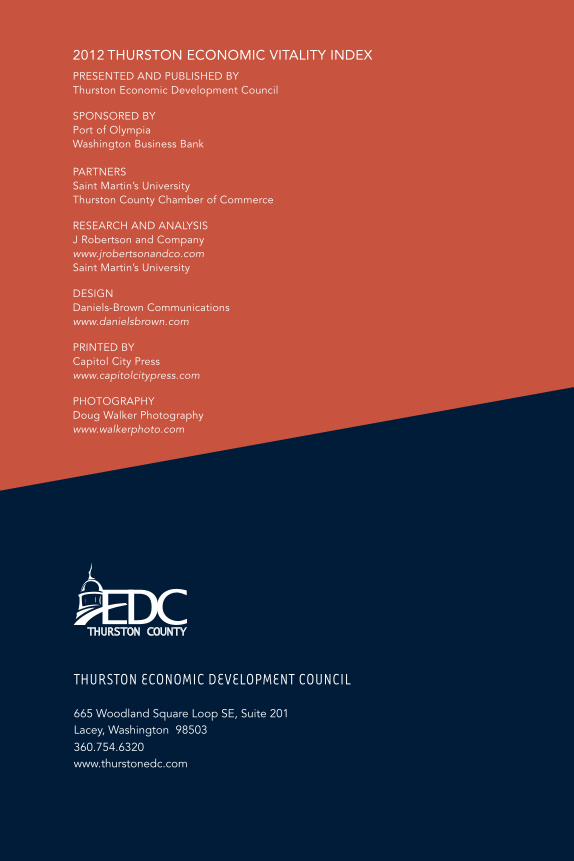
Thurston County Small Business Survey*
While the small business survey utilizes the same methods as those for the CEO survey, it represents a different segment of the local business sector. Small Businesses are major employers and key economic drivers in the economy. As a result, their perceptions are an invaluable indicator for how strong the local economy is currently and how it will perform in the future. Small business owners’ perceptions appear to mirror those of the CEOs, with a turn upward in the index for the fourth quarter of 2012. The index currently stands at 60, meaning there are more positive responses than negative pertaining to local economic conditions. Further, similar to the CEOs, 67% indicated that increased profits would come from an increase in market demand.
If you expect profits to increase, indicate which you foresee as the prime source of improvement:
Price Increase: 11%Cost Reduction: 20%New Technology: 2%Market/Demand: 67%
If you expect profits to increase, indicate which you foresee as the prime source of improvement:
Price Increase: 5%Cost Reduction: 32%New Technology: 11%Market/Demand: 53%
Thurston County CEO Confidence Survey (cont'd)
*Results represent the summary of Thurston, Lacey and Tumwater Chambers of Commerce and the Olympia Downtown Association responses.
Small Business Confidence
40
50
60
70
80Q
4:12
Q3:
12
Q2:
12
Q1:
12
Q4:
11
Q3:
11
Q4:
12
Q3:
12
Q2:
12
Q1:
12
Q4:
11
Q3:
11
Q2:
11
Q1:
11
Q4:
10
Q3:
10
Q2:
10
Q1:
10
THURSTOn ECOnOMIC DEVELOPMEnT COUnCIL
665 woodland Square Loop SE, Suite 201Lacey, washington 98503360.754.6320www.thurstonedc.com
2012 THURSTON ECONOMIC VITALITY INDEX
PRESENtEd ANd PuBLIShEd BY thurston Economic development Council
SPONSOREd BY Port of Olympia washington Business Bank PARtNERS Saint Martin’s university thurston County Chamber of Commerce
RESEARCh ANd ANALYSIS J Robertson and Company www.jrobertsonandco.com Saint Martin’s university
dESIgN daniels-Brown Communications www.danielsbrown.com
PRINtEd BY Capitol City Press www.capitolcitypress.com
PhOtOgRAPhY doug walker Photography www.walkerphoto.com