throw away your crystal ball - sun life
TRANSCRIPT

Speakers:Heather WolfeManaging Director, Client Relationships, Defined Benefit SolutionsSun Life Financial
Mathieu TessierDirector, Client Relationships, Defined Benefit SolutionsSun Life Financial
Throw away your crystal ball

2
T H E S H O E M A K E R ’ S S T O R Y

O N C E U P O N A T I M E …
3
T I M E S W E R E D I F F I C U LT …
4
Cash infusions
Time and attention

T H E S H O E M A K E R D E C I D E D T O TA K E A C T I O N
5
Look for a
buyer
Put it in run-off

Company Pension Plan
6
A N A L L E G O R Y F O R …

W H AT T H E S H O E M A K E R L E A R N E D
7

8
R ISK AND REWARDA C L O U D Y R E S U LT

W H AT ’ S Y O U R R E W A R D F O R TA K I N G R I S K ?
9
C o r e b u s i n e s s r i s k
P r o f i t
C o m p e t i t i ve a d va n t a g e
G r o w t h
S h a r e h o l d e r va l u e
P e n s i o n p l a n r i s k
N o c o m p e t i t i ve a d va n t a g e
M a n a g e m e n t t i m e a n d a t t e n t i o n
Tr a p p e d s u r p l u s
Risk budget
Vo l a t i l i t y

Material rewards for reducing pension risk
R E D U C I N G P E N S I O N R I S K PAY S O F F
10
Avoids trapped surplus
Reduced pension volatility
Potential tax savings
Reduced investment management fees
Additional reward: ensure benefit security for plan members
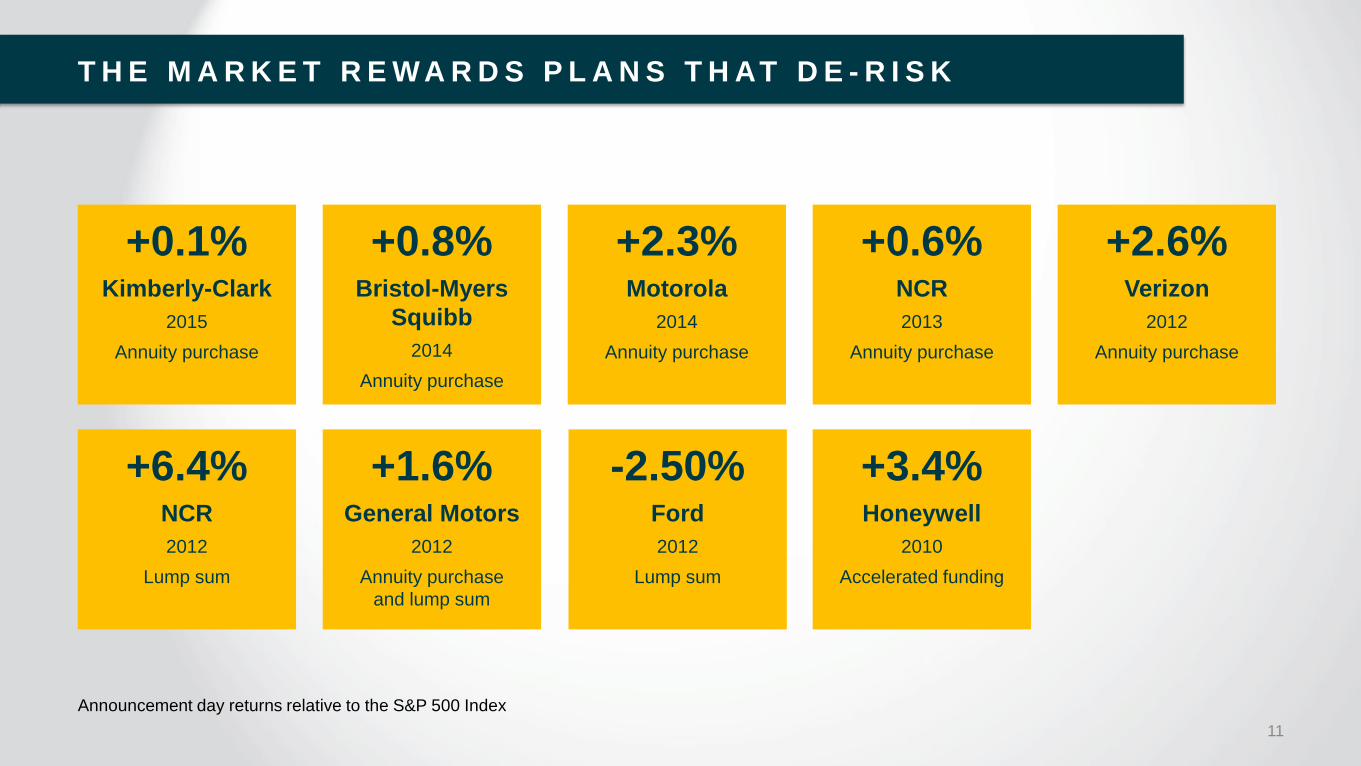
T H E M A R K E T R E W A R D S P L A N S T H AT D E - R I S K
11Announcement day returns relative to the S&P 500 Index
+0.1%Kimberly-Clark
2015Annuity purchase
+0.8%Bristol-Myers
Squibb2014
Annuity purchase
+2.3%Motorola
2014Annuity purchase
+0.6%NCR2013
Annuity purchase
+2.6%Verizon
2012Annuity purchase
+6.4%NCR2012
Lump sum
+1.6%General Motors
2012Annuity purchase
and lump sum
-2.50%Ford2012
Lump sum
+3.4%Honeywell
2010Accelerated funding

W H AT ’ S T H E B E S T O P T I O N F O R F I X E D I N C O M E A S S E T S ?
12
Focus on fixed income assets
Universe bond portfolio
Customized matching bond portfolio

I S W A I T I N G F O R I N T E R E S T R AT E S T O R I S E W O R T H I T ?
13
Magic number is 2.5%
over 5 years
Source: Sun Life analysis for a typical Canadian defined benefit pension plan
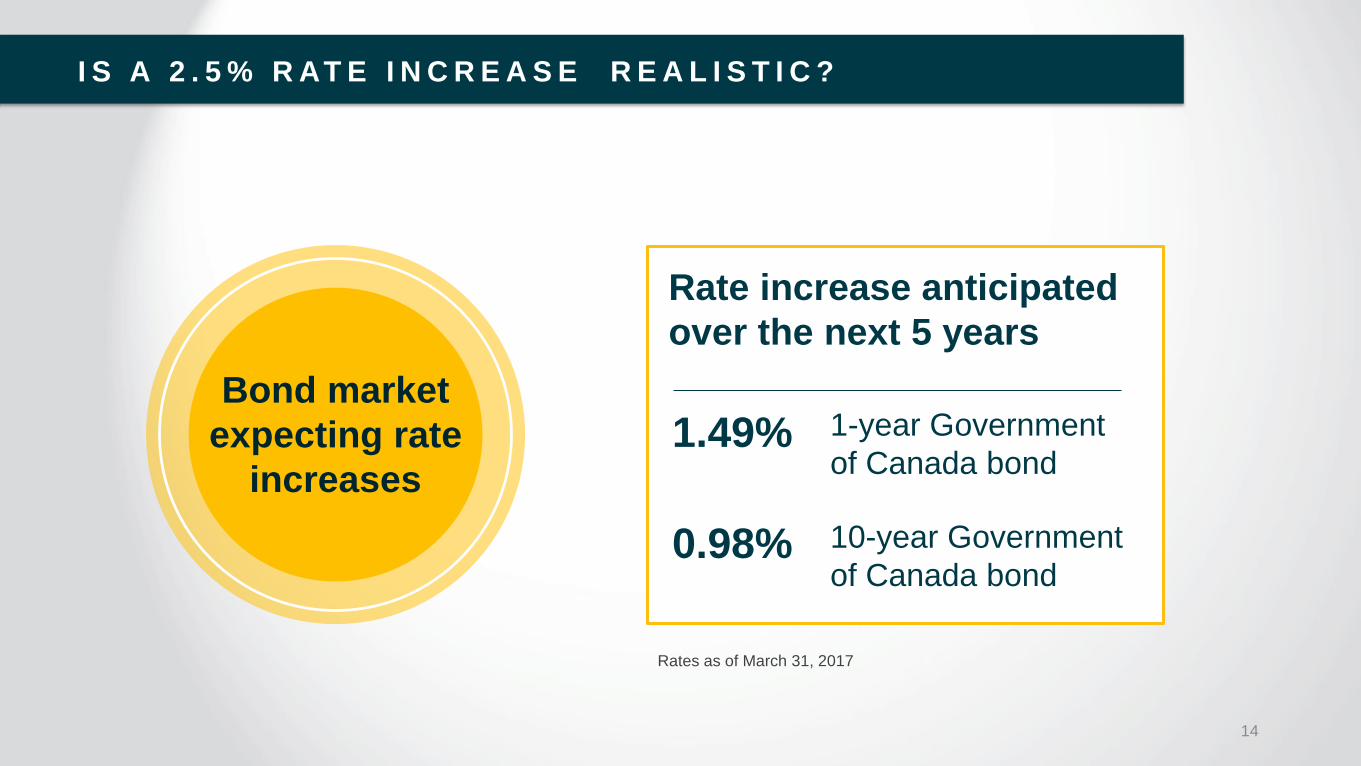
I S A 2 . 5 % R AT E I N C R E A S E R E A L I S T I C ?
14
Bond market expecting rate
increases
Rate increase anticipated over the next 5 years
1-year Government of Canada bond
1.49%
10-year Government of Canada bond
0.98%
Rates as of March 31, 2017
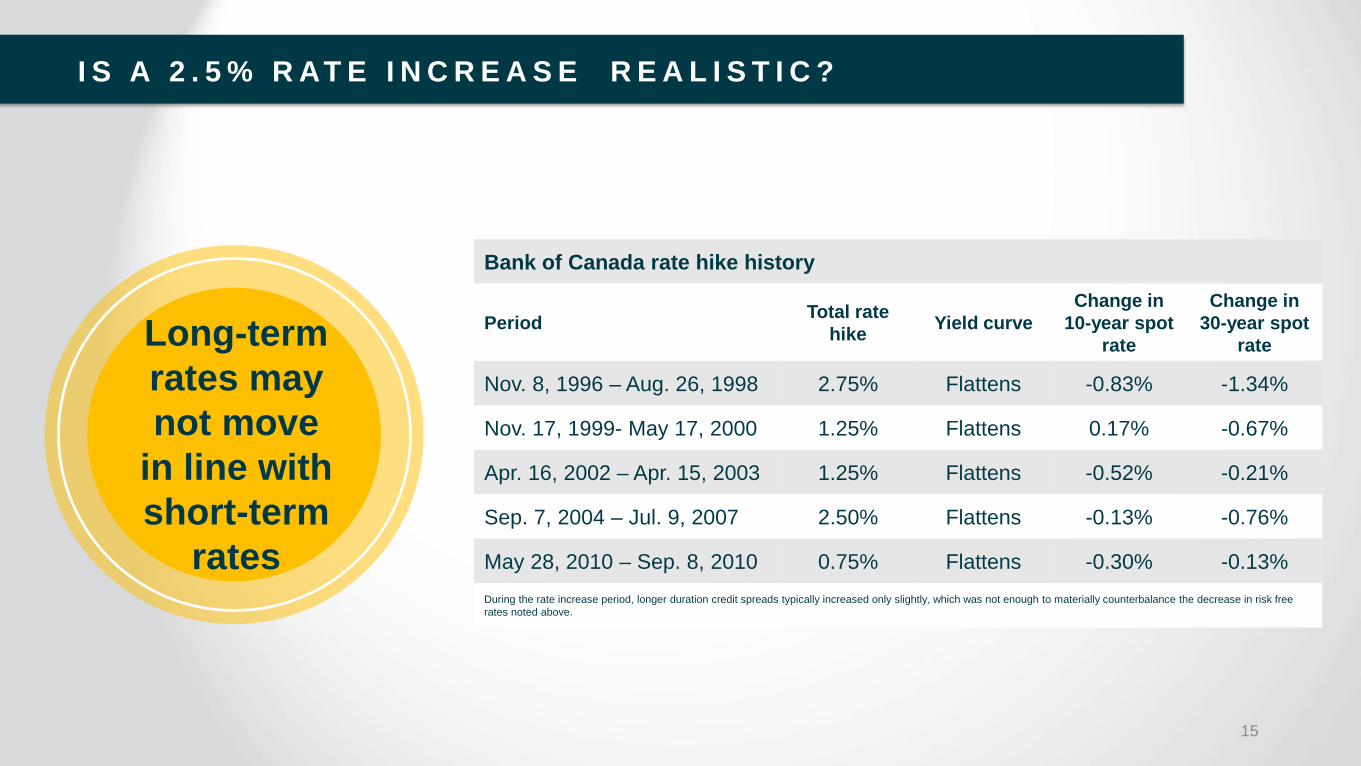
I S A 2 . 5 % R AT E I N C R E A S E R E A L I S T I C ?
15
Long-term rates may not move
in line with short-term
rates
Bank of Canada rate hike history
Period Total rate hike Yield curve
Change in 10-year spot
rate
Change in 30-year spot
rate
Nov. 8, 1996 – Aug. 26, 1998 2.75% Flattens -0.83% -1.34%
Nov. 17, 1999- May 17, 2000 1.25% Flattens 0.17% -0.67%
Apr. 16, 2002 – Apr. 15, 2003 1.25% Flattens -0.52% -0.21%
Sep. 7, 2004 – Jul. 9, 2007 2.50% Flattens -0.13% -0.76%
May 28, 2010 – Sep. 8, 2010 0.75% Flattens -0.30% -0.13%During the rate increase period, longer duration credit spreads typically increased only slightly, which was not enough to materially counterbalance the decrease in risk free rates noted above.

I S A 2 . 5 % R AT E I N C R E A S E R E A L I S T I C ?
16
Demand for long duration assets may
keep rates low

T O P T I P S T O AV O I D A C L O U D Y R E S U LT
17

Throw away your crystal ball
Take action instead
18
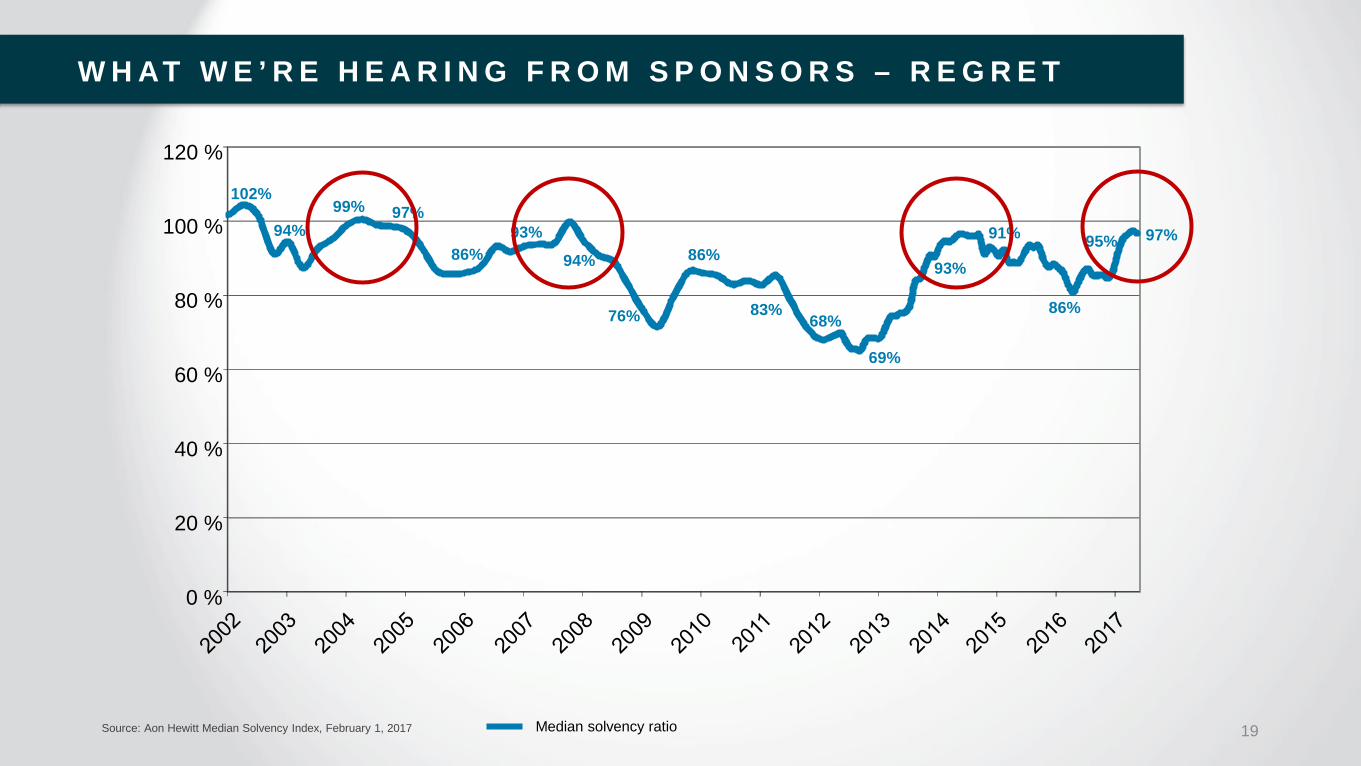
Source: Aon Hewitt Median Solvency Index, February 1, 2017
W H AT W E ’ R E H E A R I N G F R O M S P O N S O R S – R E G R E T
19
0 %
20 %
40 %
60 %
80 %
100 %
120 %
Median solvency ratio
69%
102%
94%99% 97%
86%93%
94%
76%
86%
83%68%
93%
91%
86%
95% 97%
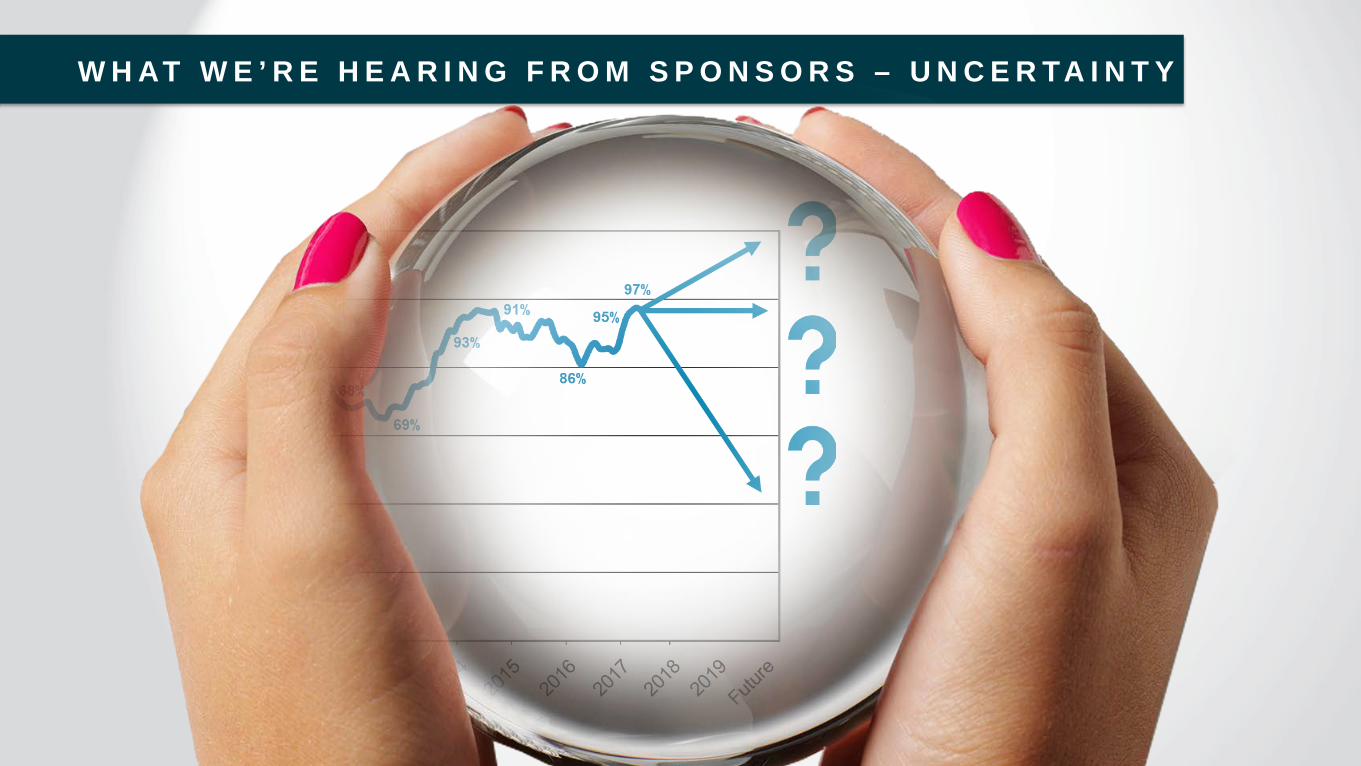
W H AT W E ’ R E H E A R I N G F R O M S P O N S O R S – U N C E R TA I N T Y

T H E F U T U R E I S R E A L LY C L O U D Y
21

M A N Y H AV E D E C I D E D T O TA K E A C T I O N
22
PPG (U.S.)
Bell Canada (Canada)
General Motors (U.S.)
Verizon (U.S.)
Loblaw (Canada)
Kimberly Clark (U.S.)
AstraZeneca (U.K.)
Rolls Royce (U.K.)
TRW (U.K., U.S., Canada)
British Airways (U.K.)
Siemens (U.K.)
Bristol-Myers-Squibb (U.S.)

O P T I O N S F O R P E N S I O N P L A N S
•Sell equities, buy bonds
•Buy longer bonds
•Custom portfolio•Custom benchmarking
•Wind up•Buy annuities or longevity insurance
23
Pension risk
transferCustom
LDIReduce equities

24
WHAT’S HOLDING
YOU BACK?