three-dimensional imaging of human stem cells using...
TRANSCRIPT
on June 6, 2018http://rsif.royalsocietypublishing.org/Downloaded from
rsif.royalsocietypublishing.org
ResearchCite this article: Niclis JC, Murphy SV,
Parkinson DY, Zedan A, Sathananthan AH, Cram
DS, Heraud P. 2015 Three-dimensional imaging
of human stem cells using soft X-ray
tomography. J. R. Soc. Interface 12: 20150252.
http://dx.doi.org/10.1098/rsif.2015.0252
Received: 22 March 2015
Accepted: 14 May 2015
Subject Areas:biochemistry, chemical biology, biotechnology
Keywords:stem cells, transmission soft X-ray microscopy,
three-dimensional, human
Author for correspondence:P. Heraud
e-mail: [email protected]
†These authors contributed equally to this
work.
Electronic supplementary material is available
at http://dx.doi.org/10.1098/rsif.2015.0252 or
via http://rsif.royalsocietypublishing.org.
& 2015 The Author(s) Published by the Royal Society. All rights reserved.
Three-dimensional imaging of humanstem cells using soft X-ray tomography
J. C. Niclis1,3,†, S. V. Murphy2,4,†, D. Y. Parkinson5, A. Zedan5,A. H. Sathananthan1, D. S. Cram1 and P. Heraud1,6
1Department of Anatomy and Developmental Biology, and 2The Ritchie Centre, Monash Institute of MedicalResearch, Monash University, Clayton, Victoria 3800, Australia3The Florey Institute of Neuroscience and Mental Health, Melbourne University, Parkville, Victoria 3052, Australia4Wake Forest Baptist Medical Center, Wake Forest Institute for Regenerative Medicine, Winston-Salem, NC, USA5Advanced Light Source, Lawrence Berkeley National Laboratory, US Department of Energy, Berkeley, CA, USA6Centre for Biospectroscopy, School of Chemistry, Monash University, Melbourne, Victoria, Australia
Three-dimensional imaging of human stem cells using transmission soft X-ray
tomography (SXT) is presented for the first time. Major organelle types—
nuclei, nucleoli, mitochondria, lysosomes and vesicles—were discriminated
at approximately 50 nm spatial resolution without the use of contrast agents,
on the basis of measured linear X-ray absorption coefficients and compari-
son of the size and shape of structures to transmission electron microscopy
(TEM) images. In addition, SXT was used to visualize the distribution of a
cell surface protein using gold-labelled antibody staining. We present the
strengths of SXT, which include excellent spatial resolution (intermediate
between that of TEM and light microscopy), the lack of the requirement for
fixative or contrast agent that might perturb cellular morphology or produce
imaging artefacts, and the ability to produce three-dimensional images of
cells without microtome sectioning. Possible applications to studying the
differentiation of human stem cells are discussed.
1. IntroductionPluripotent and multipotent human stem cells possess the extraordinary capacity
to self-renew and generate specialized cells in response to appropriate environ-
mental signals. As such, this class of cells is an invaluable research tool for
regenerative medicine, which aims to replace or repair damaged tissue [1–3],
as well as enabling disease modelling, whereby stem cells with specific genetic
or functional defects provide an opportunity to interrogate human pathologies
in vitro [4–7]. These fields have been bolstered with the identification of novel
sources of pluripotent and multipotent cell populations from embryonic, adult
and perinatal tissues, such as induced pluripotent stem cells [8] and human
amnion epithelial cells (hAECs) obtained from term placentae [9,10]. Application
of stem cells for regenerative medicine and disease modelling requires a robust
understanding of the process of cellular differentiation. Knowledge regarding
specific intracellular changes that occur during differentiation will assist in the
development of desired stem cell progeny and progress research towards a
better understanding of the nature of pluripotency. This knowledge would be
greatly assisted by advances whereby cellular morphology could be imaged in
three dimensions with minimal perturbation caused by sample preparation.
Traditionally, researchers have focused much of their attention on specific gene
and protein markers to identify and characterize both mature cell populations and
their immature progenitors. Expression of specific genes and proteins is used to
predict cellular activity and function in mature cell types and to define mature cel-
lular phenotypes. The differentiation of stem cells into their mature progeny is
correlated with the suppression of genes and proteins related to self-renewal
and pluripotency, and the increase in gene and protein expression specific for
the mature cell phenotype. However, recently there has been a greater understand-
ing that important and functional roles related to the differentiated state are
rsif.royalsocietypublishing.orgJ.R.Soc.Interface
12:20150252
2
on June 6, 2018http://rsif.royalsocietypublishing.org/Downloaded from
reflected in other phenotypic characteristics such as cell size,
cellular architecture and organelle number, size, shape and
density. For example, it is well known that stem cell populations
alter their shape, cytoskeleton and organelle composition
during differentiation. For example, human mesenchymal
stem cell commitment to adipocyte or osteoblast fate is influ-
enced by both cell shape and cytoskeletal tension [11].
Similarly, cytoskeletal changes appear to be definitive for key
stages in stem cell differentiation particularly in neural lineages
[12]. Further, mitochondrial arrangement has also been shown
to be a valid indicator of stem cell differentiation competence,
possibly due to changes to metabolic activity required for
lineage commitment [13]. Morphological changes that occur
during stem cell differentiation have essential functions and
can include the projection of cellular elements to form neurites
that conduct electrical impulses between mature neurons, or
cytoskeletal polarization during the formation of cuboidal
lung epithelium. Therefore, in addition to gene and protein
expression, there are myriad cellular changes that occur that
affect cellular function that are currently difficult to quantify
using current methodologies.
A greater understanding of the cytoskeletal and organelle
composition and arrangement during stem cell differentia-
tion would greatly assist efforts to develop lineage
committed stem cell-derived populations for research, drug
testing or cell therapy applications. A traditional method to
visualize changes in cytoskeletal structure and organelle
arrangement has been low spatial resolution analysis using
standard confocal fluorescence light microscopy and confocal
laser scanning microscopy, or high spatial resolution trans-
mission electron microscopy (TEM), both of which require
fixation and contrast agents that can alter morphology
and introduce visual artefacts. While these methods have pro-
vided valuable information regarding cellular changes during
differentiation, confocal fluorescence images have limited
spatial resolution compared with TEM and require multiple
antibody stains to provide an indirect overview of more than
one aspect of cellular structure. On the other hand, TEM
provides high-resolution two-dimensional information, but
is limited by the harsh fixation and sectioning methods necess-
ary and incompatibility with specific antibody staining. In
addition, while it is possible to reconstruct three-dimensional
tomographic images using two-dimensional electron tomogra-
phy [14,15], this method is very time consuming and suffers as
tissue is lost in the sectioning process and use of harsh fixatives
and contrast agents [16].
Hard X-ray tomography is another technique that is
used extensively to image biological samples. The most
common applications of hard X-ray tomographyare in the micro-
metre to millimetre resolution length scale (appropriate for Earth
science, materials science and medical applications, for example).
Although hard X-ray tomography instruments which achieve
sub-100 nm resolution exist, biological specimens have very
low absorption in the hard X-ray region, imparting challenges
in using this technique for their analysis. One approach to
bypass this limitation involves 200–500 nm ultramicrotome sec-
tioning for the visualization of intracellular components [17];
however, this laborious process has prevented widespread appli-
cation of the technique. A number of researchers are pursuing
phase imaging to overcome this limitation [18–20] and it will
be interesting to track the development of the hard X-ray tomo-
graphy technique and see if it can successfully be applied for
cellular imaging at resolutions relevant to resolve organelles.
Transmission soft X-ray tomography (SXT) is a new tech-
nology that may overcome the spatial resolution and image
contrast limitations of the other microscopies for studying
stem cells providing high spatial resolution imaging, in all
three dimensions, of fine-scale structural components in
thick samples (up to approx. 12 mm, as described below).
SXT represents a much higher resolution version of the
familiar computed tomographic clinical imaging method-
ology, providing spatial resolution on the order of 50 nm, a
pertinent spatial observation window previously inaccessible
to researchers observing intact cells, between confocal fluor-
escence and TEM. The soft X-ray wavelengths employed in
SXT are approximately 2 nm, and do not limit the imaging res-
olution, which is instead limited by the nanofabricated X-ray
optics used in the instrument. These optics have been demon-
strated with capabilities down to 10 nm and better [21,22].
In addition to resolution, an important capability of SXT is
its ability to distinguish subtle differences in X-ray linear
absorption coefficients (LACs). Different materials, and thus
different biological intracellular components, have character-
istic LAC values, so the ability to quantitatively image the
three-dimensional distribution of LAC values can be used to
discriminate between biological intracellular components.
The chemical compositions of organelles vary widely depend-
ing on their class, with vesicles, for example, a combination of
water and lipid molecules, while mitochondria consist of dense
granules and a proteinaceous matrix. These variations translate
to clearly distinguishable differences in X-ray absorption,
measured as an X-ray LAC [23,24]. Relying on LAC imaging
in this manner renders unnecessary the harsh fixation methods
and contrast agents of traditional techniques such as TEM,
which often dehydrate, cross-link or otherwise modify intra-
cellular structures; for SXT, samples are simply flash frozen
prior to imaging. Equally, fluorescent antibody imaging
agents used in confocal microscopy are not essential as the
cell and intracellular structures are directly imaged, providing
arguably a more accurate representation of intracellular mor-
phology. While SXT presents intense sources of radiation to
specimens, the appearance of damage to biological materials
in the images at the approximately 50 nm resolution presen-
ted here is avoided by maintaining the samples at cryogenic
temperatures during imaging [25,26].
SXT has hitherto been applied mainly to inanimate
materials [27], viruses [28] and simple organisms such as pro-
tists, unicellular eukaryotes and fungi [24,29–33]. Recently, a
few studies have captured tomographic images of mammalian
cells, typically small erythrocytes or leucocytes [34–37], includ-
ing human cells [38,39] but to our knowledge there has been no
literature reporting SXT of more complex human cells, such as
stem cells of any kind.
Here, we report the first direct imaging and contempora-
neous examination of cytoskeletal and organelle morphology
in human stem cells and their differentiated progeny with
SXT. Additionally, we show that traditional antibody staining
for specific proteins can be combined in stem cells with SXT
technology to visualize the cellular localization of proteins
concurrently with three-dimensional direct imaging of intra-
cellular components. While antibody labelling for SXT has
been demonstrated [38,40], this is the first demonstration in
human stem cells. Furthermore, we demonstrate the success-
ful application of SXT technology in two stem cell types and
report on the advantages of this new imaging modality to the
field of stem cell biology. We argue that the ability to image

rsif.royalsoc
3
on June 6, 2018http://rsif.royalsocietypublishing.org/Downloaded from
intracellular components of human cells with this new
approach will have a major impact on a plethora of research
questions in the field of cell biology, including the study of
fertilization, cell apoptosis, mechanisms of viral infections,
liposomal and protein diseases.
ietypublishing.orgJ.R.Soc.Interface
12:20150252
2. Material and methods2.1. Culture of human amnion epithelial and human
embryonic stem cellsAll experiments were performed under guidelines set by the
Monash Human Ethics Committee, Monash University. Exper-
iments were approved by the Monash Human Research Ethics
Committee as part of the research project application ‘Establishment
of a tissue bank and associated database for use by the Centre for
Women’s Health Research.’ no. 01067B. hAECs were isolated as pre-
viously described [9]. Briefly, placentae were obtained from women
with uncomplicated pregnancies undergoing elective caesarean sec-
tion at term. The amnion membrane was manually stripped from
the chorion membrane and hAECs enzymatically removed from
the amnion by two, 1 h digestions in Trypzean (Sigma-Aldrich).
Trypzean was inactivated by soya bean trypsin inhibitor (Sigma-
Aldrich) and hAECs collected by centrifugation. hAECs were
cultured in either Small Airway Epithelial Growth Medium
(Lonza) to induce differentiation into the lung epithelial lineage or
DMEM/F12 10% FBS to maintain hAECs in an undifferentiated
state for up to 28 days without passage.
Human ESCs (H9 line, WiCell) were cultured as previou-
sly described [41]. Briefly, hESCs were grown in co-culture with
2 � 104 mouse embryonic fibroblasts per cm2 in DMEM/F12
media supplemented with 20% Knockout Serum Replacement,
1% Glutamax, 1% Insulin-Transferrin-Selenium-X, 1% non-
essential amino acids, 0.5% penicillin/streptomycin and 0.2%
b-mercaptoethanol and 10 ng ml21 bFGF (Invitrogen). Human
ESCs were passaged enzymatically every 4–5 days upon reaching
confluence at a ratio of 1 : 5 using Tryple Select (Invitrogen).
2.2. Sample isolation and preparationAll cells were enzymatically disassociated to form a single-cell
suspension from culture using Trypsin 0.05% for 1–5 min at
378C and were then washed in PBS before fixation in glutaralde-
hyde for 5–10 min. As discussed earlier, SXT produces images
from the contrast of X-ray absorption and fixation is not required.
For this study, however, as cell samples were generated in
Melbourne, Australia, both quarantine regulations and transpor-
tation times to the synchrotron location in Berkeley, CA,
mandated treatment with fixatives to preserve cyto-architecture.
Upon arrival at the Lawrence Berkeley National Laboratory, cell
suspensions were passed through 40 mm filters to exclude aggre-
gates of multiple cells that would otherwise cause blockages and
prevent cells advancing to the narrow end of glass capillaries.
This process also removed a limited number of large irradiated
fibroblasts present within hESC preparations. Samples were diluted
to a low concentration (0.5–104 cells ml21). Cells were pipetted into
thin-walled (200 nm), pulled glass capillary tubes and advanced
to the narrow end (approx. 15 mm internal diameter) by gentle
centrifugation (400–600g) for 1–5 min. Glass capillaries contain-
ing specimens were then mounted immediately within the
rotation-capable cryogenic stage of the XM-2 soft X-ray microscope
on beamline 2.1 at the National Centre for X-ray Tomography at the
Advanced Light Source (ALS).
2.3. Gold nanoparticle immunocytochemistryTo determine the distribution of specific proteins within
individual, differentiated cells, single cells were harvested from
confluent hAEC cultures maintained in SAGM for 28 days
and labelled with an antibody specific for the Cystic Fibrosis
Transmembrane Conductance Regulator (CFTR) protein. Briefly,
cells were fixed in 4% paraformaldehyde in PBS for 15 min at 48Cand permeabilized with 0.1% Triton-X-100 in PBS for 5 min at
room temperature. Cells were incubated with rabbit anti-CFTR
primary antibody at 1 : 1000 (Cell Signaling no. 2269, Invitrogen)
and then with 1 : 1000 Alexa Fluor 488 FluoroNanogold-
conjugated secondary antibody (Molecular Probes no. A-24922,
Invitrogen), each for 1 h at room temperature. Visualization of
CFTR-conjugated gold nanoparticles was enhanced using a LI
Silver enhancement kit (Invitrogen).
2.4. Transmission soft X-ray microscopySamples were flash frozen by a stream of liquid nitrogen-cooled
helium and maintained at cryogenic temperatures throughout
the imaging. All imaging was done at the ‘XM-2’ instrument of
the National Center for X-ray Tomography, at Beamline 2.1 at
the ALS in Berkeley, CA. In that instrument, a synchrotron bend
magnet produces X-rays which are directed by a mirror to a Fresnel
zone plate condenser. An order-sorting aperture was used to select
photons with energies just below the oxygen edge (517 eV), corre-
sponding to an X-ray wavelength of 2.4 nm. These X-rays
penetrated mounted samples within the cryostage of XM-2 and
are then imaged onto a back-thinned CCD detector using a Fresnel
zone plate objective optic with outer zone width of approximately
50 nm (figure 1). The two-dimensional resolution of zone-plate-
based X-ray microscopes is well known to be approximately
equal to the outermost zone width [42]. The exact three-
dimensional resolution was dependent on additional factors,
including sample contrast, number and distribution of angles
collected, and sample alignment. Using test samples and the
noise-compensated leave-one-out method [43], the three-
dimensional resolution of the instrument was found to be close
to the two-dimensional resolution of 50 nm determined by the
zone plate used (DP 2010, personal communication).
X-ray image datasets comprised a series of 90 projection
images, sequentially acquired every 28 as the sample was rotated
through a total of 1808. For a given zone plate resolution, the field
of view is determined by the number of pixels. The camera used
had 512 � 512 pixels, which were binned by 4 in each dimension,
with each pixel having a dimension of 32 nm on a side, giving a
field of view of approximately 16 mm. Exposure times between
150 and 300 ms were used. Images were normalized by bright
fields (collected before and after the projection series by moving
the sample out of the field of view) and IMOD 4.1 software was
used for manual alignment of the projection images to a common
frame of reference [44] using gold nanoparticles which had been
placed on the outside of the capillary tube as fiducial markers.
Tomographic reconstructions were performed using iterative
reconstruction methods [45,46] with segmentation, surface visual-
ization and volume rendering done using AMIRA software (FEI
Visualisation Sciences Group, Burlington, MA, USA). The colour
and transparency of the colourmap for the rendered volume was
adjusted to make intracellular structures visible.
Determining the boundaries of various intracellular compo-
nents (such as organelles) is a process known as ‘segmentation’
(or digital labelling) and can be done semi-automatically using
tools in the segmentation editor interface of AVIZO. In the case
of a number of the intracellular components, the three-dimen-
sional equivalent of a ‘magic wand’ in the PHOTOSHOP software
was used, whereby one voxel (three-dimensional pixel) was
selected, along with a positive and negative greyscale threshold.
The boundary of the object expands from the starting voxel
to encompass all adjacent voxels that fell within the selected
greyscale threshold. By choosing thresholds appropriately for
different classes of intracellular components, groupings of
bend magnet
(a)
(d )
(c)
(b)
mirror condenser specimen detectorobjective
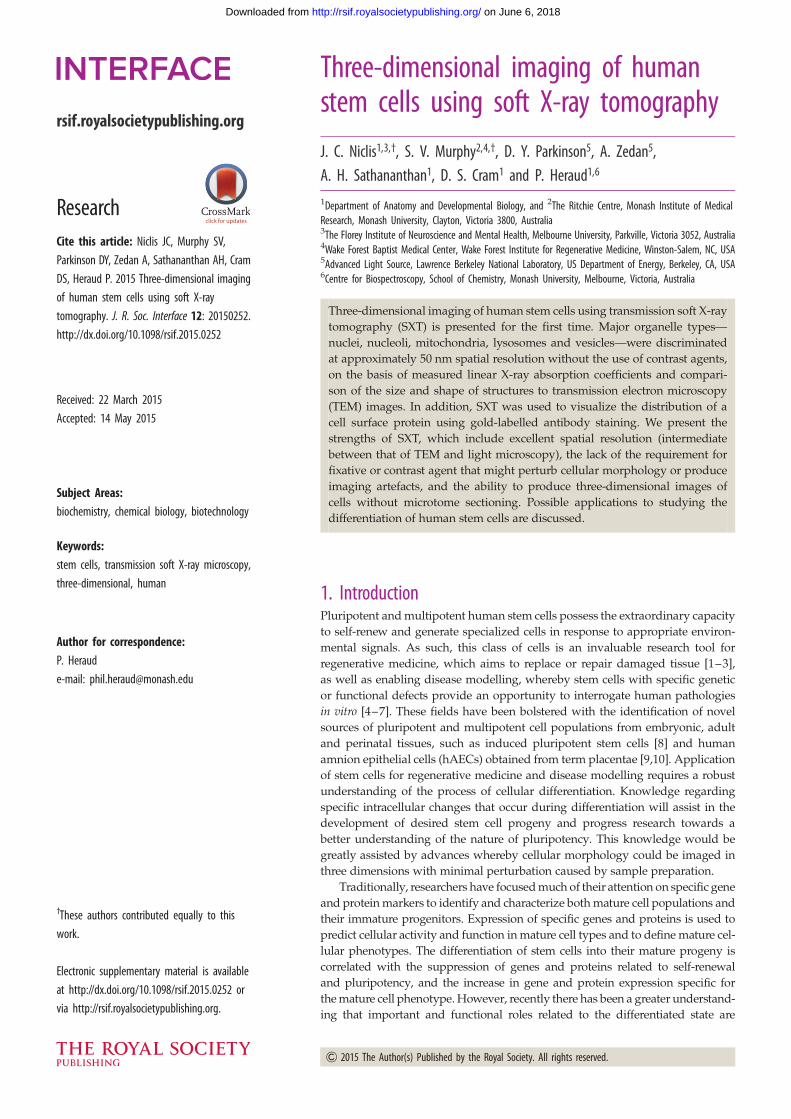
Figure 1. Sample holder and transmission X-ray microscope. (a) Optical wide field microscope image of the glass capillary tube used to hold the sample. (b) A magnifiedview of a cell in the capillary. (c) Photograph of the transmission X-ray microscope. The magnet and mirror are behind the wall at the top of the photograph. Therectangular box near the top of the image houses the condenser lens. The black box near the centre of the photograph is the cryostage, where the sample is held;the pinhole and objective lens sit approximately 1 mm on each side of the sample. The camera housing is the grey box near the bottom of the image. (d ) Schematicof the microscope. X-rays are generated by synchrotron radiation from the bend magnet for beamline 2.1. The mirror directs the X-rays into the end station, where they arefocused by a Fresnel zone plate condenser onto the sample. A pinhole acts as an order-sorting aperture to allow selection of a particular X-ray energy. The sample is held ina cryogenically cooled specimen stage and is imaged by an objective Fresnel zone plate and back-thinned CCD detector. (Online version in colour.)
rsif.royalsocietypublishing.orgJ.R.Soc.Interface
12:20150252
4
on June 6, 2018http://rsif.royalsocietypublishing.org/Downloaded from
intracellular objects with the same voxel thresholds could be
segmented (digitally labelled) serially using a single click
within the segmentation editor interface.
Additional background information on both the experiment
and image processing for SXT has recently been published [47].
We note here that in general, biological samples must be less
than 12 mm in thickness to allow sufficient penetration by soft
X-rays to achieve good images—for thicker samples, the overall
%Transmission of soft X-rays in the water window energy range
(280–530 eV) through the sample drops below 10% such that the
count level on the detector is very low. This in turn leads to
noisy and artefact-corrupted reconstructed three-dimensional
images. There are a number of studies reported where hard
X-rays are used for tomographic image reconstruction that pene-
trate tens of micrometres into tissues and cell clusters, but these
methods achieve much lower spatial resolution (micrometre
range) than using the SXT method described here [48–50].
The diameter of higher order eukaryotic cells, such as mamma-
lian cells varies considerably depending on cell type and culture
conditions, and remains a limiting factor for analysis by soft X-ray
microscopy because of the upper limit for cell thickness for SXT of
approximately 12 mm. SXT has been performed on adherent cells
grown on TEM grids [51,52], which allows for cells that are larger
than 12 in two of the dimensions, but not in thickness. While this
allows larger samples to be imaged, it does limit the angular
range over which projection images can be collected, which can
reduce the quality of the final three-dimensional reconstruction.
At XM-2, SXT microscopy is performed on samples loaded
within glass capillaries, so adherent cultures must be first disasso-
ciated and placed in suspension. The stem cells used in this study
were grown in adherent conditions on extracellular matrix sub-
strates, and enzymatic disassociation with trypsin was used to
generate suspension cultures. While this has the disadvantage of
disrupting certain morphologies of monolayer cultures systems, it
has the benefit of reducing cellular dimensions to facilitate loading
into the glass capillaries. Human stem cells are typically small and
have high nuclear to cytoplasmic ratios [53]; however, this proces-
sing was crucial for enabling these cells to achieve dimensions that
approached and fell below 12 mm in diameter.
The absence sample damage at the photon energies was used
and was confirmed by comparing images at 08 and 1808 and hori-
zontally flipping one of the images. Direct comparisons could then
be made and for all samples no changes were observed, indicating
no sample damage at the resolution used (data not shown).
2.5. Transmission electron microscopy and areameasurements
Cells were fixed by adding 0.2 ml of fixative (6% paraformalde-
hyde and 5% gluteraldehyde in 0.2 M cacodyladate buffer) at
room temperature for 1 h. After fixation, cells were centrifuged
at 3200 r.p.m. for 10 min at 308C, and washed with 0.1 M cacody-
ladate buffer. After fixation the samples were postfixed with 1%
osmium tetroxide, dehydrated in a graded series of ethanol and
embedded in Epon. A total of 50–70 nm thick sections were
stained with uranyl acetate and lead citrate and observed with a
Zeiss EM 109 transmission electron microscope.
The ‘magic wand’ selection tool in Adobe Photoshop CS5 was
used to encircle each organelle within digital files of both TEM

(a) (g)
(h)
(b)
(bi)
(ei) (ev)
(eii)
(eiii)
(eiv)
(bii) (biv)
(bv)
(biii)(c)
(d )
(e)
( f )
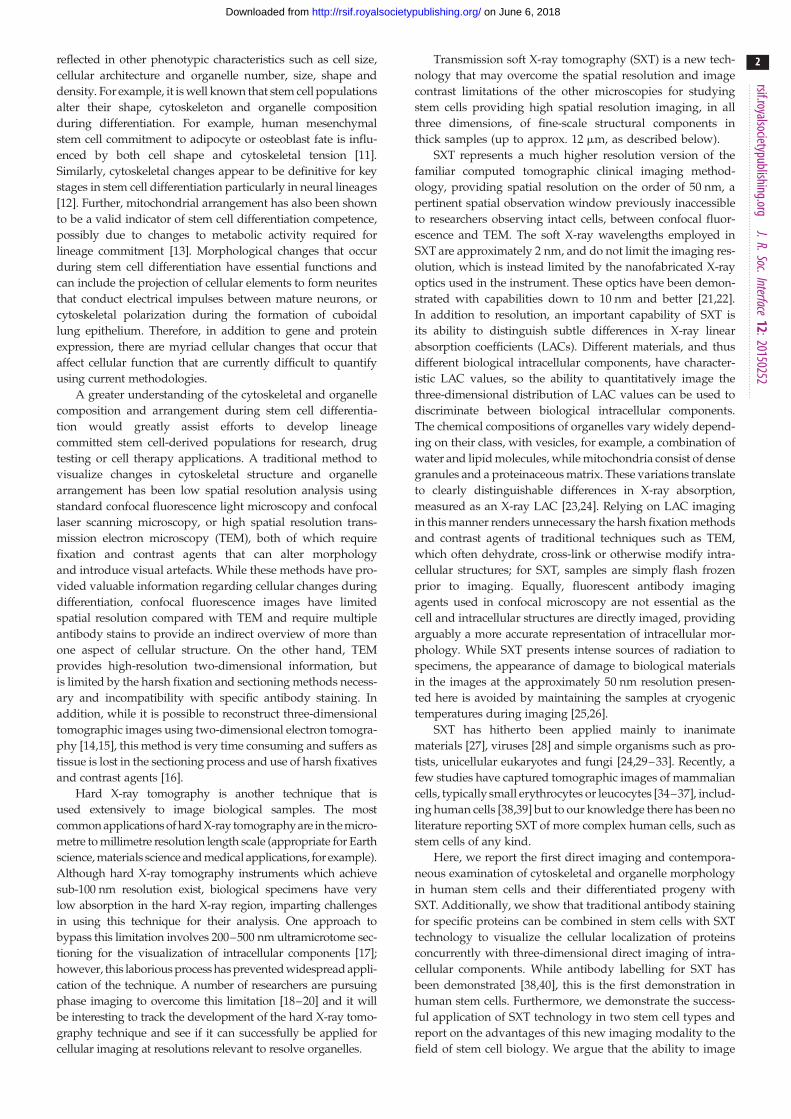
Figure 2. Three-dimensional reconstruction methodology. (a – c) Representative two-dimensional digital sections from three hESCs and (d – f ) three hAECs shown ingreyscale. After tomographic reconstruction, digital sections of the three-dimensional volume can be visualized. A series of sections for an individual hESC (b(i – v))and hAEC (e(i – v)) are shown, with an example tracing (segmentation) of organelles, outlined in yellow and indicated by arrows. Full three-dimensional volumevisualization of a hESC (g) and hAEC (h) are shown with false-coloured organelles. (Online version in colour.)
rsif.royalsocietypublishing.orgJ.R.Soc.Interface
12:20150252
5
on June 6, 2018http://rsif.royalsocietypublishing.org/Downloaded from
images and cross-sectional area dimensions were then recorded.
Area values were converted from a pixel to a real value based
upon scale bar measurements. To compare these measurements
with those from SXT images, a single digital slice can be extracted
from the reconstructed three-dimensional volume as a two-dimen-
sional image, and then areas can be calculated based on this image
as described above for TEM. All organelles within both TEM
images were measured and collated into organelle categories by
visual examination. SXT intracellular objects were collated using
these methods, but with additional reliance on the measured
LAC values within each organelle, as previous publications have
shown that LAC values can be used to separate distinct organelles
[22]. All graphical representations were generated using the PRISM
program (GraphPad Software, Inc, CA, USA; figures 3 and 4),
with data displayed as mean+ s.e.m., *p , 0.05, **p , 0.01,
***p , 0.001, using one-way ANOVAs and the Kruskal–Wallis
non-parametric test with Dunns post-test. Raw data was found in
electronic supplementary material, S5.
3. Results3.1. Cell preparationAs described in the Material and methods section, specimens
imaged by the XM-2 soft X-ray microscope were contained
within fine-walled pulled glass capillaries (figure 1a,b), which
were mounted before the detector between the microscope
condenser and objective (figure 1c,d ). Once cells were delivered
to the appropriate position, sample loaded capillaries were
then mounted for imaging by the XM-2 (figure 1d).
3.2. Soft X-ray imaging and three-dimensionalreconstruction
Representative single two-dimensional images of three of the
12 total hESC (figure 2a–c) and 12 total hAEC-derivatives
after X-ray imaging are shown (figure 2d– f ). For each cell,
this kind of two-dimensional image was repeatedly collected
90 times as mounted capillaries were rotated in 28 steps.
Acquired two-dimensional datasets for each cell were tomogra-
phically reconstructed to generate a single three-dimensional
volume, consisting of the measured LAC value for each point
in three-dimensional space. This three-dimensional volume
can be visualized in a number of ways. One of these ways is
by taking ‘digital sections’ through the volume. Several of
these one-pixel-thick slices for an individual hESC and hAEC-
derivative are shown in figure 2b(i–v) and figure 2e(i–v),
respectively, with several organelles outlined in yellow across
all frames—the change in shape of the outlines organelles
over the various slices emphasizes the importance of three-
dimensional imaging—any individual slice through the
volume gives incomplete information. A colourmap (sometimes

nucleus
LA
C (
mm–1
)
volu
me
(mm
3 )
0 0
0.2
0.4
0.62.5
3.0
3.5
4.0
0.005
0.0100.20
0.30
0.40(g)
(a) (b)
(c)
(e)
(d )
( f )
(h)**
*
*
*
**
****
nucleoli red
2.5 mM
black green nucleoli red black green
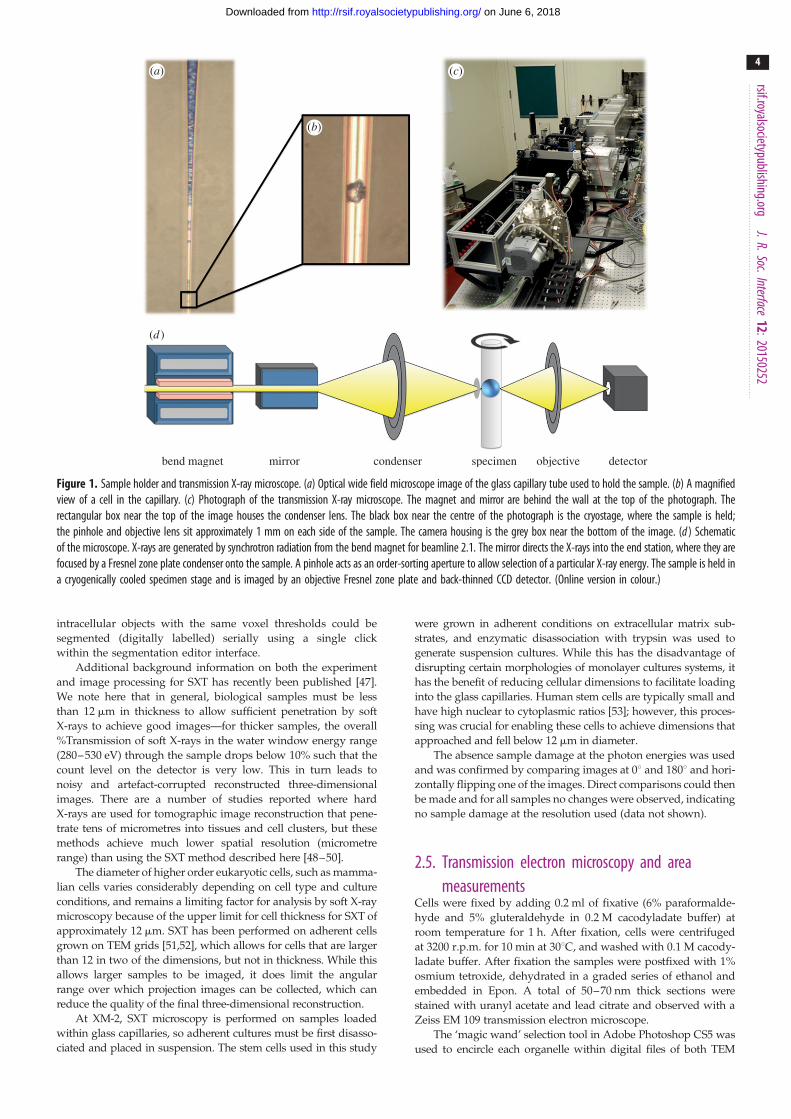
Figure 3. Organelle sub-division and calculation of densities and volumes. (a – d) Digital sections through reconstructed three-dimensional SXT volumes of an hESCsample. The boundaries of all discreet intracellular objects were determined either semi-automatically or by tracing on each section, to allow calculation of LAC andvolume values for each object. In cases of tracing, finding of optimal boundaries was aided by gradient magnitude images of the volume (e). The nucleus andnucleoli (a,f, blue arrow heads ¼ nucleus, blue arrows ¼ nucleoli) were immediately identifiable. Remaining objects required further assessment before assigningto organelle categories and were divided into three groups based on density and volume values, indicated by (b,f ) red arrows, (c,f ) black arrows and (d – f ) greenarrows. ( f ) Following tracing and assignment, all five groups were given false colours and rendered into a three-dimensional video image before (g) densities and(h) volumes were calculated. *p , 0.05, **p , 0.01. (Online version in colour.)
rsif.royalsocietypublishing.orgJ.R.Soc.Interface
12:20150252
6
on June 6, 2018http://rsif.royalsocietypublishing.org/Downloaded from
referred to as a lookup table) is used to map LAC values to
the colours or grey values that are seen on the screen to aid
in the process of segmentation. Low LAC values correspond
to darker grey colours (black being the lowest), whereas
higher LAC values correspond to lighter grey colours (white
being the highest).
Another way to visualize the volume is to show the bound-
aries of relevant structures within the sample, and then display a
three-dimensional rendering of the full volume. This was done
for figure 2g,h and three-dimensional files found in electronic
supplementary material, figures S1 and S2, after image segmen-
tation was completed as described in the Material and methods
section. After segmentation, each grouping of intracellular
objects can be volume rendered or surface rendered using a
different colour. If volume rendering is used, a colourmap that
includes variations in colour and transparency can be used;
generally, higher LAC values are shown as more opaque.
Videos showing a series of slices through the reconstructed
volumes of all 12 hESCs and hAECs imaged are shown in
electronic supplementary material, figures 3 and 4, respectively.
3.3. Volume and density evaluation of human stemcell samples
Volume and density evaluations were performed for the hESC
images acquired as opposed to hAEC-derivative images, due

0
***
(c)
(a) (b)
(d )
2.5 mM
***
******
**
***
******
******
******
SXT-nu
cleoli
SXT-lys
osom
e
SXT-mito
chon
d
SXT-se
c.ves
icles
TEM-se
c.ves
icles
TEM-m
itoch
ond.
TEM-ly
soso
me
area
(mm
2 )
0.5
1.0
2.0
2.5
Figure 4. Organelle classification. (a,b) TEM images of hESCs were captured and used as references for comparisons to SXT images to assist with organelle classi-fication. TEM images clearly show the presence and characteristics of potential organelle groups such as mitochondria (black arrows), lysosomes (red arrows) andunclassified objects, possibly small secretory vesicles or ribosomal clusters (green arrows). (c) Matching colour arrows showing examples of similar objects in three-dimensional rendered SXT hESC image. (d ) Area values were calculated from SXT (open bars) and TEM (striped bars) images and compared; organelles whichremained unknown were classified based on the closest match to TEM references and original colouring indicated by X-axis text highlighting. *p , 0.05,**p , 0.01, ***p , 0.001. (Online version in colour.)
rsif.royalsocietypublishing.orgJ.R.Soc.Interface
12:20150252
7
on June 6, 2018http://rsif.royalsocietypublishing.org/Downloaded from
to the considerably greater quantity of literature available from
alternative imaging methodologies of hESCs for comparative
purposes. Firstly, several intracellular objects visualized by
SXT may be assigned a priori, due to their well-characterized
location and morphology. This was used for identifying the
nucleus as it was the largest intracellular structure (figure 3a,
blue arrowhead), and the organelles within it, that were
obviously nucleoli (figure 3a, blue arrow). Both of these orga-
nelles were assigned false colour (blue), with colour density
directly proportional to organelle density (figure 3f ). Panels
(a–d ) show visualizations of digital slices through the volumes,
with brighter colours indicating higher LAC values. Figure 3fshows the volume rendering of the cell after segmentation of
the intracellular objects of interest.
Many intracellular objects were not classifiable in this
manner, as their size and location were indistinct. To assist
with object assignment, we performed accurate measure-
ments of each object’s volume and average LAC values
from the segmented SXT images. In cases of objects that
were especially complex, or in cases where the difference in
LAC between adjacent structures was very small, it was
necessary to manually trace the outlines of individual objects
in each two-dimensional digital slice that constituted the
three-dimensional image. This was done based on visual
inspection of the reconstructed images. As mentioned earlier,
the apparent contrast in slices through the reconstructed
images (figure 3a–d ) was a direct representation of LAC
values. To confirm that the location of the boundaries
selected by eye were optimal, these boundaries were over-
layed on images representing the gradient magnitude of the
three-dimensional images. Gradient magnitude images have
their highest values at locations of the fastest change in
LAC value in the image, which corresponds to the bound-
aries between objects. The manually traced boundaries were
fine-tuned to be in line with the boundaries visible in these
gradient magnitude images (figure 3e).
Once segmentation of all intracellular objects within the
reconstructed three-dimensional SXT cell image was completed,
precise LAC, volume and surface area values could be calculated
for each individual object, and clusters of objects could be deter-
mined (figure 3g,h). The localization of the nucleoli within the
nucleus enabled their identification to be made with confidence.
Remaining intracellular objects were distributed across a spec-
trum of LAC values, with low LAC represented by dark
contrast areas (figure 3b, red arrow), and high LAC as intensely
white (figure 3c,d, black and green arrows).
LAC and volume measurements were then used to classify
these remaining objects, using a combinatorial approach.
rsif.royalsocietypublishing.orgJ.R.Soc.Interface
12:20150252
8
on June 6, 2018http://rsif.royalsocietypublishing.org/Downloaded from
The largest unclassified objects were false-coloured red
(figure 3f, red arrows) and were seen to exhibit a tight distri-
bution of low LAC values compared with other objects
(0.008 + 0.0002 mm21, figure 3g). The remaining objects
(with higher LAC values) were separated into two groups
based on volume as two distinct groupings were evident,
with the larger 0.288+0.008 mm3 false-coloured black and
smaller 0.043+0.007 mm3 false-coloured green (figure 3f ).
Statistical separation based on volume measurements was
observed between these black and green objects (figure 3h)
and additionally LAC values demonstrated significance
between most object groups (figure 3g). Despite confident sep-
aration of SXT identified intracellular structures into distinct
categories, further assessment was required to provide confi-
dence in an accurate classification of each object category into
various organelle types.
It is important to note that, in this study, cell samples were
lightly fixed with glutaraldehyde to acquiesce with US customs
importation requirements. Aldehydes and other fixatives con-
tain carbon molecules that bind to amine groups, cause the
aggregation of molecules within cells and reduce lipid content.
Although fixatives are reversible upon washing in buffers and
over time, the rate of this reversal process is difficult to gauge.
Thus, fixatives potentially could have modified LAC values of
cells in this study from their native non-fixed state and may
have introduced inaccuracies in object classification based on
chemical density signatures (explaining the close LAC data
range for red, green and black objects). This variable warrants
future investigations of these cells in the absence of fixatives.
3.4. Organelle characterization and comparison totransmission electron microscopy
As this report is the first to image human stem cells with SXT,
and few mammalian cells have been previously assessed,
few reference data exist to assist with the assignment of
intracellular structures to various organelle categories from
detailed volume and LAC values. Accordingly, TEM images
of undifferentiated hESCs were obtained and used as objec-
tive reference material for comparison with the SXT data
(figure 4a,b). Morphological characteristics and a wealth of
reference literature [54–57] assisted with the classification
of organelles within TEM images, with mitochondria (black
arrows), ribosomes (green arrows) and vacuoles (red arrows)
appearing distinct and clearly identifiable (figure 4a,b). TEM
images, while only two-dimensional, allowed for generation
of approximate cross-sectional area values for each organelle
at the representative serial section that was acquired.
This was done similarly for digital slices through the SXT
three-dimensional reconstructed hESC images, to provide a
cross-sectional area measurement for each organelle and
facilitate SXT and TEM comparisons.
Surface area dimensions of red objects acquired by SXT
(1.00+0.2389 mm2) correlated closely with those of lysosomes
seen in TEM (0.870+0.2644 mm2) images. While these
measurements were not significantly different ( p . 0.05), they
were significantly different in size to all other potential orga-
nelle types that were evaluated (figure 4d). As such, the red
objects identified by SXT imaging are likely to be lysosomes,
or a similar organelle type. The most numerous SXT intra-
cellular objects, coloured black, were found to be similar in
size, distribution and surface area to mitochondria; 0.252+0.017 mm2 (SXT) and 0.107+0.010 mm2 (TEM). SXT objects
coded green were tentatively assigned as secretory vesicles as
they were equivalent in size (0.050+0.006 mm2) to observed
secretory vesicles in TEM images (0.024+0.001 mm2) and
were not statistically separable (figure 4d).
Overall, intracellular components could be separated into
distanced groupings based on LAC and volume measurements
from SXT datasets. These object groupings demonstrated sig-
nificant differences to each other in regards to cross-sectional
area, number and intracellular distribution (figure 4d). Group-
ings of intracellular objects identified by SXT correlated
robustly with various organelle classes identified by TEM
and were thus assigned with confidence, such as the nucleus,
nucleolus and mitochondria. For other groupings, such as
red objects, their classification as lysosomes or another similar
organelle type (i.e. large vacuoles) is likely, but requires
additional studies to confirm. One grouping of intracellular
objects that were not confidently assigned to an organelle
type, may possibly represent small secretory vesicles or riboso-
mal clusters, and differences in cross-sectional area between
the SXT and TEM preclude definitive classification at present.
3.5. Gold conjugated secondary antibody labelling ofcellular structures
One major advantage of SXT imaging is that, while three-
dimensional imaging and identification and characterization
of specific intracellular components can be performed without
stains or labels, traditional antibody staining can be used for
visualization of the three-dimensional distribution of specific
proteins, without sacrificing the other information. Immuno-
staining can complement SXT to remarkably increase the
information gathered with this technology. As proof of con-
cept, we targeted the CFTR protein, which is associated with
genetic lung disease. CFTR protein was labelled with a gold
nanoparticle-conjugated monoclonal antibody, and the density
signal was enhanced using LI silver. The gold/silver nanopar-
ticles are significantly denser than the surrounding cellular
components, providing a marked differentiation between the
nanoparticles and biological densities, making them easy to
segment and visualize. The advantage of this system is that
specific localizations of proteins of interest can be identified
and related to the location of cellular components such as the
nucleus, mitochondria, lysosomes and cell membrane. In this
study, we found that differentiated hAEC cells synthesi-
zed CFTR protein that was localized primarily on the cell
membrane, expressed in a polarized manner. However, in
undifferentiated hAECs, CFTR protein was not observed.
These data suggest that following differentiation of hAECs
from an immature stem-like phenotype to a mature lung epi-
thelial cell phenotype, cells produce the functional CFTR
protein, which is actively transported to the cell membrane,
and that the cells undergo polarization similar to what is
observed in cuboidal lung epithelium, confirming previous
studies showing increased CFTR gene and protein expression
[58] associated with this phenotype. Soft X-ray imaging and
three-dimensional reconstruction facilitated the observation
of protein polarization in our differentiated cells, whereas
other two-dimensional imaging methodologies would not
have been suitable for this analysis.
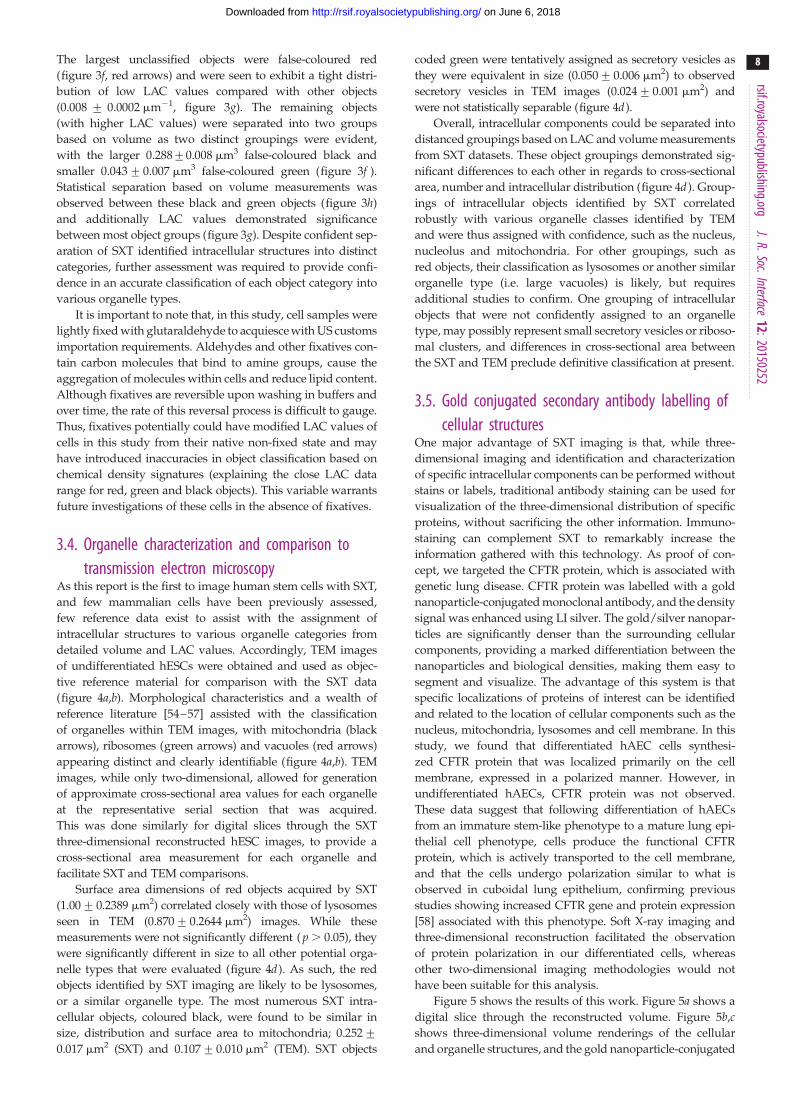
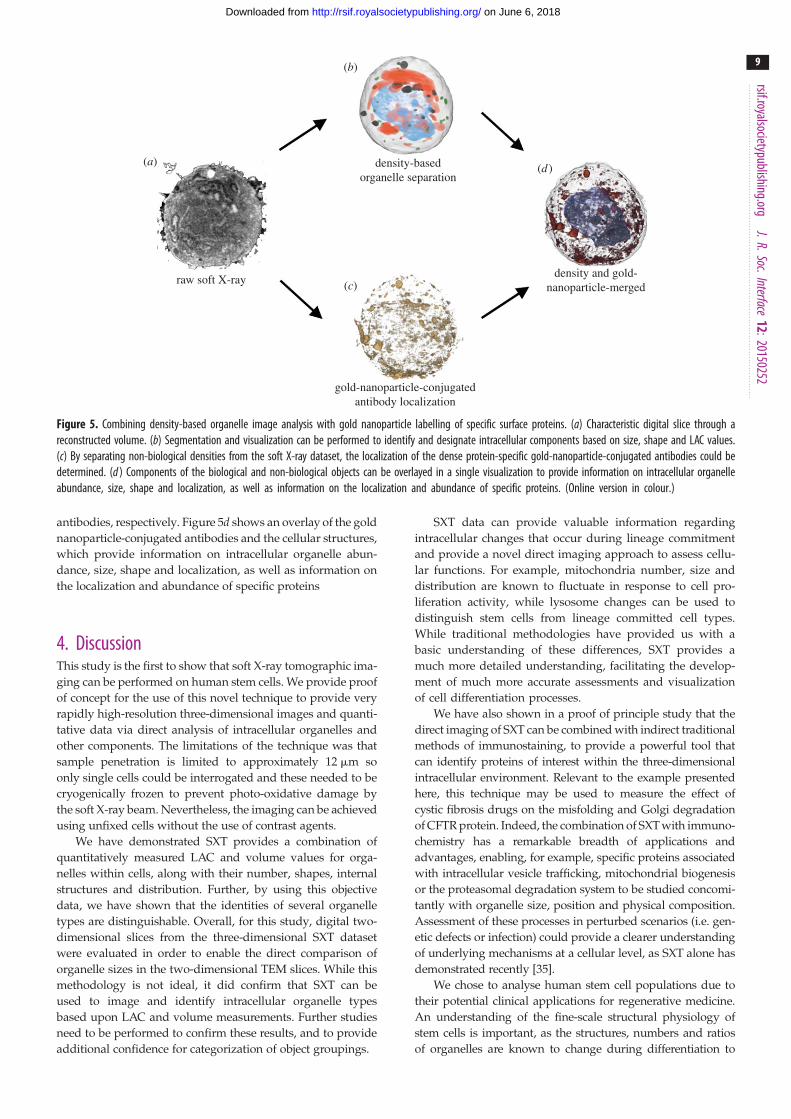
Figure 5 shows the results of this work. Figure 5a shows a
digital slice through the reconstructed volume. Figure 5b,cshows three-dimensional volume renderings of the cellular
and organelle structures, and the gold nanoparticle-conjugated
(a)
(b)
(c)raw soft X-ray
density-basedorganelle separation
density and gold-nanoparticle-merged
gold-nanoparticle-conjugatedantibody localization
(d )
Figure 5. Combining density-based organelle image analysis with gold nanoparticle labelling of specific surface proteins. (a) Characteristic digital slice through areconstructed volume. (b) Segmentation and visualization can be performed to identify and designate intracellular components based on size, shape and LAC values.(c) By separating non-biological densities from the soft X-ray dataset, the localization of the dense protein-specific gold-nanoparticle-conjugated antibodies could bedetermined. (d ) Components of the biological and non-biological objects can be overlayed in a single visualization to provide information on intracellular organelleabundance, size, shape and localization, as well as information on the localization and abundance of specific proteins. (Online version in colour.)
rsif.royalsocietypublishing.orgJ.R.Soc.Interface
12:20150252
9
on June 6, 2018http://rsif.royalsocietypublishing.org/Downloaded from
antibodies, respectively. Figure 5d shows an overlay of the gold
nanoparticle-conjugated antibodies and the cellular structures,
which provide information on intracellular organelle abun-
dance, size, shape and localization, as well as information on
the localization and abundance of specific proteins
4. DiscussionThis study is the first to show that soft X-ray tomographic ima-
ging can be performed on human stem cells. We provide proof
of concept for the use of this novel technique to provide very
rapidly high-resolution three-dimensional images and quanti-
tative data via direct analysis of intracellular organelles and
other components. The limitations of the technique was that
sample penetration is limited to approximately 12 mm so
only single cells could be interrogated and these needed to be
cryogenically frozen to prevent photo-oxidative damage by
the soft X-ray beam. Nevertheless, the imaging can be achieved
using unfixed cells without the use of contrast agents.
We have demonstrated SXT provides a combination of
quantitatively measured LAC and volume values for orga-
nelles within cells, along with their number, shapes, internal
structures and distribution. Further, by using this objective
data, we have shown that the identities of several organelle
types are distinguishable. Overall, for this study, digital two-
dimensional slices from the three-dimensional SXT dataset
were evaluated in order to enable the direct comparison of
organelle sizes in the two-dimensional TEM slices. While this
methodology is not ideal, it did confirm that SXT can be
used to image and identify intracellular organelle types
based upon LAC and volume measurements. Further studies
need to be performed to confirm these results, and to provide
additional confidence for categorization of object groupings.
SXT data can provide valuable information regarding
intracellular changes that occur during lineage commitment
and provide a novel direct imaging approach to assess cellu-
lar functions. For example, mitochondria number, size and
distribution are known to fluctuate in response to cell pro-
liferation activity, while lysosome changes can be used to
distinguish stem cells from lineage committed cell types.
While traditional methodologies have provided us with a
basic understanding of these differences, SXT provides a
much more detailed understanding, facilitating the develop-
ment of much more accurate assessments and visualization
of cell differentiation processes.
We have also shown in a proof of principle study that the
direct imaging of SXT can be combined with indirect traditional
methods of immunostaining, to provide a powerful tool that
can identify proteins of interest within the three-dimensional
intracellular environment. Relevant to the example presented
here, this technique may be used to measure the effect of
cystic fibrosis drugs on the misfolding and Golgi degradation
of CFTR protein. Indeed, the combination of SXT with immuno-
chemistry has a remarkable breadth of applications and
advantages, enabling, for example, specific proteins associated
with intracellular vesicle trafficking, mitochondrial biogenesis
or the proteasomal degradation system to be studied concomi-
tantly with organelle size, position and physical composition.
Assessment of these processes in perturbed scenarios (i.e. gen-
etic defects or infection) could provide a clearer understanding
of underlying mechanisms at a cellular level, as SXT alone has
demonstrated recently [35].
We chose to analyse human stem cell populations due to
their potential clinical applications for regenerative medicine.
An understanding of the fine-scale structural physiology of
stem cells is important, as the structures, numbers and ratios
of organelles are known to change during differentiation to
rsif.royalsocietypublishing.orgJ.R.Soc.Interface
12:20150252
10
on June 6, 2018http://rsif.royalsocietypublishing.org/Downloaded from
terminal identities. This study demonstrated that such aspects
can be studied in exquisite detail using SXT. In addition,
naive stem cells and their differentiated progeny could be com-
pared with pathological counterparts to assess key disease
processes at the cellular level. For example, Huntington’s dis-
ease involves disruption to rates of mitochondrial fusion and
fission [59] and the shape and quantities of mitochondria are
quantitatively rendered using SXT. Additionally, Huntington’s,
Alzheimer’s and Amyotrophic lateral sclerosis are some of the
many human disorders involving protein misfolding and for-
mation of intracellular aggregates, within the resolution range
of SXT. The formation and distribution of these aggregates
could be mapped over time to assist with understanding the
aetiology of these pathological cellular phenotypes.
Future studies would greatly advance the utility of this
immensely powerful technology by evaluating the breadth of
interspecies organelle LAC and volume variation across com-
monly studied eukaryotic and prokaryotic species. Indeed,
work towards this objective has been initiated recently [51].
With the collection and analysis of a larger body of LAC and
volume datasets for a range of cell types, one can envisage
future studies, whereby automated classification and image
reconstruction allowing identification of organelles in an
unambiguous manner, abrogating the present need for com-
parative studies with TEM images or a priori grounded
decisions based upon organelle size, shape and location.
While this study comprised a limited number and type of
cells analysed due to beamtime availability, this study has
established a base protocol for SXT imaging analysis of
human stem cells that will facilitate research of basic cell
biology and the changes in cellular architecture throughout
stem cell differentiation. These investigations on human stem
cells shed new light on a multitude of intracellular structures
contemporaneously, through the generation of highly informa-
tive images of cellular architecture hitherto unattainable by
conventional imaging techniques.
Competing interests. We declare we have no competing interests.
Funding. The NCXT is supported by the National Institute of GeneralMedical Sciences of the National Institutes of Health (P41GM103445)and the US Department of Energy, Office of Biological and Envi-ronmental Research (contract no. DE-AC02-05CH11231). Financialassistance to attend the beamtime at the ALS and perform the measure-ments was provided by the Australian Synchrotron’s InternationalSynchrotron Access Program, NHMRC Project grant no. 491145 andsupport from Monash University. The ALS is supported by the Director,Office of Science, Office of Basic Energy Sciences, of the US Departmentof Energy under contract no. DE-AC02-05CH11231.
Acknowledgements. This research was supported by peer-reviewed,merit-based beamtime provided by the Advanced Light Source(ALS), Lawrence Berkeley National Laboratory, Berkeley, CA. Thisresearch was partly undertaken on the XM-2 beamline at the NationalCenter for X-ray Tomography (NCXT) located at the ALS. We areparticularly grateful and thankful to Christian Knoechel for datacollection and technical assistance at the ALS.
References
1. Wang TY, Bruggeman KA, Sheean RK, Turner BJ,Nisbet DR, Parish CL. 2014 Characterisation of thestability and bio-functionality of tethered proteinson bioengineered scaffolds: implications for stemcell biology and tissue repair. J. Biol. Chem. 289,15 044 – 15 051. (doi:10.1074/jbc.M113.537381)
2. Murphy SV, Atala A. 2013 Organ engineering–combining stem cells, biomaterials, and bioreactors toproduce bioengineered organs for transplantation.Bioessays 35, 163 – 172. (doi:10.1002/bies.201200062)
3. Kauhausen J, Thompson LH, Parish CL. 2013 Cellintrinsic and extrinsic factors contribute to enhanceneural circuit reconstruction followingtransplantation in Parkinsonian mice. J. Physiol.591, 77 – 91. (doi:10.1113/jphysiol.2012.243063)
4. Brennand KJ et al. 2011 Modelling schizophreniausing human induced pluripotent stem cells. Nature473, 221 – 225. (doi:10.1038/nature09915)
5. Niclis JC, Trounson AO, Dottori M, Ellisdon AM,Bottomley SP, Verlinsky Y, Cram DS. 2009 Humanembryonic stem cell models of Huntington disease.Reprod. Biomed. Online 19, 106 – 113. (doi:10.1016/S1472-6483(10)60053-3)
6. Lee G et al. 2009 Modelling pathogenesis andtreatment of familial dysautonomia using patient-specific iPSCs. Nature 461, 402 – 406. (doi:10.1038/nature08320)
7. Park I-H et al. 2008 Disease-specific inducedpluripotent stem cells. Cell 134, 877 – 886. (doi:10.1016/j.cell.2008.07.041)
8. Takahashi K, Tanabe K, Ohnuki M, Narita M, IchisakaT, Tomoda K, Yamanaka S. 2007 Induction of
pluripotent stem cells from adult human fibroblastsby defined factors. Cell 131, 861 – 872. (doi:10.1016/j.cell.2007.11.019)
9. Murphy S, Rosli S, Acharya R, Mathias L, Lim R,Wallace E, Jenkin G. 2010 Amnion epithelial cellisolation and characterization for clinical use. Curr.Protoc. Stem Cell Biol. 13, 1E.6.1 – 1E.6.25. (doi:10.1002/9780470151808.sc01e06s13)
10. Murphy S, Lim R, Dickinson H, Acharya R, Rosli S,Jenkin G, Wallace E. 2011 Human amnion epithelialcells prevent bleomycin-induced lung injury andpreserve lung function. Cell Transplant. 20, 909 – 923.
11. McBeath R, Pirone DM, Nelson CM, Bhadriraju K, ChenCS. 2004 Cell shape, cytoskeletal tension, and RhoAregulate stem cell lineage commitment. Dev. Cell 6,483 – 495. (doi:10.1016/S1534-5807(04)00075-9)
12. Slomiany P, Baker T, Elliott ER, Grossel MJ. 2006Changes in motility, gene expression and actindynamics: Cdk6-induced cytoskeletal changesassociated with differentiation in mouse astrocytes.J. Cell. Biochem. 99, 635 – 646. (doi:10.1002/jcb.20966)
13. Lonergan T, Brenner C, Bavister B. 2006 Differentiation-related changes in mitochondrial properties asindicators of stem cell competence. J. Cell Physiol. 208,149 – 153. (doi:10.1002/jcp.20641)
14. de Jonge N, Sougrat R, Northan BM, Pennycook SJ.2010 Three-dimensional scanning transmissionelectron microscopy of biological specimens.Microsc. Microanal. 16, 54 – 63. (doi:10.1017/S1431927609991280)
15. Hoog JL, Schwartz C, Noon AT, O’Toole ET,Mastronarde DN, McIntosh JR, Antony C. 2007
Organization of interphase microtubules in fissionyeast analyzed by electron tomography. Dev. Cell12, 349 – 361. (doi:10.1016/j.devcel.2007.01.020)
16. Chen X, Winters CA, Reese TS. 2008 Life inside a thinsection: tomography. J. Neurosci. 28, 9321 – 9327.(doi:10.1523/JNEUROSCI.2992-08.2008)
17. Hildebrand M, Kim S, Shi D, Scott K, SubramaniamS. 2009 3D imaging of diatoms with ion-abrasionscanning electron microscopy. J. Struct. Biol. 166,316 – 328. (doi:10.1016/j.jsb.2009.02.014)
18. Lareida A, Beckmann F, Schrott-Fischer A, GlueckertR, Freysinger W, Muller B. 2009 High-resolutionX-ray tomography of the human inner ear:synchrotron radiation-based study of nerve fibrebundles, membranes and ganglion cells. J. Microsc.234, 95 – 102. (doi:10.1111/j.1365-2818.2009.03143.x)
19. Langer M, Pacureanu A, Suhonen H, Grimal Q,Cloetens P, Peyrin F. 2012 X-ray phasenanotomography resolves the 3D human boneultrastructure. PLoS ONE 7, e35691. (doi:10.1371/journal.pone.0035691)
20. Schulz G, Waschkies C, Pfeiffer F, Zanette I,Weitkamp T, David C, Muller B. 2012 Multimodalimaging of human cerebellum: merging X-ray phasemicrotomography, magnetic resonance microscopyand histology. Sci. Rep. 2, 826. (doi:10.1038/srep00826)
21. Chao W, Fischer P, Tyliszczak T, Rekawa S, AndersonE, Naulleau P. 2012 Real space soft X-ray imaging at10 nm spatial resolution. Opt. Express 20,9777 – 9783. (doi:10.1364/OE.20.009777)
rsif.royalsocietypublishing.orgJ.R.Soc.Interface
12:20150252
11
on June 6, 2018http://rsif.royalsocietypublishing.org/Downloaded from
22. McDermott G, Le Gros MA, Knoechel CG, Uchida M,Larabell CA. 2009 Soft X-ray tomography andcryogenic light microscopy: the cool combination incellular imaging. Trends Cell Biol. 19, 587 – 595.(doi:10.1016/j.tcb.2009.08.005)
23. Le Gros MA, McDermott G, Larabell CA. 2005 X-raytomography of whole cells. Curr. Opin. Struct. Biol.15, 593 – 600. (doi:10.1016/j.sbi.2005.08.008)
24. Weiss D, Schneider G, Niemann B, Guttmann P,Rudolph D, Schmahl G. 2000 Computed tomographyof cryogenic biological specimens based on X-raymicroscopic images. Ultramicroscopy 84, 185 – 197.(doi:10.1016/S0304-3991(00)00034-6)
25. Schneider G, Niemann B, Guttmann P, Rudolph D,Schmahl G. 1995 Cryo X-ray microscopy. SynchrotronRadiat. News 8, 19 – 28. (doi:10.1080/08940889508602810)
26. Schmahl GN, Rudolph D, Guttmann P, Schneider G,Thieme JR, Niemann B. 1995 Phase contrast studiesof biological specimens with the X-ray microscopeat BESSY (invited). Rev. Sci. Instrum. 66, 1282.(doi:10.1063/1.1145955)
27. Mitrea G, Thieme J, Guttmann P, Heim S, Gleber S.2007 X-ray spectromicroscopy with the scanningtransmission X-ray microscope at BESSY II.J. Synchrotron Rad. 15, 26 – 35. (doi:10.1107/S0909049507047966)
28. Carrascosa JL, Chichon FJ, Pereiro E, Rodrıguez MJ,Fernandez JJ, Esteban M, Heim S, Guttmann P,Schneider G. 2009 Cryo-X-ray tomography of vacciniavirus membranes and inner compartments. J. Struct.Biol. 168, 234 – 239. (doi:10.1016/j.jsb.2009.07.009)
29. Uchida M, McDermott G, Wetzler M, Le Gros MA,Myllys M, Knoechel C, Barron AE, Larabell CA. 2009Soft X-ray tomography of phenotypic switching andthe cellular response to antifungal peptoids inCandida albicans. Proc. Natl Acad. Sci. USA 106,19 375 – 19 380. (doi:10.1073/pnas.0906145106)
30. Larabell CA, Le Gros MA. 2004 X-ray tomographygenerates 3-D reconstructions of the yeast,saccharomyces cerevisiae, at 60-nm resolution.Mol. Biol. Cell 15, 957 – 962. (doi:10.1091/mbc.E03-07-0522)
31. Gu W, Etkin LD, Le Gros MA, Larabell CA. 2007 X-raytomography of Schizosaccharomyces pombe.Differentiation 75, 529 – 535. (doi:10.1111/j.1432-0436.2007.00180.x)
32. Parkinson DY, McDermott G, Etkin LD, Le Gros MA,Larabell CA. 2008 Quantitative 3-D imaging ofeukaryotic cells using soft X-ray tomography.J. Struct. Biol. 162, 380 – 386. (doi:10.1016/j.jsb.2008.02.003)
33. Uchida M, Sun Y, McDermott G, Knoechel C, Le GrosMA, Parkinson D, Drubin DG, Larabell CA. 2010Quantitative analysis of yeast internal architectureusing soft X-ray tomography. Yeast 28, 227 – 236.(doi:10.1002/yea.1834)
34. Hanssen E, Knoechel C, Dearnley M, Dixon MWA, LeGros M, Larabell C, Tilley L. 2011 Soft X-raymicroscopy analysis of cell volume and hemoglobin
content in erythrocytes infected with asexual andsexual stages of Plasmodium falciparum. J. Struct.Biol. 177, 1 – 9. (doi:10.1016/j.jsb.2011.09.003)
35. Hanssen E, Knoechel C, Klonis N, Abu-Bakar N, DeedS, LeGros M, Larabell C, Tilley L. 2011 Cryotransmission X-ray imaging of the malaria parasiteP. falciparum. J. Struct. Biol. 173, 161 – 168. (doi:10.1016/j.jsb.2010.08.013)
36. Clowney EJ, LeGros MA, Mosley CP, Clowney FG,Markenskoff-Papadimitriou EC, Myllys M, Barnea G,Larabell CA, Lomvardas S. 2012 Nuclear aggregationof olfactory receptor genes governs their monogenicexpression. Cell 151, 724 – 737. (doi:10.1016/j.cell.2012.09.043)
37. Isaacson SA, Larabell CA, Le Gros MA, McQueen DM,Peskin CS. 2013 The influence of spatial variation inchromatin density determined by X-ray tomograms onthe time to find DNA binding sites. Bull. Math. Biol. 75,2093 – 2117. (doi:10.1007/s11538-013-9883-9)
38. Smith EA, Cinquin BP, McDermott G, Le Gros MA,Parkinson DY, Kim HT, Larabell CA. 2013 Correlativemicroscopy methods that maximize specimenfidelity and data completeness, and improvemolecular localization capabilities. J. Struct. Biol.184, 12 – 20. (doi:10.1016/j.jsb.2013.03.006)
39. Duke EM, Razi M, Weston A, Guttmann P, Werner S,Henzler K, Schneider G, Tooze SA, Collinson LM.2014 Imaging endosomes and autophagosomes inwhole mammalian cells using correlative cryo-fluorescence and cryo-soft X-ray microscopy (cryo-CLXM). Ultramicroscopy 143, 77 – 87. (doi:10.1016/j.ultramic.2013.10.006)
40. Meyer-Ilse W et al. 2001 High resolution proteinlocalization using soft X-ray microscopy. J. Microsc. 201,395– 403. (doi:10.1046/j.1365-2818.2001.00845.x)
41. Song B, Niclis JC, Alikhan MA, Sakkal S, Sylvain A,Kerr PG, Laslett AL, Bernard CA, Ricardo SD. 2011Generation of induced pluripotent stem cells fromhuman kidney mesangial cells. J. Am. Soc. Nephrol.22, 1213 – 1220. (doi:10.1681/asn.2010101022)
42. Thompson AC et al. 2009 X-ray data handbook.Berkeley, CA: Center for X-ray Optics, AdvancedLight Source.
43. Cardone G, Grunewald K, Steven AC. 2005 Aresolution criterion for electron tomography basedon cross-validation. J. Struct. Biol. 151, 117 – 129.(doi:10.1016/j.jsb.2005.04.006)
44. Kremer JR, Mastronarde DN, McIntosh JR. 1996Computer visualization of three-dimensional imagedata using IMOD. J. Struct. Biol. 116, 71 – 76.(doi:10.1006/jsbi.1996.0013)
45. Erdogan H, Fessler JA. 1999 Ordered subsets algorithmsfor transmission tomography. Phys. Med. Biol. 44,2835 – 2851. (doi:10.1088/0031-9155/44/11/311)
46. Stayman JW, Fessler JA. 2000 Regularization foruniform spatial resolution properties in penalized-likelihood image reconstruction. IEEE Trans. Med.Imaging 19, 601 – 615. (doi:10.1109/42.870666)
47. Parkinson DY, Epperly LR, McDermott G, Le GrosMA, Boudreau RM, Larabell CA. 2013 Nanoimaging
cells using soft X-ray tomography. Methods Mol.Biol. 950, 457 – 481. (doi:10.1007/978-1-62703-137-0_25)
48. Muller B, Riedel M, Thurner PJ. 2006 Three-dimensional characterization of cell clusters usingsynchrotron-radiation-based micro-computedtomography. Microsc. Microanal. 12, 97 – 105.(doi:10.1017/S1431927606060168)
49. Saldamli B et al. 2008 Internal structures ofscaffold-free 3D cell cultures visualizedbysynchrotron radiation-based micro computedtomography. Proc. SPIE 70781, 1 – 11. (doi:10.1117/12.795162)
50. Zehbe R, Haibel A, Riesemeier H, Gross U,Kirkpatrick J, Schubert H, Brochhausen C. 2010Going beyond histology. Synchrotron micro-computed tomography as a methodology forbiological tissue characterization: from tissuemorphology to individual cells. J. R. Soc. Interface 7,49 – 59. (doi:10.1098/rsif.2008.0539)
51. Muller WG, Heymann JB, Nagashima K, GuttmannP, Werner S, Rehbein S, Schneider G, McNally JG.2012 Towards an atlas of mammalian cellultrastructure by cryo soft X-ray tomography.J. Struct. Biol. 177, 179 – 192. (doi:10.1016/j.jsb.2011.11.025)
52. Hagen C, Guttmann P, Klupp B, Werner S, RehbeinS, Mettenleiter TC, Schneider G, Grunewald K. 2012Correlative VIS-fluorescence and soft X-ray cryo-microscopy/tomography of adherent cells. J. Struct.Biol. 177, 193 – 201. (doi:10.1016/j.jsb.2011.12.012)
53. Armstrong L, Tilgner K, Saretzki G, Atkinson SP,Stojkovic M, Moreno R, Przyborski S, Lako M. 2010Human induced pluripotent stem cell lines show stressdefense mechanisms and mitochondrial regulationsimilar to those of human embryonic stem cells. StemCells 28, 661 – 673. (doi:10.1002/stem.307)
54. Sathananthan H, Pera M, Trounson A. 2002 The finestructure of human embryonic stem cells. Reprod.Biomed. Online 4, 56 – 61. (doi:10.1016/S1472-6483(10)61916-5)
55. Thomson JA, Marshall VS. 1998 Primate embryonicstem cells. Curr. Top. Dev. Biol. 38, 133 – 165.(doi:10.1016/S0070-2153(08)60246-X)
56. Desbaillets I, Ziegler U, Groscurth P, Gassmann M.2000 Embryoid bodies: an in vitro model of mouseembryogenesis. Exp. Physiol. 85, 645 – 651. (doi:10.1111/j.1469-445X.2000.02104.x)
57. Mohr LR, Trounson AO. 1982 Comparativeultrastructure of hatched human, mouse and bovineblastocysts. J. Reprod. Fertil. 66, 499 – 504. (doi:10.1530/jrf.0.0660499)
58. Murphy SV et al. 2012 Human amnion epithelialcells induced to express functional cystic fibrosistransmembrane conductance regulator. PLoS ONE 7,e46533. (doi:10.1371/journal.pone.0046533)
59. Song W et al. 2011 Mutant huntingtin binds themitochondrial fission GTPase dynamin-relatedprotein-1 and increases its enzymatic activity. Nat.Med. 17, 377 – 382. (doi:10.1038/nm.2313)