three-dimensional imaging in polymer science: its
TRANSCRIPT
AWARD ACCOUNTS: SPSJ WILEY AWARD (2006)
Three-Dimensional Imaging in Polymer Science:Its Application to Block Copolymer
Morphologies and Rubber Composites
Hidehiko DOHI,1 Hideaki KIMURA,1 Marina KOTANI,1 Takeshi KANEKO,2
Tatsuro KITAOKA,2 Toshio NISHI,3 and Hiroshi JINNAI2;y
1SRI Research & Development Ltd., Chuo-ku, Kobe 651-0071, Japan2Department of Macromolecular Science and Engineering, Graduate School of Science and Technology,
Kyoto Institute of Technology, Matsugasaki, Kyoto 606-8585, Japan3Department of Organic and Polymeric Materials, School of Science and Engineering,
Tokyo Institute of Technology, Meguro-ku, Tokyo 152-8552, Japan
(Received March 9, 2007; Accepted April 17, 2007; Published June 12, 2007)
ABSTRACT: New methods to visualize polymer morphologies in three-dimension (3D) in polymer science are re-
viewed. Here we concentrate on one of such 3D imaging technique, transmission electron microtomography (TEMT),
and introduce some experimental studies using this novel technique. They are block copolymer morphologies during
order-order transition between the two different morphologies and block copolymer thin film morphology also during
morphological change due to confinement. Direct visualization of 3D structure of silica particle/rubber composite and
related morphological analyses are shown. Subsequently, as a very hot topic of the 3D imaging, we show for the first
time to characterize the morphological change in a silica particle/rubber composite upon stretching. It was found that
the aggregates of silica particles were broken down upon stretching and many voids were generated near and between
the silica particles. Local stress upon stretching inside the composite was inferred from the image intensity of the 3D
reconstructed image. The local stress was found not only near the silica particles but also near the top of the voids. The
observations indicated that the local stress increases the modulus, causing voids to form along the stretching direction.
The thickness of the specimen after the stretching was also estimated from the 3D volume data, which turned out to be
non-uniform and thinner than what is expected from the affine deformation. These experimental findings indicate that
the rubber composite does not obey the assumption of the affine deformation at the nano-scale.
[doi:10.1295/polymj.PJ2006259]KEY WORDS Transmission Electron Microtomography / Three-dimensional Imaging / Order-
order Transition / Stretching / Silica / Rubber Composite / Local Strain in Rubber Matrix /
Polymer materials are ubiquitous in our daily life.Such materials often consist of more than one speciesof polymers and thus become multi-component sys-tems, such as in polymer blends,1,2 block copolymers,3
and fillers/polymer composites.4 The multi-compo-nent systems often show phase-separated structuresdue to immiscibility of constituents. Studies to charac-terize such morphologies inside the materials havebeen growing intensively over the past few decades.Academic interest in complex fluids (to which poly-meric systems belong) as well as the ceaseless indus-trial need for developing new materials motivatessuch studies.In academia, pattern formation and self-assembling
processes of multi-component polymer systems areone of the most fascinating research themes in non-linear, non-equilibrium phenomena.1 Likewise, nano-meter-scale periodic structures formed in block co-polymers in their equilibrium state are interesting
because their self-assembly is driven by the subtle bal-ance between the entropic block chain conformationand enthalpic interaction between the constituents.3
In industry, phase-separated polymer systems providean important route to achieve superior physical prop-erties. Hence, the structure-property relationship inmulti-component polymeric materials is of significantimportance, basic studies on which eventually rendernew designs of polymer materials satisfying the di-verse requirements of industry.Filler/polymer composites are another key class of
polymer materials. Incorporation of a few percent ofclay minerals into a polymer matrix in many casessynergistically increases the modulus, gas barrierproperties, heat distortion temperature, etc. It is alsowell known that the improvement of such propertiesstrongly depends on structures of fillers inside thepolymer matrix.5 As typical fillers, carbon black(CB), silica particles, clay mineral are often used. As
yTo whom correspondence should be addressed (Tel: +81-75-724-7846, Fax: +81-75-724-7770, E-mail: [email protected]).
749
Polymer Journal, Vol. 39, No. 8, pp. 749–758 (2007)
#2007 The Society of Polymer Science, Japan

many different types of polymers can be used as thematrix, rubber is one of the most common polymersin industrial use. For example, the CB/rubber compo-sites are often used as composite-type materials thatare made of polymers, fillers, cross-linking agents,and other additives. While filler particles are knownto alter the mechanical properties of rubber materials,the mechanism by which the alterations occur is still asubject of debate.6 Today, extensive efforts are beingmade to unravel the mechanism of rubber reinforce-ment by fillers and the fracture process of rubber vul-canizates. A complete fundamental understanding ofthis complex mechanism remains a significant scien-tific challenge.7–14
THREE-DIMENSIONAL (3D) IMAGING
In order to establish the structure-mechanical prop-erties relationship, one needs proper methods to char-acterize the morphologies. Up to now, morphologicalstudies of the polymeric materials have been carriedout by various microscopic and scattering methods.Optical microscopes, transmission electron micro-scopes (TEM), scanning electron microscopes(SEM) and atomic force microscopes (AFM) are com-mercially available and widely used. The biggest ad-vantage to use such microscopes is that they offer in-tuitive real-space representation of the morphologies.However, when it comes to ‘‘measurements’’, espe-cially in a quantitative way, the microscopes may giveonly limited pieces of structural information with infe-rior statistical accuracy to scattering methods. Scatter-ing techniques give statistically-averaged structuralinformation over the scattering volume which can beseveral orders of magnitude larger than the volumeprobed by the microscopes. Moreover, the scatteringmethods do not directly provide intuitive insight intothe morphologies. The scattering methods often re-quire knowledge of the morphologies beforehand toobtain the structural parameters: The two methodsare complementary.In some cases, however, identification of complex
structures by the above microscopes is inconclusiveand therofore the interpretation of scattering data be-comes quite difficult. One of the reasons is that themicroscopes used so far take two-dimensional (2D)(transmitted or surface) images of three-dimensional(3D) objects. The more complicated the morphologiesare, the less convincing the 2D images usually be-come. It is thus requisite to develop microscopes thatare capable of visualizing 3D morphologies in 3D. Acouple of different types of 3D microscopes have beendeveloped.15 They are laser scanning confocal micros-copy (LSCM),16–27 X-ray tomography,28–30 and trans-mission electron microtomography (TEMT).15,31–54
The spatial resolution of LSCM and X-ray tomogra-phy is on the order of a micrometer, while that ofTEMT approaches 1 nm or less.44,52 We also empha-size that 3D microscopy should be accompanied bydigital image analyses that extract useful and newstructural information from the 3D volume data.55–58
Among those 3D imaging techniques, with rapidadvances in ‘‘nanotechnology’’, there is a growingneed for quantitative structural analysis at the nano-meter scale. In TEMT, a series of projections at differ-ent tilt angles are obtained, which are subsequentlyused to calculate tomograms on the basis of computer-ized tomography (CT). In the coarse of the ‘‘recon-struction’’, precise alignment of projections to a tiltaxis is required in order to obtain high-resolution 3Ddata. This alignment should be the foundation forthe subsequent data analysis to extract various kindsof structural information. Another critical issue asso-ciated with TEMT is what is called the ‘‘missingwedge’’ problem: Image quality of tomograms is con-siderably deteriorated due to the limitation of thetilting angle up to �60�70� in the transmissionelectron microscope. Kawase et al. recently demon-strated a protocol to perform complete rotation, i.e.,�90�, of their ZrO2/polymer nanocomposite, bywhich they achieved truly quantitative TEMT for thefirst time.52,59 The detailed theoretical backgroundsas well as experimental results are described in a sep-arate review article.15
SOME APPLICATIONS USING TEMT
3D Morphological Studies of Block CopolymersTEMT has been used to characterize 3D structures
in a wide range of materials.15,39 As described above,block copolymers self-assemble into various periodicnano-scale structures (‘‘microphase-separated struc-tures’’) and hence their 3D morphologies are subjectsfor many scientific studies. In 1988, Spontak and cow-orkers32 used TEMT to observe cylindrical morpholo-gies of block copolymer for the first time. Later, acomplex morphology, Gyroid, has been extensivelystudied using TEMT.35,37 Complicated 3D ‘‘maze’’was beautifully imaged (see, for example, Figure 1in ref 37), from which some structural features, e.g.volumetric fraction of one of the constituents, inter-facial curvatures,55,56 topology,60 connectivity of do-mains57,58 etc. were measured.The grain boundary of microphase-separated struc-
ture is another important aspects of block copolymermorphologies. The grain boundary morphology of la-mellar structure where two lamellae intersect orthog-onally was examined by TEMT (see Figure 5 in refer-ence 44). It was found that the lamellae microdomainswere continuous through the boundary region and the
H. DOHI et al.
750 Polym. J., Vol. 39, No. 8, 2007

boundary morphology had characteristics of the sad-dle-like hyperbolic surface, called the Scherk’s firstsurface. This experimental result demonstrates thatthe minimization of the surface area, i.e., the minimi-zation of the surface energy, is the dominant cause ofthe structural formation.44 Another intriguing boun-dary structure was found between the Gyroid andhexagonally-perforated lamellar (HPL) morphologiesduring the order-order transition.61 Figure 1(a) showsa 3D image of the boundary between these two mor-phologies where every other HPL layers were beauti-fully connect to one of the two non-intersectingGyroid networks. Moreover, as clearly shown inFigure 1(b), nature of epitaxy can be found: f1�111g,f20�22g and f121g planes were at the boundary withthe f121g plane being parallel to the HPL layers.TEMT is also useful to investigate microphase-sep-
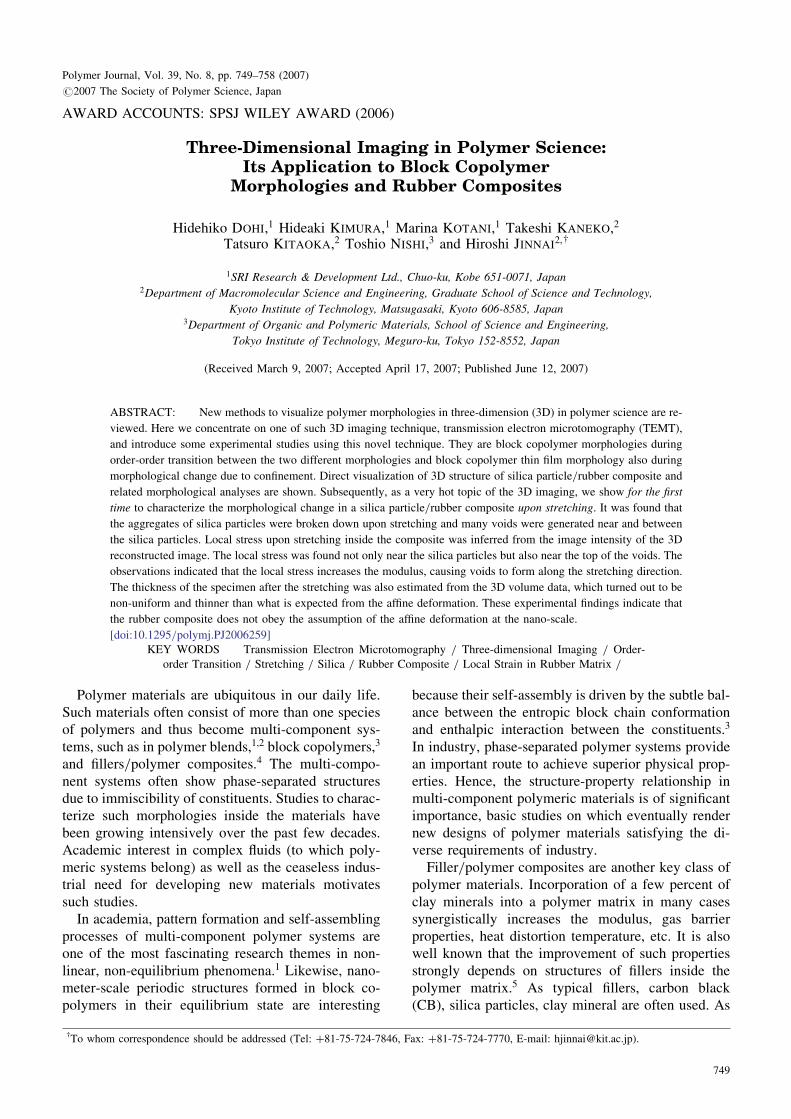
arated structures of block copolymer thin films.Figure 2 demonstrates order-order transition inducedby the confinement (finite thickness of the film) wherethe cylindrical morphology transformed into sphericalmorphology upon annealing.62 Note that the equilibri-um structure of this block copolymer in the bulk stateis cylindrical morphology. The stability of either cyl-inders or spheres in the block copolymer thin film wassimulated on the basis of the Self Consistent FieldTheory, which is in excellent agreement with the ex-perimental results.62
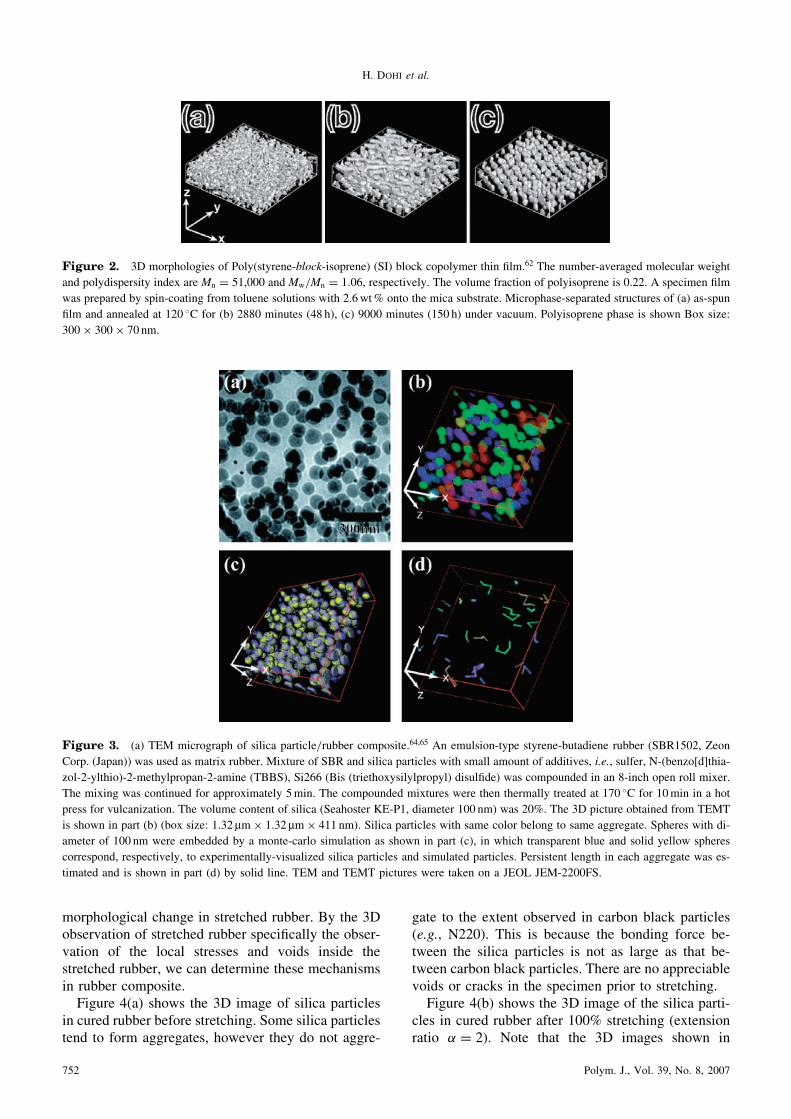
3D Morphological Studies of Composite MaterialsFigure 3 shows a 3D structure of a rubber compo-
site consisting of silica particles in rubbery matrix.Figure 3(a) and 3(b) display a TEM micrograph andcorresponding TEMT image, respectively. The TEMTimage contains richer structural information than the2D TEM image. Using a Monte-Carlo simulation, spa-tial position of each silica particle was resolved63,64
and displayed in Figure 3(c). Note that this protocolis necessary to evaluate 3D spatial distribution, e.g.,the spatial correlation function of fillers, especiallywhen individual fillers are too small to be clearly vi-sualized but only regions of the fillers are obtained.The simulated silica particles can be further used tomeasure the persistent length of fillers as demonstrat-ed in Figure 3(d).65 Needless to say, the persistentlength of fillers should be an important measure to un-derstand electrical property of semi-conductive mate-rials, e.g., CB/rubber composites. Besides these struc-tural parameters, distribution and orientation of fillerparticles45 have been discussed. We note here thatmost of this structural information can never be ob-tained from other existing experimental techniques.15
Although TEMT is receiving significant attention inpolymer science, the 3D imaging of strain under anexternal field, e.g., strain, has never been carried out.
3D Morphologies of Filler/Rubber Composite UponStretchingIn order to establish the structure-property (me-
chanical property) relationship, complete understand-ing of the phenomena occurring under strain66 is cru-cial. Such studies will provide new insight on thenano-scale structures in rubber that cannot be obtainedby observing rubber in the static condition. We reporthere, as a first attempt, the analytical results of the 3D
Figure 1. (a) 3D morphology of Poly(styrene-block-isoprene)
(SI) block copolymer during order-order transition (OOT) from
hexagonally-perforated lamellar (HPL) structure (right) to Gyroid
structure (left).62 The Gyroid structure has Ia�33d symmetry. The
number-averaged molecular weight and polydispersity index are
Mn ¼ 37;000 and Mw=Mn ¼ 1:01. The volume fraction of poly-
isoprene is 0.62. Blue and red microdomains consist of polysty-
rene and continuous through the boundary. Non-intersecting PS
microdomains independently and periodically connect to the
HPL layers. Scale bar is 100 nm. (b) Orthogonal views of the
3D reconstruction of SI block copolymer during OOT. Z-axis is
parallel to the optical axis of the microscope and also the depth
direction of the sample. As shown in each cross-section, the PS
microdomain (white domain) of the Gyroid exhibits characteristic
crystallographic planes, demonstrating that the OOT is epitaxial.
The insets in the cross-sections show characteristic patterns of
Gyroid viewed from certain crystallographic planes indicated by
the miller numbers.
3D Imaging in Polymer Science
Polym. J., Vol. 39, No. 8, 2007 751
morphological change in stretched rubber. By the 3Dobservation of stretched rubber specifically the obser-vation of the local stresses and voids inside thestretched rubber, we can determine these mechanismsin rubber composite.Figure 4(a) shows the 3D image of silica particles
in cured rubber before stretching. Some silica particlestend to form aggregates, however they do not aggre-
gate to the extent observed in carbon black particles(e.g., N220). This is because the bonding force be-tween the silica particles is not as large as that be-tween carbon black particles. There are no appreciablevoids or cracks in the specimen prior to stretching.Figure 4(b) shows the 3D image of the silica parti-
cles in cured rubber after 100% stretching (extensionratio � ¼ 2). Note that the 3D images shown in
Figure 2. 3D morphologies of Poly(styrene-block-isoprene) (SI) block copolymer thin film.62 The number-averaged molecular weight
and polydispersity index are Mn ¼ 51;000 and Mw=Mn ¼ 1:06, respectively. The volume fraction of polyisoprene is 0.22. A specimen film
was prepared by spin-coating from toluene solutions with 2.6wt% onto the mica substrate. Microphase-separated structures of (a) as-spun
film and annealed at 120 �C for (b) 2880 minutes (48 h), (c) 9000 minutes (150 h) under vacuum. Polyisoprene phase is shown Box size:
300� 300� 70 nm.
Figure 3. (a) TEM micrograph of silica particle/rubber composite.64,65 An emulsion-type styrene-butadiene rubber (SBR1502, Zeon
Corp. (Japan)) was used as matrix rubber. Mixture of SBR and silica particles with small amount of additives, i.e., sulfer, N-(benzo[d]thia-
zol-2-ylthio)-2-methylpropan-2-amine (TBBS), Si266 (Bis (triethoxysilylpropyl) disulfide) was compounded in an 8-inch open roll mixer.
The mixing was continued for approximately 5min. The compounded mixtures were then thermally treated at 170 �C for 10min in a hot
press for vulcanization. The volume content of silica (Seahoster KE-P1, diameter 100 nm) was 20%. The 3D picture obtained from TEMT
is shown in part (b) (box size: 1:32 mm� 1:32 mm� 411 nm). Silica particles with same color belong to same aggregate. Spheres with di-
ameter of 100 nm were embedded by a monte-carlo simulation as shown in part (c), in which transparent blue and solid yellow spheres
correspond, respectively, to experimentally-visualized silica particles and simulated particles. Persistent length in each aggregate was es-
timated and is shown in part (d) by solid line. TEM and TEMT pictures were taken on a JEOL JEM-2200FS.
H. DOHI et al.
752 Polym. J., Vol. 39, No. 8, 2007
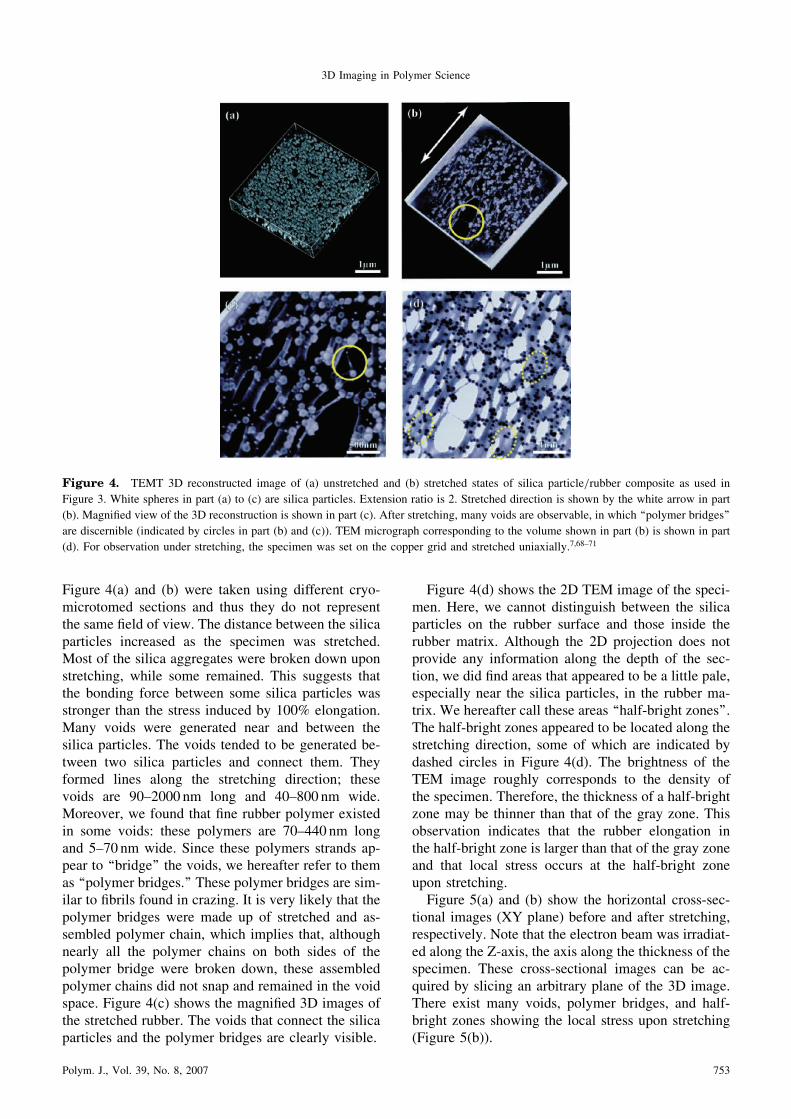
Figure 4(a) and (b) were taken using different cryo-microtomed sections and thus they do not representthe same field of view. The distance between the silicaparticles increased as the specimen was stretched.Most of the silica aggregates were broken down uponstretching, while some remained. This suggests thatthe bonding force between some silica particles wasstronger than the stress induced by 100% elongation.Many voids were generated near and between thesilica particles. The voids tended to be generated be-tween two silica particles and connect them. Theyformed lines along the stretching direction; thesevoids are 90–2000 nm long and 40–800 nm wide.Moreover, we found that fine rubber polymer existedin some voids: these polymers are 70–440 nm longand 5–70 nm wide. Since these polymers strands ap-pear to ‘‘bridge’’ the voids, we hereafter refer to themas ‘‘polymer bridges.’’ These polymer bridges are sim-ilar to fibrils found in crazing. It is very likely that thepolymer bridges were made up of stretched and as-sembled polymer chain, which implies that, althoughnearly all the polymer chains on both sides of thepolymer bridge were broken down, these assembledpolymer chains did not snap and remained in the voidspace. Figure 4(c) shows the magnified 3D images ofthe stretched rubber. The voids that connect the silicaparticles and the polymer bridges are clearly visible.
Figure 4(d) shows the 2D TEM image of the speci-men. Here, we cannot distinguish between the silicaparticles on the rubber surface and those inside therubber matrix. Although the 2D projection does notprovide any information along the depth of the sec-tion, we did find areas that appeared to be a little pale,especially near the silica particles, in the rubber ma-trix. We hereafter call these areas ‘‘half-bright zones’’.The half-bright zones appeared to be located along thestretching direction, some of which are indicated bydashed circles in Figure 4(d). The brightness of theTEM image roughly corresponds to the density ofthe specimen. Therefore, the thickness of a half-brightzone may be thinner than that of the gray zone. Thisobservation indicates that the rubber elongation inthe half-bright zone is larger than that of the gray zoneand that local stress occurs at the half-bright zoneupon stretching.Figure 5(a) and (b) show the horizontal cross-sec-
tional images (XY plane) before and after stretching,respectively. Note that the electron beam was irradiat-ed along the Z-axis, the axis along the thickness of thespecimen. These cross-sectional images can be ac-quired by slicing an arbitrary plane of the 3D image.There exist many voids, polymer bridges, and half-bright zones showing the local stress upon stretching(Figure 5(b)).
Figure 4. TEMT 3D reconstructed image of (a) unstretched and (b) stretched states of silica particle/rubber composite as used in
Figure 3. White spheres in part (a) to (c) are silica particles. Extension ratio is 2. Stretched direction is shown by the white arrow in part
(b). Magnified view of the 3D reconstruction is shown in part (c). After stretching, many voids are observable, in which ‘‘polymer bridges’’
are discernible (indicated by circles in part (b) and (c)). TEM micrograph corresponding to the volume shown in part (b) is shown in part
(d). For observation under stretching, the specimen was set on the copper grid and stretched uniaxially.7,68–71
3D Imaging in Polymer Science
Polym. J., Vol. 39, No. 8, 2007 753

Comparing Figure 4(d) (2D image) and Figure 5(b)(3D XY plane), we can see that the contrast of the XYplane is greater than that of the 2D image. We findthat there are more half-bright zones in the XY digitalslice. They tend to align along the stretching direction,indicating that the local stress also occurs near the topof the voids.67 The local stress near the top of voidsmust be the point from which void propagation origi-nates. Figure 5(c) and (d) show the magnified imagesof the local stress. TEM images include all the infor-mation along the depth showing average image bright-ness of the specimen. On the contrary, the TEMTdigital slice can provide an arbitrary cross-sectionalimage that provides information regarding the limitedthin section (in this study, the thickness is 5.2 nm).Thus, we can acquire a high-contrast image usingthe cross-sectional TEMT image.The thickness of each specimen was measured from
the 3D reconstruction in the following way. We ran-domly selected 10 points in the XY plane. For eachpoint, uppermost and bottommost edges of the speci-men were found by scanning XY digital slices alongthe Z direction. The sample thickness was determinedby averaging these 10 thicknesses. The thicknessesbefore and after stretching were approximately 400–460 (424) nm and 70–240 (182) nm, respectively(numbers in the parentheses are average values). Itwas found that the thickness of the specimen decreas-es and the variation of thickness increases uponstretching. If the specimen obeyed affine deformation,the thickness should be in the range from 400�
ffiffiffi
2p
¼
280 nm to 460�ffiffiffi
2p
¼ 330 nm. Thus, it is evidentthat the thickness deformation of rubber compositedoes not conform to affine deformation. This resultmight be caused by the local stress and void genera-tion in the specimen.Figure 6(a), (b), and (c) show the schematic repre-
sentation of the vertical cross section before andafter stretching. Location of these cross sections areindicated in Figure 5(a) and (b) by solid lines. Thesefigures clearly demonstrated that the thickness of thespecimen decreased with stretching, while the varia-tion of thickness increased with stretching. The finerubber polymer (polymer bridge) was also observed.The thickness of the polymer bridge was approximate-ly 70 nm, which is approximately one-sixth of thethickness before stretching. This result indicates thatthe polymer chains are highly strained at the polymerbridges.Let us now consider the fracture process of the rub-
ber materials containing inorganic particles uponstretching. The local stress, which increased modulusand hardness, first occurred at the interface of the par-ticles and rubber polymer. Upon further stretching, thedetachment between the particle surface and polymertook place. Nanovoids were generated at the interfacebetween the particles and rubber. The local stress nearthe top of the voids caused the voids to grow. Thevoids grew and became larger with stretching, andfinally connected between two particles. This is thefracture process of stretched rubber containing inor-ganic particles. The results obtained from this study
Figure 5. Digitally-sliced cross-sectional image of TEMT 3D reconstructed images of silica/rubber composite. (a) unstretched and
(b) stretched states. Thickness of the digitally-sliced cross-section is 5.2 nm. Black spheres in the cross sections represent silica particles.
In part (b), white arrow is a stretching direction. Many voids are observable. Part (c) and (d) show magnified view of rectangles in part (b).
As indicated by circles, there are half-bright zones that may be characteristic to the local stress upon stretching.66
H. DOHI et al.
754 Polym. J., Vol. 39, No. 8, 2007

suggest the fundamental mechanism of reinforcementand fracture of the rubber composite.
Acknowledgment. HD is grateful to Prof. TetsuoAsakura, Department of Biotechnology, Tokyo Uni-versity of Agriculture and Technology, for useful dis-cussions with regard to this study. The authors alsowish to thank Dr. Eiko Nakazawa, Hitachi High-Tech-nologies, for the preliminary test of stretched silica/rubber samples and also acknowledge Mr. HirofumiNakamae, Mr. Naoki Tsukamori, Mr. Masaya Sakaiand Mr. Hiroyuki Kishimoto, SRI R&D Ltd., for theircooperation in this work. HJ gratefully acknowledgeProf. Taihyun Chang and Mr. Hae-Woong Park (Po-hang University of Science and Technology), Prof.Masao Doi and Dr. Hiroshi Morita (The Universityof Tokyo) and Mr. Kohji Sawa (KIT) by their helpfuldiscussions. HJ is also grateful to NEDO for supportthrough the Japanese National Project ‘‘Nano-Struc-tured Polymer Project’’ by the Ministry of Economy,Trade and Industry and for support from the Ministryof Education, Science, Sports and Culture throughGrant-in-Aid No. 1855019 and No. 19031016.
REFERENCES
1. J. D. Gunton, M. S. Miguel, and P. S. Sahni, in ‘‘Phase
transition and critical phenomena,’’ C. Domb, and J. L.
Lebowitz, Ed., Academic, New York, 1983.
2. T. Hashimoto, in ‘‘Material science and technology,’’ R. W.
Cahn, P, Haasen, and E. J. Kramer, Ed., VCH, Weinheim,
1993, vol. 12, p 251.
3. V. Abetz and P. F. W. Simon, in ‘‘Block Copolymers I,’’ V.
Abetz, Ed., Springer, Heidelberg, 2005.
4. ‘‘Polymer-Clay Nanocomposites,’’ T. I. Pinnavaia and G. W.
Beale, Ed., John Wiley, New York, 2000.
5. S. S. Ray, K. Okamoto, and M. Okamoto, Macromolecules,
36, 2355 (2003).
6. J. S. Bergstom and M. C. Boyce, Rubber Chem. Technol.,
72, 633 (1999).
7. W. M. Hess, F. Lyon, and K. A. Burgess, Kautsch. Gummi
Kunstst., 20, 135 (1967).
8. A. R. Payne and R. E. Whittaker, Rubber Chem. Technol.,
44, 440 (1971).
9. T. Nishi, J. Polym. Sci., Polym. Phys. Ed., 12, 685 (1974).
10. A. N. Gent and B. Park, J. Mater. Sci., 19, 1947 (1984).
11. Y. Fukahori and W. Seki, Polymer, 33, 502 (1992).
12. Y. Fukahori and W. Seki, J. Materi. Sci., 28, 4143 (1993).
13. N. Suzuki and M. Ito, e-J. Soft Mater., 1, 1 (2005). (URL:
http://www.jstage.jst.go.jp/article/ejsm/1/0/1 1/ article/-char/
ja/).
14. G. Heideman, R. N. Datta, and J. W. M. Nordermeer,
Rubber Chem. Technol., 77, 512 (2004).
15. H. Jinnai, Y. Nishikawa, T. Ikehara, and T. Nishi, Adv.
Polym. Sci., 170, 115 (2004).
16. T. Wilson, in ‘‘Confocal microscopy,’’ T. Wilson, Ed.,
Academic, London, 1990.
17. H. Verhoogt, J. van Dam, A. Posthuma de Boer, A. Draaijer,
Figure 6. Schematic representations of cross-section of silica particle/rubber composite. Part (a) shows the cross-section at the position
indicated by red line in Figure 5(a). Black spheres (silica particle) dispersed in ocher zone (rubber matrix). Part (b) and (c) correspond to
cross-sections of stretched composite shown by dashed and solid lines in Figure 5(b), respectively. Voids viewed from side of the cryo-
microtomed section are indicated by white areas. represents the same position in Figure 5(b).
3D Imaging in Polymer Science
Polym. J., Vol. 39, No. 8, 2007 755
and P. M. Houpt, Polymer, 34, 1325 (1993).
18. L. Li, S. Sosnowski, C. E. Chaffey, S. T. Balke, and M. A.
Winnik, Langumuir, 10, 2495 (1994).
19. H. Jinnai, Y. Nishikawa, T. Koga, and T. Hashimoto,
Macromolecules, 28, 4782 (1995).
20. A. E. Ribbe, T. Hashimoto, and H. Jinnai, J. Matter Sci., 31,
5837 (1996).
21. H. Jinnai, T. Koga, Y. Nisikawa, T. Hashimoto, and S. T.
Hyde, Phys. Rev. Lett., 78, 2248 (1997).
22. E. Kumacheva, L. Li, M. A. Winnik, D. M. Shinozaki, and
P. C. Cheng, Langmuir, 13, 2483 (1997).
23. O. Vorobyova and M. A. Winnik, J. Polym. Sci., B., 39,
2317 (2001).
24. Y. Terada, S. Hirano, T. Ikehara, and T. Nishi, Polym. J., 33,
371 (2001).
25. N. Loren, A. Altskaer, and A.-M. Hermansson, Macromole-
cules, 34, 8117 (2001).
26. I. Hopkinson and M. Myatt, Macromolecules, 35, 5153
(2002).
27. T. Magoshi, H. Ziani-Cherif, S. Ohya, Y. Nakayama, and T.
Matsuda, Langmuir, 18, 4862 (2002).
28. N. Mashita, T. Minamikawa, K. Uesugi, and H. Jinnai,
Kobunshi Ronbunshu, 60, 373 (2003).
29. A. Momose, A. Fujii, H. Jinnai, and H. Kadowaki, Macro-
molecules, 38, 7197 (2005).
30. S. Koizumi, Y. Yamane, S. Kuroki, I. Ando, Y. Nishikawa,
and H. Jinnai, J. Appl. Polym. Sci., 103, 470 (2007).
31. J. Frank, ‘‘Electron tomography,’’ Plenum, New York, 1992.
32. R. J. Spontak, M. C. Williams, and D. A. Agard, Polymer,
29, 387 (1988).
33. R. J. Spontak, J. C. Fung, M. B. Braunfeild, J. W. Sedat,
D. A. Agard, L. Kane, S. D. Smith, M. Satkowski, A.
Ashraf, D. A. Hajduk, and S. M. Gruner, Macromolecules,
29, 4494 (1996).
34. J. H. Laurer, D. A. Hajduk, J. C. Fung, J. W. Sedat, S. D.
Smith, S. M. Gruner, D. A. Agard, and R. J. Spontak,
Macromolecules, 30, 3938 (1997).
35. J. H. Laurer, A. Ashraf, S. D. Smith, and R. J. Spontak,
Langmuir, 13, 2250 (1997).
36. L. H. Radzilowski, B. O. Carragher, and S. I. Stupp, Macro-
molecules, 30, 2110 (1997).
37. H. Jinnai, Y. Nishikawa, R. J. Spontak, S. D. Smith, D. A.
Agard, and T. Hashimoto, Phys. Rev. Lett., 84, 518 (2000).
38. A. J. Koster, U. Ziese, A. J. Verkleij, A. H. Janssen, and
K. P. De Jong, J. Phys. Chem. B., 104, 9368 (2000).
39. P. A. Midgley and M. Weyland, Ultramicroscopy, 96, 413
(2003).
40. T. Kaneko, H. Nishioka, T. Nishi, and H. Jinnai, J. Electron.
Microsc., 54, 437 (2005).
41. T. Xu, A. V. Zvelindovsky, G. J. A. Sevink, K. S. Lyakhova,
H. Jinnai, and T. P. Russell, Macromolecules, 38, 10788
(2005).
42. H. Sugimori, T. Nishi, and H. Jinnai, Macromolecules, 38,
10226 (2005).
43. S. Pratip and N. Jacqes W. M., Macromol. Rapid Commun.,
26, 542 (2005).
44. H. Jinnai, K. Sawa, and T. Nishi, Macromolecules, 39, 5815
(2006).
45. H. Nishioka, K. Niihara, T. Kaneko, J. Yamanaka, Y.
Nishikawa, T. Inoue, T. Nishi, and H. Jinnai, Compos.
Interfaces, 13, 589 (2006).
46. J. H. Kim, D. H. Lee, J. Won, H. Jinnai, and Y. S. Kang,
J. Membr. Sci., 281, 369 (2006).
47. H. Jinnai, H. Hasegawa, Y. Nishikawa, G. J. Agur Sevink,
M. B. Braunfeld, D. A. Agard, and R. J. Spontak,Macromol.
Rapid Commun., 27, 1424 (2006).
48. H. Jinnai, T. Kaneko, H. Nishioka, H. Hasegawa, and T.
Nishi, Chem. Rec., 6, 267 (2006).
49. M. Ono, H. Nishioka, H. Jinnai, K. Nakajima, and T. Nishi,
e-J. of Soft Mat., 2, 56 (2006). (URL: http://www.jstage.jst.
go.jp/article/ejsm/2/0/2 56/ article/-char/ja/).
50. T. Kaneko, K. Suda, K. Satoh, M. Kamigaito, T. Kato, T.
Ono, E. Nakamura, T. Nishi, and H. Jinnai, Macromol.
Symp., 242, 80 (2006).
51. H. Jinnai, K. Yasuda, and T. Nishi, Macromol. Symp., 245,
170 (2006).
52. N. Kawase, M. Kato, H. Nishioka, and H. Jinnai, Ultra-
microscopy, 107, 8 (2007).
53. H.-W. Park, K. Im, B. Chung, M. Ree, T. Chang, K. Sawa,
and H. Jinnai, Macromolecules, 40, 2603 (2007).
54. T. Ikehara, H. Jinnai, T. Kaneko, H. Nishioka, and T. Nishi,
J. Polym. Sci., Part B: Polym. Phys., 45, 1122 (2007).
55. Y. Nishikawa, H. Jinnai, T. Koga, T. Hashimoto, and S. T.
Hyde, Langmuir, 14, 1242 (1998).
56. Y. Nishikawa, T. Koga, T. Hashimoto, and H. Jinnai,
Langmuir, 17, 3254 (2001).
57. Y. Nishikawa, H. Jinnai, and H. Hasegawa, Kobunshi
Ronbunshu, 58, 13 (2000).
58. H. Jinnai, H. Watashiba, T. Kajihara, and M. Takahashi,
J. Chem. Phys., 119, 7554 (2003).
59. A 360� single-axis tilt stage was used for �90� rotation in
the past (D. P. Barnard et al. Microscopy 167, 39 (1992)).
However, it is for high-voltage electron microscope and is
NOT versatile.
60. S. Hyde, S. Andersson, K. Larsson, Z. Blum, T. Landh,
S. Lidin, and B. W. Niham, in ‘‘The language of shape,’’
Elsevier, Amsterdam, 1997.
61. a) K. Sawa, H. Jinnai, H. W. Park, T. Chang, and T. Nishi,
Polym. Prepr. Jpn., 55, 3588 (2006).
b) H. Jinnai, K. Sawa, F. Hirato, H. W. Park, T. Chang, and
T. Nishi, manuscript in preparation.
62. a) H. Sugimori, U. Matsuwaki, H. Morita, M. Doi, T. Nishi,
and H. Jinnai, Polym. Prepr. Jpn., 55, 1321 (2006).
b) H. Sugimori, U. Matsuwaki, H. Morita, M. Doi, T. Nishi,
and H. Jinnai, manuscript in preparation.
63. Y. Shinbori, T. Kitaoka, H. Sugimori, Y. Nishikawa, H.
Jinnai, K. Akutagawa, N. Mashita, and T. Nishi, Polym.
Prepr. Jpn., 55, 994 (2006).
64. H. Jinnai, Y. Shinbori, T. Kitaoka, K. Akutagawa, N.
Mashita, and T. Nishi, Macromolecules, submitted.
65. T. Kitaoka, Y. Shinbori, H. Sugimori, Y. Nishikawa, H.
Jinnai, K. Akutagawa, N. Mashita, and T. Nishi, Polym.
Prepr. Jpn., 55, 3340 (2006).
66. A. Lapra, F. Clement, L. Bokobza, and L. Monnerie, Rubber
Chem. Technol., 76, 60 (2004).
67. Due to the missing wedge problem in TEMT experiments,
areas that appear to be pale perpendicular to the tilt axis
can be artifacts in the 3D reconstruction. The tilt axis is par-
H. DOHI et al.
756 Polym. J., Vol. 39, No. 8, 2007

allel to Y-axis in Figure 5. Thus, the half-bright zones dis-
cussed in the text should truly correspond to actual thickness
of the rubber matrix.
68. W. Reichert, D. Goritz, and E. J. Duschl, Polymer, 34, 1216
(1993).
69. H. Dohi, Polym. Prepr. Jpn., 53, 4255 (2004).
70. H. Dohi, M. Sakai, Y. Minagawa, and H. Kishimoto at the
52th Rheology Conference, Hirosaki Japan, September 22–
24, 2004.
71. J. Y. Lee, Q. Zhang, T. Emrick, and A. J. Crosby, Macro-
molecules, 39, 7392 (2006).
Hidehiko DOHI graduated from the Department of Petro-Chemistry of Kyoto University, Kyoto, Japan in 1973. In
the same year, he got employment in Sumitomo Rubber Industries, Ltd., Kobe, Japan. In 1998, he moved to General
Manager of Chemical Analysis Center in Research and Development Division of Sumitomo Rubber Industries, Ltd.
In 2003, he moved to General Manager of Chemical Analysis Center of SRI R&D Ltd., because of the organiza-
tional reform of the company. His research interest is the development of new analysis technique of rubber materi-
als. He is also a graduate student at the Department of Biotechnology, Tokyo University of Agriculture and Tech-
nology. His research theme is the study on nano-structures in rubber.
Hideaki KIMURA was born in Miyagi, Japan, in 1969. He awarded Doctor of Engineering in 1998 at Gunma Uni-
versity. He was a principal scientist at JCII (Japan Chemical Innovation Institute) as a NEDO (New Energy and
Industrial Technology Development Organization) fellowship researcher from 1998 to 2001. He received a JSPS
(Japan Society for the Promotion of Science) Research Fellowships for Young Scientists from 2001 to 2004. During
this period, he studied at Tokyo Institute of Technology and Iowa State University, USA. He was a guest scientist at
Tsukuba University in 2005. His present position is the associate manager of the chemical analysis center of SRI
R&D Ltd. His research interests are the molecular structure and dynamics of rubbers and resins.
Marina KOTANI got employment in Sumitomo Rubber Industries, Ltd., Kobe, Japan. She worked for Tire Material
Research Division. She moved to Manager of Chemical Analysis Center of SRI R&D Ltd., because of the organiza-
tional reform of the company. Her research interest is rubber analysis.
Takeshi KANEKO was born in Chiba, Japan in 1979 and grew up in Osaka, Japan. He obtained his education in
polymer science from the Department of Mcromolecular Science and Engineering, Kyoto Institute of Technology,
where he received his B.S. degree in 2003 and his M.S. degree in 2005. He is interested in three-dimensional ob-
servation and analysis of microphase-separated structures of block copolymers.
Tatsuro KITAOKA was born in Hyogo, Japan in 1984. He obtained his education in polymer science from the De-
partment of Macromolecular Science and Engineering, Kyoto Institute of Technology, Kyoto, Japan where he re-
ceived his B.S. degree in 2006. He is interested in 3D observation and structural analysis of nanocomposite mate-
rials.
3D Imaging in Polymer Science
Polym. J., Vol. 39, No. 8, 2007 757
Toshio NISHI was born in Kanagawa, Japan, in 1942, and graduated from the department of applied physics of The
University of Tokyo, Japan in 1965. He studied polymer physics and awarded Master of Engineering in 1967 and
Doctor of Engineering in 1972 at the same university. He joined R&D Division of Bridgestone Tire Co., Ltd. in
1967 until 1980. He was a visiting scientist at Bell Telephone laboratories, USA from 1972 to 1975. He was ap-
pointed lecturer at the Department of Applied Physics, The University of Tokyo in 1980 and associate professor in
1982, and promoted to full professor in 1992 majoring physics of polymer alloys and composites. In 2003, he re-
tired from The University of Tokyo and was appointed professor emeritus. He then moved to Tokyo Institute of
Technology, Tokyo and is studying polymer nanotechnology. He served as president of The Society of Rubber In-
dustry, Japan between 1995 to 1997, and as vice president of The Society of Polymer Science, Japan between 2000
to 2002. He was awarded the Polymer Science Award in 1990, Oenschlager Award in 1998, Polymer Science Merit
Award in 2005. He is active as the Head of the Department of Organic and Polymeric Materials, Graduate School of
Science and Engineering, Tokyo Institute of Technology and Specialist to The Supreme Court in the field of poly-
mer science and engineering.
Hiroshi JINNAI was born in Osaka, Japan, in 1965, and graduated from the Department of Polymer Chemistry of
Kyoto University, Kyoto, Japan in 1988. He studied polymer physics and awarded Master of Engineering in 1990
and Doctor of Engineering in 1993 at the same university. During this period, he was a guest scientist at National
Institute of Standards and Technology (NIST), USA from 1988 to 1989 and from 1991 to 1992. He received a JSPS
(Japan Society for the Promotion of Science) Research Fellowships for Young Scientists in 1993. In 1993, he joined
an ERATO (Exploratory Research for Advanced Technology) program, Hashimoto Polymer Phasing Project, as a
group leader. He was appointed lecturer at the Department of Macromolecular Science and Engineering of Kyoto
Institute of Technology in 1998 and was promoted to an associate professor in 2002. He was awarded the SPSJ (The
Society of Polymer Science, Japan) Wiley Award in 2006. His research interests are the self-assembling morphol-
ogies and processes of polymer blends and block copolymers. He is also a recognized world expert in three-dimen-
sional visualization of soft-condensed matters.
H. DOHI et al.
758 Polym. J., Vol. 39, No. 8, 2007