thesis for e.coli and salmonella
DESCRIPTION
as per the titleTRANSCRIPT

THESIS
SURVIVAL AND PERSISTENCE OF FOODBORNE PATHOGENS IN FOOD
RESIDUES ON PACKAGING MATERIALS AND REDUCTION OF ESCHERICHIA
COLI O157:H7 AND SALMONELLA IN BEEF TRIMMINGS
Submitted by
Matthew Charles Nunnelly
Department of Animal Sciences
In partial fulfillment of the requirements
For the Degree of Master of Science
Colorado State University
Fort Collins, Colorado
Spring 2012
Master�’s Committee:
Advisor: John N. Sofos
Dale Woerner Patricia Kendall

ii
ABSTRACT
SURVIVAL AND PERSISTENCE OF FOODBORNE PATHOGENS IN FOOD
RESIDUES ON PACKAGING MATERIALS AND REDUCTION OF ESCHERICHIA
COLI O157:H7 AND SALMONELLA IN BEEF TRIMMINGS
Foodborne pathogens continue to cause health problems for modern consumers of meat
products despite efforts to control bacteria in food. New approaches to controlling
pathogens and identifying sources of contamination are needed. Some of the most
important foodborne pathogens that affect modern food supplies are Salmonella serotypes
and Escherichia coli O157:H7, both associated with uncooked meat, and Listeria
monocytogenes, a problematic organism for ready-to-eat foods. The objective of this
thesis is to investigate survival of E. coli O157:H7 and L. monocytogenes on food
packaging materials soiled with meat-based residues, and compare differences of
behavior when exposed to different packaging materials and storage conditions. In
addition to these investigations, a study comparing resistance of multi drug-resistant and
susceptible Salmonella serotypes and E. coli O157:H7 on beef trimmings treated with
decontaminating antimicrobials provides valuable information concerning the efficacy of
current chemical interventions against Salmonella serotypes that are at the forefront of
public health concerns.
To evaluate pathogen survival on contaminated food packaging materials, meat based
homogenate (10% w/w) was inoculated with a multi-strain mixture of either L.
monocytogenes or E. coli O157:H7 and spot-inoculated on packaging material samples,

iii
placed in a new, empty petri dish, and stored in incubators set at either 4 or 25º C for up
to 130 days. Samples were analyzed regularly until the end of the study. There were
survivors of the pathogens on several soiled packaging material types even at 123 or 130
days of storage (L. monocytogenes or E. coli O157:H7, respectively).
When the decontamination of beef trimmings contaminated with multi drug-resistant and
susceptible Salmonella was compared with E. coli O157:H7, there were very few
statistically significant differences (P < 0.05) between the reduction of Salmonella and
the response of E. coli O157:H7 to acidified sodium chlorite (1000ppm), peroxyacetic
acid (200ppm), and sodium metasilicate (40000ppm). In addition, there were only minor
differences between the reductions of antibiotic susceptible Salmonella and multi drug-
resistant strains.
Results of these studies will aid in quantifying risks associated with contamination of
food packaging materials as well as beef trimmings.

iv
ACKNOWLEDGEMENTS
I would like to thank the Colorado State University Center for Meat Safety and Quality
for the opportunity to advance my education. Special thanks go to Dr. John Sofos who
continually demonstrated patience and offered guidance throughout my education. I
would also like to express gratitude to Dr. Gina Geornaras for her patience, instruction,
and help throughout all aspects of my work while at Colorado State University. Much
appreciation is due to Dr. Jeremy Adler for his advice, help, and friendship, Aliyar
Fouladkhah for his enthusiasm and expertise, and Dr. Shivani Gupta for her kindness,
help, and friendship throughout my education.
I would be unable to have all the opportunities I have been blessed to have without the
love and support of my parents, Mark and Lottie Nunnelly, and my brother Michael
Nunnelly throughout my life. I am so grateful for the companionship of my friends and
church family from Birmingham, Auburn, and now Fort Collins, as well as the Fort
Collins cycling community for allowing me to stay healthy and balanced throughout my
education.
Most importantly I must thank my Lord and Savior Jesus Christ for grace, mercy,
guidance, and peace throughout my life. I am truly blessed.

v
TABLE OF CONTENTS
Abstract ............................................................................................................................... ii Chapter 1: Introduction to Thesis ........................................................................................1
Chapter 2: Literature Review ...............................................................................................5 I. Overview of pathogenic bacteria studied ................................................................................ 5
i. Listeria monocytogenes ........................................................................................................ 5 ii. Escherichia coli O157:H7 ................................................................................................... 7 iii. Salmonella ....................................................................................................................... 10
II. Attachment, survival, and persistence of pathogens ............................................................. 12 i. Persistence of Listeria monocytogenes .............................................................................. 12 ii. Listeria monocytogenes attachment on non-food surfaces ............................................... 13 iii. Listeria monocytogenes survival on non-food surfaces ................................................... 14 iv. Listeria monocytogenes cross-contamination .................................................................. 15 v. Public health interest in Escherichia coli O157:H7 .......................................................... 17 vi. Attachment and biofilm formation of Escherichia coli O157:H7 .................................... 18 vii. Survival of Escherichia coli O157:H7 ............................................................................ 19 viii. Cross-contamination with Escherichia coli O157:H7 ................................................... 20
III. Resistance of Salmonella to antimicrobials ........................................................................ 22 i. Salmonella prevalence in food supply ............................................................................... 22 ii. Multi-drug resistant Salmonella strains ............................................................................ 23 iii. Threats posed by Salmonella serotypes ........................................................................... 24 iv. Control of Salmonella serovars ........................................................................................ 25
IV. Overview of select antimicrobials available for use in beef trim grinding operations ........ 25 i. Acidified sodium chlorite ................................................................................................... 25 ii. Peroxyacetic acid .............................................................................................................. 26 iii. Sodium metasilicate ......................................................................................................... 27
Chapter 3: Survival of Listeria monocytogenes on common food packaging materials soiled with antimicrobial-free ham residue ........................................................................29
Chapter Overview ..............................................................................................................29 I. Introduction ............................................................................................................................ 31 II. Materials and Methods .......................................................................................................... 33
i. Strains and inoculum preparation ....................................................................................... 33 ii. Packaging material sample preparation ............................................................................ 34 iii. Inoculation ....................................................................................................................... 34 iv. Sampling and analysis ...................................................................................................... 35 v. Statistical analysis ............................................................................................................. 35
III. Results ................................................................................................................................. 37 i. General Trends ................................................................................................................... 37 ii. Survival of L. monocytogenes on soiled food packaging material inoculated with a high initial level and stored at 25º C ............................................................................................. 38 iii. Survival of L. monocytogenes on soiled food packaging materials inoculated with a high initial level and stored at 4º C ............................................................................................... 44 iv. Survival of L. monocytogenes on soiled food packaging materials inoculated at a low initial level and stored at 25º C ............................................................................................. 49

vi
v. Survival of L. monocytogenes on soiled food packaging materials inoculated at a low initial level and stored at 4º C ............................................................................................... 55 vi. Discussion ........................................................................................................................ 61
IV. Conclusions ......................................................................................................................... 65 Chapter 4: Escherichia coli O157:H7 survival on food packaging materials soiled with ground beef residues ..........................................................................................................66
Chapter Overview ...................................................................................................................... 66 I. Introduction ............................................................................................................................ 67 II. Materials and Methods .......................................................................................................... 69
i. Strain and inoculum preparation ........................................................................................ 69 ii. Packaging material sample preparation ............................................................................ 70 iii. Inoculation ....................................................................................................................... 71 iv. Sampling and analysis ...................................................................................................... 71 v. Statistical analysis ............................................................................................................. 72
III. Results and Discussion ........................................................................................................ 73 i. General trends .................................................................................................................... 73 ii. Survival of E. coli O157:H7 on soiled food packaging materials inoculated at a high inoculation level and stored at 25º C ..................................................................................... 75 iii. Survival of E. coli O157:H7 on soiled food packaging material when inoculated at a high inoculation level and stored at 4º C ....................................................................................... 80 iv. Survival of E. coli O157:H7 on soiled food packaging materials inoculated at a low inoculation level and stored at 25º C ..................................................................................... 84 v. Survival of E. coli O157:H7 on soiled food packaging material when inoculated at a low inoculation level and stored at 4º C ....................................................................................... 88 vi. Discussion ........................................................................................................................ 91
IV. Conclusions ........................................................................................................................ 96 Chapter 5: Comparison of the efficacy of decontaminating agents against susceptible and multi-drug resistant Salmonella compared to Escherichia coli O157:H7 in beef trimmings97
Chapter Overview ...................................................................................................................... 97 I. Introduction ............................................................................................................................ 98 II. Materials and methods ........................................................................................................ 100
i. Culture preparation .......................................................................................................... 100 ii. Beef trimmings preparation ............................................................................................ 104 iii. Decontamination solution preparation ........................................................................... 104 iv. Inoculation of beef trimmings ........................................................................................ 105 v. Treatment of contaminated beef trimmings .................................................................... 105 vi. Sampling of contaminated beef trimmings .................................................................... 106 vii. Statistical analysis of data ............................................................................................. 107
III. Results and discussion ....................................................................................................... 107 i. Effect of acidified sodium chlorite ................................................................................... 107 ii. Peroxyacetic acid ............................................................................................................ 112 iii. Sodium metasilicate ....................................................................................................... 116 iv. pH ................................................................................................................................... 120 v. Percent weight change ..................................................................................................... 122
IV. Conclusions ....................................................................................................................... 123 References ........................................................................................................................125
Appendix: .........................................................................................................................135

1
Chapter 1: Introduction to Thesis
Foodborne pathogens are a leading concern in the food industry, as contaminated food
can lead to illness and death. In addition, presence of pathogens in the food supply has
prompted development of industry guidelines and federal regulations governing food
wholesomeness. In addition to the obvious public health detriment of contaminated
food, there exists a steep economic loss associated with recalls as well as a loss of
consumer confidence in the food supply. Three pathogens of note are Listeria
monocytogenes, Escherichia. coli O157:H7, and Salmonella serotypes. Though
pathogens generally affect consumers in rare circumstances, mortality and
hospitalization are still present and problematic (Scallan et al., 2011). Countless studies
have been performed to develop control systems for pathogens in food processing
environments, yet contamination still occurs and pathogens persist, even in seemingly
adverse environments, especially for L. monocytogenes (Knøchel, 2010; Riazi and
Matthews, 2011). Survival under adverse conditions is not limited to L. monocytogenes,
as E. coli O157:H7 has been reported to survive under similar conditions in food, food
processing facilities, or the environment for extended periods of time (Uhlich et al.,
2010; van Elsas et al., 2011, Wilks et al., 2005), while some Salmonella serotypes have
been shown to resist common therapeutic antibiotics including tetracycline and
streptomycin (Antunes et al., 2003).

2
Because of these issues, research to investigate the hardiness and survival of common
foodborne pathogens is important. Building on the foundational knowledge of stress
adaptation and long-term survival (Shen et al., 2011; Ingham et al., 2004; Masters et al.,
1994; Allen et al., 2008; Knøchel, 2010; Tompkin, 2002) as well as on investigations on
the effect of biofilm formation and food soiling on the survival of pathogens (Gram et
al., 2007; Uhlich et al., 2010; Marouani-Gadri et al., 2010), it was decided that
investigating the survival of L. monocytogenes and E. coli O157:H7 on soiled food
packaging materials would be beneficial to our understanding of transmission of
foodborne illness. During storage and retail, nearly every meat product has contact with
one or more packaging materials, meaning that common materials may possibly be a
source and reservoir of foodborne pathogens. With a better understanding of long-term
survival of pathogens, risk assessment recommendations will have more valid scientific
backing, the food industry will be better prepared to combat recalls and economic losses,
and consumers will better understand the risk and danger of improper food handling and
storage.
When evaluating pathogenic Salmonella serotypes (both antibiotic resistant and
susceptible) against the well-documented behavior of E. coli O157:H7 contaminating
beef trimmings, it is plausible that results could influence policy regarding the
decontamination of beef trimmings harboring both Salmonella and E. coli O157:H7. As
the presence of E. coli O157:H7 in ground beef and other non-intact beef products is the
subject of federal policy (FDA, 9 CFR 311.33, 2011; FSIS directive 6420.2, 2004), it
stands to reason that other pathogenic bacteria will become the subject of legislation in

3
the future. By comparing Salmonella serotypes to E. coli O157:H7, an organism that has
been studied extensively (Pohlmann et al., 2007; Quilo et al., 2010; Hajmeer et al., 2004;
Arthur et al., 2008), it is possible that more appropriate conclusions may be made
concerning risk assessment of Salmonella contamination in beef trimmings.
Strains of L. monocytogenes have been documented in some studies to survive for at
least 250 days in frozen food (Gianfranceschi and Aureli, 1996), and at least 8-10
months in a fish processing plant that was improperly cleaned (M drala et al., 2003),
and E. coli O157:H7 has been found to persist for at least 9 days through cleaning
treatments on food contact surfaces (Uhlich et al., 2010; Marouani-Gadri et al., 2010)
and at least 10 days in fecal contamination (Semenov, 2011). In addition to this,
Tompkin (2002) reports that a strain of L. monocytogenes survived for at least 12 years
in a poultry processing plant in the United States. Clearly the bacteria have the ability to
survive in a variety of conditions for a long period of time. Because of this knowledge,
the objective was to investigate the behavior of the pathogens on common food
packaging materials when the materials have been soiled with a contaminated food
matrix. By analyzing the survival of the bacteria, readers will gain an understanding of
dangers associated with contaminated and soiled food packaging materials (Semenov et
al., 2011; Janssen et al., 2005).
The objective of the other study was to determine potential differences in resistance to
decontaminating antimicrobials, if any, between E. coli O157:H7 and Salmonella
(antibiotic susceptible and resistant serotypes). Results from this trial will show any

4
possible differences between five tested Salmonella serotypes and E. coli O157:H7
when inoculated on beef trimmings and treated with antimicrobials commonly used in
the meat processing industry (acidified sodium chlorite, peroxyacetic acid, and sodium
metasilicate).
Data obtained from these trials will allow conclusions to be made as to the behavior of
three common foodborne pathogens that continue to cause problems in the meat
industry. Because foodborne pathogens continue to present themselves as issues for
public health and the food industry (Scallan et al., 2011), it is necessary to pursue an
understanding of L. monocytogenes, E. coli O157:H7, and Salmonella serotypes and
their behavior in food soiling matrices or beef trimmings, respectively. Benefits of an
understanding of bacterial behavior are far reaching, with potential to influence
everything from consumer and retail storage behavior to industry activities and federal
legislation.

5
Chapter 2: Literature Review
I. Overview of pathogenic bacteria studied
i. Listeria monocytogenes
First described in the early part of the 1900s as a causative agent of human and animal
illness, L. monocytogenes is still at the forefront of research interests today (Jay et al.,
2005). The pathogen is unique in that, while incidence of infection is low, consequences
of an outbreak involve higher rates of hospitalization and death than other foodborne
pathogens (Scallan et al., 2011). Recent studies indicate that L. monocytogenes may be
much more prevalent in retail settings than initially estimated (Sauders et al., 2009).
Because of the danger posed by the presence of the pathogen in food, continued efforts to
understand the characteristics and behavior of L. monocytogenes are needed.
1. Morphology and pathogenicity
Listeria monocytogenes has been defined as a species for nearly a century (Jay et al.,
2005). It is a gram-positive, rod-shaped, facultatively anaerobic and motile organism. It is
known to be ubiquitous, and species of the genus Listeria can be commonly found in
environmental samples as well as areas commonly associated with processed meat
products (Williams et al., 2011; WHO, 2004). L. monocytogenes is not a spore-forming
organism, so thermal processing is typically considered a viable intervention for food.
The problem, therefore, lies with consumption of food not traditionally heat treated prior
to ingestion. This includes, but is not limited to, fresh produce like leafy greens and

6
fruits, dairy products like cheese, raw milk and ice cream, and cooked meat products like
deli ham and frankfurters that can be exposed to new contamination after cooking (de
Oliveira et al., 2011).
L. monocytogenes, when present in food at infectious levels, generally infects those who
are at risk. This group traditionally includes the elderly, the very young, and the
immunocompromised, specifically patients with HIV/AIDS or people with organ
transplants, as well as fetuses of pregnant women (Jay et al., 2005). L. monocytogenes
has the ability to traverse the placental membrane and infect a developing child, causing
spontaneous abortion (WHO, 2004). Infection generally occurs in the small intestine,
where the organism internalizes itself in the epithelial lining of a host and acts as an
intracellular parasite, growing and multiplying until it is able to escape the cell via
lysozome action. Once in the cytoplasm it quickly moves to adjacent cells where the
process continues (Hamon et al., 2006).
Incidence of listeriosis can also be managed by proper education of consumers and
producers alike. While producers and processors can be legally mandated to handle
product and manage facilities in ways to prevent outbreaks, consumers must be
approached differently. Even in the 1980s, the United States Department of Agriculture �–
Food Safety and Inspection Service (USDA-FSIS) began publishing information
instructing consumers on proper handling of food with regards to L. monocytogenes
(USDA, 2000). As a result of education programs, many women opt to forego deli meats

7
during pregnancy (Kendall et al., 2003). A marked shift in consumer behavior to prevent
listeriosis is indicative of a functional education program.
2. Impact of pathogen
L. monocytogenes is of interest because infection is often associated with a high mortality
rate. Although the organism is not associated with the highest number of foodborne
illnesses (a title belonging to Campylobacter species), the mortality rate for victims of
listeriosis is 16% and may be as high as 30% (Scallan et al., 2011). Therefore, it is of
great interest to the food industry and public health programs to prevent the pathogen
from entering the food supply. As of 2000, specific policy was enacted to target the
presence of L. monocytogenes in the food supply. The USDA-FSIS urged the food
industry to re-evaluate HACCP plans with specific regard to the threat of L.
monocytogenes keeping in mind the goal of 0.5 cases per 100,000 people, with a goal to
reduce it to 0.25 cases per 100,000 by 2010 (USDA-FSIS, 2000). USDA-FSIS currently
enforces a zero-tolerance policy on foods labeled as ready-to-eat (USDA-FSIS, 2000).
Though the viability of zero-tolerance policy is always a subject for debate within
industry and academia, the push for such an extreme measure is highly indicative of the
problem the pathogen causes for consumers.
ii. Escherichia coli O157:H7
Escherichia coli, especially the serotype O157:H7 has, in recent decades, become one of
the most well-known, publicized, and legislated foodborne pathogens the meat industry
encounters. Numerous news stories, documentary films, social practices, and legal

8
measures reference this pathogen either directly or indirectly, making the pathogen a
household name and concern from cattle production to the dinner table. Ever since the
Jack-in-the-Box E. coli O157:H7 outbreak of 1993, the coliform has been of special
interest to the food production and foodservice industry. Due to the educational efforts of
government agencies and food companies, ground meat is nearly always cooked to an
internal temperature lethal to the organism (72º C or greater), even in private household
settings. Finally, and possibly most importantly to the meat packing industry, E. coli
O157:H7 has been declared an adulterant of beef, enforced with a zero-tolerance policy
for any fecal contamination (FSIS directive 6420.2, 2004). Though non-pathogenic E.
coli can be found nearly anywhere in the environment, and is common in the digestive
tracts of many animals, serotype O157:H7 is of greater concern due to its pathogenicity.
1. Morphology and pathogenicity
Escherichia coli O157:H7 is a gram-negative, flagellated, rod-shaped organism. The cell
wall contains the �“O�” antigen, while the �“H�” denotes the flagellar antigen present.
Though of the same species as non-pathogenic E. coli, serotype O157:H7 can be
differentiated in that it is unable to ferment sorbitol efficiently, unlike most generic E.
coli. E. coli O157:H7 is specifically adapted for survival in the gastrointestinal tract of
host organisms. Some strains �“produce curli fimbriae that facilitate attachment of cells to
surfaces�” (Jay et al., 2005). This is notable in that it not only facilitates attachment of
cells to host organisms, but also can aid in attachment of cells to abiotic surfaces where
biofilm formation will further facilitate persistence and survival of the pathogen (Torres
et al., 2005; Uhlich et al., 2010). E. coli O157:H7 is most well known as a causative

9
agent of Hemolytic Uremic Syndrome (HUS). Its virulence is due to production of non-
heat stable shiga-like toxins, responsible for HUS which attack epithelial and renal cells,
causing lysis, leading to bloody stool or blood in urine. The protein toxin attaches to
specific receptors on these cells and disrupts protein synthesis. It is important to note that
HUS is only caused when a population of shiga-toxin E. coli (STEC) is able to grow in a
host organism, as the toxin is a protein, produced more readily at 37º C than at room
temperature (Abdul-Raouf et al., 1994), though the pathogen is able to survive in a wide
range of conditions including lower temperatures associated with storage of meat
products.
2. Impact of pathogen
Traditionally associated with ground beef, E. coli O157:H7 has also been found in non-
meat foods such as radish sprouts in Japan in 1996 and even hazelnuts in the Great Lakes
region in 2011 (Centers for Disease Control and Prevention �– OutbreakNet, 2011). As is
the case with most foodborne pathogens, E. coli O157:H7 is of greatest concern to at-risk
groups: the very young, the very old, and immuno-compromised people. People with a
healthy immune system may experience gastroenteritis and diarrhea without developing
HUS. Scallan et al. (2011) reported that E. coli O157:H7 could be responsible for over
60,000 cases of illness per year as well as being responsible for up to 20 deaths on
average. In addition to the health consequences and threats posed by the pathogen,
continued presence of the pathogen and resurgence in the food supply undermines
consumer confidence in commercial food production and processing (Viazis and Diez-

10
Gonzalez, 2011). Controlling the organism and incidence of illness is beneficial from an
economic , public relations, and a public health standpoint.
iii. Salmonella
Salmonella has long been known to cause foodborne illness. Though not generally
referenced by species name (as is the case in Escherichia coli, Campylobacter jejuni,
Listeria monocytogenes, etc.), different serovars have been studied in the past, most
belonging to the species enterica, with the non-pathogenic Salmonella serovars belonging
to the bongori species (Jay et al., 2005). Biologically, Salmonella is very similar to E.
coli (indistinguishable from E. coli on nonselective media), so it is no surprise that the
bacteria thrive in similar environments (Jay et al., 2005). Salmonella is a gram-negative
facultative anaerobe that readily colonizes the intestinal tracts of host organisms, whether
it be a human or animal host.
1. Morphology and pathogenicity
Also similar to E. coli, Salmonella are gram-negative rods, not spore forming, and are
generally flagellated, providing motility and a wide range of antigens with which to
classify the individual bacteria. Fecal-oral transmission is also one of the most common
methods of infection for consumers of contaminated food, a result of improper carcass
washing, poor worker hygiene, or in the case of produce, contaminated groundwater
resulting in attachment of the pathogen to food products. Salmonella serovars are
generally adapted for specific hosts, though serovars that cause typhoid fever are the most

11
serious threats to human health (Jay et al., 2005). Further complicating matters, the
pathogen has been shown to possess antibiotic resistance to a broad spectrum of
antibiotics including ampicillin, chloramphenicol, streptomycin, sulfa drugs, and
tetracylines (Jay et al., 2005; Rabsch et al., 2001). Symptoms of foodborne illness
stemming from Salmonella serotypes include diarrhea and malaise, though mortality does
occur at a 0.5% rate (Scallan et al., 2011). Though effects and methods of infection of
the pathogen are not identical to other Enterobacteriaceae, it is likely that control of the
organism in the food supply will be very similar to control of other Enterobacteriaceae.
Salmonella infections occur when contaminated food is consumed and Salmonella cells
colonize epithelial cells in the host intestine (Zhang et al., 2003). Aside from
environmental reservoirs of the bacteria, poultry, ground beef, and pork may be sources
of contamination with the pathogen (National Center for Zoonotic, Vector-Borne, and
Enteric Diseases, 2009). Symptoms of salmonellosis are generally diarrhea and
abdominal cramps, though more severe pain and sepsis can develop if the bacterial
infection spreads outside of the intestinal lining to the blood stream or surrounding
tissues (National Center for Zoonotic, Vector-Borne, and Enteric Diseases, 2009).
Though salmonellosis generally is resolved by a healthy immune system in a timely
fashion, multi-drug resistant strains have become problematic in treating patients
suffering from salmonellosis (Arthur et al., 2008). Salmonella serotypes can be controlled
by thermal processing and effective sanitation practices, but problems arise in ground or
comminuted products, as internalized bacteria are able to survive when the product is not
cooked properly (Gill et al., 2009).

12
2. Impact of pathogen
Salmonella serotypes have been a cause for alarm in the food industry, affecting the way
consumers view food safety. In addition to causing an estimated 20,000 hospitalizations
per year with nearly 400 deaths resulting from infection (Scallan et al., 2011), any
outbreak of foodborne illness has the potential to cause loss of consumer trust in the food
supply and skepticism of the industry�’s dedication to public health. Salmonella presence
is also indicative of more sweeping problems in a food processing environment. When
the pathogen is present in a food it indicates that antimicrobial hurdles have failed or are
ineffective or there is a control point in food processing for which food safety plans have
not accounted. If the source of infection can be traced to retail or home settings, it
indicates that worker hygiene or unsanitary storage conditions may have led to cross-
contamination. Because the pathogen is a serious cause of health problems and revenue
loss as a result of food contamination, farther reaching factors should be noted and
evaluated for overall food product safety and quality.
II. Attachment, survival, and persistence of pathogens
i. Persistence of Listeria monocytogenes
Research on L. monocytogenes in relation to the meat industry generally focuses on
control and prevention of the contamination of processed products, as well as
environmental persistence of the organism. Because thermal processing is generally
adequate in destroying the organism, L. monocytogenes contamination on raw product,
though not desirable by any means, is less of an issue than contamination of a product

13
that will not be cooked prior to eating. Despite L. monocytogenes not being a spore-
forming organism, it is amazingly persistent in harsh environments, not only able to
survive, but even possibly grow, at temperatures from 0 to 10º C (Walker, 1990). In fact,
Junttila et al. (1988) reported on the ability of L. monocytogenes to grow within a range
of 1.7 ± 0.5º C. Similarly, the organism is quite persistent in desiccated environments,
simultaneously showing a high tolerance to salt (Vogel et al., 2010). These traits make L.
monocytogenes quite problematic for the food industry. Food plants have implemented
sanitation programs and manage control procedures through programs like Hazard
Analysis Critical Control Points (HACCP), but unforeseen variables may arise and
contamination may still occur. Sanitation programs are also not a complete guarantee that
the environment is sterile. Mutation and adaptation is widely known to occur in
organisms, possibly creating resistant or tolerant strains of bacteria. With regards to L.
monocytogenes, however, cleaning programs and good hygiene practices will promote a
safe and wholesome product. Great care has been taken since USDA-FSIS implemented a
zero-tolerance policy and required a reassessment of HACCP plans to address the
problem of L. monocytogenes to keep equipment clean, incoming product wholesome,
and workers sanitary (USDA-FSIS, 2003; USDA-FSIS Executive Summary, 2003;
USDA-FSIS, 2000).
ii. Listeria monocytogenes attachment on non-food surfaces
When a surface (food or non-food) is exposed to L. monocytogenes, pathogen cells are
quick to attach. Takhistov and George (2004) reported attachment of the pathogen to an
aluminum surface in as rapidly as three seconds, only increasing in a linear fashion for

14
the duration of their trials (a total of 300 seconds). More accumulation of cells on a
surface leads to formation of complex structures �– biofilms �– that aid in survival of
bacteria. It has also been reported that flagellar proteins aid in attachment of bacteria to
surfaces (Blaschek and Wang, 2007), and it stands to reason that a flagellated pathogen,
like L. monocytogenes, will readily attach to a surface under a variety of conditions.
After initial attachment of cells, more cells will begin to accumulate on the surface via
growth and repeated contact with new sources of contamination beginning formation of a
complex biofilm consisting primarily of polysaccharides, but also proteins, different
species of cells, and nucleic acids (Takhistov and George, 2004, Kalmokoff et al., 2001).
Accumulation and further growth not only helps anchor cells to a surface, but also serves
to grow the size of the biofilm and network of cells, and protect the cells from
environmental damage.
iii. Listeria monocytogenes survival on non-food surfaces
One avenue of food contamination that is often overlooked, however, may be
contamination of the material in which the food is packaged. Reports indicate that L.
monocytogenes can survive for many months in inactive food plants (Knøchel et al.,
2010), and that the pathogen is highly capable of forming biofilms on polyvinyl chloride
material (Takahashi et al., 2010). In light of this information, it is worthwhile to
investigate the duration of survival of L. monocytogenes in food residues that may be
present on common food packaging materials.
15
Marsh et al. (2003) investigated the structure in which L. monocytogenes persists on a
surface. The lattice formed by extracellular material differs slightly between different
strains of the pathogen, though published results confirm a complex matrix, which the
same investigators hypothesize may have structures that act as channels for water,
nutrients, and waste. This explanation holds merit in light of published data showing
survival of L. monocytogenes on surfaces well after nutrients are added to the
environment (M drala et al., 2003; Wulff et al., 2006; Vogel 2010). A complex network
to optimize contact with sparse nutrients and water, and easily remove waste products
will prolong the life of a cell under adverse conditions.
In addition to the physical structures that enhance survival of L. monocytogenes under
conditions that seem less than ideal, the pathogen has been demonstrated to not only
survive at refrigeration temperatures, but to grow (Walker et al., 1990). Rørvik et al.
(1991) demonstrated growth of the bacteria on smoked salmon under vacuum packaged
conditions at 4º C. L. monocytogenes populations grew from approximately 1 log
CFU/ml of rinsing water to nearly 4 to 6.5 log CFU/ml of rinsing water, or approximately
3 log CFU/ml of rinsing water to over 7 log CFU/ml of rinsing water over the course of 5
weeks of storage. In this particular study, the pathogen thrived in a nutrient-rich
environment despite the anaerobic and refrigerated conditions.
iv. Listeria monocytogenes cross-contamination
As mentioned previously, L. monocytogenes is able to persist in relatively inhospitable
environments. It forms biofilms (Vogel et al., 2010) and can last for extended periods of
16
time, even up to multiple years (Sauders et al., 2009, Tompkin, 2002). The possibility of
cross-contamination for longer periods of time past the initial contamination is not only
plausible but also likely. Work has been done in the past to investigate and control the
possibility of cross-contamination of food from workers, equipment, or other
contaminated food (Tompkin et al., 1999), but contamination on a packaging material
from food residue has never been investigated. Certain groups have researched the
attachment of L. monocytogenes on surfaces similar to packaging materials and food
contact surfaces, notably polyvinyl chloride and stainless steel (Lundén et al., 2006,
Takahashi et al., 2010). These studies report that persistent strains of the pathogen have a
very high propensity to adhere to food contact surfaces even after short contact times (1-2
h), and that initial adherence to a surface greatly impacts the ability for a contaminating
bacterium to form biofim, especially if death of the cells is not immediate. This provides
a foundation for the investigation, but no studies investigating the overall persistence of
the organism on materials used for meat packaging exist.
Cross-contamination affecting consumers may be a result of excessive handling by a
contaminated individual, storage in a contaminated display case, or leaking purge
containing L. monocytogenes onto previously uncontaminated packages, leading to a
reservoir of pathogenic bacteria and possible biofilm formation. Biofilm presence is a
very real danger to the food industry, as large numbers of pathogens become concentrated
near food processing or storage areas and subsequently offer opportunities for cross-
contamination (Sauders et al., 2009; Kalmokoff et al., 2001) via direct contact or rinsing
and cleaning. This ability is a likely mechanism by which L. monocytogenes persists and

17
continues to cross-contaminate food. These possibilities, therefore, necessitate
investigation of more avenues of pathogenic harboring and cross-contamination, such as
materials used in the storage, shipment, and sales of meat products.
Therefore, the purpose of the studies reported in this thesis was, in part, to evaluate the
survival of L. monocytogenes on food packaging materials soiled with a food matrix
containing the pathogen. The aim was to simulate storage in a setting typical of either a
retail establishment or a household, therefore materials selected evaluated were those
commonly used in food packaging. In addition, antimicrobial interventions were not
applied to the samples. Ideally, it would be possible to simulate storage of a contaminated
package for the entirety of the survival of the pathogen, though the pathogen survived for
much longer than anticipated, meaning that only a roughly four-month window of time
for the behavior of the pathogen was shown. Through extended sampling, a general idea
of the survival rate of L. monocytogenes at different temperatures, initial populations, and
inoculated on different materials was developed. The design of the experiment was such
that the contamination was similar to what would occur naturally if a package holding
purge contaminated with L. monocytogenes leaked onto an adjacent package, or if a
person with hands soiled with organic material containing the pathogen touched an
otherwise clean package of food.
v. Public health interest in Escherichia coli O157:H7
In 1993, undercooked ground beef patties contaminated with E. coli O157:H7 purchased
from Jack in the Box restaurants caused three children to develop HUS and die soon

18
thereafter; a fourth child also died through person-to-person transmission. Because the
pathogen has become a household name and constant concern for processors, retailers,
and consumers, investigation of sources and avenues of contamination is necessary.
vi. Attachment and biofilm formation of Escherichia coli O157:H7
Escherichia coli O157:H7 has been known as a causative agent for illness since the early
1980s (Riley et al., 1983). The prevalence of the organism and mechanisms by which it
survives, thrives, is transmitted, and infects the host, have become much more understood
through continued research of the pathogen. For instance, in the meat production and
processing chain, one of the most plausible ways of product contamination is from a fecal
source during hide removal and evisceration of beef animals (Woerner et al., 2006). In
light of this, FSIS has issued a zero-tolerance policy (Directive 6420.2) for visible fecal
contamination on carcasses and slaughter facilities implement practices intended to limit
exposure of product to soiled hides and gastrointestinal tracts.
Aside from the physical nature of fecal contamination on beef carcasses, E. coli O157:H7
is able to attach to surfaces independently of fecal mass. The O antigen has been
reported to play a role in the attachment of the pathogen to food surfaces due to increased
electronegativity, especially to lettuce leaves (Boyer et al., 2011). The results from the
study by Boyer et al. (2011) suggest that pathogenic strains of E. coli (with O antigen) are
more apt to adhere to food surfaces than non-pathogenic strains. Boyer et al. (2011)
showed that the presence of the O157 antigen lends a slightly less negative overall charge
to the bacteria, subsequently leading to greater attachment to food surfaces compared to
19
non-pathogenic E. coli (Boyer et al., 2011). E. coli O157:H7 is also able to survive for
extended periods of time in mixed-culture biofilms (Uhlich et al., 2008). In addition,
presence of a meat-based soil on food contact surfaces greatly enhances the propensity of
E. coli O157:H7 to form biofilms that enhance growth, survival, and resistance to
cleaning efforts (Skandamis et al., 2008). This information is of special importance, as
food-based soil may contain a large number of non-pathogenic ubiquitous organisms,
assisting E. coli O157:H7 in survival through conditions normally more inhospitable to
survival. For these reasons, attachment and biofilm formation of E. coli O157:H7 should
be discussed simultaneously. Food soiling matrices and non-E. coli bacterial biofilm
production has the propensity to assist with the attachment of pathogenic bacteria on food
and food-contact surfaces.
vii. Survival of Escherichia coli O157:H7
In addition to survival in fecal contamination, E. coli is able to survive in a plethora of
environmental conditions. Recent outbreaks have linked pathogenic serotypes to leafy
greens, and research shows that the organism is able to survive in soil and other
environments less hospitable than a gastrointestinal tract (Semenov et al., 2011; van Elsas
et al., 2011). Though not a spore-former, the pathogen has the ability to survive for
extended periods of time without ideal growth or proliferation conditions (Møretrø et al.,
2010). E. coli has been reported to enter a �“stationary phase�” during starvation or high-
stress conditions, as cells are reportedly able to survive by using available energy and
nutrients on maintenance of the cell membrane and DNA structure rather than growth
(Hengge-Aronis, 1993). It is of special interest with regards to public health to consider
20
that the pathogen possesses specific pathways to preserve cell life under environmental
distress.
viii. Cross-contamination with Escherichia coli O157:H7
Long-term survival suggests an ability for the bacteria to cross-contaminate product long
after a surface has been considered clean. Bacteria can be introduced to clean food, food
contact surfaces, or the environment via improper worker hygiene, contact with a
previously contaminated surface, or contact with other food contaminated with
pathogens. E. coli O157:H7 has also been found to survive cleaning and sanitizing
(Marouani-Gadri et al., 2010). Most importantly, E. coli O157:H7 possesses an ability to
attach to food and non-food surfaces (Boyer et al., 2011; Torres et al., 2005).
Considering the knowledge of attachment and biofilm formation with the understanding
that metabolic pathways and extracellular structures are able to preserve the pathogen for
extended periods of time, it stands to reason that sporadic colonies of E. coli O157:H7
can serve as sources of cross-contamination.
Cassin et al. (1998) published a risk assessment of E. coli O157:H7 dose levels in ground
beef. Using a Poisson process, the authors concluded that, at the time of the study,
approximately 2.9% of packages of ground beef could be expected to contain any
population of E. coli O157:H7. Contamination levels were predicted to be quite small
(generally 2 log CFU/pkg), though infective dose is possibly not very high for the
pathogen (as low as 1 to 100 organisms) (Paton and Paton, 1998; Cassin et al., 1998;
Tuttle et al., 1999). What is important to note in the Cassin et al. study, though, is that
21
the only vehicle investigated for transmission of the pathogen from evisceration to
commercial product was the beef itself. Since we know E. coli O157:H7 is able to
survive on a variety of surfaces like soil, feces, stainless steel, and PVC (Torres et al.,
2005; Marouani-Gadri et al., 2010; Møretrø et al., 2010; Wilks et al., 2005), we should
operate under the assumption that contamination of food products can arise from food
contact surfaces, food service workers, and food storage as well as the food itself.
E. coli O157:H7 is one serotype of a select group of STECs (shigatoxin producing E.
coli) that is responsible for severe gastroenteritis and possible complications with kidney
function. STEC contamination generally arises from a fecal reservoir in live animals and
may affect consumers, whether from contaminated meat, produce, or water (Viazis et al.,
2011). Cross-contamination occurs when a product contacts the pathogen and is not
properly cleaned or processed afterwards. This is not to say that E. coli O157:H7
infection occurs only by eating fecal particulates, but that fecal contamination is usually
the original source of the pathogen.
Since different studies confirm that E. coli O157:H7 is able to survive for extended
periods outside of a GI tract (Torres et al., 2005; Marouani-Gadri et al., 2010; Møretrø et
al., 2010; Wilks et al., 2005), it is worthwhile to consider all reservoirs of contamination.
In addition to contaminated food products, food contact surfaces are also treated as
potential sources of cross contamination when drafting HACCP plans or implementing
sanitation standard operating procedures (SSOPs). In addition to regular antimicrobial
sanitation measures in food processing facilities, HACCP plans also frequently require a

22
high quality starting product. This could be validated by audits of microbiological
performance standards and checked with letters of guarantee.
Due to the nature of meat packing and retail, packaging materials are subject to frequent
handling by employees or consumers as well as contact with other packages of product.
With knowledge that, under relatively commonplace circumstances, E. coli O157:H7 can
persist at detectable levels, the question of microbiological survival on soiled food
packaging materials is one that warrants investigation. Consumer contact with food
packaging materials is almost a necessity during consumption of a product, therefore
simulating a scenario in which food packaging materials were contaminated with E. coli
O157:H7 and meat exudate was devised. The goal of studies, therefore, was to investigate
persistence of E. coli O157:H7 on soiled food packaging materials and identify factors in
food storage that promote or inhibit survival of the pathogen.
III. Resistance of Salmonella to antimicrobials
i. Salmonella prevalence in food supply
Salmonella is found readily in livestock including chicken, turkey, beef animals, and
swine (USDA, 2010). Fecal contamination, as is the case with most enteric pathogens,
has been identified as a major source of Salmonella (Bacon et al., 2002). The USDA-
FSIS enforces a zero-tolerance policy for visible fecal contamination on carcasses,
aiming to minimize the exposure of meat products to enteric pathogens harbored in the
GI tract of food animals (USDA-FSIS Directive 6420.2). Even with interventions
applied to reduce microbiological loads from soiled hides, Salmonella serotypes continue

23
to be found in ground beef (Arthur et al., 2008). Even with a zero-tolerance policy for
visible fecal contamination, complete sterility of food is not certain. Salmonella can be
introduced to meat from a meat animal carcass contaminated with ruptured GI tract
contents, contact with a hide soiled with fecal material, contact with contaminated
equipment or workers, or contact with contaminated trimmings stored in the same
container (Arthur et al., 2008; Smeltzer et al., 1980). In addition, due to the comminuted
nature of ground beef, lymph material may also be present in final products, as suggested
by Arthur et al. (2008).
ii. Multi-drug resistant Salmonella strains
Salmonella is especially of note due to a rise in antibiotic resistance among pathogenic
serotypes. Though many pathogens can be controlled or remedied through therapeutic
antibiotics, certain serotypes of Salmonella carry genetic modifications that encode for
antibiotic resistance (Andrews and Bäumler, 2005). It has been suggested that extensive
use of antibiotics in modern medicine and food production has led to strains that, while
not necessarily more pathogenic or lethal, are more difficult to control when present in a
food supply (Rabsch et al., 2001). Concern has existed as to whether these antibiotic-
resistant strains are less susceptible to common food processing antimicrobials than
antibiotic-sensitive strains, especially as incidence of illness as a result of these strains
has increased in recent years (Zansky et al., 2002). This is unlikely, though, as the genes
encoding for resistance in the pathogen are not virulence genes but rather a common
genetic trait shared between clones of the same strain (Andrews and Bäumler, 2005).
Regardless of the genetics of multi-drug resistance, infections with these strains are

24
occurring with greater frequency, and hygiene theory signals that increased use of
antibiotics in the food production and processing industry could increase the amount and
variety of drug-resistant strains of Salmonella.
iii. Threats posed by Salmonella serotypes
Foodborne pathogens are of great concern in the modern food industry, and Salmonella
serovars alone are estimated to cost the United States nearly three billion dollars annually
(USDA, 2010). Since 1984, the CDC has reported hundreds of outbreaks, resulting in
thousands of confirmed cases of salmonellosis (Centers for Disease Control and
Prevention, OutbreakNet). Also alarming is that nearly 50% of Salmonella strains
collected from food plants are resistant to one or more antibiotics (Kiessling et al., 2002).
As is the case with any possible foodborne contaminant, HACCP plans and SSOPs are in
place to attempt to curtail the possibility of outbreaks. Many of the interventions in
HACCP plans involve antimicrobial compounds ranging from organic acids like lactic
acid to chlorine-based detergents, applied both to the food contact surfaces and the food
itself. Arthur et al. (2008) explains that multi-drug resistant (MDR) strains of Salmonella
are the most problematic pathogens in the Salmonella genus. Leyer and Johnson (1993)
show that some Salmonella serotypes are able to persist in adverse environments longer
when adapted to environmental stresses, such as cleaning agents, heat, or cold. Because
of this, Salmonella serotypes that have been shown to be resistant to antibiotics may be
resistant to antimicrobial interventions applied to beef trimmings in meat processing
facilities.

25
iv. Control of Salmonella serovars
Commercial antimicrobials are often used for control of foodborne pathogens and other
microbes on meat carcasses, primal cuts, and trimmings. Validation studies have been
published detailing the effects of antimicrobials on the survival of E. coli O157:H7 and
other bacteria on beef surfaces (Arthur et al., 2008; Gill et al., 2004; Pohlman et al., 2009;
Quilo et al., 2010), specifically detailing, in addition to lactic acid, the effects of acidified
sodium chlorite, peroxyacetic acid, or sodium metasilicate. With a wealth of knowledge
concerning resistance or susceptibility of E. coli O157:H7 to these antimicrobials, it is
necessary to explore any possible differences between a well-documented pathogen (E.
coli O157:H7) and Salmonella serovars, which, as detailed earlier, may be responsible for
over one million cases of foodborne illness per year in the United States of America
(Scallan et al., 2011). Most of this work, however, involves sampling of beef tissue at a
carcass level, as is the case in Arthur et al. (2008). Behavior of E. coli O157:H7 and
Salmonella serotypes in beef trimmings, especially when treated with commonly used
antimicrobials, is of pressing interest. Investigating any similarities or differences
between the two distinct pathogens has the possibility to change how Salmonella is
controlled during beef processing.
IV. Overview of select antimicrobials available for use in beef trim grinding operations
i. Acidified sodium chlorite
Acidified sodium chlorite (ASC) is an FDA-approved antimicrobial that consists of
sodium chlorite suspended in solution with its conjugate acid (Hajmeer et al., 2004). ASC
is also kosher-certified, allowing for more versatility and widespread use in different

26
aspects of meat production. Hajmeer et al. also reports that ASC is effective in reducing
E. coli O157:H7 on beef briskets when applied by spraying. Using a concentration of
0.1% ASC and applied for up to 60s, E. coli O157:H7 populations were reduced by up to
1.6 log CFU/cm2 of beef brisket (Hajmeer et al., 2004). These studies are limited,
however, as the pathogen was only inoculated on beef brisket surfaces, not trim. Other
studies have investigated the action of the intervention on beef used for trimmings,
reporting effective reduction of bacteria through their application, though slight quality
issues arose regarding the final product�’s sensory characteristics and aerobic bacteria
population (Ransom et al., 2003; Quilo et al., 2009). While the antimicrobial has been
demonstrated to be effective in controlling pathogenic populations on beef carcass
surfaces, effective treatment of beef trim with antimicrobials has not been investigated
fully.
ii. Peroxyacetic acid
Peroxyacetic acid (PAA) is an oxidizer (Rossoni and Gaylarde, 2000). It is an acidic
antimicrobial that is made in solution from acetic acid and hydrogen peroxide, both of
which are hostile to bacterial survival on their own. King et al. (2005) reports that PAA is
effective at reducing populations of E. coli O157:H7 and Salmonella on carcass surfaces,
but due to the unstable nature of the solution, the antimicrobial has an effective time span
of only a few minutes (Quilo et al., 2009). The National Organic Standards Board, under
the USDA, reports that acetic acid and hydrogen peroxide are the primary products of the
decomposition of PAA, and is therefore available for use in food systems, as both
compounds are fairly benign (National Organic Standards Board, 2009). In addition to
27
this, it has been demonstrated that PAA is effective in reducing Salmonella counts in
ground beef by nearly 2 log CFU/g initially while maintaining desirable sensory
characteristics (Pohlman et al., 2007). However, as previously mentioned, certain multi-
drug resistant strains of Salmonella may have developed resistance to antimicrobials
(Arthur et al., 2008). Because certain serotypes of Salmonella may be resistant to
antimicrobials, and because the effect of the aforementioned antimicrobials is not well-
documented in ground beef or beef trimmings, further investigation of the pathogen
under these unknown circumstances is warranted.
iii. Sodium metasilicate
Sodium metasilicate (NMS) is a basic antimicrobial available for use in beef systems and
noted for its effectiveness in controlling E. coli O157:H7 (Weber et al., 2004; Quilo et al.,
2010; Quilo et al., 2009; Byelashov et al., 2010). Pohlman et al. (2007) reports that NMS
is immediately as effective as PAA and ASC in reducing Salmonella populations in
ground beef. As a strong alkali agent, pH of a solution may range from 11.3 to 12.7
(Weber et al, 2004). NMS is also is classified as generally recognized as safe (GRAS) by
the U.S. Food and Drug Administration (FDA) (21 CFR 184.1769a).
Because the possibilities for this decontaminating antimicrobial are extensive, it is used
in the meat and poultry industries (USDA-FSIS, 2009). What is not detailed, though, is
whether or not there exists a difference between E. coli O157:H7 and multi-drug resistant
and susceptible Salmonella serotypes with regards to sensitivity to sodium metasilicate.

28
Since multi-drug resistant Salmonella strains have been shown to be prevalent in food
products available to consumers (Antunes et al., 2003), investigation is warranted to
identify any pathogenic serotypes that are more resistant to common antimicrobial
treatments.

29
Chapter 3: Survival of Listeria monocytogenes on common food packaging materials
soiled with antimicrobial-free ham residue
Chapter Overview
Sporadic and outbreak cases of foodborne illness due to Listeria monocytogenes are
predominantly associated with ready-to-eat foods. Contamination of such foods with the
pathogen may occur during processing, distribution, food preparation activities, and from
other potential sources. This study evaluated survival of L. monocytogenes in food
residues on the outside of various materials commonly associated with food packaging.
Samples (5×5 cm) of aluminum foil, butcher paper, cardboard, deli wax paper, paper
grocery bags, plastic grocery bags, PVC overwrap film, and vacuum plastic bags were
spot-inoculated (0.5 ml) with a ham homogenate (simulating contaminated purge)
containing a 5-strain mixture of L. monocytogenes (4.9±0.2 log CFU/cm2 or 2.1 ± 0.2 log
CFU/cm2). Inoculated packaging materials were stored for up to 123 days aerobically in
sterile petri dishes at 4°C or 25°C, and periodically analyzed for L. monocytogenes
(PALCAM agar) and total bacterial populations (tryptic soy agar with 0.6% yeast
extract). The experiment was repeated twice with three samples analyzed at each
sampling point. Even though L. monocytogenes populations in the ham homogenate
residue gradually decreased on all packaging materials at either inoculation level during
storage at 4 or 25°C, survivors (<0.2-3.2 log CFU/cm2) were obtained on most of the
tested materials with the high inoculation level even at 123 days of storage. Materials at
25°C with pathogen counts >1 log CFU/cm2 at the end of storage included aluminum foil,
30
butcher paper and plastic bags (3.2±0.5, 2.3±0.5 and 1.6±0.9 log CFU/cm2, respectively);
corresponding pathogen counts on these materials stored at 4°C were 1.8±1.0, 1.3±1.2
and 2.4±1.0 log CFU/cm2, respectively. L. monocytogenes counts reached non-detectable
levels (<-0.1 log CFU/cm2) on cardboard and paper bag samples on day-95 and day-123,
respectively, of storage at 25°C. When L. monocytogenes was inoculated at a level of
approximately 2 log CFU/cm2, populations on cardboard box material, deli wax paper,
and paper bag material were detectable for up to 81 days before decreasing below the
detection limit. L. monocytogenes populations on aluminum foil only decreased to 1.9 ±
2.2 log CFU/cm2, almost no reduction from the initial value. The 4º C temperature was
less hospitable to the pathogen, with no materials harboring survivors for the full time
allotted for the study. Under these conditions, populations on PVC overwrap film
decreased below the detection limit by 4 days of storage, the most rapid death of the
pathogen under any condition tested in the study. Even aluminum foil, plastic bag
material, and vacuum pouch material, all yielded populations near the detection limit on
day 123 of storage. The population on aluminum foil was 0.0 ± 0.1 log CFU/cm2 at the
end of storage, with populations on plastic bag and vacuum pouch materials at 0.1 ± 0.3
and 0.5 ± 0.5 log CFU/cm2, respectively. Sampling was discontinued for materials that
had counts below the detection limit for at least two consecutive sampling dates. The
results of the study indicated that L. monocytogenes present in contaminated food
residues may survive on the outside of used food packaging materials for long periods of
time and, thus, potentially serve as a source of cross-contamination.

31
I. Introduction
Scallan et al. (2011) reported that Listeria monocytogenes is the causative agent of nearly
1,500 cases of foodborne illnesses and an estimated 255 deaths per year in the United
States. In addition to the presence of this pathogen in processed foods, it is also reported
that L. monocytogenes is able to survive under highly adverse conditions, such as near-
freezing temperatures (0-1º C) and lowered water activity (0.91-0.93) (Knøchel, 2010).
Though systematic approaches, like multiple antimicrobial hurdles, exist to combat the
presence of pathogens in the food supply, once the product leaves a processing facility,
wholesomeness is not governed by a processor�’s sanitation program. Because a product
is not kept within the food safety parameters of the processor, possibility of post-
processing contamination in retail establishments or home kitchens exist, both of which
present a threat to consumer safety. Studies conducted show an alarming presence of
persistent L. monocytogenes strains in retail establishments, namely supermarket deli
operations (Sauders et al., 2009). Such persistence may be attributed partially to strain
genetics, but it is also likely that biofilm formation and food soiling may be factors in the
persistence of the pathogen. Biofilms are known to form readily in the presence of food
soiling, and function to protect pathogenic organisms from physical removal, as well as
some sanitizers (Gram et al., 2007; Riazi and Matthews, 2011).
Frequent handling of the exterior of food packaging materials may serve as a source for
cross-contamination of otherwise safe food products. A general lack of education,
coupled with the hardiness of L. monocytogenes and its ability to cross-contaminate

32
processed food products, necessitates research into the ability and time frame of survival
under common retail case or home kitchen storage environments.
To this date, while pulse-field gel electrophoresis (PFGE) and molecular assays have
been conducted to detect L. monocytogenes in the environment (Clark et al., 2010; Autio
et al., 2003; Williams et al., 2011), very little work has been done to evaluate survival of
the pathogen on soiled food packaging materials. Prior to the onset of the study,
expectations were that low levels of pathogenic organisms would be able to survive for
an extended period of time, though possibly injured or otherwise damaged due to
desiccation and starvation conditions, since literature indicates that, under specific
conditions, L. monocytogenes is able to survive in frozen food environments for up to 300
days (Gianfranceschi and Aureli, 1996), in meat processing plants for up to 12 years
(Tompkin, 2002), and has been found in processed meats manufactured with
antimicrobials for up to 11 weeks under vacuum storage (Ingham et al., 2004). This
reinforces knowledge that simple control of temperature is not a foolproof means by
which to control presence of the pathogen. With this information in mind, the objective
of this study was to quantify the survival of L. monocytogenes on the outside of various
food packaging materials soiled with ham purge, inoculated at different levels, and stored
at two temperatures.

33
II. Materials and Methods
i. Strains and inoculum preparation
Five strains of the pathogen (J1-177 (human isolate, serotype 1/2b), C1-056 (human
isolate, serotype 1/2a), N3-013 (food isolate, serotype 4b), N1-227 (food isolate, serotype
4b), and R2-499 (food isolate, serotype 1/2a)) were obtained with special thanks to Dr.
Wiedmann (Cornell University), and individual colonies were isolated via streak plating
on PALCAM agar (Becton, Dickinson & Company, Sparks, MD). A single colony from
each strain was activated in 10 ml trypic soy broth (TSB; Becton, Dickinson & Company,
Sparks, MD) by incubation at 30°C for 24 hours. After incubation, 100 l of culture was
pipetted into fresh TSB tubes and incubated again for 20-24 hours. Sterile �“ham
homogenate�” was made by using 10% ham (prepared without addition of antimicrobials,
Cooked Ham Lean, Water Added) and 90% distilled water. The mixture was masticated
for 120 seconds at 6 strokes per second (IUL Instruments, S.A. Barcelona, Spain,
Masticator Silver-Paddle Blender), subsequently strained through a cheesecloth, then
autoclaved for sterility (Yang et al., 2009). Cell pellets were individually centrifuged for
15 minutes (Eppendorf 5810 R, 4° C, 4,629 x g), and the supernatant was discarded. Cell
pellets were resuspended in 10 ml Phosphate Buffered Saline (pH 7.4, 0.2 g KH2PO4, 1.5
g Na2HPO4 7H2O, 8.0 g NaCl, .2 g KCl per liter dH2O: Fisher Scientific, Fair Lawn,
MO) and centrifuged for an additional 15 minutes. Finally, each strain was resuspended
in 10 ml of the sterile ham homogenate (pH 6.46) and stored for 72 hours at 4°C to
habituate cell cultures to an environment typical of food stored in a refrigerator or cooler.
34
ii. Packaging material sample preparation
Eight materials commonly associated with food packaging and handling were selected for
investigation: butcher paper (Kold-Lok, Georgia-Pacific, Norwalk, CT), cardboard
(Donated by Colorado Premium, Greeley, CO), deli paper (Dispens-a-wax® Deli Patty
Paper, Georgia Pacific, Dixie Business, Norwalk, CT), aluminum foil (Foodservice Foil,
Bakers & Chefs, Sam�’s West, Inc., Bentonville, AR), PVC overwrap film (Prime Source
Crystal Clear PVC Wrapping Film, International Paper Co., N. Kansas City, MO), paper
grocery bag (4# Kraft Bags, Duro Bag Mfg. Co., Ludlow, KY), plastic grocery bag
(Carry Out Bag, Poly-America, Grand Prarie, TX), and vacuum plastic storage bag
(Prime Source Vacuum Pouch, 3 mil STD barrier, International Paper Co., N. Kansas
City, MO). Prior to inoculation, each material was cut into 5 cm x 5 cm samples which
were placed in sterile empty petri dishes (Polystyrene Petri Dish, Fisher Scientific,
Pittsburgh, PA).
iii. Inoculation
To inoculate the packaging material samples, cell culture inoculum was diluted in sterile
containers of sterile ham homogenate, prepared in the same manner as described earlier.
Under a biosafety cabinet, 500 µl of ham homogenate containing L. monocytogenes was
spot-inoculated without spreading in the center of each packaging material sample,
covered, and placed immediately in an incubator set at either 4 or 25º C (25º C, 13.13 ±
0.64% RH; 4º C, 37.33 ± 1.78% RH).

35
iv. Sampling and analysis
In order to quantify the microbial population persisting on each inoculated packaging
material sample, a random selection of three samples of each material were removed
from their respective incubators immediately prior to testing. An aliquot of 20 ml of
Maximum Recovery Diluent (MRD; Becton, Dickinson & Company, Sparks, MD) were
added to Whirl-Pak® bags (Nasco, 18oz.). Samples were aseptically removed from petri
dishes, placed into bags, and masticated for 120 seconds at six strokes per second (IUL
Instruments, S.A. Barcelona, Spain, Masticator Silver-Paddle Blender). Homogenized
sample material was pipetted out, serial dilutions were made in 0.1% buffered peptone
water (Difco, Becton and Dickinson, Franklin Lakes, NJ), and liquid was spread plated
onto both selective media (PALCAM) and non-selective media (TSA+YE �– 40 g Tryptic
Soy Agar, Acumedia; 6 g Yeast Extract �– Acumedia per 1 L distilled water: Neogen
Corp., Lansing, MI). PALCAM plates were incubated at 30° C for 48 hours and colonies
were counted, while TSAYE plates were incubated at 25° C for 72 hours and colonies
were subsequently counted. Sampling procedures were repeated regularly, as materials
were sampled weekly until 39 days of storage time, then every other week until 123 days
of storage.
v. Statistical analysis
The experiment was repeated in duplicate, yielding a total of six samples of each material
at each temperature and inoculation level for each sampling point. Colony counts were
converted into log CFU/cm2, and were analyzed for a replication effect using the Proc
Mixed program of SAS with a Tukey-adjusted analysis of variance to separate the least

36
square means of the population counts for each replication (Version 9.2, SAS, Inc., Cary,
NC).
Population data from both replicates were subsequently analyzed with GInaFiT, a
freeware add-in for Microsoft Excel 2007 developed by Geeraerd et al. (2005). Using
microbiological inactivation formulas from previous studies, including Cerf (1977), the
add-in is able to fit curves to population data in Excel and generate numerical parameters
for the rates of inactivation to quantify the behavior of bacterial populations. This
freeware module allows a user to fit multiple different models of curves to logarithmic
population data, which have been published in papers dating back to 1920. Goodness-of-
fit values (R-squared) are given for each curve. A biphasic model (Cerf, 1977)
consistently yielded the highest R-squared values for each curve. Biphasic models fit
curves using the formula log10(N)=log10(N0)+log10(f*exp(-kmax1*t)+(1-f)*exp(-
kmax2*t)) where log10(N0) is the log CFU/cm2 initial population (day 0 sampling data
for each treatment), f is in essence the percentage of the population that is shown to
behave in a manner consistent with the fit curve, kmax1 and kmax2 are the �“specific
inactivation rates of the two populations, respectively (Geeraerd et al., 2005). Therefore,
kmax1 describes the inactivation rate (1/time unit) of the cells that die initially, whereas
kmax2 describes the inactivation rate of cells that persist for a longer time. The higher
the kmax value is, the more rapid the death during that phase of the study will be.
Therefore, the values may be thought of as descriptors of the slope of the curve �– larger
values indicate more rapid death.

37
III. Results
i. General Trends
When survivor counts on PALCAM and TSAYE plates of high initial inoculation were
analyzed statistically, a replication effect (P < 0.05) was discovered in most treatments
(Appendix Tables 1 and 2). A significant (P < 0.05) replication effect was also present in
low initial contamination counts detected on selective and non-selective media (Appendix
Tables 3 and 4). Though significant replication effects were present in a range of the
individual treatments, death of L. monocytogenes was present in both replications
(Appendix Tables 5, 6, and 7). Because trends are similar, further analysis of pathogen
survival may still be appropriate for risk assessment.
Significant differences (P < 0.05) of replication effects in most of the treatments were not
entirely unexpected considering the variation in population data obtained. Differences
are not surprising, considering conditions of the study and behavior of bacteria in difficult
environments. Because of this inherent variation, the survivor data are presented as
overall survivor trends and comparisons of fitted curves (Geeraerd et al., 2005) can be
made using the GInaFiT freeware module for Microsoft Excel. Using values generated
by GInaFiT, evaluation of different treatments is possible simply by comparing kmax
values (a value expressing population persistence in a unit of 1/day), similar to the
comparison published by Janssen et al. (2005). This biphasic model was selected for
analysis because R-squared values were consistently the highest with regards to the data.
Compared with analysis of data in later chapters of this work, the biphasic model (Cerf,
1977) was most appropriate for the data, indicated by R-squared values. In addition, data

38
show a pronounced biphasic decrease in population on most materials (Figures 1.1
through 1.8) where an initial decrease in population is followed by a prolonged period of
persistence. Not every pathogen can be described in an identical fashion though, which is
to be expected.
In addition to survival of L. monocytogenes, total aerobic bacterial survival followed the
trends of the pathogen very closely. Because a sterile meat homogenate was used for
inoculation, it was expected that bacteria recovered on each medium would be very
similar. Cardboard box material was an exception, harboring nearly 3 log CFU/cm2 of
yeasts and molds (organisms able to survive in low water activity environments) which
was present on the material at the onset of the study, regardless of temperature and
inoculation levels. These organisms may have had an effect on survival of L.
monocytogenes, though the pathogen was still able to persist for many days without rapid
death on the material.
ii. Survival of L. monocytogenes on soiled food packaging material inoculated with a
high initial level and stored at 25º C
When packaging material samples were inoculated at a level near 5 log CFU/cm2 and
were stored at 25º C, only cardboard box and paper bag materials reached populations
consistently near the detection limit (-0.1 log CFU/cm2) by the 95th day of storage. It is
evident from the data (Figure 1.1) that for as long as 25 days of storage, cardboard box,
paper bag material, and PVC overwrap film allowed survival of L. monocytogenes, while
survival on aluminum foil, butcher paper, and plastic bag material was even greater (see

39
Appendix Table 5 for combined data results, and Appendix Tables 6 and 7 for individual
replicate results, while Table 8 shows total aerobic plate counts and Tables 9 and 10 show
individual replicates). In contrast, average counts of L. monocytogenes on aluminum foil
under these conditions decreased by less than 2 log CFU/cm2 for the duration of the study
(Figure 1.1). The populations on the remaining soiled packaging materials decreased at a
fairly similar rate throughout the study. By 67 days of storage, large changes in surviving
levels of pathogens on contaminated packaging material (with the possible exception of
populations inoculated on vacuum pouch material and PVC overwrap film) had stopped,
and most populations appeared to be persisting or decreasing in a very consistent manner.
Total aerobic bacteria counts behaved similarly (Figure 1.2). Though data will show that
overall numbers of total bacteria are greater than numbers of L. monocytogenes
(Appendix Tables 5 and 8), trends remained the same. In addition, nonselective media is
able to foster growth of background contamination, possibly arising from bacteria already
persisting on the packaging material.
Biphasic curve analysis of the data (Table 1.1) indicated that surviving counts on
cardboard box material and paper bag material exhibited the highest kmax1 values
(1.05/day and 0.18/day, respectively), while aluminum foil exhibited the smallest kmax1
values (0.03/day). The kmax refers to the inactivation rate (1/day) on a reduction curve
used to describe the behavior of a pathogen, so that higher kmax values indicate more
rapid death. In addition, 4-D reduction in counts was not reached on aluminum foil,
butcher paper, cardboard box, and plastic bag material. It should be concluded, therefore,
that when stored at 25º C and inoculated at a level of approximately 5 log CFU/cm2, L.

40
monocytogenes was able to persist and survive best on soiled aluminum foil, butcher
paper, and plastic bag material - evidenced by little to no initial reduction in population
followed by a mild reduction in the second phase of the biphasic curve.
In contrast, the environment of cardboard box material was more lethal to L.
monocytogenes than all other materials, as it had the highest kmax1 value, 1.05,
indicating that death was quite abrupt. Though the kmax2 value was fairly low
(0.06/day), the vast majority of L. monocytogenes died more rapidly on cardboard than on
any other material. Based on this, it may be concluded that soiled cardboard box material
and paper bag material were the least hospitable to L. monocytogenes, while soiled
aluminum foil and butcher paper were the least lethal to the pathogen. Regardless of
variations and differences observed among packaging materials and time of storage, the
important point is that the pathogen was able to survive for long periods of time in meat
product residues placed on several food packaging materials stored at room temperature.

41
Figure 1.1 - Listeria monocytogenes survival (log CFU/cm2) on food packaging materials soiled with antimicrobial-free ham homogenate inoculated with approximately 5 log CFU/cm2 of L. monocytogenes and stored at 25º C for up to 123 days (Data in Appendix Table 5)
Figure 1.2 �– Total aerobic bacteria survival (log CFU/cm2) on food packaging materials soiled with antimicrobial-free ham homogenate inoculated with approximately 5 log CFU/cm2 of L. monocytogenes and stored at 25º C for up to 123 days (Data in Appendix Table 8)
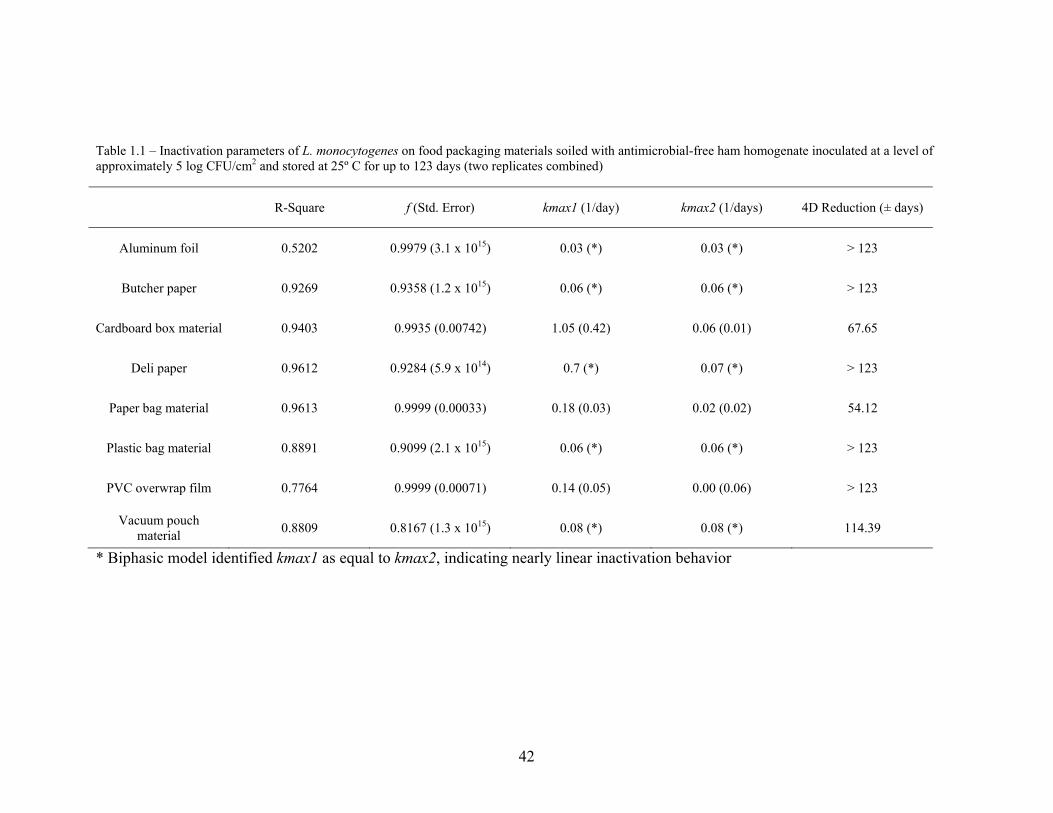
42
Table 1.1 �– Inactivation parameters of L. monocytogenes on food packaging materials soiled with antimicrobial-free ham homogenate inoculated at a level of approximately 5 log CFU/cm2 and stored at 25º C for up to 123 days (two replicates combined)
R-Square f (Std. Error) kmax1 (1/day) kmax2 (1/days) 4D Reduction (± days)
Aluminum foil 0.5202 0.9979 (3.1 x 10¹⁵) 0.03 (*) 0.03 (*) > 123
Butcher paper 0.9269 0.9358 (1.2 x 10¹⁵) 0.06 (*) 0.06 (*) > 123
Cardboard box material 0.9403 0.9935 (0.00742) 1.05 (0.42) 0.06 (0.01) 67.65
Deli paper 0.9612 0.9284 (5.9 x 10¹⁴) 0.7 (*) 0.07 (*) > 123
Paper bag material 0.9613 0.9999 (0.00033) 0.18 (0.03) 0.02 (0.02) 54.12
Plastic bag material 0.8891 0.9099 (2.1 x 10¹⁵) 0.06 (*) 0.06 (*) > 123
PVC overwrap film 0.7764 0.9999 (0.00071) 0.14 (0.05) 0.00 (0.06) > 123
Vacuum pouch material 0.8809 0.8167 (1.3 x 10¹⁵) 0.08 (*) 0.08 (*) 114.39
* Biphasic model identified kmax1 as equal to kmax2, indicating nearly linear inactivation behavior

43
Table 1.2 - Inactivation parameters of L. monocytogenes on food packaging materials soiled with antimicrobial-free ham homogenate inoculated at a level of approximately 5 log CFU/cm2 and stored at 25º C for up to 123 days (two individual replicates)
R-Square f value kmax1 (1/day) kmax2 (1/day) 4D Reduction (± days) Rep1 Rep2 Rep1 Rep2 Rep1 Rep2 Rep1 Rep2 Rep1 Rep2
Aluminum Foil 0.4237 0.4319 0.9811
(3.1x10¹⁵) 0.9766 (3.6x10¹⁵)
0.03 (6.7x10⁵)
0.03 (9.7x10⁵)
0.03 (3.5x10⁷)
0.03 (4.1x10⁷) > 123 > 123
Butcher Paper 0.9269 0.8783 0.9358
(1.2x10¹⁵) 0.9413 (9.0x10¹⁴)
0.06 (4.2x10⁵)
0.05 (2.3x10⁵)
0.06 (6.1x10⁶)
0.05 (3.7x10⁶) > 123 > 123
Cardboard Box Material
0.9591 0.8831 0.9967 (0.00302)
0.9999 (0.00019)
0.95 (0.030) 0.21 (0.04) 0.05 (0.01) 0.02 (0.03) 65.19 45.51
Deli Wax Paper 0.8627 0.9466 0.9987
(0.02866) 0.8479 (7.7x10¹⁴) 0.06 (0.02) 0.09
(*) 0.00 (0.18) 0.09 (*) > 123 103.32
Paper Bag Material 0.9576 0.9281 0.9999
(0.00014) 0.9996 (0.00148) 0.20 (0.03) 0.16 (0.04) 0.01 (0.02) 0.03 (0.04) 47.97 61.5
Plastic Bag Material 0.9379 0.7094 0.9098
(9.1x10¹⁴) 0.9081 (2.7x10¹⁵)
0.07 (6.5x10⁵) 0.06 (*) 0.07
(6.5x10⁶) 0.06 (*) > 123 > 123
PVC Overwrap Film
0.8642 0.4632 1.0000 (0.00014)
0.9994 (0.00544) 0.16 (0.04) 0.12 (0.09) 0.00 (0.05) 0.00 (0.10) 59.04 > 123
Vacuum Pouch Material
0.8767 0.7020 0.8160 (1.4x10¹⁵)
0.8284 (4.0x10¹⁵) 0.09 (*) 0.07
(*) 0.09 (*) 0.07 (*) 107.01 > 123
* - GInaFit finds kmax values to be equal, and standard error was not able to be computed due to poor fit
44
iii. Survival of L. monocytogenes on soiled food packaging materials inoculated with a
high initial level and stored at 4º C
Populations of L. monocytogenes (5 log CFU/cm2) stored on soiled packaging materials
at 4º C had similar counts to each other at 25 days of storage and 95 days of storage
(Figure 1.3)(data in Appendix Table 11 for combined data results, and Appendix Tables
12 and 13 for individual replicate results; while Appendix Table 14 shows total aerobic
plate counts and Appendix Tables 15 and 16 show data from individual replicates). No
material exhibited cell reductions below the detection limit by the end of storage (123
days). However, PVC overwrap film had the least amount of survivors on day 123 of
storage. Listeria monocytogenes survived at the highest levels on plastic bag and vacuum
pouch material (Figure 1.3). Nonselective media showed more survival than selective
media, but trends remained the same, and any variation may be attributed to background
flora (especially in the case of cardboard box material)(Figure 1.4). At this high
inoculation level, cells died more rapidly at 4º C than at 25º C.
L. monocytogenes populations stored at 4º C behaved in a manner that can be described
by the biphasic model, as outlined by Cerf et al., 1977. This model once again yielded
the most consistent and highest R-Squared values, save for L. monocytogenes on vacuum
pouch material, which behaved in a more linear fashion (Table 1.3). Populations on
cardboard box material and PVC overwrap film exhibited the highest kmax1 values,
while plastic bag material and butcher paper material exhibited the smallest kmax1
values, similar to storage of identical samples at 25º C (Table 1.3). Butcher paper, deli
45
wax paper, paper bag material and PVC overwrap film were projected to achieve a 4-D
reduction within the time of storage studied (123 days).
Compared with 25º C, every material examined was less hospitable to L monocytogenes
at 4º C. The lowest kmax1 value was 0.07 or 0.02 (vacuum packaging material, Table
1.4), which were similar to the values determined for vacuum packaging material stored
at 25º C. No kmax1 values were as high as those for cardboard box material stored at 25º
C (Tables 1.1 and 1.3), and the general trend of pathogen populations at 4º C indicated a
much more drastic initial reduction than the 25º C counterpart. Overall, more populations
of L. monocytogenes inoculated on soiled packaging materials at 4º C decreased during
the time of storage than counterparts stored at 25º C, though some cells were still able to
persist for extended periods of time. It is of great importance to note that the pathogen
was still very capable of surviving for extended periods of time even under these
conditions, regardless of material.

46
Figure 1.3 - Listeria monocytogenes survival (log CFU/cm2) on food packaging materials soiled with antimicrobial-free ham homogenate inoculated with approximately 5 log CFU/cm2 of L. monocytogenes and stored at 4º C for up to 123 days (Data in Appendix Table 11)
Figure 1.4 �– Total aerobic bacteria survival (log CFU/cm2) on food packaging materials soiled with antimicrobial-free ham homogenate inoculated with approximately 5 log CFU/cm2 of L. monocytogenes and stored at 4º C for up to 123 days (Data in Appendix Table 14)

47
Table 1.3 �– Inactivation parameters of L. monocytogenes on food packaging materials soiled with antimicrobial-free ham homogenate inoculated at a level of approximately 5 log CFU/cm2 and stored at 4º C for up to 123 days (two replicates combined)
R-Square f (Std. Error) kmax1 (1/day) kmax2 (1/days) 4D Reduction (± days)
Aluminum foil 0.9199 0.9784 (0.02285) 0.20 (0.07) 0.03 (0.01) > 123
Butcher paper 0.9709 0.9543 (0.02964) 0.32 (0.12) 0.06 (0.01) 109.47
Cardboard box material 0.9027 0.9958 (0.00396) 0.62 (0.26) 0.02 (0.01) > 123
Deli paper 0.9621 0.9944 (0.00495) 0.28 (0.06) 0.05 (0.01) 88.56
Paper bag material 0.9480 0.9750 (0.02507) 0.28 (0.11) 0.06 (0.01) 93.48
Plastic bag material 0.8915 0.9970 (0.00581) 0.13 (0.03) 0.00 (0.02) > 123
PVC overwrap film 0.9417 0.9998 (0.00025) 0.54 (0.13) 0.03 (0.01) 30.75
Vacuum pouch material 0.7848 0.9619 (*) 0.04 (*) 0.04 (*) > 123
* - GInaFit finds kmax values to be equal, and standard error was not able to be computed due to poor fit

48
Table 1.4 �– Inactivation parameters of L. monocytogenes on food packaging materials soiled with antimicrobial-free ham homogenate inoculated at a level of approximately 5 log CFU/cm2 and stored at 4º C for up to 123 days (two individual replicates)
R-Square f value kmax1 (1/day) kmax2 (1/day) 4D Reduction (± days)
Rep1 Rep2 Rep1 Rep2 Rep1 Rep2 Rep1 Rep2 Rep1 Rep2 Aluminum Foil 0.8074 0.6822 0.9988
(0.00213) 0.9757 (1.6x10¹⁵)
0.33 (0.12)
0.04 (3.9x10⁵)
0.04 (0.02)
0.04 (1.5x10⁷) 71.34 > 123
Butcher Paper 0.9636 0.8499 0.9054 (0.9060)
0.9638 (0.07293)
0.22 (0.11) 0.12 (0.06) 0.07
(0.01) 0.02 (0.02) 94.71 > 123
Cardboard Box Material 0.9023 0.8025 0.9971
(0.00336) 0.9957 (0.00512)
0.62 (0.27) 0.96 (0.41) 0.03
(0.01) 0.01 (0.01) 97.17 > 123
Deli Wax Paper 0.9504 0.9355 0.9999
(0.00009) 0.9246 (0.06352)
0.26 (0.04) 0.27 (0.16) 0.02
(0.02) 0.05 (0.01) 36.9 > 123
Paper Bag Material 0.9664 0.8763 0.9891
(0.00937) 0.9438 (0.08311)
0.30 (0.08) 0.29 (0.24) 0.06
(0.01) 0.06 (0.01) 79.95 107.01
Plastic Bag Material 0.8862 0.7519 0.9998
(0.00065) 0.9222 (0.15233)
0.16 (0.04) 0.10 (0.07) 0.00
(0.03) 0.01 (0.02) > 123 > 123
PVC Overwrap Film
0.9681 0.7688 1.0000 (0.00003)
0.9990 (0.00219)
0.46 (0.06) 0.57 (0.32) 0.01
(0.01) 0.03 (0.02) 20.91 66.42
Vacuum Pouch Material
0.7908 0.3474 0.8590 (2.1x10¹⁵) 0.9861 (*) 0.07 (*) 0.02 (*) 0.07 (*) 0.02 (*) > 123 > 123
* - GInaFit finds kmax values to be equal, and standard error was not able to be computed due to poor fit
49
iv. Survival of L. monocytogenes on soiled food packaging materials inoculated at a low
initial level and stored at 25º C
Soiled packaging materials, except for PVC overwrap film, cardboard and deli wax
paper, exhibited drastic increases in population for the first part of storage (ranging from
4 to 25 days) when soiled with inoculated ham homogenate (approximately 2 log
CFU/cm2) and stored at 25º C (Figure 1.5) (see Appendix Table 17 for combined data
results, and Appendix Tables 18 and 19 for individual replicate results, while Appendix
Table 20 shows total aerobic plate counts and Appendix Tables 21 and 22 show
individual replicates). Populations on soiled plastic bag material, butcher paper, and
aluminum foil are of special note, as they grew to over 2 log CFU/cm2 higher than the
initial inoculated level within two weeks of inoculation before they began declining in
number. Pathogens on many materials at this low inoculation level and 25º C
environment exhibited high levels of survival, continuing this trend without much change
to the end of storage (123 days). Populations on paper bag material, cardboard, and deli
wax paper were below the detection limit (-0.1 log CFU/cm2) on the 67th day of storage.
Aluminum foil harbored the greatest amount of survivors on day 123 of storage at 25º C.
The pathogen was less consistent from sample to sample than when stored at other
temperature and inoculation level combinations, so R-values were not as desirable as they
were in other treatments, generally ranging from 0.0000 to less than 0.9 (Table 1.5).
Biphasic models (Cerf et al., 1977) were still fit to the pathogenic population data for the
sake of comparison. No 4-D reductions were determined for these data, as initial levels
were approximately 2 log CFU/cm2 with a detection limit of -0.1 log CFU/cm2. Pathogen

50
populations exhibited the most drastic reduction on deli wax paper and cardboard, with
complete elimination of counts almost immediately, indicated by high kmax1 values of
2.46 and 0.34. Plastic bag and butcher paper materials exhibited the smallest kmax1
values, a result of populations of L. monocytogenes that were able to persist for much
longer periods of time, and with behavior not completely consistent with biphasic
reduction.
Interestingly, compared with counterparts inoculated at a higher level, low initial L.
monocytogenes levels on soiled paper bag material did not exhibit the most drastic
decrease in population. Instead, populations decreased at a rate with a kmax1 in the
middle of the range of all materials. In addition, populations on cardboard box material
exhibited an extremely rapid decrease in the first replication (kmax1 3.30) while
reduction in the second replication (kmax1 0.32) was comparable to that on other
materials (paper bag, PVC overwrap, and vacuum plastic bag materials) and the kmax1
values of cardboard box material inoculated at a higher level (Table 1.6, also Table 1.2).
These results suggest that survival even with low initial microbiological loads is a
possibility, as L. monocytogenes may grow or remain viable for long periods of time on
some packaging materials. Not only did populations on some materials grow, overall
inactivation rates (Table 1.5) were not faster than those on high-inoculation counterparts,
with low overall kmax1 values and low f values. Many of these curves cannot be
adequately described by a model predicting reduction, so there exists a great risk when L.
monocytogenes contaminates select packaging materials at this temperature.

51
Total aerobic plate counts under these conditions followed their selective media
counterparts very closely. Aside from cardboard box material, it can be gathered from
this data (Figures 1.5 and 1.6) that the majority of bacteria present on packaging materials
(except for that on cardboard box material) was L. monocytogenes which had been
inoculated at the onset of storage.

52
Figure 1.5 - Listeria monocytogenes survival (log CFU/cm2) on food packaging materials soiled with antimicrobial-free ham homogenate inoculated with approximately 2 log CFU/cm2 of L. monocytogenes and stored at 25º C for up to 123 days (Data in Appendix Table 17)
Figure 1.6 �– Total aerobic bacteria survival (log CFU/cm2) on food packaging materials soiled with antimicrobial-free ham homogenate inoculated with approximately 2 log CFU/cm2 of L. monocytogenes and stored at 25º C for up to 123 days (Data in Appendix Table 20)

53
Table 1.5 �– Inactivation parameters of L. monocytogenes on food packaging materials soiled with antimicrobial-free ham homogenate inoculated at a level of approximately 2 log CFU/cm2 and stored at 25º C for up to 123 days (two replicates combined)
R-Square f (Std. Error) kmax1 (1/days) kmax2 (1/days)
Aluminum foil 0.0000 0.9743 (*) 0.00 (*) 0.00 (*)
Butcher paper�† 0.0000 0.9152 (*) 0.00 (*) 0.00 (*)
Cardboard box material 0.8397 0.9548 (0.03183) 0.34 (0.17) 0.01 (0.01)
Deli paper 1.0000 0.9941 (0.00002) 2.46 (0.09) 0.00 (0.00)
Paper bag material 0.8803 0.9989 (0.00249) 0.14 (0.04) 0.00 (0.02)
Plastic bag material�† 0.0000 0.9488 (�†) 0.00 (*) 0.00 (*)
PVC overwrap film 0.6997 0.9866 (0.21776) 0.05 (0.04) 0.00 (0.13)
Vacuum pouch material�† 0.4598 0.9565 (5.45 x 10¹⁵) 0.04 (5.4 x 10⁵) 0.04 (1.2 x 10⁷)
�† Unacceptable R-Squared values and/or high standard errors indicate that the biphasic model (Cerf et al, 1977) is not an appropriate model for the behavior of L. monocytogenes on this packaging material * Biphasic model identified kmax1 as equal to kmax2, indicating nearly linear inactivation behavior

54
Table 1.6 �– Inactivation parameters of L. monocytogenes on food packaging materials soiled with antimicrobial-free ham homogenate inoculated at a level of approximately 2 log CFU/cm2 and stored at 25º C for up to 123 days (two individual replicates)
R-Square f value kmax1 (1/day) kmax2 (1/day)
Rep1 Rep2 Rep1 Rep2 Rep1 Rep2 Rep1 Rep2
Aluminum Foil 0.7170 0.0227 0.8967 (2.5x10¹⁵) 0.9811 (1.0x10¹⁵) 0.05 (*) 0.01 (*) 0.05 (*) 0.01 (*)
Butcher Paper 0.5637 0.0000 0.9805 (3.7x10¹⁵) 0.9266 (*) 0.04 (1.4x10⁶) 0.00 (*) 0.04 (1.4x10⁷) 0.00 (*)
Cardboard Box Material 0.7017 0.9546 0.9513 (0.05802) 0.9832 (0.00623) 3.30 (7409.01) 0.32 (0.06) 0.02 (0.01) 0.00 (0.00)
Deli Wax Paper 1.0000 1.0000 0.9930 (0.00002) 0.9950 (0.00003) 2.47 (0.09) 2.37 (0.09) 0.00 (0.00) 0.00 (0.00)
Paper Bag Material 0.9920 0.8042 0.9989 (0.00154) 0.9993 (0.00355) 0.17 (0.03) 0.11 (0.04) 0.00 (0.02) 0.00 (0.05)
Plastic Bag Material 0.6407 0.1025 0.8298 (3.1x10¹⁵) 0.9883 (1.0x10¹⁶) 0.05 (1.4x10⁶) 0.01 (*) 0.05 (7.0x10⁶) 0.01 (*)
PVC Overwrap Film 0.9250 0.4171 0.9931 (0.00468) 0.9738 (*) 0.20 (0.04) 0.04 (*) 0.00 (0.01) 0.04 (*)
Vacuum Pouch Material 0.3490 0.3518 0.9516 (5.8x10¹⁵) 0.9921 (0.02938) 0.04 (9.2x10⁵) 0.22 (0.24) 0.04 (1.8x10⁷) 0.01 (0.04)
* - GInaFit finds kmax values to be equal, and standard error was not able to be computed due to poor fit

55
v. Survival of L. monocytogenes on soiled food packaging materials inoculated at a low
initial level and stored at 4º C
When inoculated at approximately 2 log CFU/cm2, L. monocytogenes all survived
similarly on various packaging materials. Apart from vacuum pouch and plastic bag
material, counts on other packaging materials were below the detection limit on day 123
of storage (Figure 1.7) (see Appendix Table 23 for combined data results, and Appendix
Tables 24 and 25 for individual replicate results, while Table 26 shows total aerobic plate
counts and Appendix Tables 27 and 28 show individual replicates). In contrast to other
temperature and inoculation conditions, populations stored under these conditions
behaved consistently between all packaging materials, with no initial growth on any
soiled material, and a steady decrease in populations of materials examined. These
results are consistent with knowledge that a lower initial microbial load and low
temperatures are less hospitable for the survival of bacteria.
Results from fitting a biphasic curve to population data (Table 1.7) yielded favorable R-
Squared values, indicating very strong goodness-of-fit for biphasic reduction curves, and
large kmax1 values (indicating rapid death) in most cases. Once again, cardboard box
material and PVC overwrap material were among the least hospitable to pathogenic
survival with the highest kmax1 values (1.14 and 2.56, respectively), though vacuum
pouch material yielded kmax1 values of 2.70 (albeit with very high standard error).
Populations on butcher paper exhibited the lowest kmax1 value (0.49). kmax2 values
ranged from 0.00 (PVC overwrap film and deli wax paper) to 0.03 (plastic bag material),
indicating that the second phase of inactivation is very mild. This reinforces findings that

56
initial inactivation (kmax1) of the pathogen was the most important time for determining
long-term survival of bacteria.
PVC overwrap material allowed less survival of L. monocytogenes at this temperature
and inoculation level combination when compared to other temperature and inoculation
level combinations. Cardboard box material was consistently inhospitable to L.
monocytogenes populations, though behavior of the pathogen changed very minutely
from temperature to temperature and inoculation level. All other materials experienced
wide variation in kmax values under different storage and inoculation conditions. In
general, it may be said that soiled cardboard was the least hospitable to bacterial survival,
while soiled aluminum foil allowed L. monocytogenes to consistently persist at high
levels and even grow in numbers more than any other material, regardless of storage and
inoculation condition. Soiled PVC overwrap film and paper bag material were
inhospitable to L. monocytogenes and did not foster much survival under all conditions
tested.
Overall, results associated with L. monocytogenes, inoculated in ham homogenate and
used to soil food packaging materials at a low initial level of inoculation showed that
storage at 4º C was, in fact, the most lethal to the pathogen. Materials with a tendency to
be inhospitable to the pathogen (high kmax1 values) were even more inhospitable to
bacterial cells under these conditions. Materials known to be more hospitable to survivors
still had higher inactivation rates when compared to counterparts at higher temperatures
or inoculation levels. However, the most important information is that L. monocytogenes

57
was able to survive at detectable levels for up to 123 days in adverse storage conditions
on various packaging materials. Some materials (i.e., PVC overwrap film and cardboard
box material) were consistently less hospitable to survival of the pathogen, though never
to the point where a material could safely be deemed bacteriocidal.
Total aerobic plate counts were generally higher than counts on selective media (Figures
1.7 and 1.8). This suggests that at cold temperatures, psychotrophic bacteria better
persists alongside L. monocytogenes. Therefore, it may not be asserted that cold
temperatures are perfect for storage of packaging materials, as a wide variety of bacteria
were able to persist for extended periods of time.

58
Figure 1.7 - Listeria monocytogenes survival (log CFU/cm2) on food packaging materials soiled with antimicrobial-free ham homogenate inoculated with approximately 2 log CFU/cm2 of L. monocytogenes and stored at 4º C for up to 123 days (Data in Appendix Table 23)
Figure 1.8 �– Total aerobic bacteria survival (Log CFU/cm2) on food packaging materials soiled with antimicrobial-free ham homogenate inoculated with approximately 2 log CFU/cm2 of L. monocytogenes and stored at 4º C for up to 123 days (Data in Appendix Table 26)

59
Table 1.7 �– Inactivation parameters of L. monocytogenes on food packaging materials soiled with antimicrobial-free ham homogenate inoculated at a level of approximately 2 log CFU/cm2 and stored at 4º C for up to 123 days (two replicates combined)
R-Square f (Std. Error) kmax1 (1/days) kmax2 (1/days)
Aluminum foil 0.9508 0.9261 (0.03236) 0.68 (0.23) 0.02 (0.00)
Butcher paper 0.9348 0.9689 (0.01422) 0.49 (0.15) 0.01 (0.00)
Cardboard box material 0.9818 0.9796 (0.00445) 1.14 (0.15) 0.01 (0.00)
Deli paper 0.9998 0.9939 (0.00087) 0.63 (0.01) 0.00 (0.00)
Paper bag material 0.8735 0.9380 (0.04466) 0.76 (0.40) 0.02 (0.01)
Plastic bag material�† 0.8717 0.98485 (1.1 x 10¹⁵) 0.03 (*) 0.03 (*)
PVC overwrap film 0.9831 0.9935 (0.00161) 2.56 (11.21) 0.00 (0.00)
Vacuum pouch material 0.6035 0.9380 (0.06517) 2.70 (812.13) 0.01 (0.01)
�† Unacceptable R-Squared values and/or high standard errors indicate that the biphasic model (Cerf et al, 1977) is not an appropriate model for the behavior of L. monocytogenes on this packaging material * Biphasic model identified kmax1 as equal to kmax2, indicating nearly linear inactivation behavior

60
Table 1.8 �– Inactivation parameters of L. monocytogenes on food packaging materials soiled with antimicrobial-free ham homogenate inoculated at a level of approximately 2 log CFU/cm2 and stored at 4º C for up to 123 days (two individual replicates)
R-Square f value kmax1 (1/day) kmax2 (1/day) Rep1 Rep2 Rep1 Rep2 Rep1 Rep2 Rep1 Rep2
Aluminum Foil 0.7803 0.9408 0.9702 (0.11417) 0.9738 (0.01319) 0.06 (0.04) 0.49 (0.16) 0.00 (0.04) 0.02 (0.00)
Butcher Paper 0.8325 0.8904 0.9257 (0.05887) 0.9896 (0.00663) 0.61 (0.38) 0.39 (0.11) 0.02 (0.01) 0.00 (0.01)
Cardboard Box Material 0.9477 0.9949 0.9783 (0.00905) 0.9797 (0.00211) 1.24 (0.40) 1.08 (0.06) 0.01 (0.00) 0.00 (0.00)
Deli Wax Paper 0.9929 0.9665 0.9920 (0.00123) 0.9971 (0.00121) 1.23 (0.08) 0.54 (0.08) 0.00 (0.00) 0.00 (0.00)
Paper Bag Material 0.8104 0.9742 0.9399 (0.05249) 0.9856 (0.00603) 2.83 (1048.10) 0.15 (0.02) 0.02 (0.01) 0.00 (0.00)
Plastic Bag Material 0.7482 0.8876 0.9845 (1.8x10¹⁵) 0.7539 (1.7x10¹⁵) 0.03 (1.8x10⁵) 0.03 (1.2x10⁶) 0.03 (1.1x10⁷) 0.03 (3.6x10⁶)
PVC Overwrap Film 1.0000 0.9362 0.9940 (0.00001) 0.9930 (0.00347) 2.60 (0.09) 2.74 (49.32) 0.00 (0.00) 0.00 (0.00)
Vacuum Pouch Material 0.2048 0.7195
0.9517 (9.78266)
0.9894 (0.01177) 0.02 (0.20) 1.28 (0.75) 0.00 (1.15) 0.00 (0.01)
* - GInaFit finds kmax values to be equal, and standard error was not able to be computed due to poor fit

61
vi. Discussion
Results of this study show that L. monocytogenes, suspended in ham homogenate and
spilled onto various packaging materials, is able to survive for extended periods of time,
up to 123 days, under certain conditions. This said, survival of L. monocytogenes varied
among packaging materials as well as at different storage temperatures and inoculation
levels. As suggested by the literature regarding survival of L. monocytogenes in adverse
environments, biofilms could be an important factor concerning the survival of the
pathogen in adverse environments (Knøchel, 2010; Chmielewski and Frank, 2003;
M drala et al, 2003; Tompkin, 2002). Coupled with knowledge of the survival dynamics
of L. monocytogenes at different temperatures (Gandhi et al., 2007) with the readiness to
form biofilm systems under duress (Gandhi et al., 2007, Renier et al., 2011), it was
expected that harsh conditions would promote hardiness in L. monocytogenes populations
on contaminated materials.
L. monocytogenes on soiled cardboard box material and PVC overwrap film survived less
than on all other materials under all conditions. Aluminum foil and butcher paper
consistently harbored the pathogen without rapid death for much longer than any other
materials within each temperature-inoculation level combination. With this information
in mind, those involved with processing, storage, and retail of meat should primarily take
extra precaution to prevent cross-contamination of food from occurring, and keep all
packaged food at a temperature of 4º C or lower, if possible. Use of cardboard box
material is desirable from a microbiological safety perspective, though problems on most

62
material could be avoided by preventing L. monocytogenes from attaching to packaging
material and keeping products refrigerated.
The most probable explanation for the long-term survival of L. monocytogenes on various
soiled packaging materials is the aptitude to form biofilms when stressed (Renier et al.,
2011). Biofilms not only �“shelter�” the pathogens (Sofos and Geornaras, 2010), but can
reorganize cells into a structure specifically suited for survival of a group of pathogens
(Chmielewski and Frank, 2003). Even though biofilms are usually formed when
pathogens are in a growth phase, surviving cells have been reported to form biofilms,
especially when under stress (Chmielewski and Frank, 2003; Kalmokoff et al., 2001;
Takhistov and George, 2004). It should also be noted that, unlike studies involving
antimicrobial treatments, spot-inoculating L. monocytogenes on soiled food packaging
materials never resulted in immediate reduction in bacterial populations, so it is possible
that biofilms were quickly formed due to the presence of a food soiling matrix as well as
the stress of dessication or refrigeration temperatures. In addition, studies have shown
that biofilm formation is affected both by surface characteristics, and by material on
which contamination occurs (Chmielewski and Frank, 2003).
The level of pathogen presence tested in the study may be higher than what might be
found in environmental samples, as Chaitiemwong et al. reports a level of approximately
5 log CFU/100cm2 on environmental conveyor belt samples (Chaitiemwong et al., 2010).
Converting to the same units tested in this study, the level found by Chaitiemwong et al.
was approximately 3.5 log CFU/cm2. This means that one level of inoculation used in

63
this trial may be considered higher than would be expected in a food processing
environment. Therefore, high initial levels of the pathogen may have also contributed to
long-term survival, as Knøchel (2010) reports that L. monocytogenes is able to persist for
extended periods of time when present in large numbers. L. monocytogenes is known to
grow to approximately 109 cells per milliliter of broth, though this level is achieved in
conditions tailored to the growth of the pathogen.
It is no surprise that survival was observed at both temperatures, as L. monocytogenes has
been demonstrated to be persistent under less-than-ideal conditions (multi-year
persistence �– Tompkin, 2002; year-long survival, collection from freezers, etc. �– Autio et
al., 2003; desiccation conditions, Vogel et al., 2010), and is able to grow at temperatures
below 1º C (Junttila et al., 1988). Because L. monocytogenes is so persistent in harsh
environments, it may be concluded that a large part of variation shown in the results is
due to interaction of the bacteria with various packaging materials on which it is
inoculated.
Also, likely contributing to survival of the pathogen was the absence of antimicrobials in
the food soiling matrix itself. The ham used to create a soiling homogenate had no
antimicrobials added, and all materials used were acquired before exposure to
antimicrobial interventions post-processing. This is important, as literature indicates that
L. monocytogenes is generally susceptible to antimicrobial treatments, multiple hurdle
interventions, and antimicrobials applied at some point during food processing
(Chaitiemwong et al., 2010, Sofos and Geornaras, 2010), though resistance to various

64
antimicrobials has been reported in certain strains of the pathogen (Gandhi et al., 2007).
Eliminating influence of non-ambient bacteriocidal or bacteriostatic inhibitors allowed
development of a �“worst-case scenario�” setting for pathogen growth or survival on soiled
food packaging materials.
The results from this study indicate that presence of L. monocytogenes on soiled food
packaging may serve as a source of continued cross-contamination. Bacterial cells were
consistently more persistent when stored at 25º C and died more rapidly at 4º C.
Interestingly, even lower initial levels of the pathogen did not ensure rapid death of the
pathogen on packaging materials. This suggests that even low doses of contamination on
wholesale and retail packaging materials may present a lingering contamination problem,
especially if stored at 25º C.
Since packaging materials are typically not treated with antimicrobial interventions (with
the exceptions of high pressure pasteurization and irradiation), a general knowledge of
the danger of contaminated packaging materials is beneficial for both industry and
consumer alike. Riazi and Matthews (2011) showed that common sanitizing measures
(namely sodium hypochlorite) are effective in reducing pathogenic populations by over 5
log units on a food contact surface when applied at a high concentration (512 ppm
sodium hypochlorite). However, typical consumer hygienic practices related to ready-to-
eat foods involve handwashing and refrigerating leftovers; rarely are packages washed
and sanitized prior to handling or storage.

65
IV. Conclusions
In conclusion, it should be noted that the data indicated that L. monocytogenes was able
to survive for extended periods of time in food residues deposited on common food
packaging materials. Regardless of temperature of storage, initial microbiological load,
or soiled material harboring the contamination, the pathogen was able to persist for at
least 123 days in many cases. Care should be taken primarily to ensure that packaging is
kept clean and free from food-based soil. This may be done by keeping meat processing
facilities, food storage and shipping environments, those who handle meat products, and
packaging free from food soil buildup and L. monocytogenes. With these precautions in
mind, it has also been demonstrated in this study that, in case of contamination, survivors
on packaging materials will be lower when stored at 4º C compared to 25º C.
It is important to stress that this pathogen is able to persist under seemingly unfavorable
conditions for an extended period of time. When the general public becomes aware of the
dangers posed by L. monocytogenes, education in methods to minimize risk of exposure
to the pathogen should follow suit immediately. Consumers should be urged to keep
food preparation and storage areas clean and to wash objects related to food before and
after use. Knowing the dangers of L. monocytogenes when present on soiled packaging
materials should allow consumers, retailers, and processors to more completely protect
the food supply and the health and well-being of consumers.

66
Chapter 4: Escherichia coli O157:H7 survival on food packaging materials soiled with
ground beef residues
Chapter Overview
Escherichia coli O157:H7 cells present in contaminated food residues, such as meat
purge, may potentially be deposited on internal and external surfaces of food packaging
materials, where they may attach, survive, and serve as sources of cross-contamination of
other foods. This study explored behavior of E. coli O157:H7 in meat residues deposited
on four materials commonly associated with storage and display of fresh meat (butcher
paper, cardboard, PVC overwrap film, and vacuum plastic bags). Packaging material
samples (5 × 5 cm) were spot-inoculated (0.5 ml) with a ground beef homogenate (10%
wt/wt in distilled water) containing an eight-strain mixture of rifampicin-resistant E. coli
O157:H7 (simulating contaminated meat residues), to achieve target inoculation levels of
4 or 6 log CFU/cm2. Inoculated packaging materials were stored aerobically in petri
dishes at 4 or 25oC for up to 130 days. At regular intervals during storage, samples were
analyzed (two repetitions, three samples/treatment/repetition) for surviving total
microbial (tryptic soy agar) and inoculated E. coli O157:H7 (tryptic soy agar with 100
g/ml rifampicin) populations. The pathogen, when placed on packaging materials via
ground beef homogenate, decreased throughout storage at various rates dependent upon
storage conditions and materials, though regardless of environment, pathogen survivors
were obtained at the end of storage (130 days) on all tested materials. When inoculated at
the low inoculum level (4 log CFU/cm2), pathogen counts at 130 days ranged from
<0.9±1.0 (cardboard) to 1.6±0.8 (butcher paper) log CFU/cm2 on materials stored at

67
25oC, and <0.0±0.2 (vacuum pouch material) to <0.3±0.4 (PVC overwrap film) log
CFU/cm2 on samples stored at 4oC. For samples inoculated at 6 log CFU/cm2, the lowest
and highest pathogen counts at 130 days at 25oC were obtained on vacuum pouch
material (<1.7±1.1 log CFU/cm2) and butcher paper (1.8±0.5 log CFU/cm2), respectively.
For corresponding samples stored at 4oC, the lowest and highest pathogen counts on day
130 of storage were obtained on butcher paper (<0.3±0.6 log CFU/cm2) and PVC
overwrap film (2.4±0.2 log CFU/cm2), respectively. The results indicated that under these
conditions, E. coli O157:H7 was able to survive for more than four months on soiled
packaging materials. Thus, contaminated meat residues deposited on packaging materials
may serve as sources of cross-contamination of foods.
I. Introduction
Despite efforts to eliminate Escherichia coli O157:H7 from the modern food supply, the
pathogen continues to be a problem for the industry and consumers. Due to publicized
infections and associated deaths, consumers have lost confidence in the safety of the
modern meat supply. In addition to this, recalls of products associated with the O157
serotype of E. coli have cost the beef industry millions of dollars, as well as lost revenue
and costs associated with loss of consumer trust. In addition, up to 4,614 people may be
hospitalized every year due to the pathogen (Scallan et al., 2011). As E. coli O157:H7 is
an organism declared an adulterant by federal legislation (USDA-FSIS directive
10,010.1), its control is on the forefront of industry interest. Interventions exist to control
spread of the pathogen from presence on cattle hide to carcasses ranging from

68
vaccinations to carcass sprays, each with varying success (Woerner et al., 2006;
Carpenter et al., 2010).
However, even after focusing much effort on controlling E. coli O157:H7 in processing,
outbreaks and contamination still occur. As evidenced by recent outbreaks of the
pathogen on produce, cross-contamination is the most likely culprit of transmission of the
pathogen. E. coli serotypes are able to attach to surfaces, both food and abiotic, and form
biofilms that increase the pathogen�’s likelihood of survival. More alarmingly, pathogenic
strains of E. coli such as O157:H7 possess antigens that possibly increase the ability to
attach to surfaces (Torres et al., 2005). Uhlich et al. (2010) reported that survival of
pathogenic bacteria is enhanced after attachment on soiled surfaces, surviving even after
cleaning and sanitizing. Results of these studies suggest that risk analysis for E. coli
O157:H7 should be expanded beyond beef carcass and trimming surfaces and food plant
processing and fabrication surfaces. If the pathogen is able to cross-contaminate products
due to efficient attachment and possible biofilm formation, survival of the bacteria on all
materials contacting food products should be investigated.
Survival of E. coli O157:H7 suspended in meat homogenate has been demonstrated on
food contact surfaces such as polyurethane (Marouani-Gadri et al., 2010). With
knowledge of the pathogen�’s ability to survive on soiled food contact surfaces,
researchers should consider all pathways of contamination, including the material in
which food is packaged. Food that is sold is guaranteed to contact packaging materials,
and consumers will most likely handle the material prior to preparation and consumption

69
of the product. Cross-contamination, therefore, may occur due to poor hygiene practices
in household or commercial kitchens (Bloomfield et al., 2007).
It is of interest to public health and industry reputation that the survival of E. coli
O157:H7 on a variety of soiled food packaging materials be investigated. Food packages
are able to become soiled during cold storage in a processing facility, during storage or
display at a retail establishment, or during storage in a consumer or service refrigerator.
E. coli O157:H7 has been demonstrated to survive at refrigeration temperatures for up to
28 days on stainless steel and 35 days in commercial mayonnaise (Wilks et al., 2005;
Weagant et al., 1994). It stands to reason, therefore, that other materials may allow
survival of the pathogen, and subsequently pose a threat to consumer health. Because of
the pressing issue of food safety with regards to E. coli O157:H7, the objective of this
study was to quantify and compare survival of E. coli O157:H7 on various food
packaging materials soiled with ground beef purge, investigating the effect on bacterial
survival of different temperatures and levels of contamination.
II. Materials and Methods
i. Strain and inoculum preparation
Six rifampicin-resistant (Kaspar and Tamplin, 1993) strains of E. coli O157:H7 (ATCC
43895, ATCC 43888, ATCC 51658, and C1-057, C1-072, C1-109; bovine fecal isolates
(Carlson et al., 2008)) were obtained and individual colonies were isolated via streak
plating on TSA (Becton, Dickinson & Company, Sparks, MD) agar supplemented with
100 µg/ml rifampicin (Sigma-Aldrich Company, St. Louis, MO). A single colony from

70
each strain was activated in 10 ml Trypic Soy Broth (TSB; Becton, Dickinson &
Company, Sparks, MD) supplemented with 100 µg/ml rifampicin (Sigma-Aldrich
Company, St. Louis, MO), and incubated at 30°C for 20-24 hours. After incubation 100
l of culture was pipetted into fresh TSB+Rif tubes and incubated again for 20-24 hours.
�“Ground beef homogenate�” was prepared with 10% fresh ground beef (CSU Meat
Science Laboratory, Fort Collins, CO) and 90% distilled, sterile water, then strained
through a cheesecloth (adapted from Dourou et al. 2011). Cell pellets were individually
centrifuged for 15 minutes (Eppendorf 5810 R, 4° C, 4,629 x g), then the supernatant was
discarded. Cell pellets were resuspended in 10 ml Phosphate Buffered Saline (pH 7.4,
PBS; Fisher Scientific, Fair Lawn, NJ) and centrifuged for an additional 15 minutes.
Finally, each strain was resuspended in 10 ml of the ground beef homogenate (pH 5.47)
before the inoculum was diluted to levels appropriate for inoculation (approximately 6 or
8 log CFU/ml).
ii. Packaging material sample preparation
Four materials commonly associated with food packaging and handling were selected for
investigation: butcher paper (Kold-Lok, Georgia-Pacific, Norwalk, CT), cardboard box
material (Donated by Colorado Premium, Greeley, CO), polyvinyl chloride (PVC)
overwrap film (Prime Source Crystal Clear PVC Wrapping Film, International Paper Co.,
N. Kansas City, MO), and vacuum plastic bag (Prime Source Vacuum Pouch, 3 mil STD
barrier, International Paper Co., N. Kansas City, MO). Prior to inoculation, each material
was cut into 5 cm x 5 cm samples and placed in new, sterile petri dishes (Polystyrene
Petri Dish, Fisher Scientific, Pittsburgh, PA).

71
iii. Inoculation
A 0.5 ml portion of the ground beef homogenate containing the E. coli O157:H7
inoculum was pipetted onto each individual packaging material sample without
spreading, achieving an initial inoculation level of approximately 4 (�“low�”) or 6 (�“high�”)
log CFU/cm2. Samples were individually set in a sterile petri dish and placed in
incubators set at either 4º or 25º C (25º C, 13.13 ± 0.64% RH; 4º C, 37.33 ± 1.78% RH).
iv. Sampling and analysis
For microbiological sampling, 20 ml of Maximum Recovery Diluent (MRD; Becton,
Dickinson & Company, Sparks, MD) were pipetted into Whirl-Pak® bags (Nasco, 18oz.).
Packaging material samples were aseptically removed from petri dishes and placed into
bags. Samples were masticated for 120 seconds at six strokes per second (IUL
Instruments, S.A. Barcelona, Spain, Masticator Silver-Paddle Blender). Homogenized
sample was pipetted out, serial dilutions were made in 0.1% buffered peptone water
(BPW; Difco, Becton, Dickinson & Company, Sparks, MD), and liquid was spread plated
onto both non-selective media (TSA; Becton, Dickinson & Company, Sparks, MD) and
selective media (TSA+Rif). TSA+Rif plates were incubated at 35° C for 24 hours and
colonies were counted, while the TSA plates were incubated at 25° C for 72 hours and
colonies were subsequently counted. Materials were sampled weekly until 39 days of
storage, and then the materials were sampled every other week until 130 days of storage.
Sampling was discontinued for materials that had counts below the detection limit for at

72
least two consecutive sampling dates. Three samples were taken at each sampling date for
each material in each inoculation level.
v. Statistical analysis
To analyze the data, colony counts were converted into log CFU/cm2 using Microsoft
Excel spreadsheets, and were analyzed using the Proc Mixed program of SAS software
for a Tukey-adjusted analysis of variance of the population counts for each replication
(Version 9.2, SAS, Inc., Cary, NC). In analysis of the data, tests were performed to
investigate the presence of a significant (P < 0.05) replication effect.
The population data from both replicates were subsequently analyzed with GInaFiT, a
freeware add-in for Microsoft Excel 2007 developed by A.H. Geeraerd et al. (2005).
Using published microbiological inactivation curves, the add-in is able to fit curves to
population data in Excel and generate numerical parameters to quantify the inactivation
of bacterial populations. This freeware module allows a user to fit multiple different
models of curves to logarithmic population data, which have been published in papers
dating back to 1920. Goodness-of-fit values (R-squared) are given for each curve. A so-
called Weibull model consistently yielded very high R-squared values for each curve
(Mafart et al, 2002), more so than any other modeling equation provided with the
software. Weibull models fit curves using the formula LOG10(N)=LOG10(N0)-((t/ )p)
where N0 refers to the initial log population of the pathogen in question, refers to the
time (in days) for the first decimal reduction of the initial population, t is the observed
time in days (using any number of days here will generate an estimate for log population

73
at this date t) and N is the numerical population in question, whereas p is a �“shape
parameter�” that defines the curve as either concave or convex, useful for defining overall
persistence and survival of the bacteria (Geeraerd et al., 2005). Using these parameters,
evaluation of different treatments is possible simply by comparing and p values, similar
to the comparison published by Janssen et al. (2005). The Weibull model was selected
for analysis, as opposed to biphasic models (Cerf, 1977), since E. coli O157:H7 death did
not exhibit distinctly different behaviors during persistence, and usually exhibited a more
concave reduction. High R-square values reinforce the decision to use the Weibull
model, rather than other models used in previous chapters.
III. Results and Discussion
i. General trends
Overall, although microbiological counts decreased over the course of the study,
survivors persisted and could be a cause of concern for cross contamination. Counts on
some materials decreased below the detection limit (-0.1 log CFU/cm2) prior to the end of
storage. When all samples from a material were below the detection limit for more than
two consecutive sampling times, sampling was discontinued and assumed to be less than
the detection limit. Significant (P < 0.05) replication effects were noticed in most of the
treatments (Appendix Tables 29-32), though this is not unexpected considering the
variation present in the data and the conditions of the study. Because of this, data are
discussed as overall survivor trends and results are compared using the GInaFiT analysis
and and p values, parameters describing time (days) for a 1-log reduction and the
concavity of the Weibull curve, respectively.

74
Most populations on soiled materials decreased at a fairly consistent rate. Though
decreases were more rapid in the early days of storage, subsequent decrease in counts for
the duration of storage was very similar. Because this behavior seemed generally
consistent throughout storage, a Weibull model was selected to describe survival of the
bacteria. Selection of the model was validated by consistently high R-squared values
generated by the curve.
Some packaging materials and storage conditions seemed to allow for more prolonged
persistence of E. coli O157:H7 than others, though drawing conclusions from simple
numerical comparison is difficult and scientifically invalid. Furthermore, simple
comparison of data collected from similar sampling points is cumbersome and offers no
insight to the overall behavior of the pathogen.
Using data from the GInaFiT freeware (Geeraerd et al., 2005), risk assessment is given
some helpful parameters by which to quantify risk for soiled food packaging materials,
namely values and p values. values describe the time (in days) that it would take for a
predicted population to decrease by 1 log CFU/cm2, while p values are shape parameters
describing the concavity or linear nature of a curve. Large values (closer to 1) indicate
that a curve will behave in a more linear fashion, whereas small p values indicate a highly
concave curve and prolonged persistence, based on the model. Smaller values mean that
90% of the population of the pathogen is affected quickly by the conditions tested for

75
storage, but when small values are associated with small p values some level of the
pathogen persists for a longer period of time and inactivation will occur less rapidly.
ii. Survival of E. coli O157:H7 on soiled food packaging materials inoculated at a high
inoculation level and stored at 25º C
E. coli O157:H7 inoculated on soiled packaging materials at a level of 6 log CFU/cm2
survived for up to 130 days when stored at 25º C. From material to material, amounts of
survivors were comparable at all points throughout the study, and survivors were present
on all materials at approximately 2 log CFU/cm2 on day 130 of storage. The general
trend of E. coli O157:H7 death and persistence on all materials was similar, though PVC
overwrap film harbored the lowest mean population of survivors and cardboard harbored
the highest (Figure 2.1)(see Appendix Table 33 for combined data results, and Appendix
Tables 34 and 35 for individual replicate results, while Appendix Table 36 shows total
aerobic plate counts and Appendix Tables 37 and 38 show individual replicates). No
material consistently yielded populations at or below the detection limit, though
reductions in counts did occur on all materials. In addition, counts collected from TSA
plates showed a similar trend of total aerobic bacteria. Though counts were higher,
background flora did not behave differently from pathogens collected on TSA+rifampicin
(Figure 2.2).

76
Figure 2.1 �– E. coli O157:H7 survival (Log CFU/cm2) on food packaging materials soiled with ground beef homogenate inoculated with approximately 6 log CFU/cm2 of E. coli O157:H7 and stored at 25º C for up to 130 days (Data in Appendix Table 33)
Figure 2.2 �– Total aerobic bacteria survival (Log CFU/cm2) on food packaging materials soiled with ground beef homogenate inoculated with approximately 6 log CFU/cm2 of E. coli O157:H7 and stored at 25º C for up to 130 days (Data in Appendix Table 36)

77
The overall behavior of the pathogen on various packaging materials can be better
compared based on analysis of data by the GInaFiT freeware module for Microsoft Excel,
which was used to fit curves to the mean populations of each treatment (Geeraerd et al.,
2005).
For the high inoculation levels of E. coli O157:H7 on packaging materials stored at 25º
C, populations on butcher paper exhibited the highest value (5.45 days) (Table 2.1),
whereas populations on PVC overwrap film and vacuum pouch material were estimated
to have the lowest value (1.15 days), indicating more rapid initial population decrease.
When comparing p values, butcher paper had the highest estimated value (0.45), meaning
that the population decrease was more linear than on other materials, while values given
to populations on PVC overwrap film and vacuum pouch material were the lowest (0.34),
describing a more concave population curve.
Aside from one replicate of contamination on soiled butcher paper (Table 2.2), all
populations exhibited values of less than 7, indicating that in less than one week after
contamination populations in all treatments (packaging materials) had decreased by 1 log
CFU/cm2. Because values are so similar, it is beneficial to compare p parameters.
From the results of this analysis, populations on butcher paper had the highest p
parameter (0.45), indicating a more linear curve than the other populations (and
comparatively less survival as time progressed), whereas populations on vacuum pouch
material had the lowest p parameter, predicting slightly higher populations as time of
storage progressed.

78
Additionally, analysis provides a 4-D estimation. This estimates when a 4 log CFU/cm2
reduction in population will occur for E. coli O157:H7 on each material under the given
storage conditions. Bacteria on vacuum plastic bags were projected to decrease by 4 log
units by 72.8 days of storage, while the same bacteria on butcher paper was estimated to
decrease by 4 log units on 122.2 days of storage. This parameter offers simple way of
observing which material allows the pathogen to persist for a longer period of time.
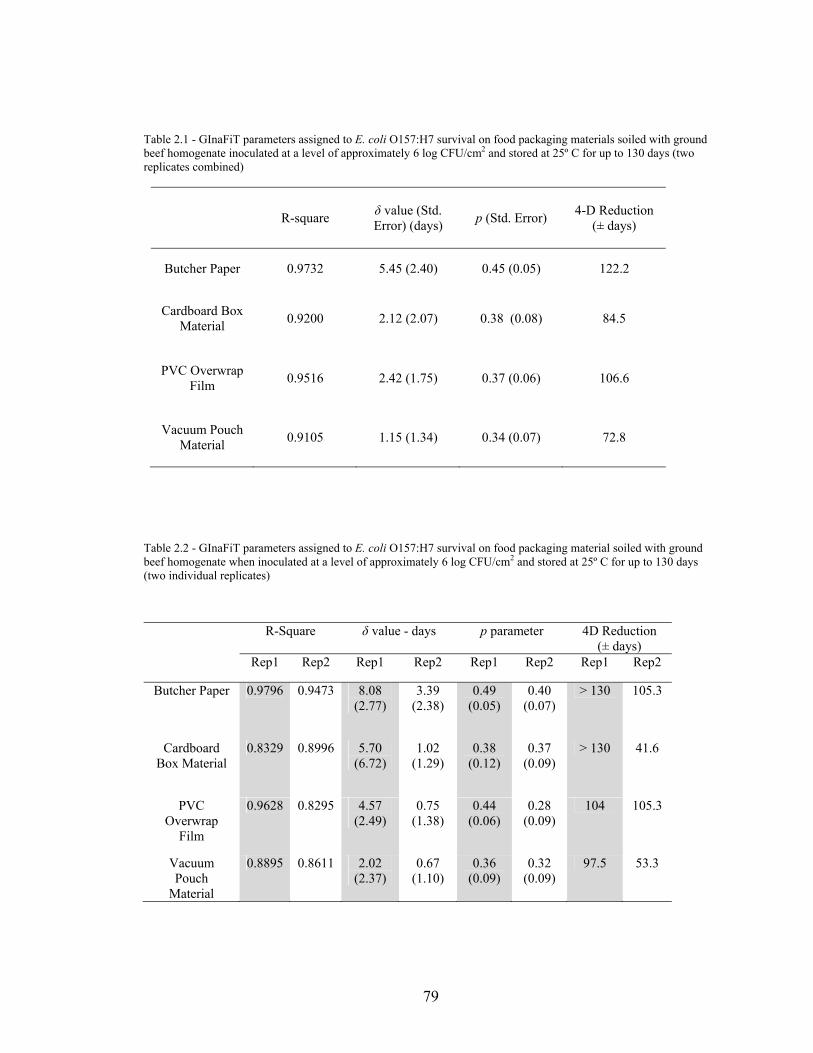
79
Table 2.1 - GInaFiT parameters assigned to E. coli O157:H7 survival on food packaging materials soiled with ground beef homogenate inoculated at a level of approximately 6 log CFU/cm2 and stored at 25º C for up to 130 days (two replicates combined)
R-square value (Std. Error) (days) p (Std. Error) 4-D Reduction
(± days)
Butcher Paper 0.9732 5.45 (2.40) 0.45 (0.05) 122.2
Cardboard Box Material 0.9200 2.12 (2.07) 0.38 (0.08) 84.5
PVC Overwrap Film 0.9516 2.42 (1.75) 0.37 (0.06) 106.6
Vacuum Pouch Material 0.9105 1.15 (1.34) 0.34 (0.07) 72.8
Table 2.2 - GInaFiT parameters assigned to E. coli O157:H7 survival on food packaging material soiled with ground beef homogenate when inoculated at a level of approximately 6 log CFU/cm2 and stored at 25º C for up to 130 days (two individual replicates)
R-Square value - days p parameter 4D Reduction (± days)
Rep1 Rep2 Rep1 Rep2 Rep1 Rep2 Rep1 Rep2
Butcher Paper 0.9796 0.9473 8.08 (2.77)
3.39 (2.38)
0.49 (0.05)
0.40 (0.07)
> 130 105.3
Cardboard Box Material
0.8329 0.8996 5.70 (6.72)
1.02 (1.29)
0.38 (0.12)
0.37 (0.09)
> 130 41.6
PVC Overwrap
Film
0.9628 0.8295 4.57 (2.49)
0.75 (1.38)
0.44 (0.06)
0.28 (0.09)
104 105.3
Vacuum Pouch
Material
0.8895 0.8611 2.02 (2.37)
0.67 (1.10)
0.36 (0.09)
0.32 (0.09)
97.5 53.3

80
iii. Survival of E. coli O157:H7 on soiled food packaging material when inoculated at a
high inoculation level and stored at 4º C
Survival of E. coli O157:H7 on soiled food packaging material when stored at 4º C
mimicked behavior at 25º C on all materials except for butcher paper, though butcher
paper still harbored survivors on the 130th day of storage. Figure 2.3 shows the behavior
of the pathogen on all packaging materials and shows that the general trend is rapid initial
decrease with subsequent persistence (see Appendix Table 39 for results, and tables 40
and 41 for individual replicate results, while Table 42 shows total aerobic plate counts
and Tables 43 and 44 show individual replicates).
Most populations do not vary much between the two temperatures, with average values of
approximately 3 log CFU/cm2 at 39 days of storage increasing in variance by day 95 of
storage (Appendix Tables 33 and 39). Unlike storage at a higher temperature, E. coli
O157:H7 on butcher paper decreased in population very rapidly. All other survivor
counts were at a level of approximately 2 log CFU/cm2 on day 130 of storage while the
mean population of E. coli O157:H7 on butcher paper on day 130 was less than 0.3 log
CFU/cm2.
Analysis on nonselective media showed even less variation between samples (Figure
2.4). Counts were higher, though this may be attributed to background flora present in
ground beef prior to inoculation.

81
Figure 2.3 �– E. coli O157:H7 survival (Log CFU/cm2) on food packaging materials soiled with ground beef homogenate inoculated with approximately 6 log CFU/cm2 of E. coli O157:H7 and stored at 4º C for up to 130 days (Data in Appendix Table 39)
Figure 2.4 �– Total aerobic bacteria survival (Log CFU/cm2) on food packaging materials soiled with ground beef homogenate inoculated with approximately 6 log CFU/cm2 of E. coli O157:H7 and stored at 4º C for up to 130 days (Data in Appendix Table 42)
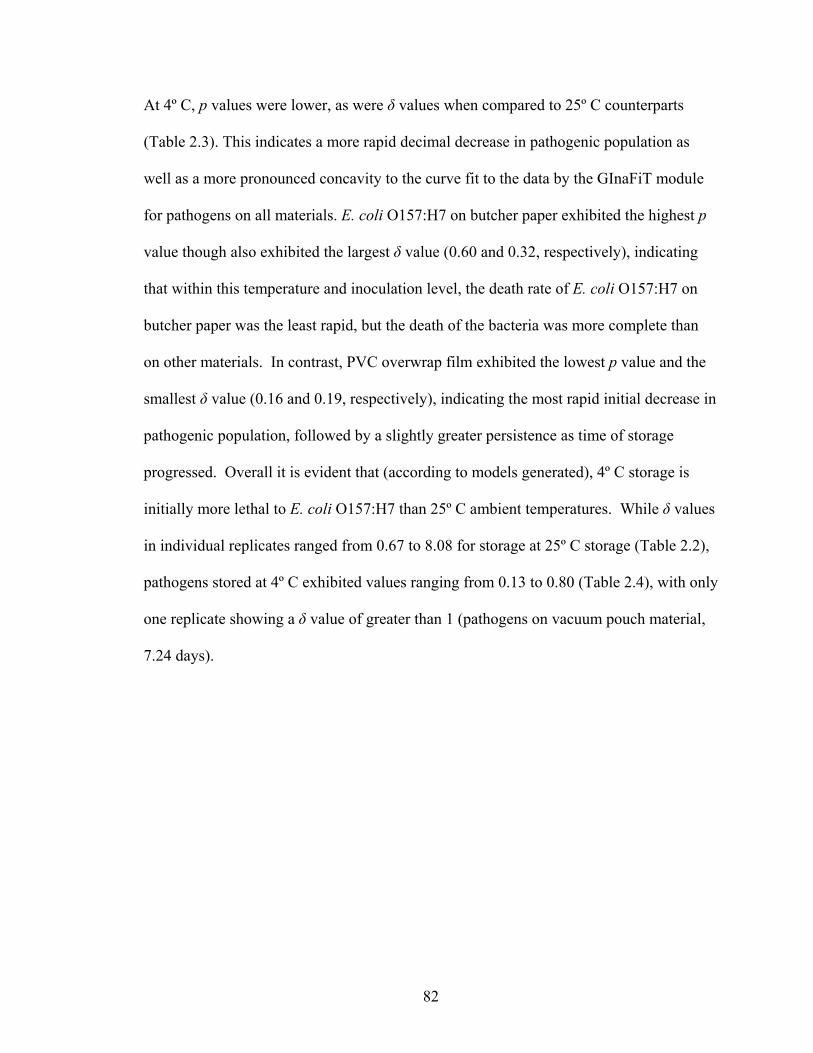
82
At 4º C, p values were lower, as were values when compared to 25º C counterparts
(Table 2.3). This indicates a more rapid decimal decrease in pathogenic population as
well as a more pronounced concavity to the curve fit to the data by the GInaFiT module
for pathogens on all materials. E. coli O157:H7 on butcher paper exhibited the highest p
value though also exhibited the largest value (0.60 and 0.32, respectively), indicating
that within this temperature and inoculation level, the death rate of E. coli O157:H7 on
butcher paper was the least rapid, but the death of the bacteria was more complete than
on other materials. In contrast, PVC overwrap film exhibited the lowest p value and the
smallest value (0.16 and 0.19, respectively), indicating the most rapid initial decrease in
pathogenic population, followed by a slightly greater persistence as time of storage
progressed. Overall it is evident that (according to models generated), 4º C storage is
initially more lethal to E. coli O157:H7 than 25º C ambient temperatures. While values
in individual replicates ranged from 0.67 to 8.08 for storage at 25º C storage (Table 2.2),
pathogens stored at 4º C exhibited values ranging from 0.13 to 0.80 (Table 2.4), with only
one replicate showing a value of greater than 1 (pathogens on vacuum pouch material,
7.24 days).

83
Table 2.3 - GInaFiT parameters assigned to E. coli O157:H7 survival on food packaging materials soiled with ground beef homogenate inoculated at a level of approximately 6 log CFU/cm2 and stored at 4º C for up to 130 days (two replicates combined)
Table 2.4 - GInaFiT parameters assigned to E. coli O157:H7 survival on food packaging materials soiled with ground beef homogenate inoculated at a level of approximately 6 log CFU/cm2 and stored at 4º C for up to 130 days (two individual replicates)
R-Square value - days p parameter 4D Reduction (± days)
Rep1 Rep2 Rep1 Rep2 Rep1 Rep2 Rep1 Rep2 Butcher Paper 0.9834 0.9373 0.42
(0.24) 0.80
(0.82) 0.31
(0.03) 0.32
(0.06) 39 63.7
Cardboard Box Material 0.9457 0.9231 0.36
(0.40) 0.15
(0.24) 0.23
(0.04) 0.18
(0.04) > 130 > 130
PVC Overwrap
Film 0.8727 0.9109 0.13
(0.29) 0.19
(0.32) 0.18
(0.05) 0.20
(0.05) > 130 > 130
Vacuum Pouch
Material 0.7917 0.8094 0.57
(1.26) 7.24
(9.42) 0.25
(0.09) 0.43
(0.16) > 130 > 130
R-square (Std. Error) (days) p (Std. Error) 4-D Reduction
(± days)
Butcher Paper 0.9835 0.60 (0.32) 0.32 (0.03) 49.4
Cardboard Box Material 0.9685 0.25 (0.23) 0.21 (0.03) > 130
PVC Overwrap Film 0.9502 0.16 (0.21) 0.19 (0.03) > 130
Vacuum Pouch
Material 0.9312 0.43 (0.53) 0.24 (0.05) > 130

84
iv. Survival of E. coli O157:H7 on soiled food packaging materials inoculated at a low
inoculation level and stored at 25º C
Soiled food packaging materials with an initial level of E. coli O157:H7 of approximately
4 log CFU/cm2, had survivors even on the 130th day of storage at 25º C (Figure 2.5).
Under these conditions, butcher paper material harbored the greatest number of survivors
at the end of the trial, while populations on cardboard yielded the smallest counts when
sampled at 130 days of storage.
Figure 2.5 �– E. coli O157:H7 survival (Log CFU/cm2) on food packaging materials soiled with ground beef homogenate inoculated with approximately 4 log CFU/cm2 of E. coli O157:H7 and stored at 25º C for up to 130 days (Data in Appendix Table 45)

85
Survivors were collected at a level near 1 log CFU/cm2 on the last day of sampling,
regardless of behavior of the pathogen during the rest of the study (see Appendix Table
45 for results, and tables 46 and 47 for individual replicate results, while Table 48 shows
total aerobic plate counts and Tables 49 and 50 show individual replicates), with lowest
counts found on cardboard. However, since populations were similar on many days of
sampling, further analysis is warranted to discern if certain materials were less hospitable
to survivors than others.
While butcher paper yielded higher counts on TSA, it must be noted that not all of the
bacteria was E. coli O157:H7. Background flora was present, and a lower initial dose of
the pathogen may have been instrumental in allowing background flora to survive in
higher numbers on this material (Figure 2.6).
Figure 2.6 �– Total aerobic bacteria survival (Log CFU/cm2) on food packaging materials soiled with ground beef homogenate inoculated with approximately 4 log CFU/cm2 of E. coli O157:H7 and stored at 25º C for up to 130 days (Data in Appendix Table 48)

86
E. coli O157:H7 cells inoculated on packaging materials at a lower inoculation level
(approximately 4 log CFU/cm2) seemed to mimic the behavior of the higher inoculation
treatment, with steady decrease in counts over time. E. coli O157:H7 populations on
cardboard box material exhibited the smallest and p values (10.9 days, 0.51,
respectively), indicating a rapid initial decrease in population followed by prolonged
persistence. Behavior of the bacteria on soiled butcher paper is described by the largest
and p values (39.51 days, 0.83, respectively), describing the slowest initial decrease in
population with a slightly more linear decrease in population throughout the study than
the bacteria inoculated on other materials.
These results show that E. coli O157:H7 inoculated at approximately 4 log CFU/cm2 and
stored at 25º C will persist for more time than when inoculated at a higher level or stored
at 4º C, regardless of host material. values were higher under these conditions than
under other storage conditions, as were p values (Table 2.5, 2.6). Butcher paper,
according to the Weibull model, did not reduce by 1 log unit until over 41 days of
storage, while the smallest value describes cardboard box material (3.12 days) (Table
2.6). p parameters were higher under these conditions as well compared to other
conditions, showing that death of the pathogen at 25º C followed a very linear trend
among all inoculated materials.
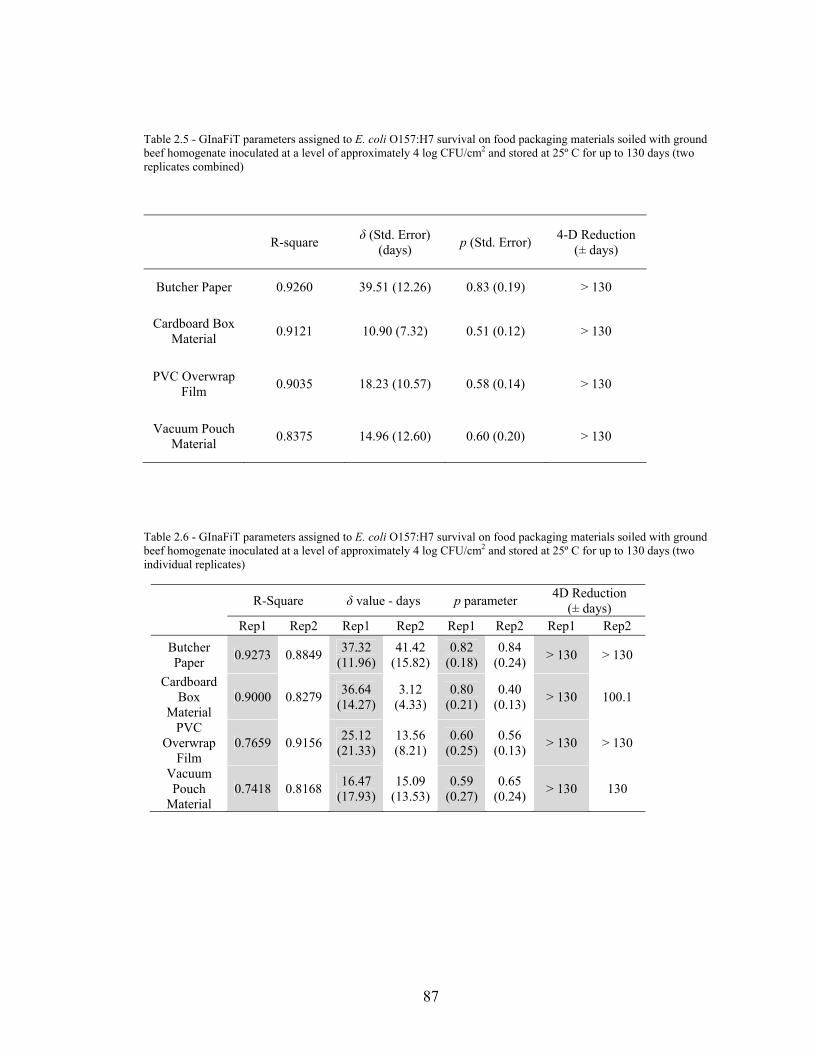
87
Table 2.5 - GInaFiT parameters assigned to E. coli O157:H7 survival on food packaging materials soiled with ground beef homogenate inoculated at a level of approximately 4 log CFU/cm2 and stored at 25º C for up to 130 days (two replicates combined)
Table 2.6 - GInaFiT parameters assigned to E. coli O157:H7 survival on food packaging materials soiled with ground beef homogenate inoculated at a level of approximately 4 log CFU/cm2 and stored at 25º C for up to 130 days (two individual replicates)
R-Square value - days p parameter 4D Reduction (± days)
Rep1 Rep2 Rep1 Rep2 Rep1 Rep2 Rep1 Rep2 Butcher Paper 0.9273 0.8849 37.32
(11.96) 41.42
(15.82) 0.82
(0.18) 0.84
(0.24) > 130 > 130
Cardboard Box
Material 0.9000 0.8279 36.64
(14.27) 3.12
(4.33) 0.80
(0.21) 0.40
(0.13) > 130 100.1
PVC Overwrap
Film 0.7659 0.9156 25.12
(21.33) 13.56 (8.21)
0.60 (0.25)
0.56 (0.13) > 130 > 130
Vacuum Pouch
Material 0.7418 0.8168 16.47
(17.93) 15.09
(13.53) 0.59
(0.27) 0.65
(0.24) > 130 130
R-square (Std. Error) (days) p (Std. Error) 4-D Reduction
(± days)
Butcher Paper 0.9260 39.51 (12.26) 0.83 (0.19) > 130
Cardboard Box Material 0.9121 10.90 (7.32) 0.51 (0.12) > 130
PVC Overwrap Film 0.9035 18.23 (10.57) 0.58 (0.14) > 130
Vacuum Pouch Material 0.8375 14.96 (12.60) 0.60 (0.20) > 130

88
v. Survival of E. coli O157:H7 on soiled food packaging material when inoculated at a
low inoculation level and stored at 4º C
Stored at 4º C, no material consistently yielded mean counts at or below the detection
limit during 130 days of storage. Counts of the low inoculum level (4 log CFU/cm2) were
all below 0.5 log CFU/cm2 on the last day of storage. PVC overwrap film harbored the
highest amount of survivors and vacuum pouch material the least (Figure 2.4) (see
Appendix Table 51 for results, and tables 52 and 53 for individual replicate results, while
Table 54 shows total aerobic plate counts and Tables 55 and 56 show individual
replicates). Decreases in the pathogen were more rapid on all packaging materials when
compared with other temperature and inoculation level combinations, as is evidenced by
lower values (time in days for a 1-log reduction). In the same fashion as other
conditions of inoculation and storage, however, mean populations on the last day of
storage were comparable for all materials. Aerobic bacteria counts, however, did not
follow counts of E. coli O157:H7 (Figure 2.8). With a lower initial level of the pathogen,
background flora may have been able to persist at much greater numbers. This is not
entirely unexpected, as the ground beef homogenate used to soil materials was not made
sterile prior to inoculation.
Under these conditions, all values given to E. coli O157:H7 populations were less than
1.00 day of storage (Table 2.7). Small values are indicative of extremely rapid initial
population decrease, showing that low initial inoculation level, coupled with storage at 4º
C is most inhospitable for E. coli O157:H7 on soiled packaging materials.

89
Figure 2.7 �– E. coli O157:H7 survival (Log CFU/cm2) on food packaging materials soiled with ground beef homogenate inoculated with approximately 4 log CFU/cm2 of E. coli O157:H7 and stored at 4º C for up to 130 days (Data in Appendix Table 51)
Figure 2.8 �– Total aerobic bacteria survival (Log CFU/cm2) on food packaging materials soiled with ground beef homogenate inoculated with approximately 4 log CFU/cm2 of E. coli O157:H7 and stored at 4º C for up to 130 days (Data in Appendix Table 54)

90
p parameters were much lower under these conditions than they were under others,
meaning that populations initially decrease rapidly with a portion of the population
persisting for very long. In addition, values were the lower at this
temperature/inoculation level combination than they were in any other. According to the
models fit to the population data, a 1 log CFU/cm2 decrease in population was
experienced on all materials before 1 day of storage had elapsed. This is more desirable
than the values at 25º C, which ranged from less than one week of storage to nearly six
weeks of storage before a 1-log reduction was predicted (Table 2.5 and 2.6). p
parameters on all materials under these conditions were lower than the parameters
describing pathogen behavior when inoculated at a higher level, indicating a less rapid
continued decrease in counts.
Table 2.7 - GInaFiT parameters assigned to E. coli O157:H7 survival on food packaging materials soiled with ground beef homogenate inoculated at a level of approximately 4 log CFU/cm2 and stored at 4º C for up to 130 days (two replicates combined)
R-square (Std. Error) (days) p (Std. Error) 4-D Reduction (±
days)
Butcher Paper 0.9317 0.00 (0.00) 0.12 (0.03) 100.1
Cardboard Box
Material 0.9824 0.27 (0.18) 0.22 (0.02) > 130
PVC Overwrap
Film 0.9748 0.00 (0.00) 0.12 (0.02) > 130
Vacuum Pouch
Material 0.9496 0.12 (0.15) 0.21 (0.03) 100.1
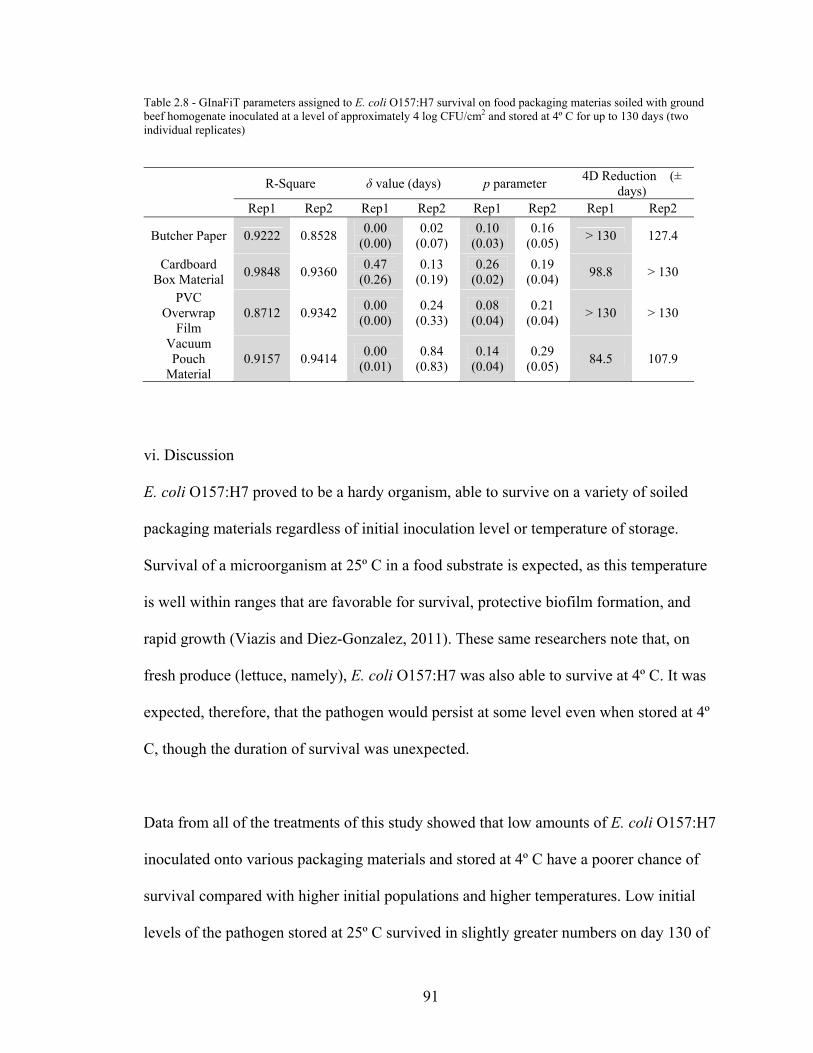
91
Table 2.8 - GInaFiT parameters assigned to E. coli O157:H7 survival on food packaging materias soiled with ground beef homogenate inoculated at a level of approximately 4 log CFU/cm2 and stored at 4º C for up to 130 days (two individual replicates)
vi. Discussion
E. coli O157:H7 proved to be a hardy organism, able to survive on a variety of soiled
packaging materials regardless of initial inoculation level or temperature of storage.
Survival of a microorganism at 25º C in a food substrate is expected, as this temperature
is well within ranges that are favorable for survival, protective biofilm formation, and
rapid growth (Viazis and Diez-Gonzalez, 2011). These same researchers note that, on
fresh produce (lettuce, namely), E. coli O157:H7 was also able to survive at 4º C. It was
expected, therefore, that the pathogen would persist at some level even when stored at 4º
C, though the duration of survival was unexpected.
Data from all of the treatments of this study showed that low amounts of E. coli O157:H7
inoculated onto various packaging materials and stored at 4º C have a poorer chance of
survival compared with higher initial populations and higher temperatures. Low initial
levels of the pathogen stored at 25º C survived in slightly greater numbers on day 130 of
R-Square value (days) p parameter 4D Reduction (± days)
Rep1 Rep2 Rep1 Rep2 Rep1 Rep2 Rep1 Rep2
Butcher Paper 0.9222 0.8528 0.00 (0.00)
0.02 (0.07)
0.10 (0.03)
0.16 (0.05) > 130 127.4
Cardboard Box Material 0.9848 0.9360 0.47
(0.26) 0.13
(0.19) 0.26
(0.02) 0.19
(0.04) 98.8 > 130
PVC Overwrap
Film 0.8712 0.9342 0.00
(0.00) 0.24
(0.33) 0.08
(0.04) 0.21
(0.04) > 130 > 130
Vacuum Pouch
Material 0.9157 0.9414 0.00
(0.01) 0.84
(0.83) 0.14
(0.04) 0.29
(0.05) 84.5 107.9
92
storage compared with storage at 4º C. High levels of the pathogen stored at both 4 and
25º C survived in greater numbers proportional to starting populations than populations
inoculated at approximately 4 log CFU/cm2.
Within each temperature and inoculation level, though, it is difficult to distinguish which
packaging material was least hospitable to survival of E. coli O157:H7, as the general
trends presented in Figures 2.1-2.8 are all quite similar. Pathogen counts on all materials
tested behaved similarly and did not consistently die faster on one material than on
another across different temperature and inoculation combinations. Rather, the
differences between values and p parameters seemed more dependent upon the
temperature of storage and the initial level of inoculation, and not affected by packaging
material.
It should be noted, however, that the homogenate used to soil the packaging materials
was not sterile and contained a small level of background contamination, as is evidenced
by population data on TSA plates (Appendix Tables 36-38, 42-45, 48-50, 54-56). While
competition for resources may occur in a microbiological system, most aerobic plate
counts corresponded very closely to populations recovered on TSA+rifampicin,
suggesting that presence of background contamination had very little effect on the
behavior of the pathogen regardless of initial inoculation level or storage temperature.
Another possible explanation for survival of E. coli O157:H7 on these materials is the
probability of biofilm formation, whether the colonies were mixed-culture or not.

93
Multiple studies show that E. coli O157:H7 survival in adverse conditions is greatly
enhanced by formation of biofilms (Uhlich et al., 2010; Uhlich et al., 2008; Skandamis et
al., 2009). Biofilms can function to protect bacteria against adverse environments,
though are generally only formed during growth phases of the bacteria (Uhlich et al.,
2010). While growth of E. coli O157:H7 was seldom detected on soiled food packaging
material in this study, rapid death occurred only when initial populations were low and
stored at 4º C, suggesting the possibility that biofilm formation may occur before death,
therefore protecting the bacteria to some extent.
Evidence of death of E. coli O157:H7 on soiled food packaging materials is not to say
that the presence of the pathogen at any level is acceptable, as E. coli O157:H7 is
considered an adulterant in any food product. In addition, results cannot be used to claim
that soiled materials are bacteriocidal when exposed to a lower dose of the pathogen.
Most alarming in this study, within the higher inoculation level, is the similarity between
surviving populations stored at 4º and 25º C. Though a refrigerated temperature is
generally held to be safer, or at least more bacteriostatic than room temperature, survival
was comparable between the treatments. This furthers the notion that extreme caution and
care to keep packaging materials clean must be taken to reduce the risk of cross-
contamination to the consumer.
Regardless of inoculation level or temperature of storage, E. coli O157:H7 was able to
persist for up to 130 days on various packaging materials soiled with ground beef

94
homogenate. E. coli O157:H7, even at low levels, was able to persist for extended
periods of time in harsh environments. The bacteria is already regulated and included in
consideration of HACCP programs, therefore additional legal measures against the
pathogen on packaging materials may be unnecessary. However, Bloomfield et al. state
that the infective dose for E. coli O157:H7 can be as low as 10 cells, and certain
infections have been known to stem from doses of less than 100 total cells (2007).
Because of this, extra care must be taken to keep food packaging materials clean and free
from sources of contamination.
When designing food processing plants or storage facilities for meat products in retail
establishments or in the home, conscious effort to protect packaging material from
contamination should be a priority. Firstly, packaging should be stored in a clean,
elevated area removed from food storage prior to use, free from exterior contamination.
Many establishments already employ this practice, but keeping vehicles of cross-
contamination away from food product would serve to limit possibilities of an outbreak,
since the pathogen has been demonstrated to survive for extended periods of time, even
in low doses. Secondly, when storing food in retail establishments or the home, packages
that leak should be removed from the vicinity of other food packages, and areas affected
by food soiling should be properly cleaned, effectively preventing otherwise unsoiled
packaging materials from contamination. Lastly, any soiled packaging material or
suspect sources of contamination should be properly removed from the food supply
chain.

95
Results of this study confirmed that low initial levels of the pathogen coupled with
refrigeration temperatures is most detrimental to survival of the pathogen. Though
persistence of a pathogen for up to 130 days is not ideal under any circumstances,
comparison between all treatments indicates that low initial levels of the pathogen,
coupled with refrigeration storage, are most unfavorable to E. coli O157:H7.
E. coli O157:H7 can be controlled by way of antimicrobial intervention, whether it be
thermal processing, antimicrobial food additives, more stringent pre-slaughter control of
equipment, personnel, facilities, and animals (Viazis and Diez-Gonzalez, 2011; Woerner
et al., 2006). These methods are important to implement, as van Elsas et al. (2011) show
report that E. coli O157:H7 is able to persist in adverse environments via genetic
adaptation and molecular pathways when high numbers are present. In addition, the
same researchers hypothesize that when microbiological diversity is lower, E. coli
O157:H7 has a greater chance to fill a niche within the community and utilize available
resources more easily (van Elsas et al., 2011). As with any microbiological sanitation
program, starting with a low microbiological load is ideal and generally leads to less
chance of a pathogen reaching the food supply. This is evidenced by the results of our
study, where samples inoculated with a lower initial level of E. coli O157:H7 and stored
at 4º C had a more rapid and complete decrease in population.

96
IV. Conclusions
Information taken from this experiment is beneficial to develop guidelines for preventing
E. coli O157:H7 cross contamination due to in processing, retail, and consumer
environments. Because E. coli O157:H7 contamination on packaging and survival of the
pathogen is a risk not generally regarded when developing food safety plans, information
of the dangers of handling soiled packaging materials is necessary to prevent illness and
outbreaks due to improper handling or a lack of education. Most importantly, this data
should be considered when implementing plans to control E. coli O157:H7. Care should
be taken to ensure that packaging material is kept clean and away from sources of raw
beef to prevent soiling of new packaging material. In addition, preventing contamination
of beef products, processing equipment, and workers is necessary to keep the pathogen
off of food packaging materials. Finally, while these methods hopefully serve to prevent
E. coli O157:H7 from contaminating packaging material, storage of packaged product in
environments kept at 4º C or less will help to prevent growth, high amounts of survival,
and subsequent cross contamination of meat products.

97
Chapter 5: Comparison of the efficacy of decontaminating agents against susceptible and
multi-drug resistant Salmonella compared to Escherichia coli O157:H7 in beef trimmings
Chapter Overview
During hide removal and evisceration of carcasses, as well as subsequent handling of
products such as trimmings, beef may become contaminated with a host of bacteria. Of
specific concern is the potential presence of Escherichia coli O157:H7 and various
Salmonella serotypes. For this reason, antimicrobial interventions are applied to beef
trimmings in order to reduce contamination levels. The purpose of this study was to
evaluate the behavior of Salmonella serotypes in comparison to E. coli O157:H7 on beef
trimmings when treated with three common antimicrobials. Five different serovars of
Salmonella (Newport �– Antibiotic Susceptible, Newport �– Multi-drug resistant AmpC;
and Typhimurium �– Antibiotic Susceptible, Typhimurium �– Multi-drug resistant, and
Typhimurium �– Multi-Drug Resistant AmpC) and E. coli O157:H7 were separately
inoculated on beef chuck trimmings and subsequently treated by dipping in either
acidified sodium chlorite (1000ppm), peroxyacetic acid (200ppm), or sodium metasilicate
(40000ppm) solutions. Samples were plated on modified MacConkey sorbitol (SMAC)
agar (supplemented with 20 mg/L novobiocin and 2.5 mg/L potassium tellurite) for E.
coli O157:H7, tryptic soy agar with 100 µg/ml rifampicin for E. coli O157:H7, xylose
lysine deoxycholate agar for Salmonella serovars, and trypic soy agar for total plate
counts; corresponding colony counts were obtained after 24, 48, or 72 h of incubation.
The pH of samples and percent weight changes due to treatment were also measured.
Log counts and pH data were analyzed with SAS using proc GLM. There was a

98
significant reduction (p 0.05) of counts on samples treated with every antimicrobial
intervention, but rarely a significant difference (p 0.05) when comparing Salmonella
serotypes to E. coli O157:H7; the only differences resulting from different initial
inoculation levels. There also existed very few significant differences (p 0.05) within
Salmonella serotypes when compared to each other. Because the antimicrobials tested
were as effective against various Salmonella serotypes as they were against E. coli
O157:H7, it may be concluded that the tested interventions, if used in a meat processing
facility against E. coli O157:H7 may also be considered effective for control of antibiotic
susceptible and resistant Salmonella serotypes.
I. Introduction
Escherichia coli O157:H7 has been implicated as a cause of foodborne illness in the
United States (Scallan et al., 2011). As such, presence of the pathogen is illegal in meat
products (USDA-FSIS Directive 10,010.1). Evidence of fecal contamination or other
gastrointestinal contents on animal carcasses is guarded against by way of a zero-
tolerance policy, as pathogens are frequently harbored in fecal material (Viazis and Diez-
Gonzalez, 2011). In addition to trimming visible contamination from animal carcasses,
decontaminating antimicrobials are frequently applied to carcasses for the purpose of
controlling E. coli O157:H7. Recent outbreaks, however, have not been limited to E. coli
O157:H7, and both antibiotic susceptible and resistant Salmonella serotypes have been
implicated as causes of foodborne illness (Scallan et al., 2011).
99
Salmonella is the cause of a large portion of reported foodborne illness in the United
States (Scallan et al., 2011). Similar to E. coli O157:H7, Salmonella belongs to the
Enterobacteriaceae family, and contamination of meat products generally occurs during
hide removal and evisceration of meat animals. It is most problematic for foods that will
not be thermally processed and may be undercooked. Similar to contamination of E. coli
O157:H7, introduction of Salmonella can occur from a range of sources, whether that be
fecal, cross-contamination from equipment (Smetlzer et al., 1980), or even lymph
material incorporated into ground product (Arthur et al., 2008). Because of this threat,
antimicrobial interventions are frequently applied to beef animal carcasses to reduce
pathogens such as E. coli O157:H7 and Salmonella.
Some Salmonella serotypes have been shown to possess drug-resistant properties
(Antunes et al., 2003). However, Bacon et al. (2003) reported that resistance or
susceptibility to antibiotics has little to do with survival of Salmonella when challenged
with decontaminating treatments commonly used in the meat industry. Because of the
threat of Salmonella outbreaks in the food supply, it is necessary to compare the effects
of decontaminating antimicrobials against antibiotic susceptible and resistant serotypes of
Salmonella to E. coli O157:H7.
Selected for this study were three common antimicrobials: acidified sodium chlorite
(1000ppm, 25±2 º C), peroxyacetic acid (200ppm, 25±2 º C), and sodium metasilicate
(40000ppm, 25±2 º C). Acidified sodium chlorite, although acidic, functions primarily as
an oxidizing agent. Peroxyacetic acid is classified as an organic acid, functioning by

100
altering the pH of the product to be treated. Sodium metasilicate has a very high pH and
is used as an alkaline cleaner (Sharma and Beuchat, 2004). These antimicrobials have
potential to be effective against E. coli O157:H7 when applied to whole beef carcasses
prior to chilling, or applied via spray application to beef primal and subprimal cuts (Quilo
et al., 2009; Pohlman et al., 2007; King et al., 2005). The objective of the study,
therefore, was to evaluate whether these interventions known for reducing E. coli
O157:H7 contamination on beef trimmings are as effective in reducing contamination of
multiple drug resistant (MDR) and susceptible Salmonella Newport and Salmonella
Typhimurium on beef trimmings, and to evaluate possible differences between
populations of antibiotic susceptible and resistant serotypes after chemical
decontamination treatments.
II. Materials and methods
i. Culture preparation
Escherichia coli O157:H7 strains used in the study include ATCC 43895, C1-057, C1-
072, and C1-109. All inocula of these strains were prepared to be rifampicin-resistant
according to Kaspar and Tamplin (1993). Salmonella Newport strains tested included
antibiotic susceptible strains CVM N4505, CVM N18445, CVM N1509, and FSL S5-
639. Salmonella Newport, multi-drug resistant, AmpC strains included CVM 22698,
CVM N19852, FSL S5-436, and FSL S5-920. Salmonella Typhimurium, antibiotic
susceptible strains included CVM N7300, CVM N15788, CVM N18534, and FSL S5-
536. Salmonella Typhimurium, multi-drug resistant strains included CVM N6431, CVM
30662, FSL R6-215, and FSL R8-2540. Lastly, Salmonella Typhimurium, multi-drug
101
resistant, AmpC strains used included CVM N176, CVM 33831, CVM 30034, and FSL
S5-786. Table 3.1 shows the sources and antibiotic resistance profiles of Salmonella
strains.
Each Salmonella strain was kept on XLD agar (Xylose Lysine Deoxycholate; Acumedia,
Neogen Corporation, Lansing MI) until three days prior to the experiment. One single
colony was aseptically selected from the agar with a flame-sterilized, air-cooled loop and
activated in 10 ml of TSB (Difco, Becton Dickinson, Sparks, MD) by incubating at 35º C
for 24 hours, with the exception of the E. coli O157:H7 strains, which were grown on
TSA+Rif agar (Acumedia, Neogen Corporation, Lansing MI, plus 5 ml Rifampicin
supplement for a concentration of 100 µg/ml) and then activated in TSB+Rif broth
(Difco, Becton Dickinson, Sparks, MD with 50 l Rifampicin supplement, 100 µg/ml).
After 24 h of incubation, 0.1 ml of the cultured broth was subcultured into fresh TSB (or
TSB+Rif) and placed in an incubator set at 35º C for an additional 24 h.

102
Table 3.1: Sources and antibiotic resistance profiles of S. Newport and S. Typhimurium strains Salmonella Serotype Strain Source Antibiotic Resistance *
Phenotype: Susceptible/MDR/MDR-AmpC
Provided by
Newport CVM N4505 Ground Turkey S Susceptible Dr. Zhao CVM N18445 Ground Beef S Susceptible Dr. Zhao CVM N1509 Ground Turkey S Susceptible Dr. Zhao FSL S5-639 Human S Susceptible Dr. Wiedmann
CVM 22698 Pork Chop AMP, CHL, STR, FIS, TET, AUG2, XNL, AXO, FOX, SXT
MDR-AmpC Dr. Zhao
CVM N19852 Ground Beef AMP, CHL, STR, FIS, TET, AUG2, XNL, AXO, FOX, KAN
MDR-AmpC Dr. Zhao
FSL S5-436 Bovine AMP, CHL, STR, FIS, TET, AUG2, XNL, AXO, FOX, KAN
MDR-AmpC Dr. Wiedmann
FSL S5-920 Bovine AMP, CHL, STR, FIS, TET, AUG2, XNL, AXO, FOX, KAN
MDR-AmpC Dr. Wiedmann
Typhimurium CVM N7300 Chicken Breast S Susceptible Dr. Zhao CVM N15788 Ground Beef S Susceptible Dr. Zhao CVM N18534 Chicken Breast S Susceptible Dr. Wiedmann FSL S5-536 Human S Susceptible Dr. Wiedmann
CVM N6431 Chicken Breast AMP, CHL, STR, FIS, TET MDR Dr. Zhao
CVM 30662 Chicken Breast AMP, CHL, STR, FIS, TET MDR Dr. Zhao
FSL R6-215 Human AMP, CHL, STR, FIS, TET MDR Dr. Wiedmann

103
FSL R8-2540 Human AMP, CHL, STR, FIS, TET MDR Dr. Wiedmann
CVM N176 Chicken Breast AMP, CHL, STR, FIS, TET, AUG2, XNL, AXO, FOX
MDR-AmpC Dr. Zhao
CVM 33831 Cattle AMP, CHL, STR, FIS, TET, AUG2, XNL, AXO, FOX, SXT, KAN
MDR-AmpC Dr. Zhao
CVM 30034 Ground Turkey AMP, CHL, STR, FIS, TET, AUG2, XNL, AXO, FOX, NAL, KAN
MDR-AmpC Dr. Zhao
FSL S5-786 Bovine AMP, CHL, STR, FIS, TET, AUG2, XNL, AXO, FOX, KAN
MDR-AmpC Dr. Wiedmann
* Per results of the Sensititre® antimicrobial susceptibility system CMV2AGNF panel (Trek Diagnostic Systems). Antibiotics included on the panel include ampicillin (AMP), amoxicillin/clavulanic acid (AUG2), cefoxitin (FOX), ceftiofur (XNL), ceftriaxone (AXO), chloramphenicol (CHL), ciprofloxacin (CIP), gentamicin (GEN), kanamycin (KAN), nalidixic acid (NAL), streptomycin (STR), sulfisoxazole (FIS), tetracycline (TET), trimethoprim/sulfamethoxazole (SXT) MDR: resistant to at least ampicillin, chloramphenicol, streptomycin, sulfisoxazole, and tetracycline (ACSSuT) MDR-AmpC: resistant to at least ACSSuT, amoxicillin-clavulanic acid and ceftiofur, and a decreased susceptibility to ceftriaxone (MIC 2 g/ml) S: sensitive to all tested antibiotics
Source: Geornaras et al., 2011
104
The day of the experiment, all strains in a serotype were combined in centrifuge tubes
and centrifuged (Eppendorf 5810 R, 4° C, 4,629 x g). The supernatant was discarded and
the pellets were washed in Phosphate Buffered Saline (PBS; Fisher Scientific, Fair Lawn,
NJ). The centrifugation cycle was repeated once, the supernatant discarded, and the
pellets resuspended in 40 ml PBS and mixed by vortexing before serial dilutions in PBS
were made to achieve an inoculum level of approximately 5-6 log CFU/ml.
ii. Beef trimmings preparation
Beef chuck rolls were obtained the week of the experiment from a local processor prior to
the application of any subprimal antimicrobial intervention, and transported chilled to the
Colorado State University Meat Science Laboratory. Beef chuck rolls were fabricated
into 1x5x10 cm (thickness x width x length) trim samples and individual weights were
recorded.
iii. Decontamination solution preparation
Depending on the day of the experiment, acidified sodium chlorite (Ecolab, St. Paul, MN,
1000ppm, 25±2 º C, pH 2.5 ± 0.0), peroxyacetic acid (Ecolab, 200ppm 25±2 º C, pH 3.8
± 0.1), and sodium metasilicate (Danisco, New Century, KS, 40000ppm, 25±2 º C, pH
12.6 ± 0.1) were tested for efficacy. Each antimicrobial was prepared in sterile deionized
water according to the manufacturer�’s instructions in sterile graduated cylinders less than
30 minutes prior to application of treatment to beef trimming samples and stored in sterile
autoclaved containers.

105
iv. Inoculation of beef trimmings
In a biosafety cabinet, one side of the beef trimmings was spot-inoculated with a 100 µl
cocktail of either Salmonella or E. coli O157:H7, achieving a final inoculum level of
approximately 3 log CFU/cm2. The trimmings were placed in a 4º C walk-in cooler for 10
minutes, then the opposite side was inoculated and placed back in the cooler for an
additional 10 minutes. The trimmings were allowed a total of 20 minutes for attachment
of the bacteria.
v. Treatment of contaminated beef trimmings
At the end of the prescribed attachment period, the trimmings were removed and either
sampled or treated with a decontaminant. Untreated samples were placed in 100 ml of
Dey-Engley (DE) neutralizing broth (Becton, Dickinson and Company, Sparks, MD) and
masticated for 120 s in a mechanical agitator (6 strokes per second) (Masticator, IUL
Instruments, Barcelona, Spain). Samples to which antimicrobial treatments were applied
were treated for 30 seconds via dipping in a new Whirl-Pak bag containing 150 ml of
decontaminating solution (Whirl-Pak, Modesto, CA) then allowed to drain for 60 seconds
in a sterile colander suspended over a container to capture drained liquid. After treatment,
the beef trimmings were placed in sterile Whirl-Pak bags and stored at 4º C for one hour
before microbiological sampling to simulate time gaps in the meat industry between
fabrication and processing of beef trim.
106
vi. Sampling of contaminated beef trimmings
Escherichia coli O157:H7 colonies were enumerated on modified MacConkey Sorbitol
(SMAC) agar (mSMAC, MacConkey Sorbitol Agar, Difco, Becton and Dickinson,
Sparks, MD modified with 20 mg/l novobiocin, and 2.5 mg/l Potassium Tellurite, Sigma-
Aldrich, St. Louis, MO), Tryptic Soy agar (TSA) supplemented with 100 µg/ml
rifampicin, and TSA agar (TSA, Acumedia, Neogen Corporation, Lansing MI).
Salmonella colonies were enumerated on xylose lysine deoxycholate (XLD) agar, and
TSA. In addition to inoculated samples, background flora was determined without
treatment or inoculation on TSA, TSA+Rif, XLD, and mSMAC agar. Samples were
serially diluted (10-fold) with 0.1% buffered peptone water (Difco, Becton and
Dickinson, Franklin Lakes, NJ). TSA+Rif and XLD agar were incubated at 35º C for 24
hours prior to counting, mSMAC agar was incubated at 35º C for 48 hours prior to
counting, and TSA agar was incubated for 72 hours at 25º C prior to counting. After
incubating and counting colonies, data was entered into an Excel spreadsheet (Microsoft
Excel 2008 for Mac) and converted to log CFU/cm2.
The pH of decontaminating solutions and samples, both treated and untreated, was
measured with a pH meter (UB-5 UltraBasic pH Meter, Denver Instrument, Arvada, CO).
For each treatment, 24 hour pH samples were taken to evaluate the pH effect of the
antimicrobials after 24 h of refrigerated storage. Values were combined and reported as
mean values.

107
In addition, moisture uptake was calculated by weighing the samples prior to inoculation,
recording the weight, and then weighing the samples after treatment and draining.
Findings are expressed as a percentage increase over the untreated sample�’s weight.
vii. Statistical analysis of data
Three samples were analyzed per replicate, two replicate studies were conducted, for a
total of six samples for each treatment. Results were analyzed in SAS (Version 9.2, SAS,
Inc., Cary, NC) using the Proc MIXED procedure to compare Salmonella serovars to the
reference organism, E. coli O157:H7. The student-based t-test in the proc GLM
procedure was also used to compare mean counts before and after treatment of each
serotype within each antimicrobial. For both analyses, P values smaller than 0.05 were
considered to be statistically significant differences. Finally, using the Proc GLM
procedure with Tukey�’s HSD separation of means ( 0.05), pairwise comparisons were
made between all Salmonella serotypes and within Salmonella serovars, both antibiotic
resistant and susceptible. P-values smaller than 0.05 were considered to be statistically
significant.
III. Results and discussion
i. Effect of acidified sodium chlorite
Salmonella serotypes, when treated with acidified sodium chlorite (1000ppm) were not
statistically different (P 0.05) from E. coli O157:H7 (Figures 3.1-3.3), with the slight
exception of Salmonella Typhimurium, multidrug resistant AmpC. However, this could

108
be attributed to a significantly lower (P 0.05) starting population. It can be concluded,
therefore, that while some Salmonella serotypes exhibit a statistically different (P 0.05)
population from E. coli O157:H7, when treated with ASC (1000ppm) for 30s, behavior of
Salmonella serotypes, both antibiotic resistant and susceptible, is similar to that of E. coli
O157:H7.
Figure 3.1 - Reduction of Salmonella serotypes (antibiotic susceptible, multi-drug resistant, and multi-drug resistant; AmpC) and Escherichia coli O157:H7 on inoculated beef trimmings when treated with acidified sodium chlorite (dipping 30s) (1000ppm) (TSA+rif/XLD) (Data in Appendix Table 57)
Log
CFU
/cm
2
Susceptible MDR MDR-AmpC
Typhimurium
Susceptible MDR-AmpC
Newport
O157:H7
Acidified Sodium Chlorite 1000ppm
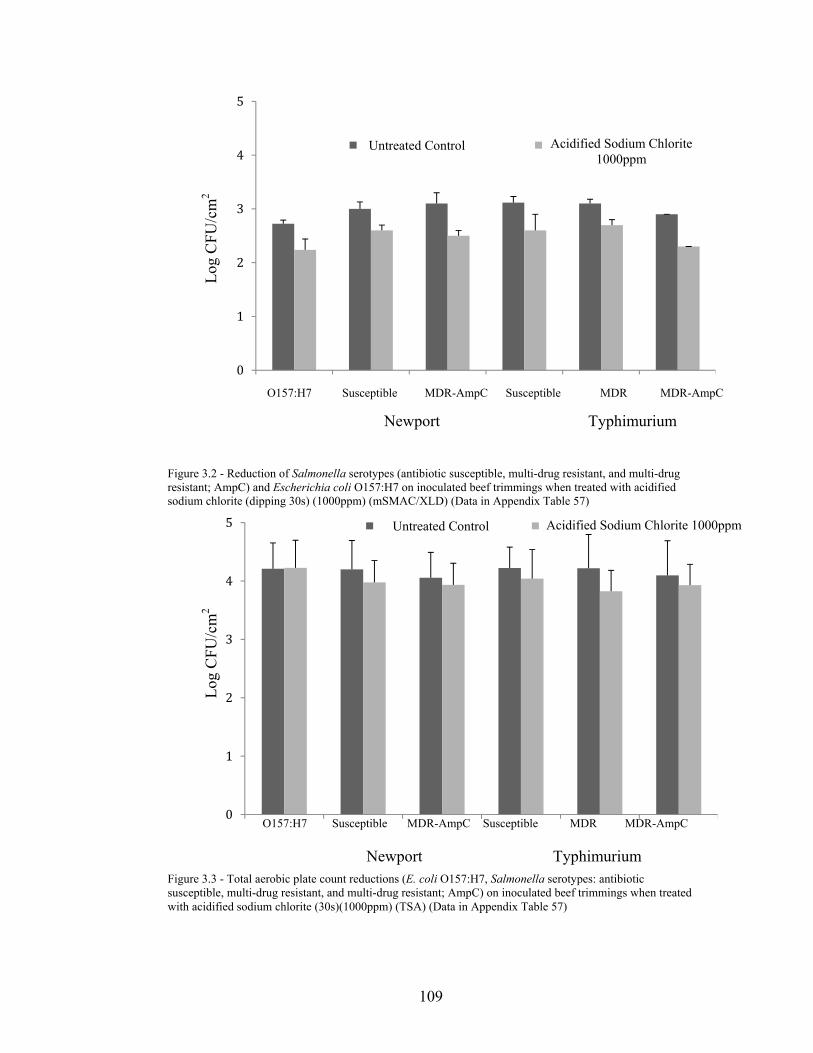
109
O157:H7
Untreated Control
Log
CFU
/cm
2
Susceptible MDR MDR-AmpC
Typhimurium
Susceptible MDR-AmpC
Newport
Figure 3.2 - Reduction of Salmonella serotypes (antibiotic susceptible, multi-drug resistant, and multi-drug resistant; AmpC) and Escherichia coli O157:H7 on inoculated beef trimmings when treated with acidified sodium chlorite (dipping 30s) (1000ppm) (mSMAC/XLD) (Data in Appendix Table 57)
Figure 3.3 - Total aerobic plate count reductions (E. coli O157:H7, Salmonella serotypes: antibiotic susceptible, multi-drug resistant, and multi-drug resistant; AmpC) on inoculated beef trimmings when treated with acidified sodium chlorite (30s)(1000ppm) (TSA) (Data in Appendix Table 57)
Acidified Sodium Chlorite 1000ppm
Acidified Sodium Chlorite 1000ppm
O157:H7
Untreated Control
Log
CFU
/cm
2
Susceptible MDR MDR-AmpC
Typhimurium
Susceptible MDR-AmpC
Newport
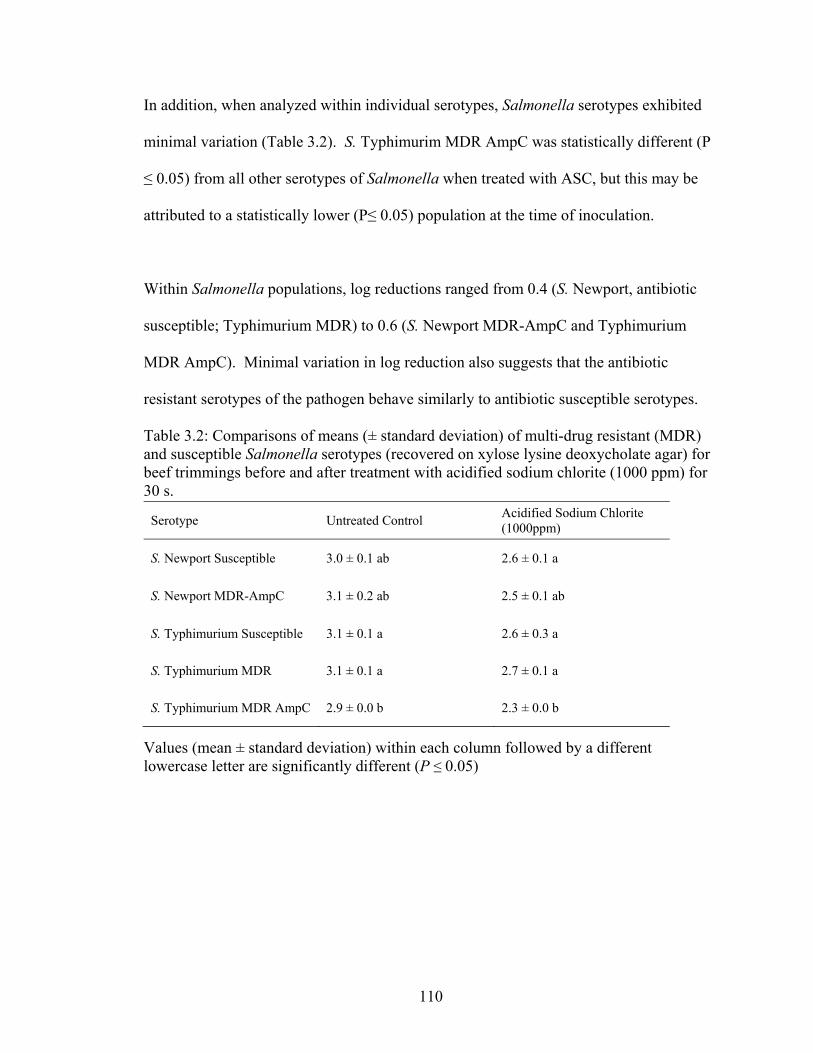
110
In addition, when analyzed within individual serotypes, Salmonella serotypes exhibited
minimal variation (Table 3.2). S. Typhimurim MDR AmpC was statistically different (P
0.05) from all other serotypes of Salmonella when treated with ASC, but this may be
attributed to a statistically lower (P 0.05) population at the time of inoculation.
Within Salmonella populations, log reductions ranged from 0.4 (S. Newport, antibiotic
susceptible; Typhimurium MDR) to 0.6 (S. Newport MDR-AmpC and Typhimurium
MDR AmpC). Minimal variation in log reduction also suggests that the antibiotic
resistant serotypes of the pathogen behave similarly to antibiotic susceptible serotypes.
Table 3.2: Comparisons of means (± standard deviation) of multi-drug resistant (MDR) and susceptible Salmonella serotypes (recovered on xylose lysine deoxycholate agar) for beef trimmings before and after treatment with acidified sodium chlorite (1000 ppm) for 30 s.
Values (mean ± standard deviation) within each column followed by a different lowercase letter are significantly different (P 0.05)
Serotype Untreated Control Acidified Sodium Chlorite (1000ppm)
S. Newport Susceptible 3.0 ± 0.1 ab 2.6 ± 0.1 a
S. Newport MDR-AmpC 3.1 ± 0.2 ab 2.5 ± 0.1 ab
S. Typhimurium Susceptible 3.1 ± 0.1 a 2.6 ± 0.3 a
S. Typhimurium MDR 3.1 ± 0.1 a 2.7 ± 0.1 a
S. Typhimurium MDR AmpC 2.9 ± 0.0 b 2.3 ± 0.0 b

111
Table 3.3: Comparisons of means (± standard deviation) of multi-drug resistant (MDR) and susceptible Salmonella Typhimurium (recovered on xylose lysine deoxycholate agar) for beef trimmings before and after treatment with acidified sodium chlorite (1000 ppm) for 30 s.
Serotype Untreated Control Acidified Sodium Chlorite (1000ppm)
S. Typhimurium Susceptible 3.1 ± 0.1 a 2.6 ± 0.3 a
S. Typhimurium MDR 3.1 ± 0.1 a 2.7 ± 0.1 a
S. Typhimurium MDR AmpC 2.9 ± 0.0 b 2.3 ± 0.0 b
Values (mean ± standard deviation) within each column followed by a different lowercase letter are significantly different (P 0.05) Table 3.4: Comparisons of means (± standard deviation) of multi-drug resistant (MDR) and susceptible Salmonella Newport (recovered on xylose lysine deoxycholate agar) for beef trimmings before and after treatment with acidified sodium chlorite (1000 ppm) for 30 s.
Serotype Untreated Control Acidified Sodium Chlorite (1000ppm)
S. Newport Susceptible 3.0 ± 0.1 a 2.6 ± 0.1 a
S. Newport MDR-AmpC 3.1 ± 0.2 a 2.5 ± 0.1 a
Values (mean ± standard deviation) within each column followed by a different lowercase letter are significantly different (P 0.05)
These results imply that, if ASC has been validated to reduce E. coli O157:H7
contamination on beef trimmings, it is effective in reducing populations of Salmonella,
whether they are resistant or susceptible to antibiotics. The most important finding of
this aspect of the study is that pathogens did not behave differently from species to
species or serotype to serotype.

112
ii. Peroxyacetic acid
Reductions (P 0.05) were experienced across all E. coli O157:H7 samples as well as
Salmonella samples when treated with peroxyacetic acid (200ppm). No Salmonella
serotypes exhibited a significantly (P 0.05) lower count from E. coli O157:H7 when
treated with PAA, except for Typhimurium MDR, though differences may be attributed
to higher starting populations. All treated serotypes exhibited a decrease in population of
0.5 to 0.7 log CFU/cm2 regardless of starting values, including counts on mSMAC
(Figures 3.4, 3.5, and 3.6). Despite statistically different (P 0.05) populations (before
and after treatment), reductions were numerically similar. Regardless of drug resistance
or susceptibility, Salmonella serotypes responded similarly to E. coli O157:H7 when
treated with PAA.
Untreated Control
Log
CFU
/cm
2
Susceptible MDR MDR-AmpC
Typhimurium
Susceptible MDR-AmpC
Newport O157:H7
Figure 3.4 - Reduction of Salmonella serotypes (antibiotic susceptible, multi-drug resistant, and multi-drug resistant; AmpC) and Escherichia coli O157:H7 on inoculated beef trimmings when treated with peroxyacetic acid (dipping 30s) (200ppm) (TSA+rif/XLD) (Data in Appendix Table 58)
Peroxyacetic Acid 200ppm

113
0
1
2
3
4
5
O157:H7
Untreated Control
Log
CFU
/cm
2
Susceptible MDR MDR-AmpC
Typhimurium
Susceptible MDR-AmpC
Newport
Figure 3.5 - Reduction of Salmonella serotypes (antibiotic susceptible, multi-drug resistant, and multi-drug resistant; AmpC) and Escherichia coli O157:H7 on inoculated beef trimmings when treated with peroxyacetic acid (dipping 30s) (200ppm) (mSMAC/XLD) (Data in Appendix Table 58)
Figure 3.6 - Total aerobic plate count reductions (E. coli O157:H7, Salmonella serotypes: antibiotic susceptible, multi-drug resistant, and multi-drug resistant; AmpC) on inoculated beef trimmings when treated with peroxyacetic acid (30s)(200ppm) (TSA) (Data in Appendix Table 58)
Peroxyacetic Acid 200ppm
Peroxyacetic Acid 200ppm
O157:H7
Log
CFU
/cm
2
Susceptible MDR MDR-AmpC
Typhimurium
Susceptible MDR-AmpC
Newport
Untreated Control
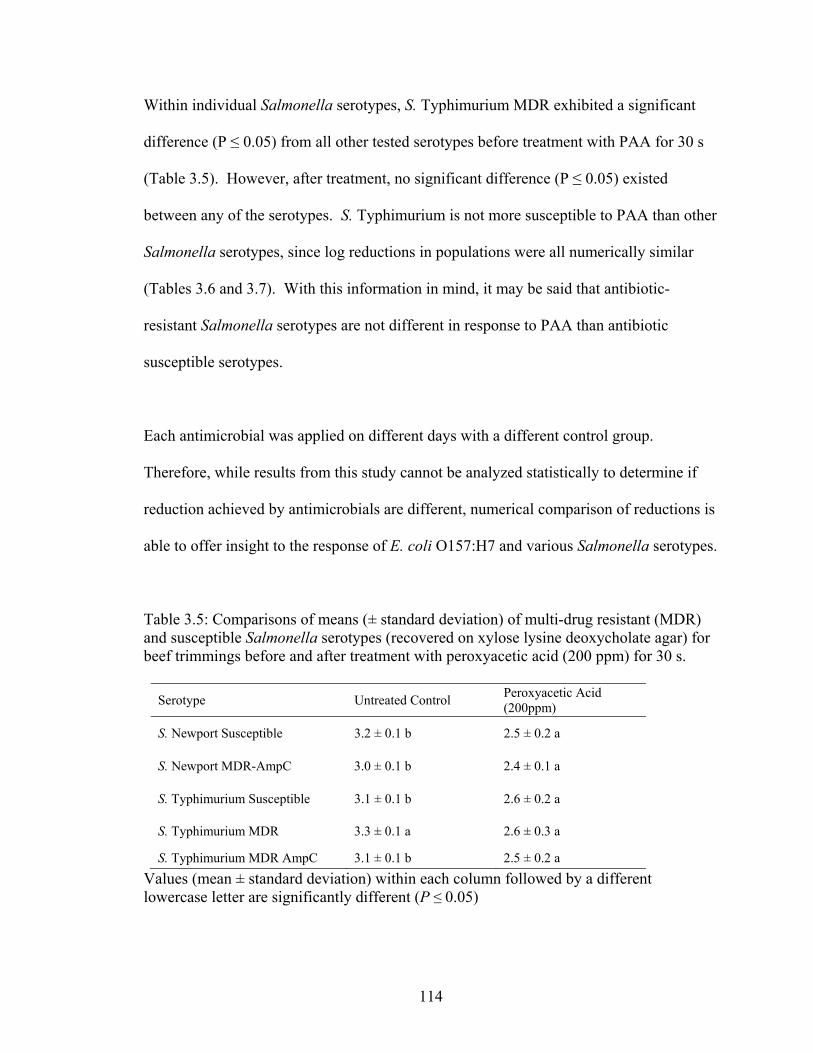
114
Within individual Salmonella serotypes, S. Typhimurium MDR exhibited a significant
difference (P 0.05) from all other tested serotypes before treatment with PAA for 30 s
(Table 3.5). However, after treatment, no significant difference (P 0.05) existed
between any of the serotypes. S. Typhimurium is not more susceptible to PAA than other
Salmonella serotypes, since log reductions in populations were all numerically similar
(Tables 3.6 and 3.7). With this information in mind, it may be said that antibiotic-
resistant Salmonella serotypes are not different in response to PAA than antibiotic
susceptible serotypes.
Each antimicrobial was applied on different days with a different control group.
Therefore, while results from this study cannot be analyzed statistically to determine if
reduction achieved by antimicrobials are different, numerical comparison of reductions is
able to offer insight to the response of E. coli O157:H7 and various Salmonella serotypes.
Table 3.5: Comparisons of means (± standard deviation) of multi-drug resistant (MDR) and susceptible Salmonella serotypes (recovered on xylose lysine deoxycholate agar) for beef trimmings before and after treatment with peroxyacetic acid (200 ppm) for 30 s.
Serotype Untreated Control Peroxyacetic Acid (200ppm)
S. Newport Susceptible 3.2 ± 0.1 b 2.5 ± 0.2 a
S. Newport MDR-AmpC 3.0 ± 0.1 b 2.4 ± 0.1 a
S. Typhimurium Susceptible 3.1 ± 0.1 b 2.6 ± 0.2 a
S. Typhimurium MDR 3.3 ± 0.1 a 2.6 ± 0.3 a
S. Typhimurium MDR AmpC 3.1 ± 0.1 b 2.5 ± 0.2 a Values (mean ± standard deviation) within each column followed by a different lowercase letter are significantly different (P 0.05)

115
Table 3.6: Comparisons of means (± standard deviation) of multi-drug resistant (MDR) and susceptible Salmonella Typhimurium (recovered on xylose lysine deoxycholate agar) for beef trimmings before and after treatment with peroxyacetic acid (200 ppm) for 30 s.
Serotype Untreated Control Peroxyacetic Acid (200ppm)
S. Typhimurium Susceptible 3.1 ± 0.1 b 2.6 ± 0.2 a
S. Typhimurium MDR 3.3 ± 0.1 a 2.6 ± 0.1 a
S. Typhimurium MDR AmpC 3.1 ± 0.1 b 2.5 ± 0.2 a
Values (mean ± standard deviation) within each column followed by a different lowercase letter are significantly different (P 0.05) Table 3.7: Comparisons of means (± standard deviation) of multi-drug resistant (MDR) and susceptible Salmonella Newport (recovered on xylose lysine deoxycholate agar) for beef trimmings before and after treatment with peroxyacetic acid (200 ppm) for 30 s.
Serotype Untreated Control Peroxyacetic Acid (200ppm)
S. Newport Susceptible 3.2 ± 0.1 a 2.5 ± 0.2 a
S. Newport MDR-AmpC 3.0 ± 0.1 a 2.4 ± 0.1 a
Values (mean ± standard deviation) within each column followed by a different lowercase letter are significantly different (P 0.05)

116
iii. Sodium metasilicate
No significant differences (P 0.05) were found between counts of E. coli O157:H7 and
Salmonella serotypes when enumerated before and after treatment of contaminated beef
trimmings with sodium metasilicate (40000ppm) on TSA+rif and XLD agar. Untreated
trimming samples inoculated with Salmonella Typhimurium MDR had greater (P 0.05)
microbiological counts than samples contaminated with E. coli O157:H7 when evaluated
using mSMAC. All trimming samples, regardless of species or serotype, exhibited
significant reductions (P 0.05) in counts ranging from 1.3-1.5 log CFU/cm2, though no
counts after treatment were significantly different (P 0.05) (Figures 3.7 �– 3.9).
Figure 3.7 -Reduction of Salmonella serotypes (antibiotic susceptible, multi-drug resistant, and multi-drug resistant; AmpC) and Escherichia coli O157:H7 on inoculated beef trimmings when treated with sodium metasilicate (dipping 30s) (40000ppm) (TSA+rif/XLD) (Data in Appendix Table 59)
Untreated Control
Log
CFU
/cm
2
Susceptible MDR MDR-AmpC
Typhimurium
Susceptible MDR-AmpC
Newport
O157:H7
Sodium Metasilicate 40000ppm

117
Untreated Control
Log
CFU
/cm
2
Susceptible MDR MDR-AmpC
Typhimurium
Susceptible MDR-AmpC
Newport
O157:H7
Log
CFU
/cm
2
Susceptible MDR MDR-AmpC
Typhimurium
Susceptible MDR-AmpC
Newport
O157:H7
Figure 3.8 - Reduction of Salmonella serotypes (antibiotic susceptible, multi-drug resistant, and multi-drug resistant; AmpC) and Escherichia coli O157:H7 on inoculated beef trimmings when treated with sodium metasilicate (dipping 30s) (4%) (mSMAC/XLD) (Data in Appendix Table 59)
Figure 3.9 - Total aerobic plate count reductions (E. coli O157:H7, Salmonella serotypes: antibiotic susceptible, multi-drug resistant, and multi-drug resistant; AmpC) on inoculated beef trimmings when treated with sodium metasilicate (30s)(4%) (TSA) (Data in Appendix Table 59)
Sodium Metasilicate 40000ppm
Sodium Metasilicate 40000ppm
Untreated Control

118
Though S. Typhimurium MDR on beef trimmings exhibited a statistically higher
population (P 0.05) than other Salmonella serotypes prior to treatment, no significant (P
0.05) differences existed between serotypes after treatment with SMS for 30 s. (Table
3.8). This is not indicative of a greater susceptibility to SMS by S. Typhimurium MDR,
but instead a function of small sample sizes. Similar amounts of reduction suggest that
there is no difference in response to chemical decontaminating treatments between
Salmonella serotypes, whether susceptible or resistant to antibiotics (Tables 3.9 and
3.10).
Table 3.8: Comparisons of means (± standard deviation) of multi-drug resistant (MDR) and susceptible Salmonella serotypes (recovered on xylose lysine deoxycholate agar) for beef trimmings before and after treatment with sodium metasilicate (40000ppm) for 30 s.
Serotype Untreated Control Sodium Metasilicate (40000ppm)
S. Newport Susceptible 3.2 ± 0.1 b 1.8 ± 0.3 a
S. Newport MDR-AmpC 3.0 ± 0.1 b 1.6 ± 0.3 a
S. Typhimurium Susceptible 3.1 ± 0.1 b 1.6 ± 0.3 a
S. Typhimurium MDR 3.3 ± 0.1 a 2.0 ± 0.2 a
S. Typhimurium MDR AmpC 3.1 ± 0.1 b 1.6 ± 0.5 a
Values (mean ± standard deviation) within each column followed by a different lowercase letter are significantly different (P 0.05)

119
Table 3.9: Comparisons of means (± standard deviation) of multi-drug resistant (MDR) and susceptible Salmonella Typhimurium (recovered on xylose lysine deoxycholate agar) for beef trimmings before and after treatment with sodium metasilicate (40000ppm) for 30 s.
Serotype Untreated Control Acidified Sodium Chlorite (1000ppm)
S. Typhimurium Susceptible 3.1 ± 0.1 b 1.6 ± 0.3 a
S. Typhimurium MDR 3.3 ± 0.1 a 2.0 ± 0.2 a
S. Typhimurium MDR AmpC 3.1 ± 0.1 b 1.6 ± 0.5 a
Values (mean ± standard deviation) within each column followed by a different lowercase letter are significantly different (P 0.05) Table 3.10: Comparisons of means (± standard deviation) of multi-drug resistant (MDR) and susceptible Salmonella Newport (recovered on xylose lysine deoxycholate agar) for beef trimmings before and after treatment with sodium metasilicate (40000ppm) for 30 s.
Serotype Untreated Control Acidified Sodium Chlorite (1000ppm)
S. Newport Susceptible 3.2 ± 0.1 a 1.8 ± 0.3 a
S. Newport MDR-AmpC 3.0 ± 0.1 a 1.6 ± 0.3 a
Values (mean ± standard deviation) within each column followed by a different lowercase letter are significantly different (P 0.05)
Sodium metasilicate caused the greatest numerical reduction in population of any
decontaminating agent tested. High numerical reduction is obviously a desirable trait for
an antimicrobial, especially when it is demonstrated that the solution is as effective
against antibiotic resistant strains of Salmonella as it is against antibiotic susceptible
strains of the same bacteria, as well as E. coli O157:H7, though use of SMS may not be
appropriate for all applications.

120
iv. pH
pH values between untreated and treated samples and between samples taken at 0 h and
24 h of storage at 4º C were not statistically greater or lower (P < 0.05). Values for beef
trimmings left untreated ranged from 5.79 to 6.23 (0 h, 24 h of storage, respectively)
(untreated). When trimmings were treated with ASC, pH values changed from 5.75 at 0
h to 5.63 by 24 h of storage at 4º C (Figure 3.10). Trimmings treated with PAA changed
from 5.98 to 5.42 from 0 to 24 h, respectively (Figure 3.11) while values for untreated
controls changed from 6.04 (0 h) to 5.44 (24 h). Samples used to test SMS ranged from
6.04 to 5.44 (untreated controls) while treated samples yielded values of 8.66 (0 h) and
then 6.52 (24 h) (Figure 3.12). Processors may worry that an antimicrobial treatment
may cause quality defects in a product over a period of time in which the beef trimmings
are stored, especially if the treatments cause drastic changes in pH. These results clearly
demonstrate that, under these conditions, only SMS causes a drastic increase in pH, with
levels returning close to neutral by 24h of storage at 4º C.
Untreated Control Acidified Sodium Chlorite (1000ppm)
pH
0 h 24 h post treatment sampling
Figure 3.10 - pH of beef trimmings treated with acidified sodium chlorite (1000ppm) before and after treatment (dipping, 30s) and after 24h (Data in Appendix Table 60)

121
Untreated Control Peroxyacetic Acid
(200ppm)
pH
0 h 24 h post treatment sampling
Untreated Control
Sodium Metasilicate (40000ppm)
pH
0 h 24 h post treatment samplingFigure 3.12 - pH of beef trimmings treated with sodium metasilicate (4%) before and after treatment (dipping, 30s) and after 24h (Data in Appendix Table 62)
Figure 3.11 - pH of beef trimmings treated with peroxyacetic acid (200ppm) before and after treatment (dipping, 30s) and after 24h (Data in Appendix C, Table 61)

122
v. Percent weight change
Sodium metasilicate consistently caused greater moisture retention of beef trimming
samples than the other two antimicrobials tested, with values ranging from 4.7 to 6.1%
overall moisture uptake, as opposed to 2.3 �– 4.4% and 1.8 �– 4.0% increase for acidfied
sodium chlorite and peroxyacetic acid , respectively (Table 3.11). This information may
be necessary to consider by processors, as percent weight added by water is controlled by
the USDA (9 CFR 381, 441). The final rule states that no water may be added to raw
meat other than what is necessary to meet food safety requirements. Thusly, knowledge
of the amount of water retained by beef trimmings treated with these decontaminating
solutions is necessary to prevent recourse from the sale of meat with unnecessary water
weight added.
Table 3.11 - Mean weight change (percentage of original weight, ± standard deviation) of beef trimmings treated with Acidified Sodium Chlorite (1000ppm), Peroxyacetic Acid (200ppm), or Sodium Metasilicate (40000ppm) for 30 s.
Serotype Peroxyacetic Acid Sodium Metasilicate Acidified Sodium Chlorite
Weight Change (%) Weight Change (%) Weight Change (%)
Escherichia coli O157:H7 3.43 ± 1.79 6.12 ± 1.52 2.85 ± 0.84
Salmonella Newport �– Susceptible 3.99 ± 1.51 5.50 ± 1.48 3.85 ± 1.95
Salmonella Newport �– MDR-AmpC 3.10 ± 1.09 4.89 ± 0.37 4.37 ±1.12
Salmonella Typhiumurim �– Susceptible 2.21 ± 1.78 4.67 ± 1.03 3.30 ± 0.71
Salmonella Typhiumurim �– MDR 2.78 ± 0.97 5.42 ± 1.41 2.25 ± 0.91
Salmonella Typhiumurim �– MDR-AmpC 1.81 ± 0.40 5.30 ± 1.42 2.89 ± 1.03

123
IV. Conclusions
The goal of these studies was to compare the resistance to antimicrobials of Salmonella
serotypes (antibiotic susceptible and resistant) to a well-studied pathogenic model (E. coli
O157:H7). All decontaminating treatments were effective in reducing both resistant and
susceptible Salmonella as well as E. coli O157:H7, with only very small differences
observed in total reduction of each pathogen tested. Sodium metasilicate caused the
greatest reduction in pathogenic population of all the solutions tested, with ASC and PAA
reducing the pathogens in similar numbers. In addition to microbiological parameters,
changes in pH values and weight added due to the treatments were minimal. As
mentioned previously, statistical differences between serotypes in treatment with ASC
and PAA are most likely due to differing starting population values and a subsequently
small standard deviation. Reductions were similar numerically, and all antimicrobial
treatments caused a statistically significant (P 0.05) decrease in population. Though
sodium metasilicate exhibited more drastic reductions in bacterial populations in this
trial, different methods of application may yield different results. Moreover, an alkaline
cleaner may not be appropriate for every setting, just as an oxidizer or organic acid may
not be appropriate for a certain application. Numerically, the reductions in populations of
E. coli O157:H7 and assorted Salmonella serotypes in response to PAA were similar to
that caused by treatment with ASC. As mentioned previously, peroxyacetic acid has
different characteristics than ASC, one being primarily an oxidizing agent while PAA is
an organic acid. Therefore, processors may decide that one agent is more suitable to
apply to their products than the other. With the results of this study in mind, processors
may use whichever decontaminating agent is appropriate with confidence.

124
Interventions implemented for control of E. coli O157:H7 should be considered effective
for control of a variety of Salmonella serotypes as well. This study investigated the
efficacy of antimicrobials against E. coli O157:H7 and Salmonella serotypes through
dipping, though other methods of application have been proven effective. In considering
antimicrobial interventions for Salmonella serotypes, no change is necessary to control
for the pathogen if measures are already in place to combat the presence of E. coli
O157:H7. If industry regulations and legislation is considered to control Salmonella spp.
on beef trimmings, data from this study may be useful to the industry in combating the
presence of these pathogenic bacteria in beef trimmings.
125
REFERENCES Abdul-Raouf, U.M., L.R. Beuchat, T. Zhao, and M.S. Ammar. 1994. Growth and verotoxin 1 production by Escherichia coli O157:H7 in ground roasted beef. Int J. Food Microbiol. 23:79-88. Allen, K.J., D. Lepp, R.C. McKellar, and M.W. Griffiths. 2008. Examination of stress and virulence gene expression in Escherichia coli O157:H7 using targeted microarray analysis. Food. Path. and Dis. 5:437-447. Andrews, H.L., and A.J. Bäumler. 2005. Salmonella Species. 327-339. In Fratamico, Pina M., Arun K Bhunia, and James L. Smith (ed.), Foodborne Pathogens: Microbio.l and Mol. Biol. Caister Academic Press, Norfolk, UK. Antunes, P., C.Réu, J.C. Sousa, L. Peixe, and N. Pestana. 2003. Incidence of Salmonella from poultry products and their susceptibility to antimicrobial agents. Int. J. Food Microbiol. 82:97-103. Arthur, T., D.M. Brichta-Harhay, J.M. Bosilevac, M.N. Guerini, N. Kalchayanand, J.E. Wells, S.D. Shackelford, T.L. Wheeler, and M. Koohmaraie. 2008. Prevalence and characterization of Salmonella in bovine lymph nodes potentially destined for use in ground beef. J. Food Prot. 71:1685-1688. Arthur, T., N. Kalachayanand, J.M. Bosilevac, D.M. Brichta-Harhay, S.D. Shackelford, J.L. Bono, T.L. Wheeler, and M.Koohmaraie. 2008. Comparison of effects of antimicrobial interventions on multidrug-resistant Salmonella, susceptible Salmonella, and Escherichia coli O157:H7. J. Food Prot. 71:2177-2181. Autio, T., R. Keto-Timonen, J. Lundén, J. Björkroth, and H. Korkeala. 2003. Characterisation of persistent and sporadic Listeria monocytogenes strains by pulsed-field gel electrophoresis (PFGE) and amplified fragment length polymorphism (AFLP). Syst. Appl. Microbiol. 26:539-545. Bacon, R.T., J.N. Sofos, P.A. Kendall, K.E. Belk, and G.C. Smith. 2003. Comparative analysis of acid resistance between susceptible and multi-antimicrobial-resistant Salmonella strains cultured under stationary-phase acid tolerance-inducing and noninducing conditions. J. Food Prot. 66:732-740. Bacon, R.T., J.N. Sofos, K.E. Belk, D.R. Hyatt, and G.C. Smith. 2002. Prevalence and antibiotic susceptibility of Salmonella isolated from beef animal hides and carcasses. J Food Prot. 65:284-290. Blaschek, H.P., H. Wang, M.E. Agle. 2007. Biofilms in the Food Environment. Blackwell Publishing Professional. Ames, IA.

126
Bloomfield, S.F., A.E. Aiello, B.Cookson, C.O�’Boyle, and E.L. Larson. 2007. The effectiveness of hand hygiene procedures in reducing the risks of infections in home and community settings including handwashing and alcohol-based hand sanitizers. Am. J. Infect. Cont. 35:S27-S64. Boyer, R.R., S.S. Sumner, R.C. Williams, K.E. Kniel, and J.M. McKinney. 2011. Role of O-antigen on the Escherichia coli O157:H7 cells hydrophobicity, charge, and ability to attach to lettuce. Int. J. Food Microbiol. 147:228-232. Byelashov, O.A. J.M. Adler, I. Geornaras, K.Y. Ko, K.E. Belk, G.C. Smith, and J.N. Sofos. 2010. Evaluation of brining ingredients and antimicrobials for effects on thermal destruction of Escherichia coli O157:H7 in a meat model system. J. Food Sci. 75:M209-M217. Carlson, B.A., J. Ruby, G.C. Smith, J.N. Sofos, G.R. Bellinger, W.Warren-Serna, B.Centrella, R.A. Bowling, and K.E. Belk. 2008. Comparison of antimicrobial efficacy of multiple beef hide decontamination strategies to reduce levels of Escherichia coli O157:H7 and Salmonella. J. Food Prot. 71:2223-2227. Carpenter, C.E., J.V. Smith, and J.R. Broadbent. 2010. Efficacy of washing meat surfaces with 2% levulinic acid, or lactic acid for pathogen decontamination and residual growth inhibition. Meat Sci. 88:256-260. Cassin, M.H., A.M. Lammerding, E.C.D. Todd, W.Ross, and R.S. McColl. 1998. Quantitative risk assessment for Escherichia coli O157:H7 in ground beef hamburgers. Int. J. Food Microbiol. 41:21-44. Cerf, O. 1977. A review: tailing of survival curves of bacterial spores. J Appl. Bacteriol. 42:1-19. Chaitiemwong, N., W.C. Hazeleger, and R.R. Beumer. 2010. Survival of Listeria monocytogenes on a conveyor belt material with or without antimicrobial additives. Int. J. Food Microbiol, 142:260-263. Chmielewski, R.A.N., and J.F. Frank. 2003. Biofilm formation and control in food processing facilities. Comp. Rev. Food Sci. Food Safety 2:22-32. Clark, C.G., J. Farber, F. Pagotto, N. Ciampa, K. Doré, C. Nadon, K. Bernard, and L.-K. Ng, CPHLN. 2010. Surveillance for Listeria monocytogenes and listeriosis. Epidemiol. Infection, 138:559-572. de Oliveira, M.A, Vanessa M. de Souza, A.M.M. Bergamini, and E.C. Periera De Martinis. 2011. Microbiological quality of ready-to-eat minimally processed vegetables consumed in Brazil. Food Cont. 22:1400-1403.

127
Dourou, D., C.S. Beauchamp, Y. Yoon, I. Geornaras, K.E. Belk, G.C. Smith, G-J.E. Nychas, J.N. Sofos. 2011. Attachment and biofilm formation by Escherichia coli O157:H7 at different temperatures, on various food-contact surfaces encountered in beef processing. Int. J. Food Microbiol. 149:262-268. Gandhi, M., and M.L. Chikindas. 2007. Listeria: A foodborne pathogen that knows how to survive. Int. J. Food Microbiol. 113:1-15. Geeraerd, A.H., V.P. Valdramidis, and J.F. Van Impe. 2005. GInaFiT, a freeware tool to assess non-log-linear microbial survivor curves. Int. J. Food Microbiol. 102:95-105. Geornaras, I., H. Yang, N. Andritsos, A. Fouladkhah, S. Manios, G. Moschonas, M.C. Nunnelly, K.E. Belk, K.K. Nightingale, D.R. Woerner, G.C. Smith, and J.N. Sofos. 2011. Final Report: Evaluation of chemical decontamination treatments for beef trimmings against Escherichia coli O157:H7, Non-O157 shiga toxin-producing E. coli, and antibiotic resistant and susceptible Salmonella typhimurium and Salmonella newport. American Meat Institute Foundation, Accessed 2 December 2011. <http://www.amif.org/ht/a/GetDocumentAction/i/72071> Gianfranceschi, M., and P. Aureli. 1996. Freezing and frozen storage on the survival of Listeria monocytogenes in different foods. Ital. J. Food Sci. 8:303-309. Gill, C.O., and M. Badoni. 2004. Effects of peroxyacetic acid, acidified sodium chlorite or lactic acid solutions on the microflora of chilled beef carcasses. Int. J. Food Microbiol. 91:43-50. Gill, C.O., L.F. Moza, and S. Barbut. 2009. Survival of bacteria in less than thorough cooked, brine-injected steaks. Food Cont. 20:501-507. Gram, L., D. Bagge-Ravn, Y.Y. Ng, P. Gymoese, and B.F. Vogel. 2007. Influence of food soiling matrix on cleaning and disinfection efficiency on surface attached Listeria monocytogenes. Food Cont. 18:1165-1171. Hajmeer, M.N., J.L. Marsden, D.Y.C. Fung, and G.K. Kemp. 2004. Water, sodium dhloride, and acidified sodium chlorite effects on Escherichia coli O157:H7 and Staphylococcus aureus on beef briskets. Meat Sci. 68:277-283. Hamon, M., H. Bierne, and P. Cossart. 2006. Listeria monocytogenes: A multifaceted model. Nat. 4:423-434. Hengge-Aronis, R. 1993. Survival of Hunger and Stress: The role of rpoS in early stationary phase gene regulation in E. coli. Cell 72:165-168. Ingham, S.C., D.R. Buege, B.K. Dropp, and J.A. Losinski. 2004. Survival of Listeria monocytogenes during storage of ready-to-eat meat products processed by drying, fermentation, and/or smoking. J. Food Prot. 67:2698-2702.

128
Janssen, M. A.H. Geeraerd, A. Cappuyns, L. Garcia-Gonzalez, K.M. Vereecken, J. Debevere, F. Devlieghere, and J.F. Van Impe. 2005. Separating lactic acid and pH effects on the Listeria innocua inactivation. Acta Hortic. 674:231-237. Jay, J.M., M.J. Loessner, and D.A. Golden. 2005. Modern Food Microbiology 7th ed. Springer. Junttila, J.R., S.I. Niemala, and J. Hirn. 1988. Minimum growth temperatures of Listeria monocytogenes and nonhaemolytic Listeria. J. Appl. Bacteriol. 65:321-327. Kalmokoff, M.L., J.W. Austin, X.-D. Wan, G. Sanders, S. Banerjee, and J.M. Farber. 2001. Adsorption, attachment, and biofilm formation among isolates of Listeria monocytogenes using model conditions. J. Appl. Microbiol. 91:725-734. Kaspar, C.W. and M.L. Tamplin. 1993. Effects of temperature and salinity on the survival of Vibrio vulnificus in seawater and shellfish. Appl. Environ. Microbiol. 59:2425-2429. Kendall, P., L.C. Medeiros, V. Hillers, G. Chen, and S. Dimascola. 2003. Food handling behaviors of special importance for pregnant women, infants and young children, the elderly, and immune-compromised people. J. Am. Diet. Assoc. 103:1646-1649. Kiessling, C.R., J.H. Cutting, M. Loftis, W.M. Kiessling, A.R. Datta, and J.N. Sofos. 2002. Antimicrobial resistance of food-related Salmonella isolates, 1999-2000. J. Food Prot, 65:603-608. King, D.A., L.M. Lucia, A. Castillo, G.R. Acuff, K.B. Harris, and J.W. Savell. 2005. Evaluation of peroxyacetic acid as a post-chilling intervention for control of Escherichia coli O157:H7 and Salmonella Typhimurium on beef carcass surfaces. Meat Sci. 69:401-407. Knøchel, S. 2010. Listeria monocytogenes �– not only bad but also persistent. Aust. J. Dairy Technol. 65:50-57. Leyer, G.L., and E.A. Johnson. 1993. Acid adaptation induces cross-protection against environmental stresses in Salmonella typhimurium. Appl. Environ. Microbiol. 59:1842-1847. Lundén, J.M., M.K. Miettinen, T.J. Autio, and H.J. Korkeala. 2000. Persistent Listeria monocytogenes strains show enhanced adherence to food contact surface after short contact times. J. Food Prot. 63:1204�–1207. Mafart, P., O. Couvert, S. Gaillard, and I. Leguerinel, 2002. On calculating sterility in thermal preservation methods: application of the Weibull frequency distribution model. Int. J. Food Microbiol. 72:107�–113.

129
Marouani-Gadri, N., O. Firmesse, D. Chassaing, and D. Sandris-Nielsen. 2010. Potential of Escherichia coli O157:H7 to persist and form viable but non-culturable cells on a food-contact surface subjected to cycles of soiling and chemical treatment. Int. J. Food Microbiol. 144:96-103. Marsh, E.J., H. Luo, and H. Wang. 2003. A three-tiered approach to differentiate Listeria monocytogenes biofilm-forming abilities. FEMS Microbiol. Let. 228:203-210. Masters, C.I., J.A. Shallcross, and B.M. Mackey. 1994. Effect of stress treatments on the detection of Listeria monocytogenes and enterotoxigenic Escherichia coli by the polymerase chain reaction. J. Appl. Bacteriol. 77:73-79. M drala, D., W. D browskia, U. Czekaj o-Ko odzieja, E. Daczkowska-Kozona, A. Koronkiewicza, E. Augustynowiczb, and M. Manzanoc. 2003. Persistence of Listeria monocytogenes strains isolated from products in a Polish fish-processing plant over a 1-year period. Food Microbiol. 20:715-724. Møretrø, T., E. Heir, K.R. Mo, O. Habimana, A. Abdelgani, and S. Langsrud. 2010. Factors affecting survival of shigatoxin-producing Escherichia coli on abiotic surfaces. Int. J. Food Microbiol. 138:71-77. National Center for Zoonotic, Vector-Borne, and Enteric Diseases. Centers for Disease Control and Prevention. �“Salmonellosis.�” 2009. Accessed June 2011. <http://www.cdc.gov/nczved/divisions/dfbmd/diseases/salmonellosis/> National Organic Standards Board. �“Handling committee recommendation for §205.605(b) - Sunset of peracetic acid / peroxyacetic acid (CAS # 79-21-0). 2009. Accessed June 2011. <http://www.ams.usda.gov/AMSv1.0/getfile?dDocName=STELPRDC5079514&acct=nosb> OutbreakNet �– Foodborne Outbreak Online Database. Centers for Disease Control and Prevention. Accessed June 2011. <http://wwwn.cdc.gov/foodborneoutbreaks/Default.aspx> Paton, J.C., and A.W. Paton. 1998. Pathogenesis and diagnosis of shiga toxin-producing Escherichia coli infections. Clin. Microbiol. Rev. 11:450-479. Pohlman, F.W., P.N. Dias-Morse, S.A. Quilo, A.H. Brown, Jr., P.G. Crandall, R.T. Baublits, R.P. Story, C. Bokina, and G. Rajaratnam. 2007. Microbial, instrument color and sensory characteristics of ground beef processed from beef trimmings treated with potassium lactate, sodium metasilicate, peroxyacetic acid, or acidified sodium chlorite as single antimicrobial interventions. J. Muscle Foods 20:54-69.

130
Quilo, S.A., F.W. Pohlman, A.H. Brown, Jr., P.G. Crandall, P.N. Dias-Morse, R.T. Baublits, and J.L. Aparicio. 2009. Effects of potassium lactate, sodium metasilicate, peroxyacetic acid, and acidified sodium chlorite on physical, chemical, and sensory properties of ground beef patties. Meat Sci. 82:44-52. Quilo, S.A., F.W. Pohlman, P.N. Dias-Morse, A.H. Brown, Jr., P.G. Crandall, R.T. Baublits, and J.L. Aparicio. 2009. The impact of single antimicrobial intervention treatment with potassium lactate, sodium metasilicate, peroxyacetic acid, and acidified sodium chlorite on non-inoculated ground beef lipid, instrumental color, and sensory characteristics. Meat Sci. 83:345-350. Quilo, S.A., F.W. Pohlman, P.N. Dias-Morse, A.H. Brown, Jr., P.G. Crandall, and R.P. Story. 2010. Microbial, instrument color and sensory characteristics of inoculated ground beef product using potassium lactate, sodium metasilicate or peroxyacetic acid as multiple antimicrobial interventions. Meat Sci. 84:470-476. Rabsch, W., H. Tschäpe, and A.J. Bäumler. 2001. Non-typhoidal salmonellosis: emerging problems. Microb and Infect. 3:237-247. Ransom, J.R., K.E. Belk, J.N. Sofos, J.D. Stopforth, J.A. Scanga, and G.C. Smith. 2003. Comparison of intervention technologies for reducing Escherichia coli O157:H7 on beef cuts and trimmings. Food Prot. Trends 23:24-34. Renier, S., M. Hébraud, and M. Desvaux. 2011. Molecular biology of surface colonization by Listeria monocytogenes: an additional facet of an opportunistic Gram-positive foodborne pathogen. Enviro.n Microbiol. 13:835-850. Riazi, S., and K.R. Matthews. 2011. Failure of foodborne pathogens to develop resistance to sanitizers following repeated exposure to common sanitizers. Int. Biodeterioration Biodegradation. 65:374-378. Riley, L.W., R.S. Remis, S.D. Helgerson, H.B. McGee, J.G. Wells, B.R. Davis, R.J. Herbert, E.S. Olcott, L.M. Johnson, N.T. Hargrett, P.A. Blake, and M.L. Cohen. 1983. Hemmorhagic colitis associated with a rare Esherichia coli serotype. New Engl. J. of Med. 308:681-685. Rossoni, E.M.M., and C.C. Gaylarde. 2000. Comparison of sodium hypochlorite and peracetic acid as sanitising agents for stainless steel food processing surfaces using epifluorescence microscopy. Int. J. Food Microbiol. 61:81-85. Rørvik, M., M. Yndestad, and E. Skjerve. 1991. Growth of Listeria monocytogenes in vacuum-packed, smoked salmon, during storage at 4º C. Int. J. Food Microbiol. 14:111-117.

131
Sauders, B.D., M.D. Sanchez, D.H. Rice, J. Corby, S. Stich, E.D. Fortes, S.E. Roof, and M. Wiedman. 2009. Prevalence and molecular diversity of Listeria monocytogenes in retail establishments. J. Food Prot. 72:2337-2349. Scallan, E., R.M. Hoekstra, F.J. Angulo, R.V. Tauxe, M.-A. Widdowson, S.L. Roy, J.L. Jones, and P.M. Griffin. 2011. Foodborne illness acquired in the United States �– major pathogens. Emerging Infect. Dis. 17:7-15. Semenov, A.V., L. van Overbeek, A.J. Termorshuizen, and A.H.C. van Bruggen. 2011. Influence of aerobic and anaerobic conditions on survival of Escherichia coli O157:H7 and Salmonella enterica serovar Typhimurium in Luria-Bertani broth, farm-yard manure and slurry. J. Environ. Manage. 92:780-787. Sharma, M., and L.R. Beuchat. 2004. Sensitivity of Escherichia coli O157:H7 to commercially available alkaline cleaners and subsequent resistance to heat and sanitizers. Appl. Environ. Microbiol. 70:1795-1803. Shen, C., I. Geornaras, K.E. Belk, G.C. Smith, and J.N. Sofos. 2011. Thermal inactivation of acid, cold, heat, starvation, and desiccation stress-adapted Escherichia coli O157:H7 in moisture-enhanced nonintact beef. J. Food Prot. 74:531-538. Skandamis, P., J.D. Stopforth, L.V. Ashton, I. Geornaras, P.A. Kendall, and J.N. Sofos. 2008. Escherichia coli O157:H7 survival, biofilm formation and acid tolerance under simulated slaughter plant moist and dry conditions. Food Microbiol. 26:112-119. Smeltzer, T., R. Thomas, and G. Collins. 1980. The role of equipment having an accidental or indirect contact with the carcass in the spread of Salmonella in an abattoir. Aust. Vet. J. 56:14-17. Sofos, J.N., and I. Geornaras. 2010. Overview of current meat hygiene and safety risks and summary of recent studies on biofilms, and control of Escherichia coli O157:H7 in nonintact, and Listeria monocytogenes in ready-to-eat, meat products. Meat Sci. 86:2-14. Takahashi, H., T. Suda, Y. Tanaka, and B. Kimura. 2010. Cellular hydrophobicity of Listeria monocytogenes involves initial attachment and biofilm formation on the surface of polyvinyl chloride. Lett. Appl. Microbiol. 50:618-625. Takhistov, P., and B. George. 2004. Linearized kinetic model of Listeria monocytogenes biofilm growth. Bioprocesses Biosyst. Eng. 26:259-270. Tompkin, R.B. 2002. Control of Listeria monocytogenes in the food-processing environment. J. Food Prot. 65:709-725. Tompkin, R.B., V.N. Scott, D.T. Bernard, W.H. Sveum, and K.S. Gombas. 1999. Guidelines to prevent post-processing contamination from Listeria monocytogenes. Dairy, Food, Environ. Prot. 19:8, 551-562.

132
Torres, A.G., C. Jeter, W. Langley, .and G. Matthyse. 2005. Differential binding of Escherichia coli O157:H7 to alfalfa, human epithelial cells, and plastic is mediated by a variety of surface structures. Appl. Environ. Microbiol. 71:8008-8015. Tuttle, J., T. Gomez, M.P. Doyle, J.G. Wells, T. Zhao, R.V. Tauxe, and P.M. Griffin. 1999. Lessons from a large outbreak of Escherichia coli O157:H7 infections: insights into the infectious dose and method of widespread contamination of hamburger patties. Epidemiol. Inf. 122:185-192. Uhlich, G.A., J.R. Sinclair, N.G. Warren, W.A. Chmielecki, and P. Fratamico. 2008. Characterization of shiga toxin-producing Escherichia coli isolates associated with two multistate food-borne outbreaks that occurred in 2006. Appl. Environ. Microbiol. 74:1268-1272. Uhlich, G.A., D.P. Rogers, and D.A. Mosier. 2010. Escherichia coli serotype O157:H7 retention on solid surfaces and peroxide resistance is enhanced by dual-strain biolm formation. Foodborne Path. Dis. 7:935-943. USDA-FSIS. 2009. Safe and suitable ingredients used in the production of meat and poultry products. Accessed 14 December 2011<http://www.fsis.usda.gov/OPPDE/rdad/FSISDirectives/> USDA Food Safety Research Information Office. A focus on Salmonella �– updated version. 2010. Accessed June 2011. <http://fsrio.nal.usda.gov/nal_web/fsrio/fsheet_pf.php?id=223> USDA-FSIS. Executive summary: 2003 FSIS Listeria risk assessment. 2003. Accessed November 2011. <http://www.fsis.usda.gov/PDF/Lm_Deli_Risk_Assess_ExecSumm_2003.pdf> USDA-FSIS. 2000. Revised action plan for control of Listeria monocytogenes for the prevention of foodborne listeriosis. Accessed June 2011.<http://www.fsis.usda.gov/Frame/FrameRedirect.asp?main=http://www.fsis.usda.gov/OA/topics/lm_action.htm> USDA-FSIS Directive 10,010.1. 2010. Verification activities for Escherichia coli O157:H7 in raw beef products, revision 3. Accessed November 2011. <http://www.fsis.usda.gov/OPPDE/rdad/FSISDirectives/10010.1Rev3.pdf> USDA-FSIS Directive 6420.2. 2004. Accessed September 2011 <http://www.fsis.usda.gov/oppde/rdad/fsisdirectives/6420.2.pdf> USDA-FSIS Federal Register. 2003. Control of Listeria monocytogenes in ready-to-eat meat and poultry products. 68:109. <http://www.gpo.gov/fdsys/pkg/FR-2003-06-06/pdf/03-14173.pdf>

133
U.S. Food and Drug Administration, Code of Federal Regulations. 2011. Listeriosis. 9 CFR 311.33. U.S. Food and Drug Administration, Code of Federal Regulations. 2001. Retained water in raw meat and poultry products. 9 CFR 381. U.S. Food and Drug Administration, Code of Federal Regulations. 2001. Poultry chilling requirements. 9 CFR 441. U.S. Food and Drug Administration, Code of Federal Regulations. 2003. Sodium metasilicate. 21 CFR 184.1769a. van Elsas, J.D., A,V. Semenov, R, Costa, and J.T. Trevors. 2011. Survival of Escherichia coli in the environment: fundamental and public health aspects. ISME J. 5:173-183. Viazis, S. and F. Diez-Gonzalez. 2011. Enterohemmorhagic Escherichia coli: the twentieth century�’s emerging foodborne pathogen: a review. Adv. Agron. 111:1-50. Vogel, B. F. L.T. Hansen, H. Mordhorst, and L. Gram. 2010. The survival of Listeria monocytogenes during long term desiccation is facilitated by sodium chloride and organic material. Int. J. Food Microbiol. 140:192-200. Walker, S.J., P. Archer, and J.G. Banks. 1990. Growth of Listeria monocytogenes at refrigeration temperatures. J. Appl. Bacteriol. 68:157-162. Weagant, S.D., J.L. Bryant, and D.H. Bark. 1994. Survival of Escherichia coli O157:H7 in mayonnaise and mayonnaise-based sauces at room and refrigerated temperatures. J. Food Prot. 57:629-631. Weber, G.H., J.K. O�’Brien, and F.G. Bender. 2004. Control of Escherichia coli O157:H7 with sodium metasilicate. J. Food. Prot. 67:1501-1506. Wilks, S.A., H. Michels, and C.W. Keevil. 2005. The survival of Escherichia coli O157 on a range of metal surfaces. Int. J. Food Microbiol. 105:445-454. Williams, S., S. Roof, E.A. Boyle, D. Burson, H. Thippareddi, I. Geornaras, J.N. Sofos, M. Wiedmann, and K. Nightingale. 2011. Molecular ecology of Listeria monocytogenes and other Listeria species in small and very small Ready-To-Eat Meat Processing Plants. J. Food Prot. 74:63-77. Woerner, D.R., J.R. Ransom, J.N. Sofos, G.A. Dewell, G.C. Smith, M.D. Salman, and K.E. Belk. 2006. Determining the prevalence of Escherichia coli O157 in cattle and beef from the feedlot to the cooler. J. Food Prot. 69:2824-2827.

134
World Health Organization. 2004. Risk assessment of Listeria monocytogenes in ready-to-eat food; interprative summary Rome, Italy. <http://www.who.int/foodsafety/publications/micro/en/mra4.pdf> Wulff, G., L. Gram, P. Ahrens, and B.F. Vogel. 2006. One group of genetically similar Listeria monocytogenes strains frequently dominates and persists in several fish slaughter- and smokehouses. Appl. Environ. Microbiol. 72:4313-4322. Yang, H., P.A. Kendall, L.C Medeiros, and J.N. Sofos. 2009. Efficacy of sanitizing agents against Listeria monocytogenes biofilms on high-density polyethylene cutting board surfaces. J. Food. Prot. 72:990-998. Zansky, S., B. Wallace, D. Schoonmaker-Bopp, P. Smith, F. Ramsey, J. Painter, A. Gupta, P. Kalluri, and S. Noviello. 2002. Outbreak of multi-drug resistant Salmonella Newport �– United States, January-April 2002. Centers for Disease Control and Prevention. J. Am. Med. Assoc. 288:951-953. Zhang, S., R.A. Kingsley, R.L. Santos, H.Andrews-Polymenis, M. Raffatellu, J. Figueiredo, J. Nunes, R.M. Tsolis, L.G. Adams, and A.J. Bäumler. 2003. Molecular pathogenesis of Salmonella enterica serotype Typhimurium-induced diarrhea. Infect. Immun. 71:1-12.

135
Appendix:
Tables of persistence and survival of Listeria monocytogenes on food packaging soiled with antimicrobial-free ham homogenate and stored for up to 123 days;
Tables of persistence and survival of Escherichia coli O157:H7 on food
packaging soiled with ground beef homogenate and stored for up to 130 days;
Tables of comparison of decontaminating agents against Escherichia coli O157:H7, susceptible and multi-drug resistant Salmonella in beef trimming

136
Table A.1: Summary of statistical analysis results showing which soiled materials inoculated with Listeria monocytogenes (inoculated at 5 log CFU/cm2 and stored up to 123 days at 25º C) exhibited a replication effect
Packaging Material P Value (PALCAM) P Value (TSA+YE) Aluminum Foil 0.0671 0.0546 Butcher Paper 0.2298 0.0096*
Cardboard Box Material 0.0317* <0.0001* Deli Wax Paper <0.0001* <0.0001*
Paper Bag Material <0.0001* <0.0001* Plastic Bag Material 0.0018* 0.7879 PVC Overwrap Film 0.0004* 0.0066*
Vacuum Pouch Material 0.0005* 0.8889 * Effects are significant if P < 0.05
Table A.2: Summary of statistical analysis results showing which soiled materials inoculated with Listeria monocytogenes (inoculated at 5 log CFU/cm2 and stored up to 123 days at 4º C) exhibited a replication effect
Packaging Material P Value (PALCAM) P Value (TSA+YE) Aluminum Foil <0.0001* <0.0001* Butcher Paper <0.0001* <0.0001*
Cardboard Box Material <0.0001* 0.0521 Deli Wax Paper <0.0001* <0.0001*
Paper Bag Material <0.0001* 0.0013* Plastic Bag Material <0.0001* <0.0001* PVC Overwrap Film <0.0001* <0.0001*
Vacuum Pouch Material <0.0001* 0.0046* * Effects are significant if P < 0.05
Table A.3: Summary of statistical analysis results showing which soiled materials inoculated with Listeria monocytogenes (inoculated at 2 log CFU/cm2 and stored up to 123 days at 25º C) exhibited a replication effect
Packaging Material P Value (PALCAM) P Value (TSA+YE) Aluminum Foil <0.0001* <0.0001* Butcher Paper 0.0072* 0.0275*
Cardboard Box Material 0.0109* 0.0018* Deli Wax Paper 0.0060* 0.1050
Paper Bag Material 0.0003* <0.0001* Plastic Bag Material <0.0001* <0.0001* PVC Overwrap Film <0.0001* <0.0001*
Vacuum Pouch Material 0.0057* 0.0114* * Effects are significant if P < 0.05

137
Table A.4: Summary of statistical analysis results showing which soiled materials inoculated with Listeria monocytogenes (inoculated at 2 log CFU/cm2 and stored up to 123 days at 4º C) exhibited a replication effect
Packaging Material P Value (PALCAM) P Value (TSA+YE) Aluminum Foil 0.1799 0.4843 Butcher Paper 0.0008* 0.0039*
Cardboard Box Material <0.0001* 0.2631 Deli Wax Paper <0.0001* 0.2402
Paper Bag Material 0.7266 0.0432* Plastic Bag Material <0.0001* <0.0001* PVC Overwrap Film 0.2803 0.1913
Vacuum Pouch Material <0.0001* <0.0001* * Effects are significant if P < 0.05

138
Table A.5: Populations of Listeria monocytogenes (n = 6) on soiled food packaging surfaces when inoculated at a level of approximately 5 log CFU/cm2 and stored at 25º C �– Combined Means (Figure 1.1)
Materials
Day of Storage Butcher Paper Cardboard Deli Wax
Paper Aluminum
Foil
PVC Overwrap
Film Paper Bag Plastic Bag Vacuum Pouch
0 5.1 ± 0.1 4.8 ± 0.1 5.0 ± 0.2 5.0 ± 0.1 4.8 ± 0.1 4.8 ± 0.3 5.0 ± 0.1 4.9 ± 0.1 4 5.4 ± 0.2 3.1 ± 0.2 4.5 ± 0.3 4.0 ± 0.5 3.3 ± 0.3 4.4 ± 0.4 5.0 ± 0.4 5.2 ± 0.5
11 5.5 ± 0.3 2.8 ± 0.4 5.0 ± 0.4 6.0 ± 0.5 4.9 ± 1.0 4.2 ± 0.4 5.7 ± 0.7 5.7 ± 0.4 18 5.2 ± 0.5 2.3 ± 0.3 4.4 ± 0.1 5.5 ± 0.2 4.3 ± 0.8 3.9 ± 0.3 5.1 ± 0.4 4.8 ± 0.8 25 4.4 ± 0.4 2.1 ± 0.8 3.9 ± 0.7 4.7 ± 0.6 2.4 ± 1.0 2.9 ± 1.0 4.8 ± 0.1 4.5 ± 0.7 32 4.7 ± 0.2 1.9 ± 0.8 4.3 ±0.4 5.3 ± 0.5 4.0 ± 0.3 2.9 ± 1.1 4.5 ± 0.2 4.9 ± 0.5 39 4.1 ± 0.2 1.4 ± 0.6 3.6 ± 0.2 5.3 ± 0.3 1.9 ± 1.3 <1.8 ± 1.4 4.0 ± 0.5 4.3 ± 0.7 53 3.7 ± 0.2 <0.3 ± 0.5 2.8 ± 0.3 4.3 ± 0.9 2.3 ± 2.0 <0.0 ± 0.3 4.0 ± 0.4 4.1 ± 1.7 67 4.0 ± 0.3 <0.6 ± 0.4 3.1 ± 0.6 4.6 ± 0.7 -0.1 ± 0.0 <0.9 ± 0.7 4.5 ± 0.6 4.2 ± 1.4 81 3.4 ± 0.3 <-0.0 ± 0.2 2.4 ± 0.6 4.5 ± 0.4 <0.6 ± 1.0 <0.6 ± 0.7 3.0 ± 0.5 3.4 ± 0.6 95 2.5 ± 1.0 <-0.1 1.9 ± 0.9 3.9 ± 1.0 1.6 ± 1.0 <0.0 ± 0.3 2.7 ± 1.0 1.4 ± 0.5 109 2.8 ± 0.3 <-0.1 1.5 ± 0.4 3.9 ± 0.6 <0.9 ± 1.6 <-0.0 ± 0.2 2.6 ± 0.7 1.9 ± 1.3 123 2.3 ± 0.5 <-0.1 <1.2 ± 1.4 3.2 ± 0.5 <1.0 ± 1.1 <-0.1 1.5 ± 0.9 <0.8 ± 0.8
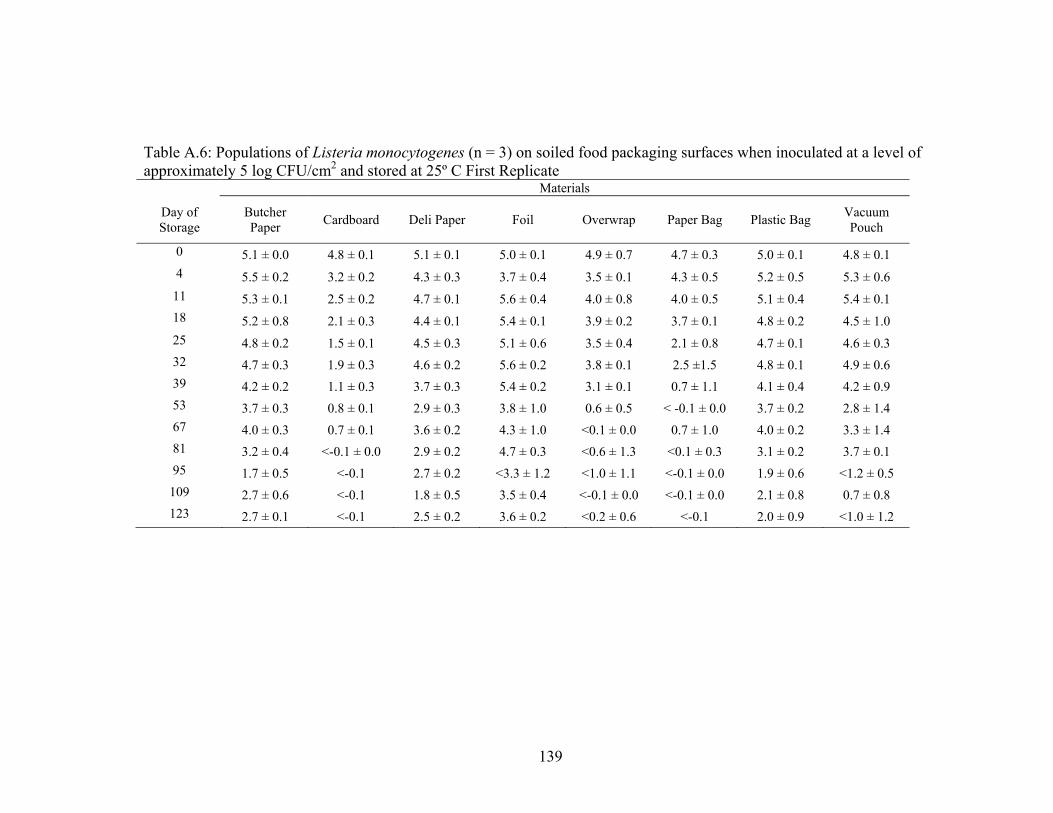
139
Table A.6: Populations of Listeria monocytogenes (n = 3) on soiled food packaging surfaces when inoculated at a level of approximately 5 log CFU/cm2 and stored at 25º C First Replicate Materials
Day of Storage
Butcher Paper Cardboard Deli Paper Foil Overwrap Paper Bag Plastic Bag Vacuum
Pouch
0 5.1 ± 0.0 4.8 ± 0.1 5.1 ± 0.1 5.0 ± 0.1 4.9 ± 0.7 4.7 ± 0.3 5.0 ± 0.1 4.8 ± 0.1 4 5.5 ± 0.2 3.2 ± 0.2 4.3 ± 0.3 3.7 ± 0.4 3.5 ± 0.1 4.3 ± 0.5 5.2 ± 0.5 5.3 ± 0.6
11 5.3 ± 0.1 2.5 ± 0.2 4.7 ± 0.1 5.6 ± 0.4 4.0 ± 0.8 4.0 ± 0.5 5.1 ± 0.4 5.4 ± 0.1 18 5.2 ± 0.8 2.1 ± 0.3 4.4 ± 0.1 5.4 ± 0.1 3.9 ± 0.2 3.7 ± 0.1 4.8 ± 0.2 4.5 ± 1.0 25 4.8 ± 0.2 1.5 ± 0.1 4.5 ± 0.3 5.1 ± 0.6 3.5 ± 0.4 2.1 ± 0.8 4.7 ± 0.1 4.6 ± 0.3 32 4.7 ± 0.3 1.9 ± 0.3 4.6 ± 0.2 5.6 ± 0.2 3.8 ± 0.1 2.5 ±1.5 4.8 ± 0.1 4.9 ± 0.6 39 4.2 ± 0.2 1.1 ± 0.3 3.7 ± 0.3 5.4 ± 0.2 3.1 ± 0.1 0.7 ± 1.1 4.1 ± 0.4 4.2 ± 0.9 53 3.7 ± 0.3 0.8 ± 0.1 2.9 ± 0.3 3.8 ± 1.0 0.6 ± 0.5 < -0.1 ± 0.0 3.7 ± 0.2 2.8 ± 1.4 67 4.0 ± 0.3 0.7 ± 0.1 3.6 ± 0.2 4.3 ± 1.0 <0.1 ± 0.0 0.7 ± 1.0 4.0 ± 0.2 3.3 ± 1.4 81 3.2 ± 0.4 <-0.1 ± 0.0 2.9 ± 0.2 4.7 ± 0.3 <0.6 ± 1.3 <0.1 ± 0.3 3.1 ± 0.2 3.7 ± 0.1 95 1.7 ± 0.5 <-0.1 2.7 ± 0.2 <3.3 ± 1.2 <1.0 ± 1.1 <-0.1 ± 0.0 1.9 ± 0.6 <1.2 ± 0.5
109 2.7 ± 0.6 <-0.1 1.8 ± 0.5 3.5 ± 0.4 <-0.1 ± 0.0 <-0.1 ± 0.0 2.1 ± 0.8 0.7 ± 0.8 123 2.7 ± 0.1 <-0.1 2.5 ± 0.2 3.6 ± 0.2 <0.2 ± 0.6 <-0.1 2.0 ± 0.9 <1.0 ± 1.2

140
Table A.7: Populations of Listeria monocytogenes (n = 3) on soiled food packaging surfaces when inoculated at a level of approximately 5 log CFU/cm2 and stored at 25º C �– Second Replicate
Materials Day of Storage Butcher Paper Cardboard Deli Paper Foil Overwrap Paper Bag Plastic Bag Vacuum
Pouch 0 5.2 ± 0.1 4.8 ± 0.1 4.9 ± 0.1 4.9 ± 0.1 4.7 ± 0.1 5.0 ± 0.0 4.9 ± 0.0 4.9 ± 0.0 4 5.2 ± 0.2 3.0 ± 0.2 4.7 ± 0.3 4.3 ± 0.4 3.1 ± 0.2 4.4 ± 0.3 4.8 ± 0.1 5.0 ± 0.3
11 5.7 ± 0.2 3.0 ± 0.3 5.4 ± 0.1 6.3 ± 0.1 5.7 ± 0.1 4.3 ± 0.2 6.3 ± 0.1 6.0 ± 0.3 18 5.1 ± 0.2 2.5 ± 0.2 4.4 ± 0.1 5.7 ± 0.2 4.7 ± 1.1 4.1 ± 0.1 5.4 ± 0.4 5.1 ± 0.6 25 4.1 ± 0.1 2.8 ± 0.1 3.3 ± 0.4 4.3 ± 0.1 2.3 ± 0.3 3.7 ± 0.4 4.9 ± 0.1 4.5 ± 1.0 32 4.8 ± 0.1 2.0 ± 1.2 4.0 ± 0.2 5.0 ± 0.6 4.2 ± 0.2 3.4 ± 0.4 4.3 ± 0.1 4.9 ± 0.6 39 4.1 ± 0.0 1.7 ± 0.7 3.6 ± 0.1 5.1 ± 0.2 <0.9 ± 0.2 3.0 ± 0.1 4.0 ± 0.6 4.4 ± 0.7 53 3.7 ± 0.2 <-0.1 ± 0.0 2.7 ± 0.3 4.9 ± 0.2 4.1 ± 0.1 <0.2 ± 0. 4.3 ± 0.4 5.5 ± 0.2 67 4.1 ± 0.4 <0.6 ± 0.0 2.5 ± 0.3 5.0 ± 0.1 <-0.1 ± 0.0 1.1 ± 0.1 5.0 ± 0.2 5.2 ± 0.1 81 3.5 ± 0.3 <0.1 ± 0.3 1.9 ± 0.1 4.3 ± 0.5 <0.5 ± 0.8 1.1 ± 0.4 2.9 ± 0.7 3.1 ± 0.8 95 3.3 ± 0.4 <-0.1 1.2 ± 0.4 4.4 ± 0.2 2.3 ± 0.3 0.1 ± 0.4 3.5 ± 0.6 1.6 ± 0.5
109 3.0 ± 0.3 <-0.1 1.3 ± 0.3 4.4 ± 0.3 2.0 ± 1.8 <0.1 ± 0.3 3.1 ± 0.1 3.0 ± 0.0 123 2.1 ± 0.5 <-0.1 <-0.1 ± 0.0 2.8 ± 0.1 1.9 ± 0.7 <-0.1 1.1 ± 0.8 0.7 ± 0.2

141
Table A.8: Total aerobic plate count (n = 6) on various soiled food packaging materials when inoculated at a level of approximately 5 log CFU/cm2 and stored at 25º C �– Combined Means (Figure 1.2)
Materials
Day of Storage
Butcher Paper Cardboard Deli Wax
Paper Aluminum Foil PVC
Overwrap Film
Paper Bag Plastic Bag Vacuum Pouch
0 5.2 ± 0.1 4.8 ± 0.1 4.8 ± 0.3 5.0 ± 0.2 4.9 ± 0.1 4.8 ± 0.2 5.0 ± 0.1 4.9 ± 0.1 4 5.5 ± 0.5 3.5 ± 0.4 5.3 ± 0.5 5.3 ± 0.7 4.8 ± 0.4 4.2 ± 0.9 5.5 ± 0.6 5.2 ± 0.6
11 5.6 ± 0.2 3.3 ± 0.4 5.3 ± 0.1 6.2 ± 0.4 5.0 ± 0.9 4.3 ± 0.2 5.9 ± 0.6 5.8 ± 0.3 18 5.4 ± 0.5 2.9 ± 0.2 4.7 ± 0.2 5.7 ± 0.3 4.3 ± 0.5 4.3 ± 0.4 5.3 ± 0.5 5.0 ± 0.9 25 4.8 ± 0.5 3.0 ± 0.2 4.9 ± 0.4 5.3 ± 0.6 3.3 ± 0.7 4.0 ± 0.4 5.1 ± 0.1 4.8 ± 1.1 32 5.1 ± 0.1 2.8 ± 0.4 4.7 ± 0.2 5.7 ± 0.5 4.3 ± 0.1 3.7 ± 0.6 5.0 ± 0.3 5.1 ± 0.5 39 4.9 ± 0.1 2.8 ± 0.2 4.5 ± 0.2 5.9 ± 0.2 <2.7 ± 1.7 3.3 ± 0.9 4.8 ± 0.5 5.1 ± 0.4 53 4.5 ± 0.2 2.4 ± 0.2 3.8 ± 0.2 5.1 ± 1.0 3.2 ± 1.6 <1.1 ± 1.4 5.0 ± 0.3 5.0 ± 0.9 67 4.5 ± 0.3 2.8 ± 0.2 4.0 ± 0.4 5.4 ± 0.7 1.0 ± 1.1 1.8 ± 0.8 5.5 ± 0.3 5.5 ± 0.3 81 4.5 ± 0.3 2.5 ± 0.2 3.4 ± 0.4 5.5 ± 0.4 <0.5 ± 0.9 1.5 ± 0.7 4.4 ± 0.3 4.4 ± 0.6 95 4.0 ± 0.3 1.7 ± 0.9 3.4 ± 0.8 5.7 ± 0.2 <2.9 ± 0.6 <1.0 ± 1.1 5.0± 0.5 4.3 ± 0.4 109 3.7 ± 0.3 2.6 ± 0.3 2.9 ± 0.7 4.9 ± 0.4 1.9 ± 1.1 <0.4 ± 0.5 4.2 ± 0.5 3.5 ± 0.8 123 3.3 ± 0.6 2.3 ± 0.2 2.4 ± 1.1 4.3 ± 0.9 2.2 ± 0.6 <0.2 ± 0.4 3.1 ± 0.7 2.3 ± 1.5

142
Table A.9: Total aerobic plate count (n = 3) on various soiled food packaging materials when inoculated at a level of approximately 5 log CFU/cm2 and stored at 25º C �– First Replicate
Materials
Day of Storage
Butcher Paper Cardboard Deli Paper Foil Overwrap Paper Bag Plastic Bag Vacuum
Pouch 0 5.2 ± 0.1 4.8 ± 0.6 4.8 ± 0.4 5.1 ± 0.1 4.9 ± 0.1 4.7 ± 0.3 5.0 ± 0.1 4.9 ± 0.1 4 5.9 ± 0.5 3.8 ± 0.4 5.7 ± 0.4 5.9 ± 0.4 5.1 ± 0.3 4.8 ± 0.6 6.0 ± 0.3 5.4 ± 0.8
11 5.5 ± 0.1 3.6 ± 0.2 5.2 ± 0.1 6.0 ± 0.5 4.3 ± 0.7 4.2 ± 0.2 5.4 ± 0.4 5.6 ± 0.1 18 5.4 ± 0.7 2.7 ± 0.3 4.6 ± 0.2 5.5 ± 0.1 4.1 ± 0.2 4.0 ± 0.2 5.0 ± 0.2 4.7 ± 0.9 25 5.3 ± 0.1 2.9 ± 0.2 5.0 ± 0.3 5.8 ± 0.3 4.0 ± 0.1 3.8 ± 0.5 5.1 ± 0.2 5.3 ± 0.4 32 5.0 ± 0.1 3.0 ± 0.1 4.9 ± 0.2 6.1 ± 0.1 4.2 ± 0.2 3.5 ± 0.8 5.3 ± 0.2 5.0 ± 0.6 39 4.8 ± 0.1 2.9 ± 0.2 4.6 ± 0.1 6.0 ± 0.2 3.8 ± 0.2 2.5 ± 0.5 4.9 ± 0.4 5.0 ± 0.5 53 4.6 ± 0.2 2.6 ± 0.1 3.8 ± 0.3 4.4 ± 1.0 1.9 ± 0.6 0.0 ± 0.1 4.7 ± 0.1 4.4 ± 1.0 67 4.4 ± 0.2 2.9 ± 0.1 4.4 ± 0.1 5.2 ± 1.1 <0.7 ± 1.3 1.2 ± 1.2 5.3 ± 0.2 5.2 ± 0.1 81 4.7 ± 0.3 2.6 ± 0.1 3.7 ± 0.3 5.7 ± 0.3 <0.0± 0.2 0.9 ± 0.7 4.6 ± 0.2 4.9 ± 0.2 95 3.9 ± 0.2 2.5 ± 0.2 4.1 ± 0.2 5.7 ± 0.1 2.4 ± 0.1 <0.0± 0.2 4.9 ± 0.5 4.6 ± 0.3 109 3.7 ± 0.3 2.9 ± 0.2 3.5 ± 0.1 4.6 ± 0.4 1.3 ± 0.8 <0.4 ± 0.5 4.0 ± 0.4 3.2 ± 1.0 123 3.9 ± 0.1 2.5 ± 0.2 3.5 ± 0.3 5.1 ± 0.1 2.0 ± 0.2 <0.3 ± 0.6 3.7 ± 0.3 2.9 ± 2.0

143
Table A.10: Total aerobic plate count (n = 3) on various soiled food packaging materials when inoculated at a level of approximately 5 log CFU/cm2 and stored at 25º C �– Second Replicate
Materials Day of Storage Butcher Paper Cardboard Deli Paper Foil Overwrap Paper Bag Plastic Bag Vacuum
Pouch 0 5.2 ± 0.1 4.8 ± 0.1 4.9 ± 0.1 4.9 ± 0.2 4.8 ± 0.2 5.0 ± 0.1 4.9 ± 0.1 5.0 ± 0.0 4 5.2 ± 0.2 3.2 ± 0.2 4.9 ± 0.2 4.8 ± 0.2 4.5 ± 0.3 3.4 ± 0.3 5.0 ± 0.1 5.1 ± 0.4
11 5.7 ± 0.2 3.0 ± 0.3 5.4 ± 0.1 6.3 ± 0.1 5.7 ± 0.1 4.3 ± 0.2 6.3 ± 0.1 6.0 ± 0.3 18 5.4 ± 0.2 3.0 ± 0.1 4.9 ± 0.0 6.0 ± 0.1 4.6 ± 0.8 4.6 ± 0.3 5.7 ± 0.4 5.4 ± 0.8 25 4.4 ± 0.1 3.1 ± 0.2 4.8 ± 0.5 4.7 ± 0.1 2.8 ± 0.4 4.1 ± 0.4 5.1 ± 0.1 4.3 ± 1.4 32 5.2 ± 0.1 2.6 ± 0.6 4.5 ± 0.2 5.2 ± 0.3 4.3 ± 0.1 3.9 ± 0.4 4.8 ± 0.3 5.3 ± 0.6 39 4.9 ± 0.1 2.8 ± 0.2 4.4 ± 0.2 5.8 ± 0.3 <1.7 ± 1.9 4.1 ± 0.3 4.7 ± 0.6 5.1 ± 0.3 53 4.4 ± 0.2 2.2 ± 0.1 3.8 ± 0.2 5.7 ± 0.3 4.6 ± 0.3 2.4 ± 0.3 5.3 ± 0.1 5.6 ± 0.4 67 4.7 ± 0.3 2.7 ± 0.2 3.7 ± 0.1 5.6 ± 0.1 1.6 ± 0.3 2.2 ± 0.1 5.8 ± 0.1 5.7 ± 0.2 81 4.3 ± 0.1 2.3 ± 0.1 3.1 ± 0.1 5.4 ± 0.4 1.2 ± 1.4 2.0 ± 0.2 4.2 ± 0.1 3.9 ± 0.3 95 4.1 ± 0.4 <0.9 ± 0.9 2.8 ± 0.5 5.7 ± 0.4 3.3 ± 0.4 2.1 ± 0.2 5.2 ± 0.4 4.0 ± 0.2
109 3.7 ± 0.4 2.4 ± 0.1 2.3 ± 0.4 5.1 ± 0.4 2.8 ± 0.6 <0.3 ± 0.5 4.5 ± 0.5 3.8 ± 0.7 123 3.0 ± 0.6 2.1 ± 0.1 1.3 ± 0.4 3.5 ± 0.4 2.5 ± 0.8 <0.1 ± 0.2 2.6 ± 0.6 <1.8 ± 0.8

144
Table A.11: Populations of Listeria monocytogenes (n = 6) on soiled food packaging surfaces when inoculated at a level of approximately 5 log CFU/cm2 and stored at 25º C �– Combined Means (Figure 1.3)
Materials
Day of Storage Butcher Paper Cardboard Deli Wax
Paper Aluminum
Foil
PVC Overwrap
Film Paper Bag Plastic Bag Vacuum
Pouch
0 5.1 ± 0.1 4.8 ± 0.1 5.0 ± 0.2 5.0 ± 0.1 4.8 ± 0.1 4.8 ± 0.3 5.0 ± 0.1 4.9 ± 0.1 4 5.56 ± 0.4 3.6 ± 0.4 5.2 ± 0.4 5.6 ± 0.4 4.9 ± 0.6 4.8 ± 0.6 5.7 ± 0.4 5.4 ± 0.6
11 4.2 ± 0.4 2.5 ± 0.4 3.4 ± 0.6 4.2 ± 0.3 2.3 ± 0.4 3.6 ± 0.4 5.0 ± 0.2 4.3 ± 0.7 18 3.9 ± 0.2 2.3 ± 0.3 3.1 ± 0.5 3.8 ± 0.6 1.2 ± 0.6 3.3 ± 0.7 4.5 ± 0.7 5.1 ± 0.4 25 4.1 ± 0.8 1.6 ± 0.3 3.1 ± 1.2 3.8 ± 1.9 2.0 ± 1.8 2.6 ± 0.7 3.9 ± 1.1 4.2 ± 0.7 32 3.5 ± 0.1 2.0 ± 0.4 2.5 ± 0.5 3.3 ± 1.2 0.8 ± 0.9 2.5 ± 0.5 4.2 ± 0.5 4.4 ± 0.8 39 3.6 ± 0.4 2.2 ± 0.2 2.0 ± 1.1 2.8 ± 1.5 <0.7 ± 0.9 2.6 ± 0.6 2.9 ± 0.9 4.5 ± 0.5 53 2.7 ± 0.4 1.7 ± 0.5 1.9 ± 1.3 2.7 ± 1.2 <0.4 ± 0.6 2.3 ± 1.0 3.3 ± 1.0 3.9 ± 0.8 67 2.6 ± 0.8 2.1 ± 0.9 <1.4 ± 1.5 3.2 ± 0.6 <1.0 ± 1.2 1.7 ± 1.0 2.5 ± 1.7 4.4 ± 0.7 81 2.7 ± 0.2 1.6 ± 0.5 <1.0 ± 1.2 <2.3 ± 1.9 <0.2 ± 0.6 1.7 ± 0.6 3.0 ± 1.4 4.0 ± 0.7 95 2.1 ± 1.0 <1.2 ± 1.1 <0.7 ± 1.0 2.7 ± 1.3 <0.2 ± 0.5 <0.0 ± 0.2 2.8 ± 1.1 <3.5 ± 1.4
109 1.8 ± 1.0 2.0 ± 0.6 <0.9 ± 1.1 <1.9 ± 1.8 <0.3 ± 0.5 <0.7 ± 1.1 3.1 ± 0.6 3.0 ± 1.0 123 1.3 ± 1.2 <0.7 ± 0.9 <0.7 ± 0.9 1.8 ± 1.0 <0.2 ± 0.3 <0.5 ± 0.8 2.4 ± 1.0 <2.0 ± 2.3

145
Table A.12: Populations of Listeria monocytogenes (n = 3) on soiled food packaging surfaces when inoculated at a level of approximately 5 log CFU/cm2 and stored at 4º C �– First Replicate
Materials
Day of Storage
Butcher Paper Cardboard Deli Paper Foil Overwrap Paper Bag Plastic Bag Vacuum
Pouch
0 5.1 ± 0.0 4.8 ± 0.1 5.1 ± 0.1 5.0 ± 0.1 4.9 ± 0.7 4.7 ± 0.3 5.0 ± 0.1 4.8 ± 0.1 4 5.5 ± 0.6 3.9 ± 0.1 5.4 ± 0.5 5.5 ± 0.4 5.0 ± 0.3 4.5 ± 0.6 5.6 ± 0.5 5.1 ± 0.7
11 4.5 ± 0.2 2.2 ± 0.4 2.9 ± 0.0 4.2 ± 0.3 2.2 ± 0.5 3.4 ± 0.4 5.0 ± 0.2 4.4 ± 0.1 18 3.9 ± 0.4 2.1 ± 0.2 2.7 ± 0.1 3.3 ± 0.4 1.4 ± 0.7 2.8 ± 0.5 4.3 ± 0.9 5.1 ± 0.6 25 3.4 ± 0.2 1.8 ± 0.4 1.8 ± 0.3 1.7 ± 0.3 0.3 ± 0.4 2.0 ± 0.5 3.0 ± 0.7 4.1 ± 0.8 32 3.6 ± 0.2 1.8 ± 0.2 2.0 ± 0.3 2.2 ± 0.5 0.0 ± 0.2 2.3 ± 0.5 3.8 ± 0.3 4.1 ± 0.8 39 3.3 ± 0.2 2.1 ± 0.1 1.0 ± 0.2 1.8 ± 0.8 <0.3 ± 0.8 2.1 ± 0.0 2.6 ± 1.1 4.2 ± 0.6 53 2.5 ± 0.4 1.4 ± 0.2 0.6 ± 0.3 1.9 ± 0.3 0.5 ± 0.3 1.4 ± 0.0 2.5 ± 0.8 3.5 ± 0.7 67 2.0 ± 0.7 1.4 ± 0.9 0.1 ± 0.3 2.9 ± 0.1 <-0.1 0.9 ± 0.5 1.0 ± 0.8 3.8 ± 0.3 81 2.5 ± 0.0 1.4 ± 0.2 <-0.1 <0.7 ± 1.4 <-0.1 1.3 ± 0.3 1.9 ± 1.1 3.9 ± 0.5 95 1.4 ± 1.0 <0.2 ± 0.4 <-0.1 1.6 ± 1.1 <-0.1 <-0.1 ± 0.0 1.8 ± 0.3 <2.3 ± 0.9
109 0.9 ± 0.0 1.7 ± 0.7 <-0.1 <0.3 ± 0.4 <-0.1 <-0.1 2.7 ± 0.1 2.3 ± 0.9 123 0.3 ± 0.4 <-0.1 ± 0.0 <-0.1 0.9 ± 0.1 <-0.1 0.1 ± 0.3 1.5 ± 0.1 <-0.1 ± 0.0

146
Table A.13: Populations of Listeria monocytogenes (n = 3) on soiled food packaging surfaces when inoculated at a level of approximately 5 log CFU/cm2 and stored at 4º C �– Second Replicate
Materials Day of Storage Butcher Paper Cardboard Deli Paper Foil Overwrap Paper Bag Plastic Bag Vacuum
Pouch 0 5.2 ± 0.1 4.8 ± 0.1 4.9 ± 0.1 4.9 ± 0.1 4.7 ± 0.1 5.0 ± 0.0 4.9 ± 0.0 4.9 ± 0.0 4 5.6 ± 0.4 3.2 ± 0.2 5.1 ± 0.1 5.7 ± 0.3 4.8 ± 0.8 5.1 ± 0.6 5.7 ± 0.5 5.7 ± 0.1
11 4.0 ± 0.3 2.8 ± 0.2 3.8 ± 0.5 4.1 ± 0.4 2.4 ± 0.4 3.7 ± 0.4 5.0 ± 0.1 4.1 ± 0.2 18 3.9 ± 0.1 2.5 ± 0.3 3.5 ± 0.4 4.2 ± 0.1 1.0 ± 0.3 3.9 ± 0.4 4.8 ± 0.1 5.2 ± 0.2 25 4.8 ± 0.5 1.4 ± 0.2 4.0 ± 0.4 5.2 ± 0.1 3.6 ± 0.1 3.2 ± 0.3 4.8 ± 0.1 4.4 ± 0.7 32 3.5 ± 0.1 2.3 ± 0.5 3.0 ± 0.1 4.4 ± 0.3 1.6 ± 0.2 2.6 ± 0.5 4.7 ± 0.1 4.6 ± 0.9 39 3.9 ± 0.3 2.3 ± 0.2 3.1 ± 0.1 4.3 ± 0.0 <1.1 ± 1.0 3.1 ± 0.1 3.3 ± 0.2 4.8 ± 0.1 53 2.9 ± 0.1 2.1 ± 0.4 3.1 ± 0.2 3.5 ± 1.3 <0.4 ± 0.8 3.1 ± 0.1 4.1 ± 0.3 4.3 ± 0.8 67 3.2 ± 0.1 2.7 ± 0.2 2.8 ± 0.2 3.4 ± 0.9 2.1 ± 0.2 2.5 ± 0.4 4.0 ± 0.6 5.0 ± 0.1 81 2.8 ± 0.2 1.8 ± 0.6 2.0 ± 0.3 3.8 ± 0.1 <0.5 ± 0.7 2.1 ± 0.4 4.2 ± 0.1 4.2 ± 0.9 95 2.8 ± 0.1 2.1 ± 0.1 1.6 ± 0.5 3.7 ± 0.1 <0.5 ± 0.5 <0.2 ± 0.2 3.7 ± 0.6 4.6 ± 0.2
109 2.7 ± 0.0 2.7 ± 0.2 1.9 ± 0.3 3.5 ± 0.1 0.6 ± 0.5 1.5 ± 1.0 3.6 ± 0.4 3.7 ± 0.7 123 2.4 ± 0.3 1.4 ± 0.5 1.6 ± 0.2 2.6 ± 0.4 0.4 ± 0.3 <1.0 ± 1.0 3.3 ± 0.3 4.2 ± 0.2

147
Table A.14: Total aerobic plate count (n = 6) on various soiled food packaging materials when inoculated at a level of approximately 5 log CFU/cm2 and stored at 4º C �– Combined Means (Figure 1.4)
Materials
Day of Storage Butcher Paper Cardboard Deli Wax
Paper Aluminum
Foil
PVC Overwrap
Film Paper Bag Plastic Bag Vacuum
Pouch
0 5.2 ± 0.1 4.8 ± 0.1 4.8 ± 0.3 5.0 ± 0.2 4.9 ± 0.1 4.9 ± 0.2 5.0 ± 0.1 4.9 ± 0.1 4 5.6 ± 0.4 3.7 ± 0.9 4.9 ± 0.5 5.0 ± 1.0 4.2 ± 0.9 4.0 ± 0.8 5.6 ± 0.6 5.6 ± 0.5
11 4.2 ± 0.4 2.8 ± 0.3 3.6 ± 0.4 4.6 ± 0.6 2.2 ± 0.6 3.8 ± 0.4 5.2 ± 0.3 4.4 ± 0.8 18 4.2 ± 0.4 2.8 ± 0.3 3.9 ± 0.5 4.5 ± 0.4 1.9 ± 0.4 4.1 ± 0.5 4.7 ± 0.7 5.2 ± 0.4 25 4.6 ± 0.8 2.7 ± 0.2 3.8 ± 0.7 5.1 ± 0.9 2.5 ± 1.0 3.9 ± 0.3 4.8 ± 1.0 4.8 ± 0.6 32 3.9 ± 0.1 2.8 ± 0.3 3.5 ± 0.6 4.23 ± 0.4 1.6 ± 0.9 3.4 ± 0.4 4.7 ± 0.2 4.7 ± 0.7 39 4.2 ± 0.2 2.9 ± 0.1 3.4 ± 0.8 4.0 ± 0.7 1.4 ± 1.2 4.2 ± 0.1 3.4 ± 0.9 5.0 ± 0.4 53 3.6 ± 0.2 2.8 ± 0.1 3.8 ± 0.5 4.1 ± 0.7 1.4 ± 0.8 3.8 ± 0.6 3.8 ± 0.9 4.5 ± 0.7 67 3.5 ± 0.6 2.9 ± 0.2 3.4 ± 0.7 4.3 ± 0.5 2.3 ± 0.7 3.9 ± 0.6 3.5 ± 1.3 5.0 ± 0.3 81 3.6 ± 0.2 2.9 ± 0.3 3.3 ± 0.5 4.0 ± 0.7 <1.0 ± 0.7 3.7 ± 0.3 4.1 ± 0.8 4.7 ± 0.7 95 3.5 ± 0.4 2.9 ± 0.2 2.9 ± 1.0 4.1 ± 0.5 1.7 ± 0.3 3.2 ± 0.3 4.0 ± 0.5 4.4 ± 0.8
109 3.1 ± 0.5 3.0 ± 0.2 3.0 ± 0.6 3.8 ± 0.7 0.9 ± 0.7 3.1 ± 0.4 4.5 ± 0.2 3.8± 0.9 123 2.2 ±1.5 2.7 ± 0.2 1.9 ± 1.9 2.7 ± 1.6 <0.5 ± 0.7 1.9 ± 0.9 3.1 ± 1.3 3.4 ± 1.6

148
Table A.15: Total aerobic plate count (n = 3) on various soiled food packaging materials when inoculated at a level of approximately 5 log CFU/cm2 and stored at 4º C �– First Replicate
Materials Day of Storage
Butcher Paper Cardboard Deli Paper Foil Overwrap Paper Bag Plastic Bag Vacuum
Pouch 0 5.2 ± 0.1 4.8 ± 0.6 4.8 ± 0.4 5.1 ± 0.1 4.9 ± 0.1 4.7 ± 0.3 5.0 ± 0.1 4.9 ± 0.1 4 5.3 ± 0.1 3.3 ± 0.4 4.5 ± 0.3 4.2 ± 0.4 3.7 ± 0.2 4.3 ± 0.6 5.2 ± 0.5 5.4 ± 0.6
11 4.6 ± 0.3 2.7 ± 0.4 3.4 ± 0.3 5.0 ± 0.1 1.9 ± 1.0 4.0 ± 0.3 5.5 ± 0.1 4.7 ± 0.1 18 4.0 ± 0.5 2.7 ± 0.1 3.4 ± 0.0 4.3 ± 0.5 2.0 ± 0.6 3.9 ± 0.6 4.5 ± 1.1 5.1 ± 0.6 25 3.9 ± 0.2 2.9 ± 0.2 3.2 ± 0.5 4.2 ± 0.2 1.6 ± 0.2 4.1 ± 0.3 4.1 ± 1.1 4.9 ± 0.7 32 3.9 ± 0.2 2.6 ± 0.1 2.9 ± 0.3 4.0 ± 0.3 0.8 ± 0.3 3.6 ± 0.4 4.6 ± 0.2 4.7 ± 0.7 39 4.1 ± 0.2 2.9 ± 0.1 2.7 ± 0.1 3.9 ± 0.3 1.1 ± 0.7 4.1 ± 0.0 3.1 ± 0.2 4.9 ± 0.5 53 3.4 ± 0.3 2.6 ± 0.0 3.4 ± 0.3 4.0 ± 0.1 1.3 ± 0.6 3.3 ± 0.2 3.0 ± 0.4 4.3 ± 0.8 67 3.1 ± 0.4 2.7 ± 0.1 2.8 ± 0.2 4.2 ± 0.2 1.7 ± 0.4 3.8 ± 0.1 2.5 ± 0.9 4.8 ± 0.3 81 3.4 ± 0.1 2.9 ± 0.3 2.9 ± 0.1 3.4 ± 0.7 0.9 ± 0.4 3.6 ± 0.3 3.5 ± 0.6 4.9 ± 0.5 95 3.2 ± 0.2 2.8 ± 0.1 2.1 ± 0.7 3.7 ± 0.4 1.5 ± 0.1 3.3 ± 0.4 3.7 ± 0.0 3.8 ± 0.8 109 2.7 ± 0.1 2.9 ± 0.2 2.5 ± 0.3 3.2 ± 0.6 0.8 ± 0.5 3.0 ± 0.4 4.5 ± 0.3 3.5 ± 1.2 123 0.8 ± 0.3 2.7 ± 0.3 0.1 ± 0.2 <1.3 ± 0.3 <-0.1 ± 0.0 1.1 ± 0.2 1.9 ± 0.4 1.9 ± 0.3
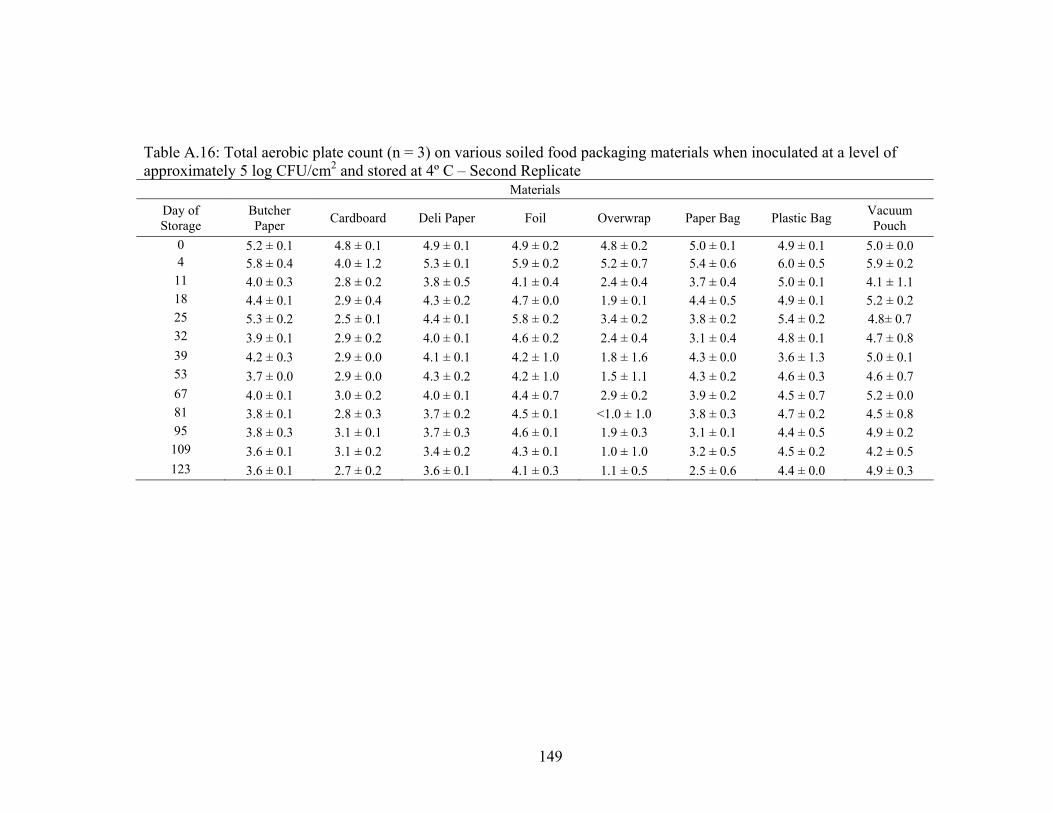
149
Table A.16: Total aerobic plate count (n = 3) on various soiled food packaging materials when inoculated at a level of approximately 5 log CFU/cm2 and stored at 4º C �– Second Replicate
Materials Day of Storage
Butcher Paper Cardboard Deli Paper Foil Overwrap Paper Bag Plastic Bag Vacuum
Pouch 0 5.2 ± 0.1 4.8 ± 0.1 4.9 ± 0.1 4.9 ± 0.2 4.8 ± 0.2 5.0 ± 0.1 4.9 ± 0.1 5.0 ± 0.0 4 5.8 ± 0.4 4.0 ± 1.2 5.3 ± 0.1 5.9 ± 0.2 5.2 ± 0.7 5.4 ± 0.6 6.0 ± 0.5 5.9 ± 0.2
11 4.0 ± 0.3 2.8 ± 0.2 3.8 ± 0.5 4.1 ± 0.4 2.4 ± 0.4 3.7 ± 0.4 5.0 ± 0.1 4.1 ± 1.1 18 4.4 ± 0.1 2.9 ± 0.4 4.3 ± 0.2 4.7 ± 0.0 1.9 ± 0.1 4.4 ± 0.5 4.9 ± 0.1 5.2 ± 0.2 25 5.3 ± 0.2 2.5 ± 0.1 4.4 ± 0.1 5.8 ± 0.2 3.4 ± 0.2 3.8 ± 0.2 5.4 ± 0.2 4.8± 0.7 32 3.9 ± 0.1 2.9 ± 0.2 4.0 ± 0.1 4.6 ± 0.2 2.4 ± 0.4 3.1 ± 0.4 4.8 ± 0.1 4.7 ± 0.8 39 4.2 ± 0.3 2.9 ± 0.0 4.1 ± 0.1 4.2 ± 1.0 1.8 ± 1.6 4.3 ± 0.0 3.6 ± 1.3 5.0 ± 0.1 53 3.7 ± 0.0 2.9 ± 0.0 4.3 ± 0.2 4.2 ± 1.0 1.5 ± 1.1 4.3 ± 0.2 4.6 ± 0.3 4.6 ± 0.7 67 4.0 ± 0.1 3.0 ± 0.2 4.0 ± 0.1 4.4 ± 0.7 2.9 ± 0.2 3.9 ± 0.2 4.5 ± 0.7 5.2 ± 0.0 81 3.8 ± 0.1 2.8 ± 0.3 3.7 ± 0.2 4.5 ± 0.1 <1.0 ± 1.0 3.8 ± 0.3 4.7 ± 0.2 4.5 ± 0.8 95 3.8 ± 0.3 3.1 ± 0.1 3.7 ± 0.3 4.6 ± 0.1 1.9 ± 0.3 3.1 ± 0.1 4.4 ± 0.5 4.9 ± 0.2 109 3.6 ± 0.1 3.1 ± 0.2 3.4 ± 0.2 4.3 ± 0.1 1.0 ± 1.0 3.2 ± 0.5 4.5 ± 0.2 4.2 ± 0.5 123 3.6 ± 0.1 2.7 ± 0.2 3.6 ± 0.1 4.1 ± 0.3 1.1 ± 0.5 2.5 ± 0.6 4.4 ± 0.0 4.9 ± 0.3

150
Table A.17: Populations of Listeria monocytogenes (n = 6) on soiled food packaging surfaces when inoculated at a level of approximately 2 log CFU/cm2 and stored at 25º C �– Combined Means (Figure 1.5)
Materials
Day of Storage
Butcher Paper Cardboard Deli Wax
Paper Aluminum
Foil
PVC Overwrap
Film Paper Bag Plastic Bag Vacuum
Pouch
0 2.1 ± 0.1 1.9 ± 0.2 2.1 ± 0.1 2.3 ± 0.2 2.2 ± 0.0 2.0 ± 0.2 2.2 ± 0.2 2.3 ± 0.2 4 3.7 ± 1.5 1.0 ± 0.6 -0.1 ± 0.0 3.9 ± 0.7 1.7 ± 0.6 3.2 ± 0.8 4.9 ± 1.0 2.8 ± 1.0
11 4.2 ± 0.1 0.7 ± 0.5 -0.1 ± 0.0 4.2 ± 0.6 1.9 ± 1.1 2.4 ± 0.9 4.3 ± 1.5 2.9 ± 1.8 18 3.6 ± 0.5 0.4 ± 0.3 -0.1 ± 0.0 4.2 ± 0.9 1.0 ± 1.4 2.4 ± 0.8 4.0 ± 0.7 3.2 ± 1.1 25 3.9 ± 0.5 0.0 ± 0.3 -0.1 ± 0.0 3.6 ± 0.9 1.0 ± 1.4 1.7 ± 0.8 4.3 ± 0.7 2.0 ± 1.1 32 3.6 ± 1.1 0.9 ± 1.0 -0.1 ± 0.0 3.5 ± 1.4 1.1 ± 1.8 <0.9 ± 0.9 3.1 ± 0.9 1.6 ± 1.3 39 2.4 ± 0.7 -0.1 ± 0.0 -0.1 ± 0.0 3.4 ± 1.6 1.0 ± 1.5 <-0.1 ± 0.0 3.7 ± 1.1 1.0 ± 1.7 53 3.0 ± 0.6 -0.1 ± 0.0 -0.1 ± 0.0 3.7 ± 0.9 1.8 ± 2.1 <0.5 ± 0.7 3.9 ± 0.9 1.9 ± 1.7 67 2.5 ± 0.5 -0.1 ± 0.0 -0.1 ± 0.0 3.0 ± 1.4 0.9 ± 1.2 <-0.1 ± 0.0 3.6 ± 0.9 3.4 ± 0.7 81 2.0 ±0.7 -0.1 ± 0.0 -0.1 ± 0.0 2.8 ± 1.8 0.0 ± 0.1 <-0.1 ± 0.0 2.9 ± 1.6 2.0 ± 0.9 95 2.3 ± 0.6 -0.1 ± 0.0 -0.1 ± 0.0 3.0 ±1.4 -0.1 ± 0.0 <-0.1 2.9 ± 1.8 0.5 ± 1.0 109 1.4 ± 0.8 -0.1 ± 0.0 -0.1 ± 0.0 2.3 ± 1.4 0.1 ± 0.6 <-0.1 2.3 ± 1.3 0.9 ± 1.6 123 1.4 ± 0.3 -0.1 ± 0.0 -0.1 ± 0.0 1.9 ± 2.2 0.3 ± 0.7 <-0.1 1.7 ± 2.1 0.5 ± 1.0

151
Table A.18: Populations of Listeria monocytogenes (n = 3) on soiled food packaging surfaces when inoculated at a level of approximately 2 log CFU/cm2 and stored at 25º C �– First Replicate
Materials
Day of Storage
Butcher Paper Cardboard Deli Paper Foil Overwrap Paper Bag Plastic Bag Vacuum Bag
0 2.1 0.0 2.1 0.1 2.1 0.03 2.1 0.0 2.1 0.1 2.0 0.05 2.1 0.0 2.1 0.2 4 3.0 2.1 0.5 0.3 <-0.1 3.1 0.8 1.3 1.8 3.1 0.40 4.5 0.1 1.8 1.7
11 4.0 0.1 1.1 0.1 <-0.1 3.6 0.6 1.7 0.4 2.3 0.94 3.6 1.1 2.9 0.9 18 4.0 0.5 0.8 0.3 <-0.1 0.0 3.7 0.5 <0.6 1.1 1.7 0.63 2.9 1.3 4.7 0.1 25 3.7 0.2 <0.1 0.4 <-0.1 2.9 0.4 <-0.1 1.0 0.48 4.0 0.5 2.7 1.0 32 <3.1 1.3 1.4 1.1 Discontinued 2.4 1.2 <-0.1 <0.5 0.57 2.5 0.8 2.4 0.2 39 2.0 0.8 <-0.1 Discontinued 2.1 0.9 <-0.1 <-0.1 0.0 3.0 1.2 <2.0 1.9 53 2.8 0.9 <-0.1 Discontinued 2.8 0.1 <-0.1 <-0.1 3.0 0.2 3.3 0.2 67 2.3 0.6 0.0 0.2 Discontinued 1.8 0.8 0.0 0.2 <-0.1 0.0 2.7 0.3 2.8 0.3 81 2.5 0.5 <-0.1 Discontinued <1.3 1.2 <0.0 0.2 <-0.1 ± 0.0 1.6 0.8 1.8 0.3 95 2.0 0.4 <-0.1 Discontinued 1.7 0.2 <-0.10 <-0.10 <1.5 1.4 <0.8 1.2
109 0.7 0.5 Discontinued Discontinued 1.1 1.1 <-0.10 Discontinued 1.6 1.6 1.9 1.8 123 1.1 0.1 Discontinued Discontinued <-0.1 0.0 <-0.10 Discontinued <-0.1 0.0 <0.1 0.4

152
Table A.19: Populations of Listeria monocytogenes (n = 3) on soiled food packaging surfaces when inoculated at a level of approximately 2 log CFU/cm2 and stored at 25º C �– Second Replicate
Materials Day of Storage Butcher Paper Cardboard Deli Paper Foil Overwrap Paper Bag Plastic Bag Vacuum Bag
0 2.1 0.1 1.6 0.1 2.2 0.1 2.4 0.1 2.2 0.0 2.0 0.3 2.4 0.2 2.4 0.1 4 4.4 0.5 1.5 0.4 <-0.1 0.0 4.7 0.2 2.0 0.3 3.2 0.4 5.2 0.1 4.3 0.7
11 4.3 0.1 <0.3 0.8 <-0.1 0.0 4.7 0.2 2.2 0.7 2.5 0.9 5.1 0.1 2.9 1.3 18 3.3 0.4 <0.0 0.2 <-0.1 0.0 4.7 0.2 1.4 1.0 3.1 0.2 5.1 0.1 <1.7 0.9 25 4.1 0.7 <-0.1 0.0 <-0.1 0.0 4.4 0.3 2.0 1.3 2.4 1.4 4.6 0.9 1.4 0.9 32 4.1 0.8 <0.3 0.4 <-0.1 0.0 4.5 0.3 <2.3 2.1 1.2 1.2 3.7 0.4 1.3 1.9 39 2.8 0.5 <-0.1 0.0 Discontinued 4.8 0.2 2.2 0.4 <-0.1 0.0 4.4 <-0.1 0.0 53 3.2 0.4 <-0.1 0.0 Discontinued 4.2 0.6 3.7 0.3 1.1 0.6 4.0 0.2 <0.5 1.0 67 2.7 0.2 <-0.1 0.0 Discontinued 4.2 0.6 1.8 1.1 <-0.1 0.0 4.4 0.4 4.0 0.3 81 1.5 0.4 <-0.1 0.0 Discontinued 4.3 0.1 <-0.1 <-0.1 4.1 0.9 2.3 1.4 95 2.8 0.5 <-0.1 0.0 Discontinued 4.2 0.1 <-0.1 0.0 <-0.1 4.4 0.2 <-0.1 109 2.0 0.3 Discontinued Discontinued 3.4 0.1 <0.4 0.8 Discontinued 3.0 0.5 <-0.1 0.0 123 1.7 0.1 Discontinued Discontinued 4.0 0.1 <0.8 0.8 Discontinued 3.5 1.1 <0.8 1.4
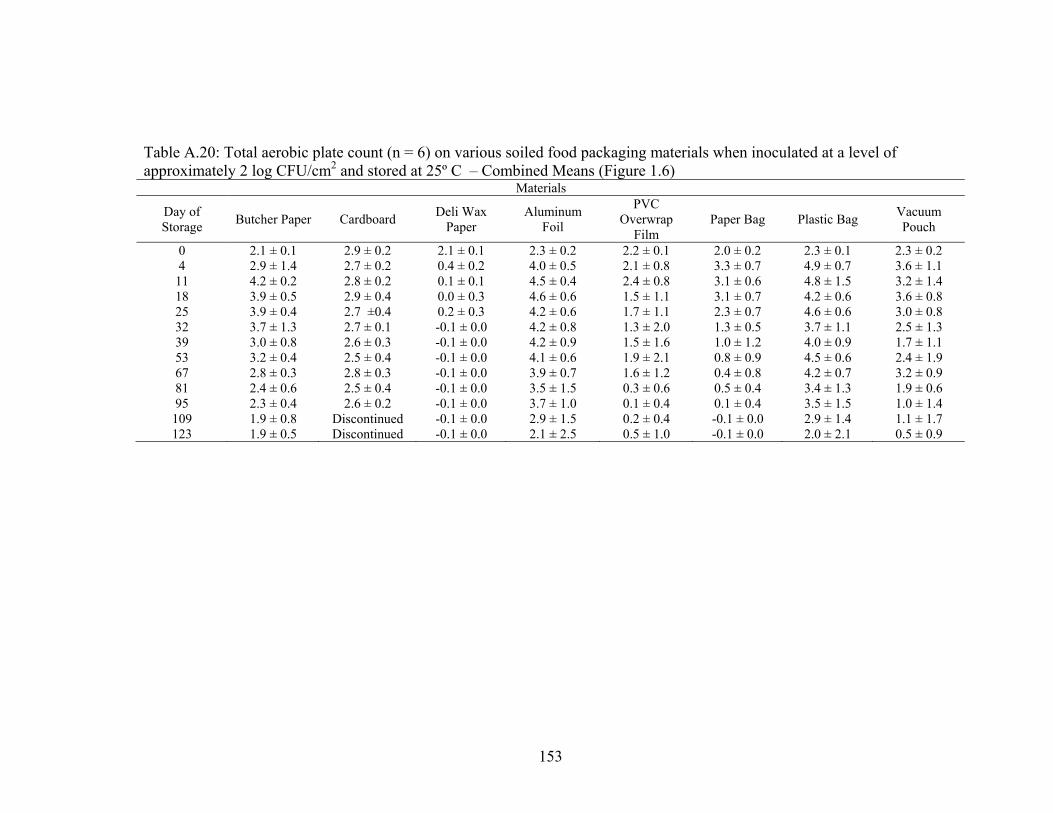
153
Table A.20: Total aerobic plate count (n = 6) on various soiled food packaging materials when inoculated at a level of approximately 2 log CFU/cm2 and stored at 25º C �– Combined Means (Figure 1.6)
Materials
Day of Storage Butcher Paper Cardboard Deli Wax
Paper Aluminum
Foil
PVC Overwrap
Film Paper Bag Plastic Bag Vacuum
Pouch
0 2.1 ± 0.1 2.9 ± 0.2 2.1 ± 0.1 2.3 ± 0.2 2.2 ± 0.1 2.0 ± 0.2 2.3 ± 0.1 2.3 ± 0.2 4 2.9 ± 1.4 2.7 ± 0.2 0.4 ± 0.2 4.0 ± 0.5 2.1 ± 0.8 3.3 ± 0.7 4.9 ± 0.7 3.6 ± 1.1
11 4.2 ± 0.2 2.8 ± 0.2 0.1 ± 0.1 4.5 ± 0.4 2.4 ± 0.8 3.1 ± 0.6 4.8 ± 1.5 3.2 ± 1.4 18 3.9 ± 0.5 2.9 ± 0.4 0.0 ± 0.3 4.6 ± 0.6 1.5 ± 1.1 3.1 ± 0.7 4.2 ± 0.6 3.6 ± 0.8 25 3.9 ± 0.4 2.7 ±0.4 0.2 ± 0.3 4.2 ± 0.6 1.7 ± 1.1 2.3 ± 0.7 4.6 ± 0.6 3.0 ± 0.8 32 3.7 ± 1.3 2.7 ± 0.1 -0.1 ± 0.0 4.2 ± 0.8 1.3 ± 2.0 1.3 ± 0.5 3.7 ± 1.1 2.5 ± 1.3 39 3.0 ± 0.8 2.6 ± 0.3 -0.1 ± 0.0 4.2 ± 0.9 1.5 ± 1.6 1.0 ± 1.2 4.0 ± 0.9 1.7 ± 1.1 53 3.2 ± 0.4 2.5 ± 0.4 -0.1 ± 0.0 4.1 ± 0.6 1.9 ± 2.1 0.8 ± 0.9 4.5 ± 0.6 2.4 ± 1.9 67 2.8 ± 0.3 2.8 ± 0.3 -0.1 ± 0.0 3.9 ± 0.7 1.6 ± 1.2 0.4 ± 0.8 4.2 ± 0.7 3.2 ± 0.9 81 2.4 ± 0.6 2.5 ± 0.4 -0.1 ± 0.0 3.5 ± 1.5 0.3 ± 0.6 0.5 ± 0.4 3.4 ± 1.3 1.9 ± 0.6 95 2.3 ± 0.4 2.6 ± 0.2 -0.1 ± 0.0 3.7 ± 1.0 0.1 ± 0.4 0.1 ± 0.4 3.5 ± 1.5 1.0 ± 1.4 109 1.9 ± 0.8 Discontinued -0.1 ± 0.0 2.9 ± 1.5 0.2 ± 0.4 -0.1 ± 0.0 2.9 ± 1.4 1.1 ± 1.7 123 1.9 ± 0.5 Discontinued -0.1 ± 0.0 2.1 ± 2.5 0.5 ± 1.0 -0.1 ± 0.0 2.0 ± 2.1 0.5 ± 0.9

154
Table A.21: Total aerobic plate count (n = 3) on various soiled food packaging materials when inoculated at a level of approximately 2 log CFU/cm2 and stored at 25º C �– First Replicate
Materials Day of Storage Butcher Paper Cardboard Deli Paper Foil Overwrap Paper Bag Plastic Bag Vacuum Bag
0 2.1 0.1 2.8 0.1 2.1 0.1 2.1 0.1 2.1 0.1 2.0 0.1 2.2 0.0 2.1 0.0 4 3.3 1.9 2.5 0.1 0.3 0.3 3.3 0.6 1.7 2.0 3.2 0.1 4.5 0.1 3.0 0.4
11 4.1 0.0 2.9 0.2 <0.0 0.2 4.1 0.1 1.8 0.5 2.6 0.7 4.3 0.7 3.2 0.7 18 4.2 0.3 3.0 0.1 <0.0 0.2 4.2 0.3 1.2 0.9 2.6 0.4 3.2 1.6 4.8 0.1 25 3.7 0.2 2.9 0.4 <0.1 0.3 3.8 0.5 1.0 1.2 2.1 0.5 4.3 0.2 3.3 1.1 32 3.2 1.6 2.7 0.0 Discontinued 3.6 0.5 <0.0 0.2 1.0 0.5 3.1 1.3 2.8 0.3 39 2.6 0.8 2.6 0.2 Discontinued 3.4 0.2 <0.1 0.4 <-0.1 0.0 3.4 0.9 1.7 1.6 53 3.0 0.3 2.7 0.4 Discontinued 3.6 0.3 <-0.1 0.0 <0.1 0.3 4.0 0.4 4.2 0.6 67 2.8 0.4 3.1 0.1 Discontinued 3.4 0.4 0.5 0.5 <-0.1 0.0 3.6 0.2 2.6 0.9 81 2.9 0.4 2.8 0.4 Discontinued 2.5 1.6 0.6 0.6 0.6 0.3 2.5 1.1 2.3 0.1 95 2.3 0.5 2.6 0.3 Discontinued 2.8 0.3 <-0.1 0.0 <0.2 0.5 2.3 1.2 1.5 1.7 109 1.2 0.3 Discontinued Discontinued 1.6 0.6 <-0.1 0.0 Discontinued 2.1 1.8 2.4 1.7 123 1.5 0.6 Discontinued Discontinued <-0.1 0.0 <-0.1 0.0 Discontinued <0.2 0.5 <0.5 1.1

155
Table A.22: Total aerobic plate count (n = 3) on various soiled food packaging materials when inoculated at a level of approximately 2 log CFU/cm2 and stored at 25º C �– Second Replicate
Materials Day of Storage
Butcher Paper Cardboard Deli Paper Foil Overwrap Paper Bag Plastic Bag Vacuum Bag
0 2.0 0.0 3.1 0.1 2.2 0.1 2.4 0.1 2.3 0.1 2.0 0.3 2.3 0.1 2.4 0.1 4 4.5 0.4 3.0 0.3 0.6 0.3 4.8 0.1 2.8 0.2 3.4 0.1 5.2 0.2 4.2 0.0
11 4.4 0.2 2.7 0.1 <0.1 0.2 4.9 0.1 3.0 0.6 3.6 0.3 5.3 0.1 3.2 1.7 18 3.5 0.4 2.8 0.1 <-0.1 0.0 4.9 0.1 1.9 0.7 3.5 0.1 5.2 0.1 2.5 0.8 25 4.2 0.4 2.5 0.2 <0.3 0.3 4.7 0.3 2.4 0.0 2.6 0.9 4.9 0.8 2.6 0.3 32 4.3 0.6 2.6 0.2 <-0.1 0.0 4.8 0.4 <2.5 2.3 1.8 0.1 4.4 0.2 2.2 2.4 39 3.4 0.6 2.5 0.4 Discontinued 5.0 0.1 2.8 0.8 2.1 0.2 4.6 0.6 1.7 0.2 53 3.3 0.5 2.3 0.1 Discontinued 4.6 0.4 3.8 0.2 1.6 0.5 5.0 0.1 <1.2 1.2 67 2.9 0.2 2.5 0.1 Discontinued 4.4 0.6 2.6 0.6 1.0 0.8 4.7 0.4 3.8 0.2 81 2.0 0.4 2.3 0.3 Discontinued 4.5 0.1 <-0.1 0.0 0.5 0.6 4.2 0.9 <1.5 0.6 95 2.2 0.0 2.5 0.1 Discontinued 4.6 0.2 <0.4 0.4 <-0.1 0.0 4.7 0.3 0.3 0.6 109 2.6 0.1 Discontinued Discontinued 4.3 0.4 0.5 0.4 Discontinued 2.7 0.5 <-0.1 123 2.2 0.0 Discontinued Discontinued 4.4 0.1 <1.2 1.2 Discontinued 3.8 1.1 0.4 0.7

156
Table A.23: Populations of Listeria monocytogenes (n = 6) on soiled food packaging surfaces when inoculated at a level of approximately 2 log CFU/cm2 and stored at 4º C �– Combined Means (Figure 1.7)
Materials
Day of Storage
Butcher Paper Cardboard Deli Wax
Paper Aluminum
Foil
PVC Overwrap
Film Paper Bag Plastic Bag Vacuum
Pouch
0 2.1 ± 0.1 1.9 ± 0.2 2.1 ± 0.1 2.3 ± 0.2 2.2 ± 0.0 2.0 ± 0.2 2.2 ± 0.2 2.3 ± 0.2 4 1.4 ± 0.4 0.3 ± 0.4 1.1 ± 0.9 1.4 ± 0.6 -0.1 ± 0.0 1.0 ± 0.4 1.9 ± 0.2 <1.0 ± 1.0
11 0.6 ± 0.4 <0.2 ± 0.4 0.0 ± 0.2 1.0 ± 0.3 -0.1 ± 0.0 <0.7 ± 0.5 1.9 ± 0.3 <1.0 ± 1.2 18 0.6 ± 0.3 0.1 ± 0.4 <-0.1 ± 0.1 1.1 ± 0.2 0.2 ± 0.7 0.9 ± 0.3 1.7 ± 0.1 <0.7 ± 0.8 25 0.6 ± 0.5 <0.0 ± 0.2 <-0.1 ± 0.1 0.9 ± 0.3 <-0.1 ± 0.1 1.0 ± 0.5 1.6 ± 0.4 <0.7 ± 1.0 32 <0.2 ± 0.5 0.1 ± 0.3 <-0.10 0.8 ± 0.6 <-0.1 ± 0.1 0.4 ± 0.5 1.6 ± 0.2 <0.9 ± 0.8 39 0.5 ± 0.6 <0.1 ± 0.2 <-0.10 1.0 ± 0.2 <-0.1 ± 0.1 <0.2 ± 0.3 1.7 ± 0.2 <1.3 ± 1.1 53 0.5 ± 0.5 <-0.1 ± 0.1 <-0.10 <0.3 ± 0.5 <-0.1 ± 0.1 <0.0 ± 0.2 1.5 ± 0.3 <1.1 ± 1.0 67 0.4 ± 0.7 <-0.1 ± 0.1 <-0.10 0.2 ± 0.4 <-0.1 ± 0.1 <-0.1 ± 0.1 1.4 ± 0.4 <1.0 ± 1.1 81 <-0.1 ±0.2 <-0.1 ± 0.1 <-0.10 <0.2 ± 0.4 <-0.1 ± 0.1 <-0.1 ± 0.1 1.2 ± 0.2 <-0.1 ± 0.0 95 0.4 ± 0.5 <-0.1 ± 0.1 <-0.10 <0.3 ± 0.4 <-0.1 ± 0.1 <-0.1 ± 0.1 1.2 ± 0.7 <0.8 ± 0.8
109 <-0.1 ± 0.1 <-0.1 ± 0.1 <-0.10 <0.1 ± 0.3 <-0.1 ± 0.1 <-0.1 ± 0.1 0.6 ± 0.6 <0.9 ± 1.0 123 <-0.1 ± 0.1 <-0.1 ± 0.1 <-0.10 <0.0 ± 0.1 <-0.1 ± 0.1 <-0.1 ± 0.1 <0.1 ± 0.3 <0.5 ± 0.5

157
Table A.24: Populations of Listeria monocytogenes (n = 3) on soiled food packaging surfaces when inoculated at a level of approximately 2 log CFU/cm2 and stored at 4º C �– First Replicate
Materials Day of Storage
Butcher Paper Cardboard Deli Paper Foil Overwrap Paper Bag Plastic Bag Vacuum Bag
0 2.1 0.0 2.1 0.1 2.1 0.0 2.1 0.0 2.1 0.1 2.0 0.1 2.1 0.0 2.1 0.1 4 1.3 0.6 0.5 0.2 0.2 0.3 1.1 0.7 <-0.1 0.0 0.7 0.5 2.1 0.0 1.4 0.7
11 0.7 0.1 0.6 0.1 <0.1 0.3 1.2 0.1 <-0.1 0.0 <0.2 0.4 2.2 0.1 2.2 0.1 18 0.6 0.3 0.4 0.4 <-0.1 0.0 1.2 0.0 <-0.10 1.0 0.2 1.7 0.1 1.0 0.8 25 0.9 0.2 0.1 0.3 <-0.10 1.1 0.1 <-0.10 1.2 0.3 1.9 0.2 1.3 1.2 32 <0.5 0.5 <0.3 0.4 <-0.10 1.3 0.2 <-0.10 0.6 0.7 1.7 0.2 1.3 0.9 39 1.1 0.1 0.3 0.1 <-0.10 1.1 0.2 <-0.10 <0.3 0.3 1.9 0.0 1.9 0.3 53 0.6 0.3 <-0.1 0.0 <-0.10 <0.1 0.4 <-0.10 <0.1 0.4 1.7 0.2 1.8 0.2 67 0.9 0.7 <-0.1 0.0 <-0.10 0.0 0.2 Discontinued <-0.1 0.0 1.7 0.1 1.9 0.1 81 <-0.1 0.0 <-0.1 0.0 <-0.10 <0.5 0.5 Discontinued <-0.1 0.0 1.4 0.1 <-0.1 0.0 95 0.3 0.4 <-0.1 0.0 <-0.10 <0.3 0.4 Discontinued <-0.1 0.0 1.5 0.1 <1.0 1.0 109 <-0.1 0.0 Discontinued Discontinued 0.3 0.4 Discontinued Discontinued 1.1 0.2 1.7 0.3 123 <-0.1 0.0 Discontinued Discontinued <-0.10 Discontinued Discontinued <0.1 0.3 0.7 0.2
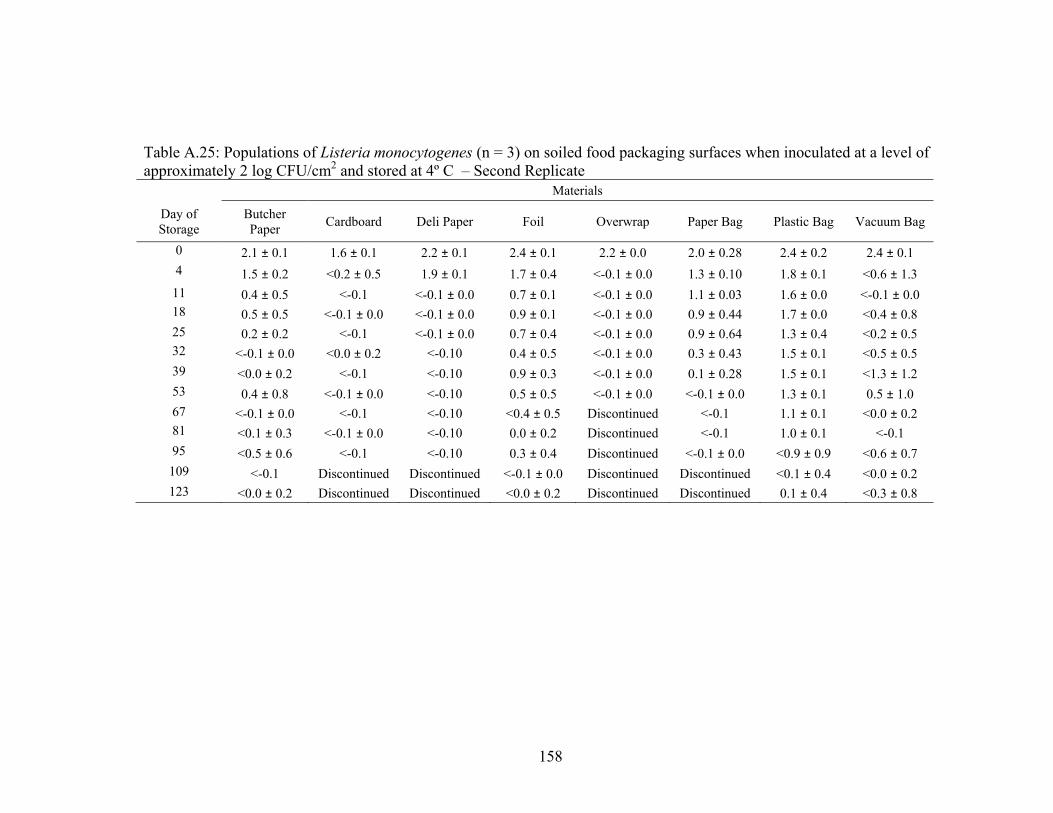
158
Table A.25: Populations of Listeria monocytogenes (n = 3) on soiled food packaging surfaces when inoculated at a level of approximately 2 log CFU/cm2 and stored at 4º C �– Second Replicate
Materials
Day of Storage
Butcher Paper Cardboard Deli Paper Foil Overwrap Paper Bag Plastic Bag Vacuum Bag
0 2.1 0.1 1.6 0.1 2.2 0.1 2.4 0.1 2.2 0.0 2.0 0.28 2.4 0.2 2.4 0.1 4 1.5 0.2 <0.2 0.5 1.9 0.1 1.7 0.4 <-0.1 0.0 1.3 0.10 1.8 0.1 <0.6 1.3
11 0.4 0.5 <-0.1 <-0.1 0.0 0.7 0.1 <-0.1 0.0 1.1 0.03 1.6 0.0 <-0.1 0.0 18 0.5 0.5 <-0.1 0.0 <-0.1 0.0 0.9 0.1 <-0.1 0.0 0.9 0.44 1.7 0.0 <0.4 0.8 25 0.2 0.2 <-0.1 <-0.1 0.0 0.7 0.4 <-0.1 0.0 0.9 0.64 1.3 0.4 <0.2 0.5 32 <-0.1 0.0 <0.0 0.2 <-0.10 0.4 0.5 <-0.1 0.0 0.3 0.43 1.5 0.1 <0.5 0.5 39 <0.0 0.2 <-0.1 <-0.10 0.9 0.3 <-0.1 0.0 0.1 0.28 1.5 0.1 <1.3 1.2 53 0.4 0.8 <-0.1 0.0 <-0.10 0.5 0.5 <-0.1 0.0 <-0.1 0.0 1.3 0.1 0.5 1.0 67 <-0.1 0.0 <-0.1 <-0.10 <0.4 0.5 Discontinued <-0.1 1.1 0.1 <0.0 0.2 81 <0.1 0.3 <-0.1 0.0 <-0.10 0.0 0.2 Discontinued <-0.1 1.0 0.1 <-0.1 95 <0.5 0.6 <-0.1 <-0.10 0.3 0.4 Discontinued <-0.1 0.0 <0.9 0.9 <0.6 0.7 109 <-0.1 Discontinued Discontinued <-0.1 0.0 Discontinued Discontinued <0.1 0.4 <0.0 0.2 123 <0.0 0.2 Discontinued Discontinued <0.0 0.2 Discontinued Discontinued 0.1 0.4 <0.3 0.8

159
Table A.26: Total aerobic plate count (n = 6) on various soiled food packaging materials when inoculated at a level of approximately 2 log CFU/cm2 and stored at 4º C �– Combined Means (Figure 1.8)
Materials
Day of Storage Butcher Paper Cardboard Deli Wax
Paper Aluminum
Foil
PVC Overwrap
Film Paper Bag Plastic Bag Vacuum
Pouch
0 2.1 ± 0.1 2.9 ± 0.2 2.1 ± 0.1 2.3 ± 0.2 2.2 ± 0.1 2.0 ± 0.2 2.3 ± 0.1 2.3 ± 0.2 4 1.7 ± 0.3 2.4 ± 0.1 1.4 ± 0.8 1.8 ± 0.3 0.1 ± 0.3 1.2 ± 0.3 2.1 ± 0.2 1.4 ± 0.7
11 0.9 ± 0.4 2.5 ± 0.2 0.7 ± 0.1 1.6 ± 0.4 0.0 ± 0.1 1.2 ± 0.5 2.0 ± 0.1 1.1 ± 1.3 18 1.0 ± 0.3 2.6 ± 0.2 0.1 ± 0.3 1.4 ± 0.5 <0.1 ± 0.2 1.4 ± 0.5 2.0 ± 0.1 1.1 ± 0.9 25 0.9 ± 0.4 2.5 ± 0.1 0.2 ± 0.4 1.4 ± 0.6 <0.0 ± 0.3 1.6 ± 0.4 1.9 ± 0.3 1.1 ± 0.9 32 0.7 ± 0.3 2.6 ± 0.2 0.1 ± 0.3 1.5 ± 0.2 0.4 ± 0.7 1.3 ± 0.3 1.9 ± 0.1 1.2 ± 0.7 39 0.9 ± 0.4 2.7 ± 0.1 0.3 ± 0.3 1.7 ± 0.1 -0.1 ± 0.0 1.0 ± 0.6 2.1 ± 0.1 1.9 ± 0.7 53 1.0 ± 0.4 2.5 ± 0.2 0.1 ± 0.3 0.9 ± 0.8 -0.1 ± 0.0 1.2 ± 0.6 1.9 ± 0.1 1.4 ± 0.9 67 0.8 ± 0.7 2.5 ± 0.1 0.2 ± 0.2 1.1 ± 0.6 -0.1 ± 0.0 0.8 ± 0.5 1.8 ± 0.3 1.2 ± 1.1 81 0.6 ± 0.3 2.5 ± 0.3 -0.1 ± 0.0 1.0 ± 0.6 -0.1 ± 0.0 0.9 ± 0.2 1.7 ± 0.1 0.1 ± 0.3 95 1.3 ± 0.5 2.4 ± 0.2 0.3 ± 0.4 1.5 ± 0.2 -0.1 ± 0.0 1.0 ± 0.2 1.6 ± 0.4 1.0 ± 0.8 109 0.3 ± 0.5 Discontinued -0.1 ± 0.0 0.9 ± 0.4 -0.1 ± 0.0 -0.1 ± 0.0 1.2 ± 0.5 1.2 ± 1.1 123 0.2 ± 0.4 Discontinued -0.1 ± 0.0 0.9 ± 0.3 -0.1 ± 0.0 -0.1 ± 0.0 1.1 ± 0.4 1.1 ± 0.7

160
Table A.27: Total aerobic plate count (n = 3) on various soiled food packaging materials when inoculated at a level of approximately 2 log CFU/cm2 and stored at 4º C �– First Replicate
Materials Day of Storage
Butcher Paper Cardboard Deli Paper Foil Overwrap Paper Bag Plastic Bag Vacuum Bag
0 2.1 0.1 2.8 0.1 2.1 0.1 2.1 0.1 2.1 0.1 1.9 0.1 2.2 0.0 2.1 0.0 4 1.7 0.5 2.4 0.1 0.7 0.5 1.7 0.3 0.1 0.4 1.0 0.3 2.2 0.1 1.6 0.6
11 1.2 0.1 2.6 0.1 0.7 0.2 1.8 0.1 <0.0 0.2 0.8 0.3 2.1 0.1 2.2 0.0 18 0.9 0.2 2.5 0.1 0.2 0.3 1.7 0.1 <-0.1 1.7 0.1 2.1 0.1 1.5 0.8 25 1.3 0.3 2.4 0.0 <0.4 0.6 1.8 0.0 <-0.1 1.9 0.1 2.1 0.1 1.6 0.9 32 0.9 0.1 2.6 0.1 <0.1 0.4 1.7 0.1 0.3 0.6 1.4 0.7 1.9 0.2 0.7 1.5 39 1.2 0.2 2.7 0.1 0.4 0.2 1.8 0.1 <-0.1 <0.9 0.9 2.2 0.0 2.1 0.2 53 1.2 0.1 2.7 0.1 0.3 0.3 0.2 0.5 <-0.1 1.7 0.1 2.0 0.1 2.0 0.2 67 1.2 0.5 2.5 0.1 0.1 0.2 0.8 0.8 Discontinued 1.2 0.2 1.8 0.5 2.1 0.1 81 0.7 0.2 2.4 0.3 <-0.1 0.0 0.9 0.9 Discontinued 1.0 0.1 1.8 0.2 0.2 0.3 95 1.0 0.1 2.4 0.3 0.1 0.4 1.5 0.2 Discontinued 0.9 0.1 1.9 0.1 <1.0 1.0 109 0.4 0.6 Discontinued Discontinued 1.3 0.2 Discontinued Discontinued 1.6 0.2 2.1 0.2 123 <0.3 0.3 Discontinued Discontinued 0.6 0.2 Discontinued Discontinued 1.1 0.6 1.4 0.1

161
Table A.28: Total aerobic plate count (n = 3)on various soiled food packaging materials when inoculated at a level of approximately 2 log CFU/cm2 and stored at 4º C �– Second Replicate
Materials Day of Storage Butcher Paper Cardboard Deli Paper Foil Overwrap Paper Bag Plastic Bag Vacuum Bag
0 2.0 0.0 3.1 0.1 2.2 0.1 2.4 0.1 2.3 0.1 2.0 0.3 2.3 0.1 2.4 0.1 4 1.7 0.2 2.4 0.1 2.1 0.1 1.9 0.2 <0.1 0.2 1.4 0.1 2.0 0.1 1.1 0.9
11 0.6 0.4 2.5 0.2 0.7 0.1 1.3 0.6 <-0.1 0.0 1.6 0.1 1.9 0.1 <-0.1 0.0 18 1.1 0.4 2.8 0.1 0.1 0.3 1.2 0.7 0.2 0.0 1.0 0.6 1.9 0.1 <0.8 0.9 25 0.6 0.2 2.5 0.1 <0.1 0.2 1.0 0.7 <0.1 0.4 1.3 0.3 1.7 0.2 <0.6 0.6 32 0.5 0.3 2.7 0.4 <0.0 0.2 1.4 0.1 0.6 0.8 1.1 0.2 1.9 0.1 0.9 0.6 39 0.7 0.4 2.8 0.1 0.2 0.5 1.7 0.1 <-0.1 0.0 1.1 0.4 1.9 0.0 1.6 1.1 53 0.9 0.5 2.4 0.2 0.0 0.2 1.6 0.1 <-0.1 0.0 0.7 0.5 1.8 0.0 0.8 1.0 67 0.3 0.4 2.5 0.1 <0.2 0.3 1.5 0.1 Discontinued <0.5 0.5 1.8 0.1 <0.2 0.3 81 <0.4 0.4 2.5 0.3 <-0.1 0.0 1.1 0.1 Discontinued 0.7 0.1 1.7 0.1 <-0.1 0.0 95 1.6 0.6 2.5 0.2 <0.4 0.5 1.6 0.0 Discontinued 1.0 0.2 1.3 0.5 1.0 0.7
109 0.2 0.5 Discontinued Discontinued 0.5 0.2 Discontinued Discontinued 0.8 0.2 <0.3 0.6 123 0.2 0.5 Discontinued Discontinued 1.1 0.2 Discontinued Discontinued 1.1 0.1 <0.8 0.9

162
Table A.29: Summary of statistical analysis results showing which soiled materials inoculated with Escherichia coli O157:H7 (inoculated at 6 log CFU/cm2 and stored up to 130 days at 25º C) exhibited a replication effect
Packaging Material P Value (TSA+Rifampicin) P Value (TSA) Butcher Paper <0.0001* <0.0001*
Cardboard Box Material <0.0001* <0.0001* PVC Overwrap Film 0.0103* 0.0102*
Vacuum Pouch Material 0.0206* 0.1983 * Effects are significant if P < 0.05
Table A.30: Summary of statistical analysis results showing which soiled materials inoculated with Escherichia coli O157:H7 (inoculated at 6 log CFU/cm2 and stored up to 130 days at 4º C) exhibited a replication effect
Packaging Material P Value (TSA+Rifampicin) P Value (TSA) Butcher Paper <0.0001* <0.0001*
Cardboard Box Material 0.0002* 0.0001* PVC Overwrap Film 0.0269* 0.1170
Vacuum Pouch Material 0.7422 0.0006* * Effects are significant if P < 0.05
Table A.31: Summary of statistical analysis results showing which soiled materials inoculated with Escherichia coli O157:H7 (inoculated at 4 log CFU/cm2 and stored up to 130 days at 25º C) exhibited a replication effect
Packaging Material P Value (TSA+Rifampicin) P Value (TSA) Butcher Paper 0.1162 0.0024*
Cardboard Box Material <0.0001* <0.0001* PVC Overwrap Film <0.0001* <0.0001*
Vacuum Pouch Material 0.0004 <0.0001* * Effects are significant if P < 0.05
Table A.32: Summary of statistical analysis results showing which soiled materials inoculated with Escherichia coli O157:H7 (inoculated at 4 log CFU/cm2 and stored up to 130 days at 4º C) exhibited a replication effect
Packaging Material P Value (TSA+Rifampicin) P Value (TSA) Butcher Paper 0.0043* <0.0001*
Cardboard Box Material 0.4333 0.1543 PVC Overwrap Film <0.0001* <0.0001*
Vacuum Pouch Material 0.0021* 0.6265 * Effects are significant if P < 0.05

163
Table A.33: Escherichia coli O157:H7 (n = 6) survival on soiled food packaging materials when inoculated at a level of approximately 6 log CFU/cm2 and stored at 25º C (TSA + Rifampicin) �– Combined Means (Figure 2.1)
Materials Day of Storage Butcher Paper Cardboard Overwrap Vacuum Pouch
0 6.0 ± 0.2 6.0 ± 0.1 5.9 ± 0.1 6.0 ± 0.2 4 4.7 ± 0.6 4.8 ± 0.6 4.3 ± 1.2 4.5 ± 0.5
11 4.8 ± 0.2 4.4 ± 0.8 4.7 ± 0.3 3.8 ± 0.4 18 4.4 ± 0.2 3.9 ± 1.3 4.1 ± 0.4 3.7 ± 0.9 25 4.0 ± 0.3 3.9 ± 0.9 3.4 ± 0.7 3.1 ± 1.4 32 4.0 ± 0.3 3.0 ± 1.5 3.5 ± 0.5 2.9 ± 0.4 39 3.3 ± 0.3 2.8 ± 0.7 2.8 ± 0.7 3.4 ± 0.7 53 3.1 ± 0.4 2.8 ± 0.7 2.5 ± 0.5 <2.1 ± 1.2 67 2.7 ± 0.4 2.6 ± 1.4 2.5 ± 0.3 1.9 ± 0.8 81 2.4 ± 0.4 <1.3 ± 1.6 2.6 ± 0.4 <0.8 ± 0.9 95 2.4 ± 0.6 <1.4 ± 1.7 2.3 ± 0.8 2.0 ± 0.7
109 2.4 ± 0.5 <1.6 ± 1.7 1.8 ± 0.9 1.3 ± 0.5 130 1.8 ± 0.5 <2.2 ± 1.3 1.6 ± 0.8 <1.7 ± 1.1
Table A.34: Escherichia coli O157:H7 (n = 3)survival on soiled food packaging materials when inoculated at a level of approximately 6 log CFU/cm2 and stored at 25º C (TSA + Rifampicin) �– First Replicate
Materials Day of Storage Butcher Paper Cardboard Overwrap Vacuum Bag
0 5.9 ± 0.1 5.9 ± 0.0 5.9 ± 0.1 5.8 ± 0.0 4 5.2 ± 0.2 5.1 ± 0.1 5.1 ± 0.3 4.7 ± 0.6
11 4.9 ± 0.2 5.0 ± 0.2 4.6 ± 0.1 4.0 ± 0.4 18 4.5 ± 0.2 4.9 ± 0.3 4.4 ± 0.4 3.2 ± 0.9 25 4.3 ± 0.2 4.7 ± 0.3 3.8 ± 0.1 3.7 ± 0.6 32 4.3 ± 0.1 4.2 ± 0.5 3.9 ± 0.2 3.1 ± 0.3 39 3.5 ± 0.1 2.9 ± 0.6 3.1 ± 0.3 3.7 ± 0.9 53 3.4 ± 0.3 3.3 ± 0.4 2.6 ± 0.8 2.8 ± 0.5 67 3.0 ± 0.1 3.7 ± 0.2 2.5 ± 0.2 2.2 ± 0.9 81 2.6 ± 0.4 2.6 ± 0.8 2.3 ± 0.4 1.1 ± 1.0 95 2.4 ± 0.1 3.0 ± 0.4 1.8 ± 0.9 1.8 ± 0.7
109 2.6 ± 0.7 3.1 ± 0.4 2.3 ± 0.4 1.6 ± 0.5 130 2.2 ± 0.2 3.1 ± 0.0 1.7 ± 0.2 2.1 ± 0.2

164
Table A.35: Escherichia coli O157:H7 (n = 3)survival on soiled food packaging materials when inoculated at a level of approximately 6 log CFU/cm2 and stored at 25º C (TSA + Rifampicin) �– Second Replicate
Materials Day of Storage Butcher Paper Cardboard Overwrap Vacuum Bag
0 6.1 ± 0.2 6.0 ± 0.1 6.0 ± 0.1 6.1 ± 0.1 4 4.3 ±0.4 4.6 ± 0.8 3.5 ± 1.3 4.2 ± 0.3
11 4.7 ± 0.1 3.8 ± 0.7 4.8 ± 0.4 3.7 ± 0.3 18 4.2 ± 0.0 2.9 ± 1.2 3.8 ± 0.0 4.2 ± 0.6 25 3.8 ± 0.1 3.1 ± 0.4 3.0 ± 0.9 2.5 ± 1.8 32 3.8 ± 0.2 1.2 ± 1.3 3.1 ± 0.2 2.7 ± 0.4 39 3.1 ± 0.1 2.6 ± 0.8 2.5 ± 0.9 3.2 ± 0.4 53 2.8 ± 0.3 2.2 ± 0.4 2.4 ± 0.4 1.3 ± 1.3 67 2.4 ± 0.1 1.4 ± 0.9 2.4 ± 0.3 1.6 ± 0.7 81 2.2 ± 0.3 <-0.1 ± 0.0 2.8 ± 0.2 <0.1 ± 0.9 95 2.4 ± 1.0 <-0.10 2.7 ± 0.4 2.0 ± 0.7
109 2.2 ± 0.3 <0.0 ± 0.2 1.3 ± 1.0 1.0 ± 0.5 130 1.3 ± 0.1 <1.2 ± 1.1 1.4 ± 1.1 1.3 ± 1.6
Table A.36: Total aerobic plate count (n = 6) on soiled food packaging materials when inoculated at a level of approximately 6 log CFU/cm2 and stored at 25º C (TSA) �– Combined Means (Figure 2.2)
Materials Day of Storage Butcher Paper Cardboard Overwrap Vacuum Pouch
0 6.0 ± 0.2 6.0 ± 0.2 6.0 ± 0.2 6.0 ± 0.2 4 5.3 ± 0.2 4.5 ± 0.7 5.0 ± 0.3 4.3 ± 0.8
11 4.9 ± 0.3 4.4 ± 0.8 4.5 ± 0.3 3.9 ± 0.4 18 4.5 ± 0.3 4.1 ± 1.2 3.8 ± 0.7 3.9 ± 0.7 25 4.2 ± 0.3 4.1 ± 0.7 3.4 ± 0.6 3.7 ± 1.4 32 4.1 ± 0.4 3.4 ± 1.2 3.6 ± 0.5 2.8 ± 0.6 39 3.3 ± 0.4 3.0 ± 0.4 3.0 ± 0.7 3.1 ± 0.8 53 3.2 ± 0.5 2.9 ± 0.6 2.4 ± 0.5 2.2 ± 1.4 67 2.6 ± 0.4 2.8 ± 0.7 2.0 ± 0.3 <1.6 ± 1.1 81 2.3 ± 0.5 2.4 ± 0.6 2.1 ± 0.1 <1.2 ± 1.0 95 2.3 ± 0.6 2.4 ± 0.9 1.7 ± 0.4 1.5 ± 0.3
109 2.0 ± 0.4 1.8 ± 0.6 <-0.1 ± 0.0 0.6 ± 0.6 130 0.7 ± 0.5 1.9 ± 0.3 <0.1 ± 0.3 <0.6 ± 1.0

165
Table A.37: Total aerobic plate count (n = 3) on soiled food packaging materials when inoculated at a level of approximately 6 log CFU/cm2 and stored at 25º C (TSA) �– First Replicate
Materials Day of Storage Butcher Paper Cardboard Overwrap Vacuum Bag
0 6.0 ± 0.0 5.9 ± 0.0 5.9 ± 0.2 5.9 ± 0.2 4 5.4 ± 0.1 5.1 ± 0.0 5.2 ± 0.2 4.6 ± 0.6
11 5.1 ± 0.2 5.0 ± 0.2 4.5 ± 0.2 4.1 ± 0.5 18 4.7 ± 0.2 5.0 ± 0.2 4.3 ± 0.3 3.6 ± 0.6 25 4.4 ± 0.2 4.7 ± 0.4 3.7 ± 0.1 4.4 ± 0.4 32 4.5 ± 0.1 4.3 ± 0.4 4.0 ± 0.1 3.2 ± 0.3 39 3.7 ± 0.0 3.1 ± 0.4 3.1 ± 0.4 3.0 ± 1.5 53 3.6 ± 0.4 3.3 ± 0.2 2.7 ± 0.4 3.1 ± 0.9 67 2.9 ± 0.2 3.5 ± 0.2 2.0 ± 0.2 2.1 ± 0.9 81 2.5 ± 0.5 2.8 ± 0.5 2.1 ± 0.1 1.2 ± 1.1 95 2.2 ± 0.1 3.1 ± 0.4 1.8 ± 0.6 0.9 ± 0.1
109 2.0 ± 0.4 2.3 ± 0.1 <-0.10 0.7 ± 0.5 130 1.0 ± 0.4 1.8 ± 0.4 <-0.10 0.1 ± 0.2
Table A.38: Total aerobic plate count (n = 3) on soiled food packaging materials when inoculated at a level of approximately 6 log CFU/cm2 and stored at 25º C (TSA) �– Second Replicate
Materials Day of Storage Butcher Paper Cardboard Overwrap Vacuum Bag
0 6.1 ± 0.2 6.1 ± 0.1 6.0 ± 0.1 6.1 ± 0.1 4 5.2 ± 0.1 3.9 ± 0.3 4.8 ± 0.1 4.0 ± 1.0
11 4.8 ± 0.3 3.9 ± 0.7 4.4 ± 0.4 3.8 ± 0.4 18 4.2 ± 0.1 3.2 ± 1.0 3.3 ± 0.5 4.3 ± 0.6 25 3.9 ± 0.2 3.5 ± 0.1 3.1 ± 0.8 2.9 ± 1.8 32 3.8 ± 0.1 2.5 ± 0.8 3.2 ± 0.3 2.3 ± 0.4 39 3.0 ± 0.2 2.9 ± 0.5 2.9 ± 1.0 3.1 ± 0.4 53 2.9 ± 0.2 2.4 ± 0.2 2.2 ± 0.5 1.3 ± 1.3 67 2.3 ± 0.1 2.3 ± 0.2 2.0 ± 0.5 <1.1 ± 1.2 81 2.0 ± 0.3 2.0 ± 0.3 2.1 ± 0.2 <1.1 ± 1.2 95 2.5 ± 0.8 1.7 ± 0.6 1.7 ± 0.3 1.8 ± 1.7
109 1.9 ± 0.4 1.2 ± 0.4 <-0.1 ± 0.0 0.5 ± 0.8 130 0.5 ± 0.5 2.1 ± 0.1 0.23 ± 0.4 <1.0 ± 1.2

166
Table A.39: Escherichia coli O157:H7 (n = 6) survival on soiled food packaging materials when inoculated at a level of approximately 6 log CFU/cm2 and stored at 4º C (TSA + Rifampicin) �– Combined Means (Figure 2.3)
Materials Day of Storage Butcher Paper Cardboard Overwrap Vacuum Pouch
0 6.0 ± 0.2 6.0 ± 0.1 5.9 ± 0.1 6.0 ± 0.2 4 4.6 ± 0.8 3.8 ± 0.3 4.1 ± 0.8 4.0 ± 0.8
11 3.4 ± 0.4 3.9 ± 0.1 3.5 ± 0.4 3.6 ± 0.9 18 2.8 ± 0.3 3.5 ± 0.4 3.3 ± 0.3 3.7 ± 0.3 25 2.6 ± 0.1 3.4 ± 0.3 3.2 ± 0.4 3.1 ± 0.4 32 2.8 ± 0.4 3.1 ± 0.7 3.2 ± 0.8 3.5 ± 0.7 39 2.2 ± 0.7 3.3 ± 0.3 3.3 ± 0.1 3.2 ± 0.4 53 2.0 ± 0.7 2.9 ± 0.2 3.2 ± 0.2 2.6 ± 0.5 67 1.6 ± 0.9 2.6 ± 0.1 2.8 ± 0.3 2.5 ± 0.3 81 1.4 ± 0.8 2.7 ± 0.5 2.9 ± 0.4 2.7 ± 0.3 95 1.3 ± 0.7 2.6 ± 0.5 2.4 ± 0.5 2.2 ± 0.6
109 1.0 ± 0.7 2.2 ± 0.5 1.9 ± 0.4 1.5 ± 0.9 130 <0.3 ± 0.6 2.0 ± 0.4 2.4 ± 0.2 2.3 ± 0.6
Table A.40: Escherichia coli O157:H7 (n = 3) survival on soiled food packaging materials when inoculated at a level of approximately 6 log CFU/cm2 and stored at 4º C (TSA + Rifampicin) �– First Replicate
Materials Day of Storage Butcher Paper Cardboard Overwrap Vacuum Bag
0 5.9 ± 0.1 5.9 ± 0.0 5.9 ± 0.1 5.8 ± 0.0 4 3.9 ± 0.2 3.9 ± 0.1 3.5 ± 0.6 4.1 ± 0.8
11 3.0 ± 0.2 3.9 ± 0.1 3.3 ± 0.1 3.1 ± 0.6 18 2.6 ± 0.2 3.6 ± 0.2 3.3 ± 0.4 3.7 ± 0.3 25 2.5 ± 0.1 3.2 ± 0.3 3.4 ± 0.2 2.9 ± 0.6 32 2.5 ± 0.3 2.5 ± 0.3 3.6 ± 0.5 4.0 ± 0.4 39 2.0 ± 0.9 3.1 ±0.1 3.3 ± 0.0 3.3 ± 0.4 53 1.5 ± 0.1 2.8 ± 0.2 3.2 ± 0.1 2.5 ± 0.3 67 0.7 ± 0.3 2.6 ± 0.1 2.7 ± 0.2 2.3 ± 0.1 81 0.7 ± 0.4 2.3 ± 0.5 2.5 ± 0.3 2.0 ± 0.1 95 0.8 ± 0.3 2.6 ± 0.2 2.3 ± 0.2 2.5 ± 0.7
109 <0.6 ± 0.7 1.9 ± 0.3 1.6 ± 0.2 <0.9 ± 0.9 130 <-0.1 ± 0.0 1.8 ± 0.3 2.4 ± 0.2 2.5 ± 0.5

167
Table A.41: Escherichia coli O157:H7 (n = 3) survival on soiled food packaging materials when inoculated at a level of approximately 6 log CFU/cm2 and stored at 4º C (TSA + Rifampicin) �– Second Replicate
Materials Day of Storage Butcher Paper Cardboard Overwrap Vacuum Bag
0 6.1 ± 0.2 6.0 ± 0.1 6.0 ± 0.1 6.1 ± 0.1 4 5.2 ± 0.2 3.7 ± 0.3 4.7 ± 0.4 3.9 ± 0.9
11 3.8 ± 0.1 3.9 ± 0.1 3.6 ± 0.6 4.1 ± 0.9 18 3.0 ± 0.2 3.4 ± 0.6 3.4 ± 0.3 3.8 ± 0.3 25 2.6 ± 0.1 3.6 ± 0.2 3.1 ± 0.6 3.2 ± 0.1 32 3.0 ± 0.1 3.6 ± 0.2 2.8 ± 0.8 3.1 ± 0.5 39 2.5 ± 0.3 3.5 ± 0.2 3.2 ± 0.1 3.1 ± 0.4 53 2.5 ± 0.6 3.0 ± 0.2 3.2 ± 0.3 2.7 ± 0.6 67 2.2 ± 0.6 2.5 ± 0.2 2.9 ± 0.4 2.8 ± 0.1 81 2.1 ± 0.2 3.0 ± 0.2 3.3 ± 0.0 3.4 ± 0.2 95 2.1 ± 0.3 2.6 ± 0.8 2.5 ± 0.7 1.9 ± 0.5
109 1.4 ± 0.4 2.6 ± 0.3 2.3 ± 0.2 1.0 ± 1.1 130 0.8 ± 0.5 2.2 ± 0.3 2.4 ± 0.2 2.1 ± 0.7
Table A.42: Total aerobic plate count (n = 6) on soiled food packaging materials when inoculated at a level of approximately 6 log CFU/cm2 and stored at 4º C (TSA) �– Combined Means (Figure 2.4)
Materials Day of Storage Butcher Paper Cardboard Overwrap Vacuum Pouch
0 6.0 ± 0.2 6.0 ± 0.2 6.0 ± 0.2 6.0 ± 0.2 4 4.4 ± 0.2 4.2 ± 0.1 4.0 ± 0.8 4.4 ± 0.6
11 4.4 ± 0.2 3.9 ± 0.3 3.7 ± 0.4 4.1 ± 0.8 18 3.7 ± 0.4 3.8 ± 0.1 3.5 ± 0.4 4.2 ± 0.4 25 4.0 ± 0.8 3.7 ± 0.2 3.5 ± 0.4 3.8 ± 0.7 32 4.1 ± 0.7 3.7 ± 0.2 3.2 ± 0.8 3.8 ± 0.5 39 3.8 ± 0.8 3.5 ± 0.2 3.5 ± 0.2 3.5 ± 0.4 53 3.5 ± 0.8 3.0 ± 0.2 2.5 ± 0.7 2.9 ± 0.6 67 3.4 ± 0.8 2.8 ± 0.2 2.4 ± 0.4 3.0 ± 0.6 81 2.7 ± 0.5 2.8 ± 0.2 2.5 ± 0.4 3.1 ± 0.7 95 2.9 ± 0.6 2.8 ± 0.3 2.2 ± 0.5 2.9 ± 0.6
109 2.2 ± 0.7 2.2 ± 0.3 1.7 ± 0.6 1.3 ± 0.6 130 2.7 ± 1.1 1.9 ± 0.2 1.1 ± 0.5 2.0 ± 0.2

168
Table A.43: Total aerobic plate count (n = 3) on soiled food packaging materials when inoculated at a level of approximately 6 log CFU/cm2 and stored at 4º C (TSA) �– First Replicate
Materials Day of Storage Butcher Paper Cardboard Overwrap Vacuum Bag
0 6.0 ± 0.0 5.9 ± 0.0 5.9 ± 0.2 5.9 ± 0.2 4 4.3 ± 0.3 4.1 ± 0.2 3.9 ± 0.9 4.4 ± 0.9
11 3.9 ± 0.3 3.6 ± 0.2 3.4 ± 0.2 3.6 ± 0.0 18 3.3 ± 0.1 3.8 ± 0.1 3.5 ± 0.5 3.9 ± 0.3 25 3.5 ± 0.2 3.6 ± 0.2 3.6 ± 0.1 3.4 ± 0.4 32 3.1 ± 0.2 3.7 ± 0.2 3.7 ± 0.4 4.0 ± 0.4 39 2.8 ± 0.2 3.3 ± 0.0 3.6 ± 0.0 3.5 ± 0.5 53 2.7 ± 0.1 2.9 ± 0.2 3.1 ± 0.2 2.6 ± 0.4 67 3.1 ± 0.5 2.8 ± 0.1 2.5 ± 0.1 2.5 ± 0.1 81 2.5 ± 0.4 2.7 ± 0.3 2.2 ± 0.2 2.5 ± 0.3 95 2.5 ± 0.3 2.9 ± 0.2 2.3 ± 0.2 3.0 ± 0.7
109 1.7 ± 0.4 2.0 ± 0.2 1.9 ± 0.8 1.2 ± 0.2 130 1.7 ± 0.1 1.9 ± 0.3 1.5 ± 0.4 1.9 ± 0.2
Table A.44: Total aerobic plate count (n = 3) on soiled food packaging materials when inoculated at a level of approximately 6 log CFU/cm2 and stored at 4º C (TSA) �– Second Replicate
Materials Day of Storage Butcher Paper Cardboard Overwrap Vacuum Bag
0 6.1 ± 0.2 6.1 ± 0.1 6. ± 0.1 6.1 ± 0.1 4 4.4 ± 0.1 4.2 ± 0.0 4.0 ± 1.0 4.4 ± 0.2
11 3.8 ± 0.6 4.3 ± 0.1 4.1 ± 0.1 4.9 ± 0.2 18 4.7 ± 0.2 3.8 ± 0.1 3.4 ± 0.4 4.5 ± 0.3 25 4.7 ± 0.4 3.9 ± 0.1 3.5 ± 0.6 4.4 ± 0.7 32 4.6 ± 0.1 3.7 ± 0.2 2.7 ± 0.9 3.5 ± 0.5 39 4.2 ± 0.4 3.6 ± 0.2 3.4 ± 0.3 3.6 ± 0.5 53 4.1 ± 0.5 3.0 ± 0.1 2.0 ± 0.5 3.1 ± 0.7 67 4.0 ± 0.7 2.8 ± 0.2 2.4 ± 0.7 3.5 ± 0.1 81 2.9 ± 0.5 2.9 ± 0.2 2.8 ± 0.2 3.7 ± 0.2 95 3.4 ± 0.4 2.8 ± 0.4 2.2 ± 0.8 2.7 ± 0.4
109 2.7 ± 0.6 2.3 ± 0.3 1.5 ± 0.3 1.6 ± 0.9 130 3.8 ± 0.2 1.9 ± 0.1 0.8 ± 0.2 2.2 ± 0.0

169
Table A.45: Escherichia coli O157:H7 (n = 6) survival on soiled food packaging materials when inoculated at a level of approximately 4 log CFU/cm2 and stored at 25º C (TSA + Rifampicin) �– Combined Means (See Figure 2.5)
Materials Day of Storage Butcher Paper Cardboard Overwrap Vacuum Pouch
0 4.0 ± 0.1 4.0 ± 0.2 4.0 ± 0.2 4.0 ± 0.1 4 4.6 ± 0.1 3.1 ± 0.9 4.4 ± 0.2 4.1 ± 0.8
11 4.4 ± 0.2 3.3 ± 0.5 3.3 ± 0.5 4.0 ± 0.7 18 4.0 ± 0.2 3.1 ± 0.4 3.6 ± 0.5 3.5 ± 0.8 25 3.5 ± 0.3 2.6 ± 1.0 3.2 ± 0.6 2.8 ± 0.7 32 3.6 ± 0.4 1.6 ± 1.5 2.7 ± 1.0 2.1 ± 1.0 39 3.0 ± 0.3 2.5 ± 1.1 2.7 ± 0.7 <1.8 ± 1.4 53 2.9 ± 0.3 <1.5 ± 1.7 2.2 ± 0.7 2.8 ± 0.7 67 2.7 ± 0.6 <1.6 ± 1.3 2.0 ± 0.2 2.4 ± 0.9 81 2.8 ± 0.4 <0.9 ± 1.1 <1.6 ± 1.1 <1.1 ± 1.1 95 2.5 ± 0.3 <0.9 ± 0.9 <1.5 ± 0.9 <0.6 ± 1.0
109 2.1 ± 0.6 <0.6 ± 0.8 <2.1 ± 1.2 0.9 ± 1.0 130 1.6 ± 0.8 <0.9 ± 1.0 <1.2 ± 1.1 1.1 ± 1.3
Table A.46: Escherichia coli O157:H7 (n = 3) survival on soiled food packaging materials when inoculated at a level of approximately 4 log CFU/cm2 and stored at 25º C (TSA + Rifampicin) �– First Replicate
Materials Day of Storage Butcher Paper Cardboard Overwrap Vacuum Bag
0 4.1 ± 0.1 4.1 ± 0.1 4.1 ± 0.1 4.1 ± 0.0 4 4.6 ± 0.1 3.9 ± 0.1 4.6 ± 0.2 4.6 ± 0.5
11 4.5 ± 0.2 3.6 ± 0.0 3.5 ± 0.5 4.2 ± 0.8 18 4.1 ± 0.2 3.3 ± 0.2 4.0 ± 0.4 3.8 ± 0.7 25 3.8 ± 0.2 3.5 ± 0.4 3.8 ± 0.2 2.8 ± 0.9 32 3.9 ± 0.2 3.0 ± 0.2 3.5 ± 0.5 2.8 ± 0.5 39 3.1 ± 0.1 3.4 ± 0.3 3.2 ± 0.1 2.6 ± 0.5 53 2.8 ± 0.3 3.1 ± 0.1 2.5 ± 0.7 3.2 ± 0.4 67 2.8 ± 0.8 2.7 ± 0.2 2.2 ± 0.2 2.7 ± 0.4 81 2.6 ± 0.4 1.8 ± 0.5 <1.6 ± 1.5 <0.9 ± 1.7 95 2.4 ± 0.4 1.5 ± 0.3 2.1 ± 0.4 <1.1 ± 1.1
109 2.2 ± 0.6 1.4 ± 0.3 2.9 ± 0.1 1.2 ± 1.3 130 1.7 ± 0.9 1.8 ± 0.2 2.0 ± 0.4 2.2 ± 0.7
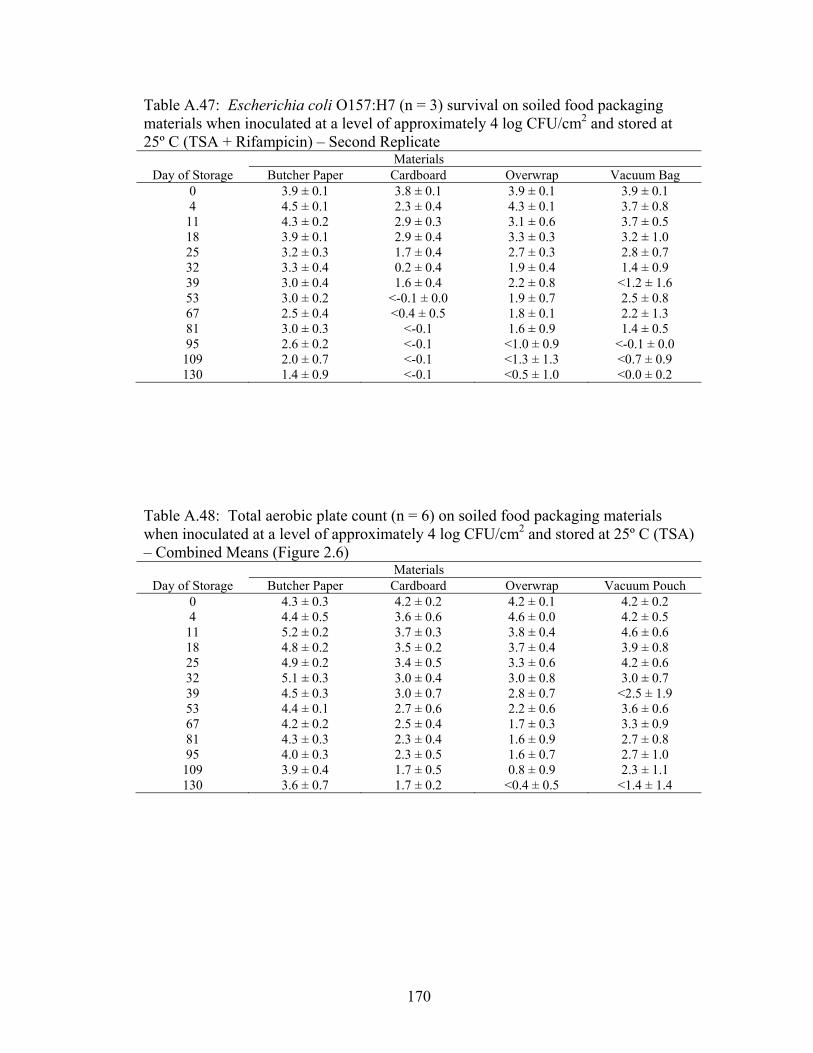
170
Table A.47: Escherichia coli O157:H7 (n = 3) survival on soiled food packaging materials when inoculated at a level of approximately 4 log CFU/cm2 and stored at 25º C (TSA + Rifampicin) �– Second Replicate
Materials Day of Storage Butcher Paper Cardboard Overwrap Vacuum Bag
0 3.9 ± 0.1 3.8 ± 0.1 3.9 ± 0.1 3.9 ± 0.1 4 4.5 ± 0.1 2.3 ± 0.4 4.3 ± 0.1 3.7 ± 0.8
11 4.3 ± 0.2 2.9 ± 0.3 3.1 ± 0.6 3.7 ± 0.5 18 3.9 ± 0.1 2.9 ± 0.4 3.3 ± 0.3 3.2 ± 1.0 25 3.2 ± 0.3 1.7 ± 0.4 2.7 ± 0.3 2.8 ± 0.7 32 3.3 ± 0.4 0.2 ± 0.4 1.9 ± 0.4 1.4 ± 0.9 39 3.0 ± 0.4 1.6 ± 0.4 2.2 ± 0.8 <1.2 ± 1.6 53 3.0 ± 0.2 <-0.1 ± 0.0 1.9 ± 0.7 2.5 ± 0.8 67 2.5 ± 0.4 <0.4 ± 0.5 1.8 ± 0.1 2.2 ± 1.3 81 3.0 ± 0.3 <-0.1 1.6 ± 0.9 1.4 ± 0.5 95 2.6 ± 0.2 <-0.1 <1.0 ± 0.9 <-0.1 ± 0.0
109 2.0 ± 0.7 <-0.1 <1.3 ± 1.3 <0.7 ± 0.9 130 1.4 ± 0.9 <-0.1 <0.5 ± 1.0 <0.0 ± 0.2
Table A.48: Total aerobic plate count (n = 6) on soiled food packaging materials when inoculated at a level of approximately 4 log CFU/cm2 and stored at 25º C (TSA) �– Combined Means (Figure 2.6)
Materials Day of Storage Butcher Paper Cardboard Overwrap Vacuum Pouch
0 4.3 ± 0.3 4.2 ± 0.2 4.2 ± 0.1 4.2 ± 0.2 4 4.4 ± 0.5 3.6 ± 0.6 4.6 ± 0.0 4.2 ± 0.5
11 5.2 ± 0.2 3.7 ± 0.3 3.8 ± 0.4 4.6 ± 0.6 18 4.8 ± 0.2 3.5 ± 0.2 3.7 ± 0.4 3.9 ± 0.8 25 4.9 ± 0.2 3.4 ± 0.5 3.3 ± 0.6 4.2 ± 0.6 32 5.1 ± 0.3 3.0 ± 0.4 3.0 ± 0.8 3.0 ± 0.7 39 4.5 ± 0.3 3.0 ± 0.7 2.8 ± 0.7 <2.5 ± 1.9 53 4.4 ± 0.1 2.7 ± 0.6 2.2 ± 0.6 3.6 ± 0.6 67 4.2 ± 0.2 2.5 ± 0.4 1.7 ± 0.3 3.3 ± 0.9 81 4.3 ± 0.3 2.3 ± 0.4 1.6 ± 0.9 2.7 ± 0.8 95 4.0 ± 0.3 2.3 ± 0.5 1.6 ± 0.7 2.7 ± 1.0
109 3.9 ± 0.4 1.7 ± 0.5 0.8 ± 0.9 2.3 ± 1.1 130 3.6 ± 0.7 1.7 ± 0.2 <0.4 ± 0.5 <1.4 ± 1.4

171
Table A.49: Total aerobic plate count (n = 3) on soiled food packaging materials when inoculated at a level of approximately 4 log CFU/cm2 and stored at 25º C (TSA) �– First Replicate
Materials Day of Storage Butcher Paper Cardboard Overwrap Vacuum Bag
0 4.3 ± 0.1 4.3 ± 0.1 4.3 ± 0.1 4.2 ± 0.1 4 4.1 ± 0.4 4.2 ± 0.0 4.7 ± 0.1 4.5 ± 0.1
11 5.2 ± 0.1 4.0 ± 0.1 3.9 ± 0.5 5.0 ± 0.6 18 4.8 ± 0.2 3.5 ± 0.3 3.8 ± 0.3 4.2 ± 0.9 25 5.0 ± 0.2 3.7 ± 0.3 3.7 ± 0.2 4.6 ± 0.1 32 5.3 ± 0.1 3.3 ± 0.1 3.7 ± 0.4 3.6 ± 0.2 39 4.5 ± 0.5 3.6 ± 0.1 3.2 ± 0.1 3.8 ± 0.8 53 4.4 ± 0.2 3.3 ± 0.1 2.5 ± 0.3 4.1 ± 0.0 67 4.2 ± 0.2 2.8 ± 0.3 1.9 ± 0.3 3.8 ± 0.6 81 4.5 ± 0.1 2.3 ± 0.5 1.5 ± 1.2 2.6 ± 1.1 95 4.2 ± 0.3 2.1 ± 0.2 1.7 ± 0.5 3.4 ± 0.7
109 4.2 ± 0.1 1.9 ± 0.4 1.6 ± 0.1 3.0 ± 0.7 130 4.2 ± 0.2 1.8 ± 0.3 0.8 ± 0.1 2.4 ± 0.1
Table A.50: Total aerobic plate count (n = 3) on soiled food packaging materials when inoculated at a level of approximately 4 log CFU/cm2 and stored at 25º C (TSA) �– Second Replicate
Materials Day of Storage Butcher Paper Cardboard Overwrap Vacuum Bag
0 4.3 ± 0.4 4.2 ± 0.3 4.1 ± 0.0 4.2 ± 0.1 4 4.9 ± 0.1 3.2 ± 0.4 4.6 ± 0.0 3.9 ± 0.5
11 5.2 ± 0.3 3.4 ± 0.2 3.6 ± 0.3 4.2 ± 0.1 18 5.0 ± 0.2 3.1 ± 0.5 3.5 ± 0.4 3.3 ± 0.2 25 4.8 ± 0.1 2.7 ± 0.3 2.9 ± 0.4 3.9 ± 0.6 32 4.7 ± 0.1 2.5 ± 0.5 2.3 ± 0.2 2.5 ± 0.5 39 4.4 ± 0.2 2.2 ± 0.4 2.3 ± 0.7 <1.2 ± 1.9 53 4.4 ± 0.1 2.2 ± 0.4 1.8 ± 0.6 3.2 ± 0.5 67 4.1 ± 0.2 2.3 ± 0.3 1.6 ± 0.3 2.6 ± 0.8 81 4.2 ± 0.3 2.3 ± 0.3 1.6 ± 0.7 2.8 ± 0.5 95 3.8 ± 0.3 3.6 ± 0.7 1.4 ± 0.9 1.8 ± 0.0
109 3.5 ± 0.2 1.4 ± 0.5 0.0 ± 0.2 1.6 ± 1.1 130 3.1 ± 0.7 1.7 ± 0.1 <0.0 ± 0.2 <-0.1 ± 0.0

172
Table A.51: Escherichia coli O157:H7 (n = 6) survival on soiled food packaging materials when inoculated at a level of approximately 4 log CFU/cm2 and stored at 4º C (TSA + Rifampicin) �– Combined Means (Figure 2.7)
Materials Day of Storage Butcher Paper Cardboard Overwrap Vacuum Pouch
0 4.0 ± 0.1 4.0 ± 0.2 4.0 ± 0.2 4.0 ± 0.1 4 1.9 ± 0.4 2.0 ± 0.3 1.7 ± 0.7 2.5 ± 1.2
11 <0.8 ± 0.6 1.7 ± 0.1 1.0 ± 1.1 1.1 ± 0.7 18 0.4 ± 0.4 1.5 ± 0.1 <0.8 ± 0.8 1.2 ± 0.7 25 <0.2 ± 0.2 1.4 ± 0.3 1.2 ± 0.6 1.1 ± 0.5 32 <0.6 ± 1.0 1.1 ± 0.4 0.9 ± 0.7 0.9 ± 0.2 39 0.7 ± 0.6 1.0 ± 0.3 1.0 ± 0.5 <0.6 ± 0.6 53 <0.5 ± 0.6 <0.3 ± 0.4 0.6 ± 0.5 0.5 ± 0.6 67 <-0.1 0.4 ± 0.3 0.5 ± 0.3 <-0.1 ± 0.0 81 <-0.1 <0.4 ± 0.6 <0.3 ± 0.3 <0.4 ± 0.5 95 <0.0 ± 0.3 <0.2 ± 0.3 <0.3 ± 0.4 <0.0 ± 0.3
109 <0.2 ± 0.6 <0.3 ± 0.4 <0.3 ± 0.3 <0.1 ± 0.3 130 <0.2 ± 0.7 <0.1 ± 0.4 <0.3 ± 0.4 <0.0 ± 0.2
Table A.52: Escherichia coli O157:H7 (n = 3) survival on soiled food packaging materials when inoculated at a level of approximately 4 log CFU/cm2 and stored at 4º C (TSA + Rifampicin) �– First Replicate
Materials Day of Storage Butcher Paper Cardboard Overwrap Vacuum Bag
0 4.1 ± 0.1 4.1 ± 0.1 4.1 ± 0.1 4.1 ± 0.0 4 1.5 ± 0.3 2.1 ± 0.1 1.5 ± 0.9 2.1 ± 1.6
11 <0.6 ± 0.9 1.7 ± 0.0 0.0 ± 0.2 0.5 ± 0.0 18 0.2 ± 0.2 1.6 ± 0.0 <0.2 ± 0.2 0.6 ± 0.3 25 0.3 ± 0.1 1.5 ± 0.3 0.6 ± 0.1 1.1 ± 0.3 32 <-0.1 ± 0.0 1.1 ± 0.2 0.9 ± 0.2 0.8 ± 0.1 39 0.6 ± 0.3 1.1 ± 0.3 0.7 ± 0.5 <0.2 ± 0.5 53 <0.0 ± 0.3 0.7 ± 0.3 0.8 ± 0.6 0.4 ± 0.5 67 <-0.1 0.3 ± 0.4 0.3 ± 0.1 <-0.1 ± 0.0 81 <-0.1 <0.1 ± 0.4 <0.1 ± 0.1 <0.1 ± 0.2 95 <-0.1 <-0.1 ± 0.0 <-0.1 ± 0.0 <-0.1
109 <-0.1 <-0.1 <0.3 ± 0.3 <0.3 ± 0.4 130 <0.4 ± 0.9 <-0.1 0.3 ± 0.4 0.1 ± 0.2

173
Table A.53: Escherichia coli O157:H7 (n = 3) survival on soiled food packaging materials when inoculated at a level of approximately 4 log CFU/cm2 and stored at 4º C (TSA + Rifampicin) �– Second Replicate
Materials Day of Storage Butcher Paper Cardboard Overwrap Vacuum Bag
0 3.9 ± 0.1 3.8 ± 0.1 3.9 ± 0.1 3.9 ± 0.1 4 2.2 ± 0.2 1.9 ± 0.4 1.8 ± 0.5 2.9 ± 0.8
11 1.0 ± 0.3 1.7 ± 0.2 1.9 ± 0.2 1.7 ± 0.3 18 0.6 ± 0.4 1.5 ± 0.1 1.5 ± 0.5 1.7 ± 0.5 25 <0.1 ± 0.3 1.3 ± 0.2 1.7 ± 0.1 1.1 ± 0.7 32 1.4 ± 1.0 1.1 ± 0.5 0.9 ± 1.0 1.1 ± 0.2 39 0.8 ± 0.9 0.8 ± 0.2 1.4 ± 0.1 1.1 ± 0.1 53 1.0 ± 0.5 <0.0 ± 0.2 0.3 ± 0.4 <0.6 ± 0.9 67 <-0.1 0.6 ± 0.2 0.6 ± 0.4 <-0.1 ± 0.1 81 <-0.1 0.6 ± 0.8 0.5 ± 0.2 0.8 ± 0.4 95 <0.2 ± 0.5 0.5 ± 0.1 0.6 ± 0.2 <0.1 ± 0.4
109 <0.4 ± 0.9 0.6 ± 0.4 <0.3 ± 0.4 <0.0 ± 0.2 130 <-0.1 ± 0.0 <0.3 ± 0.6 <0.2 ± 0.6 <-0.1 ± 0.0
Table A.54: Total aerobic plate count (n = 6) on soiled food packaging materials when inoculated at a level of approximately 4 log CFU/cm2 and stored at 4º C (TSA) �– Combined Means (Figure 2.8)
Materials Day of Storage Butcher Paper Cardboard Overwrap Vacuum Pouch
0 4.3 ± 0.3 4.2 ± 0.2 4.2 ± 0.1 4.2 ± 0.2 4 4.6 ± 0.4 3.3 ± 0.3 3.4 ± 0.6 4.1 ± 0.1
11 5.0 ± 0.3 3.2 ± 0.3 3.1 ± 1.3 4.3 ± 0.4 18 5.0 ± 0.7 3.4 ± 0.1 1.7 ± 0.5 4.0 ± 0.8 25 5.1 ± 0.7 3.3 ± 0.2 2.8 ± 1.5 4.5 ± 0.2 32 4.3 ± 0.3 3.0 ± 0.3 2.6 ± 0.6 4.1 ± 1.2 39 4.4 ± 0.7 3.0 ± 0.3 3.3 ± 0.7 4.2 ± 0.3 53 4.3 ± 0.7 2.9 ± 0.2 2.7 ± 0.4 4.3 ± 0.4 67 4.7 ± 0.5 2.8 ± 0.2 2.7 ± 0.3 4.1 ± 0.6 81 4.0 ± 0.5 2.5 ± 0.2 2.6 ± 0.4 4.4 ± 0.3 95 4.2 ± 0.9 2.5 ± 0.2 2.4 ± 0.3 2.6 ± 0.6
109 4.0 ± 0.6 2.3 ± 0.2 2.2 ± 0.6 2.9 ± 1.5 130 3.7 ± 0.3 2.2 ± 0.5 2.2 ± 0.4 3.2 ± 0.5

174
Table A.55: Total aerobic plate count (n = 3) on soiled food packaging materials when inoculated at a level of approximately 4 log CFU/cm2 and stored at 4º C (TSA) �– First Replicate
Materials Day of Storage Butcher Paper Cardboard Overwrap Vacuum Bag
0 4.3 ± 0.1 4.3 ± 0.1 4.3 ± 0.1 4.2 ± 0.1 4 4.3 ± 0.3 3.1 ± 0.2 3.3 ± 0.7 4.1 ± 0.0
11 5.1 ± 0.3 3.3 ± 0.4 4.0 ± 0.6 4.6 ± 0.0 18 4.5 ± 0.6 3.4 ± 0.1 1.2 ± 0.1 3.6 ± 1.2 25 4.5 ± 0.6 3.3 ± 0.2 1.5 ± 0.6 4.6 ± 0.2 32 4.1 ± 0.3 3.0 ± 0.2 2.6 ± 0.2 3.8 ± 1.6 39 3.9 ± 0.1 2.8 ± 0.1 2.8 ± 0.5 4.0 ± 0.1 53 3.7 ± 0.2 2.8 ± 0.3 2.5 ± 0.1 4.6 ± 0.5 67 4.3 ± 0.1 2.7 ± 0.2 2.6 ± 0.3 4.4 ± 0.8 81 3.6 ± 0.2 2.6 ± 0.2 2.3 ± 0.1 4.6 ± 0.1 95 3.4 ± 0.4 2.5 ± 0.1 2.1 ± 0.0 3.5 ± 0.7
109 3.7 ± 0.3 2.1 ± 0.1 2.0 ± 0.2 3.5 ± 1.5 130 3.5 ± 0.4 2.3 ± 0.3 2.1 ± 0.4 3.6 ± 0.0
Table A.56: Total aerobic plate count (n = 3) on soiled food packaging materials when inoculated at a level of approximately 4 log CFU/cm2 and stored at 4º C (TSA) �– Second Replicate
Materials Day of Storage Butcher Paper Cardboard Overwrap Vacuum Bag
0 4.3 ± 0.4 4.2 ± 0.3 4.1 ± 0.0 4.2 ± 0.1 4 4.9 ± 0.2 3.5 ± 0.4 3.5 ± 0.7 4.0 ± 0.1
11 5.1 ± 0.3 3.3 ± 0.4 4.0 ± 0.6 4.6 ± 0.0 18 5.5 ± 0.1 3.3 ± 0.2 2.0 ± 0.4 4.3 ± 0.3 25 5.7 ± 0.2 3.4 ± 0.2 4.1 ± 0.4 4.4 ± 0.1 32 4.5 ± 0.2 3.0 ± 0.3 2.6 ± 0.9 4.5 ± 0.1 39 5.0 ± 0.3 3.2 ± 0.2 3.9 ± 0.3 4.4 ± 0.3 53 4.9 ± 0.2 3.0 ± 0.2 3.0 ± 0.4 4.0 ± 0.1 67 5.1 ± 0.4 2.9 ± 0.1 2.8 ± 0.3 3.9 ± 0.1 81 4.5 ± 0.2 2.5 ± 0.2 2.8 ± 0.4 4.1 ± 0.3 95 5.0 ± 0.4 2.5 ± 0.4 2.6 ± 0.0 3.8 ± 0.6
109 4.4 ± 0.7 2.5 ± 0.2 2.4 ± 0.8 2.3 ± 1.5 130 2.8 ± 0.3 2.1 ± 0.7 2.3 ± 0.4 2.8 ± 0.2

175
Table A.57: Mean (± standard deviation; log CFU/cm2) populations of rifampicin-resistant Escherichia coli O157:H7 (recovered on tryptic soy agar supplemented with 100 µg/mL rifampicin; TSArif, or modified sorbitol MacConkey agar; mSMAC) Salmonella serotypes (recovered on xylose lysine deoxycholate agar; XLD) and total bacteria (recovered on tryptic soy agar; TSA) for beef trimmings before and after treatment with Acidified Sodium Chlorite (1000ppm) for 30 s.
Serotype
TSA + Rifampicin (100 µg/mL) (E. coli O157:H7) or XLD agar
(Salmonella sp.)
Modified SMAC agar (E. coli O157:H7) or XLD agar (Salmonella sp.)
TSA (Total Bacterial Population)
Untreated Control
Acidified Sodium Chlorite
(1000ppm)
Untreated Control Acidified Sodium
Chlorite (1000ppm)
Untreated Control Acidified Sodium
Chlorite (1000ppm)
E. coli O157:H7 3.1 ± 0.0 A 2.6 ± 0.1 B 2.7 ± 0.1 A 2.2 ± 0.2 B 4.2 ± 0.4 A 4.2 ± 0.5 A
S. Newport Susc. 3.0 ± 0.1 *A 2.6 ± 0.1 *B 3.0 ± 0.1 A 2.6 ± 0.1 B 4.2 ± 0.5 *A 4.0 ± 0.4 *A
S. Newport MDR-AmpC 3.1 ± 0.2 *A 2.5 ± 0.1 *B 3.1 ± 0.2 A 2.5 ± 0.1 B 4.1 ± 0.4 *A 3.9 ± 0.4 *A
S. Typhimurium
Susc. 3.1 ± 0.1 *A 2.6 ± 0.3 *B
3.1 ± 0.1 A 2.6 ± 0.3 B
4.2 ± 0.4 *A 4.0 ± 0.5 *A
S. Typhimurium
MDR 3.1 ± 0.1 *A 2.7 ± 0.1 *B
3.1 ± 0.1 A 2.7 ± 0.1 B
4.2 ± 0.6 *A 3.8 ± 0.4 B
S. Typhimurium MDR-AmpC
2.9 ± 0.0 A 2.3 ± 0.0 B
2.9 ± 0.0 *A 2.3 ± 0.0 *B
4.1 ± 0.6 *A 3.9 ± 0.4 *A
Values (mean ± SD) within each row followed by different uppercase letters are significantly (P 0.05) different. Values (mean ± SD) within each column followed by * are not significantly (P 0.05) different with Escherichia coli O157:H7

176
Table A.58: Mean (± standard deviation; log CFU/cm2) populations of rifampicin-resistant Escherichia coli O157:H7 (recovered on tryptic soy agar supplemented with 100 µg/mL rifampicin; TSArif, or modified sorbitol MacConkey agar; mSMAC) Salmonella serotypes (recovered on xylose lysine deoxycholate agar; XLD) and total bacteria (recovered on tryptic soy agar; TSA) for beef trimmings before and after treatment with Peroxyacetic Acid (200ppm) for 30 s.
Serotype
TSA + Rifampicin (100 µg/mL) (E. coli O157:H7) or XLD agar
(Salmonella sp.) Modified SMAC agar (E. coli O157:H7)
or XLD agar (Salmonella sp.) TSA (Total Bacterial Population)
Untreated Control
Peroxyacetic Acid
(200ppm) Untreated Control Peroxyacetic Acid
(200ppm) Untreated Control Peroxyacetic Acid (200ppm)
E. coli O157:H7 3.1 ± 0.0 A 2.4 ± 0.1 B 2.8 ± 0.1 A 2.3 ± 0.2 B 3.4 ± 0.1 A 2.8 ± 0.2 B S. Newport
Susc. 3.2 ± 0.1 *A 2.5 ± 0.2 *B 3.2 ± 0.1 A 2.5 ± 0.2 B 3.4 ± 0.1 *A 3.2 ± 0.5 B
S. Newport MDR-AmpC 3.0 ± 0.1 *A 2.4 ± 0.1 *B 3.0 ± 0.1 A 2.4 ± 0.1 *B 3.3 ± 0.2 *A 2.9 ± 0.3 *B
S. Typhimurium Susc. 3.1± 0.1 *A 2.6 ± 0.2 *B 3.1± 0.1 A 2.6 ± 0.2 B 3.4 ± 0.1 *A 3.0 ± 0.2 *B
S. Typhimurium MDR 3.3 ± 0.1 A 2.6 ± 0.3 B 3.3 ± 0.1 A 2.6 ± 0.3 B 3.6 ± 0.1 *A 3.0 ± 0.4 *B
S. Typhimurium MDR-AmpC 3.1 ± 0.1 *A 2.5 ± 0.2 *B 3.1 ± 0.1 A 2.5 ± 0.2 B 3.3 ± 0.1 *A 2.9 ± 0.1 *B
Values (mean ± SD) within each row followed by different uppercase letters are significantly (P 0.05) different. Values (mean ± SD) within each column followed by * are not significantly (P 0.05) different with Escherichia coli O157:H7

177
Table A.59: Mean (± standard deviation; log CFU/cm2) populations of rifampicin-resistant Escherichia coli O157:H7 (recovered on tryptic soy agar supplemented with 100 µg/mL rifampicin; TSArif, or modified sorbitol MacConkey agar; mSMAC) Salmonella serotypes (recovered on xylose lysine deoxycholate agar; XLD) and total bacteria (recovered on tryptic soy agar; TSA) for beef trimmings before and after treatment with Sodium Metasilicate (40000ppm) for 30 s.
Serotype
TSA + Rifampicin (100 µg/mL) (E. coli O157:H7) or XLD agar
(Salmonella sp.)
Modified SMAC agar (E. coli O157:H7)
or XLD agar (Salmonella sp.)
TSA (Total Bacterial Population)
Untreated Control
Sodium Metasilicate (40000ppm)
Untreated Control
Sodium Metasilicate (40000ppm)
Untreated Control
Sodium Metasilicate (40000ppm)
E. coli O157:H7 3.1 ± 0.0 A 1.8 ± 0.2 B
2.8 ± 0.1 A 1.4 ± 0.6 B
3.4 ± 0.1 A 2.2 ± 0.2 B
S. Newport Susc. 3.2 ± 0.1 *A 1.8 ± 0.3 *B
3.2 ± 0.1 *A 1.8 ± 0.3 *B
3.4 ± 0.1 *A 2.3 ± 0.2 *B
S. Newport MDR-AmpC 3.0 ± 0.1 *A 1.6 ± 0.3 *B
3.0 ± 0.1 *A 1.6 ± 0.3 *B
3.3 ± 0.2 *A 2.3 ± 0.5 *B
S. Typhimurium
Susc. 3.1± 0.1 *A 1.6 ± 0.3 *B
3.1± 0.1 *A 1.6 ± 0.3 *B
3.4 ± 0.1 *A 2.1 ± 0.5 *B
S. Typhimurium
MDR 3.3 ± 0.1 *A 2.0 ± 0.2 *B
3.3 ± 0.1 A 2.0 ± 0.2 B
3.6 ± 0.1 *A 2.6 ± 0.4 B
S. Typhimurium MDR-AmpC
3.1 ± 0.1 *A 1.6 ± 0.5 *B
3.1 ± 0.1 *A 1.6 ± 0.5 *B
3.3 ± 0.1 *A 2.2 ± 0.2 *B
Values (mean ± SD) within each row followed by different uppercase letters are significantly (P 0.05) different.Values (mean ± SD) within each column followed by * are not significantly (P 0.05) different with Escherichia coli O157:H7

178
Table A.60: pH values of beef trimmings treated with Acidified Sodium Chlorite (1000ppm) for 30s
Treatment 0 h pH 24 h pH Untreated Control 5.79 ± 0.11 aB 6.23 ± 0.11 aA
Treatment with Acidified Sodium Chlorite
(1000ppm) 5.75 ± 0.16 aA 5.63 ± 0.14 bA
Within a column, values lacking a common lowercase letter are significantly different (p < 0.05). Within a row, values lacking a common uppercase letter are significantly different (P 0.05).
Table A.61: pH values of beef trimmings treated with Peroxyacetic Acid (1000ppm) for 30s
Treatment 0 h pH 24 h pH Untreated Control 6.04 ± 0.13 aA 5.44 ± 0.11 aB
Treatment with Peroxyacetic Acid
(200ppm) 5.98 ± 0.14 aA 5.42 ± 0.08 aB
Within a column, values lacking a common lowercase letter are significantly different (p < 0.05). Within a row, values lacking a common uppercase letter are significantly different (P 0.05).
Table A.62: pH values of beef trimmings treated with Sodium Metasilicate (40000ppm) for 30s
Within a column, values lacking a common lowercase letter are significantly different (p < 0.05). Within a row, values lacking a common uppercase letter are significantly different (P 0.05)
Treatment 0 h pH 24 h pH Untreated Control 6.04 ± 0.13 bA 5.44 ± 0.11 bB
Treatment with Sodium Metasilicate
(40000ppm) 8.66 ± 0.55 aA 6.52 ± 0.16 aB