the wisdom of crowd-funders - brookings … wisdom of crowd-funders what motivates cross-border...
TRANSCRIPT
THE WISDOM OF CROWD-FUNDERSWHAT MOTIVATES CROSS-BORDER PRIVATE DEVELOPMENT AID?
Raj M. Desai Homi Kharas
GLOBAL ECONOMY & DEVELOPMENT
WORKING PAPER 64 | DECEMBER 2013
Global Economyand Developmentat BROOKINGS

Global Economyand Developmentat BROOKINGS

Raj M. Desai is an associate professor of interna-
tional development at the Edmund A. Walsh School of
Foreign Service and the Department of Government
at Georgetown University. He is also a nonresident se-
nior fellow with the Global Economy and Development
program at the Brookings Institution.
Homi Kharas is a senior fellow and the deputy direc-
tor of the Global Economy and Development program
at the Brookings Institution.
Abstract:
The rapid growth in crowd-funded private development aid allows an examination of the preferences of philan-
thropic individuals with respect to international causes. Using survival analysis, we analyze the rate at which loan
requests are funded through an internet-based nonprofit organization that bundles contributions from individu-
als and transfers them as loans to borrowers in developing countries. We find little evidence for the view that
crowd-funders behave as either official aid donors or as selfish aid-givers. Rather, our results show that private
aid contributions are motivated by associational communities that link citizens in donor countries to those in re-
cipient countries — in particular, through migrant and diaspora networks — and that, as a result, their giving may
be considered a complement to official aid.

CONTENTS
Introduction . . . . . . . . . . . . . . . . . . . . . . . . . . . . . . . . . . . . . . . . . . . . . . . . . . . . . . . . . . . . . . . . . . . . . . . . . . .1
Crowd-Funded Philantrophy and Development Aid . . . . . . . . . . . . . . . . . . . . . . . . . . . . . . . . . . . . . . . . . 3
Citizen Preferences and Foreign Assistance . . . . . . . . . . . . . . . . . . . . . . . . . . . . . . . . . . . . . . . . . . . 3
What Motivates Crowd-Funders? . . . . . . . . . . . . . . . . . . . . . . . . . . . . . . . . . . . . . . . . . . . . . . . . . . . . . 4
Data . . . . . . . . . . . . . . . . . . . . . . . . . . . . . . . . . . . . . . . . . . . . . . . . . . . . . . . . . . . . . . . . . . . . . . . . . . . . . . . . . 7
Kiva . . . . . . . . . . . . . . . . . . . . . . . . . . . . . . . . . . . . . . . . . . . . . . . . . . . . . . . . . . . . . . . . . . . . . . . . . . . . . . 7
Project Data . . . . . . . . . . . . . . . . . . . . . . . . . . . . . . . . . . . . . . . . . . . . . . . . . . . . . . . . . . . . . . . . . . . . . . . 7
Cross-National Allocation . . . . . . . . . . . . . . . . . . . . . . . . . . . . . . . . . . . . . . . . . . . . . . . . . . . . . . . . . . . 8
Funding Rates . . . . . . . . . . . . . . . . . . . . . . . . . . . . . . . . . . . . . . . . . . . . . . . . . . . . . . . . . . . . . . . . . . . . 10
Methods and Results . . . . . . . . . . . . . . . . . . . . . . . . . . . . . . . . . . . . . . . . . . . . . . . . . . . . . . . . . . . . . . . . . . 13
Survival Regressions . . . . . . . . . . . . . . . . . . . . . . . . . . . . . . . . . . . . . . . . . . . . . . . . . . . . . . . . . . . . . . 13
Robustness . . . . . . . . . . . . . . . . . . . . . . . . . . . . . . . . . . . . . . . . . . . . . . . . . . . . . . . . . . . . . . . . . . . . . . 20
Conclusions . . . . . . . . . . . . . . . . . . . . . . . . . . . . . . . . . . . . . . . . . . . . . . . . . . . . . . . . . . . . . . . . . . . . . . . . . . 26
Appendix . . . . . . . . . . . . . . . . . . . . . . . . . . . . . . . . . . . . . . . . . . . . . . . . . . . . . . . . . . . . . . . . . . . . . . . . . . . . 28
References . . . . . . . . . . . . . . . . . . . . . . . . . . . . . . . . . . . . . . . . . . . . . . . . . . . . . . . . . . . . . . . . . . . . . . . . . . 30
Endnotes . . . . . . . . . . . . . . . . . . . . . . . . . . . . . . . . . . . . . . . . . . . . . . . . . . . . . . . . . . . . . . . . . . . . . . . . . . . . 34

LIST OF TABLES
Table 1: Selectivity by Aid Type, Panel Regressions . . . . . . . . . . . . . . . . . . . . . . . . . . . . . . . . . . . . . . . . 10
Table 2: Summary Statistics . . . . . . . . . . . . . . . . . . . . . . . . . . . . . . . . . . . . . . . . . . . . . . . . . . . . . . . . . . . . 11
Table 3: Kiva Funding Rates, Flexible Parametric Regressions . . . . . . . . . . . . . . . . . . . . . . . . . . . . . . 15
Table 4: Kiva Funding Rates, Before and After Natural Disasters . . . . . . . . . . . . . . . . . . . . . . . . . . . . 21
Table 5: Robustness Checks, Subsamples . . . . . . . . . . . . . . . . . . . . . . . . . . . . . . . . . . . . . . . . . . . . . . . . 24
Table A1: Kiva Loan Funding Rates, Cox Hazard Estimates . . . . . . . . . . . . . . . . . . . . . . . . . . . . . . . . . 29
LIST OF FIGURES
Figure 1: Monthly Disbursements by Kiva Lenders, April 2006 to December 2010 . . . . . . . . . . . . . . 9
Figure 2: Daily Funding Rate for Kiva Projects . . . . . . . . . . . . . . . . . . . . . . . . . . . . . . . . . . . . . . . . . . . . . 9
Figure 3: Baseline Hazard Function, Kiva Projects . . . . . . . . . . . . . . . . . . . . . . . . . . . . . . . . . . . . . . . . 13
Figure 4: Baseline Hazard Functions by US Share, Timing and Funding Concentration . . . . . . . . . 23

THE WISDOM OF CROWD-FUNDERS: WHAT MOTIVATES CROSS-BORDER PRIVATE DEVELOPMENT AID? 1
THE WISDOM OF CROWD-FUNDERSWHAT MOTIVATES CROSS-BORDER PRIVATE DEVELOPMENT AID?
Raj M. Desai Homi Kharas
INTRODUCTION
In 2010, foundations, nongovernmental organiza-
tions (NGOs), religious groups and other charitable
organizations in the United States contributed $39
billion to international development causes (Hudson
Institute 2012). By comparison, $30 billion in US offi-
cial development assistance (ODA) was disbursed dur-
ing the same year. For US-based organizations, this
represented a doubling of international private, vol-
untary development assistance over the past decade.
In recent years, the proliferation of private develop-
ment aid has been facilitated by peer-to-peer (or
“crowd-funding”) practices. As with the broader
“crowd-sourcing” phenomenon which solicits infor-
mation from large numbers of individuals for various
entrepreneurial activities, crowd-funding platforms
bundle large numbers of small, individual contribu-
tions for investment, grants or loans. The bundling of
funds is generally done through internet-based social
networks. From the United States, internet-based
companies such as Global Giving, Kiva, Wokai and
Zidisha have channeled millions of dollars to individu-
als and partner organizations in developing countries.
Despite the tremendous growth in private develop-
ment assistance of all kinds — from mega-charities to
“micro-philanthropy” — very little is known about the
allocation and selectivity of private aid. Compared
to official aid, private aid — whoever provides it — is
obviously more sensitive to the preferences of philan-
thropic-minded individuals who determine allocations
across countries and, within countries, across sectors,
projects and individuals. More importantly, crowd-
funding philanthropy affords an opportunity to test a
central premise behind arguments for expanded pri-
vate aid — namely, that private aid avoids the political
and strategic considerations that influence bilateral
ODA allocation, and better matches recipient need
with individual donor preferences.
Information on the allocation of crowd-funded private
aid, and on the choices made by private citizens who
contribute to international causes, can potentially re-
veal the implicit preferences of philanthropic citizens
in a way that cannot be captured by looking at official
aid allocations. There are several possibilities: that
crowd-funders behave in accordance with rational-
choice theories of charity, allocating money based on

2 GLOBAL ECONOMY AND DEVELOPMENT PROGRAM
individual-specific preferences; that crowd-funders
behave like official donors, responding to a combina-
tion of recipient-country need, expected performance
and commercial and/or strategic value; or that crowd-
funders make allocative decisions on the basis of
group behavior and norms.
This article presents new data on crowd-funded de-
velopment assistance, which allows us to analyze
the motivations behind individual contributors. We
analyze data from Kiva, the largest provider of crowd-
funded microcredit to developing nations. We develop
a model to show how the allocation of aid through
crowd-funding websites reflects the preferences of
philanthropically-minded citizens regarding develop-
ment assistance, and then use data on Kiva’s transac-
tions to examine empirically the factors that affect
the supply of private development aid, as well as to
determine the extent to which private preferences
differ from official aid agency allocative mechanisms.
We argue that the rate at which individual microloan
requests are funded by Kiva’s community of lenders,
once they are posted on the Kiva website, can be in-
terpreted as a proxy for crowd-funder preferences
regarding private development assistance. We can
therefore use survival analysis of the time to fund
each project to estimate the significance of a number
of covariates.
We find that Kiva’s crowd-funders are generally not
influenced by the usual set of official aid determinants
(including foreign-policy considerations, recipient-
country poverty and recipient-country institutional
quality). Additionally, Kiva crowd-funders do not ap-
pear to base lending decisions on the usual indica-
tors of credit risk. We find, instead, that the type of
diaspora and migrant networks of aid recipients in
the crowd-funder’s country is a stronger determinant
of hazard rates, and that the nature of associational
networks and social linkages between prospective pri-
vate donors and aid recipients will more likely affect
crowd-funded aid allocation than recipient-country or
project risk.

THE WISDOM OF CROWD-FUNDERS: WHAT MOTIVATES CROSS-BORDER PRIVATE DEVELOPMENT AID? 3
CROWD-FUNDED PHILANTROPHY AND DEVELOPMENT AID
Until recently, government aid or international
development charities offered the best interme-
diaries for private charity, but in both cases agency
costs have been high. Foreign aid delivered through
official channels passes through many steps. Citizens
pay their taxes to the government which, in turn, allo-
cates resources to other governments to fund myriad
public programs, including programs that benefit poor
individuals around the world. There is no face-to-face
contact between an individual taxpayer and the final
recipient.
Many international development charities operate
in a similar manner. Private donors direct resources
to an organization (with which the donor identifies,
agrees with or otherwise trusts); the organization, in
turn, allocates resources to various programs and op-
erational expenses. Some organizations allow varying
forms of “sponsorship.” This usually involves donors
receiving updates from individual recipients (e.g., up-
dates from sponsored children) or selecting a level of
donation that corresponds to different organizational
activities. However, even in this case, donors are not
typically able to earmark funds to specific recipients.
New forms of internet-based crowd-funding now offer
realistic alternatives. Agency costs of corruption and
leakage as funds move from donor countries to bene-
ficiaries in recipient countries can be sharply reduced
by direct donations via the internet. They also provide
a more direct route between giver and recipient that
can avoid the costs of having to act through interme-
diaries (usually governments or NGOs) that are part of
a global foreign aid apparatus that may simply be too
insulated or centralized to incorporate individual tax-
payer preferences (see, e.g., Easterly 2005; Roodman
2006). Internet-based giving offers many more op-
portunities for lower-cost intermediation and reflects
individual preferences more directly.1
Citizen Preferences and Foreign Assistance
There is a considerable body of research on the ef-
fects of public opinion on foreign policy. While early
analyses suggested that these effects were weak or
indeterminate, recent studies indicate that public
opinion often has a measurable impact on, for exam-
ple, international security (e.g., Hartley and Russett
1992; Hill 1998; Sobel 2001; Wlezien 1995), trade (Kono
2008; Mansfield and Mutz 2009) and immigration
policies (Fachini and Mayda 2008).
Several authors, similarly, find that foreign aid in-
creases with public support for international assis-
tance (Lumsdaine 1993; Tingley 2007; Chong and
Gradstein 2008). However, while there is evidence
that public opinion affects aid levels, we know little
of how citizen preferences shape aid allocation. Of
course, where individual preferences must be articu-
lated through interest groups, political parties or rep-
resentative institutions, ideology and group affiliation
will filter those preferences for aid allocation. Thus,
Tingley (2009), for example, finds that right-wing
and left-wing governments show no difference in aid
to middle-income countries, but right-wing govern-
ments give less aid to low-income nations. Similar
effects have been seen with respect to legislative vot-
ing on aid allocation (Fleck and Kilby 2001; Milner and
Tingley 2010).
Public opinion regarding aid allocation may also
shape the decisions of foundations, NGOs and other
private aid organizations. However, private humani-
tarian and development aid has been little studied
by social scientists, and the limited research that ex-

4 GLOBAL ECONOMY AND DEVELOPMENT PROGRAM
ists has focused exclusively on larger organizations.
Financial records of the most prominent US-based
international development NGOs, for example, show
that these NGOs allocate funds raised from private
sources based on strong “humanitarian” motives, and
principally to projects that provide or improve educa-
tion, health care, safe drinking water, sanitation, sew-
erage and emergency relief in poor countries (Büthe,
Major, and de Mello e Souza 2012). Information on the
allocative preferences of individuals, however, is non-
existent. Examining contributions by large numbers
of individuals to international charitable causes can
provide a more direct understanding of citizen prefer-
ences regarding aid allocation.
What Motivates Crowd-Funders?
In the United States, individual, small-scale contribu-
tions now account for 75 percent of all private dona-
tions to international charitable causes (Giving USA
2012). Questions have been raised regarding the gen-
eralizability of crowd-funding philanthropy to global
private giving in general and, in particular, whether
those who donate or lend via internet platforms are
similar to those who engage in more traditional phil-
anthropic activities (fund drives, volunteerism, etc.).
The evidence is mixed. Some analyses have found
gaps between individuals that contribute to top-tier
charitable fundraising organizations and individuals
who contribute to second-tier organizations, finding
that the latter are more inclined to use e-commerce
technologies for giving (Waters 2007). Others have
shown stronger similarities between “venture” philan-
thropists and traditional philanthropists (Ball 2012).
In subsequent sections we attempt to adjust our
findings to correct for non-representativeness of
crowd-funders in the population. Crowd-funder phi-
lanthropists are not likely to be randomly selected
from the population, but are people who care about a
particular issue — in this case, international develop-
ment. The same may be said of voters relative to the
general population, with the former being more moti-
vated or civic-minded. We are inclined to view crowd-
funding philanthropists as, if not representative of
the larger population of those who donate to charity,
at least representative of those who would normally
fund longer-term projects through the use of internet
platforms. The preferences of this latter sample are
obviously salient for understanding the motivations
behind internet philanthropy.
We can conceive of three (non-exclusive) hypotheses
about how crowd-funders will make allocative deci-
sions regarding their private contributions to interna-
tional charitable causes: as “warm-glow” givers of aid,
as official donors or as members of social networks.
Crowd-Funding as “Warm Glow” Charity
Research on charitable contributions has sought to
understand why, in contrast to predictions of standard
models of private provision of public goods, people are
typically more generous than expected. One answer
is that contributors are “impurely” altruistic — that
is, while interested in promoting charitable causes,
they also respond to rebates, tax breaks, donation-
matching and other selective incentives. Analyses of
individuals’ charitable behavior find that contribu-
tors are price sensitive and driven by marginal cost
calculations (Karlan and List 2007). Individuals may
also obtain private benefits from some aspect of their
own giving, which encourages donations beyond the
level that would occur based on public benefits alone.
Different interpretations of these private benefits
range from a feeling of “warm-glow” satisfaction to
social approval, prestige and signaling about income.
Donations are typically explained by a variety of pref-

THE WISDOM OF CROWD-FUNDERS: WHAT MOTIVATES CROSS-BORDER PRIVATE DEVELOPMENT AID? 5
erence structures, from psychic rewards to social
comparison (the need to demonstrate superior gen-
erosity relative to one’s peers) (Andreoni and Miller
2002; Shang and Croson 2006; Deb, Gazzale, and
Kotchen 2012).2
Crowd-Funding as an Extension of Official
Aid.
In standard allocation mechanisms for foreign aid,
recipient countries are funded based on a combina-
tion of need (poverty, humanitarian needs), perfor-
mance (control of corruption, institutional quality) and
strategic or commercial interest (as allies, as trading
partners or as investment opportunities) in order to
ensure that taxpayer funds are used in the donor’s
national interest. Empirical work on this subject has
found increasing selectivity of aid money away from
commercial and strategic interest and toward need
and institutional quality, since the end of the Cold War
(Dollar and Levin 2006; Boschini and Olofsgård 2007).
Whether crowd-funders are equally selective remains
an open question.
Private philanthropists, to be sure, cannot lend for
some purposes that official agencies can fund, such as
policy adjustment, public sector capacity building or
institutional reform. Yet there is reason to believe that
crowd-funders may mimic official aid agencies. Survey
data from donor countries consistently indicates that
between 75 percent and 96 percent of citizens sup-
port aid to developing nations to reduce poverty,
hunger and disease (Riddell 2007: 116), precisely the
areas of focus for official aid agencies like USAID. In
the United States, public opinion surveys have shown
consistent support for development assistance, even
though Americans typically overestimate the amount
of aid provided by their government by a factor of
twenty (PIPA 2001). Majorities support international
assistance to reduce poverty, even as much of the
public believes that corruption, fraud and waste make
foreign aid ineffective (InterMedia 2012; Coyne and
Ryan 2009; Easterly 2007).
Crowd-Funding as Socially Motivated
Finally, crowd-funding may be socially-driven, and
crowd-funding decisions may be based on the density
and nature of associational ties. Social networks and
the norms of trust and reciprocity that facilitate col-
lective action seem likely to play an important role
in eliciting philanthropic behavior from individuals.
Research on associational networks finds that social
capital positively impacts citizens’ sense of commu-
nity and makes citizens more concerned about others’
welfare (Brooks 2005; Brown and Ferris 2007). As a
result, in communities high in social capital, purely al-
truistic preferences will play a greater role in behavior.
Individuals with greater stocks of network-based so-
cial capital also tend to give more to charitable — both
religious and secular — causes, and volunteer more
(Vesterlund 2006). These results underscore the im-
portance of crowd-funders’ associations in connecting
them to others and to organizations that encourage
charitable acts.
What factors might affect the balance between mate-
rial and non-material concerns of crowd-funders? One
answer comes from analyses of voting behavior. For
example, it has been shown that, in large elections,
citizens tend to vote against their material self-inter-
est and in support of more morally or ethically appeal-
ing alternatives — “expressive” voting, as compared
to “instrumental” voting (Brennan and Hamlin 1998;
Feddersen, Gailmard, and Sandroni 2009). Expressive
voting is commonly found where pivot probabilities
— the likelihood that any individual voter’s choice will
be decisive — are small. Crowd-funding platforms, like

6 GLOBAL ECONOMY AND DEVELOPMENT PROGRAM
large elections, are characterized by large numbers of
both funders (“voters”) and recipients (“candidates”).
Furthermore, as with large elections, crowd-funders
do not face an effective choice between funding
alternative countries (since each funder’s contribu-
tion to the country’s total aid allocation is small), but
the crowd-funder does face an effective choice as to
which project and which country to “support.” Crowd-
funders thus see charitable projects as an event in
which they participate rather than a concrete out-
come they determine.

THE WISDOM OF CROWD-FUNDERS: WHAT MOTIVATES CROSS-BORDER PRIVATE DEVELOPMENT AID? 7
DATA
Kiva
Kiva is a nonprofit organization that operates an
internet-based, peer-to-peer, crowd-funding platform
connecting micro-lenders to micro-entrepreneurs in
developing countries. Founded in San Francisco in
2005, Kiva operates through its internet portals, by
which anyone with a credit card or PayPal account
can lend to micro-entrepreneurs who post requests
online. Prospective borrowers must post their proj-
ects through one of several affiliated microfinance
institutions (MFIs) around the world.3 Prospective
micro-lenders, once they have registered, can select
projects based on region, country and project objec-
tive. Once the preferred traits have been selected, a
micro-lender is shown a list of project requests match-
ing the preferred project criteria. Alternatively, micro-
lenders can select “most recent” projects that have
been newly listed, or they may have the Kiva website
randomly select a project.
Selecting any particular project reveals more infor-
mation: the amount of the loan (up to a maximum of
$5,000), the loan duration in months (up to a maxi-
mum of two years), the name and risk-rating of the
MFI, the number of borrowers (if the “borrower” is
a group), the gender of the borrowers and a short
narrative written by the micro-entrepreneur describ-
ing the specific purposes for which the funds will be
used. Finally, the project information also includes an
indication of how much of the total project amount
requested has been funded.
Once a project is selected, micro-lenders can con-
tribute funds in any amount (above a required mini-
mum of $25) up to the full amount requested. Using
a PayPal account or a direct payment from a credit
card, micro-lenders then transfer funds in the pledged
amount. Projects accumulate funds from lenders in
this manner until they are fully funded and, at that
point, the funds are transferred to the MFI through
which the micro-entrepreneur receives the credit.
When microloans reach maturity, their principal is to
be repaid to the original lender’s account; lenders re-
ceive no interest. Moreover, zero-interest loans allow
Kiva to operate as a nonprofit 501(c)3 organization
under US law, rather than as a regulated commercial
bank.
Micro-lenders are notified periodically of the prog-
ress of the micro-entrepreneurs’ effort. Kiva’s field
partners may post “business journals” identifying
how the loan is being used, or what effect it has had
on the business owner. This reporting is not required,
so the flow of information from recipients can be er-
ratic and is very rarely financially detailed (Bonbright,
Kiryttopoulou, and Iversen 2008). Nevertheless, Kiva
platforms provide enough information to make a per-
sonal connection between the donor and the recipi-
ent. A key problem for both Kiva and the sponsoring
MFI is to decide on exactly what information (and how
much information) to provide, in order to permit in-
formed choices without overwhelming an individual
lender.
Project Data
Our chief interest is in using information about Kiva
microloans to assess the motivations of crowd-
funders. An analysis of Kiva projects affords an oppor-
tunity to examine how the behavior of crowd-funders
compares to that of official donors. Kiva’s bundled mi-
croloans are allocated across 60 countries, enabling
a test of whether the Kiva community of lenders
mirrors the selectivity of official donors, which allo-
cate according to recipient-country characteristics.
8 GLOBAL ECONOMY AND DEVELOPMENT PROGRAM
Moreover, because Kiva’s development assistance
takes the form of a loan, the principal for which is to
be repaid, we can additionally test the extent to which
lenders behave materially (i.e., the extent to which
lenders provide loans based on assessments of proj-
ect and country risk).
Our Kiva data contain approximately 250,000 micro-
loan requests. Kiva limits both loan size and time on
the website for each posting. Until the end of 2007,
individual loan requests could not exceed $1,200; that
limit has since been raised to $2,000. The maximum
request for group loans remains $5,000.4 All requests
by micro-entrepreneurs must be made through part-
ner MFIs, and all requests made to Kiva enter a queue.
Upon undergoing a preliminary screening, they are
posted on the website for a maximum of 30 days,
after which they are pulled from the site if they have
not been fully funded. Kiva’s approach to website
management limits the number and variety of micro-
loan requests that appear on the site, but those that
do appear are almost always 100 percent funded. As
a result, Kiva faces no shortage of individuals willing
to lend relatively small amounts, but is often without
enough projects relative to the lending supply, and
has occasionally had to cap individual lenders’ contri-
butions because of the lack of fundable projects.
Figure 1 shows monthly gross disbursements for Kiva
between 2006 and 2010 from all lenders, as well as
from US lenders only. Kiva’s dramatic growth in gross
disbursements is also helped by the fact that, by the
end of 2008, many original loans were being repaid
and could be re-lent by crowd-funders. By the end of
2010, Kiva averaged between 4,000 and 5,000 new
project posts per month. These projects were fully
funded, on average, in 2.03 days. Figure 2 shows fund-
ing rates in the form of dollars per hour, based on
daily loan averages against time. The graph shows the
growth in the size of total daily loan requests, as well
as an initial jump in funding speed, followed by greater
variability as disbursements became larger.
Cross-National Allocation
One question is the extent to which Kiva disburse-
ments approximate other types of official aid dis-
bursements. As a preliminary test we replicate the
basic Dollar-Levin (2006) approach, which estimates
annual aid flows to recipient country:
ln(Aid) it=a 0+a 1ln(Population) it+a 2ln(GDP) it+a 3
(Institutions)it (1)
We use pooled OLS with an error correction for con-
temporaneous correlation across panels, or “panel-
correct” standard errors. We compare results across
three equations — (i) net official development assis-
tance (ODA); (ii) micro-lending by official develop-
ment agencies; and (iii) total Kiva disbursements — to
examine differences in allocations across recipient
countries for these different types of assistance.
Our “institutions” proxy is the World Bank’s Country
Policy and Institutional Assessment (CPIA) score for
“public sector management and institutions,” the ba-
sis for the “governance” score used in International
Development Association (IDA) allocation.5 We re-
strict the panel to years for which we have Kiva data:
namely, 2006-2010.
Columns (1) to (3) in table 1 show that official aid is
quite selective in terms of poverty and institutional
quality: More money goes to poorer countries and
countries with better institutional quality. Official mi-
croloans respond in the same way, but Kiva lenders
do not select countries based on per capita income
or institutional quality. In columns (4) to (6), we rerun
estimations on a core sample of common country-

THE WISDOM OF CROWD-FUNDERS: WHAT MOTIVATES CROSS-BORDER PRIVATE DEVELOPMENT AID? 9
Figure 1: Monthly Disbursements by Kiva Lenders, April 2006 to December 2010
Notes: Lines show total monthly disbursements by all lenders, as well as by US-based lenders only, for all Kiva projects (left axis). Histogram shows total monthly disbursements divided by number of new projects posted on Kiva’s website; labels are weighted annual average disbursements per funded project for years 2006 to 2010 (right axis).
703
634
723
703
764
450
500
550
600
650
700
750
800
850
900
0
1
2
3
4
5
6
7
2006 2007 2008 2009 2010
Mon
thly
disb
urse
men
ts p
er p
roje
ct, $
Tota
l mon
thly
disb
urse
men
ts, $
, mill
ions
All lenders
US lenders
Figure 2: Daily Funding Rate for Kiva Projects
Notes: Graph shows daily average speed of loan fulfillment (in dollars per hour, natural logs); circles are scaled by total daily loan disbursements in US dollars. Solid line is the loan fulfillment speed with a standard Hodrick-Prescott filter ap-plied (we use the common rule for determining the bandwidth parameter: namely, 100 times annual frequency-squared, or 1.33×10⁷ for 365-day/year time series).

10 GLOBAL ECONOMY AND DEVELOPMENT PROGRAM
years across all three aid types. Kiva only operates in
48 developing countries, while official aid agencies
operate in over 100 countries. This reduces coverage
to 135 observations across 48 recipient countries.
In the reduced samples, as previously, ODA flows to
poorer countries, and official microcredit to poorer
countries and those with better institutions. However,
as before, Kiva allocations remain unaffected by pov-
erty or institutional quality. It seems clear that Kiva’s
micro-lenders behave in a very different fashion from
official aid agencies.
Funding Rates
Assume each microloan project has a vector of char-
acteristics Z that can be mapped into a single dimen-
sion f: Z p, where f is a continuous, single-peaked
function. We can further assume that if each project
can be measured along this single-dimensional spec-
trum then each potential crowd-funder will have a dif-
ferent optimal p* with respect to loan projects. We can
then assume, still further, that micro-lenders will fund
the project closest to their optimal p*, such that each
project then gets funded by those lenders whose pref-
erences most closely match the attributes of that proj-
ect. Let g represent the density function for optimal
projects p* across the population of lenders, i.e., g: f(p)
p*, where g is continuous. If the density of available
projects is also continuous and positive for all values,
and if the density of these projects is at least as high
as that of g(p*) for every p*, then the total contribu-
tion C to a project will be C = N • k • g(p*), where N is
the number of micro-lenders and k is the average per-
individual contribution.
Table 1: Selectivity by Aid Type, Panel Regressions
(1)
ODA
(2)
Official micro-credit
(3)
Kiva disbursements
(1)
ODA
(2)
Official micro-credit
(3)
Kiva disbursements
Population (ln) 0.952***(0.055)
1.426***(0.106)
-0.100(0.104)
0.787***(0.097)
0.817***(0.150)
-0.131(0.189)
GDP (ln) -0.521***(0.049)
-0.951***(0.066)
0.107*(0.060)
-0.395***(0.092)
-0.376***(0.120)
0.142(0.087)
CPIA score 0.614***(0.071)
0.973***(0.199)
-0.139(0.193)
0.332(0.253)
0.878**(0.343)
-0.091(0.255)
N 472 371 192 135 135 135
Countries 120 106 55 48 48 48
R2 0.727 0.228 0.003 0.434 0.191 0.005
Notes: Dependent variables are gross flows (ln) of different types of aid to recipient countries. Estimates are obtained from pooled OLS regressions with error correction for contemporaneous correlation across panels, with panel-correct standard er-rors in parentheses. Intercepts are estimated by not reported. Observations are recipient country-years, 2006 to 2010.*** Significant at the 1 percent level. ** Significant at the 5 percent level.* Significant at the 10 percent level.

THE WISDOM OF CROWD-FUNDERS: WHAT MOTIVATES CROSS-BORDER PRIVATE DEVELOPMENT AID? 11
The supply of microloans increases over time as pro-
spective crowd-funders learn of Kiva projects. If that
learning is uncorrelated with p*, then all projects with
higher density g(p*) should be funded more quickly
over time. If the supply of microloans among a com-
munity of crowd-funders increases over time at a
constant rate, i.e., N(t) = N0Ɵt, then the rate at which
the project will be funded will be C/t= N0Ɵ • k • g(p).
We can, therefore, use funding rates as measures of
the proximity of program attributes to crowd-funder
preferences.
Table 2: Summary Statistics
VARIABLES N Mean Std. Dev. Min. Max.
Hours to fund 251,081 72.62 137.36 0.02 2,016.26
Amount (current US dollars) 251,081 722.78 650.55 25.00 5,050.00
Number of borrowers 251,081 1.90 3.03 1.00 50.00
Female 251,081 0.77 0.42 0.00 1.00
Loan duration (months) 251,081 11.59 4.54 2.00 195.00
Concentration 248,312 0.15 0.18 0.01 1.00
US share 248,312 0.67 0.21 0.00 1.00
MFI risk rating 248,312 3.35 1.46 0.00 5.00
Dow Jones (30-day change) 251,081 0.00 0.06 -0.31 0.20
Weekly search trend 248,437 7.96 11.09 0.10 99.50
Natural disaster (persons affected, millions) 250,789 1.38 2.34 0.00 7.13
Population (millions) 251,081 39.64 44.86 0.18 239.87
CPIA governance score 250,070 3.23 0.43 2.20 5.30
ODA per capita 248,425 63.88 82.83 2.49 838.75
Official microcredit per capita 247,287 8.62 11.94 0.00 126.53
Fragile state 250,381 0.24 0.43 0.00 1.00
US affinity 248,097 -0.55 0.11 -0.77 0.80
Per capita GDP (current US dollars) 248,312 1,360.19 1,400.47 90.54 21,806.03
Immigrants per Kiva disbursement 247,424 0.01 0.06 0.00 2.96
Remittances per Kiva disbursement 235,090 0.00 0.01 0.00 1.18
Share post-2000 immigrants 191,421 0.34 0.12 0.18 0.80
Relative immigrant per capita income 189,343 1.49 0.19 0.98 2.45
Share of immigrants in services 237,033 0.07 0.02 0.02 0.16
Refugees-to-immigrants 235,307 0.31 0.47 0.00 3.51

12 GLOBAL ECONOMY AND DEVELOPMENT PROGRAM
If a Kiva project submitted by a micro-entrepreneur
gets funded very quickly, we can assume that the
project appeals to more crowd-funders than projects
funded more slowly. We expect the funding rate to de-
pend on three sets of factors: the average per-individ-
ual contribution needed to fulfill the project request;
a set of project-specific attributes; and the rate at
which supply of microloans expands, a function of the
proliferation of knowledge about, or implicit support
for, the project among the crowd-funder community.
The funding rate thus potentially reveals information
about the preferences of micro-lenders with respect
to the project or recipient individual, as well as infor-
mation about the social networks through which infor-
mation about Kiva projects might be transmitted. We
would expect, for example, projects to be funded at
faster speeds among communities of crowd-funders
characterized by factors such as denser associational
ties or more active social networks. It is possible that
projects lacking optimal characteristics for an indi-
vidual may still be funded at faster speeds than more
desirable projects if the project enjoys support among
a particular community.
We examine Kiva project funding rates using survival
analysis, which provides estimates of the effect of
various covariates on the time it takes for an event
to be completed. In our case, “failure” occurs when a
project is fully funded and is removed from the web-
site; the more rapidly the project is removed from
the Kiva website, the more popular it is with lend-
ers. The benchmark for survival analysis (the Cox
model) is from a class of proportional hazard mod-
els and, in order for the estimated parameters to be
unbiased, the proportionality assumption must hold
(Box-Steffensmeier and Jones 2004). In the next sec-
tion we find that the likelihood of full funding for Kiva
microloans may be a multiplicative, rather than pro-
portional, effect of survival time, thus violating the
proportionality requirement. We therefore rely on the
approach developed by Royston (2001) and Royston
and Parmar (2002) that extends parametric methods
using restricted cubic splines to smooth the baseline
log cumulative hazard function in order to derive flex-
ible, parametric estimates of project survival. Table
2 provides some summary statistics of all variables
used in these estimations.
THE WISDOM OF CROWD-FUNDERS: WHAT MOTIVATES CROSS-BORDER PRIVATE DEVELOPMENT AID? 13
METHODS AND RESULTS
Survival Regressions
We examine the determinants of funding speed in on-
line philanthropy using loan data from Kiva between
April 2006 and December 2010. An advantage of the
semi-parametric Cox model is that the resulting es-
timates depend on the order in which events occur,
not the actual times at which they occur. Thus, the
functional form of the baseline hazard function is not
specified ex ante (as with hazard models that rely on
specific distributional forms), but determined from
the data. For our data, standard tests of proportional-
ity using residuals (and requiring residuals with zero
slope) do not support the proportionality requirement
assumption (see appendix). In more direct tests where
we split the sample according to survival-time quan-
tiles, we find that coefficients do not remain stable
over analysis time, indicating that proportionality is
not constant over time.
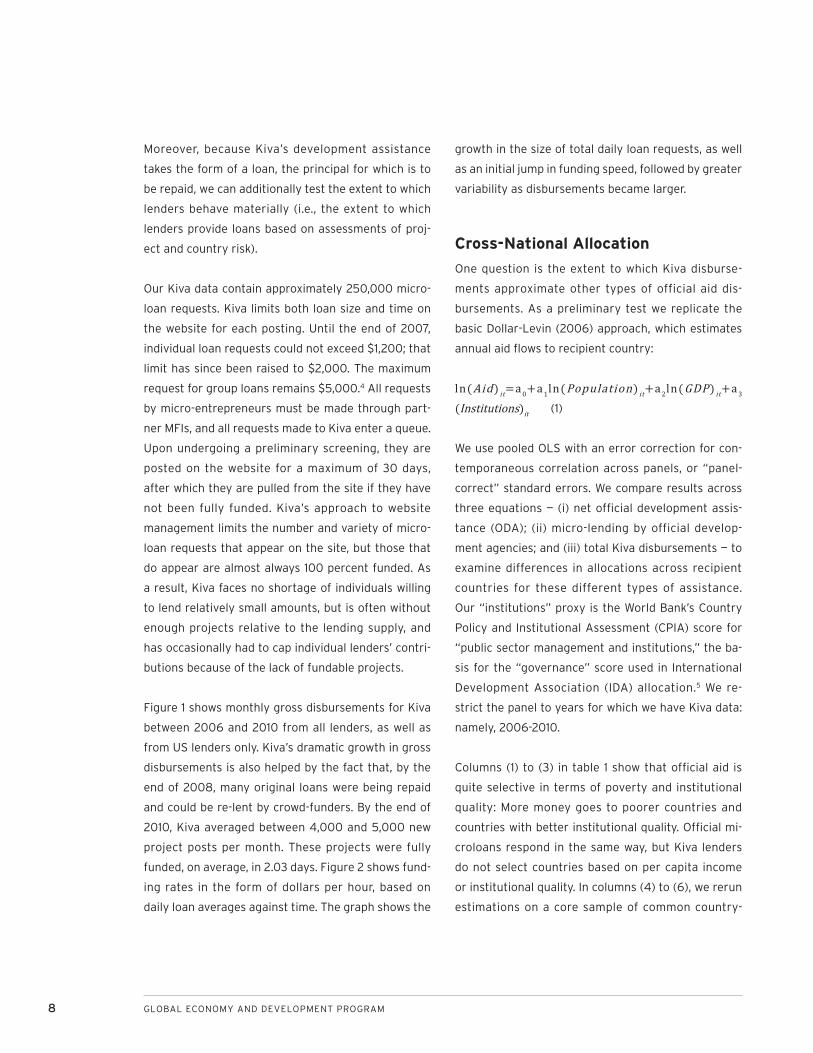
The log of the baseline survival curve is plotted in fig-
ure 3. The curve, which graphs the predicted log sur-
vival rate against analysis time with all covariates set
to zero, shows that survival rates, although they are
not convex, decline monotonically with respect to the
time a loan request has been on the website.
Figure 3: Baseline Hazard Function, Kiva Projects
Notes: Graph indicates baseline hazard rates (log scale) corresponding to each observed failure time (hours each Kiva project remains on the website until fully funded).

14 GLOBAL ECONOMY AND DEVELOPMENT PROGRAM
It is useful, therefore, to explore the joint effects of
project covariates within the framework of a model
in which the baseline hazard function is more fully
specified. Standard parametric models such as the
Weibull model are an alternative to the Cox model.
However, the baseline hazard function in figure 3 —
showing non-convex, non-constant, but monotonically
declining hazard rates — is inconsistent with param-
eterizations that impose restrictions on the shape of
the hazard function. To address the inadequacies of
fully parametric models, a more flexible parametric
model using restricted cubic splines was proposed
by Royston and Parmar (2002) for censored survival
data, enabling the baseline hazard to be modeled
directly. The restricted cubic splines offer greater
flexibility in the shape of the hazard function when
compared to standard parametric models (Nelson et
al. 2007). Accordingly, the model can be expressed as
a linear combination of a baseline cumulative hazard
and a covariate effect:
LnH(t|Q,x,w)i=LnH0(t)+βQ Ln(Qi)+βx xi+βw wi+μi, (2)
where LnH0(t)=Ln(λ)+αLn(t)=s(Ln(t)|α,k0)
and where lnH0(t) is the baseline log-integrated cumu-
lative hazard function, estimated with cubic splines
as a smoothed function of t with k0 knots. If splines
are not used to estimate the baseline, then the model
reduces to the Weibull hazard function. Among the
covariates, Q is the amount of funds requested; x is a
vector of additional project-specific attributes; w is a
vector of time-, country-, and sector-based covariates;
and μ is a random disturbance. Table 3 shows results
using the Royston-Parmar method.
Basic Project Covariates
In addition to requested grant or loan size (which we
model quadratically), we include: the number of bor-
rowers; a binary indicator coded 1 if the fraction of
borrowers that are women is greater than 0.5 (or if
the individual borrower herself is a woman), and 0
otherwise; and the duration of the loan repayment in
months. We use an additional variable to proxy project
risk: MFIs that work with Kiva have been assigned a
rating of between one and five “stars,” with one star
representing highest risk and five stars lowest risk,
based on Kiva’s experience with the MFI.6 We score
projects 1 to 5, depending on the relevant MFI rating.
The following fixed effects are part of the benchmark
specification: We include dummies for the hour (from
the 24-hour cycle) in which projects were posted on
the Kiva website, days in the week, months in the
year to control for seasonal effects, sectors for which
the project loans will be used and countries in which
the project will be implemented. Hazard estimates
correspond to the rate at which project requests are
fulfilled in hours (log), with positive coefficients imply-
ing a faster failure rate (and a more quickly-funded
project).
In column (1) we see that larger amounts requested
take longer periods to be funded, although the effect
is diminishing in loan size. Lenders also fund female
entrepreneurs over their male counterparts, a prac-
tice strongly associated with microfinance regimes
around the world (D'Espallier, Guérin, and Mersland
2009). However, unlike the case with classic micro-
lending, Kiva crowd-funders have no preference for
funding groups of borrowers rather than individual
borrowers. Short-term loans are funded more quickly
than long-term loans. Finally, lower MFI risk has a
small effect on funding rate. With the exception of
group lending, Kiva’s crowd-funders appear to behave
as risk-averse funders of developing country projects
based solely on project-specific covariates.

THE WISDOM OF CROWD-FUNDERS: WHAT MOTIVATES CROSS-BORDER PRIVATE DEVELOPMENT AID? 15
Table 3: Kiva Funding Rates, Flexible Parametric Regressions
(1) (2) (3) (4) (5)
Amount (Ln) -3.271***(0.035)
-3.252***(0.036)
-3.588***(0.047)
-3.518***(0.048)
-3.642***(0.049)
Amount2 (Ln) 0.188***(0.003)
0.187***(0.003)
0.217***(0.004)
0.211***(0.004)
0.223***(0.004)
Number of borrowers -0.005***(0.001)
-0.001(0.001)
-0.019***(0.002)
-0.015***(0.002)
-0.024***(0.002)
Female 0.454***(0.006)
0.432***(0.006)
0.414***(0.007)
0.410***(0.007)
0.396***(0.007)
Loan term (months) -0.025***(0.001)
-0.025***(0.001)
-0.019***(0.001)
-0.023***(0.001)
-0.021***(0.001)
MFI risk rating -0.006***(0.002)
0.028***(0.002)
0.048***(0.002)
0.054***(0.002)
0.053***(0.003)
Dow Jones (30 day change) -1.129***(0.040)
-0.596***(0.050)
-0.498***(0.050)
-0.467***(0.052)
Weekly search trend (Ln) -0.091***(0.016)
-0.027***(0.009)
0.084***(0.012)
-0.031***(0.010)
Weekly total project size (Ln) -0.027***(0.003)
-0.063***(0.004)
-0.051***(0.004)
-0.060***(0.004)
Natural disaster (persons affected, Ln) 1.427***(0.043)
0.015***(0.001)
0.011***(0.001) 0.017***
(0.001)
Population (Ln) -4.480***(0.134)
-0.016***(0.006)
-0.080***(0.007)
-0.027***(0.006)
GDP per capita (Ln) 0.678***(0.024)
0.203***(0.047)
0.764***(0.041)
CPIA governance score -0.080***(0.015)
-0.015(0.019)
-0.120***(0.017)
ODA per capita (Ln) 0.002***(0.000)
0.003***(0.000)
0.001***(0.000)
Fragile state -0.046***(0.014)
0.014(0.017)
-0.069***(0.015)
US affinity -1.451***(0.038)
-1.791***(0.040)
-1.467***(0.040)
Immigrants per Kiva disbursement (Ln) 0.246**(0.124)
0.546***(0.132)
0.650***(0.150)
Remittances per Kiva disbursement (Ln)
-1.216***(0.440)
-2.396***(0.485)
-1.851***(0.467)
Share of post-2000 immigrants 2.150***(0.038)
2.223***(0.047)
2.148***(0.039)
Relative immigrant per capita income 2.778***(0.108)
0.515**(0.231)
3.128***(0.169)

16 GLOBAL ECONOMY AND DEVELOPMENT PROGRAM
Table 3: Kiva Funding Rates, Flexible Parametric Regressions
(1) (2) (3) (4) (5)
Share of immigrants in services -6.507***(0.265)
-6.618***(0.271)
-6.193***(0.343)
Refugees-to-immigrants 0.235***(0.010)
0.252***(0.011)
0.248***(0.011)
East Asia/Pacific Islands -0.075***(0.019)
Former Soviet Union 0.638***(0.048)
Latin America/Caribbean -0.282***(0.030)
Middle East/North Africa 0.098***(0.022)
South Asia 0.378***(0.069)
Country dummies Yes Yes No No No
Sector, month, day and hour dummies Yes Yes Yes Yes Yes
Weighted by total private aid No No No No Yes
N 251,714 248,141 171,785 171,785 159,711
Ln(L) -4.372×10⁵ -4.300×10⁵ -1.451×10⁵ -1.450×10⁵ -1.413×10⁵
Flexible parametric survival estimates indicate that
Kiva crowd-funders prefer, on the whole, smaller
funding requests, female borrowers and shorter-term
loans. We see no preference for group-based loans, as
is usually the case in formal microfinance.7
Volatility in Loan Funding Rates
As figure 2 suggests, funding rates for Kiva loan re-
quests exhibit considerable volatility. In column (2)
we add controls that may influence survival rates with
high temporal frequency. First, it has been argued
that private aid is subject to greater volatility than
official aid, as private aid is vulnerable to the whims
of philanthropic individuals, as well as to the vicissi-
tudes of economic life in the countries in which they
live (Frot and Santiso 2008). To examine whether
economic conditions in the donor-lenders’ countries
of residence affect their grant giving or lending, we
use a lagged 30-day change in the closing Dow Jones
Industrial Average, based on the assumptions that
stock-market changes are a useful proxy for economic
Notes: Estimates are hazard coefficients obtained from Royston-Parmar flexible parametric survival regressions, with baseline hazard functions estimated using restricted cubic splines with six knots. Standard errors are in parentheses. Intercepts are estimated but not reported.*** Significant at the 1 percent level. ** Significant at the 5 percent level.* Significant at the 10 percent level.

THE WISDOM OF CROWD-FUNDERS: WHAT MOTIVATES CROSS-BORDER PRIVATE DEVELOPMENT AID? 17
conditions in donor-lender countries and that deterio-
rating economic conditions might make philanthropic
individuals more hesitant to contribute online to de-
velopment projects. If that is the case, one should
expect projects to be funded at a slower rate following
a fall in the Dow Jones index. The empirical results,
however, are the reverse — projects get funded faster
after a fall in the Dow.
Second, it is possible that the “visibility” of countries
in which micro-entrepreneurs live will influence the
rate at which their microloan requests are fulfilled —
borrowers in countries that are in the headlines, for
example, being funded more quickly than borrowers in
countries that are less well known to publics in donor
countries. To account for these changes in the public
profile of countries, we construct an index based on
Google Trends—a facility based on Google’s search
engine that shows how often a particular search term
is entered relative to the total search volume across
various regions of the world, and in various languages.
We entered the names of all countries from which
Kiva requests have come between 2006 and 2010,
both alphabetically and in groups of five (the maxi-
mum allowable on Google Trends). Because Google
Trends indexes search terms based on the first search
term entered, all our searches included the same first
country (Albania) to benchmark subsequent country
search terms. The results are weekly indices of the
relative visibility of each country as proxied by Google
searching. This variable did not prove to be robust,
switching signs in different model specifications.
In order to control for the frequency of changes in
the total volume of microloan requests across coun-
tries, we also include the total weekly amount of loan
requests from the borrower’s country. The fewer the
number of listed projects, the faster each individual
project gets funded, as expected.
Third, we control for the occurrence of natural di-
sasters, for which we rely on the Emergency Events
Database (EM-DAT). We include the number of people
“affected” (killed, injured or displaced) by a natural
disaster in the country in which the Kiva project takes
place over the preceding three months, in natural
logs.8 We find, as expected, that the greater the num-
ber of people harmed by a natural disaster, the faster
the funding rate for Kiva projects in the affected
country.
Selectivity of Crowd-Funding
We tested to see whether those variables that affect
official lending allocations also affect Kiva micro-lend-
ers. In columns (3) to (5), we replace country dummies
with country descriptors: GDP per capita, poverty
incidence, governance or institutional quality (OECD
2003; McGillivray 2003; Hout 2007).9 We also added a
dummy for fragile states to account for concerns that
good governance criteria disadvantage fragile states
unfairly and inappropriately (European Commission
2005). The dummy variable is coded 1 if the recipi-
ent country is on the OECD Development Assistance
Committee’s list of fragile states, and 0 otherwise.
In addition to these recipient-country factors, there is
also a strong tendency for official bilateral aid to be
targeted toward allies and nations with which donors
share common strategic interests. To test whether
Kiva micro-lenders also support “friendly” countries,
we rely on an indicator of commonality or “affinity”
of any aid recipient with the US, based on the similar-
ity between votes of those aid recipients and those
of the US in the United Nations General Assembly.
As a measure of shared state preferences among
pairs of states (dyads), an affinity score based on UN
voting is thought to suffer from less distortion than
more costly actions such as formal military alliances,

18 GLOBAL ECONOMY AND DEVELOPMENT PROGRAM
treaties or commercial agreements (UN votes being
largely symbolic).10
We find that Kiva lenders behave quite differently
from official agencies. They mostly fund projects in
middle-income countries at a faster rate than those
in low-income countries (columns (4) to (6)). The
funding rate for projects in well-governed countries
is significantly slower than that in more corrupt coun-
tries in some specifications (columns (4) and (6)). The
results for fragile states are also mixed. Kiva lenders
also appear to be averse to funding projects in coun-
tries that are close allies of the US, with a higher US
affinity score being associated with longer funding
times.
Social Networks and Immigrant Communities
In column (4) of table 3 we examine evidence that the
nexus of social relations that recipient countries can
rely on in donor countries affects crowd-funding. Of
course, diaspora networks — cultural and social rela-
tions between migrant communities and their coun-
try of residence — are known to play pivotal roles in
influencing foreign direct investment flows (Leblang
2010), as well as foreign aid decisions (Bermeo and
Lebland 2010), from the resident country to the coun-
try of origin. There are two principal channels by
which Kiva funding may be affected. First, members
of migrant communities may directly fund projects
in their homelands as participants in crowd-funding
arrangements. Migrants who may have better infor-
mation about entrepreneurial opportunities, aid ne-
cessities, public opinion and consumer preferences in
their home country may participate as Kiva lenders.
Second, migrant communities, through their social
ties with native-born populations, can provide infor-
mation about their home countries and thereby shape
the funding preferences of private donors who might
not themselves be immigrants. Unfortunately, we do
not have data regarding the lenders who fund Kiva
projects, apart from their country of residence. We
can, however, test these implications indirectly.
We include several indicators that characterize mi-
grant communities in the US. As mentioned previ-
ously, over two-thirds of Kiva funds come from the US
and, therefore, we can reasonably be assured that any
effects attributed to American migrant communities
are likely underestimating the true effects. In the sub-
sequent section we show that splitting the sample be-
tween mainly US funded and non-US funded projects
makes no difference with our results.
Six separate indicators of American migrant commu-
nities are used according to the country from which
the project request comes: (i) size of the immigrant
population; (ii) remittances; (iii) length of residency;
(iv) occupational status; (v) wealth; and (vi) refugees.
All indicators describe characteristics of migrant
communities from Kiva-recipient country i at time t
living in the US. Total numbers of immigrants from
each country and total amounts of remittances are
both weighted by the total amount of annual Kiva
flows to the country of origin, in order to adjust for
the level of project activity in the home country, as
well as to control for the possibility that remittances
and philanthropy are substitutes. To control for differ-
ences between recent and more established migrant
communities, and for possible resulting differences
in average internet usage and connectedness, we
include the share of the total immigrant population
that arrived in the US after 2000. For occupational
status, we use the fraction of immigrant communi-
ties in the financial, insurance and real estate (FIRE)
services sectors. To control for the wealth of migrants
relative to their compatriots in their home countries,
we incorporate the average per capita income of

THE WISDOM OF CROWD-FUNDERS: WHAT MOTIVATES CROSS-BORDER PRIVATE DEVELOPMENT AID? 19
the immigrant population divided by the per capita
income of their country of origin. Information on im-
migrant community characteristics comes from the
annual American Community Survey conducted by
the US Census Bureau. Data on bilateral remittances
from the US are from the World Bank’s Migration and
Remittances Factbook.
“Immigrant” here refers to those individuals who have
obtained permanent legal residence status. This does
not, therefore, take account of individuals who are ref-
ugees and asylum-seekers. Between 2006 and 2010,
between four and 11 countries had more refugees than
immigrants in the US. Refugees fleeing their home-
land for non-economic reasons may have different
effects on Kiva funding rates than that of immigrant
populations.11 We use data from the United Nations’
High Commission on Refugees to code the number of
refugees from a Kiva-recipient country granted asy-
lum in the US.
Column (4) in table 3 shows that countries with larger
numbers of immigrants in the US, with greater pro-
portions of recent arrivals and with migrants who
are richer than compatriots in their home countries,
receive Kiva funding at faster rates. We also see
that crowd-funding and remittances are substitutes
— indeed, Kiva projects in countries receiving large
amounts of remittances are funded more slowly.
Finally, countries claiming larger proportions of refu-
gees to immigrants also receive funding at faster
rates. Countries with larger proportions of migrants
employed in the financial services sectors — sectors
traditionally characterized by high levels of participa-
tion in crowd-funding elsewhere (e.g., Ordanini, Miceli,
and Pizzetti 2011) — receive funds more slowly, indicat-
ing that actual migrant participation in crowd-funding
does not explain project funding rates. These results
support the view that the network of social relation-
ships between migrant communities and citizens in
donor countries shapes the preferences of crowd-
funders toward recipient countries.
We note that, once we include indicators of migrant
communities, the population and per capita GDP in-
dicators switch signs. Thus, a critical aspect of selec-
tivity-based allocation — country poverty — now has a
negative effect on funding rates, calling into question
the robustness of the selectivity-based measures.
To test whether one or more regions are driving the
identification of the immigrant network covariates, we
add regional dummies in column (5): East Asia and the
Pacific; Europe and Central Asia; Latin America and
the Caribbean; the Middle East and North Africa; and
South Asia, with sub-Saharan Africa being the refer-
ence. The inclusion of regional indicators results in no
changes in signs or significance levels for any of our
immigrant network variables.
Generalizability to Other Giving
As noted earlier, it is likely that the population of
those who give to charity in general differs from the
population of Kiva’s crowd-funders along a number
of characteristics. As a final check, therefore, we ad-
just our regression estimates for this potential non-
representativeness with respect to private aid. Using
data from Büthe, Major and de Mello e Souza (2012)
on total private giving to all recipient countries, we
generate a normalized weight based on the ratio of
the gross private aid flow to the total Kiva disburse-
ment to country i — a simple procedure that gener-
ates the equivalent of a sample weight, adjusting
estimates based on the extent to which Kiva disburse-
ments are over- or under-represented in total private
aid. Results from these weighted estimations are in
column (6). The stability of coefficients relative to
previous specifications indicates that any bias from
non-representativeness is minimal.

20 GLOBAL ECONOMY AND DEVELOPMENT PROGRAM
Finally, we examine funding rates immediately before
and after the occurrence of natural disasters in re-
cipient countries, on the assumption that any incon-
sistency in estimates during these events indicates
changes in either the composition of lenders or in the
selection of projects by MFIs. In table 4 we rerun the
estimation in column (4), table 3 on three sub-samples
of projects: those posted 30 days prior to the occur-
rence of a natural disaster in the recipient country,
those posted during the immediate 30-day aftermath
and those posted between 31 and 60 days after its oc-
currence. Given that the timing of a natural disaster
cannot be manipulated by lenders or entrepreneurs,
we would expect changes in coefficients to indicate
potential selection effects — either among projects
that are posted or among the types of lenders who
fulfill microloan requests.
The coefficients for project indicators are highly
stable, suggesting that the projects selected for Kiva
posting are not influenced by natural disasters and
that variability in project selection is unlikely to be
driving our results. There are some changes in coef-
ficients among the traditional indicators of aid selec-
tivity — the CPIA score and the fragile state indicator
— but these are generally consistent with the changes
across estimations in table 3. As for the immigrant
network indicators, we see changes in immigrants
per Kiva disbursement, and in remittances per Kiva
disbursement relative to table 3. In the immediate
aftermath of a natural disaster, Kiva funding is not
driven by the size of the immigrant population, and
Kiva projects in countries receiving more remittances
are funded more quickly — indicating that, for brief
moments following natural disasters and their ensu-
ing humanitarian crises, crowd-funders are supple-
menting rather than replacing remittances. We note,
however, that all other immigrant network results are
stable.
Robustness
We check the central robustness of our findings by
estimating the effects of project-specific and country-
specific covariates, along with sector-, month- and
hour-fixed effects on Kiva project funding rates
across different subsamples. We focus on subsamples
based on US share of total funding, timing and fund-
ing concentration. Figure 4 plots the baseline hazard
functions for these subsamples and table 5 presents
covariate hazard effects.
US Funding Share
In columns (1) and (2) we split the sample between
projects funded mainly through US-based lenders
and projects funded outside the US. Our indicators of
migrant communities are US-based and, therefore, we
divide the sample above 70 percent US-based fund-
ing (roughly the sample mean), as well as below 25
percent US-based (the mean less two standard de-
viations), to ensure that the use of these US-based
indicators holds consistently for projects whose main
lenders who live outside the US. As figure 4 shows,
when splitting the sample at the mean, the baseline
hazards are similar and both closely approximate the
function plotted in figure 3. The indicators that de-
scribe migrant communities’ size, occupational status,
tenure and refugee populations are similar in sign, sig-
nificance and magnitude for projects funded mainly
through US-based lenders as well those projects
funded by non-US lenders. For mainly US-funded proj-
ects, countries that receive more remittances receive
Kiva money more slowly; for projects funded outside
the US, remittances (as with the full sample) and rela-
tive migrant income have no effect. Finally, the Google
Trends indicator does not affect funding rates for proj-
ects whose crowd-funders are mainly outside the US.

THE WISDOM OF CROWD-FUNDERS: WHAT MOTIVATES CROSS-BORDER PRIVATE DEVELOPMENT AID? 21
Table 4: Kiva Funding Rates, Before and After Natural Disasters
30 to 1 days before 0 to 30 days after 31 to 60 days after(1) (2) (3)
Amount (Ln) -3.857***(0.084)
-3.926***(0.148)
-3.602***(0.081)
Amount2 (Ln) 0.239***(0.007)
0.242***(0.012)
0.217***(0.007)
Number of borrowers -0.023***(0.003)
-0.020***(0.005)
-0.022***(0.003)
Female 0.419***(0.012)
0.446***(0.020)
0.381***(0.012)
Loan term (months) -0.021***(0.001)
-0.027***(0.003)
-0.024***(0.001)
MFI risk rating 0.046***(0.004)
0.032***(0.008)
0.060***(0.004)
Dow Jones (30 day change) 0.021(0.088)
-0.371**(0.153)
-0.760***(0.098)
Weekly search trend (Ln) -0.063***(0.016)
0.100***(0.030)
0.008(0.017)
Weekly total project size (Ln) -0.074***(0.007)
-0.063***(0.013)
0.003(0.007)
Natural disaster (persons affected, Ln) 0.014***(0.002)
0.006**(0.003)
0.039***(0.002)
Population (Ln) -0.002(0.010)
-0.206***(0.026)
-0.116***(0.010)
GDP per capita (Ln) 0.995***(0.066)
1.291***(0.171)
1.440***(0.061)
CPIA governance score 0.016(0.029)
-0.321***(0.076)
-0.431***(0.028)
ODA per capita (Ln) 0.004***(0.000)
0.000(0.001)
-0.001***(0.000)
Fragile state 0.031(0.026)
0.505***(0.059)
-0.097***(0.026)
US affinity -1.481***(0.074)
-0.655***(0.161)
-2.844***(0.080)
Immigrants per Kiva disbursement (Ln) 0.430*(0.244)
-3.647***(0.670)
0.072(0.197)
Remittances per Kiva disbursement (Ln) -3.085***(0.783)
6.967***(1.856)
-1.010(0.708)
Share of post-2000 immigrants 2.108***(0.063)
1.356***(0.130)
3.132***(0.073)
Relative immigrant per capita income 4.317***(0.288)
5.798***(0.763)
5.678***(0.262)

22 GLOBAL ECONOMY AND DEVELOPMENT PROGRAM
Although it is unlikely that countries with strong ties
between their migrant communities and US citizens
would also have strong ties between their migrants
and citizens of, for example, Western European na-
tions, the striking similarity of hazard coefficients
does suggest that, for internet-based crowd-funders,
it is the global “conspicuousness” of recipient coun-
tries that influences lending decisions.
Recession
To test whether the global recession of late 2008-
2009 affected crowd-funding, we split the sample
into projects funded before and after September 15,
2008, following the filing of Chapter 11 bankruptcy
by Lehman Brothers and the fall in US stock market
capitalization by 30 percent over the next quarter.
Initially, it was widely expected that private global
philanthropy would contract during the global eco-
nomic downturn (e.g., Sachs 2009; Raghuram 2009).
Available evidence, however, indicates little effect of the
recession on private aid flows (Hudson Institute 2012).
Similarly, Kiva crowd-funding does not appear to
have been adversely affected by recession. In fact,
as the second graph in figure 4 shows, the survival
rates have generally decreased for projects funded
after the recession, as seen in the downward shift of
the baseline hazard function at longer survival times.
Individual covariate effects, too, are similar pre- and
post-recession, with two main exceptions: the size
of an immigrant community is associated with faster
funding rates only after the recession begins, while
Kiva funders prefer countries receiving fewer remit-
tances.
Additionally, we do not see clear evidence of greater
risk aversion among crowd-funders during reces-
sion. While funders do prefer lending to projects from
countries with higher CPIA scores after September
15, 2008, there is also a shift away from group-based
lending toward individual borrowers and projects in
aid-dependent countries.
Table 4: Kiva Funding Rates, Before and After Natural Disasters
30 to 1 days before 0 to 30 days after 31 to 60 days after(1) (2) (3)
Share of immigrants in services -7.998***(0.482)
-8.284***(1.175)
-7.157***(0.475)
Refugees-to-immigrants 0.229***(0.018)
0.192***(0.042)
0.284***(0.017)
N 59,415 20,363 56,350
Ln(L) -1.027×10⁵ -3.483×10⁴ -9.712×10⁴
Notes: Estimates are hazard coefficients obtained from Royston-Parmar flexible parametric survival regressions with baseline hazard functions estimated using restricted cubic splines with six knots. Sample is restricted to projects posted before, during or after natural disasters, as events are classified by the Emergency Events Database (EM-DAT). Standard errors are in paren-theses. Intercepts and sector-, month-, day- and hour-fixed effects are estimated but not reported.*** Significant at the 1 percent level. ** Significant at the 5 percent level.* Significant at the 10 percent level.

THE WISDOM OF CROWD-FUNDERS: WHAT MOTIVATES CROSS-BORDER PRIVATE DEVELOPMENT AID? 23
Funding Concentration
It is possible that crowd-funders behave more instru-
mentally toward potential projects when they are the
main funders, especially since crowd-funders expect
their principal to be repaid by Kiva borrowers. We
examine changes in hazard coefficients for projects
in which Herfindahl concentration ratios are above
0.75 and 0.95 in columns (5) and (8), respectively, in
table 5. The results do not support the view that small
groups of big lenders act more instrumentally toward
Kiva projects. The preferences of big crowd-funders
toward project attributes are not appreciably differ-
ent than those of smaller contributors. With respect
to loan term and MFI risk the hazard covariates are
similar. Moreover, larger contributors prefer groups
and female borrowers to a lesser extent than smaller
funders.
Similarly, larger contributors do not mimic official
donor behavior to any greater extent than smaller
Figure 4: Baseline Hazard Functions by US Share, Timing and Funding Concentration
Notes: Graphs indicate baseline hazard rates (log scale) corresponding to each observed failure time (hours each Kiva projects remains on the website until fully funded) for subsamples.
-14
-12
-10
-8
-6
-4
-2
0
0 500 1000 1500 2000
Sur
viva
l rat
e (L
n)
Survival time (hours)
US SHARE ≥ 70%
US SHARE < 70%
US SHARE < 25%
-14
-12
-10
-8
-6
-4
-2
0
0 500 1000 1500 2000S
urvi
val r
ate
(Ln)
Survival time (hours)
PRE-RECESSION
POST-RECESSION
-14
-12
-10
-8
-6
-4
-2
0
0 500 1000 1500 2000
Sur
viva
l rat
e (L
n)
Survival time (hours)
CONCENTRATION ≥ 0.95
CONCENTRATION < 0.95
-14
-12
-10
-8
-6
-4
-2
0
0 500 1000 1500 2000
Sur
viva
l rat
e (L
n)
Survival time (hours)
CONCENTRATION ≥ 0.75
CONCENTRATION < 0.75

24 GLOBAL ECONOMY AND DEVELOPMENT PROGRAM
Table 5: Robustness Checks, Subsamples
By US Share By Timing By Funding Concentration
≥ 70% ≤ 25% Pre-recession
Post-recession ≥ 95% < 95% ≥ 75% < 75%
(1) (2) (3) (4) (5) (6) (7) (8)
Amount (Ln) -3.301***(0.077)
-2.973***(0.188)
-2.093***(0.110)
-4.040***(0.054)
-1.222***(0.240)
-3.617***(0.050)
-1.086***(0.202)
-3.660***(0.050)
Amount2 (Ln) 0.199***(0.006)
0.184***(0.017)
0.079***(0.009)
0.253***(0.005)
0.061***(0.023)
0.220***(0.004)
0.038**(0.019)
0.224***(0.004)
Number of borrowers
-0.016***(0.003)
-0.042***(0.010)
0.021***(0.004)
-0.027***(0.002)
-0.023(0.021)
-0.020***(0.002)
-0.010(0.015)
-0.021***(0.002)
Female 0.350***(0.011)
0.334***(0.032)
0.247***(0.015)
0.468***(0.008)
0.209***(0.049)
0.420***(0.007)
0.196***(0.041)
0.421***(0.007)
Loan term (months)
-0.017***(0.001)
-0.030***(0.004)
-0.012***(0.002)
-0.021***(0.001)
-0.023***(0.007)
-0.019***(0.001)
-0.017***(0.006)
-0.019***(0.001)
MFI risk rating 0.036***(0.004)
0.029**(0.012)
0.057***(0.005)
0.050***(0.003)
0.071***(0.019)
0.049***(0.002)
0.052***(0.015)
0.050***(0.002)
Dow Jones (30-day change)
-0.510***(0.076)
0.491*(0.253)
-0.207(0.171)
-0.847***(0.056)
1.264***(0.385)
-0.655***(0.050)
1.177***(0.324)
-0.674***(0.051)
Weekly search trend (Ln)
0.014(0.014)
-0.129**(0.053)
-0.057***(0.020)
-0.116***(0.011)
-0.188**(0.083)
-0.029***(0.009)
-0.114*(0.063)
-0.029***(0.009)
Weekly total project size (Ln)
0.007(0.005)
0.004(0.018)
0.105***(0.007)
-0.081***(0.005)
0.092***(0.025)
-0.068***(0.004)
0.070***(0.021)
-0.068***(0.004)
Natural disaster (persons affected, Ln)
0.012***(0.001)
0.012**(0.005)
-0.001(0.002)
0.018***(0.001)
-0.000(0.008)
0.015***(0.001)
0.004(0.006)
0.015***(0.001)
Population (Ln) -0.030***(0.009)
-0.007(0.031)
-0.046***(0.012)
0.029***(0.007)
-0.002(0.048)
-0.016***(0.006)
-0.013(0.037)
-0.015***(0.006)
CPIA governance score
0.688***(0.037)
0.502***(0.167)
1.073***(0.050)
0.667***(0.030)
1.361***(0.258)
0.675***(0.024)
1.214***(0.201)
0.676***(0.024)
ODA per capita (Ln)
-0.213***(0.024)
0.047(0.088)
-0.004(0.041)
-0.057***(0.018)
0.018(0.154)
-0.082***(0.015)
-0.150(0.118)
-0.085***(0.015)
Fragile state 0.003***(0.000)
0.004***(0.001)
-0.012***(0.001)
0.002***(0.000)
0.005***(0.002)
0.002***(0.000)
0.004***(0.001)
0.002***(0.000)
US affinity -0.094***(0.023)
0.083(0.087)
-0.260***(0.037)
-0.099***(0.017)
-0.020(0.145)
-0.052***(0.014)
-0.095(0.113)
-0.056***(0.015)
GDP per capita (Ln)
-1.306***(0.056)
-1.984***(0.206)
-1.604***(0.103)
-0.832***(0.066)
-2.340***(0.308)
-1.426***(0.038)
-2.076***(0.240)
-1.405***(0.038)
Immigrants per Kiva disbursement (Ln)
-0.370**(0.164)
1.049(0.641)
-3.150***(0.165)
2.216***(0.215)
-0.632(0.924)
0.260**(0.125)
-0.825(0.754)
0.249**(0.126)

THE WISDOM OF CROWD-FUNDERS: WHAT MOTIVATES CROSS-BORDER PRIVATE DEVELOPMENT AID? 25
Table 5: Robustness Checks, Subsamples
By US Share By Timing By Funding Concentration
≥ 70% ≤ 25% Pre-recession
Post-recession ≥ 95% < 95% ≥ 75% < 75%
(1) (2) (3) (4) (5) (6) (7) (8)Remittances per Kiva disbursement (Ln)
1.875***(0.619)
-5.881***(2.012)
6.857***(0.522)
-6.789***(0.683)
3.071(3.021)
-1.262***(0.445)
4.217*(2.552)
-1.226***(0.447)
Share of post-2000 immigrants
1.875***(0.060)
2.557***(0.179)
1.607***(0.099)
2.175***(0.048)
1.945***(0.292)
2.164***(0.038)
1.980***(0.237)
2.163***(0.039)
Relative immigrant per capita income
3.046***(0.171)
1.491**(0.702)
4.755***(0.243)
2.677***(0.132)
5.092***(1.115)
2.768***(0.109)
4.656***(0.855)
2.781***(0.109)
Share of immigrants in services
-6.549***(0.397)
-6.699***(1.570)
-10.544***(0.606)
-6.231***(0.358)
-7.758***(2.376)
-6.501***(0.267)
-8.446***(1.848)
-6.527***(0.268)
Refugees-to-immigrants
0.260***(0.016)
0.157***(0.046)
0.327***(0.019)
0.333***(0.017)
0.276***(0.068)
0.240***(0.011)
0.269***(0.055)
0.241***(0.011)
N 68,493 8,805 37,815 133,502 4,122 167,663 5,561 166,224
Ln(L) -1.203×10⁵ -1.587×10⁴ -5.837×10⁴ -2.321×10⁵ -7.695×10³ -2.875×10⁵ -1.048×10⁴ -2.842×10⁵
contributors. For projects with higher funding concen-
trations, neither country aid dependency, the CPIA
score nor state fragility affect project funding rates.
Larger funders also fund projects from richer coun-
tries two to three times faster than smaller funders.
Larger funders appear to be more responsive to
refugee-to-immigrant ratios and to relative wealth of
immigrant communities, the coefficients for both be-
ing higher for projects with concentrations of funders.
They also respond less to changes in the Dow Jones
index, although the effect remains the same (i.e., in-
creases in the index are associated with slower over-
all funding rates for Kiva projects). Meanwhile, large
funders also appear to follow headlines more than
smaller contributors, suggesting that larger funders
may also be more informed. While there are some
notable differences, then, none of them indicate that
larger funders are more risk-averse toward their loans
than smaller funders.
Notes: Estimates are hazard coefficients obtained from Royston-Parmar flexible parametric survival regressions with baseline hazard functions estimated using restricted cubic splines with six knots. Standard errors are in parentheses. Intercepts and sector-, month-, day- and hour-fixed effects are estimated but not reported. The post-recession period is after September 15, 2008.*** Significant at the 1 percent level. ** Significant at the 5 percent level.* Significant at the 10 percent level.

26 GLOBAL ECONOMY AND DEVELOPMENT PROGRAM
CONCLUSIONS
We examine indirect evidence of the funding pref-
erences of private aid givers using data on crowd-
funded microloans through Kiva, an internet-based
peer-to-peer platform that bundles contributions into
loans for entrepreneurs in developing countries. The
behavior of private aid givers has been little examined
to date, despite the increase in private development
aid. We identified three possibilities: that crowd-
funders act as risk-averse charitable contributors,
making funding decisions based on project-specific
risks and incentives; that crowd-funders behave like
official foreign aid agencies, funding projects based
on a combination of country need and institutional
quality; or that crowd-funders are motivated by the
social networks connecting them to countries in which
projects take place. Because Kiva crowd-funders ex-
pect to have their principal repaid, Kiva’s project data
affords us an opportunity to test the risk-aversion of
crowd-funders; because Kiva’s projects span some 80
developing countries, we can also examine whether
aid flows through Kiva are as selective as official de-
velopment assistance.
Using survival analysis of funding rates for Kiva proj-
ects between April 2006 and December 2010, we find
weak support for the view that crowd-funders are
risk-averse with respect to microcredit in develop-
ing countries. Kiva’s crowd-funders do prefer loans
to women, as well as those of shorter duration and
smaller amounts. However, they reject the group li-
ability approach of traditional microfinance and only
weakly prefer lending through lower-risk partner mi-
crofinance institutions. We find almost no consistent
support for the perspective that crowd-funders act
selectively toward projects based on the poverty or
institutional quality of the country.
By contrast, we find strong support for the argument
that crowd-funding is essentially an expressive act
that enables individuals to “connect” with micro-
entrepreneurs, much in the same way that individu-
als can “sponsor” children in developing countries
through a number of NGOs. In this regard, we find that
the nature of social relations that developing coun-
tries are able to rely upon in richer countries — in par-
ticular, through their communities of migrants — has
a strong effect on the funding rates of Kiva projects.
Kiva crowd-funders prefer to lend to countries which
claim larger numbers of more recent, wealthier immi-
grants, and from which large number of refugees also
come. For two reasons, we speculate that this is not
necessarily due to participation by immigrants them-
selves as crowd-funders. First, Kiva lending moves in
the opposite direction of remittances, which would
be unlikely if immigrants themselves were largely
responsible for Kiva funding to their home countries.
Second, countries with large percentages of immi-
grants employed in the high-wage financial services
sectors receive money at slower rates, the opposite of
what would be expected were immigrants themselves
participating as crowd-funders. Rather, we suggest
that immigrant communities, through their social ties
with native-born populations, provide information
about their home countries to prospective crowd-
funders.
These findings have implications for official aid pol-
icy.12 In contrast to years past, the collective-action
costs of private aid appear to be minimal, especially
with the proliferation of internet-based crowd-funding
platforms. Moreover, internet technology appears to
have reduced the advantage that official agencies
once held in terms of minimizing the transaction costs
of disbursing aid. Finally, private aid now has signifi-

THE WISDOM OF CROWD-FUNDERS: WHAT MOTIVATES CROSS-BORDER PRIVATE DEVELOPMENT AID? 27
cant advantages over official aid in avoiding agency
costs, as private aid givers can give money to recipi-
ents in developing countries in a much more direct
way. Indeed, the rapid growth of crowd-funded private
aid may be attributed to the attractiveness of this
“short route” to giving.
Not all recipient countries, however, are organized to
take advantage of this spread of private aid. Another
obvious conclusion is that aid recipient countries
would do well to organize themselves to take advan-
tage of new forms of private aid. For example, in India,
MFIs must first obtain approval from the Reserve Bank
of India before they can borrow abroad — an obvious
barrier to accessing private loans from Kiva. Our find-
ings also suggest that the design of projects can be
fine-tuned to make them more attractive to donors.
To give an example: It is probably more effective to
invest in providing assistance to entrepreneurs to al-
low them to develop project ideas than to invest in
building the capacity of microfinance intermediaries.
Private lenders seem not to care too much about the
rating of these agencies.
The phenomenal growth of internet-based giving is
testimony to the potential for private aid to reach a
scale which can be significant in global terms. What
has not been shown is that organizing aid in this fash-
ion is more effective for development. A comparison
of development effectiveness between public and pri-
vate aid platforms is an important direction for future
research.

28 GLOBAL ECONOMY AND DEVELOPMENT PROGRAM
APPENDIX
The familiar Cox hazard model has the following famil-
iar specification:
h(t|X)i=h0 (t) e(Xβ)i)
where, for every loan i, t is the number of hours re-
quired to fully fund a loan request; X is the vector of
independent variables; and h0(t) is the baseline haz-
ard function, i.e., the hazard function for X = 0, with
unspecified form. The attached table reports results
from the basic Cox proportional-hazards regression,
where we include a number of project-specific covari-
ates.
Table A1 below also includes joint tests of propor-
tionality based on the absolute value of the summed
Schoenfeld residuals from the estimations, as recom-
mended by Therneau, Grambsch and Fleming (1990)
and Grambsch and Therneau (1994). This global test
is based on a non-proportionality assumption; test
statistics that exceed 5 percent critical values imply
that non-proportional hazards assumptions have
been violated. In column (1) we see no such evidence,
keeping in mind that functional-form type Grambsch-
Therneau tests of non-proportionality do not perform
well where there are nonlinearities (Keele 2010).
In columns (2) to (5) in table A1, then, we attempt to
test more directly a key assumption of the Cox model:
namely, that the proportionality of hazard rates is
maintained over analysis time. We therefore split the
sample according to survival-time quartiles; hazard
coefficients should remain stable if proportionality is
constant over time. These estimations, however, show
significant sign-switching. Grambsch-Therneau tests
for each time-quartile regression, moreover, do not
reject non-proportionality.

THE WISDOM OF CROWD-FUNDERS: WHAT MOTIVATES CROSS-BORDER PRIVATE DEVELOPMENT AID? 29
Table A1: Kiva Loan Funding Rates, Cox Hazard Estimates
(1) (2) (3) (4) (5)Full sample 1st quartile 2nd quartile 3rd quartile 4th quartile
Amount (Ln) -2.562***(0.036)
-0.665***(0.083)
-0.389***(0.097)
-1.460***(0.110)
-2.399***(0.106)
Amount2 (Ln) 0.138***(0.003)
0.023***(0.007)
0.015*(0.008)
0.096***(0.009)
0.132***(0.008)
Number of borrowers 0.000(0.001)
-0.009**(0.004)
-0.003(0.003)
-0.009***(0.002)
0.008***(0.002)
Female 0.454***(0.006)
0.060***(0.013)
0.096***(0.011)
0.151***(0.011)
0.410***(0.011)
Loan term (months) -0.026***(0.001)
-0.011***(0.002)
-0.001(0.001)
-0.006***(0.001)
-0.023***(0.001)
Concentration 0.853***(0.014)
1.250***(0.019)
0.010(0.029)
0.129***(0.032)
0.486***(0.041)
US share 0.426***(0.010)
0.006(0.018)
-0.071***(0.021)
0.098***(0.022)
0.202***(0.026)
MFI risk rating 0.007***(0.002)
0.002(0.005)
0.024***(0.004)
-0.031***(0.004)
0.012**(0.005)
Country dummies Yes Yes Yes Yes Yes
Sector dummies Yes Yes Yes Yes Yes
Month dummies Yes Yes Yes Yes Yes
Day dummies Yes Yes Yes Yes Yes
Hour dummies Yes Yes Yes Yes Yes
N 251,081 62,336 62,869 62,919 62,957
Ln(L) -2.793×10⁶ -6.198×10⁵ -6.298×10⁵ -6.302×10⁵ -6.232×10⁵
Grambsch-Therneau (p>χ2) (0.000) (0.000) (0.000) (0.000) (0.000)
Notes: Estimates are hazard coefficients obtained from Cox semi-parametric survival regressions. Standard errors are in pa-rentheses. Quartile regressions are by survival-time quartiles. Grambsch-Therneau tests are for a non-zero slope in a regres-sion of scaled Schoenfeld residuals on survival time; the null hypothesis is that hazard rates are proportional.*** Significant at the 1 percent level. ** Significant at the 5 percent level.* Significant at the 10 percent level.

30 GLOBAL ECONOMY AND DEVELOPMENT PROGRAM
REFERENCES
Andreoni, James and John Miller. 2002. “Giving
According to GARP: An Experimental Test of
the Consistency of Preferences for Altruism,”
Econometrica 70 (2): 737-753.
Ball, Stephen J. 2012. “Voting with dollars: philan-
thropy, money and education policy,” Pedagogy,
Culture, and Society 20 (3): 485 – 491.
Bermeo, Sarah and David Leblang. 2010. “Foreign
Interests: Immigration and the Political Economy
of Foreign Aid Allocation.” Mimeo. Available at:
http://fds.duke.edu/db?attachment-34--12483-
view-1200
Bonbright, David, Natalia Kiryttopoulou, and Lindsay
Iversen. 2008. Online Philanthropy Markets: From
'Feel-Good' Giving to Effective Social Investing?
London: Keystone.
Boschini, Anne and Anders Olofsgård. 2007. “Foreign
Aid: An Instrument for Fighting Communism?”
Journal of Development Studies 43: 622-648.
Box-Steffensmeier, Janet M., and Bradford S. Jones.
2004. Event History Modeling: A Guide for Social
Scientists. New York: Cambridge University.
Brennan, Geoffrey and Alan Hamlin, 1998. “Expressive
voting and electoral equilibrium,” Public Choice
95(1), 149-175.
Brooks, Arthur C. 2005. “Does Social Capital Make
You Generous?” Social Science Quarterly. 86:
1–15.
Brown, Eleanor and James M. Ferris. 2007. "Social
Capital and Philanthropy: An Analysis of the
Impact of Social Capital on Individual Giving and
Volunteering." Nonprofit and Voluntary Sector
Quarterly 36(1): 85-99.
Büthe, Tim, Solomon Major, and Andre de Mello e
Souza. Forthcoming. "The Politics of Private
Foreign Aid: Humanitarian Principles, Economic
Development Objectives, and Organizational
Interests in the Allocation of Private Aid by
NGOs." International Organization.
Chong, Alberto and Mark Gradstein. 2008. “What de-
termines foreign aid? The donors’ perspective.”
Journal of Development Economics 87 (1), 1-13.
Coyne, Christopher J., and Matt E. Ryan. 2009. “With
friends like these, who needs enemies? Aiding the
world’s worst dictators.” The Independent Review,
14(1), 26–44.
Deb, Rahul, Robert S. Gazzale, and Matthew A.
Kotchen. 2012. “Testing Motives for Charitable
Giving: A Revealed-Preference Methodology with
Experimental Evidence.” NBER Working Paper No.
w18029.
D'Espallier, Bert, Isabelle Guérin and Roy Mersland.
2009. “Women and Repayment in Microfinance.”
Mimeo. Avai lable at: http://www.microfi-
nancegateway.org/gm/document-1.9.40253/
Women%20and%20Repayment%20in%20
Microfinance.pdf
Desai, Raj M. and Homi Kharas. "Democratizing
Fo re i g n A i d : O n l i n e P h i l a n t h ro py a n d
International Development Assistance." New York
University Journal of International Law & Politics
42(4), 101-129.
Dollar, David and Victoria Levin. 2006. “The Increasing
Selectivity of Foreign Aid.” World Development
34(2): 2034-2046.

THE WISDOM OF CROWD-FUNDERS: WHAT MOTIVATES CROSS-BORDER PRIVATE DEVELOPMENT AID? 31
Easterly, William. 2005. “How to Assess the Needs for
Aid?” Paper for the 3rd AFD/EUDN Conference,
Paris: December 14, 2005.
Easterly, William. 2007. “Was development assistance
a mistake?” American Economic Review, 97(2),
328–332.
European Commission. 2005. Annual Report on the
European Community’s Development Policy
and External Assistance. Brussels: European
Commission.
Facchini, Giovanni and Anna M. Mayda. 2008.
“From Individual Attitudes Towards Migrants
to Migration Policy Outcomes: Theory and
Evidence.” Economic Policy 23 (56): 651-713.
Feddersen, Timothy, Sean Gailmard and Alvaro
Sandroni. 2009. “Moral bias in large elections:
Theory and experimental evidence.” American
Political Science Review, 103(2): 175-192.
Fleck, Robert K. and Christopher Kilby. 2001. “Foreign
Aid and Domestic Politics: Voting in Congress
and the Allocation of USAID Contracts Across
Congressional Districts.” Southern Economic
Journal 67 (3): 598-617.
Frot , Emmanuel and Jav ier Sant iso. 2008.
“Deve lopment A id and Por tfo l io Funds :
Trends, Volatility and Fragmentation,” OECD
Development Centre Working Papers 275, OECD.
Gartze, Erik. 2000. “Preferences and the Democratic
Peace.” International Studies Quarterly 44 (2):
191-212.
Giving USA. 2012. Annual Report on Philanthropy.
Chicago, IL: Giving USA Foundation.
Grambsch, Patricia M., and Terry M. Therneau. 1994.
“Proportional hazards tests and diagnostics
based on weighted residuals.” Biometrika 81:
515–526.
Hartley, Thomas and Bruce Russett. 1992. “Public
Opinion and the Common Defense: Who Governs
Mil itary Spending in the United States?”
American Political Science Review 86 (4).
Hill, Kim Quaile. 1998. “The policy agenda of the presi-
dent and the mass public: A research validation
and extension.” American Journal of Political
Science 42: 1328-1334.
Hout, Wil. 2007. The Politics of Aid Selectivity: Good
Governance Criteria in World Bank, US and Dutch
Development Assistance. Abingdon: Routledge.
Hudson Inst i tute. 2012. The Index of Global
Philanthropy and Remittances. Center for Global
Prosperity. Washington DC.
InterMedia. 2012. Building Support for International
Development.
Karlan, Dean and John A. List. 2007. “Does Price
Matter in Charitable Giving? Evidence from a
Large-Scale Natural Field Experiment.” The
American Economic Review 97 (5): 1774-1793.
Keele, Luke. 2010. “Proportionally Difficult: Testing for
Nonproportional Hazards in Cox Models.” Political
Analysis, 18: 189–205.
Kono, Daniel. 2008. “Does Public Opinion Affect Trade
Policy?” Business and Politics 10 (2): 1224-1226.
Kosfeld, Michael. 2008. “Brain Trust.” Greater Good
Magazine 5(2). UC Berkeley.

32 GLOBAL ECONOMY AND DEVELOPMENT PROGRAM
Leblang, David. 2010. “Familiarity Breeds Investment:
Diaspora Networks and International Investment.”
American Political Science Review, 104(3): 584-
600.
Lumsdaine, David H. 1993. Moral Vision in International
Politics: The Foreign Aid Regime, 1949-1989.
Princeton, New Jersey: Princeton University
Press.
Mansfield, Edward and Diana Mutz. 2009. “Support for
Free Trade: Self-Interest, Sociotropic Politics, and
Out-Group Anxiety.” International Organization
63 (3): 425-457.
McGillivray, Mark. 2003. “Aid Effectiveness and
Selectivity: Integrating Multiple Objectives in Aid
Allocations.” DAC Journal, 4 (3): 23-36.
Milner, Helen and Dustin Tingley. 2010. “The
Political Economy of U.S. Foreign Aid: American
Legislators and the Domestic Politics of Aid”
Economics and Politics 20 (2): 200-232.
Moll, Jorge, Frank Krueger, Roland Zahn, Matteo
Pardini, Ricardo de Oliveira-Souza, and Jordan
Grafman. 2006. “Human Fronto–mesolimbic
Networks Guide Decisions About Charitable
Donation.” Proceedings of the National Academy
of Science 103(42): 15623-15628.
Nelson, Christopher P., Paul C. Lambert, Iain B. Squire
and David R. Jones. 2007. "Flexible parametric
models for relative survival, with application in
coronary heart disease." Statistics in Medicine
26(30): 5486-5498.
Null, Clair. 2011. “Warm Glow, Information, and
Inefficient Charitable Giving.” Journal of Public
Economics 95: 455-465.
OECD. 2003. “Geographical Distribution of Financial
Flows to Developing Countries.”
Ordanini, Andrea, Lucia Miceli, Marta Pizzetti,
A . Parasuraman . 201 1 . "Crowd- fund ing :
Transforming Customers into Investors through
Innovative Service Platforms." Journal of Service
Management, 22 (4): 443 – 470.
PIPA. 2001. “Americans on Foreign Aid and World
Hunger: A Study of U.S. Public Attitudes.” College
Park, MD: Program on International Policy
Attitudes.
Raghuram, Shobha. 2009. “Pro-Poor Development
in Crisis: Combating Economic Recession and
Market Fundamentalism.” Development 52:
349–355.
Riddell, Roger. 2007. Does Foreign Aid Really Work?
Oxford University Press.
Roodman, David. 2006. “Tax Policies to Promote
Private Charitable Giving in DAC Countries.”
Working Paper No. 82. Washington: Center for
Global Development.
Rosenberg, Richard, Adrian Gonzalez, and Sushma
Narain. 2009. “The New Moneylenders: Are
the Poor Being Exploited by High Microcredit
Interest Rates?” CGAP Occasional Paper No. 15.
Washington: CGAP.
Royston, Patrick. 2001. “Flexible parametric alterna-
tives to the Cox model.” Stata Journal 1(1): 1–28.
Royston, Patrick and Mahesh K. B. Parmar. 2002.
“Flexible Parametric-Hazards and Proportional
Odds Models for Censored Survival Data,
with Application to Prognostic Modeling and

THE WISDOM OF CROWD-FUNDERS: WHAT MOTIVATES CROSS-BORDER PRIVATE DEVELOPMENT AID? 33
Estimation of Treatment Effects.” Statistics in
Medicine 21: 2175–2197.
Sachs, Jeffrey D. 2009. “Recession Watch: Boost the
developing world.” Nature 457: 958.
Shang, Jen and Rachel Croson. 2006. “The Impact of
Social Comparisons on Nonprofit Fundraising.”
Research in Experimental Economics Series 11:
143-156.
Sobel, Richard. 2001. The Impact of Public Opinion on
US Foreign Policy since Vietnam: Constraining
the Colossus. Ithaca, New York: Oxford University
Press.
Strezhnev, Anton and Erik Voeten. 2012. “United
Nations General Assembly Voting Data,” http://
hdl.handle.net/1902.1/12379 UNF:5:fWzDBiI
+iY41v5zJF3JnoQ== Erik Voeten [Distributor] V4
[Version].
Therneau, Terry. M., Patricia M. Grambsch, and
Thomas R. Fleming. 1990. “Martingale based
residuals for survival models.” Biometrika 77:
147–160.
Tingley, Dustin. 2007. Preferences over foreign aid
funding: Survey evidence from Norway. Working
paper. Princeton University.
Tingley, Dustin. 2009. “Donors and Domestic Politics:
Political and Economic Influences on Foreign
Aid.” The Quarterly Review of Economics and
Finance 50 (1), 40-49.
Vesterlund, L. 2006. “Why do people give”, in W.
Powell and R.S. Steinberg, eds., The Nonprofit
Sector: A Research Handbook, 2nd Edition, New
Haven, CT: Yale University.
Waters, Richard D. 2007. “Nonprofit organizations'
use of the internet: A content analysis of com-
munication trends on the internet sites of the
philanthropy 400,” Nonprofit Leadership and
Management 18 (1): 59 – 76.
Wlezien, Christopher. 1995. “The Public as Thermostat:
Dynamics of Preferences for Spending.” American
Journal of Political Science 39 (4): 981-1000.
World Bank. 2003. IDA’s Performance-Based
Allocation System: Current and Emerging Issues.
Washington DC.

34 GLOBAL ECONOMY AND DEVELOPMENT PROGRAM
ENDNOTES1. This section is adapted from introductory para-
graphs in Desai and Kharas (2010).
2. There is considerable evidence of “psychic” re-
wards to charitable giving. Experiments, for ex-
ample, show that charitable donations trigger ac-
tivity in brain regions related to social attachment
and bonding in other species (Moll et al. 2006).
Kosfeld (2008) emphasizes that trust in other hu-
mans is a biologically-based part of human nature
and, in particular, that oxytocin, a hormone that
reduces social anxiety, is also linked with a greater
degree of trust that good behavior will be recip-
rocated. One survey of members of service-based
social clubs (Rotary, Kiwanis and Lions Clubs)
finds that, when faced with multiple charities to
support and uncertainty over the social value of
one's gift, “warm-glow” utility determines the al-
location of gifts (Null 2011).
3. Micro-entrepreneurs who request loans for proj-
ects may already have had funds disbursed by
MFIs. In reality, then, Kiva’s micro-lenders are ac-
tually financing previously-disbursed MFI loans
rather than lending directly to micro-entrepre-
neurs. Kiva had been criticized for not making
this “indirect” aspect of their lending operations
explicit.
4. Since 2011, Kiva has lent up to $10,000 to poten-
tial micro-entrepreneurs in the United States. Our
data on Kiva projects, which ends in December
2010, does not include any US-based projects.
5. The World Bank conducts an annual performance
assessment for its borrowing countries, known as
the Country Policy and Institutional Assessment
(CPIA), which scores a country’s present policy
and institutional framework for fostering poverty
reduction, sustainable growth and the effective
use of development assistance. It includes 20
equally weighted criteria which are grouped in
four clusters: economic management; structural
policies; policies for social inclusion and equity;
and public sector management and institutions
(the “governance” cluster).
6. The Kiva website states that a “5-Star Field Part-
ner is a highly established micro-lending institu-
tion with a proven track record, audited financials
and high ratings from independent evaluators. In
contrast, a 1-Star Field Partner is usually young
and unproven—but with the potential to reach
entrepreneurs not reached by more established
Field Partners.” The ratings are assigned based
on audits, credit ratings, independent evaluations,
estimations of existing portfolio risk, Kiva repay-
ment performance and the age of the MFI (among
other factors).
7. More importantly, the Royston-Parmar approach
provides a superior fit compared to parametric
alternatives. Likelihood ratio tests for all specifi-
cations in table 3 show that the improvement in
fit is greater when compared to the Weibull model
(p < 0.001).
8. The following criteria must be met for an event to
be coded as a natural disaster: The disaster must
occur as a result of a natural occurrence; 10 or
more people must be reported killed; at least 100
must be affected; a state of emergency must be
declared; and the country must call for interna-
tional assistance. In our estimations, the impact
of natural disasters is measured as Ln(1 + n),
where n = number of persons affected.
9. Many donors have incorporated “good gover-
nance” indicators, such as control of corruption
and performance of public-sector institutions,
into their allocation decisions starting in the
1990s. For the US Millennium Challenge Corpora-
tion, for example, meeting governance thresholds
is a requirement for countries seeking assistance.
The World Bank’s zero-interest lender, the Inter-
national Development Agency (IDA), explicitly

THE WISDOM OF CROWD-FUNDERS: WHAT MOTIVATES CROSS-BORDER PRIVATE DEVELOPMENT AID? 35
incorporates both poverty and institutional qual-
ity in its “performance-based allocation” formula
to distribute IDA funds among eligible countries
(World Bank 2003).
10. Gartze (2000), for example, notes that an addi-
tional advantage of an affinity index based on UN
voting is that it contains more information than
data on alliances, which change infrequently and
have been generally fixed for much of the post-
World War II period. By contrast, hundreds of res-
olutions appear in each session of the UN General
Assembly. The affinity score is calculated as S = 1 –
(3xd)/dmax
, where d is the sum of metric distances
between votes by the US and by any particular aid
recipient in a given year, and dmax
is the largest
possible metric distance for those votes, based
on the following coding: 1 = “yes” or approval; 2 =
abstain; and 3 = “no” or disapproval for an issue
or resolution. Resulting values for the US affinity
score range from –1 (least similar interests) to +1
(most similar interests). UN voting data are from
Strezhnev and Voeten (2012).
11. Leblang and Bermeo (2010), for example, find
that while larger numbers of immigrants from aid
recipients in donor countries increase aid from
donor to recipient, larger numbers of refugees
have the opposite effect.
12. This and subsequent paragraphs are adapted
from concluding paragraphs in Desai and Kharas
(2010).

The views expressed in this working paper do not necessarily reflect the official position of Brookings, its board or the advisory council members.
© 2013 The Brookings Institution
ISSN: 1939-9383

1775 Massachusetts Avenue, NW Washington, DC 20036 202-797-6000 www.brookings.edu/global