from citizen data to wisdom of the crowd
TRANSCRIPT

From citizen data to wisdom
of the Crowd Decentralised Citizens ENgagement Technologies Specific Targeted Research Project Collective Awareness Platforms

FP7 – CAPS - 2013 D-CENT D2.4 Data Visualisation:
From Citizen Data to Wisdom of the Crowd
Page 2 of 43
Contents
Executive Summary .................................................................................................................................................... 3
1. Decide Madrid .................................................................................................................................................... 4
1.1 Debates ....................................................................................................................................................... 4
1.2 Proposals .................................................................................................................................................... 5
DemIC .................................................................................................................................................................. 8 2.
2.1 BetaDemIC - Data Analysis working line ........................................................................................... 9
Open Source Technologies ........................................................................................................................... 12 3.
3.1 Kibana ........................................................................................................................................................ 12
3.2 D3.js ........................................................................................................................................................... 13
3.3 Sigma.js ...................................................................................................................................................... 14
Results ................................................................................................................................................................ 15 4.
4.1 Case Study: Diffusion Campaigns ....................................................................................................... 15
4.2 Research Task: Community Structure .............................................................................................. 21
4.2.1 Network of users .......................................................................................................................... 21
4.2.2 Network of tags ............................................................................................................................ 23
4.3 Research Task: Proposals Lifecycle .................................................................................................... 25
4.4 Research Task: Users Lifecycle ........................................................................................................... 29
4.5 Research Task: Modelling of Debates ............................................................................................... 33
Conclusions ....................................................................................................................................................... 40 5.
References ......................................................................................................................................................... 42 6.

FP7 – CAPS - 2013 D-CENT D2.4 Data Visualisation:
From Citizen Data to Wisdom of the Crowd
Page 3 of 43
Executive Summary
In this document we present the work of data visualisation performed on the Decide
Madrid platform. This platform was launched on September 2015 by the Madrid City
Council for open citizen decision-making.
In the first section we explain the functionalities of Decide Madrid and the political
framework of the Area of Citizen Participation, Transparency and Open Government ruled
by the Madrid City Council. The second section describes the BetaDemic research network
and the collaboration established with the D-CENT project that defined the data
visualisation tasks of this work. These tasks were devised to monitor usage patterns, guide
the development of the platform and enhance user experience in order to foster citizen
participation. In the third section we describe the open source technologies and the
analytical methods that have been employed. Results are presented in the fourth section and
organised in 5 parts:
The impact of the diffusion campaigns
The community structure of Decide Madrid
The proposals’ lifecycle
The users’ lifecycle
The modelling of online debates
The outcome of this work is useful in different ways. First, the results of the data
visualisation were used to inform the development of the platform, as well as the
assessment of the political participation process. On the other hand, the visualisations offer
an intuitive way to explore data, and can be added to the platform to provide the end-users
with a richer experience, and a higher awareness of the status of the community. We
strongly believe that our results should motivate the integration of these capabilities in
platforms for digital participation in order to turn citizen data into the wisdom of the crowd.

FP7 – CAPS - 2013 D-CENT D2.4 Data Visualisation:
From Citizen Data to Wisdom of the Crowd
Page 4 of 43
1. Decide Madrid
In September 2015 the new City Council of Madrid, led by the emerging grassroots party Ahora
Madrid, launched Decide Madrid, a website for citizen participationi. This web, under the motto “La
ciudad que quieres será la ciudad que quieras”ii is integrated into the new Open Government Portal of
Madrid (see Figure 1). The portal consists of the following sections:
Participation (Decide Madrid): A space to discuss and decide the city model (debates,
citizen proposals, participatory budgets, collaborative laws, etc.).
Transparency (upcoming): A space to review data related to the City Council
management (name and salary of the Mayor and councillors, government plans, contracts,
public agenda, etc.) and to request access to additional information.
Open Data (upcoming): Open access to databases owned by the City Council of Madrid.
Decide Madrid is based on Consul, an application software under an open source AGPLv3 licenseiii.
The code of Consul is maintained in the GitHub repositoryiv of the City Council. In this study we
have analysed the two functionalities of Decide Madrid: debates and citizen proposals.
Figure 1: Screenshot of the Open Government Portal of Madrid
1.1 Debates
Debates have been conceived to let any user open and participate in any discussion on any topic.
Debates are presented as separated threads and users can discuss among themselves by commenting
the initial post or the nested comments. Both posts and comments are also positively/negatively
voted by other users. These votes and the corresponding scores are stored to serve as input of the
sorting algorithm for debates and comments. The user accounts of the City Council politicians are
highlighted to boost their participation in public discussions and to establish a direct communication
between citizens and representatives. Figure 2 shows the first debate on Decide Madrid published by

FP7 – CAPS - 2013 D-CENT D2.4 Data Visualisation:
From Citizen Data to Wisdom of the Crowd
Page 5 of 43
Pablo Soto, councillor of the Area of Citizen Participation and Transparency and responsible of the
platform.
Figure 2: Screenshot of the first debate on Decide Madrid
(Source: https://decide.madrid.es/debates/3)
1.2 Proposals
Proposals have been designed to allow citizens to publish petitions, receive support from other
citizens and then force a public voting of the entire population of Madrid. Citizen proposals are
regulated in Madrid since September 2015v and the process follows these steps:
1. Generation: A user publishes a proposal.
2. Support: Users from Madrid are able to sign the proposal by clicking the corresponding
“Support” button. In order to verify that proposals are only signed by users who truly
belong to Madrid, users interested in supporting proposals have to complete the census
verification form in their account settings (see Figure 4). To advance to the next step,
proposals must be approved by more than 53,760 supporters (2% of Madrilenian citizens

FP7 – CAPS - 2013 D-CENT D2.4 Data Visualisation:
From Citizen Data to Wisdom of the Crowd
Page 6 of 43
older than 16). Also, proposals can be commented and comments can be voted following
the same structure of debates, as showed in Figure 2.
3. Decision: Once a proposal receives the required number of supporting citizens, it gets
announced on the web portal to increase its visibility among citizens. After 45 days the
proposal is moved to a specific voting area of the web in order to be approved or rejected
by verified users.
4. Making: If the proposal gets approved in the previous step, the Government of the Madrid
must accept the decision and execute it. To this end, the Government will produce technical
reports on its legality, feasibility and cost, taking into account the affected sectors. All
reports will be published to ensure the proper development of the proposal.
Every action of the above process can be performed both online (through the web portal) and offline (in the Citizen Support Offices of Madridvi).
Figure 3: Promotional Banner of the Proposals section

FP7 – CAPS - 2013 D-CENT D2.4 Data Visualisation:
From Citizen Data to Wisdom of the Crowd
Page 7 of 43
Figure 4: Census verification form

FP7 – CAPS - 2013 D-CENT D2.4 Data Visualisation:
From Citizen Data to Wisdom of the Crowd
Page 8 of 43
DemIC 2.
The project Decide Madrid is developed and maintained by the City Council of Madrid through the
Area of Citizen Participation, Transparency and Open Government. In parallel, DemIC (Lab of
Collective Intelligence for Democracy)vii, an interdisciplinary lab focused on the study, development
and promotion of digital citizen processes, was launched. The objective of this lab is to explore and
define models of direct and deliberative democracy to be implemented on Decide Madrid. At the
initial stage, DemIC invited researchers from a diverse range of disciplines to run BetaDemIC, a
research network whose organization and activities rely on:
Weekly working sessions in October-November 2015.
A dissemination open event in December 2015viii.
Collaborative online tools (mailing lists, pads and Kanban tools).
Medialab Pradoix in Madrid was the venue of the working sessions and the dissemination event. In
the first session, participants first defined and debated the key concepts described in Table 1.
Concept Definition(s)
Deliberative democracy
The non-specialization of decision-making through digital
processes
The ability to develop citizen proposals.
Boost collective thinking since collective thinking leads to
collective action.
Model of governance whose legitimacy emerges from the
commitment of the participants with principles and values
related to democracy.
Democratic model of decision-making capable of modify
individual preferences to build new preferences and
identities.
Crowdsourcing
The possibility of bringing together both data and
information that becomes relevant regarding the complexity
of the process.
Collective Intelligence
A collective and diverse system with larger potential than
the sum of the individual elements.
The establishment of Common Sense as an entity of the sum
of individual preferences that can be built collectively.
Collaborative creation of intellectual work.
Cooperation brings community.

FP7 – CAPS - 2013 D-CENT D2.4 Data Visualisation:
From Citizen Data to Wisdom of the Crowd
Page 9 of 43
Collaborative development
The work is not sequential since any agent can participate in
any phase.
Table 1: Core concepts discussed and defined in the 1st working session of DemIC.
Then participants elaborated a list of expectations for the following BetaDemIC working sessions in
order to provide feedback into the development of Decide Madrid. The addressing of these
expectations motivated the composition of three working lines: (1) Political Framework, (2)
Communication, and (3) Data Analysis. These three working lines were not designed to partition
BetaDemIC but to build sub-groups that perform specific tasks on these three fields. Furthermore,
the outcome of each working line was discussed in the general working sessions to generate
synergies among them. Below we present the results of the Data Analysis working line that were
obtained through the analytical and visualisation capabilities of the D-CENT project.
Figure 5: Working session of BetaDemIC
2.1 BetaDemIC - Data Analysis working line
The Data Analysis working line is a research group that applies rigorous science to the analysis of
Decide Madrid. The group is formed by Alberto Abellán (Oxfam Intermón), Miguel Aguilera
(Universidad de Zaragoza), Pedro Álvarez (DemIC), Pablo Aragón (Eurecat, Universitat Pompeu
Fabra), Miguel Arana (City Council of Madrid), Alejandra Baciero (DemIC), Yago Bermejo (DemIC),

FP7 – CAPS - 2013 D-CENT D2.4 Data Visualisation:
From Citizen Data to Wisdom of the Crowd
Page 10 of 43
Enrique García (City Council of Madrid), Tomás Gómez (Universidad de Zaragoza) and David
Ruescas (Agora Voting).
The philosophy of the group is inspired by the Growth Hacking Process (Patel & Taylor, 2014) which
is composed of the following steps:
1. Definition of actionable goals
2. Implementation of analytics to track the goals
3. Exploitation of the existing strengths
4. Execution of the experiment
5. Optimization of the experiment
6. Repetition (go to 1st step)
Figure 6: The Growth Process
(Source: http://growthority.com/)
FP7 – CAPS - 2013 D-CENT D2.4 Data Visualisation:
From Citizen Data to Wisdom of the Crowd
Page 11 of 43
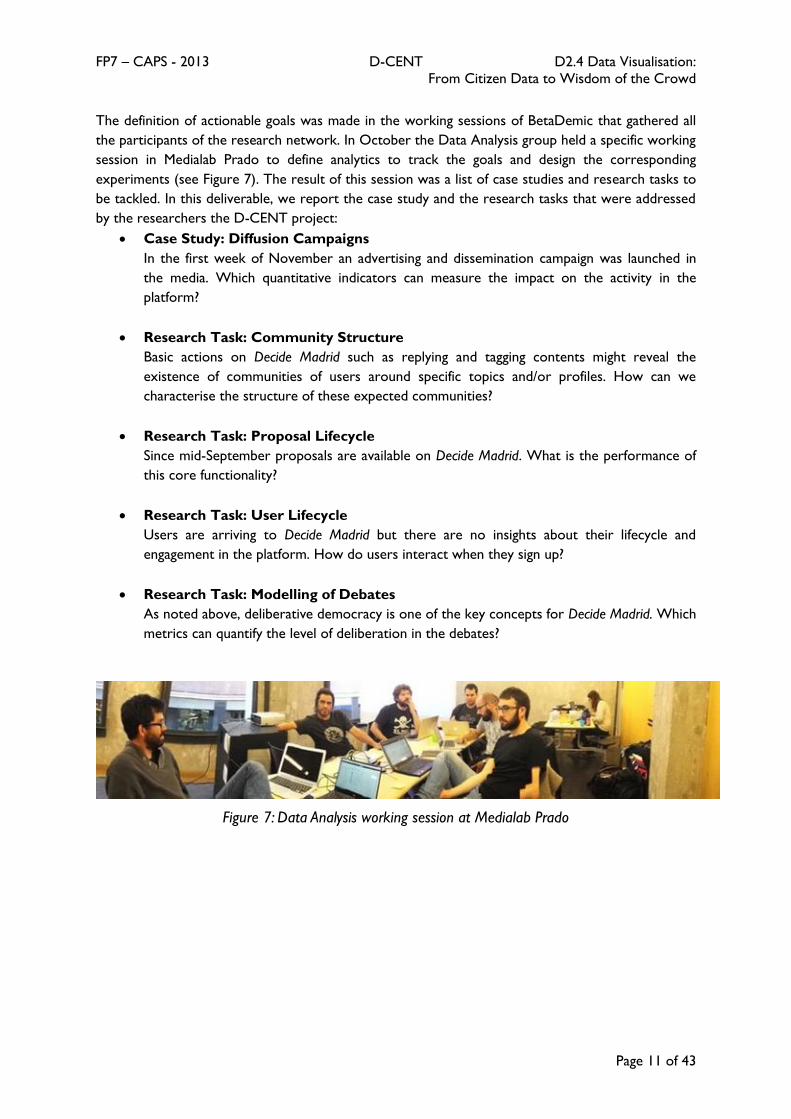
The definition of actionable goals was made in the working sessions of BetaDemic that gathered all
the participants of the research network. In October the Data Analysis group held a specific working
session in Medialab Prado to define analytics to track the goals and design the corresponding
experiments (see Figure 7). The result of this session was a list of case studies and research tasks to
be tackled. In this deliverable, we report the case study and the research tasks that were addressed
by the researchers the D-CENT project:
Case Study: Diffusion Campaigns
In the first week of November an advertising and dissemination campaign was launched in
the media. Which quantitative indicators can measure the impact on the activity in the
platform?
Research Task: Community Structure
Basic actions on Decide Madrid such as replying and tagging contents might reveal the
existence of communities of users around specific topics and/or profiles. How can we
characterise the structure of these expected communities?
Research Task: Proposal Lifecycle
Since mid-September proposals are available on Decide Madrid. What is the performance of
this core functionality?
Research Task: User Lifecycle
Users are arriving to Decide Madrid but there are no insights about their lifecycle and
engagement in the platform. How do users interact when they sign up?
Research Task: Modelling of Debates
As noted above, deliberative democracy is one of the key concepts for Decide Madrid. Which
metrics can quantify the level of deliberation in the debates?
Figure 7: Data Analysis working session at Medialab Prado

FP7 – CAPS - 2013 D-CENT D2.4 Data Visualisation:
From Citizen Data to Wisdom of the Crowd
Page 12 of 43
Open Source Technologies 3.
In this section we describe the data visualisation open technologies used in this study to present the
results of the analysis of Decide Madrid.
3.1 Kibana
Kibana is an open source platform for analytics and data visualisationx. In Kibana users are able to
seek, visualize, and interact with data stored in Elasticsearchxi, a highly scalable open-source full-text
search engine. Elasticsearch is implemented as web wrapper of Lucene, a free and open-source
information retrieval Java software library. In Lucene the information is stored in documents which
are the basic units of information. A document is represented as a record of fields such as the text,
the author or the timestamp. In our study, we identified 4 types of documents: proposals, comments
in proposals, debates (initial post), and comments in debates. The fields of these 4 types of
documents are detailed in Table 2.
Field Type Description
comments_count long Number of received comments
depth long Depth in the discussion tree (e.g. debates=0, proposals=0, comments >= 1)
id string (raw) Identifier
in_reply_to_id string (raw) If comment, identifier of the document is being replied to
in_reply_to_user string (raw) If comment, author of the document is being replied to
message string Text of the message
supports_total_count long If proposal, number of supporting users
supports_total_percentage double If proposal, percentage of supporting users
tags string (raw) If debate or proposal, tags
thread_id string (raw) URL of the proposal/debate
title string If proposal or debate, title
ts date Timestamp
type string (raw) proposal, proposal_comment, debate, debate_comment
user string (raw) Name of the autor
votes_against_count long If debate or comment, number of negative votes
votes_against_percentage double If debate or comment, percentage of negative votes
votes_favor_count long If debate or comment, number of positive votes
votes_favor_percentage long If debate or comment, percentage of positive votes
votes_total_count long If debate or comment, number of votes
Table 2: Fields of the Elasticsearch index

FP7 – CAPS - 2013 D-CENT D2.4 Data Visualisation:
From Citizen Data to Wisdom of the Crowd
Page 13 of 43
Once the index was defined, a web scraper populated an Elasticsearch index with the debates,
proposals and comments from Decide Madrid. The idea of applying Kibana is to create and share
dynamic dashboards that contain the metrics defined by the Data Analysis working line.
Dashboards, like the one showed in Figure 8, consist of the aggregation of pre-defined visualisations
of these analyses. In Kibana the available options for data visualisation are the followingxii:
Area chart: Total contribution of several different series.
Data table: Raw data of a composed aggregation.
Line chart: Comparison of different series.
Markdown widget: Free-form information or instructions about the dashboard.
Metric: Single number on the dashboard.
Pie chart: Each source’s contribution to a total.
Tile map: Results of an aggregation with geographic points.
Vertical bar chart: General-purpose chart.
Figure 8: Example of a Kibana dashboard.
(Source: https://www.elastic.co)
3.2 D3.js
D3.js is one of the most popular open source JavaScript libraries for data visualisation. This library,
created by Mike Bostock (former graphics editor for The New York Times), enables to bind data to
a Document Object Model (DOM) in order to apply data-driven transformations. The GitHub
repository includes a Reference Guide of the APIxiii organized in the following sections:
Core: Selections, transitions, data, localization, colours, etc.
Scales: Convert between data and visual encodings.

FP7 – CAPS - 2013 D-CENT D2.4 Data Visualisation:
From Citizen Data to Wisdom of the Crowd
Page 14 of 43
SVG: Utilities for creating Scalable Vector Graphics.
Time: Format times, compute calendar intervals, etc.
Layouts: Derive secondary data for positioning elements.
Geography: Project spherical coordinates, latitude & longitude math.
Geometry: Utilities for 2D geometry, such as Voronoi diagrams and quadtrees.
Behaviors: Reusable interaction behaviours.
D3.js is designed to optimize the manipulation of documents based on data through well-known web
standards such as HTML, SVG, and CSS. Therefore, any user with knowledge of these standards is
capable to easily reuse code from the gallery of data visualisationsxiv. In our study, we relied on the
existing model of Collapsible Force Layout (see Figure 9) to visualize discussion trees.
Figure 9: Collapsible Force Layout
(Source http://mbostock.GitHub.io/d3/talk/20111116/force-collapsible.html)
3.3 Sigma.js
Sigma.js is a JavaScript library for network visualisation developed by Alexis Jacomy and Guillaume
Plique from the Médialab at Sciences Poxv. This institution is also responsible of Gephi, the most
popular open source desktop platform for network exploration and visualisationxvi. Sigma.js,
following the typical extendability of Gephi, bases its design on a customizable engine to develop
interactive web applications. The open source code is published in a GitHub repository that
describes the main functionalities of this library:
Custom rendering: Canvas or WebGL built-in renderers, or any renderer to provide.
Interactivity: Methods to catch events (e.g. user clicks, mouse rolls over nodes).
Graph model: Capability to include algorithms for graph analysis.
Compatibility: Support with all modern browsers that support Canvas, and works faster
on browser with WebGL support.

FP7 – CAPS - 2013 D-CENT D2.4 Data Visualisation:
From Citizen Data to Wisdom of the Crowd
Page 15 of 43
Basic network web visualisations could be done both in Sigma and D3.js. However, we should note
that Gephi includes a plugin that exports networks to a predefined Sigma.js template. In other
words, users without Javascript/HTML/CSS knowledge can easily exploit this plugin to generate
explorative network visualisations in Sigma.js. Figure 10 shows an example of a network visualised
through the Sigma Exporter.
Figure 10: Network visualisation with Sigma.js exporter
(Source: http://blogs.oii.ox.ac.uk/vis/visualisation-demos/)
Results 4.
In this section we present the results through the proposed data visualisation technologies.
4.1 Case Study: Diffusion Campaigns
The first case study focused on the impact of City Council’s diffusion campaigns to promote Decide
Madrid. We first explored the daily activity from the platform launch day (September 7, 2015). We
built a Kibana area chart taking the timestamp as the X-axis and the number of publications (posts in
debates, proposals and comments in debates/proposals) as the Y-Axis (see Figure 12). We first
observe two remarkable peaks of activity on the launch day and on September 14, the date when
proposals were launched on Decide Madrid (in the first week only debates were available). Then
activity stabilized around 500 daily publications until the beginning of November. In early November
the City Council started a new diffusion campaign by sending informative emails to citizens and by
placing banners and leaflets in public buildings (see Figure 11). The next peaks of activity happened
from November 12 when some councillors and Manuela Carmena (Mayor of Madrid) opened new
debates to dialogue with the community of Decide Madrid. To better understand all these peaks we
then split the area of the chart according to the 4 types of publications and obtained the graph
showed in Figure 13. As we expected, the first peak was related to debates while next peaks were

FP7 – CAPS - 2013 D-CENT D2.4 Data Visualisation:
From Citizen Data to Wisdom of the Crowd
Page 16 of 43
mostly related to proposals. Indeed, activity around debates fell once proposals appeared. Only
activity around debates took relevance when Manuela Carmena and some councillors started
debates. These observations are also visible in Figure 14 that shows the percentage of daily
publications by type, instead of the absolute count. As an alternative, Figure 15 shows the same
distribution of Figure 12 but the chart is split into 4 sub-charts (one per type) to easily distinguish
and compare the activity of the different types of publications.
Figure 11: Tweets reporting the diffusion campaign of Decide Madrid
(Sources: https://twitter.com/AliencitoB/status/666934441709842432
https://twitter.com/AhoraMadrid/status/663331136412758016 )

FP7 – CAPS - 2013 D-CENT D2.4 Data Visualisation:
From Citizen Data to Wisdom of the Crowd
Page 17 of 43
Figure 12: Daily publications on Decide Madrid

FP7 – CAPS - 2013 D-CENT D2.4 Data Visualisation:
From Citizen Data to Wisdom of the Crowd
Page 18 of 43
Figure 13: Daily publications on Decide Madrid splitting the area by type (debates, proposals and comments)

FP7 – CAPS - 2013 D-CENT D2.4 Data Visualisation:
From Citizen Data to Wisdom of the Crowd
Page 19 of 43
Figure 14: Percentage of daily publications on Decide Madrid splitting the area by type (debates, proposals and comments)

FP7 – CAPS - 2013 D-CENT D2.4 Data Visualisation:
From Citizen Data to Wisdom of the Crowd
Page 20 of 43
Figure 15: Daily publications on Decide Madrid splitting the chart by type (debates, proposals and comments)

FP7 – CAPS - 2013 D-CENT D2.4 Data Visualisation:
From Citizen Data to Wisdom of the Crowd
Page 21 of 43
4.2 Research Task: Community Structure
To analyse the community structure of Decide Madrid, we focused on two different types of
networks: network of users and network of tags.
4.2.1 Network of users
The Elasticsearch index stored all the comments to debates/proposals including the author of the
comment and the author of the post/debate/comment that is being replied to. From this collection
of comments, we built a directed weighted graph comprising a set of 8 916 nodes (users) and a set
of 29 638 edges (replies between users).
The network was loaded to Gephi to calculate the most relevant nodes according to PageRank
(Page, Brin, Motwani, & Winograd, 1999) and to set the size of each node according to its PageRank
value. Colours were assigned in accordance with the communities detected through the Louvain
method (Blondel, Guillaume, Lambiotte, & Lefebvre, 2008), a community detection algorithm based
on the optimization of the modularity of the network. The Louvain Method detected 165
communities and optimized the modularity value to 0.48. Since many communities are formed by
just a few isolated nodes, we only focused on the 8 largest communities (5 439 nodes in total).
Finally we applied the Force Atlas 2 layout algorithm (Jacomy, Heymann, Venturini, & Bastian) to
enforce the cluster drawingxvii.
After this process, we exported the network to a Sigma.js explorative visualisation (see Figure 16).
The first observation of the network revealed that Force Atlas 2 was not able to partition the
network into clearly separated communities. Although cyberbalkanization is a common pattern of
online social networks (Sunstein, 2009), the network visualisation of Decide Madrid does not show a
strong user preference to interact with members of the same community.
The only community located far of the main component of the network by Force Atlas 2 is the one
around Zatchxviii. Zatch is the author “Monumento a roto2 en la puerta del sol”xix, a debate to
dedicate a monument to ROTO2 in the main square of Madrid. This debate could be understood as
“trolling”, a goliardic action aimed at generating noise in the platform. Indeed, ROTO2 is the pet of
the Spanish online forum Forocoches, a community accustomed to this kind of actionsxx. This debate
obtained more than 350 comments by active members of Forocoches. However, these users did not
comment in other debates, which explains this peripherality of this “trolling” community in the
structure of Decide Madrid.

FP7 – CAPS - 2013 D-CENT D2.4 Data Visualisation:
From Citizen Data to Wisdom of the Crowd
Page 22 of 43
Figure 16: Network of users with Sigma.js

FP7 – CAPS - 2013 D-CENT D2.4 Data Visualisation:
From Citizen Data to Wisdom of the Crowd
Page 23 of 43
4.2.2 Network of tags
The proposals and debates stored in the Elasticsearch index also include the tags established by the
authors. From this collection, we built an undirected weighted graph comprising a set of 1 709 nodes
(tags) and a set of 2 954 edges (concurrencies of tags in a debate/proposal). The network was also
loaded into Gephi and we applied again PageRank and the Louvain method which detected 222
communities and optimized the modularity value to 0.314. Because the network of tags is much
denser than the network of users, we only kept the innermost nodes of the network: those whose
k-index (Seidman, 1983) was greater than or equal to 25 (36 nodes). In simple words, this means
that we only keep a core of nodes that are well-connected to each other, more specifically a set of
nodes in which each node is connected to at least 25 of the other nodes. A detailed description of
the k-decomposition is available at D-CENT deliverable D2.3 (Aragón, et al., 2015).
Figure 17 shows the Sigma.js visualisation of the network of tags after applying the Force Atlas 2
layout. The exploration of the network shows that most top tags are connected; that is to say for
any pair of relevant tags there is at least one debate/proposal that includes both tags. However,
according to the Louvain Method, tags are partitioned into 3 network communities:
Green nodes movilidad, medio ambiente, sostenibilidad, centro, salud, deportes,
seguridad y emergencias, latina,xxi
Red nodes cultura, derechos sociales, economía, participación, empleo, equidad,
medios, transparencia, asociaciones,xxii
Blue nodes arganzuela, retiro, carabanchel, puente de vallecas, salamanca, villa
de vallecas, usera, chamberí, fuencarral-el pardo, san blas-canillejas,
ciudad lineal, moncloa-aravaca, tetuán, villaverde, barajas, chamartín,
hortaleza, vicálvaro, moratalaz.
Since:
1. green nodes are mainly tags related to mobility, environment and health,
2. red nodes are mainly tags related to civil rights and social services,
3. blue nodes are neighbourhoods of Madrid,
We observe that the partition of nodes of the network visualisation reveals 3 main topic areas on
Decide Madrid.

FP7 – CAPS - 2013 D-CENT D2.4 Data Visualisation:
From Citizen Data to Wisdom of the Crowd
Page 24 of 43
Figure 17: Network of tags with Sigma.js

FP7 – CAPS - 2013 D-CENT D2.4 Data Visualisation:
From Citizen Data to Wisdom of the Crowd
Page 25 of 43
4.3 Research Task: Proposals Lifecycle
The next research task was designed to better understand the dynamics of proposals on Decide
Madrid. One of the initial ideas to explore their lifecycle was to analyse the aggregation of
supporters. Nevertheless, due to privacy issues, the web interface of Decide Madrid only provides
the current number of supporters of each proposal. According to the code and schema of the
Decide Madrid databasexxiii, metadata of each endorsements (e.g. timestamp and the supporting user)
are stored but not accessible in order to preserve user privacy.
From the available data, we first examined the distribution of the number supporters. For this
purpose, we used a Kibana line chart plotting the number of supporters on the X-Axis, and the
number of proposals on the Y-Axis. For better readability we (1) established a granularity of 100 for
the X-Axis, (2) applied a square root scale for the Y-Axis, and (3) smoothed the lines that connect
the dots. The resulting data visualisation is showed in Figure 18: we observe a heavy-tailed
distribution where most proposals have between 0 and 100 supporters (5 094), some proposals
have between 100 and 1000 supporters (954), and just a few proposals have more than 1000
supporters (53). We then examined in detail the first subset of proposals (between 100 and 1000
supporters) by setting a finer granularity (see Figure 19). The visualisation reveals an interesting
increasing pattern from 0 to 9 supporters and a decreasing pattern from 9 supporters. In other
words, proposals are likely to have a minimum number of supporters. Finally we conducted a
longitudinal analysis of the 3 subsets of proposals. Figure 20 shows for each date the percentage of
proposals that have 0-100 supporters (green), 100-1000 supporters (yellow) and more than 1000
supporters (red). We observe that most proposals which have more than 1000 supporters occurred
in the first days. Indeed, only just a few of proposals posted in the end of October and the beginning
of November reached that level of support. We retrieved these proposals through the Elasticsearch
search engine and discovered that most of them were initiatives to force the City Council to keep
the tradition of setting Nativity scenes for Christmas (see Table 3). Interestingly, among these, the
most supported proposal was not the first published one but the one that received attention from
mass-media due to the support of a Spanish celebrityxxiv.
Title Date Supporters
que se instale este año tambien el belen tradicional en el ayuntamiento 27/10/2015 1282
Respetar la tradición de los belenes 30/10/2015 2484
Montar el Belén de Navidad en Madrid 03/11/2015 1005
Belén en Navidad 04/11/2015 2030
Table 3: Popular proposals in the end October and beginning of November

FP7 – CAPS - 2013 D-CENT D2.4 Data Visualisation:
From Citizen Data to Wisdom of the Crowd
Page 26 of 43
Figure 18: Distribution of the number of supporters

FP7 – CAPS - 2013 D-CENT D2.4 Data Visualisation:
From Citizen Data to Wisdom of the Crowd
Page 27 of 43
Figure 19: Distribution of the number of supporters (between 0 and 100)

FP7 – CAPS - 2013 D-CENT D2.4 Data Visualisation:
From Citizen Data to Wisdom of the Crowd
Page 28 of 43
Figure 20: Percentage of proposals per date and number of supporters

FP7 – CAPS - 2013 D-CENT D2.4 Data Visualisation:
From Citizen Data to Wisdom of the Crowd
Page 29 of 43
4.4 Research Task: Users Lifecycle
The previous task examined the lifecycle of proposals on Decide Madrid. The next task was
orientated to study the lifecycle of users. Because the platform was launched in September, collected
data only comprises of the first three months and the lifecycle of users is constrained in this initial
interval. For this reason, we found it of interest to inspect when users post for the first time and
which content attracted them. We built an additional Elasticsearch index which stores, for each user:
the timestamp of their first publication,
the type of the publication (debate, comment in debate, proposal, comment in proposal),
the thread that the publication belongs to.
We populated the new index and plotted a Kibana pie chart to compare the type of first posting
actions. The results are presented in Figure 22 (left visualisation of the dashboard) and reveal that
the most common initial posting actions are new proposals (4 117 users; 38.82%) followed by
comments in debates (2 478 users; 23.43%), comments in proposals (2 431 users; 22.98%), and
finally posts in debates (1 552 users; 14.67%). For comments in debates/proposals, we plotted a
secondary Kibana pie chart with an additional ring that presents the distribution of corresponding
threads. Figure 22 (right visualisation of the dashboard) shows this chart and reports that the
proposals that brought more new users to publish comments are:
“Respetar la tradición de los belenes” (79 users; 3.25%)
“Salvar la cooperativa metropolitan” (71 users; 2.92%)
“Madrid -- 100% sostenible” (57 users; 2.34%)
“Eliminar los festejos taurinos y las subvenciones” (56 users; 2.3%)
The first one was expected since, as we have explained above, that proposal received attention from
mass-media. The second proposal aims to avoid the house eviction of families from the Metropolitan
cooperative. Therefore, the appearance of new users might be explained by the involvement of the
affected families and citizens in solidarity with them. The two other proposals are two of the three
featured proposals in the homepage of the platform (see Figure 21). Featured proposals are selected
by the number of supporters, thus, the prominence of these proposals clearly improves their
visibility for new users.
For debates, the threads that attracted more new users are:
“Monumento a roto2 en la puerta del sol” (197 users; 7.95%)
“Multar por los excrementos de los perros” (90 users; 3.63%)
“#Túpreguntas: manuela carmena, alcaldesa de madrid” (88 users; 3.55%)
“Cambiar de medio de transporte público sin pagar otro billete” (74 users; 2.99%)
The first debate is the goliardic one that brought new users from the Spanish online forum
Forocoches. The second and fourth debates were posted on the first day of the platform, the day
when more comments in debates were posted. Furthermore, the initial sorting algorithm for debates
was based on the number of comments which reinforced the visibility of these debates for new
users. The third debate is the one started by Manuela Carmena, the Mayor of Madrid.
To examine the distribution of first publications over time we built a Kibana area chart representing
the timestamp on the X-Axis, and the number of documents on the Y-Axis. The area of the chart is
also split according to the type of the documents; results are visible in Figure 23. We observe similar
peaks as the ones from for the distribution of the index that stored all the publications. Again, once

FP7 – CAPS - 2013 D-CENT D2.4 Data Visualisation:
From Citizen Data to Wisdom of the Crowd
Page 30 of 43
the proposals were available the activity around debates fell. The only dates when debates arise are
the ones when debates of Manuela Carmena and the councillors were held. We also find of interest
that the day when proposals were available in the platform, first publications were more likely to be
comments to proposals than proposals. In contrast, when the diffusion campaigned was launched,
new users started by a new proposal instead of commenting the existing ones.
Figure 21: Featured proposals (PROPUESTAS DESTACADAS) on Decide Madrid
(Source https://decide.madrid.es/proposals)

FP7 – CAPS - 2013 D-CENT D2.4 Data Visualisation:
From Citizen Data to Wisdom of the Crowd
Page 31 of 43
Figure 22: Distribution of the type of first contents of users (left) and distribution of threads for initial contents when they are comments (right)

FP7 – CAPS - 2013 D-CENT D2.4 Data Visualisation:
From Citizen Data to Wisdom of the Crowd
Page 32 of 43
Figure 23: Distribution of the type of first publications of users over time

FP7 – CAPS - 2013 D-CENT D2.4 Data Visualisation:
From Citizen Data to Wisdom of the Crowd
Page 33 of 43
4.5 Research Task: Modelling of Debates
The last task of this study focused on the characterisation of the discussion structure of debates.
According to the Area of Citizen Participation and Transparency, one of the main goals of Decide
Madrid is to promote discussions that foster political deliberation. In our study we followed a
framework from the state-of-the-art that allows the analysis and comparison of different internet
technologies for the promotion of political deliberation (Gonzalez-Bailon, Kaltenbrunner, & Banchs,
2010). In this framework discussions are classified according to two features: (1) the extent of
representation and (2) the intensity of argumentation. The representativeness of a debate is related
to the level of participation and quantified through the number of comments at any level of the
discussion tree (i.e. the width). On the other hand, argumentation expresses how conclusions can be
reached through logical reasoning and quantified through the number of nested layers in the
discussion tree (i.e. the depth). Figure 24 shows a simple map of democratic possibilities in these
two dimensions:
Quadrant I: mass deliberation.
Quadrant II: deliberation of a selected group of experts or elite.
Quadrant III: poll-directed mass democracy promoted by the media.
Quadrant IV: plebiscitary democracy.
Figure 24: Deliberation in discussions according to the width and depth of the tree.
Source (Gonzalez-Bailon, Kaltenbrunner, & Banchs, 2010).

FP7 – CAPS - 2013 D-CENT D2.4 Data Visualisation:
From Citizen Data to Wisdom of the Crowd
Page 34 of 43
In our Elasticsearch index we stored the number of comments for each thread, and the indentation
level of each comment within the discussion tree. From these data, we calculated the depth of a
thread as the maximum indentation level of a comment in the corresponding discussion tree. We
then replicated the map of deliberation quadrants by plotting a Kibana line chart with number of
comments of a thread on the X-Axis, and the depth of the corresponding discussion tree on the Y-
Axis. Figure 26 shows the corresponding graph and reveals that, although most threads fall in
Quadrant III, some threads present remarkable levels of representation and/or argumentation.
In order to compute which nodes are closer to belong to Quadrant I (mass deliberation), we
calculated the h-index of a discussion tree based on the definition found in (Kaltenbrunner &
Laniado, 2012). The h-index is a measure that balances width and depth of a thread and corresponds
to the maximum number h such that there are at least h comments at depth h, but not h+1
comments at level h+1. Figure 25 provides an example for the calculation of the h-index of a nested
discussion with h = 3. In practice, a discussion has a high h-index if it is both wide (it has many
comment in different branches), and deep (several branches reach a high level of indentation).
Figure 25: Calculation of the h-index of a nested discussion (h-index=3)
(Source (Kaltenbrunner & Laniado, 2012))
Table 4 presents the top threads by the number of comments, depth and h-index. We observe that
the threads with highest representation (number of comments) are the popular threads which we
observed in previous tasks (e.g. the trolling action of Forocoches and the debate with Manuela
Carmena). In contrast, we found at the top other threads according to the level of argumentation
(depth). We found of interest that the two deepest threads (depth=20) acquire different levels of h-
index (h=10; h=3). Although both exhibited the same degree of argumentation according to their
depth, “Cuidado con los que se van a beneficiar de la remunicipalizacion” is a better example of
deliberation than “Que se retiren las marcas de debates inadecuados a debates con sentido común”
due to its representativeness (i.e. number of comments), and to the presence of a richer discussion
(with more branches that reach a high depth in the discussion tree, as indicated by the higher h-
index).
Title #comments depth h index

FP7 – CAPS - 2013 D-CENT D2.4 Data Visualisation:
From Citizen Data to Wisdom of the Crowd
Page 35 of 43
Monumento a roto2 en la Puerta del Sol 383 6 5
Multar por los excrementos de los perros 383 9 6
#túpreguntas: Manuela Carmena, alcaldesa de Madrid 323 9 5
Cuidado con los que se van a beneficiar de la remunicipalizacion. 156 20 10
Que se retiren las marcas de debates inadecuados a debates con sentido común 35 20 3
Implementar software libre en todo el ayuntamiento y organismos dependientes 40 13 4
Cuidado con los que se van a beneficiar de la remunicipalizacion. 156 20 10
Carriles bici y calles bici 35 12 6
Multar por los excrementos de los perros 142 9 6
Table 4: Top threads by number of comments, depth and h-index
Figure 24 (right) illustrates the typical structure of discussion threads for the four existing quadrants.
In order to visually explore and understand the structures of the above debates we adapted the
D3.js code of Collapsible Force Layout. In particular, we implemented a web service that, given the
numerical ID of a debate, scraps the HTML code of the debate and dumps the discussion thread into
the JSON structure required by D3. In addition, we (1) customized the size of each node based on
the number of votes of that comment, and (2) set node colours according to the ratio
positive/negative votes:
Black Root (post)
Grey Comment with no votes
Green (scale) Comment with majority of positive votes
Red (scale) Comment with majority of negative votes
Orange Comment with no strong preference of positive or negative votes
We also exploited the interactivity of D3.js by providing a tooltip that contains the metadata of a
node (author, message, timestamp and positive/negative votes) when the user rolls the mouse over
it.
The two deepest threads from Table 4 were visually explored with our web service. “Cuidado con los
que se van a beneficiar de la remunicipalizacion” is presented in Figure 27 and “Que se retiren las marcas
de debates inadecuados a debates con sentido común” is showed in Figure 28. The first network
visualisation describes a complex structure for the first thread and, therefore, its high level of
deliberation (representativeness and argumentation) as the h-index also indicated. In contrast, the
structure of the second thread mainly consists of a long chain of messages between two users that is
to say argumentation but lack of representativeness. The third visualisation in Figure 29 corresponds
to the debate about the trolling action from the Spanish forum Forocoches. As the metrics from
Table 4 described, the trolling action received many comments but they did not lead to an
argumentative structure and, therefore, political deliberation.

FP7 – CAPS - 2013 D-CENT D2.4 Data Visualisation:
From Citizen Data to Wisdom of the Crowd
Page 36 of 43
Figure 26: Distribution of threads per number of comments and depth

FP7 – CAPS - 2013 D-CENT D2.4 Data Visualisation:
From Citizen Data to Wisdom of the Crowd
Page 37 of 43
Figure 27: Thread of the debate "cuidado con los que se van a beneficiar de la remunicipalizacion" with D3.js

FP7 – CAPS - 2013 D-CENT D2.4 Data Visualisation:
From Citizen Data to Wisdom of the Crowd
Page 38 of 43
Figure 28: Thread of the debate "que se retiren las marcas de debates inadecuados a debates con sentido común" with D3.js

FP7 – CAPS - 2013 D-CENT D2.4 Data Visualisation:
From Citizen Data to Wisdom of the Crowd
Page 39 of 43
Figure 29: Thread of the debate "monumento a roto2 en la puerta del sol" with D3.js

FP7 – CAPS - 2013 D-CENT DX.X Title VX
Page 40 of 43
Conclusions 5.
In this deliverable we have showed how data visualisation can provide valuable insights into the
characterisation of collective intelligence and deliberative democracy. The visualisations described in
this deliverable rely on open source technologies for data storage, analysis and visualisation. Many of
these visualisations were powered by Kibana, a web platform for data exploration. This platform was
already mentioned in the D-CENT deliverable for the Technical Design of Open Social Web for
Crowdsourced Democracy (Aragón, et al., 2014). The results obtained in the analyses of this study
reinforce the interest in this technology for D-CENT tools. Indeed, one of the key principles of the
D-CENT project is to allow citizens control their own data. We strongly believe that data
ownership is a principle out of discussion. However, we also consider that ownership of data must
be accompanied by data analysis/visualisation capabilities. The DIKW Pyramid, showed in Figure 30,
is a well-known model that represents the functional relationships between data, information,
knowledge, and wisdom. Wallace describes information as "organized or structured” data,
knowledge is defined as “a fluid mix of framed experience, values, contextual information”, and
wisdom consists of "integrated knowledge-information made super-useful" (Wallace, 2007).
Therefore, if we are interested in turning citizen data into the Wisdom of Crowds (Surowiecki, 2005),
citizens must not only own their data but also own open, effective and user-friendly tools that reveal
(1) the information conveyed by the data, and (2) the knowledge that can be inferred. In this study,
Kibana provided us the required analytical/visualisation capabilities. The strongest requirement was
to store data in Elasticsearch, an open-source full-text search engine based on Lucene. A recent D-
CENT deliverable about the Secure Notifications Tool (Cowie, 2015) described a back-end powered
by MongoDB but also suggested that future possible developments would also use Elasticsearch for
indexing the user activity stream. We conclude that the results of our deliverable should motivate
the integration of this technology in order to provide full data exploration to citizens.
Figure 30: DIKW Pyramid
(Source https://en.wikipedia.org/wiki/DIKW_Pyramid)
The analysis of Decide Madrid was conducted due to the strategic collaboration among the D-CENT
project, the Area of Citizen Participation and Transparency of Madrid City Council, and the lab

FP7 – CAPS - 2013 D-CENT DX.X Title VX
Page 41 of 43
DemIC. In BetaDemIC, researchers from D-CENT project applied data analysis and visualisation
techniques to provide feedback for the development and refinement of Decide Madrid.
The first analyses addressed the distribution of activity in the platform over time. We observed
peaks of activity when (1) the platform was launched, (2) proposals were launched in the next week,
(3) the diffusion campaign started in early November, and (4) the debates with the Mayor and
councillors were held. We find of interest that once proposals were available most activity focused
on them rather than on debates. This might be explained because users are engaged in the possibility
of achieving tangible political goals (as proposals are) instead of just debating as users daily do in
online forums and social networks. When this pattern emerged, the Area of Citizen Participation
and Transparency indicated that debates would be improved by the participation of political
representatives. Our results proved the success of this initiative. In fact, although since October new
users were mostly engaged in proposals, many new users signed up on Decide Madrid to participate
in debates with representatives.
The results regarding proposals revealed that only a minor fraction have 1000 supporters.
Moreover, a large majority of them were published when proposals were launched. The exceptions
for this rule are the initiatives about Nativity scenes for Christmas that received attention from
mass-media and some Spanish celebrities. This result was discussed in a BetaDemic working session
and the participants concluded that the explanation behind this situation might be the sorting
algorithm for proposals in the web page. The algorithm ranks proposals according to (1) the number
of supporters and (2) a strong factor regarding time decay that considers units of 12 hoursxxv.
Therefore, most proposals are hardly visible by the community after 1 or 2 days and users are not
able to find them and give them support. This result was discussed with the developers of Decide
Madrid and a new version of the sorting algorithm is being implemented.
The analysis of the community structure of the platform depicted a well-connected community
without well-defined clusters of users. This outcome might be produced by the novelty of the
community and the fact that users receive the same feed of proposals and debates. Therefore, users
are not strongly clustered around preferences. The only community partially isolated from the main
component of the network of replies was the one from the Spanish forum Forocoches, which
focused on their trolling action. Regarding the network of tags, we find of interest how most
relevant tags formed three topical communities: (1) mobility, environment and health, (2) civil rights
and social services, and (3) neighbourhoods of Madrid.
Finally, we explored the structure of debates and found an interesting model to quantify the
deliberation given the structure of a discussion thread. The results of the metric (h-index) in the
selected threads matched with the representation of the discussion tree in our innovative thread
visualisation. We believe that these insights and upcoming measures and models from research
within the D-CENT project will provide disruptive capabilities to model and promote deliberative
democracy.

FP7 – CAPS - 2013 D-CENT DX.X Title VX
Page 42 of 43
References 6.
Aragón, P., Borge, R., Calleja-López, A., Kaltenbrunner, A., Laniado, D., Monterde, A., & Volkovich,
Y. (2015). D2. 3 Results of the data analysis. Retrieved from http://dcentproject.eu/wp-
content/uploads/2015/10/D2.3-results-of-the-data-analyses1.pdf
Aragón, P., Bria, F., de Filippi, P., Halpin, H., Korhonen, J., Laniado, D., . . . van der Waal, S. (2014).
D4. 3 Technical Design of Open Social Web for Crowdsourced Democracy. Retrieved from
http://dcentproject.eu/wp-content/uploads/2014/11/D4.3-Technical-design-of-open-social-
web-for-crowdsourced-democracy.pdf
Blondel, V. D., Guillaume, J.-L., Lambiotte, R., & Lefebvre, E. (2008). Fast unfolding of communities in
large networks. Journal of Statistical Mechanics: Theory and Experiment, P10008.
Cowie, J. (2015). D5.6 Overview of the Secure Notifications Tool.
Gonzalez-Bailon, S., Kaltenbrunner, A., & Banchs, R. E. (2010). The structure of political discussion
networks: a model for the analysis of online deliberation. {Journal of Information Technology,
25(2), 230-243.
Jacomy, M., Heymann, S., Venturini, T., & Bastian, M. (s.f.). ForceAtlas2, A Graph Layout Algorithm for
Handy Network Visualisation. Obtenido de http://webatlas.fr/tempshare/ForceAtlas2_Paper.pdf
Kaltenbrunner, A., & Laniado, D. (2012). There is no deadline: time evolution of Wikipedia
discussions. Proceedings of the Eighth Annual International Symposium on Wikis and Open
Collaboration, (pág. 6).
Page, L., Brin, S., Motwani, R., & Winograd, T. (1999). The PageRank citation ranking: bringing order
to the Web. Stanford InfoLab.
Patel, N., & Taylor, B. (2014). The Definitive Guide To Growth hacking. Retrieved from
http://www.quicksprout.com/the-definitive-guide-to-growth-hacking/
Seidman, S. B. (1983). Network structure and minimum degree. Social networks, 5(3), 269-287.
Sunstein, C. R. (2009). Republic. com 2.0. Princeton University Press.
Surowiecki, J. (2005). The wisdom of crowds. Anchor Books.
Wallace, D. P. (2007). Knowledge management: Historical and cross-disciplinary themes. Libraries
unlimited.

FP7 – CAPS - 2013 D-CENT DX.X Title VX
Page 43 of 43
i Available at: https://decide.madrid.es/
ii In English: “The city will be the city that you want”
iii Available at: http://www.gnu.org/licenses/agpl-3.0.html
iv Available at: https://github.com/ayuntamientomadrid
v Guidelines available at: https://decide.madrid.es/publications/directrices_ejercicio_propuesta.pdf
vi Full list in: http://www.madrid.es/portales/munimadrid/es/Inicio/El-Ayuntamiento/Atencion-al-
ciudadano/Oficinas-de-Atencion-al-
Ciudadano?vgnextfmt=default&vgnextchannel=5b99cde2e09a4310VgnVCM1000000b205a0aRCRD
vii Available at: http://demic.cc/
viii Report of the event at: http://diario.madrid.es/blog/2015/12/17/primer-encuentro-sobre-herramientas-para-
la-democracia/
ix Available at: http://medialab-prado.es/person/demic
x Available at: https://www.elastic.co/products/kibana
xi Available at: https://www.elastic.co/products/elasticsearch
xii Source: https://www.elastic.co/guide/en/kibana/current/visualize.html
xiii Available at: https://github.com/mbostock/d3/wiki/API-Reference
xiv Available at: https://github.com/mbostock/d3/wiki/Gallery
xv Available at: https://github.com/jacomyal/sigma.js
xvi Available at: http://gephi.org/
xvii A detailed description of PageRank, modularity and the Louvain method is available at D-CENT deliverable
D2.3 (Aragón, et al., 2015)
xviii User profile available at: https://decide.madrid.es/users/399
xix Available at: https://decide.madrid.es/debates/115
xx Available at: http://www.forocoches.com/
xxi mobility, environment, sustainability, center, health, sports, security and emergencies, latina
xxii culture, social rights, economy, participation, employment, equality, media, transparency, associations
xxiii Available at:
https://github.com/AyuntamientoMadrid/participacion/blob/master/db/schema.rb
xxiv Supportive tweet at: https://twitter.com/Tamara_Falco_/status/662352395201024000
xxv Implementation available at:
https://github.com/consul/consul/blob/ca80da37bd0363393a6ddd2d6055db150301e711/lib/score_calculator.rb#
L7

FP7 – CAPS
Project no. 610349
D-CENT
Decentralised Citizens
ENgagement Technologies
Lead beneficiary:
UOC and Eurecat
D2.4
From citizen data to
wisdom of the Crowd
Dec 2015
Version Number: 1
Authors:
Pablo Aragón
David Laniado
Contributors:
Alberto Abellán
Miguel Aguilera
Pedro Álvarez
Miguel Arana
Alejandra Baciero
Yago Barmejo
Enrique García
Tomás Gómez
David Ruescas
Editors and reviewers:
Natalie Eskinazi
Francesca Bria
The work leading to this publication has
received funding from the European Union’s
Seventh Framework Programme (FP7/2007 -
2013) under grant agreement n° 610349.
The content of this report reflects only the
author’s view and that the Commission is not
responsible for any use that may be made of
the information it contains.