the wages of sinistrality: handedness, brain structure...
TRANSCRIPT

www.hks.harvard.edu
The Wages of Sinistrality: Handedness, Brain Structure and Human Capital Accumulation Faculty Research Working Paper Series
Joshua Goodman Harvard Kennedy School
January 2012 RWP12-002
The views expressed in the HKS Faculty Research Working Paper Series are those of the author(s) and do not necessarily reflect those of the John F. Kennedy School of Government or of Harvard University. Faculty Research Working Papers have not undergone formal review and approval. Such papers are included in this series to elicit feedback and to encourage debate on important public policy challenges. Copyright belongs to the author(s). Papers may be downloaded for personal use only.

The Wages of Sinistrality:Handedness, Brain Structure and Human Capital
Accumulation∗
Joshua Goodman
Abstract
Left- and right-handed individuals have different brain structures, particularly in relationto language processing. Using five data sets from the US and UK, I show that poor infant healthincreases the likelihood of a child being left-handed. I argue that handedness can thus be usedto explore the long-run impacts of differential brain structure generated in part by poor infanthealth. Even conditional on infant health and family background, lefties exhibit economicallyand statistically significant human capital deficits relative to righties. Compared to righties,lefties score a tenth of a standard deviation lower on measures of cognitive skill and, contraryto popular wisdom, are not over-represented at the high end of the distribution. Lefties havemore emotional and behavioral problems, have more learning disabilities such as dyslexia,complete less schooling, and work in less cognitively intensive occupations. Differences be-tween left- and right-handed siblings are similar in magnitude. Most strikingly, lefties havesix percent lower annual earnings than righties, a gap that can largely be explained by thesedifferences in cognitive skill, disabilities, schooling and occupational choice. Lefties work inmore manually intensive occupations than do righties, further suggesting that lefties’ primarylabor market disadvantage is cognitive rather than physical. Those likely be left-handed dueto genetics show smaller or no deficits relative to righties, suggesting the importance of envi-ronmental shocks as the source of disadvantage. Handedness provides parents and schools acostlessly observable characteristic with which to identify young children whose cognitive andbehavioral development may warrant additional attention.
∗For their very helpful comments, I am grateful to Caroline Hoxby, Ed Glaeser, Amitabh Chandra and Felipe Barrera-Osorio, as well as participants in the NBER Education Group meetings and the Harvard Kennedy School FacultySeminar. Colin Sullivan and Heather Sarsons provided outstanding research assistance. Finally, I thank my left-handedwife, Anna Lumelsky, for encouraging this work even when the coefficients troubled her. All errors are my own.

1 Introduction
The Book of Judges records the story of Ehud, ”‘a left-handed man”’ with ”‘a double-edged
sword... which he strapped to his right thigh under his clothing.”’ Before Ehud entered the cham-
bers of the oppressive king Eglon, the king’s guards frisked only his left thigh, where a right-
handed warrior would normally place his sword in order to draw it easily. Ehud’s left-handedness
thus proved useful, allowing him to conceal his weapon and ultimately slay the king.
Whether left-handedness more generally confers comparative advantages beyond the market
for political assassination is less clear. For much of history, left-handedness was viewed with
deep suspicion. During the Middle Ages, left-handed writers were thought to be possessed by
the Devil, generating the modern sense of the word ”‘sinister”’ from (sinistra), the Latin word for
”‘left.”’1 Sinistrality, or left-handedness, does however have modern proponents who argue that
lefties are more likely to be creative superstars than righties. Anecdotal evidence for this includes
the fact that four of the last seven US presidents have been left-handed (Ford, George H.W. Bush,
Clinton and Obama) and one ambidextrous (Reagan).
Despite this popular fascination, economists have paid too little attention to the phenomenon
of handedness. I remedy this by first reviewing medical literature showing that left- and right-
handed individuals have different brain structures, particularly in relation to language process-
ing. Using five data sets from the US and UK, I then show that poor infant health increases the
likelihood of a child being left-handed. I argue that handedness can thus be used to explore the
long-run impacts of differential brain structure generated in part by poor infant health. Even con-
ditional on infant health and family background, lefties exhibit economically and statistically sig-
nificant human capital deficits relative to righties. Compared to righties, lefties score a tenth of a
standard deviation lower on measures of cognitive skill and, contrary to popular wisdom, are not
over-represented at the high end of the distribution. Lefties have more emotional and behavioral
problems, have more learning disabilities such as dyslexia, complete less schooling, and work in
less cognitively intensive occupations. Differences between left- and right-handed siblings are
similar in magnitude. Most strikingly, lefties have six percent lower annual earnings than righties,
1The English word ”‘left”’ comes from the Old English ”‘luft”’ or ”‘lyft”’, meaning idle, weak or useless.
1

a gap that can largely be explained by these differences in cognitive skill, disabilities, schooling
and occupational choice. Lefties work in more manually intensive occupations than do righties,
further suggesting that lefties’ primary labor market disadvantage is cognitive rather than phys-
ical. Those likely be left-handed due to genetics show smaller or no deficits relative to righties,
suggesting the importance of environmental shocks as the source of disadvantage. Handedness
provides parents and schools a costlessly observable characteristic with which to identify young
children whose cognitive and behavioral development may warrant additional attention.
Handedness thus relates to two recent strands of literature in economics. First, there is in-
creasing interest in the role that brain development plays in the determination of skills valued by
the labor market. The impact of early childhood experiences is a particular focus of this research
(Heckman, 2011). Second, another line of research on the fetal origins hypothesis, reviewed re-
cently by Almond and Currie (2011), stresses the long-run impact of in utero shocks to the fetal
environment. Handedness is the rare example of a trait that is costlessly observable, objectively
measurable, and strongly related to neural development triggered by early shocks to infant health.
Handedness thus deserves more attention from economists than it has previously received.
2 Handedness
Laterality - the general term for asymmetrical brain functioning that includes handedness, footed-
ness, and eye preference - is present across the animal kingdom. Primates, rodents, birds, fishes,
and lizards all display asymmetrical behaviors or brain functions (Bisazza et al., 1998). Roughly
12% of humans are left-handed, with somewhat higher rates among males than females (Vuok-
simaa et al., 2009). The prevalence of laterality in humans and other species, as well as its rela-
tionship with brain development and other processes, has made laterality a popular topic in the
biological and medical literature, though its economic implications have received less attention.
Medical and biological research has focused largely on the origins of laterality and descriptive
evidence of its effects and related conditions.
2

2.1 Causes of handedness
Theories about the causes of handedness fall into three categories: social, genetic, and anatomical.
The pure social theory argues that hand preference is learned and not biological in origin. A more
moderate version of this theory argues that training can overcome natural inclinations. Forced
right-handedness has been common throughout history and is still practiced in many parts of the
world. In India, for example, a child showing preference for his left hand will have that hand tied
behind his back or the left arm broken (Perelle and Ehrman, 2005). Connected to this social theory
is the notion of a social evolutionary mechanism. The most popular of these, the ”sword and
shield” theory, posits that ”the soldier who held his shield in his left hand offered his heart better
protection and thus had a better chance of survival.... the right hand [thus] grew more skilled in
manipulative movement and eventually came to be used for all skilled manipulative activities”
(Hardyck and Petrinovich, 1977, p. 388).
Social theories seem incomplete given strong evidence for the genetic and anatomical theories
discussed below and given that hand preference has been observed in fetuses in the form of thumb
sucking (Vuoksimaa et al., 2009). The genetic theory of handedness is supported by two types of
evidence. First, the rate of left-handedness is about 10% for children of two right-handed parents,
20% for children of one left- and one right-handed parent, and about 26% for children of two left-
handed parents (McManus and Bryden 1994). Children are also more likely to share handedness
with their mother than with their father (Harkins and Michel, 1988). These facts, though sug-
gestive of genetic influence, could also be explained by children learning handedness from their
parents, given that most children spend more time in early childhood with their mothers than
with their fathers.
The second type of genetic evidence, from twin pairs, is more convincing. One recent study
comparing mono- and dizygotic twin pairs estimated that genes account for 24% of the variance
in left-handedness (Medland et al., 2008). Genetic factors do not, however, entirely explain hand-
edness, given that 20-25% of monozygotic twins differ in their handedness even though they have
identical genomes (Carter-Salzman et al., 1975).
Anatomical theories, variations of which have been present since Aristotle, attribute handed-
3

ness to the asymmetry of organs (Hardyck and Petrinovich, 1977). Modern versions emphasize
differentiation of the left and right hemispheres of the brain, which control opposite sides of the
body. Because the left hemisphere is generally thought to process language, studies of handed-
ness and brain function focus on linguistic differences between left- and right-handed individ-
uals. Functional magnetic resonance imaging reveals that, when exposed to language, 96% of
right-handed individuals show only left hemisphere activity. Just 76% of left-handed individu-
als show only left hemisphere activity, with the remaining 24% showing activation of either both
hemispheres or only the right hemisphere (Pujol et al., 1999). Relatedly, brain lesions on the right
hemisphere are more than twice as likely to cause language disorders in the left-handed as in the
right-handed (Hardyck and Petrinovich, 1977). This pattern of greater bilateral activation among
the left-handed may be related to the corpus callosum, the bundle of neural fibers connecting the
two hemispheres, which is 11% larger in the left-handed than the right-handed (Witelson, 1985).
This biological evidence makes clear that left-handedness is intimately related to differential brain
structure and usage, particularly with respect to language processing.
The cause of this differential brain structure may be partly genetic but one common expla-
nation, known as pathological left-handedness, suggests that stress or trauma during gestation
or birth may induce normally left hemispheric functions to shift to the right hemisphere. Left-
handedness is more prevalent among infants who required resuscitation after delivery and is
more prevalent among twins and triplets than among singleton births. Studies have also found
that higher maternal age and lower birthweight are both associated with higher prevalence of
left-handedness (Medland et al., 2008; Vuoksimaa et al., 2009). All of these are consistent with the
theory that stressors during pregnancy or birth may contribute to the differential brain structures
typical of left-handed individuals.
2.2 Handedness and cognitive outcomes
One common argument suggests that the larger corpus callosum and greater bilateral activation
exhibited by the left-handed allows for faster connection between ideas and thus more creativ-
ity. According to this theory, the left-handed should excel at tasks requiring divergent thinking,
4

where the individual begins from prior knowledge and works outwards toward new concepts,
as opposed to convergent thinking, where the individual applies knowledge and rules toward
discovering a unique solution to a problem. In a series of experiments, Coren (1995) found that
left-handed males performed better on some divergent thinking tasks. The effect was, however,
neither consistent across tasks nor significant for left-handed females. The empirical evidence for
greater creativity among the left-handed is, it turns out, fairly weak.
Also fairly weak is the evidence that the left-handed are disproportionately represented at the
high end of the cognitive spectrum. Evidence purporting to show that left-handed individuals are
overrepresented among precocious SAT takers, high-performing MCAT takers, and Mensa Society
members all suffer from one or more serious problems such as selection bias, small sample size,
or mixed results (Benbow, 1986; Halpern, Haviland and Killian, 1998; Perelle and Ehrman, 2005).
Much clearer is evidence that the left-handed are disproportionately represented at the low
end of the cognitive spectrum. The rate of left-handedness among those considered mentally
retarded is between 20% and 28%, roughly twice the rate in the general population (Perelle and
Ehrman, 2005). Prior work with the NCDS has observed that the left-handed fare worse than
the right-handed on tests of overall cognitive ability, even when the lowest performing 5% are
excluded (McManus and Mascie-Taylor, 1983). These lower cognitive skills may be at least partly
explained by higher rates of learning disabilities like dyslexia among the left- and mixed-handed,
as well as higher rates of behavioral problems such as attention-deficit/hyperactivity disorder
(Rodriguez et al., 2008). Patients suffering from schizophrenia also display high rates of left-
handedness (Dragovic and Hammond, 2005).
2.3 Handedness and human capital accumulation
Despite the ubiquity of handedness in daily life, economists have paid little attention to its effects
on human capital accumulation and labor market outcomes. There are two primary reasons to
think that handedness might be related to longer-run outcomes of interest to economists. The
first is that the preference for one hand over the other may create a comparative advantage or
disadvantage in the labor market. Lefties may, for example, be less productive in occupations
5

requiring the use of equipment designed for righties. Conversely, lefties may be more productive
in occupations where they benefit from their own relative scarcity. Lefties are, for example, over-
represented among top performing athletes in interactive sports such as table tennis, fencing and
baseball, though not in non-interactive sports such as gymnastics and bowling (Raymond et al.,
1996). This is likely due to the fact that athletes are more frequently trained to compete against
right-handed opponents, giving left-handed athletes a comparative advantage. Given how few
jobs involve such interactive competition, it is likely that left-handedness is on average a compar-
ative disadvantage, at least in occupations requiring the use of right-handed equipment.
The second reason that handedness may impact longer-run outcomes is that it may be an
indicator for differential brain structure, as discussed above. If the structure of lefties’ brains
impairs the accumulation of skills, this will surface in labor market outcomes and measures of
productivity, and should be apparent early on in cognitive ability. Left-handed individuals might
fare poorly in the labor market not due to left-handedness itself, but as a consequence of a related
condition.
Two recent papers using nationally representative samples of children explore the relation-
ship between handedness and early human capital accumulation. In both papers, the authors
argue that differences between lefties and righties can not be explained by parental attitudes or
investment in children and that differential neural wiring may be the most likely explanation. Us-
ing the Longitudinal Study of Australian Children, Johnston, Shah and Shields (2007) find that
left-handed children have significantly lower cognitive and noncognitive skills than right-handed
children. Using the National Longitudinal Survey of Youth’s Children and Young Adult cohorts,
Johnston et al. (2010) find similarly significant cognitive gaps between left- and right-handed chil-
dren. I extend their analysis to other measures of early human capital and use data sets with
longer-run outcomes such as earnings.
Two economic studies based on large, nationally representative samples have found mixed
results on the relationship between handedness and earnings. Ruebeck, Harrington, and Moffitt
(2006), using the National Longitudinal Survey of Youth 1979 cohort, find no statistically signif-
icant difference in the wages of lefties and righties, either for men or women. Using the UK’s
6

Nation Child Development Study, Denny and O’Sullivan (2007) find that male lefties earn more
than male righties but that female lefties earn less than female righties. Both studies suffer, how-
ever, from sample selection decisions that render their results difficult to interpret. Both seem to
remove from their samples any individuals missing any control variables used in their primary
specification, without investigating whether lefties and righties differ in the proportion missing
such information. Both also limit the sample to individuals with wages above a certain threshold,
either explicitly or implicitly eliminating part-time workers and those not working from consid-
eration. This prevents both studies from exploring the extensive labor force participation margin,
which I show below is an important contributor to the overall differences between lefties and
righties. I improve on this by defining my samples to include all individuals whose handedness
is observed and then showing how robust the wage effects are to different sample definitions.
3 Data and Determinants of Handedness
3.1 Data sets
I use five longitudinal data sets, three from the United States and two from Great Britain. All five
contain information on handedness, as well as measures of cognitive skill and other evidence of
human capital accumulation.
The American data sets are three cohorts of the National Longitudinal Survey of Youth. The
NLSY79 is a nationally representative sample of youth ages 14-22 when first interviewed in 1979.
Interviews were conducted annually through 1994 and are now conducted biennially. The NLSY97
is a nationally representative sample of youth ages 12-17 when first interviewed in 1997. Inter-
views are conducted annually. In the most recent interview waves available, NLSY79 respondents
are 43-51 years old and NLSY97 respondents are 24-29 years old.
The third American data set is the NLSY Children and Young Adults (NLSC), which follows
all children born to the women in the NLSY79. Interviews of these children have been conducted
biennially since 1986. Unlike the other data sets used in this paper, the NLSC interviews multiple
siblings from the same family, allowing within-family analysis of the effect of handedness. Longer
7

term outcomes are, however, harder to explore in the NLSC because many of the children followed
were born too recently to have completed schooling or entered the labor market. For all three
American data sets, I use only the nationally representative cross-sectional samples and omit the
minority, economically disadvantaged and military oversamples.
The two British data sets are the National Child Development Study (NCDS58), which follows
over time all people born in Great Britain in one week in March 1958, and the British Cohort Study
(BCS70), which all people born in Great Britain in one week in April 1970. Both data sets begin at
birth and subjects are subsequently interviewed about every five years through the present.
3.2 Measuring handedness
Each of the five data sets asks somewhat different questions regarding handedness. The NLSY79
asked its subjects once in 1993, when they were 28-36 years old: ”Were you born naturally left-
handed or right-handed?” The NLSY97 asked its subjects twice in 2001 and 2002, when they were
16-22 years old: ”Are you left-handed or right-handed?” Every survey year since 1996, the NLSC
has asked three questions of the mothers of 2-14 year-olds: Which hand does the child use when
brushing teeth, when throwing a ball, and when writing? Youths older than 14 were directly asked
these same questions in 1996 and 1998 and each was also asked, ”As a child, were you ever forced
to change the hand with which you write?”
The NCDS58 explored handedness at ages 7, 11 and 16. At age 7, each mother was asked to
state her child’s handedness. Interviewers also recorded which hand each child used to throw
a crumpled paper ball and to draw a cross. At age 11, each mother was again asked to state her
child’s handedness and was then specifically asked which hand her child uses to write. Interview-
ers also recorded which hand each child used to throw a ball. At age 16, each youth was asked
with which hand he or she writes best.
The BCS70 explored handedness at ages 10 and 16. At age 10, interviewers recorded which
hand each child used to pick up a ball and to mime combing his or her hair. Each child was also
asked which hand he or she uses to write. At age 16, each youth is asked which hand he or she
uses to write a letter, throw a ball, hold a racket, hold the top of a broom to sweep, hold the top
8

of a shovel, hold a match when striking it, hold scissors, deal playing cards, hammer a nail and
unscrew the lid of a jar.
For each question asked about handedness across all five data sets, I assign a value of 1 to
answers that clearly favor the left hand (such as ”always left” or ”usually left”) and a value of 0
to answers that clearly favor the right hand. I assign a value of 0.5 to answers indicating mixed-
handedness or a lack of hand preference. To construct a continuous measure of left-handedness,
I compute for each year the mean response to handedness questions and then compute the mean
of these values across all years. This weights each year equally, regardless of how many handed-
ness questions were asked that year. I exclude from the samples individuals for whom I can not
construct any measure of handedness.
The distribution of this continuous measure of handedness is shown for each study in Figure
1. In all of the samples, except for the NLSY97, the distribution of left-handedness is clearly
concentrated at the extremes, so that most individuals can be easily categorized as right- or left-
handed. The mass in the middle of the NLSY97 distribution is due largely to 341 individuals who
claim to be right-handed in one year and left-handed in the other. To construct a binary measure
of left-handedness, I round this continuous measure to the nearest integer. This implies that some
mixed-handed individuals are categorized as left-handed. I later show that my central results are
not sensitive to changes in the definition of left-handedness. Also, in the NLSC, 37 youths report
currently preferring their right hand but also report having been forced to switch handedness
earlier in life. I categorize these youths as left-handed. For family fixed effects analysis, I then
create a subsample of the NLSC called NLSC-FE, which is limited to children from families with
at least one left-handed and at least one right-handed child.
3.3 Summary statistics
Table 1 shows the mean values of selected variables from the six samples used in this study. Panel
(A) lists the basic controls included in subsequent regressions in the paper. Individuals in the
NLSY97 sample range from 25 to 29 years old as of the most recent wave, while the remaining
three studies’ subjects are all observable through at least their mid-30s. The average individual in
9

the NLSC is 20 years old at the most recent wave in 2008, so that long run outcomes such as college
graduation and labor market earnings are not yet observable for the majority of the sample.
In nearly all of the samples, the rate of left-handedness is a remarkably consistent 11% to 13%,
well within the range observed in studies of other populations. This suggests that the constructed
measure of handedness is fairly accurate. The 16% rate of left-handedness in the NLSY97 is largely
due to categorizing the large mass of mixed-handed individuals as left-handed. The rate of left-
handedness is substantially higher in the NLSC-FE due to the exclusion of families without left-
handed children.
In all of the studies, I observe gender, birth order, mother’s age at birth and mother’s education.
I observe race in the US studies. Various measures of infant health are recorded in the NLSC and
the UK studies, including birthweight and indications of infant health challenges around the time
of birth.2 Because the NLSC children can be connected to their mothers in the NLSY79, I can
construct a dummy for each child indicating whether his or her mother was left-handed. The
NLSC-FE sample is similar to the full NLSC sample in nearly all covariates except that the fixed
effects sample has a higher proportion of blacks and those with left-handed mothers.
Panel (B) shows selected outcomes, the construction of which will be discussed in more de-
tail below. For all six samples, I observe a measure of cognitive skill that I transform into an
age-normed Z-score, as well as an indicator for having behavioral problems. For the samples in
which I observe individuals into adulthood, I observe educational attainment and hourly wages
as measured in 2009 dollars or pounds sterling. Below panel (B) are listed each sample’s size,
which refers to the number of individuals for whom handedness is observed. Most outcomes are
observed for smaller numbers of individuals due to attrition and missing data.
3.4 Determinants of handedness
Table 2 shows the results of linear probability models in which an indicator for left-handedness is
regressed on the covariates listed in Table 1. Column (1) uses the full NLSC sample, while column
2For the NLCS samples, the dummy for birth complications indicates that the child remained in the hospital formore than a week after being born. For the UK samples, it indicates that the birth was a breech birth or that forceps ora vacuum were used during delivery.
10

(2) uses the fixed effects subsample. Column (3) pools the US adult samples represented individ-
ually in columns (4) and (5), while column (6) pools the UK data sets represented individually in
columns (7) and (8). Subsequent regression tables in this paper have a similar structure.
The relationships between the covariates and the probability of being left-handed are fairly
consistent across samples. Maternal education and age at birth have little predictive power.
Conversely, gender and maternal left-handedness and infant health are strongly related to left-
handedness, consistent with previous studies. Across the samples, women are roughly three per-
centage points less likely than men to be left-handed. Rates of left-handedness thus range from
9-15% for females and from 12-18% for males. In column (2), the gender difference is an even
greater 15 percentage points because the base rate of left-handedness in males in the fixed ef-
fects sample is 42%. Column (1) shows that children with left-handed mothers are five percentage
points more likely to be left-handed themselves (about 16% of such children are left-handed). This
evidence strongly suggests a genetic component of left-handedness.
Other evidence strongly suggests an environmental component of left-handedness. In the UK
data sets, lower birthweight babies are more likely to be left-handed, with each additional pound
at birth associated with a 0.4 percentage point decrease in the rate of left-handedness. The NLSC
birthweight coefficients are also negative but the smaller sample sizes render the estimates less
precise. In these same samples, complications around the time of birth also increase the rate
of left-handedness. US babies that remain more than a week in the hospital post-birth are five
percentage points more likely to be left-handed, while UK babies whose labors were complicated
are 1.5 percentage points more likely to be left-handed. At the bottom of each column is reported
the p-value from an F-test of the joint significance of birthweight and birth complications, the
two measures of infant health. In the NLSC and UK samples, the infant health measures are at
least marginally jointly significant predictors of left-handedness. The NLSC and US samples also
suggest that black children are two to three percentage points more likely to be left-handed than
white children. Given that black infants in the US have substantially worse health at birth than do
white infants and that these data lack extensive information on fetal and infant health, race may
be serving as a proxy for unobserved fetal and infant health measures.
11

4 Human Capital Accumulation
4.1 Cognitive skills
The main measures of cognitive ability come from math and reading comprehension tests admin-
istered in all of the studies. The NLSC administered Peabody Individual Achievement Tests in
each wave for each subject between the ages of 5 and 14. The NLSY79 and NLSY97 both adminis-
tered in a single wave the Armed Services Vocational Aptitude Battery (ASVAB), at ages 17-24 in
the NLSY79 and ages 14-19 in the NLSY97. The NCDS58 administered math and reading tests at
ages 7, 11, and 16. The BCS70 administered a math test at age 10 and reading comprehension tests
at ages 5 and 10. Raw math and reading comprehension scores were normalized by age within
each study, averaged across multiple ages for individuals tested more than once, then normal-
ized again within each study. A cognitive ability Z-score was then constructed as the normalized
average of the math and reading Z-scores.
Table 3 shows the difference in cognitive skills between lefties and righties conditional on the
set of covariates listed in table 2 and its notes. In all of the samples except the NLSY79, lefties
show statistically significantly lower cognitive skills than righties. In the top row, the coefficients
imply that lefties have overall cognitive skills 0.11 standard deviations lower than righties in the
NLSC. The point estimate of the gap between left- and right-handed siblings is an even larger 0.16
standard deviations. The NLSY79 is the only one of the samples in which the cognitive difference
between lefties and righties, though negative, is too small to be statistically significant. The cogni-
tive gap in the NLSY97 is nearly identical to that in the NLSC, and the gap in the British samples
is about 0.06-0.08 standard deviations. The second and third rows of table 3, which analyze math
and reading scores separately, show that the cognitive gap between lefties and righties is nearly
identical across the two subjects. This suggests that, even if differential language processing is
responsible for these cognitive gaps, such differences equally affect both math and reading skills.
One popular claim about lefties is that they are more likely to be highly talented, perhaps
because of increased creativity. This claim suggests that aspects of the cognitive skill distribution
other than the mean are worth exploring. To do this, I plot in figures 2, 3, and 4 kernel density
12

estimates of the full distribution of cognitive skill for the NLSC, the adult US samples, and the UK
samples. There is no evidence that lefties are overrepresented at the upper end of the distribution
and generally strong evidence that they are overrepresented at the lower end. The third and
fourth rows of table 3 test this by running regressions in which the outcomes are indicators for
being in the top and bottom 10% of the cognitive skill distribution. Consistent with the plotted
CDFs, lefties are 2-4 percentage points more likely to be in the bottom 10% of the distribution
and, in all samples but the NCDS58, are 1-2 percentage points less likely to be in the top 10% of
the distribution. Tests of the probability of being in the top 5% or 1% of the distribution show
similar results. There is no evidence that lefties are more likely to be highly talented, at least by
these measures of cognitive skill. Further below I show similar results using various measures of
occupational skill instead of cognitive tests.
Further evidence of cognitive gaps come from tests administered in only some of the studies.
In the NLSY79 and NLSY97, part of the ASVAB consisted of a coding speed test in which subjects
match words to numbers based on a key. Given that the task requires nearly no prior knowledge
and that subjects have only seven minutes to complete as many matches as possible, the test
is thought to measure raw mental speed or fluid intelligence (Heckman, 1995; Segal, 2008). By
this measure, lefties in both samples score roughly a tenth of a standard deviation worse than
righties. Though the math and reading scores suggest that the NLSY79 is the only sample in which
lefties and righties have similar cognitive skills, the difference in coding speeds suggests that even
in that sample there are cognitive differences between the two groups. The British studies also
administered a test requiring little prior knowledge. Children ages 4-7 were given the Copying
Designs test, in which they were shown images of circles, crosses, and other shapes and asked
to copy those designs on a sheet of paper. Lefties scored 0.12 standard deviations worse on this
test than righties. Both the coding speed and copying designs results suggest that the observed
cognitive gaps are not only about acquired knowledge itself but also about deeper cognitive skills
necessary to acquire knowledge.
13

4.2 Disabilities
Before turning toward long-run measures of human capital, I first explore factors other than cogni-
tive skills that might also affect such long-run outcomes. Given that previous studies have found
left-handedness to be associated with a variety of impairments and behavioral problems, I con-
struct measures of a number of such factors. All of the samples except the BCS70 contain a binary
measure of whether the subject suffers from an emotional or behavioral problem. Three of the
studies also contain continuous measures of behavioral problems reported by a parent, the Be-
havior Problems Index in the NLSC, the Bristol Social Adjustment Guide in the NCDS58, and the
Rutter Scale in the BCS70. I construct an indicator for having a behavior problem that takes a value
of one if either the binary measure equals one or if the age-normalized continuous measure falls in
the top 5% of the distribution. The first row of table 4 shows strong evidence that lefties are more
likely to have behavior problems. The NLSC sample suggests that lefties are 3.5 percentage points
more likely to have behavior problems than righties, a difference that grows to 5.0 percentage
points when comparing left- and right-handed siblings. Given that roughly 8 percent of righties
in the NLSC samples have behavior problems, this implies that lefties are about 50 percent more
likely than righties to have such problems. The pooled US and UK samples also show statistically
significant differences, with lefties in those samples about 1.5 percentage points more likely to
have behavior problems. Though the magnitudes of these differences vary across samples, likely
due to different question wording and ages at interviews, the estimates clearly indicate increased
behavioral problems among lefties.
Previous research has suggested that left-handedness is unusually common among mentally
retarded individuals. This fact is cited in support of the theory of pathological left-handedness, the
idea that some left-handedness can be thought of as brain damage, perhaps due to fetal trauma.
Each of the data sets used in this paper allow construction of an indicator for mental retardation,
either through parental reporting, self-reporting, or interviewers’ observations of the subject. In all
of the samples, a high proportion of the mentally retarded individuals are left-handed. In the most
extreme case, seven of the eight mentally retarded children in the NLSC-FE are left-handed. The
second row of table 4 shows that lefties are consistently about one percentage point more likely to
14

be mentally retarded than righties. Given the low rate of mental retardation in these samples, this
represents a very large percentage increase even though the absolute number of mentally retarded
lefties is quite small. These results confirm the prior findings and add further evidence that brain
structure and handedness are closely related.
Given the biological evidence that lefties process language differently than righties, I construct
two further measures of disability related to language. The first is an indicator for having a speech
problem, such as a stutter or other speech impairment. In both NLSC samples and the British sam-
ples, lefties are about 2 percentage points more likely to have such speech problems. The second
measure is an indicator for having a learning disability, questions about which often mention
dyslexia specifically. In both the NLSC samples and the NLSY97 sample, lefties are 2-3 percentage
points more likely to report a learning disability than righties, a proportional increase of roughly
25-50 percent. Finally, the NLSC and BCS administered to children ages 7-11 a digit span test to
find the maximum number of digits a subject could memorize and recite forward (in both studies)
or backward (in the NLSC only). There is little evidence that lefties are worse at reciting digit lists
in the forward direction, which is generally considered a test of short-term auditory memory. Left-
ies are, however, substantially worse at reciting the digits backwards, which is thought to measure
the child’s ability to manipulate verbal information in temporary storage.3 This may be further
evidence of an impairment related to dyslexia or other difficulties with language processing.
4.3 Educational Attainment and Occupational Choice
Table 5 shows differences in educational attainment between lefties and righties for all samples but
the NLSC, in which many respondents have not yet completed their educations. For comparability
across the American and British data sets, educational attainment is defined by four mutually
exclusive categories: being a high school dropout, being a high school graduate, being a college
gradute, and missing information about education. In the US samples, I construct these using the
maximum level of education reported within ten years of the start of the study, at which point
subjects were in their mid-twenties to early thirties. Those reporting at least 12 years of education
3See p. 103 of the June 2009 version of the ”‘NLSY79 Child & Young Adults Data Users Guide”’.
15

are considered high school graduates and those reporting at least 16 years are considered college
graduates. In the British studies, subjects were asked at age 33-34 for their highest academic
qualification. Those with O-levels or higher are considered high school graduates and those with
qualifications beyond A-levels are considered college graduates.
The evidence suggests somewhat lower educational attainment for lefties in both the US and
the UK. The pooled US estimates suggest that lefties are 2.9 percentage points less likely to com-
plete college than righities. Given that 26% of righties in this sample complete college, this rep-
resents more than a 10% difference in the rate of college completion, a magnitude that is similar
across the NLSY79 and NLSY97. Lefties in the US are 2.4 percentage points more likely than right-
ies to stop their education with a high school diploma, while there is not significant difference in
high school dropout rates. This suggests that lefties’ disadvantages are not so severe as to prevent
completion of high school, but do interfere with higher educational attainment. In the UK sam-
ples, lefties are somewhat more likely to drop out of high school. Though they are less likely to
complete college and high school, those differences are not statistically significant.
Table 6 exploits the fact that all of the data sets record individuals’ occupations, coded by
a standardized scheme. In panel (A), I construct three mutually exclusive categories of profes-
sional/managerial occupations, other occupations, and missing occupation. In both the US and
UK samples, lefties are significantly less likely to have professional or managerial occupations,
likely due in large part to their lower rate of college completion. Also striking is that lefties are
substantially more likely to be missing occupational information. In the US data sets, this is not
due to differential attrition from the data set but instead from the fact that lefties are more likely
not to report having any occupation at all, even over multiple waves. A similar but weaker pattern
is seen in the UK data.
In panel (B), I take advantage of the US Department of Labor’s Occupational Information Net-
work (ONET), which contains measures of various abilities required by each occupation in the
Standard Occupational Classification scheme. ONET groups such abilities into four categories:
cognitive, psychomotor, physical and sensory. Each category contains multiple sub-abilities, the
importance of which to each occupation is measured on a scale from 1 to 5. For each occupation, I
16

construct a measure of cognitive ability from the mean of all the cognitive sub-abilities and a mea-
sure of physical ability from the mean of all the physical, psychomotor and sensory abilities. I also
construct two additional measures of particular relevance to the study of left-handedness. First, I
construct a measure of occupational creativity by averaging the cognitive sub-abilities ”‘original-
ity”’ and ”‘inductive reasoning”’. Second, I construct a measure of manual intensity by averaging
all physical sub-abilities that mention hands, including ”‘arm-hand steadiness,”’ ”‘finger dexter-
ity,”’ ”‘manual dexterity”’ and ”‘wrist-finger speed.”’ I then normalize all of these occupational
ability measures across the population of individuals for whom I observe occupation.
Consistent with the gaps in cognitive test scores, the top row of Panel (B) shows that lefties in
the US work in occupations requiring about 0.1 standard deviations less of cognitive ability. This
gap is larger and more precisely estimated in the NLSY97 than the NLSY79, which may be due
to measurement error stemming from the two crosswalks needed to connect the NLSY79 occu-
pational coding scheme to the more modern ONET scheme. The occupational creativity measure
tells a similar story, with lefties working in less creative occupations than righties, contrary to pop-
ular wisdom. If lefties are at a disadvantage due to the fact that they use different hands to work,
such a disadvantage is not apparent in occupational choice. Lefties work in occupations requiring
similar amounts of physical ability to righties and, even more strongly, in occupations requiring
more manual ability than righties. These occupational ability measures strengthen the case that
the primary disadvantage of being a lefty involves cognitive deficits, not manual ones.
4.4 Earnings and Wages
Long-run earnings outcomes are available for all studies but the NLSC, many of whose subjects
are too young to observe such outcomes as of the most recent wave. I construct annual earnings
and hourly wages in a way that makes the US samples comparable to each other and the UK
samples comparable to each other. Because NLSY97 subjects were ages 25-29 at the last wave of
interviews, in both the NLSY79 and NLSY97 I define the relevant value as the last non-missing
value observed from ages 25-29. In the British studies, I construct earnings and wages at age
33-34 for all respondents reporting earnings, including full-time workers, part-time workers and
17

the self-employed. The constructed distributions includes non-working individuals as having
zero earnings or wages. US and UK wages are expressed in 2009 dollars and pounds sterling
respectively.
Table 7 shows consistent earnings and wage gaps between lefties and righties across all sam-
ples but the NCDS58. The top row shows that US lefties earn about $1,800 less than righties, or
7% less than righties’ mean earnings of $24,400. In the UK sample, lefties earn nearly £900 less
than righties, or 5% less than righties’ mean earnings of £19,300. To check that these gaps are not
due to outliers or to miscoding of individuals with unusually low or high wages, I run quantile
regressions in the second row to check the gap in the median wage between lefties and righties.
The gap in median earnings is even larger than the mean gap in three of the four samples, with
the median lefty in the NLSY79, NLSY97 and BCS70 earning 10-12% less than the median righty.
Figures 5 and 6 graph by sample and gender the fraction of lefties in each earnings decile rel-
ative to the fraction of lefties in the population. In all samples but the BCS70, lefties are strikingly
over-represented in the bottom decile or two and generally under-represented in higher deciles.
The third row of panel (A) in table 7 confirms further this picture of the earnings distribution by
using as an outcome an indicator for annual earnings below $3,000 or £2,000. The vast majority of
individuals with low earnings have zero earnings. In all samples but the NCDS58, lefties are 4.2
percentage points, or 22-33%, more likely to have low earnings.
Panel (B) shows very similar gaps between the hourly wages of lefties and righties. In the
pooled US sample, lefties earn on average about $0.82 less per hour than righties, a highly statis-
tically significant difference that is similar in magnitude across the two individual samples. This
translates into roughly 6% lower hourly wages for lefties. The pooled UK sample suggests that
lefties in the UK earn £0.53 less per hour than righties, a highly statistically significant difference
that is due largely to the more recent of the two UK samples. Given the mean wage of righties
in the pooled sample, this also represents a roughly 6% wage difference. Median wage gaps are
similar to mean gaps and, as with annual earnings, lefties are 4-5 percentage points more likely to
have low wages (defined as wages less $3 or £2 per hour).
Taken as a whole, these results provide strong evidence of a statistically and economically
18

significant gap in earnings between lefties and righties. This gap is due partly but not exclusively
to a substantially higher likelihood of lefties having little or no earnings at all, which is consistent
with the increased rate at which lefties also report having no occupation.
4.5 Robustness and heterogeneity
I test the robustness of the estimated gaps in cognitive skills and earnings in table 8. In panel
(A), the first row replicates the first row of table 3, which will serve as a baseline. The second
row changes the explanatory variable from a binary measure of left-handedness to the continuous
measure from which that binary measure was originally constructed, as described previously. This
has little impact on the estimated cognitive skill gaps, suggesting that the results are not driven by
imposing a binary definition of handedness. The third row uses the binary measure of handedness
but eliminates from the sample mixed-handed individuals, those for whom the continuous mea-
sure of handedness is between one-third and two-thirds. This has little impact but does slightly
shrink the estimated gaps, suggesting that mixed-handers have even lower cognitive skills than
do lefties. The sample of mixed-handers is, however, generally too small to be able to investigate
in more depth. Finally, the fourth row of the table removes from the sample individuals identified
as mentally retarded in order to check whether the gaps are being driven by the extreme version
of pathological left-handedness discussed above. This also has little impact on the estimated gaps,
largely because the number of such individuals is quite small in these samples. Panel (B) performs
the same robustness checks using annual earnings as an outcome and shows that the estimated
gaps are not particularly sensitive to these choices of specification. The magnitude of the cogni-
tive skill and wage gaps is thus not very sensitive to the precise definition of handedness nor the
inclusion of mentally retarded individuals.
Table 9 explores the extent to which the observed differences between lefties and righties in
cognitive skill and earnings varies by various characteristics of the individual. To do so, I add
to the regression model an interaction between left-handedness and an indicator for the given
characteristic. Panel (A) explores gender differences in the impact of handedness. Here, the main
coefficient represents the gap between left- and right-handed males, while the interaction coeffi-
19

cient represents any difference in that gap between males and females. The interaction coefficient
is statistically insignificant across all samples and outcomes, providing no evidence that the gaps
between lefties and righties vary by gender.
To test whether access to resources might mitigate such gaps, I use high levels of maternal
education as a proxy for socioeconomic status. I define highly educated mothers so that roughly
25% of individuals in each sample have such mothers, which allows for consistency across all of
the samples. In the NLSC, though the interation coefficient is statistically insignificant, its magni-
tude suggests that lefties born to highly educated mothers have nearly identical cognitive scores
to righties. Conversely, in neither the pooled US or UK sample is the interaction coefficient in the
cognitive skill regressions very different from zero, providing little evidence that family resources
can mitigate these gaps. If anything, lefties born to highly educated mothers show even larger
earnings gaps, given the magnitude and negative sign of the interaction coefficients in columns
(3) and (5).
Given that left-handedness has both genetic and environmental origins, panels (C) and (D)
attempt to determine whether genetic lefties and environmental lefties seem different. Panel (C)
divides lefties into those with good infant health, who were born with neither complications nor
low birthweight, and those with bad infant health, who were born with either complciations or
low birthweight. Though this method of dividing the sample is crude, those with good infant
health are more likely to be left-handed due to genetics and those with poor infant health are more
likely to be left-handed due to environmental causes such as health shocks. In column (1) of panel
(C), lefties with poor infant health score 0.2 standard deviations lower in cognitive skill than do
righties with poor infant health. The interaction term, though statistically insignificant, suggests
that the cognitive gap is roughly half that size for infant born in good health. By contrast, in
the UK sample in column (4), the interaction coefficient suggests little difference in the cognitive
skill gap by infant health status. In column (5), however, the marginally significant interaction
coefficient is positive and nearly equal in magnitude to the main coefficient. The earnings gap is
thus indistinguishable from zero for those born with good infant health.
The NLSC provides another way to separate the two types of left-handedness. Lefties born to
20

left-handed mothers are much more likely than other lefties to carry left-handed genes, so panel
(D) interacts the individual’s left-handedness with maternal left-handedness. The main coefficient
suggests that lefties born to right-handed mothers have 0.15 standard deviations lower cognitive
skill than righties. The interaction coefficient is, however, opposite in sign and twice as large in
magnitude, implying that lefties born to left-handed mothers actually score 0.14 standard devi-
ations high than righties on measures of cognitive skill. The results of panels (C) and (D) thus
strongly suggest that most, if not all, of the cognitive skill and earnings gaps measured in this
paper come from left-handedness induced by environmental rather than genetic factors.
5 Conclusion
Across the multiple samples used in this paper, left-handed individuals show consistently lower
cognitive skills, higher rates of mental or behavioral disabilities, lower educational attainment and
lower earnings than right-handed individuals. The evidence on occupational choice suggests that
the primary disadvantage of left-handedness is not manual but cognitive. These cognitive deficits
are generally more pronounced in lefties likely to be left-handed due to in utero health shocks,
rather than those likely to be left-handed due to genetics.
Table 10 shows that these observed human capital deficits explain a substantial fraction of the
earnings gap in the NLSY97. Column (1) replicates the baseline specification from the first row
of table 7. The subsequent columns add controls for cognitive skill, disabilities, educational at-
tainment, and occupational choice. Addition of the cognitive controls reduces the left-handedness
earnings gap by 26%. The remaining controls explain a further 27% of the gap, so that these con-
trols in total explain over half of the earnings gap.
The magnitude of these handedness gaps are economically substantial. As table 11, the mag-
nitude of the handedness gap is one-seventh the size of the black-white gap in cognitive skill and
more than one-third as large as the black-white gap in college completion, annual earnings and
hourly wages. The handedness gap in earnings and wages is roughly three times the size of the
effect of an additional year of parental education. These gaps are large enough to be worthy of
our attention.
21

I draw three primary lessons from this investigation. First, brain structure and neural wiring
have a substantial impact on human capital accumulation and labor market outcomes. Second, the
bulk of the impact studied here comes from shocks to infant health that result in changed brain
structures, adding to the increasingly convincing evidence on the long-run importance of early
health. Third, handedness presents parents and schools with a measure of brain structure that
is almost costless to observe. Given the increased educational challenges associated with being
left-handed, parents and schools can use handedness to identify potentially challenged students
earlier and at less cost than they might otherwise.
22

1. REFERENCES
2. Aizer, Anne, 2009. Peer Effects, Institutions and Human Capital Acculation: The Externali-ties of ADD. Brown University Working Paper.
3. Almond, Douglas and Janet Currie, 2011. Killing Me Softly: The Fetal Origins Hypothesis.Journal of Economic Perspectives 25(3): 15372.
4. Benbow, Camilla Persson, 1986. Note: Physiological Correlates of Extreme Intellectual Pre-cocity. Neuropsychologia 24(5): 719-725.
5. Bisazza, Angelo, L.J. Rogers, and Giorgio Vallortigara, 1998. The Origins of Cerebral Asym-metry: A Review of Evidence of Behaviourfal and Brain Lateralization in Fishes, Reptilesand Amphibians. Neuroscience and Biobehavioural Reviews 22(3): 411-26.
6. Carter-Saltzman, Louise, Sandra Scarr-Salapatek, William B. Barker, and Solomon Katz,1975. Left-Handedness in Twins: Incidence and Patterns of Performance in an AdolscentSample. Behavior Genetics 6(2): 189-203.
7. Coren, Stanley, 1995. Differences in Divergent Thinking as a Function of Handedness andSex. The American Journal of Psychology 108(3): 311-25.
8. Currie, Janet and Mark Stabile, 2006. Child Mental Health and Human Capital Accumula-tion: The Case of ADHD. Journal of Health Economics 25(6): 1094-1118.
9. Currie, Janet, Mark Stabile and Jonathan Gruber (ed.), 2009. Mental Health in Childhoodand Human Capital. An Economic Perspective on the Problems of Disadvantaged Youth. Chicago:University of Chicago Press for NBER.
10. Denny, Kevin, and Vincent O’Sullivan, 2007. The Economic Consequences of Being Left-Handed: Some Sinister Results. The Journal of Human Resources 42(2): 353–374.
11. Dragovic, M. and G. Hammond, 2005. Handedness in Schizophrenia: A Quantitative Re-view of Evidence. Acta Psychiatrica Scandinavica 111: 410–419.
12. Halpern D.F., M.G. Haviland MG, and C.D. Killian, 1998. Handedness and Sex Differences inIntelligence: Evidence from the Medical College Admission Test. Brain and Cognition 36(12):1275-82.
13. Hardyck, Curtis and Lewis F. Petrinovich ,1977. Left-Handedness. Psychological Bulletin 84(3): 385-404.
14. Harkins, Debra A. and George F. Michel, 1988. Evidence for a Maternal Effect on InfantHand-Use Preferences. Developmental Psychobiology 21(6): 535-541.
15. Heckman, James, 2011. The Economics of Inequality: The Value of Early Childhood Educa-tion. American Educator Spring: 3-47.
16. Heckman, James and F. Cunha, (2010).“Investing in Our Young People,” in Arthur Reynolds,Arthur Rolnick, Michelle Englund, and Judy A. Temple, (eds.) Cost-Effective Programs in Chil-dren’s First Decade: A Human Capital Integration. New York: Cambridge University Press.
23
17. Heckman, James, 1995. Lessons from the Bell Curve. Journal of Political Economy, 103(5):1091-1120.
18. Johnston, David W., Manisha Shah, and Michael A. Shields, 2007. Handedness, Time Useand Early Childhood Development. IZA Discussion Paper No. 2752.
19. McManus, I.C. and M.P. Bryden, 1991. Geschwind’s Theory of Cerebral Lateralization: De-veloping a Formal, Causal Model. Psychological Bulletin 110: 237-253.
20. McManus, I.C. and C.G.N. Mascie-Taylor, 1983. Biosocial Correlates of Cognitive Abilities.Journal of Biosocial Science 15: 289-306.
21. Medland, Sarah E., David L. Duffy, Margaret J. Wright, Gina M. Geffen, David A. Hay, Flo-rence Levy, Catherina E.M. van-Beijsterveldt, Gonneke Willemsen, Grant C. Townsend, VickiWhite, Alex W. Hewitt, David A. Mackey, J. Michael Bailey, Wendy S. Slutske, Dale R. Ny-holt, Susan A Treloar, Nicholas G. Martin, Dorret I. Boomsma, 2009. Genetic Influences onHandedness: Data from 25,732 Australian and Dutch Twin Families. Neuropsychologia 47:330-337.
22. Perelle, Ira B. and Lee Ehrman, 2005. On the Other Hand. Behavior Genetics 35 (3): 343-350.
23. Raymond, Michel, Dominique Pontier, Anne-Beatrice Dufour, and Anders Pape Moller,1996. Frequency-Dependent Maintenance of Left Handedness in Humans. Proceedings: Bio-logical Sciences 263 (1377): 1627-1633.
24. Rodriquez, Aline, Marika Kaakinen, Irma Moilanen, Anja Taanila, James J. McGough, San-dra Loo, and Marjo-Riita Jarvelin, 2010. Mixed-Handedness is Linked to Mental HealthProblems in Children and Adolescents. Pediatrics 125: 340 – 348.
25. Ruebeck, Christopher S., Joseph E Harrington Jr., and Robert Moffitt, 2006. Handedness andEarnings. NBER Working Paper No. 12387.
26. Pujot, Jesus, Joan Deus, and Josep M. Losilla, 1999. Cerebral Lateralization of Language inNormal Left-handed People Studied by Functional MRI. Neurology 52: 1038-1043.
27. Segal, Carmit, 2008. Motivation, Test Scores, and Economic Success. Universitat PompeuFabra Department of Economics and Business Economics Working Papers.
28. Vuoksimaaa E., Koskenvuoa M., Rosea R.J., Kaprio J., 2009. Origins of handedness: A Na-tionwide Study of 30 161 Adults. Neuropsychologia 1294-1301.
24

Figure 1: Distribution of Left-Handedness
0.2
.4.6
.8F
ract
ion
0 .5 1Left−handedness
(A) NLSC
0.2
.4.6
.8F
ract
ion
0 .5 1Left−handedness
(B) NLSC−FE
0.2
.4.6
.8F
ract
ion
0 .5 1Left−handedness
(C) NLSY790
.2.4
.6.8
Fra
ctio
n
0 .5 1Left−handedness
(D) NLSY97
0.2
.4.6
.8F
ract
ion
0 .5 1Left−handedness
(E) NCDS58
0.2
.4.6
.8F
ract
ion
0 .5 1Left−handedness
(F) BCS70
25

Figure 2: Cognitive Skill Distribution by Handedness (NLSC)
0.1
.2.3
.4
Den
sity
−2 −1 0 1 2
Cognitive skill
Left−handed
Right−handed
26

Figure 3: Cognitive Skill Distribution by Handedness (US samples)
0.1
.2.3
.4
Den
sity
−2 −1 0 1 2
Cognitive skill
Left−handed
Right−handed
(A) NLSY790
.1.2
.3.4
Den
sity
−2 −1 0 1 2
Cognitive skill
Left−handed
Right−handed
(B) NLSY97
27

Figure 4: Cognitive Skill Distribution by Handedness (UK samples)
0.1
.2.3
.4
Den
sity
−2 −1 0 1 2
Cognitive skill
Left−handed
Right−handed
(A) NCDS580
.1.2
.3.4
Den
sity
−2 −1 0 1 2
Cognitive skill
Left−handed
Right−handed
(B) BCS70
28

Figure 5: Earnings Distribution by Handedness (US samples)
.1.1
2.1
4.1
6.1
8.2
Fra
ctio
n l
eft
−h
an
ded
1 2 3 4 5 6 7 8 9 10
Annual earnings decile
(A) NLSY79 − Males
.08
.1.1
2.1
4.1
6.1
8F
ract
ion
left
−h
an
ded
1 2 3 4 5 6 7 8 9 10
Annual earnings decile
(B) NLSY79 − Females
.14
.16
.18
.2.2
2.2
4F
ract
ion
left
−h
an
ded
1 2 3 4 5 6 7 8 9 10
Annual earnings decile
(C) NLSY97 − Males
.1.1
2.1
4.1
6.1
8.2
Fra
ctio
n l
eft
−h
an
ded
1 2 3 4 5 6 7 8 9 10
Annual earnings decile
(D) NLSY97 − Females
Notes: Each dot is an income decile. The dashed line is the fraction of lefties in the sample.
29

Figure 6: Earnings Distribution by Handedness (UK samples)
.11
.13
.15
.17
Fra
ctio
n l
eft
−h
an
ded
1 2 3 4 5 6 7 8 9 10
Annual earnings decile
(A) NCDS58 − Males
.08
.1.1
2.1
4F
ract
ion
left
−h
an
ded
1 2 3 4 5 6 7 8 9 10
Annual earnings decile
(B) NCDS58 − Females
.08
.1.1
2.1
4F
ract
ion
left
−h
an
ded
1 2 3 4 5 6 7 8 9 10
Annual earnings decile
(C) BCS70 − Males
.07
.09
.11
.13
Fra
ctio
n l
eft
−h
an
ded
1 2 3 4 5 6 7 8 9 10
Annual earnings decile
(D) BCS70 − Females
Notes: Each dot is an income decile. The dashed line is the fraction of lefties in the sample.
30
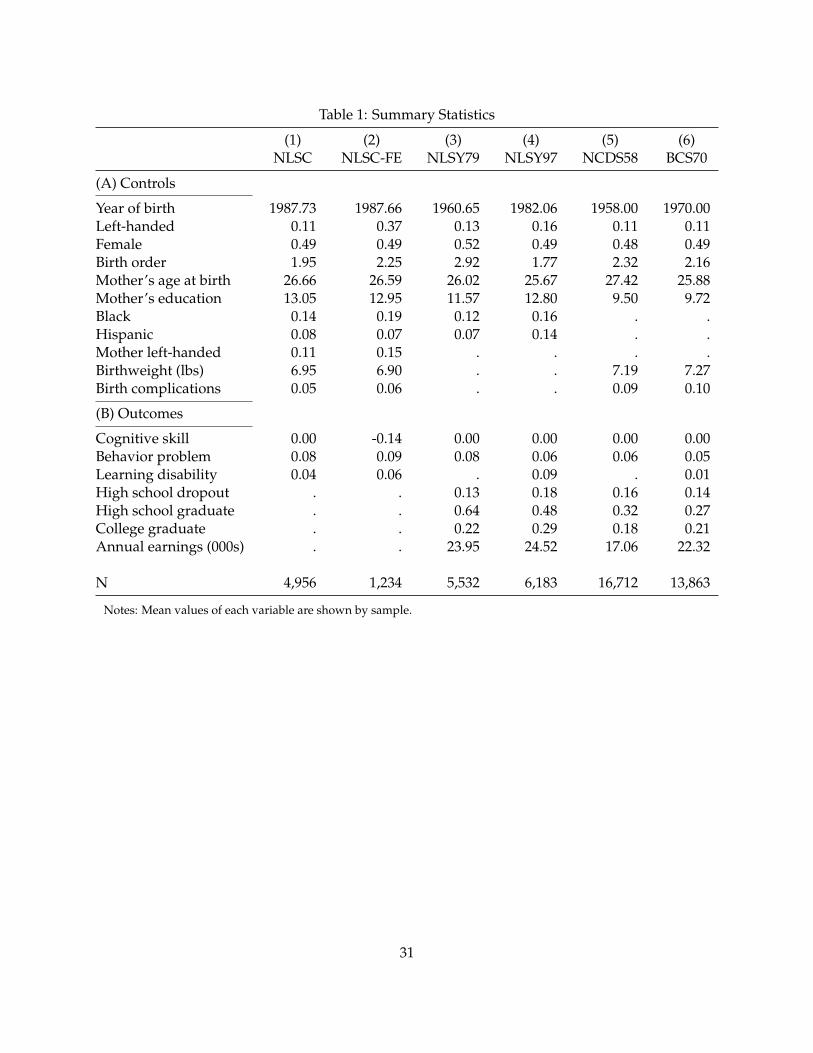
Table 1: Summary Statistics
(1) (2) (3) (4) (5) (6)NLSC NLSC-FE NLSY79 NLSY97 NCDS58 BCS70
(A) Controls
Year of birth 1987.73 1987.66 1960.65 1982.06 1958.00 1970.00Left-handed 0.11 0.37 0.13 0.16 0.11 0.11Female 0.49 0.49 0.52 0.49 0.48 0.49Birth order 1.95 2.25 2.92 1.77 2.32 2.16Mother’s age at birth 26.66 26.59 26.02 25.67 27.42 25.88Mother’s education 13.05 12.95 11.57 12.80 9.50 9.72Black 0.14 0.19 0.12 0.16 . .Hispanic 0.08 0.07 0.07 0.14 . .Mother left-handed 0.11 0.15 . . . .Birthweight (lbs) 6.95 6.90 . . 7.19 7.27Birth complications 0.05 0.06 . . 0.09 0.10
(B) Outcomes
Cognitive skill 0.00 -0.14 0.00 0.00 0.00 0.00Behavior problem 0.08 0.09 0.08 0.06 0.06 0.05Learning disability 0.04 0.06 . 0.09 . 0.01High school dropout . . 0.13 0.18 0.16 0.14High school graduate . . 0.64 0.48 0.32 0.27College graduate . . 0.22 0.29 0.18 0.21Annual earnings (000s) . . 23.95 24.52 17.06 22.32
N 4,956 1,234 5,532 6,183 16,712 13,863
Notes: Mean values of each variable are shown by sample.
31

Tabl
e2:
Det
erm
inan
tsof
Left
-Han
dedn
ess
(1)
(2)
(3)
(4)
(5)
(6)
(7)
(8)
NLS
CN
LSC
-FE
Pool
edU
SN
LSY
79N
LSY
97Po
oled
UK
NC
DS5
8BC
S70
Fem
ale
-0.0
32∗∗
∗-0
.148
∗∗∗
-0.0
28∗∗
∗-0
.025
∗∗∗
-0.0
31∗∗
∗-0
.026
∗∗∗
-0.0
33∗∗
∗-0
.017
∗∗∗
(0.0
09)
(0.0
50)
(0.0
07)
(0.0
09)
(0.0
09)
(0.0
04)
(0.0
05)
(0.0
06)
Mot
her’
sag
eat
birt
h0.
002
0.07
80.
001
0.00
10.
001
-0.0
00-0
.001
-0.0
00(0
.002
)(0
.061
)(0
.001
)(0
.001
)(0
.001
)(0
.000
)(0
.001
)(0
.001
)M
othe
r’s
educ
atio
n-0
.002
0.00
10.
000
0.00
1-0
.000
0.00
0-0
.001
(0.0
02)
(0.0
01)
(0.0
02)
(0.0
02)
(0.0
01)
(0.0
02)
(0.0
02)
Blac
k0.
030∗
∗0.
019∗
0.02
5∗0.
014
(0.0
14)
(0.0
10)
(0.0
15)
(0.0
14)
His
pani
c-0
.022
0.00
9-0
.015
0.02
1(0
.015
)(0
.012
)(0
.019
)(0
.015
)Bi
rthw
eigh
t(lb
s)-0
.002
-0.0
08-0
.005
∗∗∗
-0.0
05∗∗
∗-0
.004
(0.0
03)
(0.0
15)
(0.0
01)
(0.0
02)
(0.0
02)
Birt
hco
mpl
icat
ions
0.05
0∗∗
0.13
30.
016∗
∗0.
017∗
0.01
6∗
(0.0
24)
(0.1
08)
(0.0
07)
(0.0
09)
(0.0
09)
Mot
her
left
-han
ded
0.04
9∗∗∗
(0.0
15)
R2
0.01
80.
134
0.00
60.
004
0.00
50.
003
0.00
40.
002
N4,
956
1,23
411
,715
5,53
26,
183
29,5
1516
,712
12,8
03p
(inf
anth
ealt
h)0.
064
0.35
6.
..
0.00
00.
004
0.06
7
Not
es:
Het
eros
keda
stic
ity
robu
stst
anda
rder
rors
,cl
uste
red
bym
othe
rin
US
sam
ples
,ar
ere
port
edin
pare
nthe
ses
(*p<
.10
**p<
.05
***
p<.0
1).
Each
colu
mn
isan
OLS
regr
essi
onof
ale
ft-h
ande
dnes
sin
dica
tor
onth
ese
tof
cont
rols
show
n,as
wel
las
year
ofbi
rth
dum
mie
s,bi
rth
orde
rdu
mm
ies,
and
dum
mie
sfo
rm
issi
ngbi
rth
orde
r,m
ater
nale
duca
tion
,bir
thw
eigh
t,an
dm
ater
nall
eft-
hand
edne
ss.C
olum
n(2
)inc
lude
sm
othe
rfix
edef
fect
s.A
lso
show
nis
the
p-va
lue
from
anF-
test
ofth
ejo
ints
igni
fican
ceof
birt
hwei
ghta
ndbi
rth
com
plic
atio
ns.
32

Tabl
e3:
Cog
niti
veSk
ills
(1)
(2)
(3)
(4)
(5)
(6)
(7)
(8)
NLS
CN
LSC
-FE
Pool
edU
SN
LSY
79N
LSY
97Po
oled
UK
NC
DS5
8BC
S70
Cog
niti
vesk
ill-0
.108
∗∗-0
.164
∗∗∗
-0.0
70∗∗
∗-0
.034
-0.0
96∗∗
∗-0
.067
∗∗∗
-0.0
58∗∗
-0.0
82∗∗
∗
(0.0
44)
(0.0
57)
(0.0
25)
(0.0
35)
(0.0
35)
(0.0
19)
(0.0
24)
(0.0
30)
N4,
679
1,17
110
,386
5,29
05,
096
27,4
4916
,608
10,8
41
Mat
hsc
ore
-0.0
98∗∗
-0.1
39∗∗
-0.0
64∗∗
-0.0
22-0
.097
∗∗∗
-0.0
64∗∗
∗-0
.050
∗∗-0
.086
∗∗∗
(0.0
45)
(0.0
61)
(0.0
25)
(0.0
36)
(0.0
36)
(0.0
19)
(0.0
24)
(0.0
30)
N4,
675
1,16
810
,378
5,29
05,
088
27,2
1216
,600
10,6
12
Rea
ding
scor
e-0
.095
∗∗-0
.160
∗∗∗
-0.0
66∗∗
∗-0
.040
-0.0
82∗∗
-0.0
61∗∗
∗-0
.056
∗∗-0
.068
∗∗
(0.0
43)
(0.0
59)
(0.0
25)
(0.0
36)
(0.0
35)
(0.0
19)
(0.0
24)
(0.0
30)
N4,
676
1,16
910
,386
5,29
05,
096
27,4
4116
,602
10,8
39
Bott
om10
%0.
034∗
∗0.
037∗
0.03
4∗∗∗
0.02
4∗0.
041∗
∗∗0.
023∗
∗∗0.
020∗
∗0.
029∗
∗∗
(0.0
15)
(0.0
22)
(0.0
09)
(0.0
12)
(0.0
12)
(0.0
06)
(0.0
08)
(0.0
10)
N4,
679
1,17
110
,386
5,29
05,
096
27,4
4916
,608
10,8
41
Top
10%
-0.0
09-0
.024
-0.0
18∗∗
-0.0
15-0
.019
∗-0
.001
0.00
5-0
.011
(0.0
13)
(0.0
21)
(0.0
08)
(0.0
11)
(0.0
11)
(0.0
06)
(0.0
07)
(0.0
09)
N4,
679
1,17
110
,386
5,29
05,
096
27,4
4916
,608
10,8
41
Cod
ing
spee
d-0
.119
∗∗∗
-0.0
95∗∗
∗-0
.132
∗∗∗
(0.0
26)
(0.0
35)
(0.0
38)
N10
,316
5,29
05,
026
Cop
ying
desi
gns
-0.1
18∗∗
∗-0
.113
∗∗∗
-0.1
27∗∗
∗
(0.0
20)
(0.0
26)
(0.0
30)
N25
,746
14,7
2311
,023
Not
es:
Het
eros
keda
stic
ity
robu
stst
anda
rder
rors
,cl
uste
red
bym
othe
rin
US
sam
ples
,ar
ere
port
edin
pare
nthe
ses
(*p<
.10
**p<
.05
***
p<.0
1).
Each
coef
ficie
ntco
mes
from
are
gres
sion
ofth
eou
tcom
eon
ale
ft-h
ande
dnes
sin
dica
tor
and
the
othe
rco
ntro
lslis
ted
inta
ble
2.Th
eco
gnit
ive,
mat
h,re
adin
g,co
ding
spee
dan
dco
pyin
gde
sign
sou
tcom
esar
eZ
-sco
res
norm
aliz
edby
age.
The
top
and
bott
om10
%ou
tcom
esar
ebi
nary
vari
able
s.
33

Tabl
e4:
Dis
abili
ties
(1)
(2)
(3)
(4)
(5)
(6)
(7)
(8)
NLS
CN
LSC
-FE
Pool
edU
SN
LSY
79N
LSY
97Po
oled
UK
NC
DS5
8BC
S70
Beha
vior
prob
lem
0.03
5∗∗
0.05
0∗∗
0.01
6∗∗
0.01
60.
016∗
0.01
3∗∗∗
0.01
5∗∗
0.01
1(0
.014
)(0
.021
)(0
.007
)(0
.012
)(0
.009
)(0
.005
)(0
.007
)(0
.007
)µR
0.07
70.
077
0.07
00.
082
0.06
00.
056
0.05
90.
051
N4,
799
1,19
711
,188
5,00
56,
183
25,6
2414
,592
11,0
32
Men
tally
reta
rded
0.00
9∗0.
013∗
∗0.
007∗
∗0.
008
0.00
50.
011∗
∗∗0.
010∗
∗∗0.
014∗
∗
(0.0
05)
(0.0
07)
(0.0
03)
(0.0
06)
(0.0
03)
(0.0
03)
(0.0
03)
(0.0
06)
µR
0.00
40.
001
0.01
00.
017
0.00
30.
022
0.00
80.
038
N4,
793
1,19
611
,715
5,53
26,
183
26,2
3114
,449
11,7
82
Spee
chpr
oble
m0.
018∗
∗0.
020∗
0.00
40.
015∗
∗0.
020∗
∗0.
009
(0.0
07)
(0.0
11)
(0.0
07)
(0.0
07)
(0.0
09)
(0.0
11)
µR
0.01
20.
015
0.03
40.
159
0.15
90.
159
N4,
793
1,19
66,
183
29,4
1816
,658
12,7
60
Lear
ning
disa
bilit
y0.
022∗
∗0.
027
0.03
1∗∗∗
0.00
6(0
.011
)(0
.017
)(0
.011
)(0
.005
)µR
0.04
20.
049
0.08
80.
014
N4,
793
1,19
66,
183
8,78
5
Dig
itsp
an:f
orw
ard
0.00
4-0
.094
-0.0
19(0
.049
)(0
.071
)(0
.031
)N
4,48
71,
124
10,5
18
Dig
itsp
an:b
ackw
ard
-0.1
07∗∗
-0.1
99∗∗
(0.0
50)
(0.0
77)
N4,
488
1,12
3
Not
es:
Het
eros
keda
stic
ity
robu
stst
anda
rder
rors
,cl
uste
red
bym
othe
rin
US
sam
ples
,ar
ere
port
edin
pare
nthe
ses
(*p<
.10
**p<
.05
***
p<.0
1).
Each
coef
ficie
ntco
mes
from
are
gres
sion
ofth
eou
tcom
eon
ale
ft-h
ande
dnes
sin
dica
tor
and
the
othe
rco
ntro
lslis
ted
inta
ble
2.A
llou
tcom
esar
ebi
nary
exce
ptfo
rth
edi
gits
pan
scor
es,w
hich
are
Z-s
core
sno
rmal
ized
byag
e.Be
low
each
coef
ficie
nton
abi
nary
outc
ome
isth
em
ean
ofth
atou
tcom
efo
rri
ght-
hand
edin
divi
dual
s.
34

Table 5: Educational Attainment(1) (2) (3) (4) (5) (6)
Pooled US NLSY79 NLSY97 Pooled UK NCDS58 BCS70
College graduate -0.029∗∗∗ -0.019 -0.034∗∗ -0.008 -0.005 -0.012(0.010) (0.015) (0.014) (0.007) (0.009) (0.011)
µR 0.258 0.221 0.292 0.193 0.176 0.214
High school graduate 0.024∗ 0.020 0.025 -0.005 -0.006 -0.003(0.013) (0.019) (0.017) (0.008) (0.011) (0.013)
µR 0.558 0.643 0.479 0.295 0.318 0.267
High school dropout 0.004 0.002 0.006 0.013∗ 0.011 0.016(0.009) (0.013) (0.013) (0.007) (0.009) (0.010)
µR 0.156 0.130 0.181 0.153 0.162 0.143
Missing education 0.001 -0.003 0.003 -0.000 0.001 -0.001(0.004) (0.003) (0.007) (0.009) (0.012) (0.014)
µR 0.028 0.007 0.048 0.358 0.343 0.376
N 11,715 5,532 6,183 29,515 16,712 12,803
Notes: Heteroskedasticity robust standard errors, clustered by mother in US samples, are reported in parentheses(* p<.10 ** p<.05 *** p<.01). Each coefficient comes from a regression of the outcome on a left-handedness indi-cator and the other controls listed in table 2. Below each coefficient is the mean of that outcome for right-handedindividuals.
35

Table 6: Occupational Characteristics
(1) (2) (3) (4) (5) (6)Pooled US NLSY79 NLSY97 Pooled UK NCDS58 BCS70
(A) Occupational categories
Professional/managerial -0.039∗∗∗ -0.022 -0.050∗∗∗ -0.016∗∗ -0.011 -0.023∗
(0.010) (0.015) (0.014) (0.008) (0.010) (0.012)µR 0.241 0.211 0.269 0.239 0.228 0.253
All other occupations 0.007 -0.003 0.013 0.004 0.012 -0.005(0.012) (0.017) (0.017) (0.009) (0.012) (0.012)
µR 0.654 0.737 0.578 0.336 0.401 0.259
Missing occupation 0.032∗∗∗ 0.025∗∗ 0.037∗∗∗ 0.012 -0.001 0.028∗
(0.009) (0.010) (0.013) (0.009) (0.012) (0.014)µR 0.103 0.052 0.150 0.424 0.371 0.488
N 11,715 5,532 6,183 29,515 16,712 12,803
(B) Occupational abilities
Cognitive (overall) -0.079∗∗∗ -0.050 -0.097∗∗∗
(0.028) (0.041) (0.037)
Cognitive (creative) -0.071∗∗∗ -0.027 -0.102∗∗∗
(0.027) (0.040) (0.037)
Physical (overall) 0.037 0.054 0.018(0.027) (0.038) (0.037)
Physical (manual) 0.057∗∗ 0.053 0.055(0.027) (0.038) (0.038)
N 10,187 5,141 5,046
Notes: Heteroskedasticity robust standard errors, clustered by mother in US samples, are reported in parentheses(* p<.10 ** p<.05 *** p<.01). Each coefficient comes from a regression of the outcome on a left-handedness indi-cator and the other controls listed in table 2. All outcomes in panel (A) are binary and below each coefficient isthe mean of that outcome for right-handed individuals. All outcomes in panel (B) are Z-scores normalized acrossthe sample.
36

Table 7: Annual Earnings and Hourly Wages
(1) (2) (3) (4) (5) (6)Pooled US NLSY79 NLSY97 Pooled UK NCDS58 BCS70
(A) Annual earnings
Mean earnings -1.793∗∗∗ -1.173∗ -2.236∗∗∗ -0.874∗∗ -0.528 -1.332∗∗
(0.504) (0.704) (0.715) (0.357) (0.385) (0.675)µR 24.401 24.028 24.789 19.329 17.008 22.415
Median earnings -2.504∗∗∗ -2.837∗∗∗ -0.006 -2.029∗∗∗
(0.750) (0.864) (0.347) (0.662)µR 22.123 22.934 14.779 20.339
Low earnings 0.042∗∗∗ 0.042∗∗∗ 0.042∗∗∗ 0.015∗ -0.004 0.042∗∗∗
(0.010) (0.014) (0.014) (0.008) (0.010) (0.015)µR 0.136 0.128 0.144 0.159 0.134 0.192
N 10,916 5,481 5,435 17,833 10,488 7,345
(B) Hourly wages
Mean wage -0.823∗∗∗ -0.736∗∗ -0.858∗∗ -0.532∗∗∗ -0.273 -0.901∗∗∗
(0.247) (0.311) (0.372) (0.171) (0.179) (0.330)µR 13.83 13.49 14.17 9.74 8.49 11.41
Median wage -0.803∗∗ -0.627∗∗ -0.052 -0.829∗∗
(0.338) (0.302) (0.136) (0.352)µR 12.59 12.38 7.37 10.22
Low wage 0.039∗∗∗ 0.040∗∗∗ 0.037∗∗∗ 0.019∗∗ -0.002 0.049∗∗∗
(0.008) (0.013) (0.011) (0.008) (0.010) (0.015)µR 0.082 0.086 0.078 0.154 0.125 0.192
N 10,949 5,483 5,466 17,831 10,486 7,345
Notes: Heteroskedasticity robust standard errors, clustered by mother in US samples, are reported in parentheses(* p<.10 ** p<.05 *** p<.01). Each coefficient comes from a regression of the outcome on a left-handedness indi-cator and the other controls listed in table 2. Median impacts are estimated with quantile regressions. Below eachcoefficient is the mean or median of that outcome for right-handed individuals.
37

Tabl
e8:
Rob
ustn
ess
toA
lter
nate
Mea
sure
sof
Left
-Han
dedn
ess
(1)
(2)
(3)
(4)
(5)
(6)
(7)
(8)
NLS
CN
LSC
-FE
Pool
edU
SN
LSY
79N
LSY
97Po
oled
UK
NC
DS5
8BC
S70
(A)C
ogni
tive
scor
e
Left
-han
ded
-0.1
08∗∗
-0.1
64∗∗
∗-0
.070
∗∗∗
-0.0
34-0
.096
∗∗∗
-0.0
67∗∗
∗-0
.058
∗∗-0
.082
∗∗∗
(0.0
44)
(0.0
57)
(0.0
25)
(0.0
35)
(0.0
35)
(0.0
19)
(0.0
24)
(0.0
30)
Left
-han
dedn
ess
-0.1
38∗∗
∗-0
.176
∗∗-0
.073
∗∗∗
-0.0
21-0
.124
∗∗∗
-0.0
94∗∗
∗-0
.090
∗∗∗
-0.1
02∗∗
∗
(0.0
51)
(0.0
70)
(0.0
28)
(0.0
37)
(0.0
42)
(0.0
21)
(0.0
26)
(0.0
35)
Cle
arly
left
-han
ded
-0.0
95∗∗
-0.1
50∗∗
-0.0
58∗∗
-0.0
08-0
.107
∗∗-0
.047
∗∗-0
.045
∗-0
.051
(0.0
46)
(0.0
65)
(0.0
29)
(0.0
38)
(0.0
43)
(0.0
19)
(0.0
24)
(0.0
31)
Not
men
tally
reta
rded
-0.0
97∗∗
-0.1
49∗∗
∗-0
.065
∗∗∗
-0.0
29-0
.091
∗∗∗
-0.0
55∗∗
∗-0
.043
∗-0
.072
∗∗
(0.0
43)
(0.0
55)
(0.0
25)
(0.0
35)
(0.0
34)
(0.0
19)
(0.0
25)
(0.0
30)
(B)A
nnua
lear
ning
s
Left
-han
ded
-1.7
93∗∗
∗-1
.173
∗-2
.236
∗∗∗
-0.8
74∗∗
-0.5
28-1
.332
∗∗
(0.5
04)
(0.7
04)
(0.7
15)
(0.3
57)
(0.3
85)
(0.6
75)
Left
-han
dedn
ess
-2.0
12∗∗
∗-0
.919
-3.0
62∗∗
∗-0
.759
∗-0
.524
-1.0
45(0
.562
)(0
.742
)(0
.848
)(0
.402
)(0
.434
)(0
.797
)
Cle
arly
left
-han
ded
-1.6
27∗∗
∗-0
.614
-2.6
13∗∗
∗-0
.602
-0.3
41-0
.942
(0.5
79)
(0.7
51)
(0.8
91)
(0.3
67)
(0.3
94)
(0.7
19)
Not
men
tally
reta
rded
-1.6
54∗∗
∗-1
.016
-2.1
16∗∗
∗-0
.833
∗∗-0
.358
-1.4
93∗∗
(0.5
07)
(0.7
09)
(0.7
17)
(0.3
70)
(0.4
03)
(0.6
95)
Not
es:
Het
eros
keda
stic
ity
robu
stst
anda
rder
rors
,cl
uste
red
bym
othe
rin
US
sam
ples
,ar
ere
port
edin
pare
nthe
ses
(*p<
.10
**p<
.05
***
p<.0
1).
Each
coef
ficie
ntco
mes
from
are
gres
sion
ofth
eou
tcom
eon
am
easu
reof
left
-han
dedn
ess
and
the
othe
rco
ntro
lslis
ted
inta
ble
2.Th
efir
stro
wof
each
pane
lis
the
base
line
spec
ifica
tion
foun
din
tabl
es3
and
7.Th
ese
cond
row
ofea
chpa
nelr
epla
ces
the
left
-han
dedn
ess
indi
cato
rw
ith
aco
ntin
uous
mea
sure
ofha
nded
ness
.Th
eth
ird
row
ofea
chpa
nelu
ses
the
left
-han
dedn
ess
indi
cato
rbu
texc
lude
sm
ixed
-han
ded
indi
vidu
als.
The
four
thro
wof
each
pane
luse
sth
ele
ft-h
ande
dnes
sin
dica
tor
bute
xclu
des
men
tally
reta
rded
indi
vidu
als.
38

Table 9: Heterogeneity in Cognitive and Earnings Gaps
NLSC Pooled US Pooled UK(1) (2) (3) (4) (5)
Cognitive Cognitive Annual Cognitive Annualskill skill earnings skill earnings
(A) By gender
Left-handed -0.120∗ -0.087∗∗ -1.644∗∗ -0.072∗∗∗ -1.065∗∗
(0.062) (0.035) (0.759) (0.025) (0.526)Lefty * female 0.029 0.036 -0.327 0.010 0.410
(0.088) (0.049) (0.991) (0.037) (0.705)
(B) By maternal education
Left-handed -0.129∗∗ -0.073∗∗ -1.541∗∗∗ -0.066∗∗∗ -0.549(0.050) (0.030) (0.561) (0.021) (0.371)
Lefty * highly educated mom 0.102 0.009 -0.925 -0.012 -1.837∗
(0.100) (0.053) (1.222) (0.046) (1.081)
(C) By infant health
Left-handed -0.203∗∗ -0.078∗ -2.318∗∗∗
(0.100) (0.045) (0.833)Lefty * good infant health 0.119 0.013 1.727∗
(0.110) (0.050) (0.921)
(D) By maternal handedness
Left-handed -0.153∗∗∗
(0.049)Lefty * lefty mom 0.291∗∗∗
(0.098)
N 4,679 10,386 10,916 27,449 17,833
Notes: Heteroskedasticity robust standard errors, clustered by mother in US samples, are reported in parentheses(* p<.10 ** p<.05 *** p<.01). Each pair of coefficients comes from a regression of the outcome on a left-handedindicator, an indicator for the characteristic highlighted in the panel (not shown), the interaction of those two, andthe controls listed in the notes to table 2.
39

Table 10: Explaining The Earnings Gap in the NLSY97
(1) (2) (3) (4) (5)Baseline + cognitive + disability + education + occupation
controls controls controls controls
Left-handed -2.236∗∗∗ -1.649∗∗ -1.489∗∗ -1.414∗∗ -1.061(0.715) (0.700) (0.692) (0.673) (0.654)
Cognitive skill 4.144∗∗∗ 3.764∗∗∗ 1.522∗∗∗ 1.184∗∗∗
(0.412) (0.414) (0.420) (0.409)Bottom 10% -2.709∗∗∗ -1.937∗ -3.057∗∗∗ -2.515∗∗
(1.050) (1.047) (1.018) (0.977)Learning disability -3.723∗∗∗ -3.066∗∗∗ -2.531∗∗∗
(0.859) (0.854) (0.824)Behavior problem -8.360∗∗∗ -6.771∗∗∗ -6.134∗∗∗
(0.989) (0.988) (0.951)High school graduate 6.897∗∗∗ 5.922∗∗∗
(0.588) (0.570)College graduate 13.896∗∗∗ 9.950∗∗∗
(0.837) (0.835)Occupational cognition 4.293∗∗∗
(0.268)Missing occupation -8.056∗∗∗
(0.783)
R2 0.092 0.131 0.146 0.185 0.232N 5,435 5,435 5,435 5,435 5,435
Notes: Heteroskedasticity robust standard errors, clustered by mother, are reported in parentheses (* p<.10 **p<.05 *** p<.01). Each column is a regression of annual earnings on a left-handedness indicator and the othercontrols listed in table 2, using the NLSY97 sample. The first column replicates the first row of table 7. The sub-sequent columns add controls for cognitive skills, disabilities, educational attainment and occupational character-istics. Missing values of cognitive skill, educational attainment and occupational cognition are imputed as zeroes.Included but not shown are an indicator for missing cognitive skill in columns (2)-(5) and an indicator for missingeducation in columns (4) and (5).
40

Table 11: Comparison to Other Gaps in the NLSY97
(1) (2) (3) (4)Cognitive College Annual Hourly
skill graduate earnings wage
Left-handed -0.096∗∗∗ -0.034∗∗ -0.858∗∗ -2.236∗∗∗
(0.035) (0.014) (0.372) (0.715)Female 0.214∗∗∗ 0.093∗∗∗ -2.375∗∗∗ -7.173∗∗∗
(0.025) (0.011) (0.259) (0.508)Black -0.646∗∗∗ -0.094∗∗∗ -1.926∗∗∗ -6.794∗∗∗
(0.039) (0.014) (0.388) (0.675)Hispanic -0.263∗∗∗ -0.043∗∗∗ -0.378 -2.085∗∗∗
(0.045) (0.016) (0.388) (0.730)Parental education 0.104∗∗∗ 0.046∗∗∗ 0.373∗∗∗ 0.775∗∗∗
(0.006) (0.003) (0.060) (0.120)
N 5,096 6,183 5,466 5,435
Notes: Heteroskedasticity robust standard errors, clustered by mother, are reported in parentheses (* p<.10 ** p<.05*** p<.01). Each column is a regression of the outcome on a left-handedness indicator and the other controls listed intable 2, using the NLSY97 sample.
41