effect of handedness and muscle trained plasticity
TRANSCRIPT
Full Terms & Conditions of access and use can be found athttp://www.tandfonline.com/action/journalInformation?journalCode=vjmb20
Journal of Motor Behavior
ISSN: 0022-2895 (Print) 1940-1027 (Online) Journal homepage: http://www.tandfonline.com/loi/vjmb20
Interindividual Variability in Use-DependentPlasticity Following Visuomotor Learning: TheEffect of Handedness and Muscle Trained
Mark van de Ruit & Michael J. Grey
To cite this article: Mark van de Ruit & Michael J. Grey (2018): Interindividual Variability in Use-Dependent Plasticity Following Visuomotor Learning: The Effect of Handedness and MuscleTrained, Journal of Motor Behavior, DOI: 10.1080/00222895.2018.1446125
To link to this article: https://doi.org/10.1080/00222895.2018.1446125
© 2018 The Author(s). Published withlicense by Taylor & Francis© Mark van deRuit and Michael J. Grey
Published online: 03 Apr 2018.
Submit your article to this journal
Article views: 46
View related articles
View Crossmark data

RESEARCH ARTICLE
Interindividual Variability in Use-Dependent Plasticity FollowingVisuomotor Learning: The Effect of Handedness and MuscleTrainedMark van de Ruit 1, Michael J. Grey21Department of Biomechanical Engineering, Delft University of Technology, Delft, The Netherlands. 2Acquired Brain InjuryRehabilitation Alliance, School of Health Sciences, University of East Anglia, Norwich, United Kingdom
ABSTRACT. Motor learning has been linked with increases incorticospinal excitability (CSE). However, the robustness of thislink is unclear. In this study, changes in CSE associated withlearning a visuomotor tracking task were mapped using transcra-nial magnetic stimulation (TMS). TMS maps were obtained beforeand after training with the first dorsal interosseous (FDI) of thedominant and nondominant hand, and for a distal (FDI) and proxi-mal (biceps brachii) muscle. Tracking performance improved fol-lowing 20 min of visuomotor training, while map area wasunaffected. Large individual differences were observed with18%–36% of the participants revealing an increase in TMS maparea. This result highlights the complex relationship betweenmotor learning and use-dependent plasticity of the motor cortex.
Keywords: handedness, motor learning, motor mapping, plasticity,TMS
Introduction
Learning or relearning a motor skill has been linked with
use-dependent plasticity in the human motor system
(Butefisch et al., 2000; Plautz, Milliken, & Nudo, 2000;
Sanes & Donoghue, 2000). Use-dependent plasticity can be
explored by assessing changes in excitability of the cortico-
spinal pathway, considered a marker of plasticity (Siebner
& Rothwell, 2003). Transcranial magnetic stimulation
(TMS) is often used to study changes in corticospinal excit-
ability (CSE), e.g., by quantifying the peak-to-peak ampli-
tude of the motor-evoked potential (MEP) elicited when
stimulating the primary motor cortex (Barker, Jalinous, &
Freeston, 1985; Rossini et al., 2015). Whereas early studies
suggested a strong link between increases in CSE and
improved motor performance following motor learning
(Jensen, Marstrand, & Nielsen, 2005; Muellbacher, Zie-
mann, Boroojerdi, Cohen, & Hallett, 2001), more recently
this relationship has been challenged and labelled as con-
siderably variable across participants (Bologna et al., 2015;
Vallence, Kurylowicz, & Ridding, 2013).
Variability in changes of MEP amplitude following
motor learning may explain the equivocal results in the lit-
erature regarding changes in excitability following motor
learning with (1) the dominant vs. the nondominant hand or
(2) a proximal muscle vs. a distal muscle of the arm. The
greatest changes in MEP amplitude following motor learn-
ing have been suggested for the dominant hand by some
(Hammond & Vallence, 2006), but nondominant hand by
others (Cirillo, Rogasch, & Semmler, 2010). Other
researchers reported no difference in MEP facilitation
between hands (Gallasch, Christova, Krenn, Kossev, &
Rafolt, 2009; Garry, Kamen, & Nordstrom, 2004). More-
over, these studies have not found a consistent relationship
between changes in motor performance and MEP ampli-
tude. When comparing motor learning of a proximal and
distal muscle, Krutky and Perreault (2007) reported a pro-
gressively smaller increase in MEP amplitude for a proxi-
mal wrist and upper arm muscle compared with a distal
hand muscle. Yet, equivalent changes in TMS-evoked
movement direction of the index finger, wrist, and elbow
following training were observed. They reported small
MEP changes following training the biceps muscle, which
confirm findings by Ziemann, Muellbacher, Hallett, and
Cohen (2001) who were first to report little to no change in
MEP amplitude following training. In contrast, Jensen,
Marstrand, and Nielsen (2005) reported a significant
increase in biceps MEP amplitude following a visuomotor
tracking learning.
These contradicting results raise questions about vari-
ability in use-dependent plasticity across different muscles
in both the dominant and nondominant arm. The expression
of changes in excitability has many determinants (Ridding
& Ziemann, 2010), (e.g., age, attention, genetics, sex, time
of the day, physical activity, and prior voluntary muscle
activity) and is therefore variable across participants as
some factors are difficult to control. To capture some of
this variability, a recent trend has been to categorize partici-
pants as either responders or nonresponders to the training.
Those participants for whom MEP amplitude increases are
grouped together and categorized as responders, whereas
those participants for whom MEP amplitude does not
change or decreases are categorized as nonresponders (e.g.,
Correspondence address: Dr. Mark van de Ruit, Department ofBiomechanical Engineering. Faculty Mechanical, Maritime andMaterials Engineering, Delft University of Technology, 2628CD,Delft, The Netherlands. e-mail: [email protected]
Color versions of one or more of the figures in the article canbe found online at www.tandfonline.com/vjmb.
� 2018 The author(s). Published with license by Taylor &Francis.
This is an Open Access article distributed under the terms ofthe Creative Commons Attribution-NonCommercial-NoDeriva-tives License (http://creativecommons.org/licenses/by-nc-nd/4.0/),which permits non-commercial re-use, distribution, and reproduc-tion in any medium, provided the original work is properly cited,and is not altered, transformed, or built upon in any way.
1
Journal of Motor Behavior, Vol. 0, No. 0, 2018
Copyright© Taylor & Francis Group, LLC

Wiethoff, Hamada, & Rothwell, 2014). It is possible that a
discrepancy in the number of responders and nonresponders
is a major contributor to the conflicting results regarding
changes in CSE and motor performance following learning
with the dominant and nondominant hand or for different
muscles in the arm.
Therefore, this study was designed to investigate use-
dependent plasticity following a visuomotor tracking learning
task with the dominant and nondominant hand; or distal vs.
proximal muscle. We aimed to quantify the number of res-
ponders and nonresponders with regard to changes in CSE
across all trained muscles. Changes in CSE are assessed using
a novel TMS mapping technique (van de Ruit, Perenboom, &
Grey, 2015), rather than averaging a set of single MEPs to
quantify CSE bymeanMEP amplitude. TMSmaps allow one
to draw the same conclusions as the more commonly used
stimulus-response curve (Ridding & Rothwell, 1997), while
providing the additional ability to expose uneven expansions
of the cortical map or changes in the distribution of excitabil-
ity which can otherwise not be detected. This study comprises
two experiments. In the first experiment, the number of res-
ponders and nonresponders were studied by comparing learn-
ing with the dominant and nondominant hand, as quantified
by changes in TMS map area. In the second experiment, the
number of responders and nonresponders were studied by
comparing learning with a proximal and distal muscle, as
quantified by changes in TMSmap area. Furthermore, in both
studies we tested whether changes in TMS map area were
related to changes in performance.
Methods
Participants
We conducted two experiments involving 40 healthy par-
ticipants (Experiment 1: 20 participants—22 § 3 y, range
18–29, 12 female; Experiment 2: 20 participants—22 § 5 y,
range 18–37, 13 female). The samples were independent,
with different participants taking part in each experiment.
All participants provided written informed consent before
participating in the study. Participants were screened for
contraindications to TMS using a modified version of the
TMS adult safety questionnaire originally suggested by
Keel, Smith, and Wassermann (2001), and handedness was
assessed using the Edinburgh Handedness Inventory (Old-
field, 1971). The study was approved by the University of
Birmingham’s Science, Technology, Engineering and
Mathematics ethics committee (ERN_11-0444), and all
experiments were performed in accordance with the Decla-
ration of Helsinki.
Electromyography
Bipolar surface electrodes (Blue Sensor N, Ambu, Den-
mark) were used to record the electromyographic (EMG)
activity of the first dorsal interosseous (FDI) or biceps
brachii (BB) with only one muscle recorded for each exper-
imental session. All EMG signals were amplified (FDI: 1k;
BB: 2k), band pass filtered (20–1000 Hz), and digitally
sampled at 5 kHz to be stored for offline analysis.
Transcranial Magnetic Stimulation (TMS)
A custom-made polyurethane coated 90 mm figure-of-8
coil (type: batwing; type no. 15411) was used to deliver
magnetic stimuli to the primary motor cortex using a Mag-
stim Rapid2 (Magstim Ltd, Dyfed, United Kingdom). The
coil was held at 45� to the sagittal plane, with the handle in
the posterior direction, to induce biphasic currents in the
lateral-posterior to medial-anterior direction. The site evok-
ing the largest MEPs, the “hotspot”, was found by visual
inspection of the EMG. Subsequently, resting motor thresh-
old (RMT) was determined as the threshold intensity
at which at least 5 out of 10 stimuli evoked MEPs when
stimulating at the hotspot with a peak-to-peak amplitude
> 50 mV (Rossini et al., 1994). Coil position and orienta-
tion were monitored throughout the experiment using
frameless stereotaxy (BrainSight 2, Rogue Research Inc,
Montreal, Canada).
TMS Mapping
CSE was assessed using TMS maps acquired with a novel
rapid mapping procedure that takes advantage of frameless
stereotaxy together with a reduced interstimulus interval
(van de Ruit, Perenboom, & Grey, 2015). After finding the
motor hotspot and motor threshold of the muscle studied, a
square 6 £ 6 cm grid was positioned over the hemisphere
studied. The grid was aligned such that the motor hotspot
would be roughly central in the map to ensure full mapping
of the cortical representation was possible. For each TMS
map, 80 stimuli were delivered at 120% of RMT. Stimuli
were applied at pseudorandom locations within the grid with
each site receiving a single stimulus. It was ensured that
each stimulus was delivered at a different location. The
interstimuls interval (ISI) was set to 1.5 s as this frequency
of stimulus delivery together with the small number of stim-
uli required for the protocol does not depress cortical excit-
ability (Mathias, Barsi, van de Ruit, & Grey, 2014) as has
been shown with longer protocols. To compare across differ-
ent participants, MEPs were normalized before the maps
were constructed (see Experimental Protocol for details).
Experimental Protocol
Experiment 1: Dominant vs. Nondominant Hand Training
In the first experiment, we compared the number of res-
ponders and nonresponders, quantified by changes in TMS
map area, following visuomotor tracking learning for both
the dominant and nondominant hands. Participants visited
the lab twice, during which visuomotor tracking learning
M. VAN DE RUIT & M. J. GREY
2 Journal of Motor Behavior

was performed with either the FDI muscle of the dominant
or nondominant hand. Sessions were separated by at least
7 days but performed at the same time of the day. The order
in which training was performed with dominant and non-
dominant hand was counterbalanced across participants.
Three TMS maps were acquired before and after the visuo-
motor tracking learning task. MEPs were normalized to the
electrically evoked maximal M-wave (Mmax) in order to
compare across different participants. To obtain the Mmax,
a bipolar probe was used to stimulate the ulnar nerve at the
level of the elbow using a constant current stimulator (Digi-
timer DS7A, Digitimer Ltd, Welwyn Garden City, UK).
The visuomotor tracking learning task used in this study
is based on a method successfully applied by others (Jen-
sen, Marstrand, & Nielsen, 2005; Perez, Lungholt, Nyborg,
& Nielsen, 2004). Figure 1 shows the experimental setup
for Experiment 1. Participants were seated comfortably,
with a monitor in their direct line of sight. Participants were
asked to rest the hand that was tested palm down on a table
20 cm in front of them. The distal phalanx of the index fin-
ger was lined up with a force transducer (NL 62–50 kg,
Digitimer Ltd, Welwyn Garden City, UK). To ensure an
isolated contraction of the FDI muscle, the wrist and other
finger were immobilized using Velcro straps. The measured
force exerted by FDI contraction (measured by the force
transducer) was displayed as a circular cursor on the com-
puter screen. The cursor moved automatically from the left
to the right. Participants were able to control the movement
of the cursor by activating and relaxing the FDI muscle.
When contracting the FDI muscle the cursor moved to the
top of the screen, while when relaxing the cursor moved to
the bottom of the screen (based on design of Perez, Lun-
gholt, Nyborg, & Nielsen, 2004). The force signal was high
pass filtered by 30 Hz, amplified by 500–2 k and sampled
at 4 kHz to be stored for offline analysis.
Participants were presented with five different wave-
forms to familiarize them with the task. Each waveform
was 12 s long, including a 1 s rest period at the start and
end. The waveforms were scaled between 0% and 20% of
the participants maximal voluntary contraction (MVC),
determined before the start of the learning task. The famil-
iarization period was followed by five training blocks con-
sisting of 20 waveforms, making each training block take
4 min. After each training block, participants were allowed
a 2-min break to minimize the possibility of muscle fatigue.
The same waveforms were presented in each training block,
although the order of presentation was randomized. Visual
feedback of the absolute tracking error was provided after
each waveform. The online feedback on performance
served to keep participants motivated, to reduce their track-
ing error and to stabilize their attention.
Experiment 2: Distal vs. Proximal Muscle Training
In the second experiment, we compared variability in
changes in TMS map area following visuomotor tracking
learning for a proximal and distal muscle of the dominant
arm. The setup and experiment were identical to that for
the previous experiment except with visuomotor tracking
performed with either the BB or FDI muscle of the domi-
nant arm. Again, the order in which training was performed
with proximal and distal muscle was counterbalanced
across participants. As finding Mmax in the proximal BB
muscle was found too uncomfortable for the participants,
MEPs for this experiment were normalized to the mean
maximal MEP (MEPmax) amplitude in response to 10 stim-
uli at maximal stimulator output over the motor hotspot.
When visuomotor tracking learning performance of the
BB muscle was tested, participants rested the dominant arm
in a rig that held the arm with the elbow at approximately
120� and adjusted to a height that would prevent strain in
the shoulder and neck (Figure 1: bottom). The arm was
immobilized by a Velcro strap at the level of the wrist and
just below the elbow. Participants were instructed to always
keep the hand midway between pronation and supination
with the thumb up. A torsion bar attached to the Velcro
strap was used to record the forces exerted by a biceps con-
traction. During the learning task, participants repetitively
FIGURE 1. Experimental protocol and setup during thevisuomotor tracking learning task. Participants were seatedwith a monitor in direct line of sight on which the wave-forms were presented. The task was performed by eitheractivating or relaxing the first dorsal interosseous muscle(FDI) (top panel) or biceps brachii (BB) muscle (bottomright panel). Training was performed for a total of 20 min(five blocks of 4 min) with 2 min rest between each block.TMS was used to probe changes in excitability using TMSmapping of the FDI or BB muscle before and after training.
Variability in Use-Dependent Plasticity
2018, Vol. 0, No. 0 3

activated the BB muscle to track the presented waveforms.
When training with the distal FDI muscle, the same proce-
dures as in Experiment 1 were followed.
Data Analysis
Visuomotor Tracking Performance
Tracking performance was quantified by the root mean
square (RMS) error between the target waveform and the
tracked path. The effect of the training was examined by
comparing the mean RMS error over all training blocks. A
lower RMS would be indicative for increased performance
and a decreased tracking error with respect to the target
waveform.
TMS Maps
To create the TMS map, data were analyzed offline
with a bespoke MATLAB script (MATLAB Release
2012b, The MathWorks, Inc., Natick, Massachusetts,
United States). All stimuli positions were projected in a
2D plane. Accordingly, each position was matched with
its corresponding MEP peak-to-peak (MEPpp) value
extracted from the EMG 20–50 ms after stimulation. All
EMG recordings with a background EMG over 30 mV
(peak-to-peak) in a window from 5 to 50 ms before
stimulation were excluded.
Maps were quantified by the map area and center of grav-
ity (COG). MEPpp values were used to approximate a
6 £ 6 cm grid composed of 2500 pixels using MATLAB’s
“gridfit” function (D’Errico, 2005). The number of pixels
with an approximated MEPpp amplitude greater than 10%
of the maximum MEPpp value (Uy, Ridding, & Miles,
2002) was calculated and expressed as total map area (in
mm2). If the 10% threshold was smaller than 100 mV peak-
to-peak, 100 mV was taken as the threshold for calculating
the area. The x- and y-coordinate of the COG was calcu-
lated from the MEPpp amplitude and its position on the
map, thus creating an amplitude weighted mean of the map.
Full details of this process are described in van de Ruit, Per-
enboom, and Grey (2015).
To quantify changes in the position of the COG, the x
and y components of the translation in COG were calcu-
lated by taking the difference in x and y position of the
COG before and after the visuomotor tracking learning task
(Dx and Dy). In this way a negative value would indicate a
shift in anterior (x) or lateral (y) direction and a positive
value a shift posteriorly (x) or medially (y).
The absolute displacement was calculated by taking the
Euclidian distance (ED) between COG of the median TMS
map before and after learning:
EDDffiffiffiffiffiffiffiffiffiffiffiffiffiffiffiffiffiffiffiffiffiffiffiffiffiffiffiffiffiffiffiffiffiffiffiffiffiffiffiffiffiffiffiffiffiffiffiffiffiffiffiffiffiffiffiffiffiffiffiffiffiffiffiffiffiffiffiffiffiffiffiffiffiffiffiffiffiffiffiffiffiffiffiffiffiffiffiffiffiffiffiffiffiffiffiffiffiffiffiyCOGpre ¡ yCOGpost
� �2 C xCOGpre ¡ xCOGpost
� �2q:
Statistical Analysis
Statistical testing was conducted with IBM SPSS
Statistics 21. Tests were considered significant at
a D 0.05. The data were tested for normality (Shapiro-
Wilk test), sphericity (Machly’s test), and examined
for significant outliers. When the assumption of covari-
ance matrix circularity was violated a Geisser–Green-
house adjustment was made (denoted by GG following
the F test). Data are reported as mean § 1 SD unless
otherwise noted.
Learning
To examine visuomotor tracking learning performance
during the training a three-way repeated measures analysis
of variance (3w-rmANOVA) was used with factors MUS-
CLE (left, right) £ BLOCK (block 1–5) £ WAVEFORM
(Waveform 1–20). This statistical analysis was performed
on the tracking performance data (i.e. RMS errors). The
factor WAVEFORM was included to test for heterogeneity
in the difficulty of the waveforms.
TMS Maps
To assess learning induced changes in CSE the effect of
learning on the TMS map area was studied. First, the map
with the median map area of the three maps acquired
before and after learning was selected. In case only two
baseline measures were considered, for example, when
data were missing for one map, the map with the lowest
mean background EMG was used. Subsequently, the
difference in map area between the pre- and postmeasure-
ment was taken (Darea D areaPOST ¡ areaPRE). A negative
Darea would thereby indicate a decrease in map area, a
positive Darea an increase. The Darea data were then
tested for statistical significance with respect to the fixed
value of 0 using a one sample t-test. A paired t-test was
used to study any differences in learning induced changes
in map area between the two muscles used in each experi-
ment. The same analysis was performed for the translation
of the COG (Dx and Dy).To quantify the response rate to visuomotor tracking
learning three groups of responders were defined. Baseline
variance was calculated by calculating the difference of the
median map with respect to the two other maps collected
before training commenced. The standard deviation of the
baseline variance of all participants was used to classify
participants as either positive responders, nonresponders or
negative responders. Participants were classified as positive
responders if Darea of the median map before and after
learning > 1 SD of the baseline variance in map area. In
contrast, negative responders were classed as participants
with a decreased map area < –1 SD of baseline map vari-
ance. All other participants were classified as
nonresponders.
4 Journal of Motor Behavior
M. VAN DE RUIT & M. J. GREY

Relationship between Motor Learning and Changes in
Corticospinal Excitability
A linear regression was performed on the tracking perfor-
mance data and changes in map area to determine if a
greater improvement in tracking performance could predict
the change in map area. To quantify the improvement in
tracking performance the percentage improvement between
different blocks was calculated. Based on the improvements
in tracking performance over training blocks linear regres-
sion was performed between the improvement from block 1
to block 3, the early learning phase, and block 3 to block 5,
the late learning stage, separately with the change in map
area. Finally, the Pearson correlation was used to determine
if there was any association between the changes in map
area (Darea) in the dominant vs. nondominant hand (Exper-
iment 1) or the proximal vs. distal muscle (Experiment 2).
RESULTS
All participants that completed the study tolerated TMS
well and none of the participants reported any muscle
fatigue following visuomotor tracking learning. The data
were normally distributed and had no significant outliers.
Experiment 1: Dominant vs. Nondominant Hand
In total 19 of the 20 recruited participants completed both
sessions of the experiment. One participant did not attend
the second experimental session and was removed from the
study.
Visuomotor Tracking Learning
For analysis of the visuomotor tracking learning data, 17
of the 19 available data sets were included. Two data sets
were omitted from processing due to errors with the force
recordings.
All participants successfully completed 20 min of visuo-
motor tracking learning. Figure 2A displays tracking per-
formance in the first and last block of training with the
dominant hand for one single waveform. Here, tracking has
become much more controlled following learning. Overall,
a progressive decrease in tracking error over the five blocks
for both the dominant and nondominant hand was found
(Figure 2B). This was confirmed by the three-way repeated
measures ANOVA (within factors: MUSCLE, BLOCK,
and WAVEFORM), that showed a significant effect for
BLOCK (p D 0.03). Bonferroni post hoc testing indicated
significant differences between block 1 and 2 and block 1
and 3, but not any of the other blocks. Moreover, a
significant main effect for WAVEFORM (p < 0.01) and
BLOCK £ WAVEFORM interaction was found
(p < 0.01), indicating there was a different learning rate for
the different waveforms, some being more difficult than
others.
TMS Mapping
Analysis of the TMS map data was performed on 17 par-
ticipants. Two data sets had to be discarded as a result of
measurement noise in the MEP recordings, these data were
not from the same two participants excluded for the visuo-
motor task. The maps included in the analysis for all ses-
sions were constructed out of 66 § 12 stimuli.
No significant difference was observed in RMT between
the dominant (50% § 7% MSO) and nondominant
(49% § 7% MSO) hand (t(16) D 0.75, p D 0.47). The stan-
dard deviation of the Darea in the baseline recordings (with
respect to the median map) was 343 mm2 for the dominant
hand and 330 mm2 for the nondominant hand. Based on 1
FIGURE 2. Effect of training a visuomotor tracking learning task with the FDI muscle of either the dominant and nondom-inant hand on tracking performance. (A) Example of a single waveform for which tracking performance improved from thefirst block (blue line) to last block (red line) with respect to the target waveform (black line). (B) Overall, tracking perfor-mance improved over the five training blocks (shaded bars), for either the dominant (solid line) or nondominant index fin-ger (dotted line). Tracking performance significantly improved with training (*p < 0.05) from block 1 to 3, after whichperformance stabilized.
2018, Vol. 0, No. 0 5
Variability in Use-Dependent Plasticity
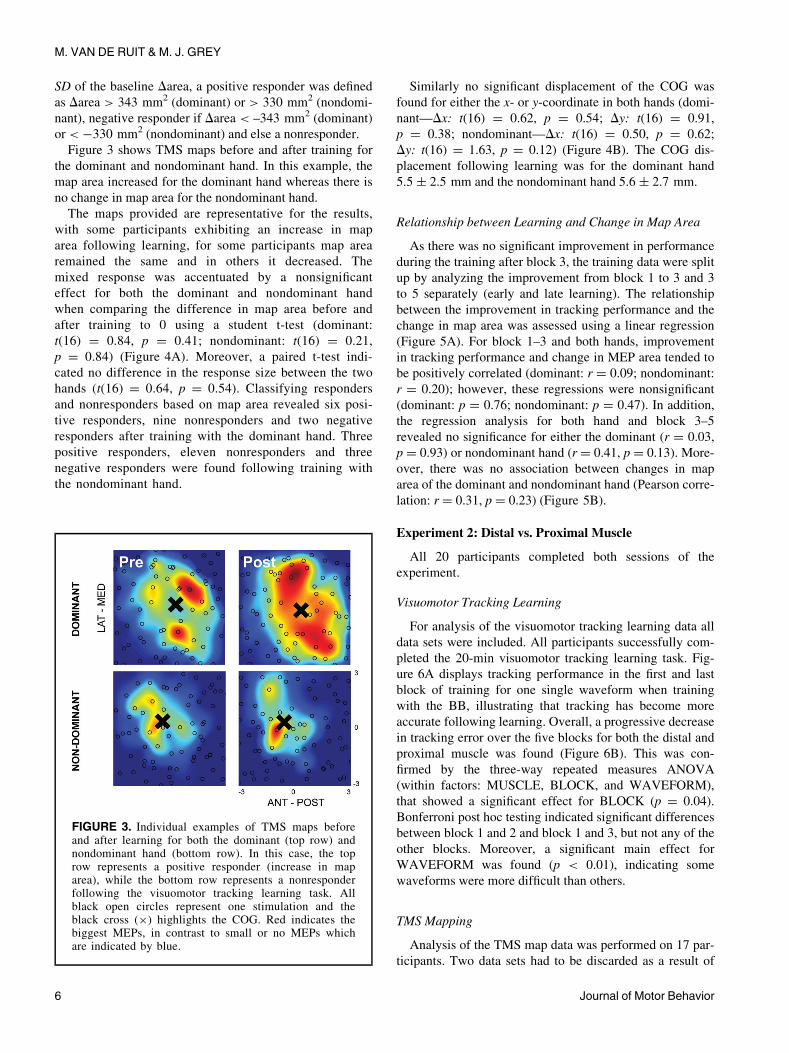
SD of the baseline Darea, a positive responder was defined
as Darea > 343 mm2 (dominant) or > 330 mm2 (nondomi-
nant), negative responder if Darea < –343 mm2 (dominant)
or < ¡330 mm2 (nondominant) and else a nonresponder.
Figure 3 shows TMS maps before and after training for
the dominant and nondominant hand. In this example, the
map area increased for the dominant hand whereas there is
no change in map area for the nondominant hand.
The maps provided are representative for the results,
with some participants exhibiting an increase in map
area following learning, for some participants map area
remained the same and in others it decreased. The
mixed response was accentuated by a nonsignificant
effect for both the dominant and nondominant hand
when comparing the difference in map area before and
after training to 0 using a student t-test (dominant:
t(16) D 0.84, p D 0.41; nondominant: t(16) D 0.21,
p D 0.84) (Figure 4A). Moreover, a paired t-test indi-
cated no difference in the response size between the two
hands (t(16) D 0.64, p D 0.54). Classifying responders
and nonresponders based on map area revealed six posi-
tive responders, nine nonresponders and two negative
responders after training with the dominant hand. Three
positive responders, eleven nonresponders and three
negative responders were found following training with
the nondominant hand.
Similarly no significant displacement of the COG was
found for either the x- or y-coordinate in both hands (domi-
nant—Dx: t(16) D 0.62, p D 0.54; Dy: t(16) D 0.91,
p D 0.38; nondominant—Dx: t(16) D 0.50, p D 0.62;
Dy: t(16) D 1.63, p D 0.12) (Figure 4B). The COG dis-
placement following learning was for the dominant hand
5.5 § 2.5 mm and the nondominant hand 5.6 § 2.7 mm.
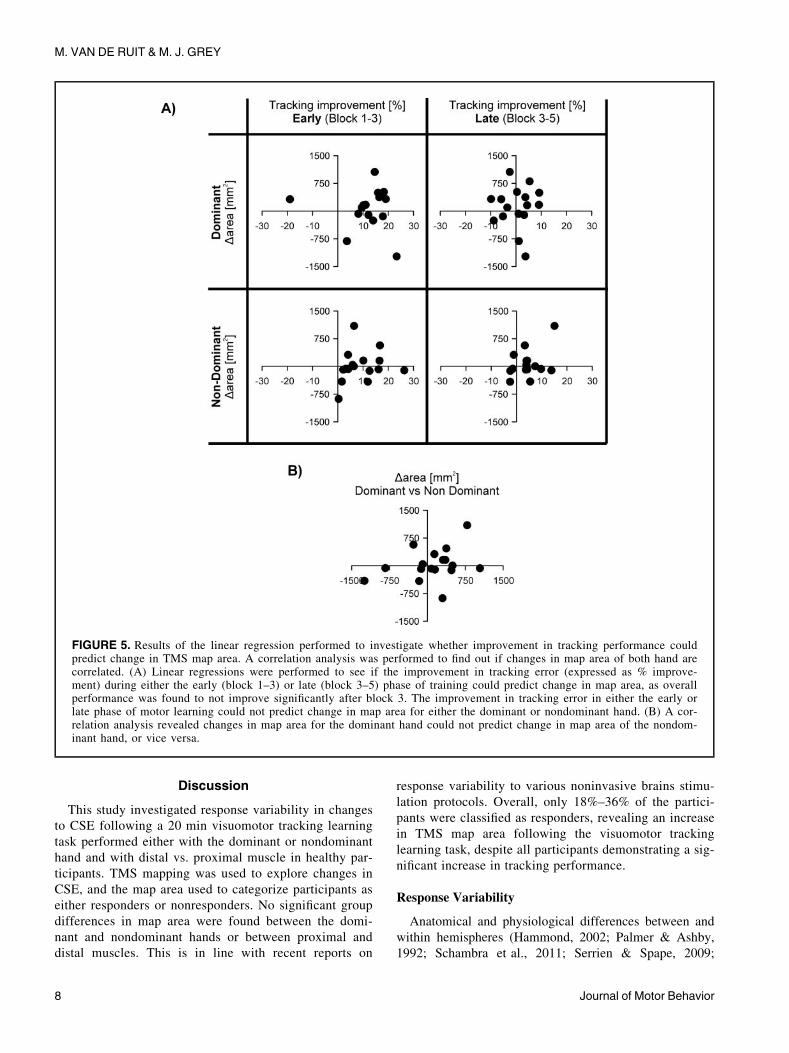
Relationship between Learning and Change in Map Area
As there was no significant improvement in performance
during the training after block 3, the training data were split
up by analyzing the improvement from block 1 to 3 and 3
to 5 separately (early and late learning). The relationship
between the improvement in tracking performance and the
change in map area was assessed using a linear regression
(Figure 5A). For block 1–3 and both hands, improvement
in tracking performance and change in MEP area tended to
be positively correlated (dominant: r D 0.09; nondominant:
r D 0.20); however, these regressions were nonsignificant
(dominant: p D 0.76; nondominant: p D 0.47). In addition,
the regression analysis for both hand and block 3–5
revealed no significance for either the dominant (r D 0.03,
p D 0.93) or nondominant hand (r D 0.41, p D 0.13). More-
over, there was no association between changes in map
area of the dominant and nondominant hand (Pearson corre-
lation: r D 0.31, p D 0.23) (Figure 5B).
Experiment 2: Distal vs. Proximal Muscle
All 20 participants completed both sessions of the
experiment.
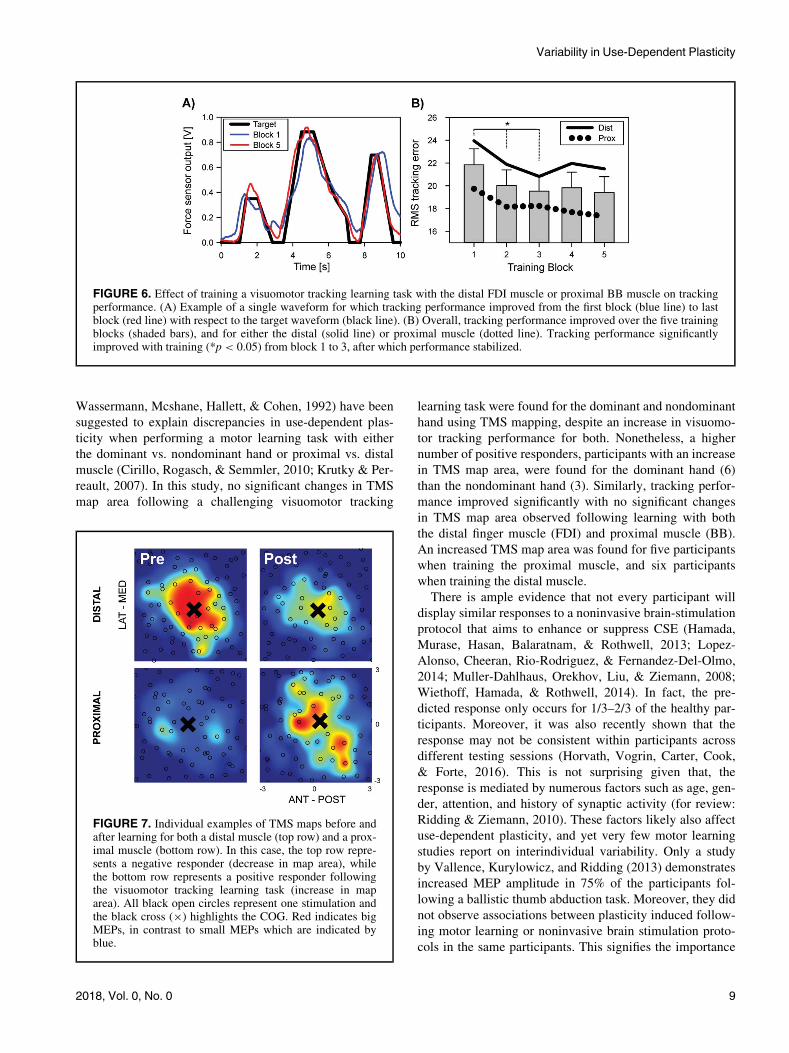
Visuomotor Tracking Learning
For analysis of the visuomotor tracking learning data all
data sets were included. All participants successfully com-
pleted the 20-min visuomotor tracking learning task. Fig-
ure 6A displays tracking performance in the first and last
block of training for one single waveform when training
with the BB, illustrating that tracking has become more
accurate following learning. Overall, a progressive decrease
in tracking error over the five blocks for both the distal and
proximal muscle was found (Figure 6B). This was con-
firmed by the three-way repeated measures ANOVA
(within factors: MUSCLE, BLOCK, and WAVEFORM),
that showed a significant effect for BLOCK (p D 0.04).
Bonferroni post hoc testing indicated significant differences
between block 1 and 2 and block 1 and 3, but not any of the
other blocks. Moreover, a significant main effect for
WAVEFORM was found (p < 0.01), indicating some
waveforms were more difficult than others.
TMS Mapping
Analysis of the TMS map data was performed on 17 par-
ticipants. Two data sets had to be discarded as a result of
FIGURE 3. Individual examples of TMS maps beforeand after learning for both the dominant (top row) andnondominant hand (bottom row). In this case, the toprow represents a positive responder (increase in maparea), while the bottom row represents a nonresponderfollowing the visuomotor tracking learning task. Allblack open circles represent one stimulation and theblack cross (£) highlights the COG. Red indicates thebiggest MEPs, in contrast to small or no MEPs whichare indicated by blue.
6 Journal of Motor Behavior
M. VAN DE RUIT & M. J. GREY

technical difficulties. The maps included in the analysis for
all sessions were constructed out of 73 § 4 stimuli. MEP-
max, used to normalize the MEPs, was on average
4.2 § 2.3 mV (range: 1.5–9.8 mV) for FDI and
0.8 § 0.7 mV (range: 0.1–1.7 mV) for BB.
There was a significantly higher RMT for the proximal
(57% § 10% MSO) compared with distal (44% § 7%
MSO) muscle (t(16) D 4.8, p < 0.01). The SD of the Dareain the baseline recordings (with respect to the median map)
was 239 mm2 for the proximal muscle and 254 mm2 for
the distal muscle. Therefore, a participant was defined as a
positive responder if Darea > 239 mm2 (proximal) or
> 254 mm2 (distal), negative responder if Darea< ¡239 mm2 (proximal) or < ¡254 mm2 (distal) and else
a nonresponder.
Figure 7 shows TMS maps before and after training for
both muscles. In this example, the map area decreased for
the distal muscle whereas an increase in map area for the
proximal muscle is present.
The maps provided are representative for the results, with
some participants exhibiting an increase in map area fol-
lowing learning, in some participants map area remained
the same while in others it decreased. The mixed response
was accentuated by a nonsignificant effect for both the
proximal and distal muscles when comparing the difference
in map area before and after training to 0 using a student t-
test (distal: t(16) D 1.04, p D 0.32; proximal:
t(16) D 0.74, p D 0.47) (Figure 8A).
Moreover, a paired t-test indicated no difference in the
response size between the two muscles (t(16) D –0.27,
p D 0.79). Classifying responders and nonresponders based
on map area revealed six positive responders, eight nonres-
ponders and three negative responders after training with
the distal muscle. Five positive responders, seven nonres-
ponders and five negative responders were found following
training with the proximal muscle.
No significant displacement of the COG was found
for the x-coordinate in the distal muscle and x-coordi-
nate of the proximal muscle (distal—Dx: t(16) D 0.20,
p D 0.84; Dy: t(16) D –1.04, p D 0.31; proximal—t(16)
D 0.14, p D 0.89). However, a significant displacement
in the COGs y-coordinate was found for the proximal
muscle (t(16) D 2.44, p D 0.03) (Figure 8B). The COG
displacement following learning was for the distal mus-
cle was 4.1 § 3.0 mm and the proximal muscle
3.8 § 2.3 mm.
Relationship between Learning and Change in Map Area
As there was no significant improvement in performance
during the training after block 3 the training data was split
up by analyzing the improvement from block 1 to 3 and 3
to 5 separately (early and late learning). The relationship
between the improvement in tracking performance and the
change in map area was assessed using a linear regression
(Figure 9A). For both the proximal and distal muscles,
there was a poor relationship between performance
improvement in block 1–3 and change in map area. There-
fore, both regressions were found not to be statistically sig-
nificant (proximal: r D 0.36, p D 0.19; distal: r D 0.08, p D0.78). In addition, the regression analysis for both hand and
block 3–5 revealed no significance for either the proximal
(r D 0.04, p D 0.89) or distal muscle (r D 0.21, p D 0.47).
There was no association between changes in map area of
the proximal and distal muscle (Pearson correlation:
r D –0.04, p D 0.89) (Figure 9B).
FIGURE 4. Effect of training a visuomotor tracking learning task with the FDI muscle of either the dominant or nondominant handon TMS map area and COG. (A) Change in map area (Darea D areaPOST ¡ areaPRE) was not significantly different from 0 for eitherhand; however, there are great interindividual differences with some participants showing an increase, decrease, or no change inmap area (black dots). Based on baseline variability of the map area, all participants with a change in map area within the range asmarked by the shaded rectangle in the background were classified as nonresponders. (B) No change was found for either the dis-placement of the x- or y-coordinate of the COG for any hand.
2018, Vol. 0, No. 0 7
Variability in Use-Dependent Plasticity
Discussion
This study investigated response variability in changes
to CSE following a 20 min visuomotor tracking learning
task performed either with the dominant or nondominant
hand and with distal vs. proximal muscle in healthy par-
ticipants. TMS mapping was used to explore changes in
CSE, and the map area used to categorize participants as
either responders or nonresponders. No significant group
differences in map area were found between the domi-
nant and nondominant hands or between proximal and
distal muscles. This is in line with recent reports on
response variability to various noninvasive brains stimu-
lation protocols. Overall, only 18%–36% of the partici-
pants were classified as responders, revealing an increase
in TMS map area following the visuomotor tracking
learning task, despite all participants demonstrating a sig-
nificant increase in tracking performance.
Response Variability
Anatomical and physiological differences between and
within hemispheres (Hammond, 2002; Palmer & Ashby,
1992; Schambra et al., 2011; Serrien & Spape, 2009;
FIGURE 5. Results of the linear regression performed to investigate whether improvement in tracking performance couldpredict change in TMS map area. A correlation analysis was performed to find out if changes in map area of both hand arecorrelated. (A) Linear regressions were performed to see if the improvement in tracking error (expressed as % improve-ment) during either the early (block 1–3) or late (block 3–5) phase of training could predict change in map area, as overallperformance was found to not improve significantly after block 3. The improvement in tracking error in either the early orlate phase of motor learning could not predict change in map area for either the dominant or nondominant hand. (B) A cor-relation analysis revealed changes in map area for the dominant hand could not predict change in map area of the nondom-inant hand, or vice versa.
8 Journal of Motor Behavior
M. VAN DE RUIT & M. J. GREY
Wassermann, Mcshane, Hallett, & Cohen, 1992) have been
suggested to explain discrepancies in use-dependent plas-
ticity when performing a motor learning task with either
the dominant vs. nondominant hand or proximal vs. distal
muscle (Cirillo, Rogasch, & Semmler, 2010; Krutky & Per-
reault, 2007). In this study, no significant changes in TMS
map area following a challenging visuomotor tracking
learning task were found for the dominant and nondominant
hand using TMS mapping, despite an increase in visuomo-
tor tracking performance for both. Nonetheless, a higher
number of positive responders, participants with an increase
in TMS map area, were found for the dominant hand (6)
than the nondominant hand (3). Similarly, tracking perfor-
mance improved significantly with no significant changes
in TMS map area observed following learning with both
the distal finger muscle (FDI) and proximal muscle (BB).
An increased TMS map area was found for five participants
when training the proximal muscle, and six participants
when training the distal muscle.
There is ample evidence that not every participant will
display similar responses to a noninvasive brain-stimulation
protocol that aims to enhance or suppress CSE (Hamada,
Murase, Hasan, Balaratnam, & Rothwell, 2013; Lopez-
Alonso, Cheeran, Rio-Rodriguez, & Fernandez-Del-Olmo,
2014; Muller-Dahlhaus, Orekhov, Liu, & Ziemann, 2008;
Wiethoff, Hamada, & Rothwell, 2014). In fact, the pre-
dicted response only occurs for 1/3–2/3 of the healthy par-
ticipants. Moreover, it was also recently shown that the
response may not be consistent within participants across
different testing sessions (Horvath, Vogrin, Carter, Cook,
& Forte, 2016). This is not surprising given that, the
response is mediated by numerous factors such as age, gen-
der, attention, and history of synaptic activity (for review:
Ridding & Ziemann, 2010). These factors likely also affect
use-dependent plasticity, and yet very few motor learning
studies report on interindividual variability. Only a study
by Vallence, Kurylowicz, and Ridding (2013) demonstrates
increased MEP amplitude in 75% of the participants fol-
lowing a ballistic thumb abduction task. Moreover, they did
not observe associations between plasticity induced follow-
ing motor learning or noninvasive brain stimulation proto-
cols in the same participants. This signifies the importance
FIGURE 6. Effect of training a visuomotor tracking learning task with the distal FDI muscle or proximal BB muscle on trackingperformance. (A) Example of a single waveform for which tracking performance improved from the first block (blue line) to lastblock (red line) with respect to the target waveform (black line). (B) Overall, tracking performance improved over the five trainingblocks (shaded bars), and for either the distal (solid line) or proximal muscle (dotted line). Tracking performance significantlyimproved with training (*p < 0.05) from block 1 to 3, after which performance stabilized.
FIGURE 7. Individual examples of TMS maps before andafter learning for both a distal muscle (top row) and a prox-imal muscle (bottom row). In this case, the top row repre-sents a negative responder (decrease in map area), whilethe bottom row represents a positive responder followingthe visuomotor tracking learning task (increase in maparea). All black open circles represent one stimulation andthe black cross (£) highlights the COG. Red indicates bigMEPs, in contrast to small MEPs which are indicated byblue.
2018, Vol. 0, No. 0 9
Variability in Use-Dependent Plasticity

of interindividual variability, as common mechanisms are
thought to underlie both brain stimulation and use-depen-
dent plasticity.
In this study, a homogenous group of young and active
healthy participants (18–29 years) were recruited to the
study and factors like attention en time of day tested were
well controlled. The finding that despite these precautions
to limit variability, fewer than 40% of the participants in
the present study exhibited an increase in TMS map area
following the visuomotor tracking learning task raises the
question about the adequacy of training volume. Between
12 and 32 min of training has been performed (Jensen,
Marstrand, & Nielsen, 2005; McAllister, Rothwell, & Rid-
ding, 2011; Perez, Lungholt, Nyborg, & Nielsen, 2004;
Willerslev-Olsen, Lundbye-Jensen, Petersen, & Nielsen,
2011) and linked with increases in MEP amplitude. In this
study, training within a single session was limited to five
blocks and a total of 20 min to prevent overlearning but
allow us to quantify changes in TMS map area following
the fast phase of learning (Floyer-Lea & Matthews, 2005;
Luft & Buitrago, 2005). The significant improvement only
up to block 3, matched the findings of Floyer-Lea and Mat-
thews (2005) for single session learning but not those of
Jensen, Marstrand, and Nielsen (2005), who reports contin-
uous improvement over all blocks in the first training ses-
sion. Our findings suggest there was no further
improvement in performance after block 3, potentially as a
result of a lack of focus or that the skill had been mastered.
Overlearning was first reported by Muellbacher, Ziemann,
Boroojerdi, Cohen, and Hallett (2001) who found that after
an initial learning stage associated with rapid MEP facilita-
tion, with further learning the MEP size returned to base-
line. To ensure the great variety in changes in TMS
map area following learning was not mediated by partici-
pants rate of learning a linear regression between the
improvement in performance from block 3 to block 5 and
the change in map area was performed. The regression was
not significant, suggesting that improvement during the last
training blocks could not predict the change in map area.
However, with only this result and the fact that TMS map
area was not measured after block 3 the possibility that
overlearning has affected our results cannot be excluded.
An important additional factor mediating the effect of
learning on changes in excitability is if the visuomotor
tracking learning task sufficiently engages the primary
motor cortex. Compared with a ballistic motor task, which
involves primarily feedforward control, feedback control
plays a critical role in a visuomotor tracking learning task.
Baraduc, Lang, Rothwell, and Wolpert (2004) demon-
strated that 1 Hz rTMS applied to the motor cortex can dis-
rupt ballistic learning, but it does not disrupt learning of
novel dynamics imposed by a force field, suggesting that
the motor cortex is essential in ballistic learning, but it
might be less engaged in more complex tasks. Evidence for
widely distributed cortical activity during visuomotor track-
ing learning was also provided by Floyer-Lea and Matthews
(2004). They reported learning associated changes in brain
activity in prefrontal areas, supplementary- and premotor
area, parietal areas, cerebellum and basal ganglia (Catalan,
Honda, Weeks, Cohen, & Hallett, 1998; Hardwick, Rott-
schy, Miall, & Eickhoff, 2013; Mitz, Godschalk, & Wise,
1991; Wise, Moody, Blomstrom, & Mitz, 1998). In conclu-
sion, in more complex learning tasks, learning-induced
plasticity might rely more on other areas of the cortical net-
work than the primary motor cortex, which we are unable
to detect using TMS.
One may question whether the TMS mapping method
applied in this study has affected the response rate. Few
studies have used TMS mapping to explore changes in
excitability following motor learning. The classic motor
FIGURE 8. Effect of training a visuomotor tracking learning task with a distal (FDI) and proximal (BB) muscle on TMS map areaand COG. (A) Change in map area (Darea D areaPOST ¡ areaPRE) was not significantly different from 0 for either muscle; however,there are great interindividual differences with some participants showing an increase, decrease, or no change in map area (blackdots). Based on baseline variability of the map area, all participants with a change in map area within the range as marked by theshaded rectangle were classified as nonresponders. (B) No change was found in x-coordinate of the COG for any muscle, while asignificant displacement of the y-coordinate for the proximal muscle was found but not the distal muscle.
10 Journal of Motor Behavior
M. VAN DE RUIT & M. J. GREY

learning paper by Pascual-Leone et al. (1995) was the first
to demonstrate increases in TMS map area following learn-
ing a complex motor task. The complexity and time con-
suming nature of the traditional mapping method reduces
its sensitivity to detect changes in CSE. The used mapping
method in this study allows obtaining all data within the
same time window as during which, routinely, 20–30 MEPs
are acquired to quantify CSE using the mean MEP ampli-
tude. The cortical representation that the TMS map area
reflects is affected by current spread of the magnetic stimu-
lus (Thickbroom, Sammut, & Mastaglia, 1998). Thus, if
cortical excitability is increased locally near the motor hot-
spot, reflected as an increase in MEP amplitude, this should
also be detected in the TMS map as stimuli further away
from the motor hotspot will also exceed stimulation thresh-
old. At present, there is no reason to assume TMS mapping
would provide different results than just using the mean
MEP amplitude at the motor hotspot.
Mono- and biphasic TMS pulses result in different pat-
terns of descending motor output (Di Lazzaro et al., 2001)
and very recently this has been suggested to affect the TMS
map (Stephani, Paulus, & Sommer, 2016). The use of novel
controllable TMS stimulators have revealed that not only
pulse waveform but also current direction and pulse dura-
tion determine the specific interneuronal circuitry activated
(D’Ostilio et al., 2016; Goetz et al., 2016; Hannah &
FIGURE 9. Results of the linear regression performed to investigate whether improvement in tracking performance could predictchange in TMS map area. A correlation analysis was performed to find out if changes in map area of the proximal and distal muscleare correlated. (A) Linear regressions were performed to see if the improvement in tracking error (expressed as % improvement)during either the early (block 1–3) or late (block 3–5) phase of training could predict change in map area, as overall performancewas found to not improve significantly after block 3. The improvement in tracking error in either the early or late phase of motorlearning could not predict change in map area for either the dominant or nondominant hand. (B) A correlation analysis revealedchange in map area for the dominant hand could not predict change in map area of the nondominant hand, or vice versa.
2018, Vol. 0, No. 0 11
Variability in Use-Dependent Plasticity

Rothwell, 2017). This may affect both the neuroplastic
response when TMS is employed to induce plasticity (Han-
nah, Rocchi, Tremblay, & Rothwell, 2016) and the specific
circuitry assessed when TMS is used to probe changes in
excitability (Sommer et al., 2006). Therefore, a limitation
of our study results is that TMS mapping using monophasic
TMS pulses with any current direction may reveal a differ-
ent response rate than we have observed with the biphasic
Magstim Rapid2 TMS stimulator used in the present study.
Differences in Use-Dependent Plasticity across Muscles
The finding of no difference in change in TMS map area
following learning with the dominant or nondominant hand
is in line with the findings of Gallasch, Christova, Krenn,
Kossev, and Rafolt (2009); Garry, Kamen, and Nordstrom
(2004). They reported no difference in MEP amplitude fol-
lowing learning, suggesting similar capacity for use-depen-
dent plasticity for both hemispheres. Both studies reported
significant changes in performance for both hands follow-
ing motor learning of a complex tasks (goal-directed move-
ment task or Purdue pegboard task) (Gallasch, Christova,
Krenn, Kossev, & Rafolt, 2009; Garry, Kamen, & Nord-
strom, 2004). However, not all studies that compared use-
dependent plasticity for the dominant and nondominant
hand have come to a similar conclusion. Studies where a
ballistic motor learning task was employed have produced
much less clear results. While Cirillo, Rogasch, and Semm-
ler (2010) found a greater improvement in thumb peak
acceleration for the dominant hand, Ridding and Flavel
(2006) report a larger improvement for the nondominant
hand. These hemispheric differences in learning have been
linked to a larger increase in MEP size in the nondominant
hemisphere (Cirillo, Rogasch, & Semmler, 2010) or no dif-
ference in MEP changes when induced by paired associa-
tive stimulation (Ridding & Flavel, 2006). In another study,
training a ballistic pinch movement led to similar behav-
ioral gains but greater MEP changes for the dominant motor
cortex (Hammond & Vallence, 2006). Different results may
be explained by the discrepancy in learning task, being a
simple ballistic motor task vs. complex goal-directed or
visuomotor tracking learning task. Indeed, task complexity
is linked with increased cortical activity (Datta, Harrison,
& Stephens, 1989) for complex motor tasks. It may be con-
cluded that is there is an asymmetry in use-dependent plas-
ticity, this only holds for simple learning tasks.
Previous research has also suggested that the capacity of
proximal and distal muscles to undergo use-dependent plas-
ticity may be due to differences in task complexity. How-
ever, the present study does not support this view. Krutky
and Perreault (2007) reported minimal change in peak
acceleration following a ballistic motor learning task with
the upper arm while Ziemann, Muellbacher, Hallett, and
Cohen (2001) observed no change in performance at all. In
both studies this was accompanied with minimal changes in
MEP amplitude. In contrast, significant long-lasting
changes in peak acceleration, movement direction, and
MEP amplitude have been reported for the same task when
the FDI muscle was tested (Krutky & Perreault, 2007;
Muellbacher, Ziemann, Boroojerdi, Cohen, & Hallett,
2001). Krutky and Perreault (2007) explain their findings
by evidence that proximal muscles have a smaller cortical
representation and less monosynaptic connections than dis-
tal muscles (Palmer & Ashby, 1992; Penfield & Boldrey,
1937; Wassermann, Mcshane, Hallett, & Cohen, 1992).
Whereas this might suggest there is minimal change in
motor performance in proximal muscles compared with dis-
tal muscles following similar training, this is not supported
by findings that significant improvement in motor perfor-
mance occur in a force-field adaptation task (Shadmehr &
Mussa-Ivaldi, 1994) and a similar visuomotor tracking
learning task as performed here (Jensen, Marstrand, & Niel-
sen, 2005). The latter study also reported significant
changes in MEP amplitude. Although difference in use-
dependent plasticity between proximal and distal muscles
may exist, this may only be important when training simple
ballistic motor learning tasks.
Conclusion
This study highlighted variability of use-dependent plastic-
ity for learning a visuomotor tracking learning task, with only
18%–36% of the participants showing an increased TMSmap
area despite significant tracking improvement. A dissociation
exists between changes in TMS map area and improvement
in tracking performance in both experiments, confirming
other reports (Bologna et al., 2015; Delvendahl et al., 2011;
Jung & Ziemann, 2009). In conclusion, this study highlights
the complex relationship between different motor learning
tasks and changes in TMS measures and the importance of
considering response variability in use-dependent plasticity
when investigating differences across muscles.
Conflict of Interest
No potential conflict of interest was reported by the
authors.
ACKNOWLEDGMENTS
We thank Dr. J. P. Mathias for his help in designing the
experiment and during data collection. This research did
not receive any specific grant from funding agencies in the
public, commercial, or not-for-profit sectors.
ORCID
Mark van de Ruit http://orcid.org/0000-0003-3806-
2031
REFERENCES
Baraduc, P., Lang, N., Rothwell, J. C., & Wolpert, D. M. (2004).Consolidation of dynamic motor learning is not disrupted by
12 Journal of Motor Behavior
M. VAN DE RUIT & M. J. GREY

rTMS of primary motor cortex. Current Biology, 14(3), 252–256. doi:10.1016/j.cub.2004.01.033
Barker, A. T., Jalinous, R., & Freeston, I. L. (1985). Non-invasivemagnetic stimulation of human motor cortex. The Lancet, 325(8437), 1106–1107.
Bologna, M., Rocchi, L., Paparella, G., Nardella, A., Li Voti, P.,Conte, A., Kojovic, M., Rothwell, J. C., & Berardelli, A. (2015).Reversal of practice-related effects on corticospinal excitabilityhas no immediate effect on behavioral outcome. Brain Stimula-tion, 8(3), 603–612. doi:10.1016/j.brs.2015.01.405
Butefisch, C. M., Davis, B. C., Wise, S. P., Sawaki, L., Kopylev,L., Classen, J., & Cohen, L. G. (2000). Mechanisms of use-dependent plasticity in the human motor cortex. Proceedings ofthe National Academy of Sciences of the USA, 97(7), 3661–3665. doi:10.1073/pnas.050350297
Catalan, M. J., Honda, M., Weeks, R. A., Cohen, L. G., & Hallett,M. (1998). The functional neuroanatomy of simple and complexsequential finger movements: A PET study. Brain, 121(2), 253–264. doi:10.1093/brain/121.2.253
Cirillo, J., Rogasch, N. C., & Semmler, J. G. (2010). Hemisphericdifferences in use-dependent corticomotor plasticity in youngand old adults. Experimental Brain Research, 205(1), 57–68.doi:10.1007/s00221-010-2332-1
D’Errico, J. (2005). Surface Fitting using gridfit.MATLAB CentralFile Exchange, Retrieved Feb 2012.
D’Ostilio, K., Goetz, S. M., Hannah, R., Ciocca, M., Chieffo, R.,Chen, J. A., Peterchev, A. V., & Rothwell, J. C. (2016). Effectof coil orientation on strength-duration time constant and I-wave activation with controllable pulse parameter transcranialmagnetic stimulation. Clinical Neurophysiology, 127(1), 675–683. doi:10.1016/j.clinph.2015.05.017
Datta, A. K., Harrison, L. M., & Stephens, J. A. (1989). Task-dependent changes in the size of response to magnetic brainstimulation in human first dorsal interosseous muscle. Journalof Physiology, 418, 13–23.
Delvendahl, I., Kuhnke, N. G., Jung, N. H., Mainberger, F.,Cronjaeger, M., Unterrainer, J., Hauschke, D., & Mall, V.(2011). The time course of motor cortex plasticity after spacedmotor practice. Brain Stimulation, 4(3), 156–164. doi:10.1016/j.brs.2010.10.002
Di Lazzaro, V., Oliviero, A., Mazzone, P., Insola, A., Pilato, F.,Saturno, E., Accurso, A., Tonali, P., & Rothwell, J. C. (2001).Comparison of descending volleys evoked by monophasic andbiphasic magnetic stimulation of the motor cortex in conscioushumans. Experimental Brain Research, 141(1), 121–127.doi:10.1007/s002210100863
Floyer-Lea, A., & Matthews, P. M. (2004). Changing brain net-works for visuomotor control with increased movement auto-maticity. Journal of Neurophysiology, 92(4), 2405–2412.doi:10.1152/jn.01092.2003
Floyer-Lea, A., & Matthews, P. M. (2005). Distinguishable brainactivation networks for short- and long-term motor skill learn-ing. Journal of Neurophysiology, 94(1), 512–518. doi:10.1152/jn.00717.2004
Gallasch, E., Christova, M., Krenn, M., Kossev, A., & Rafolt, D.(2009). Changes in motor cortex excitability following trainingof a novel goal-directed motor task. European Journal ofApplied Physiology, 105(1), 47–54. doi:10.1007/s00421-008-0871-y
Garry, M. I., Kamen, G., & Nordstrom, M. A. (2004). Hemi-spheric differences in the relationship between corticomotorexcitability changes following a fine-motor task and motorlearning. Journal of Neurophysiology, 91(4), 1570–1578.doi:10.1152/jn.00595.2003
Goetz, S. M., Luber, B., Lisanby, S. H., Murphy, D. L., Kozyrkov,I. C., Grill, W. M., & Peterchev, A. V. (2016). Enhancement of
neuromodulation with novel pulse shapes generated by control-lable pulse parameter transcranial magnetic stimulation. BrainStimulation, 9(1), 39–47. doi:10.1016/j.brs.2015.08.013
Hamada, M., Murase, N., Hasan, A., Balaratnam, M., & Rothwell,J. C. (2013). The role of interneuron networks in driving humanmotor cortical plasticity. Cerebral Cortex, 23(7), 1593–1605.doi:10.1093/cercor/bhs147
Hammond, G. (2002). Correlates of human handedness in primarymotor cortex: A review and hypothesis. Neuroscience & Biobe-havioral Reviews, 26(3), 285–292.
Hammond, G. R., & Vallence, A. M. (2006). Asymmetrical facili-tation of motor-evoked potentials following motor practice.Neuroreport, 17, 805–807.
Hannah, R., Rocchi, L., Tremblay, S., & Rothwell, J. C. (2016).Controllable pulse parameter TMS and TMS-EEG as novelapproaches to improve neural targeting with rTMS in humancerebral cortex. Front Neural Circuits, 10, 97. doi:10.3389/fncir.2016.00097
Hannah, R., & Rothwell, J. C. (2017). Pulse duration as wellas current direction determines the specificity of transcranialmagnetic stimulation of motor cortex during contraction.Brain Stimulation, 10(1), 106–115. doi:10.1016/j.brs.2016.09.008
Hardwick, R. M., Rottschy, C., Miall, R. C., & Eickhoff, S. B.(2013). A quantitative meta-analysis and review of motor learn-ing in the human brain. Neuroimage, 67, 283–297. doi:10.1016/j.neuroimage.2012.11.020
Horvath, J. C., Vogrin, S. J., Carter, O., Cook, M. J., & Forte, J. D.(2016). Effects of a common transcranial direct current stimula-tion (tDCS) protocol on motor evoked potentials found to behighly variable within individuals over 9 testing sessions.Experimental Brain Research, 234(9), 2629–2642. doi:10.1007/s00221-016-4667-8
Jensen, J. L., Marstrand, P. C. D., & Nielsen, J. B. (2005). Motorskill training and strength training are associated with differentplastic changes in the central nervous system. Journal ofApplied Physiology, 99(4), 1558–1568. doi:10.1152/japplphysiol.01408.2004
Jung, P., & Ziemann, U. (2009). Homeostatic and nonhomeostaticmodulation of learning in human motor cortex. Journal of Neu-roscience, 29(17), 5597–5604. doi:10.1523/jneurosci.0222-09.2009
Keel, J. C., Smith, M. J., & Wassermann, E. M. (2001). A safetyscreening questionnaire for transcranial magnetic stimulation.Clinical Neurophysiology, 112(4), 720.
Krutky, M. A., & Perreault, E. J. (2007). Motor cortical measuresof use-dependent plasticity are graded from distal to proximalin the human upper limb. Journal of Neurophysiology, 98(6),3230–3241. doi:10.1152/jn.00750.2007
Lopez-Alonso, V., Cheeran, B., Rio-Rodriguez, D., & Fernandez-Del-Olmo, M. (2014). Inter-individual variability in response tonon-invasive brain stimulation paradigms. Brain Stimulation, 7(3), 372–380. doi:10.1016/j.brs.2014.02.004
Luft, A. R., & Buitrago, M. M. (2005). Stages of motor skill learn-ing. Molecular Neurobiology, 32(3), 205–216. doi:10.1385/MN:32:3:205
Mathias, J. P., Barsi, G. I., van de Ruit, M., & Grey, M. J. (2014).Rapid acquisition of the transcranial magnetic stimulation stim-ulus response curve. Brain Stimulation, 7(1), 59–65.doi:10.1016/j.brs.2013.08.003
McAllister, S. M., Rothwell, J. C., & Ridding, M. C. (2011). Corti-cal oscillatory activity and the induction of plasticity in thehuman motor cortex. European Journal of Neuroscience, 33(10), 1916–1924. doi:10.1111/j.1460-9568.2011.07673.x
Mitz, A. R., Godschalk, M., & Wise, S. P. (1991). Learning-dependent neuronal activity in the premotor cortex: Activity
2018, Vol. 0, No. 0 13
Variability in Use-Dependent Plasticity

during the acquisition of conditional motor associations. Jour-nal of Neuroscience, 11(6), 1855–1872.
Muellbacher, W., Ziemann, U., Boroojerdi, B., Cohen, L., &Hallett, M. (2001). Role of the human motor cortex in rapidmotor learning. Experimental Brain Research, 136(4), 431–438. doi:10.1007/s002210000614
Muller-Dahlhaus, J. F., Orekhov, Y., Liu, Y., & Ziemann, U.(2008). Interindividual variability and age-dependency of motorcortical plasticity induced by paired associative stimulation.Experimental Brain Research, 187(3), 467–475. doi:10.1007/s00221-008-1319-7
Oldfield, R. C. (1971). The Assessment and analysis of handed-ness: The Edinburgh Inventory. Neuropsychologia, 9(1), 97–113. doi:10.1016/0028-3932(71)90067-4
Palmer, E., & Ashby, P. (1992). Corticospinal projections to upperlimb motoneurones in humans. Journal of Physiology, 448,397–412.
Pascual-Leone, A., Nguyet, D., Cohen, L. G., Brasil-Neto, J. P.,Cammarota, A., & Hallett, M. (1995). Modulation of muscleresponses evoked by transcranial magnetic stimulation duringthe acquisition of new fine motor skills. Journal of Neurophysi-ology, 74(3), 1037–1045.
Penfield, W., & Boldrey, E. (1937). Somatic motor and sensoryrepresentation in the cerebral cortex of man as studied by elec-trical stimulation. Brain, 60(4), 389–443.
Perez, M. A., Lungholt, B. K., Nyborg, K., & Nielsen, J. B.(2004). Motor skill training induces changes in the excitabilityof the leg cortical area in healthy humans. Experimental BrainResearch, 159(2), 197–205. doi:10.1007/s00221-004-1947-5
Plautz, E. J., Milliken, G. W., & Nudo, R. J. (2000). Effects ofrepetitive motor training on movement representations in adultsquirrel monkeys: Role of use versus learning. Neurobiology ofLearning and Memory, 74(1), 27–55.
Ridding, M. C., & Flavel, S. C. (2006). Induction of plasticity inthe dominant and non-dominant motor cortices of humans.Experimental Brain Research, 171(4), 551–557. doi:10.1007/s00221-005-0309-2
Ridding, M. C., & Rothwell, J. C. (1997). Stimulus/responsecurves as a method of measuring motor cortical excitability inman. Electroencephalography and Clinical Neurophysiology,105(5), 340–344.
Ridding, M. C., & Ziemann, U. (2010). Determinants of the induc-tion of cortical plasticity by non-invasive brain stimulation inhealthy subjects. Journal of Physiology, 588(Pt 13), 2291–2304. doi:10.1113/jphysiol.2010.190314
Rossini, P. M., Barker, A. T., Berardelli, A., Caramia, M. D.,Caruso, G., Cracco, R. Q., Dimitrijevi-c, M. R., Hallett, M.,Katayama, Y., L€ucking, C. H., Maertens de Noordhout, A. L.,Marsden, C. D., Murray, N. M. F., Rothwell, J. C., Swash, M.,& Tomberg, C. (1994). Non-invasive electrical and magneticstimulation of the brain, spinal cord and roots: Basic principlesand procedures for routine clinical application. Report of anIFCN committee. Electroencephalography and Clinical Neuro-physiology, 91(2), 79–92. doi:10.1016/0013-4694(94)90029-9
Rossini, P. M., Burke, D., Chen, R., Cohen, L. G., Daskalakis, Z.,Di Iorio, R., Di Lazzaro, V., Ferreri, F., Fitzgerald, P. B.,George, M. S., Hallett, M., Lefaucheur, J. P., Langguth, B.,Matsumoto, H., Miniussi, C., Nitsche, M. A., Pascual-Leone,A., Paulus, W., Rossi, S., Rothwell, J. C., Siebner, H. R.,Ugawa, Y., Walsh, V., & Ziemann, U. (2015). Non-invasiveelectrical and magnetic stimulation of the brain, spinal cord,roots and peripheral nerves: Basic principles and procedures forroutine clinical and research application. An updated reportfrom an I.F.C.N. Committee. Clinical Neurophysiology, 126(6),1071–1107. doi:10.1016/j.clinph.2015.02.001
Sanes, J. N., & Donoghue, J. P. (2000). Plasticity and primarymotor cortex. Annual review of Neuroscience, 23, 393–415.doi:10.1146/annurev.neuro.23.1.393
Schambra, H. M., Abe, M., Luckenbaugh, D. A., Reis, J.,Krakauer, J. W., & Cohen, L. G. (2011). Probing for hemi-spheric specialization for motor skill learning: A transcranialdirect current stimulation study. Journal of Neurophysiology,106(2), 652–661. doi:10.1152/jn.00210.2011
Serrien, D. J., & Spape, M. M. (2009). The role of hand domi-nance and sensorimotor congruence in voluntary movement.Experimental Brain Research, 199(2), 195–200. doi:10.1007/s00221-009-1998-8
Shadmehr, R., & Mussa-Ivaldi, F. A. (1994). Adaptive representa-tion of dynamics during learning of a motor task. Journal ofNeuroscience, 14(5 Pt 2), 3208–3224.
Siebner, H. R., & Rothwell, J. (2003). Transcranial magnetic stim-ulation: New insights into representational cortical plasticity.Experimental Brain Research, 148(1), 1–16. doi:10.1007/s00221-002-1234-2
Sommer, M., Alfaro, A., Rummel, M., Speck, S., Lang, N., Tings,T., & Paulus, W. (2006). Half sine, monophasic and biphasictranscranial magnetic stimulation of the human motor cortex.Clinical Neurophysiology, 117(4), 838–844. doi:10.1016/j.clinph.2005.10.029
Stephani, C., Paulus, W., & Sommer, M. (2016). The effect of cur-rent flow direction on motor hot spot allocation by transcranialmagnetic stimulation. Physiological Reports, 4(1), e12666.doi:10.14814/phy2.12666
Thickbroom, G. W., Sammut, R., & Mastaglia, F. L. (1998). Mag-netic stimulation mapping of motor cortex: Factors contributingto map area. Electromyography and Motor Control-Electroen-cephalography and Clinical Neurophysiology, 109(2), 79–84.
Uy, J., Ridding, M. C., & Miles, T. S. (2002). Stability of maps ofhuman motor cortex made with transcranial magnetic stimula-tion. Brain Topography, 14(4), 293–297.
Vallence, A. M., Kurylowicz, L., & Ridding, M. C. (2013). Acomparison of neuroplastic responses to non-invasivebrain stimulation protocols and motor learning in healthyadults. Neuroscience Letters, 549, 151–156. doi:10.1016/j.neulet.2013.05.064
van de Ruit, M., Perenboom, M. J., & Grey, M. J. (2015). TMSbrain mapping in less than two minutes. Brain Stimulation, 8(2), 231–239. doi:10.1016/j.brs.2014.10.020
Wassermann, E. M., Mcshane, L. M., Hallett, M., & Cohen, L. G.(1992). Noninvasive mapping of muscle representations inhuman motor cortex. Electroencephalography and ClinicalNeurophysiology, 85(1), 1–8.
Wiethoff, S., Hamada, M., & Rothwell, J. C. (2014). Variability inresponse to transcranial direct current stimulation of the motorcortex. Brain Stimulation, 7(3), 468–475. doi:10.1016/j.brs.2014.02.003
Willerslev-Olsen, M., Lundbye-Jensen, J., Petersen, T. H., & Niel-sen, J. B. (2011). The effect of baclofen and diazepam on motorskill acquisition in healthy subjects. Experimental BrainResearch, 213(4), 465–474. doi:10.1007/s00221-011-2798-5
Wise, S. P., Moody, S. L., Blomstrom, K. J., & Mitz, A. R. (1998).Changes in motor cortical activity during visuomotor adapta-tion. Experimental Brain Research, 121(3), 285–299.
Ziemann, U., Muellbacher, W., Hallett, M., & Cohen, L. G.(2001). Modulation of practice-dependent plasticity in humanmotor cortex. Brain, 124(Pt 6), 1171–1181.
Received October 2, 2017Revised February 11, 2018Accepted February 18, 2018
14 Journal of Motor Behavior
M. VAN DE RUIT & M. J. GREY