handedness and child development - university of...
TRANSCRIPT

THE CENTRE FOR MARKET AND PUBLIC ORGANISATION
The Centre for Market and Public Organisation (CMPO) is a leading research centre, combining expertise in economics, geography and law. Our objective is to study the intersection between the public and private sectors of the economy, and in particular to understand the right way to organise and deliver public services. The Centre aims to develop research, contribute to the public debate and inform policy-making. CMPO, now an ESRC Research Centre was established in 1998 with two large grants from The Leverhulme Trust. In 2004 we were awarded ESRC Research Centre status, and CMPO now combines core funding from both the ESRC and the Trust.
Centre for Market and Public Organisation Bristol Institute of Public Affairs
University of Bristol 2 Priory Road
Bristol BS8 1TX http://www.bris.ac.uk/Depts/CMPO/ Tel: (0117) 33 10799
Fax: (0117) 33 10705 E-mail: [email protected]
Handedness and Child Development
Paul Gregg, Katharina Janke and Carol Propper
May 2008
Working Paper No. 08/198
ISSN 1473-625X

CMPO Working Paper Series No. 08/198
CMPO is jointly funded by the Leverhulme Trust and the ESRC
Handedness and Child Development
Paul Gregg1 Katharina Janke2 and
Carol Propper3
1CMPO and Department of Economics, University of Bristol; CEP, London School of
Economics.
2CMPO, University of Bristol
3CMPO and Department of Economics, University of Bristol; Tanaka Business School, Imperial College London;CEPR.
May 2008
Abstract Left-handedness is historically associated with poorer outcomes for adults. Yet recent work has suggested that there may be positive labour market returns for left-handed males. This paper examines whether handedness is also associated with poorer outcomes for children and whether this differs by genders. The paper examines a wide set of outcomes for children as they age from 42 months to 14 years. We find the main penalty is not from being left-handed, but is from not having a dominant hand early in life. This penalty is larger for girls than boys by age 14, indicating that early deficits of non-right handed boys appear to fall as they age. For girls, being left-handed and especially mixed-handed at early ages is associated with persistent cognitive attainment deficits, mainly focused at the lower end of the ability distribution. Keywords: Handedness, child outcomes JEL Classification: I12, J13
Electronic version: http://www.bris.ac.uk/Depts/CMPO/workingpapers/wp198.pdf
Acknowledgements This research has been funded by the ESRC project "An Examination of the impact of Family Socio-economic status on outcomes in late childhood and adolescence" (RES-060-23-0011). Address for Correspondence CMPO, Bristol Institute of Public Affairs University of Bristol 2 Priory Road Bristol BS8 1TX [email protected] www.bris.ac.uk/Depts/CMPO/

3
1. Introduction
Historically, left-handedness has been associated with being clumsy, defective and even evil
(Coren, 1992). In the epidemiological literature of the 1960s to 1980s left-handedness was
associated with deficiencies ranging from health problems such as sleep disorders, atopic
diseases, autoimmune problems and depression to delayed physical maturation, learning
disabilities and delinquency (Perelle and Ehrman, 2005, and Coren, 1992). Recently, the
relationship between left-handedness and labour market returns has been examined. Denny and
Sullivan (2007) examine a UK cohort born in the late 1950s and Ruebeck et al. (2007) examine a
US cohort born at a similar time. Both papers find a positive association of left-handedness on
earnings for men. In contrast, there appears to be no positive labour market return for women:
Denny and Sullivan find a negative effect of left-handedness on women’s earnings and Ruebeck
et al. find no effect.
If these findings indicate a causal relationship, we might expect to find a similar effect for
cognitive and behavioural outcomes for children. If left-handers (or at least left-handed men)
have better outcomes in adulthood, we might expect that they have better outcomes in childhood
too. However, in a study of a recent cohort of Australian children of school entry age (4 to 5
years), Johnston et al. (2007) find that left-handed children – and those who use both hands to
write – do worse on a range of cognitive and behavioural outcomes.
This poses somewhat of a puzzle. If the foundations for later life are laid in the early years as is
suggested by much recent research (see for example Klebanov et al., 1998; Dearing et al., 2001;
Taylor et al., 2004; Aughinbaugh and Gittleman, 2003; Carneiro and Heckman, 2004), why do
non-right-handed children do less well at school entry, but appear to be better rewarded in later
life, at least if they are male? Selection may be one reason: left-handed adult men observed in
work may be from the more able part of the left-handed ability distribution, though selection of
this kind would not explain the penalty for left-handed women. But it may also be the case that
non-right-handed children experience problems early in life, because they have not fully adapted
to being in a right-handed world, but that once they adapt – at least if they are male - they do
better.

4
In this paper we address this paradox by examining the impact of not being right-handed on
outcomes as children age. Specifically, we examine the impact of handedness on a range of
learning and behavioural outcomes for children as they move from early childhood (specifically
age 42 months) through to age 14. The early outcomes are similar to those studied by Johnston et
al. (2007). The later ones include both behavioural outcomes and cognitive outcomes, the last of
which have been shown in cohort studies for the UK to be strongly correlated with adult labour
market outcomes (Heckman et al., 2006; Blanden et al., 2007). We study a contemporary cohort
of children who are born in the early 1990s in the UK. Thus, we both replicate the Johnston et al.
study for a larger sample and extend this study to later years in childhood. In contrast to the
research on adults by Denny and Sullivan (2007) and Ruebeck et al. (2007) – but as Johnston et
al. (2007) – we distinguish between being left-handed and being mixed-handed, as mixed-
handedness is relatively common in early childhood1.
Theories of handedness (reviewed below) suggest that handedness may be partly genetic
(parental handedness, particularly maternal handedness, is associated with the child’s
handedness), partly caused by early physical trauma (during pregnancy, birth or early infancy)
and also related to maternal mental health early in the child’s life. Medical evidence also
suggests that being mixed-handed in early childhood is not just a sign of potential
ambidextrousness (which is rare), but also possibly a sign of harm to brain development (Sattler,
1993). Late development of a preferred hand – mixed-handedness – may also be due to lack of
parental stimulation: children who are given little opportunity to engage in activities such as
drawing or painting may be late in developing a preferred hand for writing, where the hand used
for writing or holding a pen is often used as the marker in social surveys for handedness.
Genetic factors which determine handedness are orthogonal to socio-economic status. However,
damage during pregnancy or in early life, maternal mental health and low parental stimulation
are likely to be socially graded. Thus in investigating whether there is a penalty to non-right-
handedness for children, it is important to control for factors which are both potentially
associated with handedness and themselves determine childhood outcomes. For example, if left-
handedness comes about through birth trauma, it may be the birth trauma rather than the
handedness that causes the poor outcome. Equally, children who have little interaction with their
1 The mixed-handed category covers children who favour one hand for some tasks and the other hand for other tasks as well as children who use either hand for the same task. Precise definitions are given below.

5
parents might both receive less stimulation and be more likely to be classified as mixed-handed
by their parents.
The data used in this paper allows us to attempt to isolate the impact of the random component
of handedness. Our data is rich in medical as well as social outcomes. It contains information on
parental handedness, birth trauma, measures of handedness early in childhood and later in mid-
childhood, and a large number of cognitive and behavioural and non-behavioural outcomes from
early to late childhood as well as standard socio-demographic information on the child and her
parents. We begin by establishing whether and when during childhood there is a penalty to not
being right-handed. We then attempt to control for the three different determinants of
handedness: the genetic transmission of left-handedness, potential damage pre- and post-birth,
and lack of parental interest in child development as well as more standard measures of socio-
economic status (SES). This approach allows us to examine whether any association of
handedness with cognitive and behavioural outcomes that we might find remains after we control
for the fact that handedness may be a marker of other factors that will reduce child development.
We also distinguish between girls and boys, as the research on adults finds gender differences in
the relationship between handedness and labour market performance.
We find that left-handed children perform less well than right-handed children on cognitive
outcome measures and mixed-handed children perform below their right-handed peers on
cognitive as well as non-cognitive outcome measures. However, after controlling for SES, lack
of parental stimulation, early physical damage to the child’s brain and possible heritability, we
find it is primarily being mixed- rather than left-handed that is associated with developmental
deficits in childhood. These deficits occur both before and after entry to school. Developmental
gaps are also evident in measures of value added, indicating that these children are making
slower progress than their right-handed contemporaries. In terms of gender difference, we find
some evidence that left-handed girls fare worse than their male counterparts on cognitive
outcomes in late childhood, but stronger evidence that mixed-handed girls have worse cognitive
outcomes than their male counterparts. For non-cognitive outcomes the gender difference is less
clear, with mixed-handed girls and boys performing worse than their right-handed peers.
The paper is organized as follows. Section 2 overviews the literature on theories of handedness
and its potential links with development. Section 3 presents our method and data. Section 4
presents the results and section 5 concludes.

6
2. Theories of Handedness
Denny and O’Sullivan (2007) and Ruebeck et al. (2007) review evidence on differential – and
generally poorer – performance of left-handers. Here we focus on discussion of the causes of
left- and mixed-handedness to understand the extent to which handedness may confer advantages
or disadvantages and the extent to which it is random, inherited or socially graded.
Different theories have been suggested to explain why right-handedness is dominant in all
societies while there is always a minority of people who prefer their left hand. For example,2
there is the theory of the warrior who holding his shield in his left hand and fighting with the
weapon in his right hand has a higher survival probability because he can better protect his heart.
Consequently, right-handedness provides an evolutionary advantage. However, since fighting
with a shield and weapon was an important occupation only for a relatively short period in the
long history of mankind, this theory is rather partial. To give another example, the observation
that left-handedness runs in families gave rise to genetic theories of handedness. Theories based
on classic Mendelian theory, however, fail to predict handedness correctly, because we observe
right-handed children whose parents are both left-handed. In fact, the majority of children with
two left-handed parents are right-handed, though children of two left-handed parents are more
likely to be left-handed than children of two right-handed parents.
More recent genetic models of handedness incorporate an element of randomness to reconcile
the data with the belief that handedness is inherited. They also incorporate the finding that most
right-handers process language in the left hemisphere of the brain, whereas only three in four
left-handers do so (see, for example, Pujol et al, 1999). Since muscle control is contralateral, i.e.
the left hemisphere of the brain controls the right hand and vice versa, it is efficient for
individuals with lateralisation of language in the left hemisphere to write with their right hand.
Thus (inherited) lateralisation of speech processes influences handedness over and above the
random factors determining handedness.
Lateralisation of speech processes is also the starting point of the theory of the pathological left-
hander. It assumes that damage to one hemisphere causes verbal processing to shift to the other
hemisphere, consequently turning a destined right-hander into left-hander. The brain may have
2 These examples of theories of handedness are taken from Beaton (2003).

7
been damaged pre-, peri- or postnatally, causing not only a shift in handedness but also
neurological impairment. This theory might explain why the proportion of left-handers is higher
in the population of cognitively impaired people than in the general population (see, for example,
Pipe, 1988), though the theory of the pathological left-hander fails to explain why people without
any noticeable neurological impairment are left-handed. In addition, the proportion of left-
handers is also higher in the extremely gifted population than in the general population (see, for
example, Benbow, 1986).
For this reason, Perelle and Ehrman (1982, 2005) reject the assumption that there is an
archetypic left-hander and state that investigations into the aetiology of handedness have to
account for the heterogeneity of the left-handed population. They claim that there are at least two
types of lefthanders, probably three. One type of left-hander is the pathological left-hander.
Another type is the natural left-hander, individuals whose brains are functionally mirror images
of right-handers, i.e. they process verbal information in the right hemisphere and therefore it is
efficient for them to write with their left hand. A third – and by their own account probably most
controversial – type is the learned left-hander. These individuals have not suffered brain damage
and they process speech in their left hemisphere, but a chance event turns them into left-handers:
very early in life they picked up a toy with their left hand. Using the left hand made it more
skilful, reinforcing its use. When these individuals were later offered a pencil, they also picked it
up with their left hand. Since they still process language in their left hemisphere, writing with the
left hand is neurologically inefficient. To reduce the time for interhemisphere transfer, some
develop an additional verbal centre in the right hemisphere, making spatial information, which is
processed in the right hemisphere, easily accessible3. So, according to Perelle and Ehrman, left-
handers with bilateral speech processing may be highly gifted learned left-handers and left-
handers with a verbal centre in the right hemisphere may be pathological left-handers or natural
left-handers.
Theories of mixed-handedness are less common, but the ideas of anomalous hemispheric
specialisation and loss of anatomical asymmetries in the brain crop up in the literature.
Geschwind and Galaburda (1987) hypothesise that influences in pregnancy reduce the structural
3 The three types of left-handers may explain the distribution of language lateralisation in left-handers. As mentioned above, about three in four left-handers process verbal information in the left hemisphere like right-handers. The remaining quarter use either the right hemisphere or both hemispheres. Pujol et al. (1999), for example, found activation of the right hemisphere in 10% of left-handers and bilateral activation in 14% of left-handers. The distribution of language lateralisation in left-handers shows that – in contrast to right-handers – left-handers are not a homogenous group.

8
asymmetry of the brain. They suggest that factors related to male sex such as testosterone
“produce a shift from left predominance to symmetry”. Sattler (1993) claims that mixed-handed
people have suffered oxygen deprivation during the perinatal period, which caused more serious
injuries to the dominant brain hemisphere. These injuries result in unstable handedness during
childhood, but later they will settle upon using one hand. This line of argument resembles the
theory of the pathological left-hander, which also refers to the finding that the dominant
hemisphere has an elevated blood flow and therefore a higher oxygen requirement, making it
more susceptible to oxygen deprivation. Recently, researchers have found a link between
antenatal maternal anxiety or distress and mixed-handedness (Obel et al., 2003; Glover et al.,
2004 and Gutteling et al., 2007). These hypotheses have in common the idea that adverse
conditions during brain development cause mixed-handedness, suggesting that mixed-handers
are a more homogeneous group than left-handers, comprising mainly neurologically impaired
people.
In sum, these theories suggest that both left- and mixed-handedness is a marker for early brain
deficits which may translate into deficits in later life (for evidence on some of these non-earnings
deficits, see Denny and O’Sullivan, 2007, and Ruebeck et al., 2007). Left-handers may also
contain a group with greater ability. In addition, there are environmental reasons why both left-
and mixed-handed individuals may have poorer performance, as the world is geared towards
right-handers.
3. Methods and Data
3.1 Estimation method
Our focus is the impact of not being right-handed on a range of outcomes as children move
through childhood. For most of our analyses we estimate equations of the following form:
Oi = α + LiγL + MiγΜ + Xiβ + εi ,
where i indexes the child. Oi is one of 11 outcomes which occur at different ages, Li is an
indicator variable that takes the value 1 if the child is left-handed and 0 otherwise, Mi is an
indicators variable that takes the value 1 if the child is mixed-handed and 0 otherwise. The
coefficients of interest are γL and γM. To maximise sample size, we include observations with

9
item non-response in the X vector by adding missing indicators and replacing the missing value
with the mean if the variable is continuous. We estimate robust standard errors.
In our analysis we first estimate the raw correlation between handedness and the outcomes and
then add in sets of controls to attempt to isolate the effect of handedness from other variables. Xi
is a vector of controls for family SES plus the three sets of factors reflecting the literature
discussed above – parental interest in children, pre-, peri- or postnatal insult to the left brain
hemisphere and genetic heritability of handedness. So first we condition on potential cofounders,
socio-economic position and parental stimulation, to look at the picture for all typologies of left-
handedness. We then split off typologies, firstly brain insult, then hereditary, to focus on
apparently random handedness. We also examine the impact of handedness on value added
measures, primarily in cognitive development. These control for prior attainment, so control for
many of the child and parental fixed characteristics that may be determinants of handedness. The
value added measures thus both reduce the potential impact of unobserved heterogeneity as well
as showing whether children who are not right-handed progress at a different rate to their right-
handed peers.
3.2 Data
Our data are from a rich data set for a cohort of children born in one region of the UK in the
early 1990s. The Avon Longitudinal Study of Parents and Children (ALSPAC) is a population-
based study of parents and children. Pregnant women resident in the former Avon Health
Authority were invited to participate if their estimated date of delivery was between the 1st April
1991 and the 31st December 1992. The Avon area is broadly representative of the UK as a whole.
Approximately 85% of eligible mothers enrolled, resulting in a cohort of approximately 12,000
live births4. Respondents were interviewed at high frequency compared to any of the UK cohort
studies. The ALSPAC survey also contains data from sources other than self-completion
questionnaires. The ALSPAC team have run a number of clinics for children from the age of
seven (and from a younger age for a selected sub-sample) in which they are able to directly
assess various aspects of the children’s development. Records from other agencies have been
matched to the individual children and we use data from schools on standardised national tests
and teachers assessments of the pupils. In our analyses we use data from some fifteen
questionnaires, three clinics and three school tests covering the dates between 8 weeks gestation
and the 11th year of the child.
4 Our estimation samples are smaller than this due to post-birth sample attrition and item non-response.

10
Outcome measures
We analyse cognitive outcomes, early development and behavioural outcomes. Our cognitive
outcome measures are performance on tests taken at school at different ages and a measure of
IQ. The school-based measures of cognitive development are the entry assessment test taken at
age 4 or 5, the Key Stage 1 assessment which is administered in Year 2 at age 7, the Key Stage 2
assessment in Year 6 at age 11 and the Key Stage 3 assessment Year 9 at age 14. The latter three
are national tests administered to all school children in the public sector5; the former is a test that
was Avon specific but designed along similar lines to the now national school entry test. Each
test is composed of four sub-scores that capture ability in reading, writing, mathematics and
language skills (entry assessment only), spelling (Key Stage 1 only) or science (Key Stage 2 and
3 only). We compute the average of the four sub-scores to create an overall score6. The measure
of IQ is the short form of the Wechsler Intelligence Scale for Children7 (WISC-III UK),
administered to children at a clinic at the age of 8. This is the most widely used individual ability
test world-wide8.
Our measures of early development are a language development score, a social development
score, a fine motor skills score and a gross motor skills score. The language score is derived from
responses to the 38-month child-based questionnaire completed by the mother9. It is composed
of four sub-scores that each capture a slightly different aspect of the child’s language
development, such as vocabulary or grammar. The social development score and the motor skills
scores are derived from responses to the 42-month questionnaire. The questions were adapted
from the Denver Development Screening Test (Frankenburg and Dodds, 1967), a test designed to
detect children with developmental delays. 10
5 Only a small minority of children under age 11 (around 5%) are educated outside the public sector. 6 For the Key Stage 2 and 3 assessments we construct a finer measure for each subject using additional information on pupils’ marks before averaging over the four sub-scores. A detailed description of this procedure is available from the authors. 7 Wechsler, Golombok and Rust (1992) 8 It comprises five verbal sub-tests: information, similarities, arithmetic, vocabulary and comprehension; and five performance sub-tests: picture completion, coding, picture arrangement, block design and object assembly. We combine the sum of the verbal subtests and the sum of the performance subtests into an overall score using the technique of factor analysis. 9 Questions adapted from the MacArthur Infant Communication Questionnaire (Fenson, Dale, Reznic et. al., 1991). 10 The social development score covers questions such as “she is able to drink from a cup without spilling” or “he can put on a T-shirt by himself”. The fine motor score covers activities such as drawing a circle or building a tower of 4/6/8 bricks and the gross motor score includes questions on being able to throw a ball or balancing on one foot for at least four seconds.

11
Behaviour is measured by responses to the Strengths and Difficulties Questionnaire (SDQ;
Goodman, 1997), which comprises 25 questions relating to five dimensions of behaviour – pro-
social, hyperactivity, emotional, conduct and peer relations11. Respondents were asked to
indicate the extent to which 25 statements matched the study child’s behaviour over the last six
months. We use the SDQ completed by the mother when the child was 81 months old12. A
maximum of ten can be scored for each component. Using factor analysis, we combine four of
the sub-scores into one overall score, excluding the pro-social score, which we use as a separate
outcome variable. A higher total behaviour score indicates more behavioural problems, whereas
a higher pro-social score indicates more positive social behaviours. For presentational purposes
we reverse the total behaviour score so that – in line with the other outcome measures – a higher
score indicates better behaviour.
We standardise all outcome variables to have a mean of 100 and a standard deviation of 10. The
magnitudes of our regression estimates, therefore, are directly comparable across all 10
measures. As a guide to interpreting the size of our estimates, assuming a normal distribution an
increment of 1 point (i.e. a tenth of a standard deviation) results in a shift from the median to the
54th percentile, while an increment of 2.5 points (or a quarter of a standard deviation) results in a
shift from the median to the 60th percentile.
Handedness measure
We derive a measure of handedness from responses to the 42-month child-based questionnaire
completed by the mother. Mothers were asked to indicate, for six activities, if their child uses the
left hand, the right hand, either hand or does not do this activity at all. We use four of the six
activities, excluding holding a knife when cutting things, since this question may be
inappropriate for a 42 month old child, and hitting things, because this action does not require
dexterity.
Children who perform all four activities – drawing, colouring in, brushing their teeth and
throwing a ball – with the same hand are classified accordingly. If the mother ticked “either” for
all four activities, we classify the child as mixed-handed. Children who use the same hand for 3
out of 4 activities are classified according to the hand they mainly use. Children who use the
11 This measure is a good predictor of conduct, emotional, hyperactivity and any psychiatric disorders in children of the age we examine (Goodman et al., 2000). 12 The same questionnaire at age 8 completed by the teacher is for a much smaller sample; therefore, we use it only in robustness checks.

12
right hand for 2 activities and the left hand for the other 2 activities are recorded as mixed-
handed. We also assign mixed-handedness to children with the following patterns: eerl, rrel, ller
(where r = right, l = left, e = either). Children with the patterns rree and llee are classified as
right-handed and left-handed, respectively. We also include children for whom one activity is
missing, classifying as right-handed children with the patterns rrr, rrl, rre, as left-handed children
with lll, llr, lle and as mixed-handed children with eee, eel, eer, rle.
Table A1 indicates about 10% of the children in our sample are left-handed, which is in line with
proportions found in the global population (see, for example, Perelle and Ehrman, 2005). The
proportion of mixed-handed children in our sample is about 7.5%, a proportion similar to the one
found in the 1958 National Child Development Survey (NCDS) at age 7 years (see Denny and
O’ Sullivan, 2007).
Controls
We have three sets of controls in addition to gender and standard SES measures, which also
include family size and an indicator for being non-white (the last to allow for the fact that in
some groups left-handedness may be less socially acceptable). Our measures of parental SES are
father’s occupational class, mother’s age at birth, mother’s highest educational qualification,
housing tenure when the child is 21 months old and the log of the average of equivalised net
household income at ages 33 and 47 months, expressed in June 1995 prices13. Our measure of
family size is the number of siblings when the child is 47 months old. Descriptive statistics of the
data are provided in table A1.
One set controls for parental handedness, capturing the possibility that non-right-handedness is
inherited. 13% of left-handed children have a left-handed mother, whereas this proportion is only
7% for the total sample. This difference is less pronounced for the father’s handedness, with 12%
of left-handed children having a left-handed father compared to 10% for the total sample (see
Table A1).
Another set of controls captures the possibility that non-right-handedness is caused by insults to
the foetus’s or infant’s brain that might damage one hemisphere, converting a destined right-
13 Income data from the ALSPAC data is banded. We impute a median value for each band using data from the Family Expenditure Survey, convert the income variables to real values using the 1995 RPI as a base and equivalise using the OECD modified scale. We also impute the value of housing benefit for families who do not directly receive housing payments. Finally, we average over the two measures to reduce measurement error and take the log of the variable.
13
hander into a pathological left-hander. As an indicator of perinatal neurological insult, Bakan
(1971) suggested high-risk birth order position, which he defined as first born and fourth or later
birth. We therefore include indicators for first pregnancy and fourth or higher order pregnancy.
Since birth order as an indicator of potentially brain-damaging birth stress may be problematic,
we also control for some of the birth stressors identified in the medical literature (Searleman et
al.1989). We use information on the method of delivery which identifies whether the mother had
a Caesarean section and whether this was an emergency Caesarean or a planned Caesarean14.
Other direct indicators of birth stress listed by Searleman et al. (1989) are maternal age at birth,
which is one of our SES controls, and low birth weight and premature birth, which we control for
by including the birth weight to gestation ratio. We cannot, however, control for birth stressors
such as slow labour, breathing difficulties or Rh incompatibility.
As a further indicator of potentially brain-damaging prenatal stress in the foetus we include a
measure of maternal mental health – the Crown Crisp Experiential Index (CCEI) – at 18 weeks
gestation. The CCEI is a scale measuring mental ill health that consists of six sub-scales. The
ALSPAC data contain the three sub-scales which measure free-floating anxiety, somatic
concomitants and depression were employed. Each sub-scale consists of 8 items with scores
between 0 and 2. A higher score indicates that the mother is more affected. To control for
postnatal neurological insult, we include a variable indicating whether the child has been
dropped or had a bad fall since he was 6 months old, a question answered by the mother in the
15-month child-based questionnaire.
A third set controls for parental interest in the child. Misclassification of handedness may arise if
mothers cannot recall their child’s hand preference when filling in the questionnaire and so
indicate “either”. But mothers may be more ignorant of their child’s handedness if they give their
child less opportunities to perform uni-manual activities such as drawing or painting. Being
offered less such activities may result in worse outcomes. Thus, we might find that mixed-
handedness is associated with worse outcomes, whereas in fact a lack of stimulation generates
the association. To control for this potential confounder, we include in our controls a parenting
score which indicates the range and volume of activities mothers undertake with their children.
14 For about 2% of mothers we only know that they had a Caesarean section.

14
The parenting score is derived from responses to the 24-month child-based questionnaire
completed by the mother15.
The association between controls and handedness
Table 1 presents a multinomial logit model of handedness which reveals significant associations
between the controls and being left- or mixed-handed. We block the results into the four possible
sources of handedness: sex, heritability, early trauma, parenting and parental SES. The fit of the
model is low, indicating that despite the associations we find there is a high degree of chance in
handedness. We see that girls are less likely to be left- or mixed-handed. In terms of possible
genetic factors, having a left-handed or a mixed-handed mother significantly increases the
probability of being left-handed or mixed-handed. Larger coefficients on the indicator variables
for maternal left- or mixed-handedness in the left-handedness equation suggest a stronger genetic
component for left-handedness than for mixed-handedness. In addition, paternal left-handedness
increases the probability of being left-handed.
Supporting the hypothesis that non-right-handedness is associated with possible damage to the
brain at or before birth, being either left- or mixed-handed is associated with having a lower birth
weight to gestation ratio and being delivered by Caesarean section after onset of labour.
Additionally, being mixed-handed is associated with being born as a 4th or higher order
pregnancy and being dropped between six and fifteen months16. Mental ill health during
pregnancy – proxied by the CCEI at 18 weeks gestation – is also associated with left-handed
offspring.
There is some indication that classification as mixed-handed may be associated with lack of
parental awareness and/or stimulation of the child (which themselves are socially graded).
Children who are offered fewer stimulating activities by their parents are more likely to be
classified as mixed-handed and also those born to a mother who experienced more mental ill
health during pregnancy.
15 The mother is asked to report how often she: lets her child play with paints, mud or other messy objects; lets her child use objects to build towers or other creations; sings to her child; reads him stories; goes out to the park or playground with him. The scores for each component range from 1 (rarely) to 4 (every day), so the maximum parenting score is 20. 16 The coefficient on fall/drop 6-15 months is 0.20 (s.e. = 0.12) in the mixed-handed equation when excluding observations with missing control variables.

15
We also find – in contrast to findings of Johnston et al. (2007) for contemporary Australian
children – that children of lower socio-economic status are more likely to be mixed-handed.
Left-handedness is not associated with socio-economic status, though in our sample mothers who
have an A-level are less likely to have a left-handed child17.
In summary, we find non-right-handedness to be associated with many of the factors suggested
in the medical literature and mixed-handedness to have some association with socio-economic
status and parental behaviours post-birth.
4. Results
4.1 Primary results
The top panel of Table 2 shows the association between handedness and the outcome variables
conditioning just on gender. Non-right-handedness is associated with gender (see Table 1); boys
also develop more slowly than girls and so we need to avoid mixing gender and handedness.
These regressions indicate that left-handers perform significantly worse than right-handers on the
cognitive outcome measures and on the gross motor score at 42 months, whereas mixed-handers
perform significantly worse than right-handers on nearly all of the outcome measures, with no
clear pattern across the different types of outcomes.
The second panel of Table 2 shows the association between handedness and the outcome
measures after also controlling for basic socio-economic variables (including family size and
ethnicity), but not for heritability, insults to the child’s brain or parenting. The handedness
coefficients fall by around one-third for the cognitive outcomes, less for the non-cognitive
outcomes18. For left-handers, the coefficients are still significantly negative for the IQ score, the
Key Stage 2 and 3 scores and the gross motor score at 42 months; for mixed-handers all
coefficients are still significantly negative. So whilst the associations between handedness and
the individual socio-economic indicator variables in Table 1 are weak, their inclusion in the
model is important in the sense they collectively impact on the handedness coefficients. The next
17 This finding is not an artefact caused by our definition of handedness. In a logit model of left-handedness at age 7 – this handedness measure is taken at a clinic at age 7, where the tester noted which hand the child used to write with – we find the same association: mother has O-level = -0.13 (s.e. = 0.11), mother has A-level = -0.28 (s.e. = 0.13), mother has degree = -0.00 (s.e. = 0.15). 18 Since we find that children from lower socio-economic backgrounds are more likely to be mixed-handed, we would expect the coefficients on mixed-handedness to drop when controlling for SES. For left-handedness, however, we do not find a clear correlation with socio-economic variables, but the coefficients on left-handedness drop when controlling for these variables. This drop is probably partly driven by the somewhat odd association between left-handedness and mother’s education (see Table 1).

16
panel adds in the parenting score to remove the effect of a possible lack of parental involvement
in the association with mixed-handedness. The coefficients on left-handed are essentially
unchanged, whereas the coefficients on mixed-handed fall a fraction.
So far we have attempted to control for confounding variables that may reflect poor early
stimulation of the child and are reflected in poor identification of handedness. The results in
Panel III can be thought of the average gap associated with handedness rather than reflecting
social deprivation. However, as discussed in the section on theories of handedness, there are
different typologies of handedness and one in particular, pathological left-handers, may
experience handedness very differently from other non-right handed children. We now try and
explore the potential impact of brain insults. Panel IV of Table 2 adds in the controls for pre-,
peri- and postnatal insults to the child’s brain, so isolating the effect of handedness from the
physical effects of a difficult birth. The handedness coefficients drop a little (by up to 10%), but
their significance levels are largely unchanged. This suggests that non-right-handedness as a
result of birth difficulties does not lie at the heart of handedness differentials.
Finally, the bottom panel of Table 2 adds in controls for the heritability of handedness by
including parents’ handedness. The fall in the coefficients is again modest and leaves the
significance levels unchanged.
In comparison to the sex-standardised correlations presented in the top panel, the net effect of
controlling for SES, parenting, insults to the child’s brain and heritability is to considerably
reduce the correlation between left-handedness and poorer cognitive outcomes. Left-handed
children perform worse than right-handed ones in terms of cognitive outcomes at ages 8, 11 and
14, and gross motor skills at age 42 months, but the size of the coefficients is small, indicating a
performance differential between right- and left-handed children of under a tenth of a standard
deviation. Controlling for heritability and brain insults does not change the effect of left-
handedness and suggests little variation in attainment gaps according to the typologies of left-
handed groups.
For mixed-handers, though the size of the coefficients drops by between 10% and 50% when
controlling for SES, parenting, brain insults and heritability, their performance remains
significantly worse on nearly all of the outcome measures. They perform worse on all types of
outcome measures, though there appears to be more effect on outcomes early in life than at ages

17
8, 11 or 14. The size of the gap between mixed-handed and right-handed children is moderate.
The largest coefficient – for the early fine motor score – is -2.9 and suggests that (assuming a
normal distribution) being mixed-handed would result in a drop from the median to the 39th
percentile of the distribution. Mixed-handed children score about one-fifth of a standard
deviation below right-handed children on social development and gross motor skills and about
one-eight of a standard deviation below on language. The largest cognitive test deficit is for IQ,
where mixed-handed children score 1.2 points below right-handed children, which – again
assuming a normal distribution – is equivalent to a drop from the median to the 45th percentile. In
terms of behaviour, the gap is largest for behavioural problems, where mixed-handed children
score 1.5 points less than right-handed children, which is equivalent to a shift from the median to
the 44th percentile of the distribution.
The coefficients on the control variables, which are presented in Table A2, allow comparison of
the importance of handedness with more studied determinants of child outcomes19. Handedness
is less important than other determinants of outcomes such as parental education or parenting
behaviour. For example, a parenting score of only 4, where the lower quartile of the parenting
score distribution is 13, offsets the effect of being mixed-handed on Key Stage 1, 2 and 3 scores,
WISC score, early development and behaviour. But the impact of mixed-handedness is around
half the gap between boys and girls for early development and behaviour and more than twice as
large as the effect of having one more sibling for cognitive outcomes.
As non-right-handedness is associated with gender and as earlier research has shown differences
in outcomes for men and women, Tables 3a and 3b therefore investigate whether the negative
effects associated with being left- or mixed-handed differ by gender. The tables present
coefficient estimates from regressions that sequentially add our controls for socio-economic
status, parenting, insults to the child’s brain and heritability as before, first for the boys-only
19 Gender, the birth weight to gestation ratio, the mother’s mental health at 18 weeks gestation, income and the parenting score at 24 months are significant for nearly all of the outcome measures. The coefficients have the expected signs: girls’ outcomes are better than boys’; a higher birth weight to gestation ratio, higher income and a higher parenting score are associated with better outcomes; poorer maternal mental health is associated with worse outcomes. The controls for SES – as indicated by other measures than income – are significant mainly for our measures of cognitive ability and show the usual social gradient. Parents’ handedness is not systematically associated with all of the child outcomes, though parental left-handedness, either maternal or paternal, seems to be related with lower school performance. Distress at birth – as measured by delivery by caesarean section – also has no systematic association with outcomes, but there is some suggestion of a negative association with cognitive ability and behaviour.

18
sample and then the girls-only sample, respectively. The cost is smaller sample sizes, which
reduces the precision of the estimates.
For left-handedness, the basic correlations suggest that left-handed boys score below right-
handed boys on the entry assessment, the Key Stage 2 and 3 tests, the IQ test and the social
development score at 42 months. Left-handed girls perform worse than their right-handed
counterparts in the Key Stage 1, 2 and 3 tests. For these three outcomes, the gap between left-
handed girls and right-handed girls is larger than the gap between left-handed boys and right-
handed boys. Mixed-handers of both genders do less well than right-handed children across a
wider range of outcomes. The coefficients for mixed-handed boys and girls are similar for the
early development and behaviour scores, but the coefficients for mixed-handed girls are much
larger than the ones for mixed-handed boys for the cognitive outcomes. When including SES
controls, the coefficients on left-handed and mixed-handed drop by about one-quarter to one-
third for the cognitive outcome measures for boys and girls. They remain unchanged for the
early development and the behavioural measures. Adding the parenting score slightly increases
the coefficients on left-handed for boys and girls, reduces the coefficients on mixed-handed for
boys and does not changes the coefficients on mixed-handed for girls.
The controls for insults to the child’s brain reduces boys’ significant coefficients on left-handed
(entry assessment and early development measures) by around 10% and changes girls’
coefficients on left-handed by relatively little. Boys’ coefficients on mixed-handed drop slightly
and girls’ coefficients on mixed-handed drop by 3% to 13%. Subsequently adding controls for
heritability of handedness changes the coefficient estimates for left-handers and mixed-handers
by relatively little, though they tend to drop for boys and increase for girls.
The final coefficient estimates suggest that left-handed boys perform less well on two early
measures – entry assessment at age 5 and social development at age 42 months – but otherwise
perform as well as their right-handed counterparts. Left-handed girls, on the other hand, perform
less well at ages 11 and 14 on the cognitive scores. But again the larger penalties are for the
mixed-handed children. Mixed-handed boys perform significantly worse than right-handed boys
on the early development measures, the behaviour measures and the entry assessment score at
age 5. The largest deficit is for fine motor skills, where mixed-handed boys score 3.3 points
below their right-handed counterparts, which – assuming a normal distribution – is equivalent to
a drop from the median to the 37th percentile. For mixed-handed girls we find that they perform

19
significantly worse than right-handed girls on the cognitive outcome measures and the social
development, fine motor and gross motor scores. The deficit is -2.6 points for the entry
assessment at age 5, around -1.8 points for the Key Stage 1 test at age 7, the Key Stage 2 test at
age 11 and the IQ test at age 8, and still -1.6 points for the Key Stage 3 test at age 14, which is
equivalent to a drop from the median to the 44th percentile. For the early development measures,
the largest deficit is for the fine motor score, with a point estimate of -2.2, equivalent to a drop
from the median to the 41st percentile.
Interestingly, although mixed-handed boys perform worse than right-handed boys on the early
development measures and the earliest cognitive measure, there are no significant differences for
the later cognitive outcome measures. Mixed-handed girls, however, perform worse than right-
handed girls on the early development measures as well as the later cognitive outcome measures.
There is no sense of catching up among non-right handed girls.
The approach adopted allows us to say something about differences among typologies of left-
handedness. Introducing controls for brain insults and heritability allows us to see if coefficients
change as we focus in on the base group of apparently random left- or mixed-handedness. The
results suggest little evidence of differences in performance across these typologies. Next, we
explore whether there is evidence of a different distribution of attainment by handedness.
Table 4 attempts to examine where in the distribution of each outcome the deficit for non-right-
handers arises, allowing for differences between genders. It presents the coefficient estimates
from quantile regressions for interaction terms of handedness and sex for the entry assessment
score, the Key Stage 2 and 3 test scores, the fine motor skills and the total behavioural score,
controlling for the full set of confounders. The results for the other early development measures
are similar to the results for the fine motor skills and the results for the Key Stage 1 test score are
similar to the results for the Key Stage 2 and 3 test scores and are available from the authors.
Column 1 shows the coefficients on the interaction terms obtained using OLS. They are similar
to the coefficients from the separate OLS regressions for boys and girls reported in Tables 3.a
and 3.b. Columns 2 to 10 present the quantile regression estimates for the 9 deciles.
For left-handers the results suggest that the poorer performance of left-handers and right-handers
in cognitive ability arises from (moderate) differences at the lower end of the conditional
distribution. Left-handed boys perform worse on the Key Stage 2 assessment at the 0.10 quantile

20
and on the IQ test at the 0.10, 0.20. 0.30 and 0.40 quantiles (but the size of the gap diminishes as
we move up the distribution). Interestingly, there is an indication that left-handed boys perform
better at the very top of the IQ distribution20. Left-handed girls score lower on the Key Stage 2
and 3 assessments at the bottom and the middle (the 0.10 to 0.60 quantiles) of the distribution21.
In terms of motor skills, left-handers score less than right-handers only at the lower end of the
distribution. The total behavioural score is lower for left-handed girls, though not boys, at the
bottom of the distribution (0.10 and 0.20 quantiles).
In contrast, for mixed-handers the results show that being mixed-handed is broadly associated
with worse cognitive outcome measures and lower motor skills scores across the whole range of
the conditional distribution, particularly for girls. The cognitive outcome results suggest that
mixed-handed girls are affected across the whole range of the conditional distribution. Mixed-
handed boys seem to perform worse at the Key Stage 2 and 3 tests at the 0.10 to 0.40 quantiles,
whereas for girls the estimates are significant at nearly all of the quantiles. Nevertheless, for the
Key Stage 2 test score the coefficient on being a mixed-handed girl at the 0.10 quantile is three
times as large as the coefficients on mixed-handed girl at the middle and the top of the
distribution, so that – whilst the penalty to being a mixed-handed girl runs higher up the
distribution than for their male counterparts – both boys and girls have largest deficits at the
bottom end. For behaviour we find effects mainly at the bottom end of the distribution.
So far we have looked at outcomes at certain ages and found a penalty to being non-right-
handed. The Key Stage 1, 2 and 3 assessments, which both measure the same underlying ability
– academic performance – but at different ages, 7, 11 and 14 years, allow us to investigate
whether non-right-handedness also impacts on children’s progress at school by controlling for
the Key Stage 1 score in the Key Stage 2 outcome and the Key Stage 2 score in the Key Stage 3
outcome. Additionally, controlling for the previous Key Stage score provides estimates of the
effects of left- or mixed-handedness conditional on unobserved factors, such as genetics, that
determine the earlier outcome but might also influence the later outcome.
Table 5 shows that even conditional on prior attainment left-handed girls and mixed-handed girls
and boys perform worse at the Key Stage 2 assessment, though the size of the effect is relatively
20 Larger and more significant are the estimates at the very top of the distribution: The coefficient on boy & left for the 0.95 quantile is 2.11 (s.e. = 1.14) and for the 0.975 quantile 2.75 (s.e. = 1.17). These results echo Benbow’s (1986) findings of a link between left-handedness and extreme intellectual precocity. 21 The coefficient on girl & left is 1.39 (s.e. = 0.64) for the 0.95 quantile.

21
small, about the same as reducing the Key Stage 1 score by 1 point.22 Controlling for the Key
Stage 2 score in the Key Stage 3 equation, however, gives a significantly negative coefficient
only on girl & left, suggesting that mixed-handed children’s progress between age 11 and age 14
is similar to their right-handed peers, whereas left-handed girls still progress at a slower rate than
right-handed children.
The Key Stage 2 and 3 scores are the average of sub-scores in English, maths and science. The
worse performance of left- and mixed-handed girls may be driven by a lower English score due
to difficulties with handwriting. To test this, we undertook regressions using the three sub-
scores as outcome variables. The results show that the penalty to being a left-handed girl is
largest in science and that mixed-handed girls’ performance in maths is particularly poor23,
suggesting that left-handers’ handwriting problems such as illegible and smudged writing do not
account for the performance differential.
4.2 Robustness checks
Definition of handedness
As we find the largest deficit is for children who are classified as mixed- rather than left-handed,
we examine whether the results are robust to alternative definitions of handedness. Table 6
reports estimates of the association between handedness and child outcomes using the
components of our handedness measure – drawing, colouring in, brushing teeth and throwing a
ball – separately to define handedness, thus avoiding the potential pitfalls that arise when we
have to choose a cut-off to separate the three types on a multidimensional measure of handedness
(see Bishop, 1990). The regressions include our full set of control variables. The results do differ
somewhat according to the activity that defines handedness. For example, children who use their
left hand for drawing or colouring in score significantly less on Key Stage 2 and 3 assessments,
WISC and early development measures, whereas children who hold their toothbrush with their
22 Results are similar when including a measure of prior attainment in the early development regressions. For example, regressing the social development score at age 42 months on handedness, the social development score at age 30 months and our standard set of controls, we obtain the following coefficient estimates: left = -0.39 (s.e. = 0.27), mixed = -0.93 (s.e. = 0.34), social development score at 30 months = 0.60 (s.e. = 0.01). 23 The coefficient estimates for the Key Stage 2 sub-scores are for left-handed girls -0.84 (s.e. = 0.46) for English, -0.91 (s.e. = 0.50) for maths and -1.26 (s.e. 0.48) for science and for mixed-handed girls -1.49 (s.e. = 0.63) for English, -2.32 (s.e. 0.73) for maths and -1.15 (s.e. = 0.65) for science. The estimates for the Key Stage 3 sub-scores are for left-handed girls -0.96 (s.e. = 0.48) for English, -1.14 (s.e. = 0.51) for maths and -1.45 (s.e. = 0.50) for science and for mixed-handed girls -1.08 (s.e. = 0.63) for English, -2.23 (s.e. = 0.65) for maths and -1.43 (s.e. = 0.65) for science. Controls are heritability, insults to child’s brain, socio-economic status and parenting.

22
left hand score significantly less only on Key Stage 2 and 3 assessments and WISC, and children
who throw a ball with their left hand score significantly less only on gross motor skills.
So which activity is the best one to define handedness? Perelle and Ehrman (2005) argue the
writing hand determines handedness. Whereas people can learn to do mechanical tasks equally
well with either hand, only very few persons can write equally well with either hand. As 3 ½
year olds come closest to writing when they draw or colour in, we focus on these two activities.
We find the estimates of the negative effect of being left-handed are larger and more significant
when using the drawing or colouring-in hand to define handedness than when using our
multidimensional measure of handedness. For nearly all of the outcomes, being mixed-handed is
associated with a smaller, though still significant, penalty when using the drawing or colouring-
in hand to define handedness instead of our multidimensional measure of handedness. The
smaller coefficient size is possibly due to downward bias caused by measurement error, which
increases when using a one-dimensional handedness measure24.
Our handedness measure is mother reported. We investigate the robustness of this by combining
it with a handedness measure taken at a clinic at the later age of 7, where a tester noted which
hand the child used to write with (right or left)25. We find that for children who are mixed-
handed at 42 months, adding in information on the hand used for writing at age 7 does not seem
to modify the effect of mixed-handedness at age 42 months for most of the outcomes (results
available from the authors)26. We also examine the results using only the hand the child used to
write with at the clinic at age 7 as a measure of handedness (Table A3). Using this definition we
would conclude, as for our preferred classification at age 42 months, that left-handed children
score worse on several of the cognitive outcomes and the fine motor skills. But we would miss
the finding that mixed-handedness in early childhood is associated with larger negative effects
on nearly all outcomes. In addition, the negative effects on left-handedness as defined by writing 24 For example, of the 1049 children who – according to their mother – draw with either hand, 151 use the same (right or left) hand for the other three activities. Thus, these children probably have a strongly preferred hand, but their mother could not recall which hand they prefer for drawing and therefore ticked “either”. 25 For children who did not attend the clinic at age 7 but attended one of the clinics at ages 8 and 9 we use a similar variable from these clinics. About 20% of children in the sample do not have a later measure of handedness as they did not attend any of these clinics. 26 Children for whom we do not have a later handedness measure perform worse on nearly all outcome measures regardless of their handedness at age 42 months. Generally, children who do not attend the clinics are from lower socio-economic backgrounds. As we control for socio-economic background as well as parental input, the negative coefficients on right-missing, left-missing and mixed-missing capture unobserved differences between parents who take their child to the clinics and those who do not, possibly differences in parents’ interest in their children’s development. Within this group of possibly less active parents, we find that left-handed children score below right-handed children and mixed-handed children score below left-handed children on the early development measures, the entry assessment and the Key Stage 3 test.

23
hand at 7 are probably driven by the children who were mixed-handed at age 42 months, so
classification on the basis of writing hand at age 7 would suggest these negative effects are
associated with left-handedness.
In conclusion, these checks suggest that our multi-dimensional measure of handedness in early
childhood – which also allows for unstable handedness – is informative and robust.
Possible biases from maternal reporting
Several of the measures we examine are reported by mothers. In some cases we have
independent assessments of the same or similar activities. In particular, the mother-reported
motor skills at age 42 months have an independently assessed counterpart: one made in a clinic,
but at the later age of 7. The assessment of behaviour by the mother at age 81 months has an
independent counterpart in an assessment – using exactly the same questionnaire – by the child’s
teacher when the child was 8 years old. By comparing the non-maternal assessments with those
of the mother, we are able to establish whether our results might be affected by maternal bias.
For the motor skills we find no indication of maternal bias. The performance differential is larger
for mixed-handed children. For left-handed children the differential is larger for the test of gross
motor skills than for the tests of fine motor skills. These findings are consistent with our results
using mother-reported motor skills27, 28. For the behavioural outcomes we find some indication of
maternal bias. Using the teacher-reported total behaviour score we estimate that – controlling for
our full set of variables – mixed-handed children score 0.64 (s.e. = 0.56) points below right-
handed children, whereas using the mother-reported score we find a larger and statistically
27 Using the results from two tests of fine motor skills as outcome variables in regressions including the full set of controls, we find that left- and mixed-handers perform worse than right-handers. One test, known as “placing pegs”, required the child to insert twelve pegs, one at a time, into a peg board, holding the board with one hand and inserting the pegs with the other. This test was repeated using the non-preferred hand, in which left- and mixed-handed children performed better than their right-handed counterparts. In the other test, known as “threading lace”, children had to thread a lace through holes in a wooden board, using only one hand while holding the board with the other hand. The time taken to complete these tasks indicates the skill level. In our regressions we use test results standardised to have a mean of 100 and a standard deviation of 10. The estimated coefficients are: placing pegs with preferred hand: left = 0.77 (s.e. = 0.42), mixed = 1.04 (s.e. = 0.54); placing pegs with non-preferred hand: left = -1.54 (s.e. = 0.39), mixed = -2.08 (s.e. = 0.46); threading lace: left = 0.92 (s.e. = 0.49), mixed = 1.05 (s.e. = 0.56). 28 Controlling for the full range of controls, we also find that left- and mixed-handed children perform worse on a test of gross motor skills. This test involved the child attempting to throw a bean bag underarm into a box whilst standing behind a line at a distance of six feet from the box. The number of successful throws out of ten was scored. Using the standardised test result (mean = 100, s.d. = 10), we estimate the following coefficients: left = -1.32 (s.e. = 0.42), mixed = -1.41 (s.e. = 0.49).

24
significant performance differential of -1.53 (s.e. = 0.53)29. One reason for the insignificant
estimate of the effect of mixed-handedness on teacher-assessed behaviour might be the smaller
sample size (n = 4628). On the other hand, mothers’ reports might be biased. For instance, if
mixed-handedness really caused developmental delays, mothers of mixed-handed children might
be more stressed and consequently rate them more difficult than they objectively are. Teachers,
however, may have their own biases, making their assessment another subjective – but
independent – assessment of the same underlying behaviour.
Missing data
The nature of the data means that observations may have missing data on some of the controls,
as information is collected at different ages and from a variety of sources. To deal with this in the
analyses above we include an additional dummy variable indicating missingness and replace
missing observations with the mean value if the variable is continuous. To test the robustness of
our results to this imputation method, we re-ran all analyses excluding observations with missing
controls. This resulted in sample sizes which were considerably smaller than those reported in
Table 2 (samples are mainly between 4,000 and 6,000). Table A4 shows our results for mixed-
handedness are not affected by our imputation of missing values, but the estimates for left-
handedness indicate that there is no deficit attached to being left-handed in this smaller sample.
5. Conclusions
This paper has examined whether there are developmental deficits associated with not being
right-handed in a sample of contemporary children. These are children for whom left-handedness
is not a social stigma. Theories of handedness suggest that non-right-handedness may indicate
damage to the brain during very early life, whilst a minority of left-handers may have brain
advantages that have positive pay-offs later in life.
We examine a range of outcomes measured between the ages of 42 months and 14 years and
employ a rich set of controls, allowing us to control for causes or correlates of left- or mixed-
handedness that also independently might cause worse outcomes. Specifically, we include
standard socio-economic status and parenting behaviour controls, which may both result in
classification of a child by the mother as mixed-handed and be a marker for lower stimulation in
29 For the teacher-reported pro-social behaviour sub-score the coefficient on mixed is insignificant and positive (0.27, s.e. = 0.56, n = 4664), as opposed to the significantly negative coefficient estimated using mother-reported pro-social behaviour.

25
the early learning environment, plus controls for heritability of handedness and brain damage in
early life. We find that while there is some penalty to being left-handed, particularly for girls, the
main penalty is to children who do not have a dominant hand early in life. This latter group have
lower development which first appears in the early years but remains present at age 14,
particularly for girls. The size of the penalty is not large, but on average it is about half the size
of the penalty in early development associated with being male. While our finding of a negative
effect associated with not having a dominant hand by 42 months does not suggest that mixed-
handedness causes lower test scores, our results are robust to controlling for reporting error on
the part of parents that may itself be associated with lower inputs. We also examine value added,
which controls for unobserved attributes of children and families. We find mixed-handed
children make less progress. Therefore, our results suggest that mixed-handedness may be a
marker of some difference in brain structure and functionality, resulting in poorer outcomes on a
number of dimensions of development. Whatever the exact route, the poorer performance
observed in mixed-handed children before they enter school appears to persist out to age 14.
Our finding of negative effects for being a left-handed boy at school entry age echoes the work
of Johnston et al. (2007) on a smaller sample of Australian children of the same age. But in
contrast to this work, we are able to follow children into later childhood, where we find that by
ages 11 and 14, at which we look at cognitive outcomes only, the penalty to being left-handed
for boys has disappeared. It still remains for girls, for whom there is no sign of catch-up, and is
primarily focused at the lower part of the ability distribution. Given the association found in
other studies of cognitive performance in mid-childhood and later labour market outcomes
(Heckman et al. 2006, Blanden et al.2007), our findings might provide a possible answer to the
paradox that at early ages left-handed boys suffer, whilst in terms of earnings as adults, they do
better than their right-handed counterparts. However, for girls the deficits persist into adulthood.
Our research suggests that the differences across genders emerge by mid-childhood.
Finally, our results suggest that schools could use mixed-handedness as a marker for children
who are likely to need greater intervention (see also Sattler 2001). As tests for mixed-handedness
are simple to administer, they would be a cheap way of identifying children who otherwise might
slip behind their peers.

26
References
Aughinbaugh, A., and M. Gittleman. 2003. "Does Money Matter? A Comparison of the Effect of
Income on Child Development in the United States and Great Britain." Journal of Human
Resources 38: 416-440.
Bakan, Paul. 1971. “Handedness and Birth Order.” Nature 299 (January 15): 195
Beaton, Alan A. 2003. “The Nature and Determinants of Handedness.” in Kenneth Hugdahl and
Richard J. Davidson (Eds.). The Asymmetrical Brain. Cambridge, MA: MIT Press.
Benbow, Camilla Persson. 1986. “Physiological Correlates of Extreme Intellectual Precocity.”
Neuropsychologia 24 (5): 719-725.
Bishop, Dorothy V. M. 1990. “How to increase your chances of obtaining a significant
association between handedness and disorder.” Journal of Clinical and Experimental
Neuropsychology 12 (5): 812-816.
Blanden, Jo, Paul Gregg and Lindsey Macmillan. 2007. Accounting for Intergenerational Income
Persistence: Non-cognitive Skills, Ability and Education. Economic Journal 117
(March): C43-60.
Carneiro, Pedro and James J. Heckman. 2004. “Human Capital Policy.” In Benjamin M.
Friedman (Ed.) Inequality in America: What Role for Human Capital Policies?
Cambridge, M.A.: MIT Press.
Dearing, E., K. McCartney, K. and B. A. Taylor. 2001. "Change in Family Income-to-Needs
Matters More for Children with Less." Child Development 72: 1779-1793.
Denny, Kevin and Vincent O’ Sullivan. 2007. “The Economic Consequences of Being Left-
Handed – Some Sinister Results.” The Journal of Human Resources 42 (2): 354-374.
Fenson, Larry, Philip S. Dale, J. Steven Reznik et al. 1991. Technical Manual for the MacArthur
Communicative Development Inventories. San Diego, California: Developmental
Psychology Laboratory.
Frankenburg W. K. and Dodds J. B. 1967. “The Denver Developmental Screening Test.” Journal
of Pediatrics 71 (2): 181-191.
Geschwind, Norman and Albert M. Galaburda. 1987. Cerebral Lateralization: Biological
Mechanisms, Associations, and Pathology. Cambridge, MA: MIT Press.
Glover, Vivette, Thomas G. O’Connor, Jonathan Heron, Jean Golding, the ALSPAC Study team.
2004. “Antenatal maternal anxiety is linked with atypical handedness in the child.” Early
Human Development 79: 107-118.
27
Goodman, Robert. 1997. “The strengths & difficulties questionnaire: A research note.” Journal
of Child Psychology and Psychiatry 38: 581-586.
Goodman, R., D. Renfrew and M. Mullick. 2000. “Predicting type of psychiatric disorder from
Strengths and Difficulties Questionnaire (SDQ) scores in child mental health clinics in
London and Dhaka.” European Child and Adolescent Psychiatry 9: 129-134.
Guo, G. and K. M. Harris. 2000. "The Mechanisms Mediating the Effects of Poverty on
Children's Intellectual Development." Demography 37: 431-447.
Gutteling, Barbara M., Carolina De Weerth and Jan K. Buitelaar. 2007. “Prenatal Stress and
Mixed-Handedness.” Pediatric Research 62 (5): 586-590.
Heckman, James J., Jora. Stixrud and Sergio Urzua. 2006. ‘The Effects of Cognitive and Noncognitive Abilities on Labor Market Outcomes and Social Behavior’, NBER Working Paper No. 12006.
Johnston, David W., Manisha Shah and Michael A. Shields. 2007. “Handedness, Time Use and
Early Childhood Development.” IZA Discussion Paper No. 2752.
Klebanov, P. K., J. Brooks-Gunn, C. McCarton and M. C. McCormick. 1998. "The Contribution
of Neighborhood and Family Income to Developmental Test Scores over the First Three
Years of Life." Child Development 69: 1420-1436.
Obel, Carsten, Morten Hedegaard, Tine Brink Henriksen, Niels Jorgen Secheer and Jorn Olsen.
2003. “Psychological factors in pregnancy and mixed-handedness in the offspring.”
Developmental Medicine & Child Neurology 45: 557-561.
Perelle, Ira B. and Lee Ehrman. 1982. “What is a lefthander?” Experientia 38: 1256-1258.
Perelle, Ira B. and Lee Ehrman. 2005. “On the Other Hand.” Behavior Genetics, 35 (3): 343-350.
Pipe, Margaret-Ellen. 1988. “Atypical Laterality and Retardation.” Psychological Bulletin 104
(3): 343-347.
Pujol, Jesus, Joan Deus, Joseph M. Losilla and Antoni Capdevila. 1999. “Cerebral lateralization
of language in normal left-handed people studied by functional MRI.” Neurology 52:
1038-1043.
Ruebeck, Christopher S., Joseph E. Harrington and Robert Moffitt. 2007. “Handedness and
earnings.” Laterality. 12 (2): 101-120.
Sattler, Johanna Barbara. 1993. “Beidhänder sind hirngeschädigt.” Münchener Medizinische
Wochenschrift 21 (May 28): 35-40. English translation available at:
http://www.linkshaender-beratung.de/english/Ambidextrous.htm.
Sattler, Johanna Barbara. 2001. “Linkshändige und umgeschulte linkshändige Kinder und
Jugendliche.” Kinder- und Jugendarzt 32 (2): 139-147. English summary available at:
http://www.linkshaender-beratung.de/english/doctor.htm.

28
Searleman, Alan, Clare Porac and Stanley Coren. 1989. “Relationship between Birth Order,
Birth Stress, and Lateral Preferences: A Critical Review.” Psychological Bulletin 105 (3):
397-408.
Taylor, B. A., E. Dearing and K. McCartney. 2004. "Incomes and Outcomes in Early
Childhood." Journal of Human Resources 39: 980-1007.
Wechsler, David, Susan Golombok, and John Rust. 1992. WISC-III UK Wechsler Intelligence
Scale for Children – Third UK Edition UK Manual. Sidcup, UK: The Psychological
Corporation.
Yeung, W. J., M. R. Linver and J. Brooks-Gunn. 2002. "How Money Matters for Young
Children's Development: Parental Investment and Family Processes." Child Development
73: 1861-1879.

29
Table 1: Multinomial logit model of handedness
Left-handed
Mixed-handed Female -0.46*** (0.07) -0.64*** (0.08)
Heritability
Mother left-handed 0.80*** (0.11) 0.30** (0.14) Mother mixed-hand. 0.59*** (0.16) 0.48*** (0.18) Mother’s handedness missing 0.66** (0.27) -0.39* (0.23) Father left-handed 0.31*** (0.11) 0.09 (0.13) Father mixed-handed -0.40* (0.22) 0.21 (0.20) Father’s handedness missing -0.28 (0.25) 0.45** (0.20)
Insults to child’s brain
1st pregnancy -0.05 (0.08) 0.11 (0.09) 4th+ pregnancy -0.18 (0.11) 0.26** (0.12) #pregnancies missing 0.04 (0.24) 0.15 (0.26) Caesarean section w/o labour -0.05 (0.17) -0.23 (0.21) Caesarean section with labour 0.34** (0.17) 0.35* (0.19) Caesarean, type unknown -0.16 (0.25) 0.17 (0.25) Caesarean missing 0.11 (0.15) -0.13 (0.18) Birth weight/gestation -0.01** (0.00) -0.01*** (0.00) Birth weight/gestation missing 0.29 (0.28) -0.29 (0.40) CCEI at 18 weeks gestation 0.01*** (0.00) 0.01** (0.01) CCEI missing -0.03 (0.11) 0.22* (0.12) Fall/drop 6-15 months 0.01 (0.08) 0.10 (0.09) Fall/drop missing 0.01 (0.15) 0.11 (0.17)
Parenting
Parenting 24 months 0.03* (0.01) -0.04** (0.02) Parenting missing 0.09 (0.12) -0.20 (0.15)
Socio-economic status (SES)
Father’s occup.: managerial 0.01 (0.13) -0.21 (0.15) Father’s occup.: skilled non-manual 0.05 (0.15) -0.10 (0.18) Father’s occup.: skilled manual 0.08 (0.14) -0.01 (0.16) Father’s occup.: semi-skilled manual -0.03 (0.17) -0.21 (0.20) Father’s occup.: unskilled manual 0.21 (0.23) -0.35 (0.30) Father’s occupational class missing -0.04 (0.19) -0.10 (0.21) Mother’s age -0.00 (0.01) -0.02** (0.01) Mother’s age missing 1.29 (0.90) -30.19 (4.7 x 10⁶)Mother has O-level -0.05 (0.10) -0.03 (0.11) Mother has A-level -0.26** (0.12) -0.12 (0.13) Mother has degree -0.09 (0.14) -0.16 (0.17) Mother’s education missing -0.36 (0.43) -0.07 (0.39) Housing tenure: rented -0.13 (0.16) -0.00 (0.17) Housing tenure: council 0.11 (0.13) 0.24* (0.13) Housing tenure: other 0.12 (0.24) 0.15 (0.27) Housing tenure missing -0.16 (0.14) 0.10 (0.16) Ln(income) 0.02 (0.09) -0.06 (0.10) Income missing -0.01 (0.14) 0.20 (0.15) #siblings at 47 months 0.04 (0.04) -0.05 (0.05) #siblings missing -0.01 (0.13) -0.14 (0.15) Non-white -0.11 (0.18) -0.78*** (0.26) Ethnicity missing -0.18 (0.20) 0.11 (0.20) Observations 9980 9980 Pseudo R-squared 0.0283 F-test: SES variables = 0 19.99 40.00 Prob > F 0.584 0.0108 Standard errors in brackets. * significant at 10%; ** significant at 5%; *** significant at 1% CCEI = Crown Crisp Experiential Index (indicator of maternal psychopathology)

30
Table 2: Estimates of the association between handedness and cognitive ability, motor skills and behavioural outcomes Entry
assess., age 5
Key Stage 1, age 7
Key Stage 2, age 11
Key Stage 3, age 14
WISC (IQ), age 8
Language score at 38 months
Social develop. score at 42 months
Fine motor score at 42 months
Gross motor score at 42 months
Total behaviour score at 81 months
Pro-social behaviour sub-score at 81 months
I. Controlling only for gender Left -0.63 -0.73** -1.22*** -1.38*** -1.05** -0.42 -0.41 -0.52 -0.62* -0.59 0.31 (0.40) (0.35) (0.36) (0.38) (0.46) (0.37) (0.33) (0.32) (0.35) (0.42) (0.37) Mixed -2.92*** -1.46*** -2.01*** -2.09*** -2.06*** -1.66*** -2.42*** -3.30*** -1.99*** -2.19*** -1.05** (0.48) (0.44) (0.45) (0.47) (0.54) (0.49) (0.44) (0.42) (0.45) (0.53) (0.47) Adjusted R-squared 0.03 0.02 0.00 0.01 0.00 0.02 0.08 0.07 0.01 0.01 0.03
II. Controls for sex and socio-economic status Left -0.31 -0.46 -0.83** -0.94*** -0.77* -0.37 -0.40 -0.41 -0.66* -0.49 0.30 (0.37) (0.33) (0.33) (0.33) (0.43) (0.36) (0.33) (0.31) (0.35) (0.42) (0.37) Mixed -2.37*** -0.72* -1.24*** -1.24*** -1.37*** -1.53*** -2.44*** -3.15*** -2.04*** -1.84*** -1.13** (0.44) (0.40) (0.41) (0.40) (0.49) (0.49) (0.44) (0.42) (0.45) (0.53) (0.47) Adjusted R-squared 0.17 0.17 0.21 0.25 0.17 0.04 0.09 0.09 0.01 0.04 0.03
III. Controls for sex, socio-economic status and parenting Left -0.36 -0.48 -0.86*** -0.97*** -0.85** -0.46 -0.50 -0.52* -0.75** -0.52 0.25 (0.37) (0.32) (0.33) (0.33) (0.43) (0.36) (0.32) (0.31) (0.34) (0.42) (0.36) Mixed -2.30*** -0.69* -1.18*** -1.21*** -1.27*** -1.32*** -2.28*** -2.98*** -1.91*** -1.74*** -1.03** (0.44) (0.40) (0.41) (0.40) (0.49) (0.49) (0.44) (0.41) (0.45) (0.53) (0.47) Adjusted R-squared 0.18 0.18 0.21 0.26 0.18 0.08 0.11 0.12 0.03 0.04 0.05
IV. Controls for sex, socio-economic status, parenting and insults to child’s brain Left -0.28 -0.41 -0.80** -0.87*** -0.80* -0.42 -0.45 -0.46 -0.69** -0.37 0.29 (0.37) (0.32) (0.32) (0.33) (0.42) (0.36) (0.32) (0.31) (0.34) (0.41) (0.36) Mixed -2.22*** -0.60 -1.09*** -1.12*** -1.22** -1.27*** -2.22*** -2.93*** -1.86*** -1.58*** -0.95** (0.44) (0.40) (0.41) (0.41) (0.49) (0.48) (0.44) (0.41) (0.45) (0.53) (0.47) Adjusted R-squared 0.18 0.19 0.22 0.27 0.19 0.08 0.12 0.13 0.03 0.09 0.05
V. Controls for sex, socio-economic status, parenting, insults to child’s brain and heritability Left -0.23 -0.34 -0.78** -0.84*** -0.81* -0.40 -0.45 -0.42 -0.64* -0.36 0.27 (0.37) (0.32) (0.32) (0.33) (0.43) (0.35) (0.32) (0.31) (0.35) (0.42) (0.37) Mixed -2.19*** -0.56 -1.07*** -1.07*** -1.24** -1.25*** -2.22*** -2.91*** -1.87*** -1.53*** -0.96** (0.44) (0.40) (0.41) (0.40) (0.49) (0.48) (0.44) (0.41) (0.45) (0.53) (0.47) Adjusted R-squared 0.19 0.19 0.22 0.27 0.19 0.08 0.12 0.13 0.03 0.09 0.05 Observations 6822 8812 8405 7735 5776 9038 9965 9970 9979 6868 7690 Robust standard errors in brackets. * significant at 10%; ** significant at 5%; *** significant at 1%. WISC = Wechsler Intelligence Scale for Children.

31
Table 3a: Estimates of the association between handedness and child outcomes for boys Entry
assess., age 5
Key Stage 1, age 7
Key Stage 2, age 11
Key Stage 3, age 14
WISC (IQ), age 8
Language score at 38 months
Social develop. score at 42 months
Fine motor score at 42 months
Gross motor score at 42 months
Total behaviour score at 81 months
Pro-social behaviour sub-score at 81 months
I. No controls Left -1.33** -0.48 -0.96** -1.15** -1.26** -0.84 -0.75* -0.69 -0.68 -0.41 -0.15 (0.53) (0.47) (0.49) (0.51) (0.63) (0.52) (0.45) (0.44) (0.45) (0.55) (0.51) Mixed -2.57*** -0.35 -1.22** -1.26** -1.47** -2.13*** -2.73*** -3.56*** -1.80*** -2.15*** -1.64*** (0.57) (0.55) (0.56) (0.59) (0.69) (0.66) (0.58) (0.54) (0.54) (0.69) (0.63) Adjusted R-squared 0.01 -0.00 0.00 0.00 0.00 0.00 0.01 0.01 0.00 0.00 0.00
II. Controls for socio-economic status Left -0.99** -0.24 -0.61 -0.66 -0.82 -0.78 -0.81* -0.63 -0.75* -0.24 -0.18 (0.50) (0.44) (0.45) (0.45) (0.59) (0.52) (0.45) (0.44) (0.45) (0.55) (0.51) Mixed -2.19*** 0.06 -0.82 -0.88* -1.03 -2.17*** -2.88*** -3.61*** -1.91*** -1.86*** -1.77*** (0.54) (0.51) (0.52) (0.52) (0.64) (0.67) (0.58) (0.55) (0.54) (0.69) (0.62) Adjusted R-squared 0.13 0.15 0.20 0.24 0.16 0.02 0.02 0.02 0.01 0.02 0.01
III. Controls for socio-economic status and parenting Left -1.03** -0.25 -0.64 -0.69 -0.94 -0.86* -0.92** -0.74* -0.82* -0.27 -0.24 (0.50) (0.44) (0.45) (0.44) (0.59) (0.51) (0.45) (0.43) (0.44) (0.55) (0.51) Mixed -2.06*** 0.14 -0.72 -0.83 -0.90 -1.84*** -2.56*** -3.31*** -1.71*** -1.75** -1.60*** (0.54) (0.51) (0.52) (0.52) (0.64) (0.66) (0.56) (0.54) (0.54) (0.69) (0.62) Adjusted R-squared 0.14 0.16 0.21 0.25 0.17 0.06 0.06 0.06 0.03 0.02 0.02
IV. Controls for socio-economic status, parenting and insults to child’s brain Left -0.93* -0.18 -0.59 -0.59 -0.91 -0.83 -0.82* -0.67 -0.77* -0.04 -0.18 (0.49) (0.44) (0.45) (0.44) (0.59) (0.52) (0.45) (0.43) (0.44) (0.54) (0.51) Mixed -2.00*** 0.16 -0.68 -0.79 -0.86 -1.83*** -2.51*** -3.30*** -1.70*** -1.69** -1.57** (0.54) (0.51) (0.52) (0.52) (0.65) (0.66) (0.56) (0.54) (0.54) (0.68) (0.62) Adjusted R-squared 0.15 0.16 0.21 0.25 0.17 0.06 0.06 0.07 0.03 0.07 0.02
V. Controls for socio-economic status, parenting, insults to child’s brain and heritability Left -0.85* -0.05 -0.55 -0.56 -0.92 -0.79 -0.81* -0.67 -0.71 -0.02 -0.21 (0.49) (0.44) (0.44) (0.44) (0.59) (0.51) (0.45) (0.43) (0.45) (0.55) (0.51) Mixed -1.96*** 0.24 -0.64 -0.77 -0.89 -1.78*** -2.51*** -3.25*** -1.70*** -1.57** -1.57** (0.54) (0.51) (0.52) (0.53) (0.65) (0.66) (0.57) (0.54) (0.54) (0.68) (0.62) Adjusted R-squared 0.15 0.17 0.21 0.25 0.17 0.06 0.06 0.07 0.03 0.07 0.02 Observations 3542 4518 4284 3948 2899 4640 5154 5157 5166 3506 3936 Robust standard errors in brackets. * significant at 10%; ** significant at 5%; *** significant at 1%. WISC = Wechsler Intelligence Scale for Children.

32
Table 3b: Estimates of the association between handedness and child outcomes for girls Entry
assess., age 5
Key Stage 1, age 7
Key Stage 2, age 11
Key Stage 3, age 14
WISC (IQ), age 8
Language score at 38 months
Social develop. score at 42 months
Fine motor score at 42 months
Gross motor score at 42 months
Total behaviour score at 81 months
Pro-social behaviour sub-score at 81 months
I. No controls Left 0.44 -1.03* -1.55*** -1.66*** -0.72 0.16 0.08 -0.28 -0.54 -0.85 0.93* (0.60) (0.53) (0.54) (0.57) (0.69) (0.48) (0.46) (0.45) (0.55) (0.67) (0.52) Mixed -3.62*** -3.34*** -3.36*** -3.49*** -3.05*** -0.90 -1.93*** -2.86*** -2.32*** -2.24*** -0.09 (0.86) (0.70) (0.76) (0.76) (0.87) (0.70) (0.68) (0.63) (0.82) (0.83) (0.70) Adjusted R-squared 0.01 0.01 0.01 0.01 0.00 0.00 0.00 0.01 0.00 0.00 0.00
II. Controls for socio-economic status Left 0.66 -0.74 -1.11** -1.32*** -0.79 0.15 0.08 -0.17 -0.58 -0.83 0.89* (0.56) (0.48) (0.48) (0.49) (0.61) (0.48) (0.45) (0.44) (0.55) (0.65) (0.52) Mixed -2.72*** -2.05*** -2.00*** -1.85*** -1.94*** -0.52 -1.71** -2.36*** -2.31*** -1.61* 0.03 (0.75) (0.63) (0.66) (0.65) (0.75) (0.69) (0.68) (0.63) (0.81) (0.84) (0.71) Adjusted R-squared 0.16 0.17 0.21 0.26 0.19 0.03 0.01 0.04 0.00 0.05 0.00
III. Controls for socio-economic status and parenting Left 0.59 -0.75 -1.14** -1.34*** -0.83 0.06 0.02 -0.26 -0.67 -0.86 0.85* (0.56) (0.48) (0.48) (0.49) (0.61) (0.46) (0.45) (0.43) (0.55) (0.65) (0.52) Mixed -2.75*** -2.05*** -1.98*** -1.86*** -1.91** -0.49 -1.70** -2.35*** -2.30*** -1.56* 0.01 (0.75) (0.63) (0.66) (0.65) (0.75) (0.69) (0.69) (0.63) (0.81) (0.85) (0.70) Adjusted R-squared 0.17 0.17 0.22 0.27 0.20 0.07 0.03 0.06 0.02 0.05 0.01
IV. Controls for socio-economic status, parenting and insults to child’s brain Left 0.61 -0.73 -1.17** -1.33*** -0.69 0.14 0.03 -0.20 -0.59 -0.81 0.91* (0.55) (0.48) (0.47) (0.49) (0.61) (0.46) (0.45) (0.43) (0.55) (0.63) (0.51) Mixed -2.57*** -1.81*** -1.82*** -1.62** -1.83** -0.30 -1.65** -2.21*** -2.16*** -1.28 0.15 (0.73) (0.62) (0.66) (0.63) (0.74) (0.66) (0.68) (0.62) (0.80) (0.84) (0.70) Adjusted R-squared 0.18 0.19 0.23 0.28 0.20 0.07 0.03 0.07 0.02 0.10 0.02
V. Controls for socio-economic status, parenting, insults to child’s brain and heritability Left 0.61 -0.71 -1.17** -1.34*** -0.73 0.15 0.04 -0.16 -0.57 -0.79 0.90* (0.55) (0.48) (0.47) (0.49) (0.61) (0.46) (0.45) (0.43) (0.55) (0.63) (0.51) Mixed -2.57*** -1.84*** -1.83*** -1.62** -1.86** -0.30 -1.64** -2.18*** -2.14*** -1.26 0.16 (0.73) (0.62) (0.66) (0.63) (0.73) (0.67) (0.68) (0.62) (0.80) (0.84) (0.70) Adjusted R-squared 0.18 0.19 0.23 0.28 0.21 0.07 0.03 0.07 0.02 0.10 0.02 Observations 3280 4294 4121 3787 2877 4398 4811 4813 4813 3362 3754 Robust standard errors in brackets. * significant at 10%; ** significant at 5%; *** significant at 1%. WISC = Wechsler Intelligence Scale for Children.
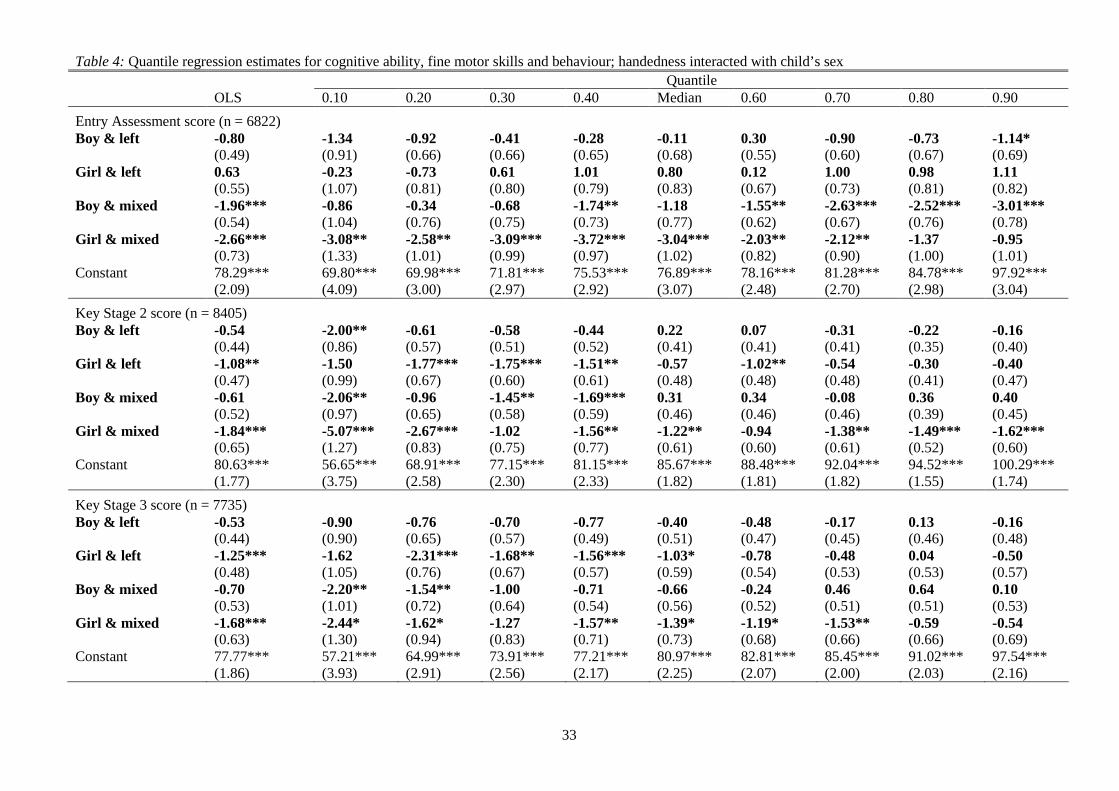
33
Table 4: Quantile regression estimates for cognitive ability, fine motor skills and behaviour; handedness interacted with child’s sex Quantile OLS 0.10 0.20 0.30 0.40 Median 0.60 0.70 0.80 0.90
Entry Assessment score (n = 6822) Boy & left -0.80 -1.34 -0.92 -0.41 -0.28 -0.11 0.30 -0.90 -0.73 -1.14* (0.49) (0.91) (0.66) (0.66) (0.65) (0.68) (0.55) (0.60) (0.67) (0.69) Girl & left 0.63 -0.23 -0.73 0.61 1.01 0.80 0.12 1.00 0.98 1.11 (0.55) (1.07) (0.81) (0.80) (0.79) (0.83) (0.67) (0.73) (0.81) (0.82) Boy & mixed -1.96*** -0.86 -0.34 -0.68 -1.74** -1.18 -1.55** -2.63*** -2.52*** -3.01*** (0.54) (1.04) (0.76) (0.75) (0.73) (0.77) (0.62) (0.67) (0.76) (0.78) Girl & mixed -2.66*** -3.08** -2.58** -3.09*** -3.72*** -3.04*** -2.03** -2.12** -1.37 -0.95 (0.73) (1.33) (1.01) (0.99) (0.97) (1.02) (0.82) (0.90) (1.00) (1.01) Constant 78.29*** 69.80*** 69.98*** 71.81*** 75.53*** 76.89*** 78.16*** 81.28*** 84.78*** 97.92*** (2.09) (4.09) (3.00) (2.97) (2.92) (3.07) (2.48) (2.70) (2.98) (3.04)
Key Stage 2 score (n = 8405) Boy & left -0.54 -2.00** -0.61 -0.58 -0.44 0.22 0.07 -0.31 -0.22 -0.16 (0.44) (0.86) (0.57) (0.51) (0.52) (0.41) (0.41) (0.41) (0.35) (0.40) Girl & left -1.08** -1.50 -1.77*** -1.75*** -1.51** -0.57 -1.02** -0.54 -0.30 -0.40 (0.47) (0.99) (0.67) (0.60) (0.61) (0.48) (0.48) (0.48) (0.41) (0.47) Boy & mixed -0.61 -2.06** -0.96 -1.45** -1.69*** 0.31 0.34 -0.08 0.36 0.40 (0.52) (0.97) (0.65) (0.58) (0.59) (0.46) (0.46) (0.46) (0.39) (0.45) Girl & mixed -1.84*** -5.07*** -2.67*** -1.02 -1.56** -1.22** -0.94 -1.38** -1.49*** -1.62*** (0.65) (1.27) (0.83) (0.75) (0.77) (0.61) (0.60) (0.61) (0.52) (0.60) Constant 80.63*** 56.65*** 68.91*** 77.15*** 81.15*** 85.67*** 88.48*** 92.04*** 94.52*** 100.29*** (1.77) (3.75) (2.58) (2.30) (2.33) (1.82) (1.81) (1.82) (1.55) (1.74)
Key Stage 3 score (n = 7735) Boy & left -0.53 -0.90 -0.76 -0.70 -0.77 -0.40 -0.48 -0.17 0.13 -0.16 (0.44) (0.90) (0.65) (0.57) (0.49) (0.51) (0.47) (0.45) (0.46) (0.48) Girl & left -1.25*** -1.62 -2.31*** -1.68** -1.56*** -1.03* -0.78 -0.48 0.04 -0.50 (0.48) (1.05) (0.76) (0.67) (0.57) (0.59) (0.54) (0.53) (0.53) (0.57) Boy & mixed -0.70 -2.20** -1.54** -1.00 -0.71 -0.66 -0.24 0.46 0.64 0.10 (0.53) (1.01) (0.72) (0.64) (0.54) (0.56) (0.52) (0.51) (0.51) (0.53) Girl & mixed -1.68*** -2.44* -1.62* -1.27 -1.57** -1.39* -1.19* -1.53** -0.59 -0.54 (0.63) (1.30) (0.94) (0.83) (0.71) (0.73) (0.68) (0.66) (0.66) (0.69) Constant 77.77*** 57.21*** 64.99*** 73.91*** 77.21*** 80.97*** 82.81*** 85.45*** 91.02*** 97.54*** (1.86) (3.93) (2.91) (2.56) (2.17) (2.25) (2.07) (2.00) (2.03) (2.16)

34
WISC score at F@8 (n = 5776) Boy & left -0.87 -2.19** -2.11*** -1.73** -1.20* -0.65 0.20 0.55 -0.29 1.36* (0.59) (0.99) (0.70) (0.76) (0.65) (0.64) (0.60) (0.64) (0.69) (0.73) Girl & left -0.72 -1.89 -1.21 -0.09 -0.29 -0.37 -0.27 -0.04 0.15 -0.04 (0.61) (1.17) (0.82) (0.89) (0.76) (0.75) (0.71) (0.76) (0.81) (0.84) Boy & mixed -0.88 -1.41 -1.55* -1.62* -1.60** -1.14 -0.83 0.13 -0.41 -0.41 (0.65) (1.19) (0.83) (0.91) (0.78) (0.76) (0.72) (0.77) (0.83) (0.87) Girl & mixed -1.84** -1.96 -2.89*** -2.52** -1.05 -0.66 -1.09 -1.41 -0.83 -2.61** (0.73) (1.44) (1.06) (1.16) (0.99) (0.97) (0.92) (0.99) (1.03) (1.12) Constant 78.91*** 68.48*** 68.91*** 73.17*** 75.04*** 77.22*** 80.08*** 82.93*** 88.13*** 91.99*** (2.35) (4.55) (3.16) (3.46) (2.98) (2.92) (2.74) (2.95) (3.11) (3.21)
Fine motor score at 42 months (n = 9970) Boy & left -0.60 -2.24*** -1.14 -0.92* -0.64 -0.35 0.11 -0.32 -0.40 0.00 (0.43) (0.81) (0.71) (0.55) (0.52) (0.45) (0.39) (0.30) (0.25) (0.00) Girl & left -0.19 0.64 0.62 -0.38 -0.55 -0.40 -0.62 -0.31 -0.06 -0.00 (0.43) (0.97) (0.85) (0.66) (0.63) (0.54) (0.46) (0.36) (0.30) (0.00) Boy & mixed -3.24*** -6.27*** -4.75*** -4.21*** -3.74*** -3.17*** -2.45*** -2.50*** -1.89*** -2.46*** (0.54) (0.91) (0.80) (0.62) (0.59) (0.50) (0.43) (0.34) (0.29) (0.00) Girl & mixed -2.34*** -3.17*** -3.71*** -3.07*** -2.63*** -2.17*** -1.77*** -1.23*** -1.04*** 0.00 (0.62) (1.19) (1.04) (0.82) (0.77) (0.66) (0.57) (0.45) (0.38) (0.00) Constant 82.76*** 63.43*** 70.05*** 75.04*** 76.71*** 81.38*** 86.19*** 91.05*** 98.57*** 110.55*** (1.81) (3.57) (3.11) (2.45) (2.32) (1.99) (1.71) (1.33) (1.10) (0.00)
Total behavioural score at 81 months (n = 6868) Boy & left -0.07 -0.46 -1.09 -0.52 -0.37 0.26 0.02 0.69 0.62 0.09 (0.55) (1.11) (0.82) (0.75) (0.66) (0.50) (0.53) (0.47) (0.51) (0.41) Girl & left -0.79 -3.17** -2.08** -0.71 -0.06 0.31 -0.03 0.48 0.38 0.94* (0.64) (1.30) (0.98) (0.89) (0.78) (0.60) (0.63) (0.56) (0.61) (0.49) Boy & mixed -1.63** -3.88*** -3.35*** -1.84** -1.98*** -0.89 -0.75 -0.81 -1.02* -0.41 (0.68) (1.26) (0.95) (0.86) (0.75) (0.58) (0.61) (0.54) (0.59) (0.48) Girl & mixed -1.32 -6.14*** -2.34* -0.70 -0.38 -0.98 -1.15 -0.86 -0.24 1.24** (0.83) (1.58) (1.22) (1.11) (0.96) (0.74) (0.78) (0.69) (0.75) (0.60) Constant -113.50*** -138.32*** -129.26*** -120.16*** -112.93*** -107.88*** -104.57*** -103.65*** -101.53*** -96.50*** (2.35) (5.06) (3.75) (3.38) (2.93) (2.25) (2.38) (2.09) (2.24) (1.82) Robust standard errors in brackets. * significant at 10%; ** significant at 5%; *** significant at 1%. WISC = Wechsler Intelligence Scale for Children. Controls are gender, socio-economic status, heritability, insults to child’s brain and parenting.

35
Table 5: Estimates of the association between handedness and Key Stage 2 and 3 results, controlling for prior attainment Key Stage 2, age 11 Key Stage 3, age 14 Boy & left -0.40 (0.31) -0.03 (0.27) Girl & left -0.65** (0.33) -0.62** (0.28) Boy & mixed -0.76** (0.36) 0.21 (0.33) Girl & mixed -0.87* (0.47) -0.15 (0.39) Key Stage 1 score 0.70*** (0.01) KS1 score missing 0.39 (0.66) Key Stage 2 score 0.76*** (0.01) KS2 score missing -8.75*** (0.83) Observations Adjusted R-squared
8405 0.60
7735 0.73
Robust standard errors in brackets. * significant at 10%; ** significant at 5%; *** significant at 1%. Controls are gender, socio-economic status, heritability, insults to child’s brain and parenting.

36
Table 6: Estimates of the association between handedness and child outcomes using the individual components of handedness measure to define handedness Entry
assess., age 5
Key Stage 1, age 7
Key Stage 2, age 11
Key Stage 3, age 14
WISC (IQ), age 8
Language score at 38 months
Social develop. score at 42 months
Fine motor score at 42 months
Gross motor score at 42 months
Total behaviour score at 81 months
Pro-social behaviour sub-score at 81 months
A. Drawing Left -0.54 -0.46 -0.98*** -1.14*** -1.07*** -0.66* -0.81** -0.82*** -0.76** -0.60 0.22 (0.36) (0.32) (0.32) (0.32) (0.41) (0.35) (0.32) (0.31) (0.34) (0.40) (0.36) Mixed -1.68*** -0.80** -0.87*** -0.89*** -0.43 -1.09*** -2.08*** -2.35*** -1.60*** -1.23*** -0.52 (0.37) (0.33) (0.33) (0.33) (0.41) (0.39) (0.35) (0.32) (0.35) (0.44) (0.40) Component missing -3.40 -3.98 -1.04 -3.84 0.91 0.27 -10.78** -6.81* -6.95 -2.64 0.28 (4.03) (2.61) (1.84) (3.34) (2.38) (1.91) (4.87) (3.68) (5.13) (2.40) (2.71) Adjusted R-squared 0.19 0.19 0.22 0.27 0.19 0.08 0.12 0.13 0.03 0.09 0.05 #left 751 969 910 848 644 961 1080 1081 1081 733 828 #mixed 730 921 866 823 557 924 1045 1046 1049 674 768 #component missing 11 16 15 12 8 13 17 17 17 12 11 B. Colouring in Left -0.48 -0.44 -0.91*** -1.09*** -1.07** -0.65* -0.80** -0.81*** -0.94*** -0.74* 0.25 (0.37) (0.32) (0.32) (0.32) (0.42) (0.36) (0.32) (0.31) (0.34) (0.41) (0.36) Mixed -1.50*** -0.47 -0.71** -0.75** -0.68 -0.90** -1.87*** -2.40*** -1.69*** -0.34 -0.40 (0.39) (0.35) (0.35) (0.35) (0.43) (0.42) (0.37) (0.35) (0.39) (0.46) (0.43) Component missing -4.04*** -6.48*** -4.15** -8.42*** -3.23** -8.69*** -15.50*** -16.82*** -10.99*** 7. 48*** -4.34** (1.47) (1.52) (1.74) (1.88) (1.47) (2.67) (2.00) (1.69) (2.17) (2.02) (1.98) Adjusted R-squared 0.19 0.19 0.22 0.27 0.19 0.08 0.13 0.15 0.04 0.09 0.05 #left 741 948 897 831 635 952 1065 1066 1066 727 820 #mixed 614 777 728 696 468 774 886 887 889 575 652 #component missing 45 63 48 50 40 52 74 74 74 39 47

37
C. Brushing teeth Left -0.56 -0.42 -1.00*** -0.91*** -1.12*** -0.38 -0.41 -0.55* -0.41 -0.30 0.04 (0.37) (0.32) (0.32) (0.32) (0.42) (0.35) (0.32) (0.31) (0.34) (0.41) (0.37) Mixed -1.02** -1.08*** -0.81** -1.09*** -0.51 -0.80* -1.28*** -1.22*** -1.11*** -1.31*** -0.25 (0.41) (0.36) (0.36) (0.37) (0.45) (0.43) (0.37) (0.35) (0.39) (0.48) (0.41) Component missing -2.13* -3.29*** -1.72* -2.44** -0.04 -3.58** -10.90*** -7.43*** -5.76*** 3.29** -4.26*** (1.16) (1.19) (1.04) (1.02) (1.22) (1.70) (1.64) (1.51) (1.69) (1.39) (1.32) Adjusted R-squared 0.18 0.19 0.22 7735 0.19 0.08 0.13 0.13 0.04 0.09 0.05 #left 727 928 871 0.27 617 931 1050 1051 1051 720 802 #mixed 572 709 681 817 459 745 827 827 827 549 621 #component missing 67 86 79 630 56 87 102 102 102 59 68 71 D. Throwing a ball Left -0.16 0.04 -0.53 -0.45 -0.58 -0.28 -0.16 -0.53 -0.83** -0.55 0.14 (0.40) (0.35) (0.36) (0.35) (0.47) (0.38) (0.34) (0.33) (0.38) (0.46) (0.41) Mixed -0.54* -0.53** -0.43* -0.68*** -0.37 -0.60** -1.08*** -1.46*** -1.18*** -1.32*** -0.68** (0.28) (0.25) (0.24) (0.25) (0.31) (0.26) (0.24) (0.24) (0.25) (0.30) (0.29) Component missing 1.96*** -1.37* -0.84 0.13 -0.99 -1.02 -4.11*** -3.27*** -4.21*** 2.77*** -2.37*** (0.75) (0.72) (0.74) (0.79) (0.85) (0.81) (1.04) (0.98) (1.07) (1.03) (0.91) Adjusted R-squared 0.18 0.19 0.22 0.27 0.19 0.08 0.12 0.13 0.04 0.09 0.05 #left 587 741 690 639 490 736 830 832 832 572 634 #mixed 1410 1832 1756 1626 1134 1886 2093 2093 2096 1389 1569 #component missing 107 149 139 123 111 145 165 165 165 102 117 Observations 6822 8812 8405 7735 5776 9038 9965 9970 9979 6868 7690 Robust standard errors in brackets. * significant at 10%; ** significant at 5%; *** significant at 1%. WISC = Wechsler Intelligence Scale for Children. Controls are gender, socio-economic status, heritability, insults to child’s brain and parenting.

38
Appendix
Table A1: Descriptive statistics for the data set for which child’s handedness is not missing (9980 observations) Right Left Mixed Total Proportion 0.103 0.074 1 Observations
0.823 8217 1026 737 9980
Mean (St. dev). Mean (St. dev.) Mean (St. dev.) Mean (St. dev.) Child’s gender
Female 0.50 0.40 0.35 0.48 Heritability Parents’ handedness
Mother right-handed (reference cat.) 0.80 0.70 0.76 0.79 Mother left-handed 0.07 0.13 0.08 0.07 Mother mixed-handed 0.03 0.05 0.05 0.04 Mother’s handedness missing 0.10 0.12 0.11 0.10 Father right-handed (reference cat.) 0.75 0.72 0.70 0.74 Father left-handed 0.09 0.12 0.10 0.10 Father mixed-handed 0.04 0.02 0.04 0.03 Father’s handedness missing 0.12 0.14 0.16 0.13
Insults to child’s brain Birth order
1st pregnancy 0.33 0.33 0.36 0.34 4th+ pregnancy 0.14 0.13 0.16 0.14 Missing 0.02 0.03 0.03 0.03
Caesarean section (CS)
No CS (reference category) 0.849 0.833 0.834 0.847 CS, never had any labour 0.044 0.043 0.035 0.043 CS, after being in labour 0.031 0.043 0.045 0.033 CS, no details about labour 0.021 0.019 0.024 0.021 Missing 0.054 0.062 0.061 0.056
Birth weight/gestation 86.4 (12.3) 85.9 (12.8) 85.3 (13.6) 86.3 (12.5) Missing 0.01 0.02 0.01 0.01 CCEI at 18 weeks gestation 13.1 (6.9) 13.8 (7.3) 14.0 (7.3) 13.2 (7.0) Missing 0.13 0.13 0.16 0.13 Accidents
Child dropped or fell between 6 and 15 months
0.22 0.22 0.24 0.22
Missing 0.06 0.07 0.07 0.06 Parenting Parenting score 14.7 (2.4) 14.7 (2.3) 14.3 (2.5) 14.7 (2.4) Missing 0.09 0.11 0.10 0.09

39
Socio-economic status Father’s occupational class
Professional (reference category) 0.11 0.10 0.09 0.10 Managerial 0.33 0.31 0.26 0.32 Skilled non-manual 0.12 0.12 0.12 0.12 Skilled manual 0.26 0.28 0.30 0.26 Semi-skilled manual 0.08 0.08 0.08 0.08 Unskilled manual 0.02 0.03 0.02 0.02 Missing 0.08 0.08 0.12 0.09
Mother’s age at delivery 28.7 (4.7) 28.6 (4.7) 27.8 (4.9) 28.6 (4.7) Missing 0.001 0.002 0 0.001 Mother’s education
CSE/none (reference category) 0.16 0.18 0.20 0.17 Vocational/O-level 0.44 0.46 0.47 0.44 A-level 0.24 0.21 0.21 0.24 Degree 0.14 0.14 0.11 0.14 Missing 0.01 0.01 0.01 0.01
Housing tenure at 21 months
Owner occupied (reference cat.) 0.74 0.73 0.67 0.73 Rented private/housing assoc. 0.06 0.05 0.06 0.06 Rented from council 0.09 0.11 0.15 0.10 Other 0.02 0.02 0.02 0.02 Missing 0.09 0.09 0.10 0.09
Income (£ per week) 226.4 (95.2) 222.3 (94.9) 212.7 (93.6) 225.0 (95.1) Missing 0.09 0.10 0.11 0.09 #siblings at 47 months 1.3 (0.91) 1.3 (0.92) 1.2 (1.03) 1.28 (0.92) Missing 0.10 0.10 0.10 0.10 Ethnicity
Non-white 0.04 0.04 0.02 0.04 Missing 0.05 0.05 0.08 0.05
CCEI = Crown Crisp Experiential Index (indicator of maternal psychopathology), CSE=Certificate of Secondary Education

40
Table A2: Coefficient estimates for control variables in Table 2 Entry
assess., age 5
Key Stage 1, age 7
Key Stage 2, age 11
Key Stage 3, age 14
WISC (IQ), age 8
Language score at 38 months
Social develop. score at 42 months
Fine motor score at 42 months
Gross motor score at 42 months
Total behaviour score at 81 months
Pro-social behaviour sub-score at 81 months
Left -0.23 -0.34 -0.78** -0.84*** -0.81* -0.40 -0.45 -0.42 -0.64* -0.36 0.27 (0.37) (0.32) (0.32) (0.33) (0.43) (0.35) (0.32) (0.31) (0.35) (0.42) (0.37) Mixed -2.19*** -0.56 -1.07*** -1.07*** -1.24** -1.25*** -2.22*** -2.91*** -1.87*** -1.53*** -0.96** (0.44) (0.40) (0.41) (0.40) (0.49) (0.48) (0.44) (0.41) (0.45) (0.53) (0.47) Female 3.18*** 2.51*** 0.61*** 1.14*** -0.24 2.44*** 5.38*** 4.98*** 1.54*** 2.03*** 3.52*** (0.22) (0.19) (0.18) (0.19) (0.24) (0.20) (0.19) (0.19) (0.20) (0.23) (0.23)
Heritability
Mother left-handed -0.25 -0.80** -0.53 -0.17 0.35 -0.37 0.09 -0.87** -0.46 0.05 0.39 (0.43) (0.36) (0.36) (0.37) (0.45) (0.41) (0.36) (0.37) (0.39) (0.42) (0.42) Mother mixed-hand. -0.29 -0.35 0.40 -0.17 0.23 -0.03 -0.42 -0.10 -0.18 -0.72 -0.02 (0.56) (0.53) (0.50) (0.51) (0.62) (0.52) (0.56) (0.50) (0.53) (0.66) (0.59) Mother’s handed. miss. 0.44 0.09 0.46 0.78 -1.17 0.56 0.23 1.56** -0.15 2.38** 0.71 (0.77) (0.76) (0.76) (0.71) (1.01) (0.79) (0.70) (0.70) (0.70) (1.08) (0.88) Father left-handed -0.74* -0.50 -0.53* -0.97*** 0.03 -0.37 -0.17 -0.04 -0.30 -0.36 -0.15 (0.38) (0.32) (0.32) (0.32) (0.38) (0.35) (0.31) (0.31) (0.35) (0.39) (0.37) Father mixed-handed -0.38 -0.55 -0.55 -0.47 -0.19 -0.09 0.44 0.15 0.79 0.00 1.04* (0.60) (0.54) (0.49) (0.51) (0.59) (0.57) (0.49) (0.48) (0.52) (0.61) (0.58) Father’s handed. miss. -1.42** -1.35** -1.10 -1.38** 0.77 -0.14 0.25 -0.15 1.12* -2.11** -0.26 (0.67) (0.67) (0.68) (0.63) (0.89) (0.64) (0.62) (0.62) (0.60) (0.95) (0.74)
Insults to child’s brain
1st pregnancy 0.91*** 1.05*** 0.88*** 1.08*** 0.37 0.78*** -0.18 0.55** -0.02 -0.15 -0.43 (0.26) (0.23) (0.22) (0.23) (0.29) (0.23) (0.22) (0.22) (0.23) (0.28) (0.27) 4th+ pregnancy -0.15 -0.68** -0.39 -0.58* -0.03 0.16 0.11 0.16 0.38 0.63 0.15 (0.36) (0.31) (0.31) (0.31) (0.39) (0.38) (0.32) (0.32) (0.32) (0.40) (0.39) #pregnancies missing 0.20 -0.58 -1.23 -1.44* -2.76*** 1.07 0.38 0.86 0.50 0.76 0.25 (0.81) (0.75) (0.81) (0.75) (1.05) (0.84) (0.73) (0.71) (0.77) (1.00) (0.90) CS w/o labour -1.36** -0.33 -0.24 -0.62 -0.13 -0.88 -0.46 -0.37 -0.51 -1.24** 0.31 (0.55) (0.47) (0.47) (0.48) (0.58) (0.58) (0.48) (0.44) (0.50) (0.60) (0.57) CS with labour -0.29 -0.60 -0.84 -0.97* -1.49** 0.34 0.23 0.61 -0.63 -0.68 0.81 (0.60) (0.52) (0.57) (0.53) (0.65) (0.52) (0.48) (0.48) (0.57) (0.63) (0.55)

41
CS, type unknown -1.48** -1.84*** -0.98* -1.22* 0.11 0.10 0.35 1.01* 0.47 -0.12 0.30 (0.73) (0.67) (0.60) (0.68) (0.86) (0.55) (0.54) (0.53) (0.64) (0.83) (0.79) CS missing -0.94* -1.78*** -0.94* -0.89* -0.32 -0.06 -1.02** -0.51 -1.02* -0.58 -0.11 (0.52) (0.47) (0.50) (0.48) (0.68) (0.55) (0.51) (0.51) (0.56) (0.70) (0.62) Birth weight/gestation 0.06*** 0.05*** 0.04*** 0.05*** 0.06*** 0.01 0.04*** 0.05*** 0.03*** 0.03*** 0. 03*** (0.01) (0.01) (0.01) (0.01) (0.01) (0.01) (0.01) (0.01) (0.01) (0.01) (0.01) Birth weight/gest. miss. 2.23* 0.03 2.42*** 2.42*** 1.56* 0.25 -0.17 0.06 -0.15 -0.30 -0.43 (1.14) (0.94) (0.69) (0.74) (0.94) (0.85) (1.05) (1.02) (1.24) (1.04) (1.14) CCEI at 18 weeks gest. -0.06*** -0.04*** -0.04*** -0.05*** -0.05** -0.07** * -0.03** -0.03** -0.02* -0.30*** -0.07*** (0.02) (0.01) (0.01) (0.01) (0.02) (0.02) (0.01) (0.01) (0.01) (0.02) (0.02) CCEI missing 0.51 -0.15 -0.04 0.04 0.45 -0.32 -0.09 -0.06 -0.18 -0.24 -0.08 (0.34) (0.32) (0.31) (0.32) (0.39) (0.35) (0.31) (0.31) (0.33) (0.43) (0.37) Fall/drop 6-15 months 0.20 0.27 0.27 0.55** 0.30 -0.01 -0.03 0.13 -0.30 -1.21*** -0.46* (0.27) (0.23) (0.23) (0.23) (0.28) (0.23) (0.22) (0.22) (0.23) (0.28) (0.27) Fall/drop missing -0.77 -0.39 -0.60 -0.81* 0.10 -0.17 0.58 -0.21 -0.30 0.51 0.18 (0.48) (0.44) (0.45) (0.44) (0.66) (0.52) (0.43) (0.46) (0.49) (0.62) (0.59)
Parenting
Parenting 24 months 0.33*** 0.24*** 0.29*** 0.28*** 0.41*** 0.81*** 0.71*** 0.73*** 0.57*** 0.37*** 0. 45*** (0.05) (0.04) (0.04) (0.04) (0.05) (0.05) (0.04) (0.04) (0.04) (0.05) (0.05) Parenting missing -0.02 -0.62* -0.48 -0.44 -0.41 -0.83* -0.25 -0.50 -0.30 -0.02 0.20 (0.42) (0.37) (0.37) (0.37) (0.53) (0.46) (0.38) (0.38) (0.40) (0.53) (0.50)
Socio-economic status
Managerial -1.26*** -1.60*** -1.36*** -1.81*** -1.50*** -0.23 0.00 0.00 0.52 -0.13 -0.16 (0.44) (0.33) (0.28) (0.35) (0.39) (0.30) (0.35) (0.32) (0.37) (0.38) (0.39) Skilled non-manual -2.03*** -2.08*** -1.59*** -2.13*** -2.03*** -0.64 -0.05 -0.21 0.76* 0.05 -0.15 (0.52) (0.40) (0.36) (0.42) (0.48) (0.39) (0.42) (0.39) (0.43) (0.47) (0.48) Skilled manual -2.49*** -2.95*** -2.94*** -3.44*** -3.01*** -0.62* 0.26 -0.08 1.04** -0.65 0.56 (0.47) (0.37) (0.33) (0.39) (0.44) (0.35) (0.39) (0.36) (0.41) (0.44) (0.43) Semi-skilled manual -3.11*** -3.24*** -3.59*** -4.21*** -4.30*** -1.09** 0.10 -0.56 0.79 -0.49 0.87 (0.56) (0.46) (0.43) (0.47) (0.58) (0.48) (0.46) (0.46) (0.50) (0.56) (0.54) Unskilled manual -3.61*** -4.94*** -4.79*** -5.79*** -4.64*** -1.61* -0.28 -2.19*** 0.30 -1.74* -0.30 (0.76) (0.71) (0.80) (0.71) (0.85) (0.83) (0.71) (0.75) (0.76) (0.92) (0.91) Father’s class missing -2.17*** -3.19*** -2.97*** -3.97*** -3.67*** -1.48** 0.31 -0.39 0.55 -1.20 -0.48 (0.67) (0.56) (0.54) (0.57) (0.70) (0.69) (0.56) (0.53) (0.60) (0.75) (0.65)

42
Mother’s age 0.11*** 0.08*** 0.09*** 0.11*** 0.09*** -0.13*** -0.15*** -0.14*** -0.08*** 0.04 -0.05* (0.03) (0.02) (0.02) (0.03) (0.03) (0.03) (0.02) (0.02) (0.02) (0.03) (0.03) Mother’s age missing -1.55 -2.11 -0.05 -0.12 0.00 5.20*** 5.56*** 2.07 3.62 (3.24) (1.89) (3.85) (4.60) (0.00) (1.80) (1.86) (1.96) (2.32) Mother has O-level 2.07*** 2.56*** 2.68*** 2.61*** 2.24*** 0.22 0.48* 0.80*** -0.35 0.49 -0.14 (0.31) (0.29) (0.31) (0.28) (0.39) (0.36) (0.28) (0.29) (0.29) (0.40) (0.35) Mother has A-level 3.03*** 3.20*** 4.29*** 4.63*** 4.04*** 0.56 0.44 1.44*** -1.12*** 0.62 -0.47 (0.38) (0.33) (0.34) (0.33) (0.44) (0.40) (0.33) (0.33) (0.33) (0.44) (0.40) Mother has degree 5.62*** 5.47*** 7.16*** 7.84*** 7.45*** 1.29*** -0.45 0.68* -1.87*** 0.31 -1.88*** (0.48) (0.40) (0.39) (0.41) (0.51) (0.44) (0.40) (0.39) (0.42) (0.50) (0.48) Mother’s educ. miss. -0.43 4.62*** 4.63*** 4.40*** 6.05** -0.33 1.42 0.20 -0.98 4.04* 1.18 (1.45) (1.22) (1.28) (1.35) (2.39) (1.85) (1.12) (1.12) (1.43) (2.16) (2.25) Housing tenure: rented -1.35*** -0.63 -0.67 -0.69 0.09 0.08 -0.02 -0.08 0.12 -0.18 -0.64 (0.51) (0.43) (0.42) (0.44) (0.58) (0.43) (0.41) (0.41) (0.39) (0.57) (0.53) Housing tenure: council -1.62*** -2.55*** -2.86*** -3.09*** -1.59*** -0.28 0.51 -1.01*** 0.04 -0.63 -0.18 (0.41) (0.39) (0.42) (0.38) (0.53) (0.45) (0.34) (0.38) (0.37) (0.54) (0.46) Housing tenure: other -0.41 0.58 1.01 1.35** 0.30 -0.48 0.94 0.15 0.50 -0.07 1.32 (0.94) (0.67) (0.63) (0.68) (0.96) (0.67) (0.58) (0.59) (0.62) (0.72) (0.82) Housing tenure miss. -0.43 -0.97** -1.48*** -1.53*** -1.94*** -0.71 -0.44 -1.02** -0.71 -0.59 -0.60 (0.45) (0.41) (0.42) (0.40) (0.56) (0.50) (0.42) (0.41) (0.47) (0.58) (0.53) Ln(income) 1.98*** 1.63*** 1.89*** 2.42*** 1.49*** 0.50* 0.88*** 0.66*** 0.47* 1.30*** 0.29 (0.30) (0.26) (0.26) (0.26) (0.33) (0.28) (0.25) (0.24) (0.26) (0.33) (0.30) Income missing 0.25 0.34 -0.41 -0.47 0.41 -0.29 0.28 -0.55 -0.59 -0.01 -0.03 (0.47) (0.41) (0.40) (0.41) (0.55) (0.51) (0.39) (0.42) (0.43) (0.55) (0.50) #siblings at 47 months -0.88*** -0.53*** -0.32*** -0.32*** -0.60*** -0.11 0.57*** 0.16 0.20 0.48*** -0.29* (0.14) (0.12) (0.12) (0.12) (0.16) (0.15) (0.12) (0.11) (0.12) (0.19) (0.17) #siblings missing -0.97** -1.33*** -0.64* -1.05*** -1.20** 0.13 0.49 0.51 1.56*** -0.30 -0.05 (0.43) (0.39) (0.37) (0.39) (0.58) (0.45) (0.37) (0.38) (0.37) (0.59) (0.52) Non-white -0.85 1.22** 1.35*** 0.80 1.19* -0.38 0.25 0.68 1.26** -0.22 -0.07 (0.65) (0.55) (0.51) (0.55) (0.70) (0.53) (0.50) (0.50) (0.49) (0.75) (0.61) Ethnicity missing 0.43 -0.35 -0.11 0.05 -0.42 -0.46 -0.20 0.35 -0.29 0.01 0.48 (0.65) (0.60) (0.63) (0.59) (0.72) (0.71) (0.55) (0.54) (0.61) (0.82) (0.71) Observations 6822 8812 8405 7735 5776 9038 9965 9970 9979 6868 7690 Adjusted R-squared 0.19 0.19 0.22 0.27 0.19 0.08 0.12 0.13 0.03 0.09 0.05 Robust standard errors in brackets. * significant at 10%; ** significant at 5%; *** significant at 1%. WISC = Wechsler Intelligence Scale for Children, CS = Caesarean Section, CCEI = Crown Crisp Experiential Index (indicator of maternal psychopathology).

43
Table A3: Estimates of the association between handedness at age 7 years and child outcomes Entry
assess., age 5
Key Stage 1, age 7
Key Stage 2, age 11
Key Stage 3, age 14
WISC (IQ), age 8
Language score at 38 months
Social develop. score at 42 months
Fine motor score at 42 months
Gross motor score at 42 months
Total behaviour score at 81 months
Pro-social behaviour sub-score at 81 months
Left at age 7 years -0.52 -0.41 -0.93*** -0.81** -0.59 -0.47 -0.29 -0.80** -0.28 -0.65 -0.21 (0.38) (0.33) (0.33) (0.33) (0.39) (0.36) (0.32) (0.33) (0.35) (0.41) (0.37) Handedness at -1.91*** -1.80*** -1.74*** -2.29*** -1.24*** -1.03*** -0.93*** -0.38 -0.29 -0.33 age 7 years missing (0.29) (0.26) (0.25) (0.26) (0.29) (0.27) (0.25) (0.27) (0.36) (0.34) Observations 6822 8812 8405 7735 5776 9038 9965 9970 9979 6868 7690 Adjusted R-squared 0.19 0.19 0.22 0.28 0.19 0.08 0.11 0.12 0.03 0.09 0.05 #left at 7/8/9 638 820 764 708 700 826 905 906 906 696 779 #missing at 7/8/9 1557 1949 1835 1754 0 1941 2356 2356 2360 948 1089 Robust standard errors in brackets. * significant at 10%; ** significant at 5%; *** significant at 1%. WISC = Wechsler Intelligence Scale for Children. Controls are gender, socio-economic status, heritability, insults to child’s brain and parenting. Table A4: Estimates of the association between handedness and child outcomes using only observations with no missing control variables Entry
assess., age 5
Key Stage 1, age 7
Key Stage 2, age 11
Key Stage 3, age 14
WISC (IQ), age 8
Language score at 38 months
Social develop. score at 42 months
Fine motor score at 42 months
Gross motor score at 42 months
Total behaviour score at 81 months
Pro-social behaviour sub-score at 81 months
Left 0.25 0.42 -0.38 -0.05 -0.28 -0.30 -0.40 -0.37 -0.33 -0.14 0.17 (0.50) (0.40) (0.41) (0.42) (0.54) (0.42) (0.42) (0.39) (0.43) (0.49) (0.46) Mixed -2.31*** -0.08 -0.89* -1.05** -1.33** -1.35** -1.77*** -2.67*** -1.83*** -1.63** -1.69*** (0.59) (0.49) (0.51) (0.53) (0.62) (0.59) (0.55) (0.53) (0.57) (0.64) (0.58) Observations 3919 5127 4884 4492 3820 5512 5749 5751 5757 4534 4991 Adjusted R-squared 0.17 0.16 0.19 0.23 0.17 0.09 0.12 0.14 0.04 0.10 0.05 Robust standard errors in brackets. * significant at 10%; ** significant at 5%; *** significant at 1%. WISC = Wechsler Intelligence Scale for Children. Controls are gender, socio-economic status, heritability, insults to child’s brain and parenting.