the urban sustainability challenge
TRANSCRIPT

The Urban Sustainability Challenge
Arnulf GrublerIIASA and Yale University
International SymposiumInternational Symposium “Realizing Low Carbon Cities: Bridging Science and Policy”
Nagoya, February 16, 2009.

Global Energy AssessmentGlobal Energy Assessment
IIASAIIASAInternational Institute for Applied Systems AnalysisInternational Institute for Applied Systems AnalysisInternational Institute for Applied Systems AnalysisInternational Institute for Applied Systems Analysis
and its international partnersand its international partners

GEA Knowledge ClustersGEA Knowledge Clusters• Cluster I: Major Global Issues and EnergyCluster I: Major Global Issues and Energy
– assessment of the Challenges
• Cluster II: Energy Resources and TechnologicalCluster II: Energy Resources and Technological Options – assessment of the Components available to build future energy
systems
• Cluster III: Describing Possible Sustainable Futures– assessment of how to combine the Components to create Systems
that address the Challengesthat address the Challenges
• Cluster IV: Realizing Energy for Sustainable DevelopmentDevelopment – assessment of the Policies needed to address the Challenges and
realize the Systems

GEA KM18 Urbanization• First Assessment with explicit discussion
of urbanization and urban energy issues• Increasing urban dominance in population,
economic activity, energy use, CO2 emissions2
• Projected urban growth (scenarios)• Unique urban energy and sustainability• Unique urban energy and sustainability
challenges identifiedInnovative solutions outlined• Innovative solutions outlined

Urbanization: The last 1000 Yearsfraction urban, and total urban population in billion
urba
n)te
(fra
ctio
n u
aniz
atio
n ra
tur
ba
Source: Grubler, 2006

Urban and Rural Population Projections (Millions)(IIASA GGI, 2007, and UN WUP, 2007)( , , , )
12000
IIASA A2r
8000
10000
IIASA B2
6000IIASA B1urban
4000
2000rural
Data source: Riahi et al., 2007; UN, 2007
02000 2025 2050 2075 2100

Urban vs. Rural Population Scenarios in 4 Macro-Regions(IIASA GGI 2007 and UN WUP 2007 in Billion)(IIASA GGI, 2007, and UN WUP, 2007, in Billion)
0 7
0.8
0.9
1.0
5.0
6.0
ASIA
0.2
0.3
0.4
0.5
0.6
0.7
Bill
ion
OECD2.0
3.0
4.0
Bill
ion
0.0
0.1
2000 2025 2050 2075 2100 0.0
1.0
2000 2025 2050 2075 2100
0.3
0.3
0.4
0.4
0.5
lion 2.0
2.5
3.0
3.5
on
ME-AFR
0.0
0.1
0.1
0.2
0.2Bill
REFs
0.0
0.5
1.0
1.5Bill
i
2000 2025 2050 2075 2100 2000 2025 2050 2075 2100
Data source: Riahi et al., 2007; UN, 2007
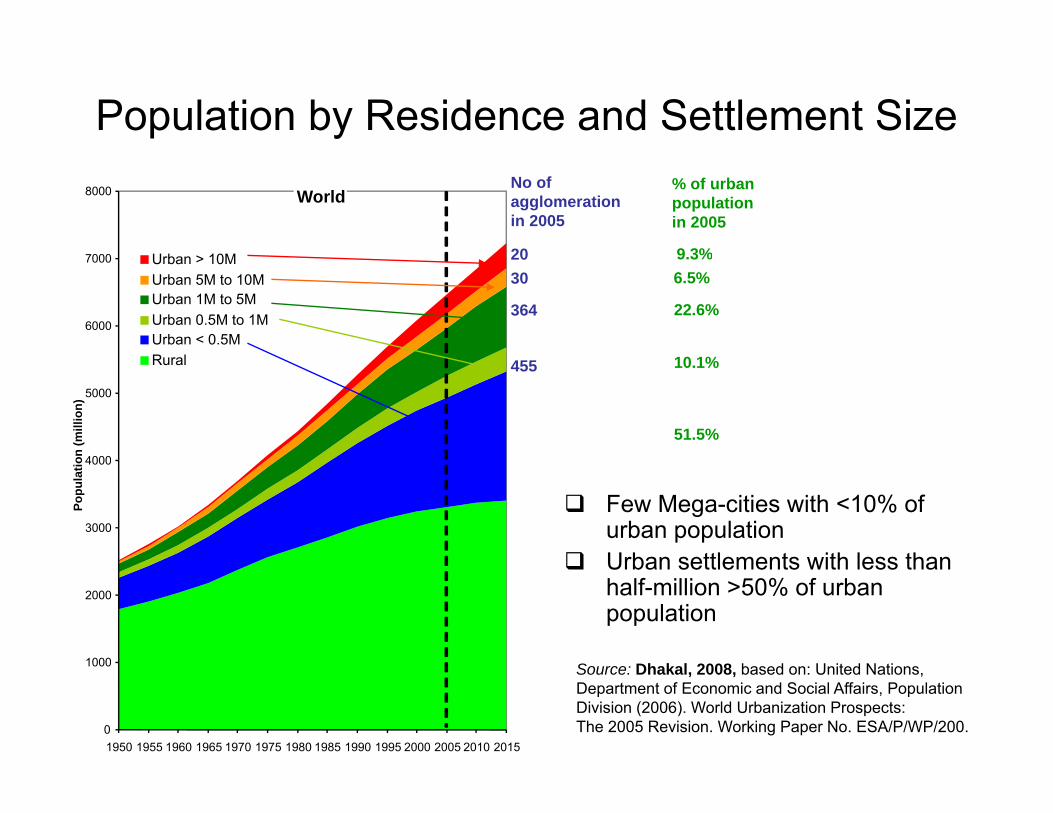
Population by Residence and Settlement Size
World8000
20
No of agglomeration in 2005
% of urban population in 2005
9 3%
6000
7000 Urban > 10MUrban 5M to 10MUrban 1M to 5MUrban 0.5M to 1MUrban < 0.5MR l
2030
364
9.3%6.5%
22.6%
4000
5000
on (m
illio
n)
Rural 455 10.1%
51.5%
Few Mega-cities with <10% of urban populationUrban settlements with less than
3000
4000
Popu
latio
Urban settlements with less than half-million >50% of urban population
1000
2000
S
0
1000
1950 1955 1960 1965 1970 1975 1980 1985 1990 1995 2000 2005 2010 2015
Source: Dhakal, 2008, based on: United Nations, Department of Economic and Social Affairs, Population Division (2006). World Urbanization Prospects:The 2005 Revision. Working Paper No. ESA/P/WP/200.

World City Hierarchies (Rank Size):Cities vs. Agglomerations/CorridorsCities vs. Agglomerations/Corridors
Chinese Seacoast?
1
2
10
100
Tokyo
0
ulat
ion
(Millio
n)
1
-1
Pop
u
.1
-2-1 0 1 2 3
Rank1 10 100 1000
.01
Megacities increasingly fuse into agglomeration corridors!Megacities increasingly fuse into agglomeration corridors!
Source: Grubler, 2006
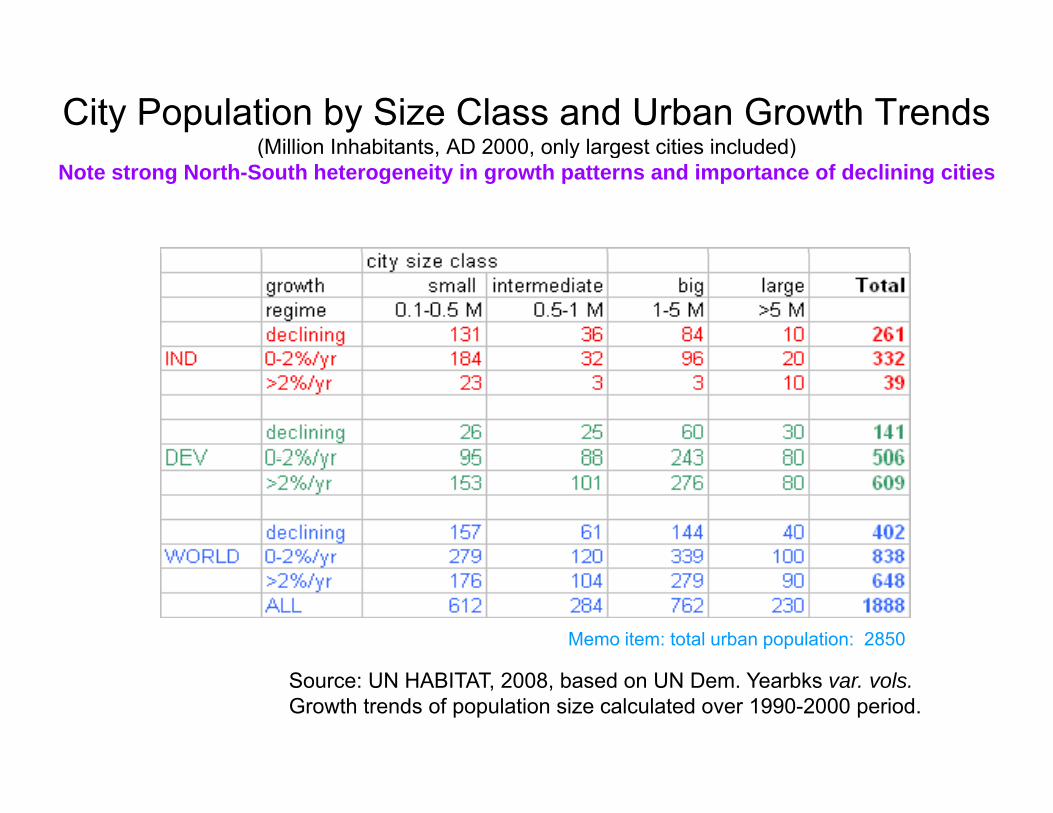
City Population by Size Class and Urban Growth Trends(Million Inhabitants AD 2000 only largest cities included)(Million Inhabitants, AD 2000, only largest cities included)
Note strong North-South heterogeneity in growth patterns and importance of declining cities
Memo item: total urban population: 2850
Source: UN HABITAT, 2008, based on UN Dem. Yearbks var. vols.Growth trends of population size calculated over 1990-2000 period.
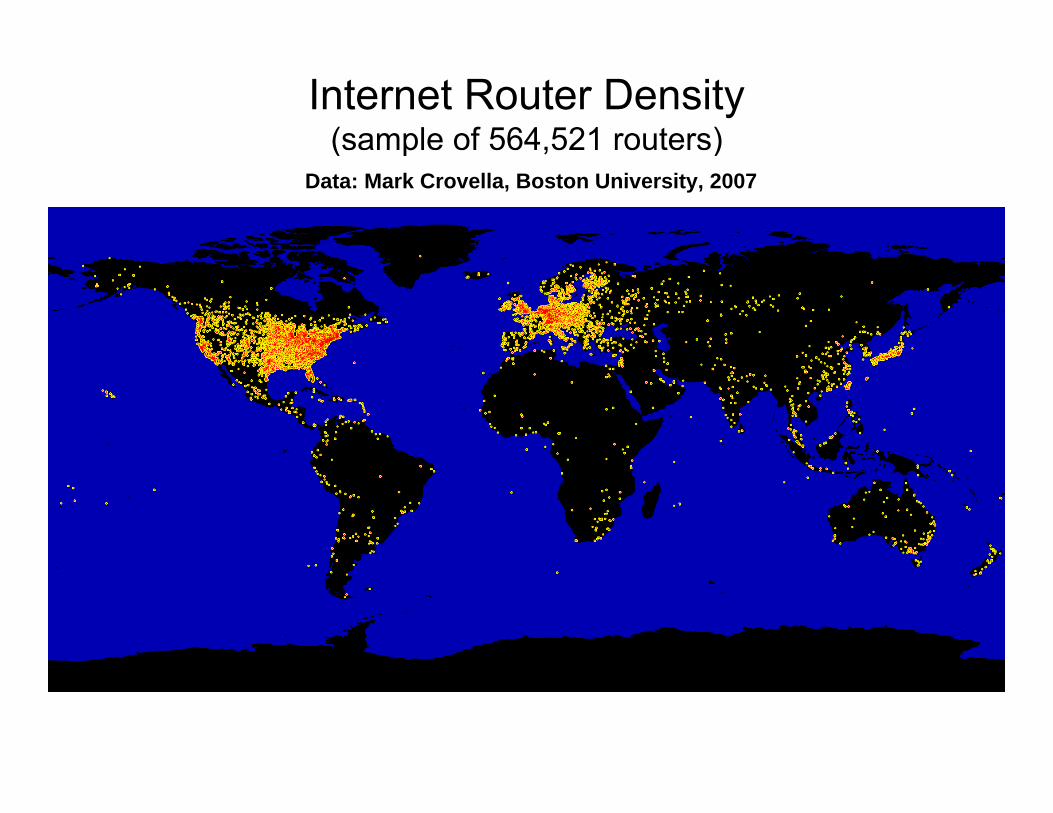
Internet Router Density(sample of 564,521 routers)( p , )
Data: Mark Crovella, Boston University, 2007

Urbanization Indicators AD 2000Urbanization Indicators AD 2000
URBAN OECD90 REFs ALM ASIA WORLD
Area (1000 km2) 618 227 658 1426 2929% of total 1.9 1.0 1.2 6.5 2.2
Population (million) 714 260 791 1089 2855% of total 77.7 63.0 53.8 33.5 47.2
$GDP (MER 1990$) (billion) 17522 587 2154 1729 21991% of total 83.8 72.0 83.1 62.1 81.1
Final energy use (EJ) 107 23 29 32 192% of total 76.4 72.5 64.5 45.7 66.6
Light luminosity (million NLIS) 23 3 5 3 33Light luminosity (million NLIS) 23 3 5 3 33% of total 56.1 53.2 53.9 71.9 56.7
Internet routers (number in 1000) 524 20 13 35 592% of total 96.5 97.5 94.3 96.8 96.5
GDP (MER) = Gross Domestic Product at market exchange rates 1990 US$. EJ = 1018 Joules. NLIS: (sum of) Night Luminosity Index of Stable lights.Definition of regions:OECD90: OECD countries as of 1990; REFs: reforming economies of Eastern Europe and ex-USSR; ; g p ;ALM: Africa, Middle East, and Latin America; ASIA: (developing economies in) Asia.
Source: Draft IIASA estimates

China’s Top 35 Cities
List of 35 most important cities mentioned in national plan: Beijing, Tianjin, Shijiazhuang, Taiyuan, Hohhot, Shenyang, Dalian, Changchun, Harbin, Shanghai, Nanjing, Hangzhou, Ningbo, Hefei, Fuzhou, Xiamen, Nanchang, Jinan, Qingdao, Zhengzhou, Wuhan, Changsha, Guangzhou, Shenzhen, Nanning, Haikou, Chongqing, Chengdu, Guiyang, Kunming, Xi'an, Lanzhou, Xining, Yinchuan, and Urumqi.
Source: Dhakal, 2008

Path Dependent Development Trajectories of Chinese Citiesof Chinese Cities
Hohhot280 000
Taiyuan
Hohhot
Yinchuan
200 000
240,000
280,000
MJ
Per P
erso
n
High energy pathway: Largely on middle and western China with energy intensive industries and climatically cooler
High energy pathway: Largely on middle and western China with energy intensive industries and climatically cooler
Xiamen
Urumqi
Guiyang
Shanghai
Guangzhou
120 000
160,000
200,000
Cons
umpt
ion
in
Low energy pathway: Cities in eastern part of the country with Low energy pathway: Cities in eastern part of the country with
Nanjing
Fuzhou
Xining
Ningbo
Xian
Beijing
China
40 000
80,000
120,000
Capi
ta E
nerg
y C
p ystrong presence of service industries, close to coast and warmer climate
p ystrong presence of service industries, close to coast and warmer climate
Chongquin
0
40,000
0 3,000 6,000 9,000 12,000
Per Capita Gross Regional Product in US$
Per C
Per Capita Gross Regional Product in US$
Source: Dhakal, 2008

Urban Sustainability ChallengesUrban Sustainability Challenges• Vast and rapid urban growthp g• Access to modern & clean services
(health, jobs, water, energy)• Security, reliability, and
resilience of systems• Pollution reduction• Efficiency improvements
-- individual plus systemic measures• Clean supply: Need for integrative view to
assess sustainability of imports

Population Living in Slums (Million)Population Living in Slums (Million)
1990 2005 2020BAU Projection
Developing Asia 420 582 807
Africa 123 220 414
Latin America 111 134 163Latin America 111 134 163
Others 61 62 8
World 715 998 1392
Energy Infrastructure investments for halving slum population: 700 billion $Energy Infrastructure investments for halving slum population: 700 billion $
Source: UN HABITAT, 2008

Urban Electricity Access and Poverty urban population (Million), 2002 with without TOTAL
electricity access % electrification electricity access % electrificationNorth Africa 73 1 74 98.8 Sub-Saharan Africa 125 117 242 51.5 Chi & E t A i 696 29 725 96 0China & East Asia 696 29 725 96.0South Asia 271 119 390 69.4 other dev. Countries 433 9 441 98.1Developing total 1597 275 1872 85.3 Ind. Countries 1085 0 1085 100.0 T t l U b 2682 275 2957 90 7Total Urban 2682 275 2957 90.7 Total Rural 1876 1347 3223 58.2
Source: IEA, WEO, 2004 estimates
Minimum access investments: 1.5 trillion $

PM10 Exposures in 3200 Cities
Exposure: PM10 concentration*City population (capita.µg/m3)Size of circle indicates exposure (Quintiles)Color of circle indicates underlying PM10 Concentration (µg/m3) range: 7-358 µg/m3
Source: C. Doll, 2009, based on World Bank data

Air Pollution in 3200 Cities with 2 Billion People and WHO PM-10 non-/attainment Status
Only 160 Million breathing clean air.
More than 1 billion needimproved urban air quality.
740 Million aboveminimum WHO air quality standard.
Source: C. Doll, 2009, based on World Bank data

Hierarchy in Urban Energy and CO2 Reductionsy gy 2
1 Spatial division of labor1. Spatial division of labor(trade, industry structure)
2. Urban form(functional mix, public transport,car ownership,…)
3 Effi i f d3. Efficiency of energy end-use(buildings, appliances, processes)
4 Energy systems integration4. Energy systems integration(co-generation, heat-cascading)
5. Fuel substitution (renewables, nuclear)( )

Singapore – Importance of Energy TradeSingapore Importance of Energy TradeM
toe
Source: Schulz, 2007 based on IEA/OECD

Complex Accounting for Urban Carbon(energy only, hypothetical numbers)
Energy embodied Energy used forgyin good and servicesimported (e.g. food,raw materials..) 200
gytransport to/from city(e.g. shipping, aircraft…)50
Final energy use
Direct energy usein production andconversion for
50
energy embodied100city imports(e.g. electricity generation..)
energy embodiedIn goods and servicesexported (e.g. manuf.goods, services..)
100100
Di t it 100g )
Direct on-site: 100direct energy: 150incl. net trade: 250incl. transport: 300
wastes
20
incl. transport: 300
Direct on-site (majority of “consumption”-based urbanemission inventories) accounts only for fraction of all carbon flows!

Tokyo – Carbon Accounts (Million tons CO2)(b d i l I O A l i )(based on regional I-O Analysis)
140 Carbon flows across systems boundariesd i t
100
120dominate:- inflows (embodied and upstream
emissions)-Outflows (embodied in exports)
40
60
80
Biggest unknowns: - International trade and C-flows- Other GHGs
S i k ll ti
0
20
Inflow Outflow Inflow Outflow Inflow Outflow
- Source-sink allocationfor large point sources
Current dominant inventories( t it ti lInflow Outflow Inflow Outflow Inflow Outflow
1990 1995 2000
Indirect Coal Oil Gas Consumption Capital Formation Export
(apparent city consumption plus upstream pro-rated national emissionsof energy conversion)offer poor policy guidance!
Source: Dhakal, based on Kaneko, 2007

Toronto – Residential per Capita GHG Emissions(tons CO2-equiv)(tons CO2 equiv)
Buildings Transport
Total ResidentialNote dominance oftransport-related emissionstransport-related emissionsfrom suburbs
Source: WandeWeghe&Kennedy, 2007
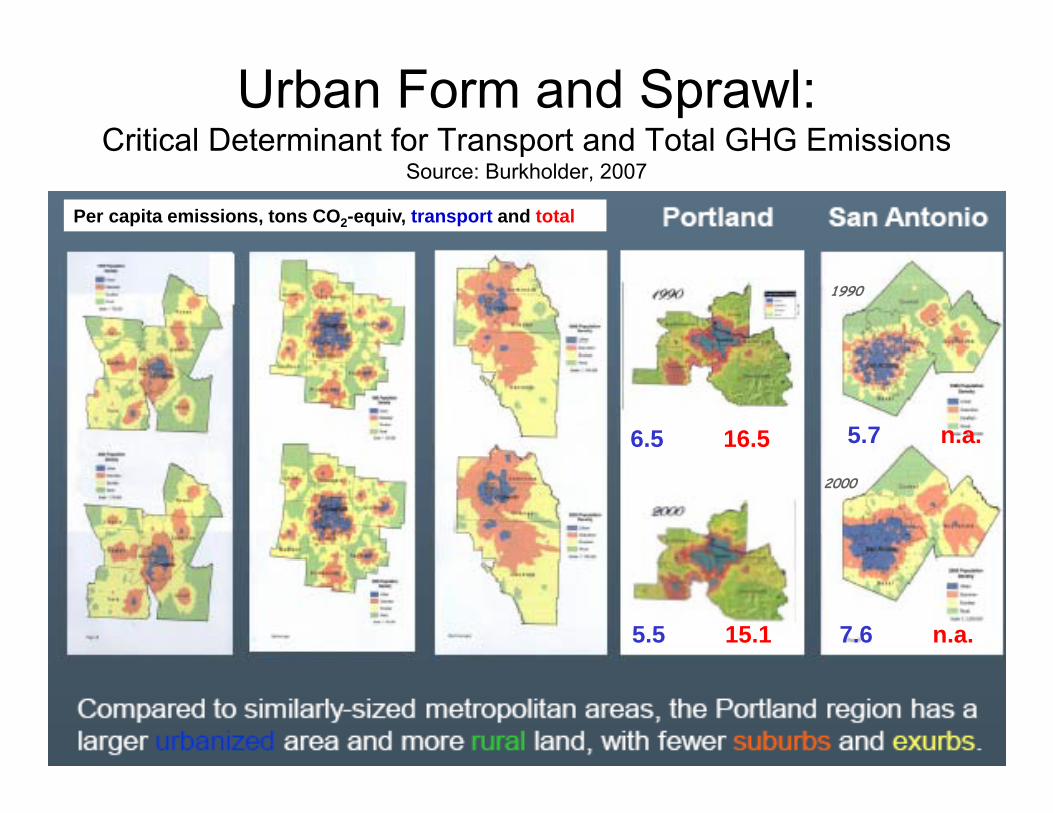
Urban Form and Sprawl:Critical Determinant for Transport and Total GHG EmissionsCritical Determinant for Transport and Total GHG Emissions
Source: Burkholder, 2007
Per capita emissions, tons CO2-equiv, transport and total
1990
6.5 16.5 5.7 n.a.
2000
5.5 15.1 7.6 n.a.

Household Transport CO2-Emissions in Bay Area: Importance of Public Transport InfrastructureImportance of Public Transport Infrastructure
Source: MTC, 2007

Sectoral economic potential for global mitigation for different regions as a function of carbon price, 2030
Source: IPCC AR4, 2007

Buildings Life cycle CO2 Emissions and Costs per m2
(typical European Mediterranean conditions)
Cheapest and most C-effective option: Thermal retrofit of buildings!
Source: Sabaté and Peters, 2008
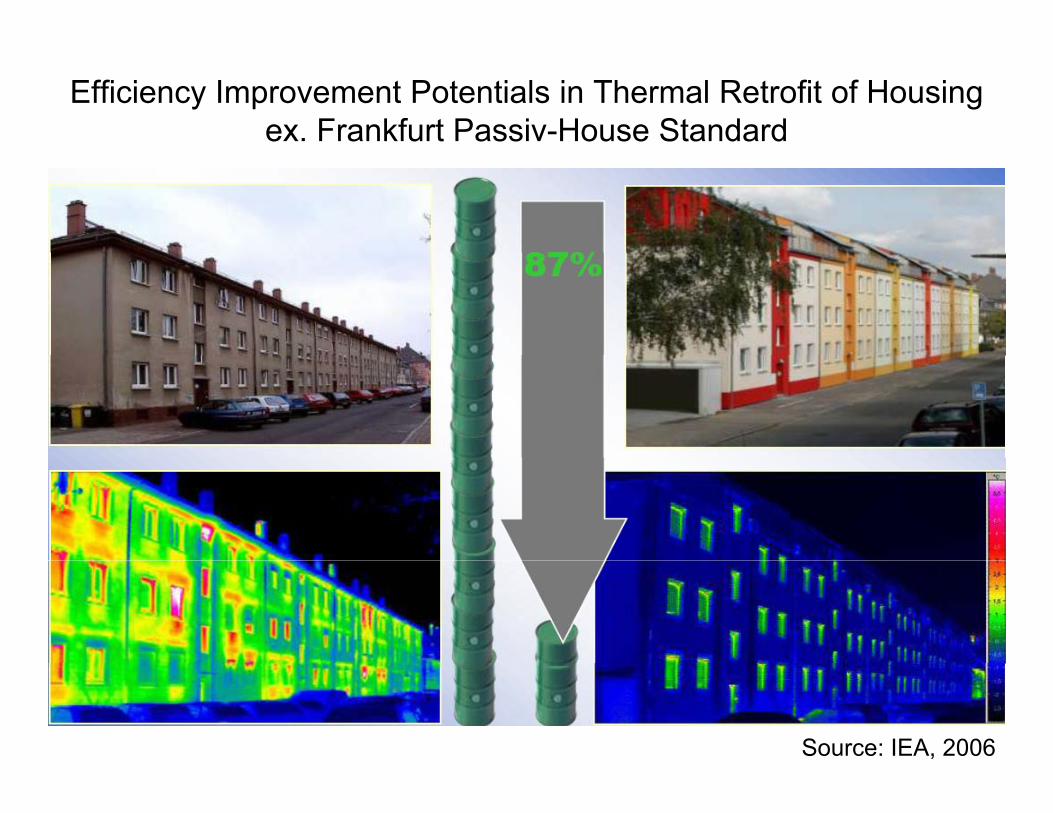
Efficiency Improvement Potentials in Thermal Retrofit of Housingex. Frankfurt Passiv-House Standard
Source: IEA, 2006

Barcelona Integrated District Heating-Cooling Grid leads to 51% CO2 reduction compared to decentralized “stand-alone” mode.
80 MW heat + 100 MW chill by 2010
Source:Source:Sabaté and Peters, 2008

Energy and Exergy Flows Vienna 2006GasGas Heat Liquids Renewables
. Electricity Motor fuels
GasGas Heat, Liquids Renewables
Secondary Exergy: 171 TJ 100%Secondary Energy: 45 TWh 100%
Final Exergy: 140 TJ 82%Final Energy: 38 TWh 84%
Industry
S i
Households Traffic
Services
Useful Exergy: 31 TJ 18%
L.T. heat Processheat
Light, motion
Useful Exergy: 31 TJ 18%Useful Energy: 23 TWh 50%
Source: Wien Energie, 2009; (rough) exergy efficiencies based on Gilli et al., 1996.

Urban Sustainability Opportunities
• Co-location of multitude of uses→ energy cascading (e g cogeneration→ energy cascading (e.g. cogeneration
of electricity, steam, chill, heat)• High metabolismHigh metabolism→ recycling of wastes (heat, materials)→ wastes as energy resource
• High density→ feasible economics for
high quality public transporthigh quality public transport• Agglomeration/network externalities→ innovation “hubs” and centers→ mobilization of capital and “action”

Urban Sustainability Constraintsy
• Energy demand and pollution densityEnergy demand and pollution density• Heat island effect
C it l i t it f i f t t• Capital intensity of infrastructure investments
• Consumer “take back” effects• Policy paradox:y p
- largest leverage from systems integration, but- most difficult due to policy fragmentation

Europe Population vs. Energy Demand DensityNote in particular renewable supply density threshold of maximum 0.5-1 W/m2
20.0
30.0
40.0
tion
and
ener
gy u
se
0.0
10.0
<0.1 0.1-1 1-5 5-10 10-25 >25
W / m2
% o
f pop
ulat
WEU POP WEU ENE EEU: 34% of demand below
30.0
40.0
and
ener
gy u
se
WEU: 21% of demand belowrenewable density threshold
U 3 % o de a d be orenewable density threshold
0.0
10.0
20.0
<0.1 0.1-1 1-5 5-10 10-25 >25
W / m2
% o
f pop
ulat
ion
a
EEU POP EEU ENE
Source: Draft IIASA calculations

Energy Use in US Residential DwellingsEnergy Use in US Residential Dwellings
kWh/ 2/ E f h ti T t lkWh/m2/year Energy for heating, cooling, hot water
Total energy usew/o transport
US average home (2001) ~100 ~250*
Passive house <15 <120
i i l h 20 000 kWhsavings per typical home(150 m2) per year
~20,000 kWh
Equivalent transportdemand
600 gal. gasoline15 000 ildemand = 15,000 miles@ 25 mpg
= 40 miles/day
* primary energy equivalent Source: DOE Res. HH Survey 2001

GEA KM18 Main Messages (draft)GEA KM18 Main Messages (draft)1. The world is already today predominantly urban (~2/3 of final energy)
and will become even more so2 R l l ti lik l t k t 3 5 billi2. Rural populations are likely to peak at 3.5 billion
and decline after 20203. Urban population projected to continue to grow to 6-8 billion by 2050 with largest growth
in settlements <0.5M4 Shrinking cities new phenomenon of demographic decline4. Shrinking cities new phenomenon of demographic decline5. Cities have specific sustainability challenges
(high density calls for ~zero-impact systems)6. Many still do not have access to basic energy services, which need to be supplied
based on economic, social, and environmental sustainability7. Vast improvement potentials, but most require demand-supply integration and systemic
changes (recycling, cascading, transport systems integration,..)8. “Upstream” energy and CO2 emission accounts fraught by uncertainty and system
boundary ambiguity9 New sustainability criteria needed considering the functional interdependence among9. New sustainability criteria needed, considering the functional interdependence among
different systems that are geographically separated10. Governance Paradox:
- largest leverage from systemic change, but- most difficult to implement in view of policy fragmentation and dispersed,
decentrali ed decision takingdecentralized decision taking
