the challenge of sustainability
DESCRIPTION
"It focuses on the key issues of energy, forests, biodiversity, land and water degradation and financing. And it proposes practical solutions that build on the World Summit on Sustainable Development and the experiences since the Earth Summit in Rio de Janeiro in 1992."TRANSCRIPT
PRINTED ON ENVIRONMENTALLY FRIENDLY PAPER
TH
E C
HA
LL
EN
GE
OF SU
STA
INA
BIL
ITY
ABOUT THE CHALLENGE OF SUSTAINABILITY
IN MANY WAYS, WE HAVE ENTERED ONE OF THE MOST CREATIVE PHASES IN HUMAN
HISTORY, WHERE SCIENCE, TECHNOLOGY, AND COMMUNICATIONS ADVANCE AT
BREATHTAKING SPEED AND OFFER UNMATCHED OPPORTUNITIES FOR POLITICAL
CONSENSUS AND RESPONSIBLE CHANGE. WE HAVE NEW TOOLS AT OUR DISPOSAL,
AND A VASTLY INCREASED UNDERSTANDING THAT OUR STRENGTH LIES IN WORKING
TOGETHER TO OVERCOME THE THREATS FACING OUR PLANET.THE ACTIONS WE TAKE
AND INVESTMENTS WE MAKE IN THE DECADES AHEAD WILL DETERMINE BOTH OUR
OWN EVOLUTION AND THAT OF FUTURE GENERATIONS.
OUR FATES ARE INTERTWINED. WE OWE IT TO EACH OTHER,AND TO OUR CHILDREN
AND THEIR CHILDREN, TO COMBINE FORCES AND ENSURE A SUSTAINABLE FUTURE
ON EARTH.
MOHAMED T. EL-ASHRY
CHIEF EXECUTIVE OFFICER AND CHAIRMAN
GLOBAL ENVIRONMENT FACILITY
THE CHALLENGE OF SUSTAINABILITY
G l o b a lE n v i r o n m e n tFa c i l i t yISBN 1-884122-79-5
GEF
G l o b a lE n v i r o n m e n tFa c i l i t y

THE HUMAN COMMUNITY FACES AN ARRAY OF CHOICES
ABOUT THE QUALITY OF OUR LIVES AND THE STATE OF
THE GLOBAL ENVIRONMENT. EACH OF THOSE CHOICES
WILL HELP TO DETERMINE WHAT KIND OF WORLD OUR
CHILDREN AND GRANDCHILDREN WILL LIVE IN . . .
THE LEGACY IS LARGELY OURS TO SHAPE.
KOFI ANNAN
U.N. SECRETARY GENERAL
For more information contact:
Hutton Archer
Senior External Affairs Coordinator
Global Environment Facility
1818 H Street NW
Washington, DC 20433 USA
Tel: 202 473 0508
Fax: 202 522 3240
Internet: www.gefweb.org
THE CHALLENGE OF SUSTAINABILITY AN ACTION AGENDA FOR THE GLOBAL ENVIRONMENT

THE CHALLENGE OF SUSTAINABILITY AN ACTION AGENDA FOR THE GLOBAL ENVIRONMENT
F O R E W O R D B Y
KOFI ANNANU.N. SECRETARY GENERAL
WASHINGTON, D.C.
G l o b a lE n v i r o n m e n tFa c i l i t y
© Copyright 2002 Global Environment Facility1818 H Street, N.W.Washington, D.C. 20433, USA
All rights reserved. Published September 2002Printed in the United States of America
Rights and permissions
The text of this publication may be reproduced in whole or in part and in any form for educational or nonprofit uses, without specialpermission, provided acknowledgment of the source is made. The Global Environment Facility Secretariat would appreciate receiving acopy of any publication that uses this book for its source. Copies may be sent to the GEF Secretariat in care of the address above.
No use of this publication may be made for resale or other commercial purposes without prior written consent of the GlobalEnvironment Facility Secretariat.
All images remain the sole property of their source and may not be used for any purpose without written permission from the source.
The designations of geographical entities in this document, and the presentation of materials, do not imply the expression of any opin-ion whatsoever on the part of the GEF concerning the legal status of any country, territory, or area, or its authorities, or concerning thedelimitation of its frontiers or boundaries.
The opinions of guest contributors do not necessarily reflect those of the GEF Secretariat.
Cover photo: Roberto Arakaki, Image StateDesign: Patricia Hord.Graphik Design
ISBN 1-884122-79-5
CONTENTS
FOREWORD v i i iKO F I A N N A N , U . N . S E C R E TA RY G E N E R A L
INTRODUCTION xM O H A M E D T. E L - A S H RY,
C H I E F E X E C U T I V E O F F I C E R A N D C H A I R M A N , G E F
1 WATER: VALUING A PRECIOUS RESOURCE 1
2 LAND, WATER, AND FOOD PRODUCTION: 19MOVING TOWARD SUSTAINABILITY
3 FORESTS AND BIODIVERSITY: 37SAVING VALUABLE ASSETS
4 ENERGY: POWERING 57SUSTAINABLE DEVELOPMENT
5 FINANCING THE ENVIRONMENT AND 75SUSTAINABLE DEVELOPMENT
CONCLUSION 88M O H A M E D T. E L - A S H RY
INDEX 94
ACKNOWLEDGMENTS 101
PHOTO CREDITS 102
v
vi
TABLES
Table 3.1 Forest Area by Region, 2000 39Table 3.2 Annual Change in Forest Area, 1900–2000 40Table 3.3 GEF Projects in Globally Significant Biological Areas (FY 2001) 48 Table 5.1 Trends in Resource Flows to Developing Countries, 1991–2001 83
FIGURES
Figure 1.1 The Glass Is Half Full—Water Use, 1900–2000 3Figure 1.2 Agriculture Dominates Freshwater Use 3Figure 1.3 Projected Water Scarcity, 1995–2025 3
Figure 2.1 World Demand for Cereals, 1997 and 2020 20Figure 2.2 Increased Cereal Demand, 1997–2000 20Figure 2.3 World Demand for Meat, 1997 and 2020 20
Figure 3.1 Countries with the Largest Shares of Forests, 2000 39Figure 3.2 Forests in Protected Areas, 2000 40
Figure 4.1 World Energy Consumption by Fuel Type, 1998 59Figure 4.2 Growth in Primary Energy Consumption, 1860–2060 59Figure 4.3 Per Capita Energy Use, 1990–2050 60Figure 4.4 Projected Growth in Renewable Energy Use, 1860–2060 60
Figure 5.1 Single Greatest Threat to Future Generations 76Figure 5.2 Share of Respondents Who Identified Environmental Pollution
as Single Greatest Threat to Future Generations, 1997–2001 76
vii
BOXES
Box 1.1 Millennium Declaration on Water Resources 2Water Targets for 2015 15
Box 2.1 Conflicts and Natural Disasters 22 Box 2.2 A New Era for Rice 30
Land, Water, and Food Production Targets for 2015 34
Box 3.1 Forests as Habitats 38Box 3.2 Upsetting Nature’s Balance 42Box 3.3 The Mesoamerican Biological Corridor 45
Forest and Biodiversity Targets for 2015 52
Box 4.1 The Climate Challenge 62Box 4.2 Renewable Energy: Key to Poverty Reduction 71
Energy Targets for 2015 70
Box 5.1 Costa Rica’s Ecomarkets Program 77Box 5.2 Sustainable Development Is Good Business 79Box 5.3 Trends in ODA and Foreign Direct Investment 80
Millennium Development Goals 91
FOREWORD
he human community faces an array of choices about the quality of our livesand the state of the global environment. Each of those choices will help todetermine what kind of world our children and grandchildren will live in. One
possibility is that at long last we will pave a path toward environmental steward-ship and sustainable development. But it is also quite possible that we will travela less enlightened course, running down the earth’s natural capital and severelylimiting the choices our descendants will face.
Over the next half-century, we could be:
� A world in which economic and social needs are balanced with the capacityof the earth’s resources and ecosystems—or a world impoverished by envi-ronmental degradation, where poverty and hunger still afflict a billion ormore people.
� A world that properly values water and manages it sustainably—or one thatfaces widespread water scarcity.
� A world making the transition to renewable energy sources—or one stilldependent on fossil fuels, and where climate change is destabilizingmany nations.
� A world in which preventable diseases have been largely eliminated—or onein which millions of children continue to die annually because they don’thave access to clean drinking water and adequate sanitation.
T
viii
ix
� A world of responsible consumption and pro-duction patterns—or one still inundated bywaste and poisoned by hazardous materials.
� A world where rich-country markets are fullyopen to labor-intensive products from poorcountries, and where trade is making significantinroads against poverty—or a world that remainsdeeply divided between rich and poor.
The legacy is largely ours to shape, and the GlobalEnvironment Facility (GEF) will continue to play animportant role in this quest. A strategic alliance ofthe U.N. Development Programme, the U.N. Environ-ment Programme, and the World Bank, the GEF is aunique and innovative source of funding mandatedto make the connection between local and globalenvironmental challenges, and between nationaland international efforts, in order to conserve bio-diversity, reduce the risks of climate change, protectthe ozone layer, clean up international waters, stopland degradation, and eliminate persistent organicpollutants. Even though its portfolio is still young,and overall funding has been relatively modest, theGEF has made a difference—for example in reduc-ing ozone-depleting substances in Eastern Europeand Central Asia, in combating deforestation and
desertification in Sub-Saharan Africa, and in bring-ing renewable energy to people in developing countries, many of whom live far from existingpower grids.
The Challenge of Sustainability: An Action Agendafor the Global Environment has two goals: first, toassess whether the battle to overcome the world’senvironmental problems is gaining strength, andsecond, to offer ideas and strategies for the next 10years. It focuses on the key issues of energy, forests,biodiversity, land and water degradation, andfinancing. And it proposes practical solutions thatbuild on the World Summit on SustainableDevelopment and the experiences since the EarthSummit in Rio de Janeiro in 1992. Readers may notagree with every strategy put forth in this report.But we can and must agree on the goals: an end toglobal poverty and hunger, renewed respect for theenvironment, and the urgent need for all actors tofulfill their responsibilities to give this generationand succeeding generations a chance to live withdignity and hope for the future.
Kofi AnnanU.N. Secretary General
INTRODUCTION
e have, in the last decade, seen environmental problems mount—from extreme weather patterns and melting glaciers that point to a
changing climate, to air and water pollution that threatens humanhealth, to deforestation and land degradation that are undermining
the earth’s capacity to sustain humanity.
But we have also seen society marshal its resources in an attempt to meet thesechallenges. Our initial response was slow; it now needs to gather speed as theproblems—and the imperative that we meet them—are becoming more clearto us. We now have new tools, and a vastly increased understanding that ourstrength lies in working together to overcome the threats facing our planet. Wecan build on these strengths and move ahead with confidence that sustainabledevelopment goals are indeed achievable.
This new drive for global sustainability should be rooted in the growing recog-nition of the strong links between the environment and development. A cleanenvironment is essential for both development and poverty eradication. Unsafewater kills 3 million people each year, many of them children. Sickness andpoor health mean lost production for the people and countries that can leastafford it. Air pollution also damages the crops, forests, rivers, and lakes thatcountries need for their economic development.
Environmental and economic inequities are closely interrelated. Poverty pushesthe poor into degraded lands and polluted slums, where economic opportuni-ties are minimal. Development that subsidizes sewers, piped water, and electric-ity for the middle classes and leaves the poor to fend for themselves is more
W
x
than unfair; the burdens this places on the poor arereflected in higher health costs, lowered productivity,and the desperate hopelessness that can lead topolitical instability. A deeper appreciation of this eco-nomic and environmental interdependence is essen-tial to tackling the global environmental problemsthat cloud our future and endanger our health, oursecurity, our natural endowment, and the beautyand splendor of life on earth.
NEW STRENGTHS,REAL ACCOMPLISHMENTS
A decade after the 1992 Rio Earth Summit, we arestill struggling to meet and overcome the world’senvironmental problems, but we are also gaining
strength. And our new strengths have been under-pinned by real accomplishments. The internationalcommunity has built new structures of cooperationto meet many of the threats facing our environ-ment. Some governments have extended the timehorizons of their development plans to ensure thatsustainability underpins future growth. A number ofcorporations have made eco-efficiency the founda-tion for their operations. Hard work has translatedinto laws and treaties, and more hard work hasgiven those laws and treaties the substance andteeth needed to make a difference.
The strength of cooperation first found its voice inthe treaties designed to slow and reverse the grow-ing hole in the stratospheric ozone layer. The 28national signatures on the March 1985 ViennaConvention for the Protection of the Ozone Layer
T H E C H A L L E N G E O F S U S TA I N A B I L I T Yxii
marked an important milestone: the first time thatnations agreed to tackle a global environmentalproblem before its effects were completely clear.Two years later, general obligations in the conven-tion were further elaborated through the 1987Montreal Protocol on Substances that Deplete theOzone Layer. By May 2000, 175 countries hadsigned on to the Protocol. Developed countrieslargely eliminated chlorofluorocarbons andhalons—the two major ozone-threatening gases—by the end of 1995. And many developing countriesare now ahead of the timetable that gives themuntil 2010 to phase out these two substances.
The Montreal Protocol is a model for internationalenvironmental agreements. It is flexible and adapt-able, and recognizes the different needs of devel-oped and developing nations. The protocol is thefirst treaty that incorporates the provision offinancing for implementation. The agreement isbased on partnership, not confrontation, and hasproven an effective way to support economicgrowth in transitional economies and developingnations.
The lessons we have learned from protectingthe ozone layer are being tapped in the effort toreduce the use of energy sources that fuel globalwarming. Wind, solar, and even tidal power offerboth clear commercial opportunities and real envi-ronmental benefits. Governments, multilateral assis-tance agencies, and private investors are buildingclean new energy systems around the world. Windpower generation capacity has increased from nearzero to over 1,700 megawatts. Virtually unknownin 1992, solar home systems using photovoltaictechnology now provide power to more than 1 million rural households. And at least 30 majorfirms have committed to investing $10 to $15billion in renewable energy over the next five years.Between $500 million and $1.5 billion of renewableenergy projects in developing countries are beingfinanced each year, a market with an annualgrowth of 5 to 10 percent.
Nations are also learning that there is a comparativeadvantage to working together on the problemsthey share. The 17 Black Sea and Danube Riverbasin countries, for example, have adopted anaction plan that commits them to the policy, legal,and institutional reforms needed for their cleanupeffort; they have pledged to install clean technologyand reduce organic and toxic discharges by 30 per-cent in a decade. The 10 Nile River basin countrieshave established priorities and joint commitmentsfor action to sustainably manage this critical ecosys-tem. And six Central American countries have joinedMexico in linking their national parks, biological andforest reserves, wildlife refuges, and biospherereserves in the Mesoamerican Biological Corridor—the first biological preservation project to crossnational borders and encompass an entire region.
NEW VOICES, NEW TOOLS,NEW UNDERSTANDING
A hallmark of the past decade has been the recogni-tion that the key actors, operational tools, and politi-cal know-how have changed. New voices havejoined the effort to forge a more sustainable form ofdevelopment and help lead the transition to sustain-ability. And science has given us both new under-standing and new tools that have vastly increasedour ability to address environmental problems.
The private sector is also playing an increasingly con-structive role, an acknowledgment that preservingthe environment is both good business and a moralobligation. Companies such as Royal Dutch Shell,DuPont, and BP Amoco are working to reduce theircompanies’ negative impact on climate change andto increase the options for cleaner energy in bothdeveloped and developing economies. Many firmshave agreed to live by product certification standards.Home Depot, Starbucks, and the British do-it-your-self chain B&Q have focused on environmentallyfriendly products. CNN founder Ted Turner donated
I N T R O D U C T I O N xiii
$1 billion to create the U.N. Foundation, whosemission is to promote a more peaceful, prosperous,and just world by supporting the goals and objec-tives of the U.N. The Bill and Melinda GatesFoundation helped launch the Global Alliance forImproved Nutrition, an innovative public-privatepartnership that seeks to provide cost-effective foodfortification that promises to improve the health,cognitive development, and productivity of peoplewho live and work in developing countries.
Acting largely through nongovernmental organiza-tions (NGOs), civil society has organized around anew agenda of eradicating poverty and protectingthe earth’s future. Today’s NGOs are skillful com-municators, mediators, managers, and intermedi-aries. They are proficient at using the Internet ande-mail to create international information exchangenetworks such as the Climate Action Network,which links more than 250 international andnational organizations that are actively involved inefforts to moderate climate change. Jordan’s RoyalSociety for the Conservation of Nature is managingconservation of the Dana and Azraq protectedareas. And miles away, in the Mankote, St. Lucia’slargest mangrove forest, the Caribbean NaturalResources Institute has developed a managementplan designed to save the forest while maintainingthe incomes of local charcoal producers.
The Global Environment Facility (GEF) is one of thelinchpins of these new cooperative efforts. The GEFbegan as a pilot venture in 1991 and was formallylaunched in 1994. It finances actions to improve theglobal environment in several key areas—biodiversity,climate change, international waters, ozone layerdepletion, land degradation, and persistent organicpollutants. In its first decade, GEF allocated $4.2 bil-lion in grants, supported by $12.4 billion in addi-tional financing, to more than 1,000 projects in 160developing and transition nations. In addition, GEFhas made more than 3,000 small grants, up to$50,000 each. GEF contributes to global sustainabili-ty through partnerships with governments and NGOsat the local, national, and regional levels. It also
engages the private sector by removing barriers toprivate investment, promoting market transforma-tion, using new approaches such as investmentfunds, and building long-term partnerships. GEFmaximizes its impact by supporting the long-termsustainability of investments, encouraging replication,and developing new tools for financial assistance.
OUR PLANET’S FUTURE RESTS ON ITS PAST
The 1992 Rio Earth Summit heralded an unprece-dented era of environmental awareness, but themomentum did not always translate into real actionon the ground. Progress has been slower thanexpected, so much must be done to overcome thetwentieth-century legacy of environmental degrada-tion that continues to plague us:
� Every year about 15.2 million hectares of forest-ed land in tropical countries are cut down andconverted to other uses. The fragmented foreststhat remain are becoming too small to supportviable animal or bird populations.
� Nearly 2 billion people cope daily with theproblem of finding enough water, and as manyas 3.5 billion—almost half the world’s projectedpopulation—could face water shortages by2025. Africa is at particular risk.
� Premature death and illness from environmentalhealth risks still account for 20 percent of theburden of disease in the developing countries.
� At a time when nearly 1 billion people dependon fish as their primary source of protein, theoutlook for world fisheries has worsened. Some75 percent of the world’s marine fisheries werejudged to be at risk in the 1990s.
� Long-term gains in food production, especiallyin developing countries, are threatened by landdegradation and by growing competition forwater from industrial and municipal sources.
� Most of the world’s scientists agree that green-house gases—notably carbon dioxide from the
T H E C H A L L E N G E O F S U S TA I N A B I L I T Yxiv
burning of fossil fuels—are contributing to awarming climate, which causes shifting precipi-tation patterns, melting glaciers, and rising sealevels. Developing countries—especially in thetropics and sub-tropics of Africa, Asia, and LatinAmerica—are most at risk, and many areunequipped to adapt to these changes.
One clear lesson of the past decade is that we areall in this together. Both our immediate health andour long-term well-being are linked with that ofother species and systems that share and shape ourplanet. And when we think about nature’s gifts toour medicine chest—penicillin, taxol, quinine, andcodeine, among other medicines in common use—we can only guess at the significance of losing theplants or insects scientists have not yet identified.
The loss of such potential opportunities could wellimpact our future well-being, but the threats to lifeas we now know it are just as sobering. Greenhousegases—from power plants, automobiles, and burn-ing forests—are agents of climate change. Andclimate change that disrupts weather patterns canraise sea levels, lower agricultural yields and, infostering the spread of infectious diseases, imperilhuman health. Environmental security, then, is astate of dynamic equilibrium between the appetiteof mankind and the resources of nature; it is not aconstruct that any one community or country canassure by itself.
BUILDING ON OUR STRENGTHS
This book measures our new strengths and determi-nation. The chapters that follow examine five of thekey challenges we will all face in the comingdecades.
The degradation of marine and freshwater resourcespresents an enormously complex challenge. AsChapter 1 illustrates, partnerships—like the cooper-ative efforts now under way to clean up the Black
Sea ecosystem and sustainably manage the NileRiver basin—are the most effective ways to remedyunsustainable uses of large freshwater and saltwa-ter systems.
Food production must increase to feed a growingglobal population, but ignoring the negative envi-ronmental effects of some agricultural practices willonly make the challenge more difficult. Chapter 2focuses on integrated land and water strategies,good management practices, environmentallysound technologies, and policies that can supportincreases in food production without putting addi-tional stresses on land and water resources.
Chapter 3 provides a frame of reference forresponding to the significant changes in the envi-ronmental, economic, and political forces thatgovern forests. Today, questions of institutions andthe enabling environment, international standards,and transparency are key issues. Countries nowassert their rights to sovereignty over their forestsmore forcefully than in the past. Some countries aredevolving control of forest resources to local com-munities. The need to manage forests within alarge-scale integrated framework has been widelyrecognized within the past decade, and internation-al mechanisms have been established to improveinteragency collaboration on forest issues.
Chapter 4 describes how government and businessleaders have changed their thinking about sustain-able energy development since the mid-1980s.Actions have centered on three main areas:improved efficiency, increased reliance on renew-able energy sources, and efforts to provide morethan 400 million rural households with access tomodern energy services.
Finally, Chapter 5 explores the new financial resourcesand mechanisms that are urgently needed to supportthe global environmental agenda and make progresstoward achieving the Millennium DevelopmentGoals. Developed countries have a responsibility, atleast a moral one, to provide additional financial
I N T R O D U C T I O N xv
resources to support sustainable development, toeradicate poverty, and to improve environmentaland human health conditions.
Pursuing a path of sustainable development whileprotecting the global environment and eradicatingpoverty is a complex undertaking that will requireunprecedented levels of effort, knowledge, andinternational cooperation. This endeavor dependson the leadership of many people and nations andthe balancing of millions of actions and interactionsthroughout the world. The agenda is truly a globalone, and the international community must findways to re-energize its pursuit of global sustainabilityand the protection of our global commons. Theproblems we collectively face are significant—andwill deeply challenge our ingenuity and commitment—but there are promising and positive trends thatcan focus and sharpen our efforts.
Mohamed T. El-AshryChief Executive Officer and ChairmanGlobal Environment Facility (GEF)

1
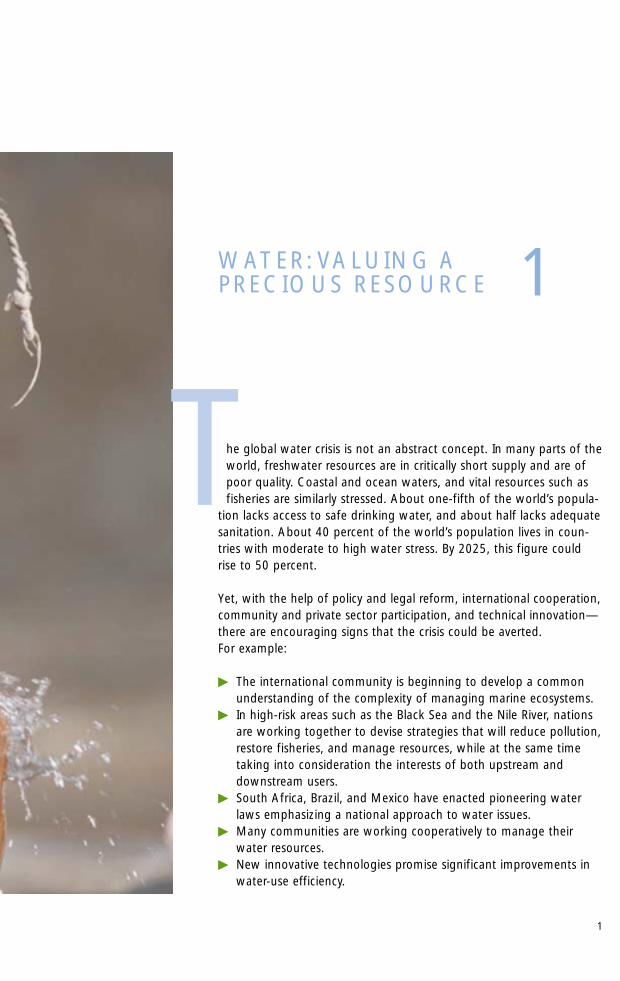
WATER: VALUING A PRECIOUS RESOURCE
he global water crisis is not an abstract concept. In many parts of theworld, freshwater resources are in critically short supply and are ofpoor quality. Coastal and ocean waters, and vital resources such asfisheries are similarly stressed. About one-fifth of the world’s popula-
tion lacks access to safe drinking water, and about half lacks adequatesanitation. About 40 percent of the world’s population lives in coun-tries with moderate to high water stress. By 2025, this figure couldrise to 50 percent.
Yet, with the help of policy and legal reform, international cooperation,community and private sector participation, and technical innovation—there are encouraging signs that the crisis could be averted. For example:
� The international community is beginning to develop a commonunderstanding of the complexity of managing marine ecosystems.
� In high-risk areas such as the Black Sea and the Nile River, nationsare working together to devise strategies that will reduce pollution,restore fisheries, and manage resources, while at the same timetaking into consideration the interests of both upstream anddownstream users.
� South Africa, Brazil, and Mexico have enacted pioneering waterlaws emphasizing a national approach to water issues.
� Many communities are working cooperatively to manage theirwater resources.
� New innovative technologies promise significant improvements inwater-use efficiency.
T1
� International forums continue to emphasize theimportance of management and policy reforms,particularly reducing water subsidies, taking amore integrated approach to water resourcesmanagement, and using catchments and basinareas as natural management units.
While encouraging, these efforts are still insuffi-cient. Much more needs to be done in five keyareas: full-cost water pricing and improved incen-tives to encourage private sector participation;increased investments for water, sanitation, andhealth for the poor; greater multinational coopera-tion on transboundary water issues; stronger effortsto prevent and remedy pollution in coastal waters;and greater emphasis on cross-sectoral approachesand decentralized decision-making on water basinmanagement.
In the Millennium Declaration, the internationalcommunity acknowledged the importance of globalaction to increase and protect water resources (Box1.1). This declaration cogently describes the linksbetween poverty, hunger, and water security andemphasizes the critical role of improved waterresources management in sustainable development.Increasing the income levels of the poor will requiremore water use and the intensive development of
marine ecosystems. Growing and harvesting addi-tional food will require more irrigation and greaterexploitation of inland and ocean fisheries. Providingmore people with safe drinking water will requirenot only more water, but also enormous invest-ments in sewage collection and treatment systemsto reduce disease. Achieving these goals depends onaccess to water resources—not just access to water.
THE GLOBAL WATER CRISIS
The water crisis has many dimensions and variesconsiderably across regions. Water supplies arescarce in some regions and relatively abundant inothers. And though water quality has improved inmany developed countries, it is still a significantproblem in most developing countries. The effectsof long-term climate change are also likely to varysignificantly across regions.
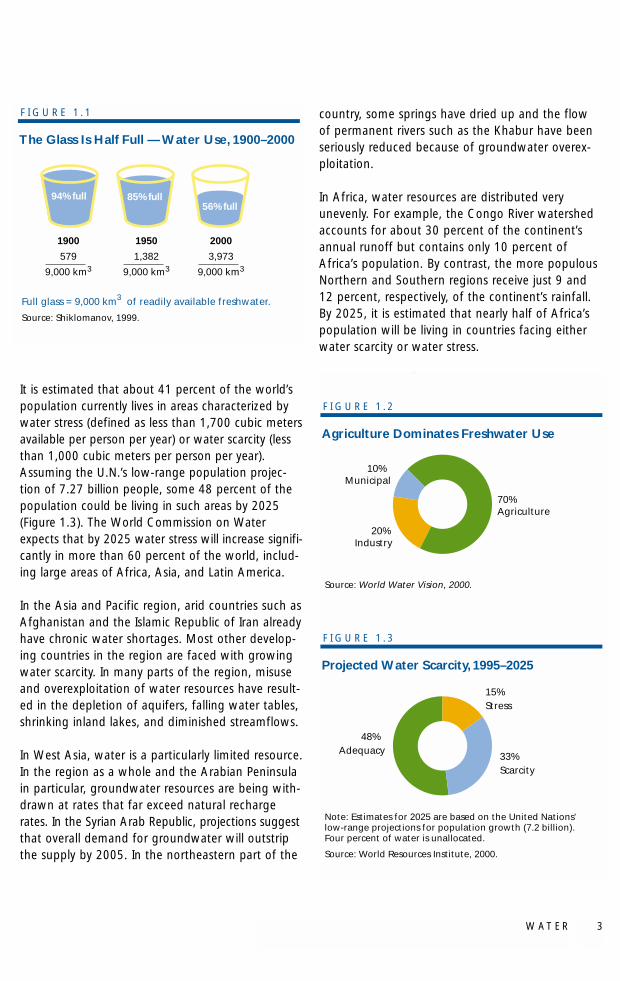
Water Scarcity. Over the past century, world popu-lation tripled, but the aggregate use of water rosesixfold. Just 35 years ago, people were using aboutone-fourth of readily available freshwater. Todaythey are using roughly half. (Figure 1.1). Most fresh-water is used for agriculture (Figure 1.2).
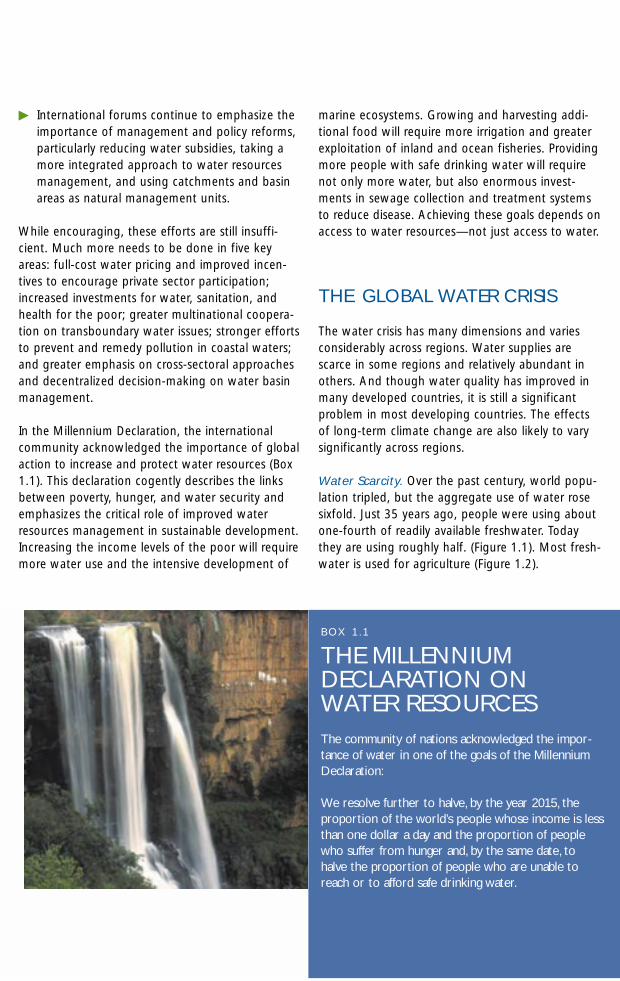
B OX 1 . 1
THE MILLENNIUMDECLARATION ONWATER RESOURCESThe community of nations acknowledged the impor-tance of water in one of the goals of the MillenniumDeclaration:
We resolve further to halve, by the year 2015, theproportion of the world’s people whose income is lessthan one dollar a day and the proportion of peoplewho suffer from hunger and, by the same date, tohalve the proportion of people who are unable toreach or to afford safe drinking water.
W AT E R 3
It is estimated that about 41 percent of the world’spopulation currently lives in areas characterized bywater stress (defined as less than 1,700 cubic metersavailable per person per year) or water scarcity (lessthan 1,000 cubic meters per person per year).Assuming the U.N.’s low-range population projec-tion of 7.27 billion people, some 48 percent of thepopulation could be living in such areas by 2025(Figure 1.3). The World Commission on Waterexpects that by 2025 water stress will increase signifi-cantly in more than 60 percent of the world, includ-ing large areas of Africa, Asia, and Latin America.
In the Asia and Pacific region, arid countries such asAfghanistan and the Islamic Republic of Iran alreadyhave chronic water shortages. Most other develop-ing countries in the region are faced with growingwater scarcity. In many parts of the region, misuseand overexploitation of water resources have result-ed in the depletion of aquifers, falling water tables,shrinking inland lakes, and diminished streamflows.
In West Asia, water is a particularly limited resource.In the region as a whole and the Arabian Peninsulain particular, groundwater resources are being with-drawn at rates that far exceed natural rechargerates. In the Syrian Arab Republic, projections suggestthat overall demand for groundwater will outstripthe supply by 2005. In the northeastern part of the
country, some springs have dried up and the flowof permanent rivers such as the Khabur have beenseriously reduced because of groundwater overex-ploitation.
In Africa, water resources are distributed veryunevenly. For example, the Congo River watershedaccounts for about 30 percent of the continent’sannual runoff but contains only 10 percent ofAfrica’s population. By contrast, the more populousNorthern and Southern regions receive just 9 and12 percent, respectively, of the continent’s rainfall.By 2025, it is estimated that nearly half of Africa’spopulation will be living in countries facing eitherwater scarcity or water stress.
1900
579
9,000 km3
1950
1,382
9,000 km3
2000
3,973
9,000 km3
94% full 85% full56% full
Full glass = 9,000 km3 of readily available freshwater.
Source: Shiklomanov, 1999.
The Glass Is Half Full — Water Use, 1900–2000
F I G U R E 1 . 1
,
Source: World Water Vision, 2000.
70%Agriculture
10% Municipal
20%Industry
Note: Estimates for 2025 are based on the United Nations’low-range projections for population growth (7.2 billion). Four percent of water is unallocated.
Source: World Resources Institute, 2000.
33% Scarcity
48% Adequacy
15%Stress
Agriculture Dominates Freshwater Use
F I G U R E 1 . 2
Projected Water Scarcity, 1995–2025
F I G U R E 1 . 3
T H E C H A L L E N G E O F S U S TA I N A B I L I T Y4
Water scarcity carries the potential to increase ten-sions among nations that share water basins. About43 percent of the world lives in multicountry basins,which cover almost half of the planet’s land surfaceand contain over 80 percent of the freshwater riverflow. There are 261 major basins and countless aquifersthat cross political boundaries. Most of the riverbasins in South Asia, South America, and Africa fallinto this category. About 50 African rivers—includ-ing the Nile, Niger, Volta, and Zambezi—run throughtwo or more countries.
As a result of manmade diversions and extractions,many major rivers no longer reach the sea duringthe dry season, including the Colorado, Huang He(Yellow), Ganges, Nile, Syr Darya, and Amu Darya.The Amu Darya and Syr Darya rivers once con-tributed 55 billion cubic meters of water annually tothe Aral Sea, but diversions for irrigation havereduced this volume to 7 billion cubic meters, withdevastating consequences for the Aral Sea.
Water Quality. About 20 percent of the world’spopulation lacks access to safe drinking water, andabout 50 percent lacks adequate sanitation. Sincethe 1970s, levels of suspended solids in Asia’s rivershave risen by a factor of four: they typically contain4 times the world average and 20 times OECDlevels. The fecal coliform count in Asia’s rivers is50 times higher than recommended by the WorldHealth Organization (WHO) guidelines. In LatinAmerica, only about 10 percent of sewage receivesany treatment; sewage pollution of groundwater isalso common in many developing countries.
Polluted water is estimated to affect the health ofabout 1.2 billion people every year. It contributesannually to the death of 15 million children underthe age of five, and is responsible for 1.5 billioncases of intestinal parasites, 1 billion cases of diar-rheal diseases, and 400 million cases of malaria.The WHO reports that about 3.5 million people diefrom these diseases each year—2.2 million fromdiarrheal diseases alone. During the month ofMarch 2002, 100,000 new cases of dengue feverwere reported in Rio de Janeiro during a wet season,
after decades of control. In Africa alone, the annu-al costs of malaria are estimated at $2 billion; glob-ally, lost productivity from preventable water-relat-ed diseases exceeds $100 billion each year.
Sewage pollution is the largest water quality prob-lem, but not the only one. In addition:
� Overuse of pesticides has degraded waterquality in many areas.
� Industrial wastes have led to significant waterpollution, contaminating water with heavy met-als (lead, mercury, arsenic, and cadmium) andpersistent organic compounds.
� Over-abstraction of groundwater has led to sea-water intrusion along shorelines, causing salin-ization of coastal agricultural lands.
Non-native invasive species. In many areas, includ-ing Lake Victoria and the Black Sea, non-nativeinvasive species have had devastating impacts. Theaccidental introduction of a jellyfish-like creature intothe Black Sea in 1982 soon dominated the aquaticfood web, where it directly competed with native fishfor food. This, combined with overfishing and otherfactors, collapsed the Black Sea fish catch to one-third of its former volume by 1992. In Lake Victoria,the introduction of the Nile perch and Nile tilapia hadmajor consequences on the lake’s native fish stocks.Invasive plants such as water hyacinths also haveproven to be a major problem in many rivers andlakes. As described later in this chapter, strategicpartnerships have helped reverse these trends.
Land-based sources of marine pollution. Roughly75 percent of global pollution of marine waters isfrom land-based sources. Pollutants include toxicchemicals (organic chemicals, heavy metals, andradioactive waste), nutrients (agricultural fertilizersand sewage), sediments, and solid waste. Nutrientpollution, especially from nitrates and phosphates,is rising dramatically, largely as a result of the exces-sive use of fertilizers, growth in the quantities ofdomestic and industrial sewage, and increasedaquaculture, which releases considerable amountsof waste directly into the water.
W AT E R 5
Regional seas such as the Baltic and Black Seasreceive massive amounts of pollutants fromwatersheds that cover a wide geographic area:
� Pollution in the Baltic Sea has been a seriousproblem for over 50 years. Contributing factorsinclude a high population (about 77 million peo-ple in the basin), inadequate wastewater treat-ment facilities, and emissions from industrialenterprises. Eutrophication and concentrationsof toxic organic compounds are growing.
� The Danube, Dnieper, Dniester, and Don riverscarry nutrients, oil, heavy metals, pesticides, andother pollutants into the Black Sea. At risk arethe 170 million people who live in the catch-ment area. In addition, eutrophication and over-fishing have decimated the fishery.
Coastal and offshore fisheries. Today the capacityof the global fishing fleet is about 40 percentgreater than global fisheries can support. Aided byhigh-technology fishing gear and other technical
advances, the global fishing fleet caught nearly105 million tons of fish in 1997, more than doublethe 50 million tons caught in 1975. The marinecatch has followed a predictable pattern: as fishingpressure in one region leaves major fish stocksdepleted or in decline, the global fleet increases itsactivities in other fishing regions around the world.
According to the Food and Agriculture Organizationof the United Nations (FAO), more than one-quarterof all fish stocks are already depleted, and almosthalf of all fish stocks are being fished at their bio-logical limit and are vulnerable to depletion.
Climate change and extreme weather events. Thedramatic increase in extreme weather events, includ-ing both floods and droughts, may be linked to cli-mate change. Between 1986 and 1995, economiclosses from natural disasters were estimated to beeight times higher than in the 1960s. The MunichReinsurance Company recorded 700 major disastersin 1998, compared with between 530 and 600 during previous years. Floods account for about
one-third of natural catastrophes, cause more thanhalf of the fatalities, and are responsible for aboutone-third of the economic losses. In addition, surfacewarming of the oceans could reduce phytoplanktonproductivity, which forms the basis of the entiremarine food chain.
Coral reefs. Coral reef systems are declining aroundthe world. While people are becoming aware thatthese systems are invaluable for sustaining poorcoastal communities in the tropics—and are themarine equivalent of rain forests in terms of shelter-ing immense biodiversity—little is being done toreduce human pressures.
Recent assessments have found that up to 60 per-cent of reefs worldwide are threatened by humanactivities. Overfishing, destructive fishing with explo-sives or poisons, sewage, and sedimentation areresponsible. In some countries, such as the Philippinesand Thailand, up to 80 percent of corals are alreadydegraded. Extensive coral bleaching also has recentlybeen linked to the warming of surface waters;these trends may be linked to climate change.
Several initiatives are under way to help slow thisdecline. The International Coral Reef Initiative, startedin 1995, stresses the need for integrated coastalmanagement to minimize the detrimental effects ofcoastal development. And at the national and local
levels, a number of governments and communitieshave taken steps to protect and restore coral reefs.
WATER, HEALTH,AND POVERTY
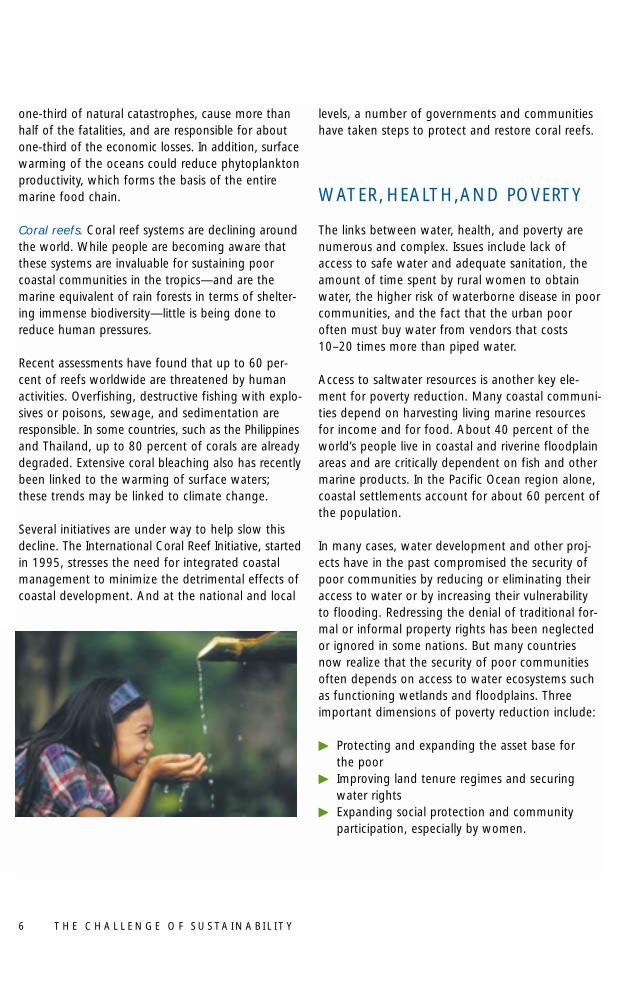
The links between water, health, and poverty arenumerous and complex. Issues include lack ofaccess to safe water and adequate sanitation, theamount of time spent by rural women to obtainwater, the higher risk of waterborne disease in poorcommunities, and the fact that the urban pooroften must buy water from vendors that costs10–20 times more than piped water.
Access to saltwater resources is another key ele-ment for poverty reduction. Many coastal communi-ties depend on harvesting living marine resourcesfor income and for food. About 40 percent of theworld’s people live in coastal and riverine floodplainareas and are critically dependent on fish and othermarine products. In the Pacific Ocean region alone,coastal settlements account for about 60 percent ofthe population.
In many cases, water development and other proj-ects have in the past compromised the security ofpoor communities by reducing or eliminating theiraccess to water or by increasing their vulnerabilityto flooding. Redressing the denial of traditional for-mal or informal property rights has been neglectedor ignored in some nations. But many countriesnow realize that the security of poor communitiesoften depends on access to water ecosystems suchas functioning wetlands and floodplains. Threeimportant dimensions of poverty reduction include:
� Protecting and expanding the asset base forthe poor
� Improving land tenure regimes and securingwater rights
� Expanding social protection and community participation, especially by women.
T H E C H A L L E N G E O F S U S TA I N A B I L I T Y6
W AT E R 7
FORGING A COMMONUNDERSTANDING
Countries are increasingly recognizing the advan-tages of working together to manage transbound-ary basins and marine ecosystems. Solutions havealready been developed to reduce ship-related pol-lution, expand general policies on wetlands, andcontrol movement and disposal of hazardouswastes.
A growing number of countries now support inter-national conventions that recommend norms, tar-gets, and compliance measures. The goal of theU.N. Convention on the Law of the Sea (UNCLOS)and the U.N. Convention on the Law of Non-Navigational Uses of International Watercourses isto implement global solutions through region-spe-cific partnerships among nations experiencing prob-lems. Regional cooperative efforts—such as thosetargeting the North Sea, the Danube River andBlack Sea, the Rhine basin, Lake Geneva, and theSenegal and Okavango River basins—are pragmaticmodels for how the world community can addressthese issues.
UNCLOS, which entered into force in 1994, setsout the rights and duties of states with respect tothe use and conservation of the oceans and theirresources. This document includes fundamentalglobal norms for conservation of marine resourcesand for preservation and protection of the marineenvironment. These global norms are translated intomore specific goals and commitments through spe-cialized agreements. For land-based sources of pol-lution, for example, the UNCLOS framework callson governments to establish detailed rules andguidelines and to harmonize policies at the regionallevel. Several regional seas agreements have specificlanguage on land-based pollution.
The U.N. Watercourses Convention adopted in1997 has yet to enter into force. It represents aglobal framework agreement designed to ensurethe safe use, development, conservation, manage-ment, and protection of international watercourses.
Non-binding “soft” law complements binding legalarrangements, helping countries overcome barriersto action. The Global Programme of Action (GPA)for the Protection of the Marine Environment fromLand-Based Activities is an example of such softlaw. Adopted in late 1995, GPA recognizes thatmore than 75 percent of coastal and marine waterpollution originates from land-based sources. Inaddition to pollution loading, GPA addresses themodification of physical habitat, such as wetlandsconversion, in establishing priority action areas anddefining strategies and programs to take advantageof numerous instruments that currently exist. Otherprominent international action programs have beenadopted in accordance with the FAO Code ofConduct for Responsible Fisheries.
In recent years, numerous international forums havesought to galvanize the plan of action originallyoutlined in Agenda 21, the global action plan forsustainable development adopted at the 1992 RioEarth Summit. In the freshwater area, these includethe deliberations of the World Commission onWater for the 21st Century, the second WorldWater Forum in the Hague in 2000, and theInternational Conference on Freshwater in Bonn in2001. In the marine area, an IntergovernmentalReview Meeting was held in Montreal in November2001 to assess progress under the GPA, and twoimportant conferences reviewed progress onaddressing marine fisheries and coastal manage-ment. The GPA Intergovernmental Review Meeting,the Reykjavik Conference on Responsible Fisheriesin the Marine Ecosystem, and the Paris Conferenceon Oceans and Coasts at Rio Plus Ten all confirmthe path laid out in Agenda 21.
These important global policy discussions, and thenew tools that have emerged from a decade ofexperience, have led to consensus on an actionagenda that addresses poverty reduction as well as water-related human health and governanceissues. The agenda covers both freshwater andmarine systems and fosters integrated approachesfor linking the two. It also recognizes the need toconsider land and water management within the
T H E C H A L L E N G E O F S U S TA I N A B I L I T Y8
framework of catchments, and supports furtherland tenure reforms and stakeholder participation.An important part of the agenda is the establish-ment of country-driven partnerships betweendeveloped and developing nations to foster thetransition to sustainable development that is con-sistent with the multiple-use, public goods natureof our planet’s water ecosystems.
PROMISING STRATEGIES
The many promising strategies for water resourcesmanagement include regional partnerships, policyand legal reforms, community participation, inte-grated approaches, and technical innovation.
Regional PartnershipsIn cases involving shared river basins and regionalseas, cooperation among affected nations is theonly way to successfully attack pollution and water
resource management problems. Two pioneeringexamples involve the Black Sea and Danube River,and the Nile River.
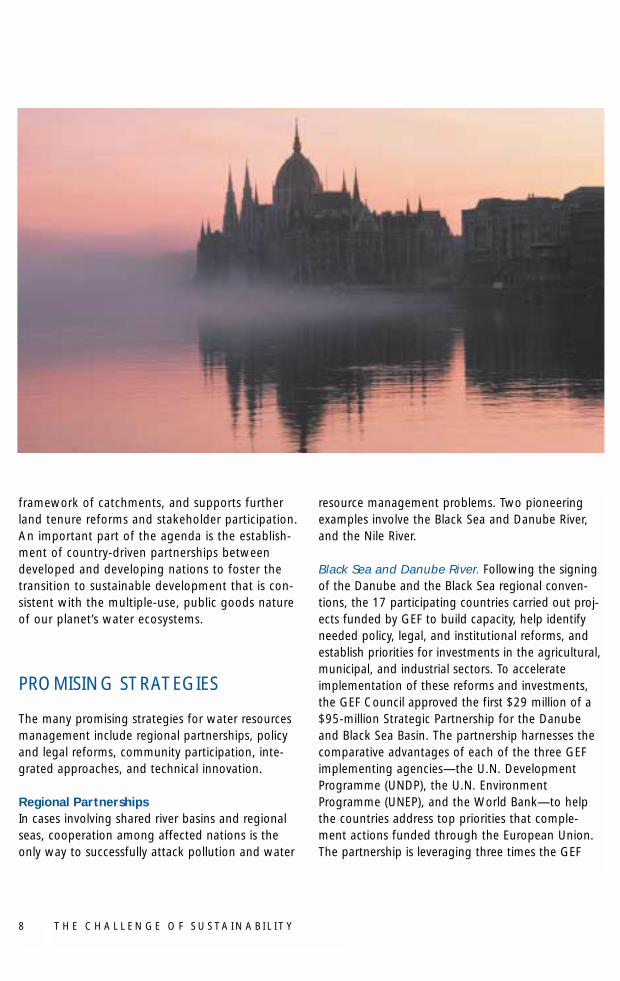
Black Sea and Danube River. Following the signingof the Danube and the Black Sea regional conven-tions, the 17 participating countries carried out proj-ects funded by GEF to build capacity, help identifyneeded policy, legal, and institutional reforms, andestablish priorities for investments in the agricultural,municipal, and industrial sectors. To accelerateimplementation of these reforms and investments,the GEF Council approved the first $29 million of a$95-million Strategic Partnership for the Danubeand Black Sea Basin. The partnership harnesses thecomparative advantages of each of the three GEFimplementing agencies—the U.N. DevelopmentProgramme (UNDP), the U.N. EnvironmentProgramme (UNEP), and the World Bank—to helpthe countries address top priorities that comple-ment actions funded through the European Union.The partnership is leveraging three times the GEF
W AT E R 9
contribution through cofinancing to assist the coun-tries in this region.
Wetlands were also considered a priority for acceler-ating restoration of the river and sea. In Romania,for example, wetlands between the villages of ChiliaVeche and Periprava were drained in the early1980s to increase agricultural production, which inturn destroyed fishery habitat and valuable reedstraditionally harvested by local people. After a GEF-supported project breached the dike in four places,20 species of fish returned to the wetlands in justtwo years, and the reed bed regained its formerhealth. A project on the island of Cernovka hadresults that were just as striking.
The Nile River. Following six years of preparation,the 10 Nile Basin countries launched the InternationalConsortium for Cooperation on the Nile in June2001. The consortium received pledges from thedonor community for an initial $140 million for theShared Vision Program of the Nile Basin Initiative,with an additional $3 billion anticipated in invest-ments for sustainable development. GEF played asignificant role by providing preparation funds forthe formulation of a GEF international waters proj-ect that would underpin the initiative.
The consortium produced a transboundary environ-mental analysis to build confidence and set priori-ties. This analysis was produced through a participa-tory process and included in-country consultations,national reports, and in-country interministerialcoordination. The Transboundary EnvironmentalAnalysis was approved by the Nile Council ofMinisters in March 2001, marking the first timesuch a substantive document received approval ofall Nile riparian countries. This catalytic processproved to be a turning point for expanding the dia-logue among the water ministries to include otherministries in each of the 10 countries as well asNGOs. The transboundary analysis process was sosuccessful that it became a model for other parts ofthe program piloted through the GEF. In 2001, theGEF Council approved the first tranche of $11 mil-lion for the Nile Basin Initiative.
Managing Large Marine EcosystemsLike the Black Sea and Nile River cases, partnershipsare being used to enhance the management oflarge marine ecosystems.
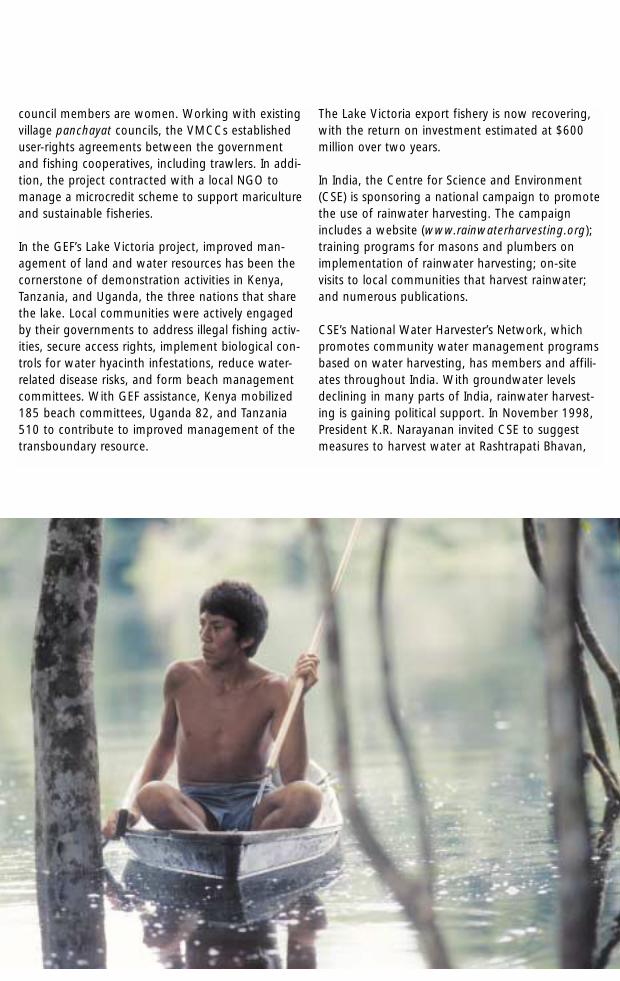
For example, the Benguela Current Large MarineEcosystem (BCLME), which is shared by Angola,Namibia, and South Africa, provides annual benefitsworth hundreds of millions of dollars. This globallyimportant fishery has been stressed by overfishing,oil and gas extraction, and diamond mining. But itis also threatened by extreme weather events. In the1980s, scientists found changes in the Benguelathat were related to increased temperatures and cur-rents. The fisheries and the region’s sensitive biodi-versity, including penguins and seals, were adverselyaffected.
The three BCLME countries received GEF assistancein 1998 to prepare a Strategic Action Programme ofreforms and actions to sustainably manage the largemarine ecosystem and its biological diversity. Thecountries will enact policy, legal, and institutionalreforms to jointly manage the large marine ecosys-tem and to address mineral and energy extractionissues. This international waters program wasformed in partnership with BENEFIT, a science-basedcapacity building program funded by Europeannations.
Legal ReformsSeveral nations—including South Africa, Brazil, andMexico—have recently enacted national water lawsthat take a new approach to water resources man-agement.
South Africa. South Africa’s 1998 National WaterAct is a pioneering effort to incorporate sustain-ability and international cooperation into a nationalwater law.
The law reflects the growing consensus amongSouth Africans that further expansion of water supplies is unrealistic. South Africa is already usingnearly 60 percent of its available water, comparedwith just 5–10 percent in countries such as Namibia
T H E C H A L L E N G E O F S U S TA I N A B I L I T Y10
and Botswana. Furthermore, South Africa’s waterresources are greatly influenced by climate andtopography. Only one-fourth of the nation hasperennial rivers, another fourth has rivers that onlyflow periodically, and half of the nation has riversthat only flow after infrequent storms.
The law’s objective is to “manage the quantity, qual-ity, and reliability of the nation’s water resources…to achieve optimum long-term, environmentally sustainable, social and economic benefit for societyfrom their use.”
Under the new law, water is specifically reserved fortwo priority uses: to meet basic human needs andto maintain ecological functions. Provisionally, thelaw allocates 25 liters a person a day to each indi-vidual for drinking, food preparation, and personalhygiene. The law also seeks to balance human usewith the long-term sustainability of aquatic andassociated ecosystems throughout South Africa.
Remaining water must be allocated so that all peo-ple have equitable access—for productive purposesand for benefits that flow from water use, such asjobs. The new law greatly broadens local participa-tion in water management decisions. Within anindividual watershed, the responsibility for allocat-ing water to users rests with local catchment man-agement agencies, which are expected to operatewith broad participation from all interested parties.
The Department of Water Affairs and Forestry isauthorized to develop water pricing strategies,such as charges to cover the full financial costs ofproviding access to water, including infrastructure;a watershed management charge, which can coverthe use of rivers and water bodies for both waterconsumption and waste disposal; and a resourceconservation charge, which can be applied when aparticular water use significantly affects others in thewatershed. Finally, the law recognizes the need tomanage transboundary water resources cooperatively.
Brazil. Brazil enacted a new water law in 1997 anda national system of water resource management
in 1998. Under the new law, Brazil adopted theriver basin as the basic territorial management unit.Rivers that lie wholly within a state are now theresponsibility of that state, while the federal govern-ment is responsible for rivers that cross more thanone state.
Basin committees for state and federal rivers arethe focal point for the development of a waterresources management system. Federal governmentapproval is not required, so basin committeesdecide how much and when to charge for theuse of rivers. They establish charging mechanisms,suggest values to be charged, and determine thecriteria for the distribution of costs linked to projectsthat have multiple uses or that are of common orcollective interest.
The pricing provisions of the law are intended topromote recognition that water is a real asset, makeconsumers aware of its economic value, motivate therational use of water resources, and obtain fundingfor programs and activities that are required in waterresource plans.
Mexico. In Mexico, the 1992 National Water Law isbased on an integrated ecosystem-based approachto the modernization of water resources manage-ment. The law authorizes the establishment of riverbasin councils to coordinate activities and produceagreements among the National Water Commission,other federal, state, and municipal agencies, andwater user representatives. The National WaterCommission also has reorganized its regional struc-ture, with boundaries based on river basins (seeChapter 2).
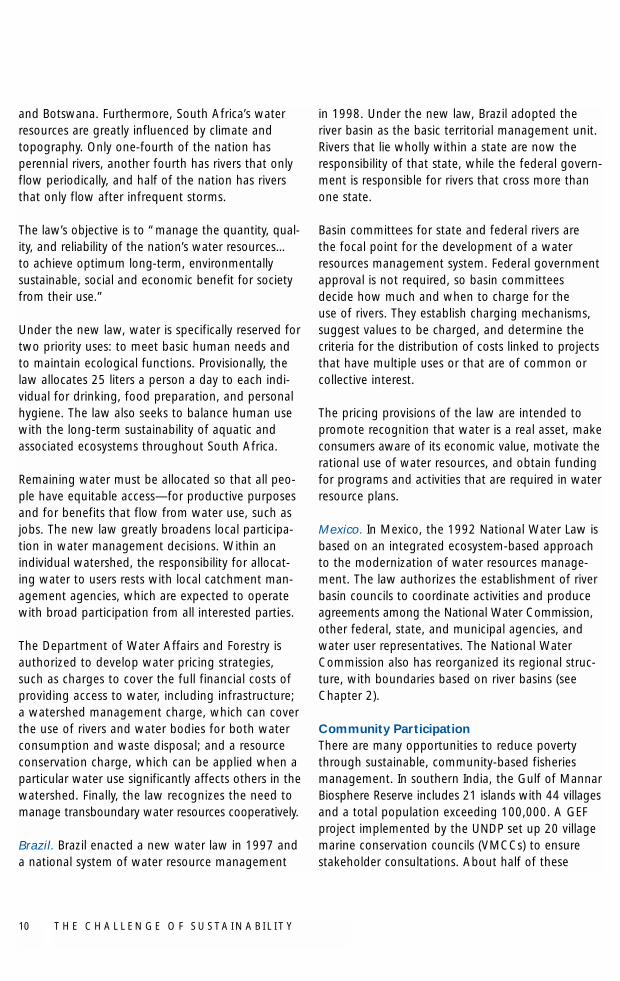
Community ParticipationThere are many opportunities to reduce povertythrough sustainable, community-based fisheriesmanagement. In southern India, the Gulf of MannarBiosphere Reserve includes 21 islands with 44 villagesand a total population exceeding 100,000. A GEFproject implemented by the UNDP set up 20 villagemarine conservation councils (VMCCs) to ensurestakeholder consultations. About half of these
council members are women. Working with existing village panchayat councils, the VMCCs establisheduser-rights agreements between the governmentand fishing cooperatives, including trawlers. In addi-tion, the project contracted with a local NGO tomanage a microcredit scheme to support maricultureand sustainable fisheries.
In the GEF’s Lake Victoria project, improved man-agement of land and water resources has been thecornerstone of demonstration activities in Kenya,Tanzania, and Uganda, the three nations that sharethe lake. Local communities were actively engagedby their governments to address illegal fishing activ-ities, secure access rights, implement biological con-trols for water hyacinth infestations, reduce water-related disease risks, and form beach managementcommittees. With GEF assistance, Kenya mobilized185 beach committees, Uganda 82, and Tanzania510 to contribute to improved management of thetransboundary resource.
The Lake Victoria export fishery is now recovering,with the return on investment estimated at $600million over two years.
In India, the Centre for Science and Environment(CSE) is sponsoring a national campaign to promotethe use of rainwater harvesting. The campaignincludes a website (www.rainwaterharvesting.org);training programs for masons and plumbers onimplementation of rainwater harvesting; on-site visits to local communities that harvest rainwater;and numerous publications.
CSE’s National Water Harvester’s Network, whichpromotes community water management programsbased on water harvesting, has members and affili-ates throughout India. With groundwater levelsdeclining in many parts of India, rainwater harvest-ing is gaining political support. In November 1998,President K.R. Narayanan invited CSE to suggestmeasures to harvest water at Rashtrapati Bhavan,
T H E C H A L L E N G E O F S U S TA I N A B I L I T Y12
the presidential estate. An elaborate plan for waterharvesting is being implemented on the estate. In addition to these examples, community-levelaction programs also could include:
� Watershed protection programs in which localpeople work with NGOs and research organiza-tions to promote conservation and local empow-erment
� Local councils that tackle local water rehabilita-tion and pollution problems
� Basin-level organizations for integrated watermanagement
� Construction of groundwater recharge wellsto improve village water supplies and aquifermanagement
� Disaster preparedness linked to community action� Drought relief efforts that mobilize work and
food supplies� Community action to control waterborne disease� Local monitoring of water quality, crop selection,
and quality control of produce irrigated witheffluent water.
Public-Private PartnershipsThere are encouraging examples of the privatesector working with urban and rural communities toprovide affordable water supply services and sewagetreatment collection systems. Some companies workwith community groups to plan the services, andcommunity labor helps to reduce the costs.
Following the adoption of South Africa’s waterlaw, for example, a number of pilot partnershipswere launched to test low-cost techniques fordelivering water to both rural communities andthose on the outskirts of cites such as Durban.Although these public-private partnerships wereestablished for an affordable fee, the water stillremains under the regulatory control of the gov-ernment as a public good. In rural areas of SouthAfrica—the Eastern Cape, Northern Province,KwaZulu/Natal, and Mpumalanga—over 2 millionpeople have been served since 1997 in a BOTT(Build-Operate-Train-Transfer) Partnership. Standpipesthat use electronic pre-payment cards and thosefinanced through community revenue collection
W AT E R 13
provide water from wells and from an extensivescheme of 50 reservoirs. The transfer of theseservices to local companies resulted in sustainableoperations and fee collections even in rural areas.
In poor sections of Durban, community groups’participation in urban planning created a demandfor affordable sewage collection systems. In 1999,a partnership was initiated to use labor from thecommunities to reduce the cost of shallow, small-bore sewer systems similar to ones popularized inBrazil. The resulting 50-percent savings in capitalcosts made extending sewerage systems afford-able. These private-sector partnerships overcameyears of inaction and inequities experienced bypoor communities in South Africa.
Innovative Irrigation Technologies Options to improve the productivity of irrigationinclude land leveling and efficient sprinklers toapply water more uniformly; surge irrigation toimprove water distribution; low-energy precisionapplication sprinklers to cut evaporation and winddrift losses; furrow diking to promote soil infiltra-tion and reduce runoff; and drip irrigation to cutevaporation and other water losses and to increasecrop yields (see Chapter 2).
Changes in water management systems are alsoimportant. For example, irrigation systems could beimproved through better timing of water releases.Farmers could adopt water-conservation technologyand use better information and communicationtechnologies to reduce non-beneficial irrigation,apply water uniformly to crops, and reduce stress.Farmers could also plant more drought-resistantcrop varieties or varieties that use water more effi-ciently. In addition, they could adapt better soilmanagement and other conservation practices.
Conserving EcosystemsSufficient water must be set aside to maintainecosystem health and services. Upstream, the man-agement of forests and land is essential for moder-ating hydrological variability, reducing silt, and con-
serving biodiversity. Downstream, water is vital forthe conservation and management of wetlands andfloodplains and to support fisheries and crop pro-duction systems.
In Australia, for example, the states in the Murray-Darling River basin have agreed to allocate 25 per-cent of the river’s natural flow to maintaining thesystem’s ecological health.
Many water utilities and hydropower companiesare developing partnerships with upstream commu-nities for maintenance of catchment quality. InEcuador, a variety of groups have joined togetherto protect the catchment area above Quito. In1998, the project leaders established a fund for theprotection of the catchment. Water consumptionfees will be negotiated with the various users andinvested in catchment protection. The project sponsors include the Nature Conservancy, theEcuadorian Forest and Natural Areas Institute,Quito’s Municipal Sewage and Water Agency, andother companies and local groups in the Quito area.
In downstream areas, new practices include incor-porating ecological flows in the design of newinfrastructure and recalibrating the operating rulesin river basins. The Lesotho Highlands Water Projectin South Africa is a recent example of how bettermanagement of river flows can provide bothecosystem and economic benefits. Restoration ofthe Lesotho River floodplain enabled traditional sub-sistence users to improve their liveihoods (seeChapter 2).
Streamflow regulation is another important compo-nent of watershed management. Developed coun-tries have historically relied on massive infrastructure(dams, levees, and canals) to control streamflowand manage floods. More recently, nonstructuralsolutions, such as watershed management andland use planning, have proved to be effectivecomplements to traditional infrastructure. Manydeveloping countries also are investing heavily innonstructural solutions.
T H E C H A L L E N G E O F S U S TA I N A B I L I T Y14
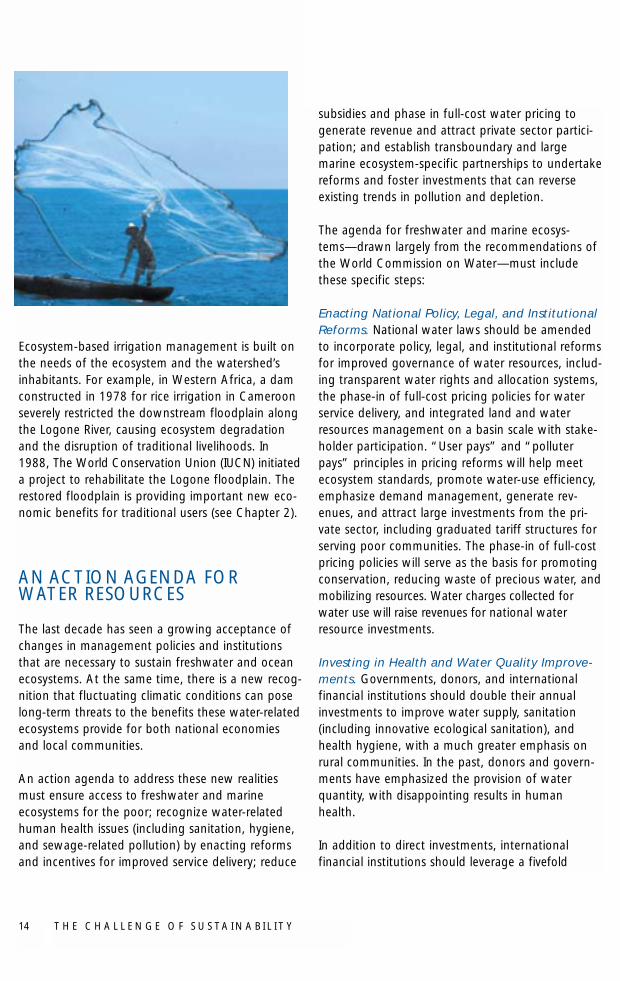
Ecosystem-based irrigation management is built onthe needs of the ecosystem and the watershed’sinhabitants. For example, in Western Africa, a damconstructed in 1978 for rice irrigation in Cameroonseverely restricted the downstream floodplain alongthe Logone River, causing ecosystem degradationand the disruption of traditional livelihoods. In1988, The World Conservation Union (IUCN) initiateda project to rehabilitate the Logone floodplain. Therestored floodplain is providing important new eco-nomic benefits for traditional users (see Chapter 2).
AN ACTION AGENDA FORWATER RESOURCES
The last decade has seen a growing acceptance ofchanges in management policies and institutionsthat are necessary to sustain freshwater and oceanecosystems. At the same time, there is a new recog-nition that fluctuating climatic conditions can poselong-term threats to the benefits these water-relatedecosystems provide for both national economiesand local communities.
An action agenda to address these new realitiesmust ensure access to freshwater and marineecosystems for the poor; recognize water-relatedhuman health issues (including sanitation, hygiene,and sewage-related pollution) by enacting reformsand incentives for improved service delivery; reduce
subsidies and phase in full-cost water pricing togenerate revenue and attract private sector partici-pation; and establish transboundary and largemarine ecosystem-specific partnerships to undertakereforms and foster investments that can reverseexisting trends in pollution and depletion.
The agenda for freshwater and marine ecosys-tems—drawn largely from the recommendations ofthe World Commission on Water—must includethese specific steps:
Enacting National Policy, Legal, and InstitutionalReforms. National water laws should be amendedto incorporate policy, legal, and institutional reformsfor improved governance of water resources, includ-ing transparent water rights and allocation systems,the phase-in of full-cost pricing policies for waterservice delivery, and integrated land and waterresources management on a basin scale with stake-holder participation. “User pays” and “polluterpays” principles in pricing reforms will help meetecosystem standards, promote water-use efficiency,emphasize demand management, generate rev-enues, and attract large investments from the pri-vate sector, including graduated tariff structures forserving poor communities. The phase-in of full-costpricing policies will serve as the basis for promotingconservation, reducing waste of precious water, andmobilizing resources. Water charges collected forwater use will raise revenues for national waterresource investments.
Investing in Health and Water Quality Improve-ments. Governments, donors, and internationalfinancial institutions should double their annualinvestments to improve water supply, sanitation(including innovative ecological sanitation), andhealth hygiene, with a much greater emphasis onrural communities. In the past, donors and govern-ments have emphasized the provision of waterquantity, with disappointing results in humanhealth.
In addition to direct investments, internationalfinancial institutions should leverage a fivefold
W AT E R 15
increase annually for infrastruc-ture and services to improvehealth and water quality.Through widespread use ofinnovative financial instru-ments, these institutions couldcatalyze public-private invest-ment, with a priority onreduced costs for services inpoor urban communities.Partial risk guarantees (and par-tial credit guarantees to munic-ipal governments) will catalyzeprivate sector investments inlow-cost technologies forurban water and sewage treat-ment. To gradually ease tariffincreases to cost-recovery lev-els, international financial insti-tutions should adopt “output-based lending” to reflect thepublic goods nature of bothhealth and water qualityimprovements and sewage pol-lution abatement.
Improving Water UseEfficiency to ProtectEcosystems. Governments,donors, and international finan-cial institutions should redirectthe approximately $33 billionannual expenditure on irriga-tion improvements. The fundsshould be used to improve theproductivity of rain-fed and irri-gated land in an effort to bal-ance conflicting uses of water within river basins,especially during times of fluctuating climatic con-ditions. Improved productivity should be encour-aged through the use of water efficient technology,water user organizations, pricing policies, and pro-ductivity gains. Investments in low-cost agriculturaltechnologies can provide important benefits for thepoor. The human-powered treadle pump and othercost-effective options are available to improve the
productivity of irrigation (seeChapter 2).
Placing New Emphasis onPartnerships for Trans-boundary Freshwater Basins.Governments should use inter-national financial institutionsand donor assistance to estab-lish multicountry partnershipsfor improving the governanceof transboundary waterresources. Country-driven part-nerships for the sustainabledevelopment of shared sys-tems—such as the GEF-spon-sored Nile River BasinInitiative—will yield domestic,regional, and global benefits.Such partnerships can improveecosystem access for the poor,reduce disease, improve waterquality, promote adaptation tofluctuating climatic regimes,and facilitate transboundaryfreshwater basin collaborationfor water security. Reallocationof phased reductions in OECDagricultural subsidies, andincreased national use of theWorld Bank’s Heavily IndebtedPoor Countries (HIPC) Initiativeto conserve natural capital, willprovide sufficient financing forsuch partnerships.
Fully Implementing ExistingInternational Agreements on Marine Systems.Full implementation and effective compliance withexisting international agreements on marine ecosys-tems are imperative to reduce overfishing, fleetovercapacity, bycatch rates, and habitat destructionin coastal areas. For both OECD and developingcountries, it is essential to enact policy, legal, andinstitutional reforms through new coastal/marinelegislation. Goals should include effectively imple-
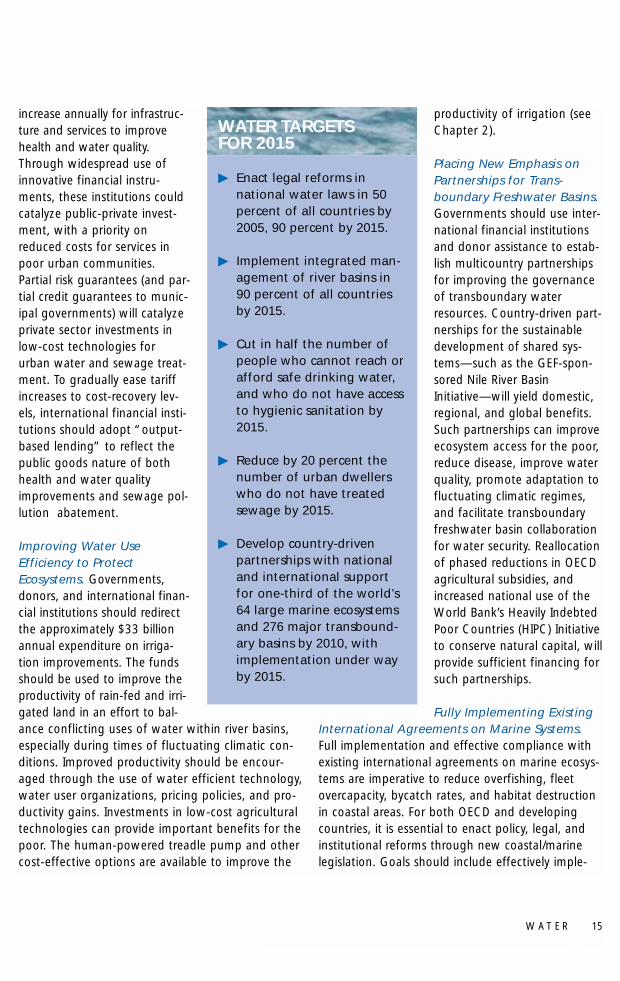
WATER TARGETS FOR 2015
� Enact legal reforms innational water laws in 50percent of all countries by2005, 90 percent by 2015.
� Implement integrated man-agement of river basins in90 percent of all countriesby 2015.
� Cut in half the number ofpeople who cannot reach orafford safe drinking water,and who do not have accessto hygienic sanitation by2015.
� Reduce by 20 percent thenumber of urban dwellerswho do not have treatedsewage by 2015.
� Develop country-drivenpartnerships with nationaland international supportfor one-third of the world’s64 large marine ecosystemsand 276 major transbound-ary basins by 2010, withimplementation under wayby 2015.
T H E C H A L L E N G E O F S U S TA I N A B I L I T Y16
menting compliance with international agreements,authorizing integrated coastal management, estab-lishing systems of strategically situated marine pro-tected areas, and reducing excessive loading ofnitrogen from land-based sources. Ecosystem-basedapproaches are necessary to achieve the integratedmanagement needed to reverse pollution anddepletion.
Supporting Partnerships for Sustaining LargeMarine Ecosystems. Donor nations, developingcountries, and international financial institutions
should establish strategic partnerships for the man-agement of large marine ecosystems. Multicountrypartnerships are essential to ensure collective share-ing of benefits. The GEF-sponsored StrategicPartnership for the Danube and Black Sea Basin andthe Benguela Current Large Marine Ecosystem areexamples of the types of partnerships needed tomake the transition to sustainability. The GEF willcontinue to assist collaborating nations in theirefforts to work together to address existing andpotential threats to water resources.
W AT E R 17
Asmal, Kader. 1998. “Water as aMetaphor for Governance:Issues in Water ResourcesManagement in Africa.” Natureand Resources 34(1): 19–25.
Brown, Lester. 2001. “EradicatingHunger: A GrowingChallenge.” In State of theWorld 2001. New York: W.W.Norton & Co.
Cruz, Maria C.J. and Alfred M.Duda. 2002. InternationalWaters as Global Public Goods:The Case of the East AsianSeas (PEMSEA Update). Manila:PEMSEA.
Duda, Alfred M. and Mohamed T.El-Ashry. 2000. “Addressingthe Global Water andEnvironment Crises throughIntegrated Approaches toManagement of Land, Water,and Ecological Resources.”Water International 25(1):115–26.
El-Ashry, Mohamed T. 1994.“Water ResourcesManagement for the NextCentury.” Interciencia 19(3).
Global Environment Facility (GEF).2002. “Strengthening theEnvironmental Dimensions ofSustainable Development:Toward an Action Agenda.”Paper prepared for theMinisterial Roundtable onFinancing Environment andSustainable Development,Second Session, Bali,Indonesia, June 4, 2002.
Jackson, Jeremy B., Michael X.Kirby, Wolfgang H. Berger,Karen A. Bjorndal, Louis W.Botsford, Bruce J. Bourque,and Roger H. Bradbury. 2001.“Historical Overfishing and theRecent Collapse of CoastalEcosystems.” Science (293):629–38.
Postel, Sandra. 2000.“Redesigning IrrigatedAgriculture.” In State of theWorld 2000. New York: W.W.Norton & Co.
Rosegrant, Mark. 1997. WaterResources in the Twenty-FirstCentury: Challenges andImplications for Action.Washington, D.C.: IFPRI.
UNDP, UNEP, World Bank, andWorld Resources Institute.2000. World Resources 2000-2001: People and Ecosystems.Washington, D.C.: WorldResources Institute.
UNEP. 1999. GEO–2000: UNEP’sMillennium Report on theEnvironment. London:Earthscan Publications.
World Commission on Water.2000. World Water Vision.London: Thanet Press.
World Conservation Union(IUCN). 2000. Vision for Waterand Nature. Gland, Switzerland:IUCN.
REFERENCES
18
19
LAND, WATER, AND FOODPRODUCTION: MOVINGTOWARD SUSTAINABIL ITY
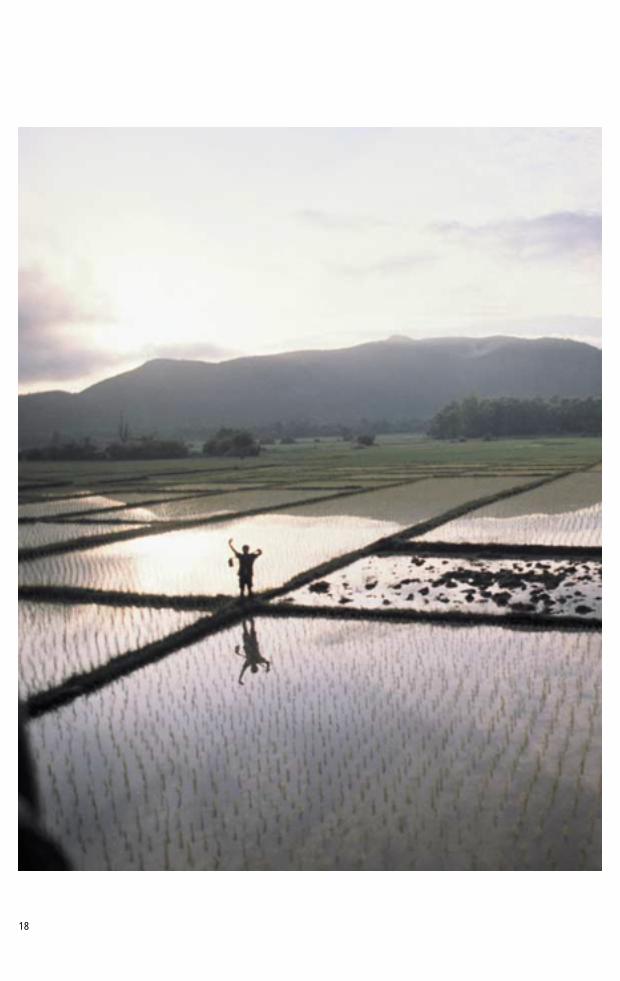
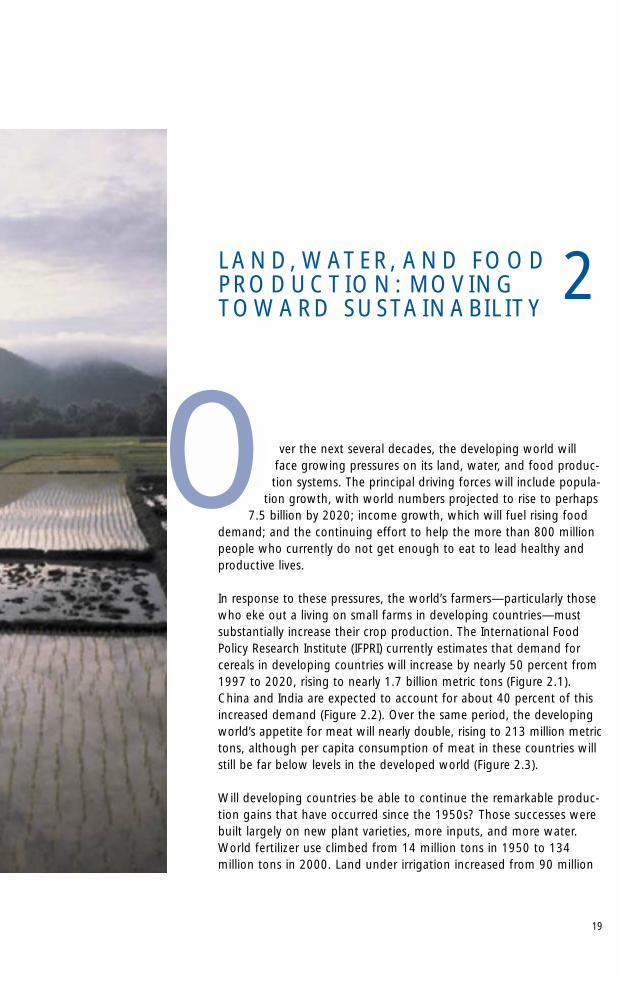
ver the next several decades, the developing world willface growing pressures on its land, water, and food produc-tion systems. The principal driving forces will include popula-
tion growth, with world numbers projected to rise to perhaps7.5 billion by 2020; income growth, which will fuel rising food
demand; and the continuing effort to help the more than 800 millionpeople who currently do not get enough to eat to lead healthy andproductive lives.
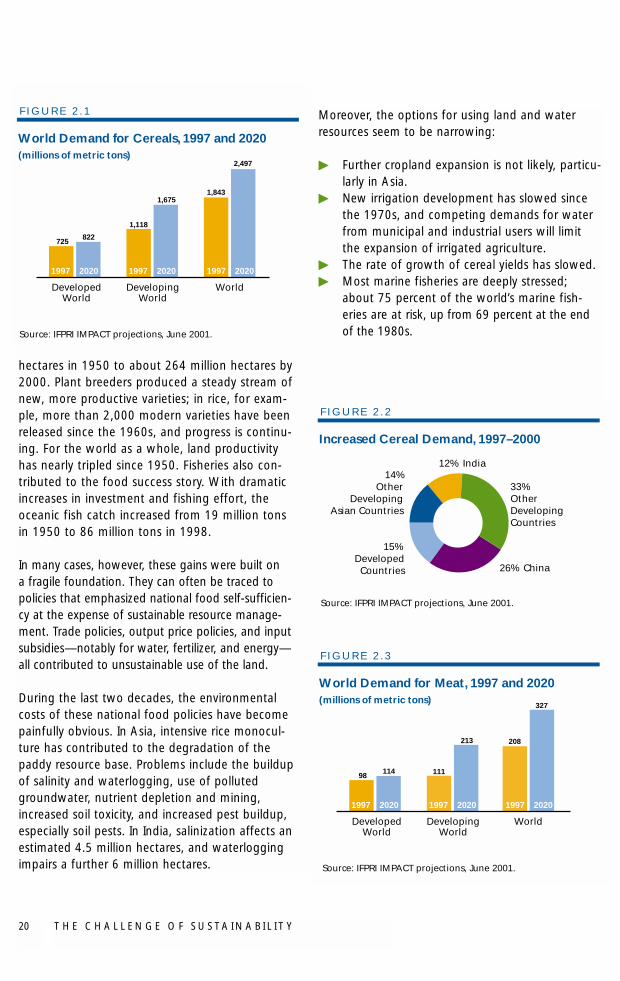
In response to these pressures, the world’s farmers—particularly thosewho eke out a living on small farms in developing countries—mustsubstantially increase their crop production. The International FoodPolicy Research Institute (IFPRI) currently estimates that demand forcereals in developing countries will increase by nearly 50 percent from1997 to 2020, rising to nearly 1.7 billion metric tons (Figure 2.1).China and India are expected to account for about 40 percent of thisincreased demand (Figure 2.2). Over the same period, the developingworld’s appetite for meat will nearly double, rising to 213 million metrictons, although per capita consumption of meat in these countries willstill be far below levels in the developed world (Figure 2.3).
Will developing countries be able to continue the remarkable produc-tion gains that have occurred since the 1950s? Those successes werebuilt largely on new plant varieties, more inputs, and more water.World fertilizer use climbed from 14 million tons in 1950 to 134 million tons in 2000. Land under irrigation increased from 90 million
2
O
T H E C H A L L E N G E O F S U S TA I N A B I L I T Y20
hectares in 1950 to about 264 million hectares by2000. Plant breeders produced a steady stream ofnew, more productive varieties; in rice, for exam-ple, more than 2,000 modern varieties have beenreleased since the 1960s, and progress is continu-ing. For the world as a whole, land productivityhas nearly tripled since 1950. Fisheries also con-tributed to the food success story. With dramaticincreases in investment and fishing effort, theoceanic fish catch increased from 19 million tonsin 1950 to 86 million tons in 1998.
In many cases, however, these gains were built ona fragile foundation. They can often be traced topolicies that emphasized national food self-sufficien-cy at the expense of sustainable resource manage-ment. Trade policies, output price policies, and inputsubsidies—notably for water, fertilizer, and energy—all contributed to unsustainable use of the land.
During the last two decades, the environmentalcosts of these national food policies have becomepainfully obvious. In Asia, intensive rice monocul-ture has contributed to the degradation of thepaddy resource base. Problems include the buildupof salinity and waterlogging, use of pollutedgroundwater, nutrient depletion and mining,increased soil toxicity, and increased pest buildup,especially soil pests. In India, salinization affects anestimated 4.5 million hectares, and waterloggingimpairs a further 6 million hectares.
Moreover, the options for using land and waterresources seem to be narrowing:
� Further cropland expansion is not likely, particu-larly in Asia.
� New irrigation development has slowed sincethe 1970s, and competing demands for waterfrom municipal and industrial users will limitthe expansion of irrigated agriculture.
� The rate of growth of cereal yields has slowed. � Most marine fisheries are deeply stressed;
about 75 percent of the world’s marine fish-eries are at risk, up from 69 percent at the endof the 1980s.Source: IFPRI IMPACT projections, June 2001.
DevelopedWorld
DevelopingWorld
World
1997 2020 1997 2020 1997 2020
725822
1,118
1,6751,843
2,497
World Demand for Cereals, 1997 and 2020 (millions of metric tons)
F I G U R E 2 . 1
Source: IFPRI IMPACT projections, June 2001.
33% OtherDeveloping Countries
14%Other
Developing Asian Countries
15%Developed
Countries 26% China
12% India
Source: IFPRI IMPACT projections, June 2001.
DevelopedWorld
DevelopingWorld
World
1997 2020 1997 2020 1997 2020
98114 111
213 208
327
Increased Cereal Demand, 1997–2000
F I G U R E 2 . 2
World Demand for Meat, 1997 and 2020 (millions of metric tons)
F I G U R E 2 . 3
21
IFPRI currently predicts that farmers in the develop-ing world will be unable to keep up with risingdemand. Net cereal imports by developing countries,largely from the United States and Europe, are likelyto more than double by 2020. China’s cereal tradedeficit could nearly double by then, rising from 89million metric tons, while India could shift from nearself-sufficiency to requiring imports of 30 millionmetric tons. By 2020, India’s agricultural trade deficitcould rise to $9.1 billion, and China’s to $33.5 billion.
Sub-Saharan Africa faces a particularly difficult chal-lenge. There, agroclimatic constraints are more diffi-cult than in much of Asia; the cost of accessingwater is higher; and irrigation, transportation, andcommunications infrastructures are far more limited.Other factors—widespread political instability, theHIV/AIDs crisis, rapid population growth, and rela-tively slow economic growth—also will make it hardfor many African nations to muster the neededinvestments and policy reforms to increase food pro-duction. IFPRI forecasts that Africa’s food bill couldrise from $6.5 billion in 1997 to $11 billion by 2020.Paying that off could be politically and economicallyunsustainable. If African nations are unable to payfor needed imports, food shortages and malnutritioncould rise to catastrophic proportions.
Faced with such daunting food bills, the pressureson farmers in developing nations to increase pro-ductivity—at the likely expense of the environ-ment—are sure to increase. A critical challenge inthe next few decades will be for these countries toadopt integrated land and water strategies, goodmanagement practices, environmentally sound tech-nologies, and better policies to support food pro-duction increases without putting potentially disas-trous stresses on land and water resources.
As an institution concerned about global environ-mental problems, GEF recognizes the many signifi-cant linkages between agricultural practices and theglobal environment. Groundwater overpumping,nutrient runoff into surface waters, and the conver-sion of forests to cropland all have significant globalenvironmental implications. Taking steps to reduce
these environmental problems can likewise createsignificant global environmental benefits.
NARROWING THE OPTIONS
The strategies used to produce the massive foodproduction gains of the last several decades maynot be sufficient for the task that lies ahead.Moreover, environmental degradation and otherfactors—including the rising incidence of conflictsand natural disasters—are combining to producesignificant production constraints (Box 2.1).
Land DegradationOn about one-fourth of the world’s agriculturalland, soil degradation is widespread, and the paceof degradation has accelerated in the past 50 years.In developing nations, productivity has declinedsubstantially on about 16 percent of agriculturalland—especially on cropland in Africa and CentralAmerica and on pastureland in Africa. The annualloss of agricultural land due to degradation isthought to range from 5 million to 12 millionhectares, or about 0.3–1.0 percent of the world’sarable land.
Estimates of the effect of degradation on agricultur-al productivity vary, but clearly the impact is signifi-cant in some regions. From 1945 to 1990, thecumulative crop productivity losses from land degra-dation have been estimated at about 5 percentworldwide, which is equivalent to a yield decline of0.11 percent per year. In Africa, however, it is esti-mated that cumulative crop yield reductions due topast erosion averaged about 8.2 percent for theentire continent and 6.2 percent for Sub-SaharanAfrica.
Water Scarcity and DegradationWater resources are critical to food security, yetwater is already scarce in many parts of the world(see Chapter 1). Water shortages are a significantproblem in Africa, Northern China, parts of India,Mexico, and the Middle East.
L A N D , W AT E R , A N D F O O D P R O D U C T I O N
Agriculture plays a major role in water use, account-ing for more than 70 percent of water withdrawalsworldwide and more than 90 percent in low-income developing countries. By 2025, total waterwithdrawals for agricultural, domestic, and industri-al use are projected to increase significantly in morethan 60 percent of the world, including large areasof Africa, Asia, and Latin America. Greater demandfrom domestic and industrial uses is likely to reducewater supplies for agriculture. Increasing waterscarcity will be a primary cause of a slowdown inthe growth of irrigated cereal yields in developingcountries.
Many existing water management practices areunsustainable. Millions of hectares of irrigated crop-land have been damaged by waterlogging andsalinization as a result of poor water management.In India and elsewhere, groundwater extractionoften exceeds the rate of natural recharge. In someareas, shallow aquifers are almost depleted; scarcityand quality problems often are linked. Groundwaterpumping can extract water that is saline or containsnatural contaminants such as arsenic or fluoride.When combined with increasing pollutant loadsfrom industry and municipal sewage, this pumpingcan irreversibly contaminate aquifers.
Water-level changes and fluctuations are anotherimportant factor influencing access to groundwater.When levels drop below an economically recover-able range, farmers lose access to irrigation, house-holds are deprived of drinking water, and surfacewater bodies and wetlands are adversely affected.
Cropland AreaPutting more land under the plow could meet someof the rising demand for food, but the opportuni-ties for cropland expansion are limited. About 87percent of potential cropland is in developing coun-tries, mainly Latin America and Sub-Saharan Africa.The productivity of this land is expected to be lowerthan the existing stock of cropland. In addition,conversion could destroy forests and rangelandsthat have valuable ecological functions.
B OX 2 . 1
CONFLICTS ANDNATURAL DISASTERSConflicts and natural disasters have caused signif-icant losses to farmers and badly damaged theagricultural sector in many countries.
Conflicts have increased from an average of 5 ayear in the 1980s to 22 in 2000. In recent years,conflicts have occurred primarily in the least-developed nations of Africa, but also in theMiddle East, the Balkans, Central America, andAsia. In 23 countries where data were available, itis estimated that the impact of conflict on agri-culture amounted to almost $55 billion between1990 and 1997. In 1997, conflicts accounted foran estimated 40 percent loss of agricultural GDPin these countries.
Similarly, the number of countries affected bydisasters rose from 28 in 1996 to 46 in 2000.Further, the scale of damage from natural disas-ters has increased. Major storms and floods havestruck China, Bangladesh,Vietnam, Cambodia,India, Southern Africa, Central America, theCaribbean, and Venezuela. Floods preceding adrought were also a significant cause of theintense food shortages that affected parts of theHorn of Africa in 2000. Economic losses from thegreat floods of the 1990s are 10 times those ofthe 1960s in real terms.There has been a 37-foldincrease in insured losses since the 1960s.
In 1998, total damages from natural disasterswere estimated at $89 billion. About 32,000people were killed, and 300 million were dis-placed from their homes and livelihoods.
Source: FAO.
L A N D , W AT E R , A N D F O O D P R O D U C T I O N 23
In the highly populated areas of Asia, wheredemand is most intense, almost all of the suitableland is already under cultivation. Western Europe,the United States, and Oceania have actually retiredabout 41 million hectares from production since1966. During 1986–96, West Asia was the onlyregion where agricultural land area expanded bymore than 1 percent annually.
IFPRI projects that by 2020 an additional 20 millionhectares of cereal cropland will be planted in Sub-Saharan Africa, 8 million more hectares in LatinAmerica, but only another 13 million hectares in therest of the developing world. This would be anincrease of about 8 percent over the current 480million hectares of cereal crop area in the develop-ing world. According to IFPRI, the primary constraintin the expansion of crop area is that cereal pricesare not expected to rise, which in many casesmakes cropland expansion unprofitable.
Irrigated AreaSeventeen percent of total cultivated land is irrigatedcropland that currently produces nearly 40 percentof the world’s food. China and India contain 39 per-cent of the total global irrigated area, while lessthan 4 percent of cropland in Sub-Saharan Africa isirrigated.
New irrigation development has slowed since the1970s due to escalating construction costs, low anddeclining prices of staple cereals, declining qualityof land available for new irrigation, and increasingconcerns over the environmental and social impactsof large-scale irrigation projects. According to theFAO, the annual growth rate in global irrigated areadeclined from 2.2 percent during 1967–82 to 1.5percent during 1982–95.
IFPRI expects the irrigated cereal area to increasefrom the 1997 total of 218 million hectares to 248million hectares by 2020—with an additional 1 mil-lion hectares in developed countries and 29 millionhectares in developing ones.
The World Water Council notes that the expansion ofirrigated agriculture poses a troubling dilemma. A 30-percent increase in irrigated area would likely lead tosevere water shortages and serious risks of deterio-rating ecosystems, while a reduction in the growth ofirrigated area could cause considerable food short-ages and rising food prices. Given these two unat-tractive alternatives, the Council’s World Water Visionemphasizes improving the productivity of water usein agriculture.
Fertilizer UseApplications of inorganic fertilizers containing nitro-gen, phosphorus, and potassium have long been astaple of agricultural success. Insufficient replenish-ment of soil can lead to long-term nutrient deple-tion that can exhaust fertility, whereas excessive orpoorly timed fertilizer use can lead to nutrientrunoff into surface waters and cause serious envi-ronmental damage.
Fertilizer use varies widely around the world. Inthe heavy-use areas—including Europe, the UnitedStates, Japan, and possibly China—applying addi-tional nutrients is not likely to have much effecton production. But in areas such as India andLatin America, additional fertilizer could helpboost production.
Farm SizeIn many parts of the developing world, populationgrowth is having a dual effect, both increasing fooddemand and shrinking farms to untenably smallsizes. In Bangladesh, for example, average farm sizehas already fallen below 1 hectare. Bangladesh’stradition of bequeathing land in fixed proportionsto all male and female heirs promises to furtherreduce average farm size. The Worldwatch Institutereports that India may now have 90 million or morefamilies with farms of less than 2 hectares.
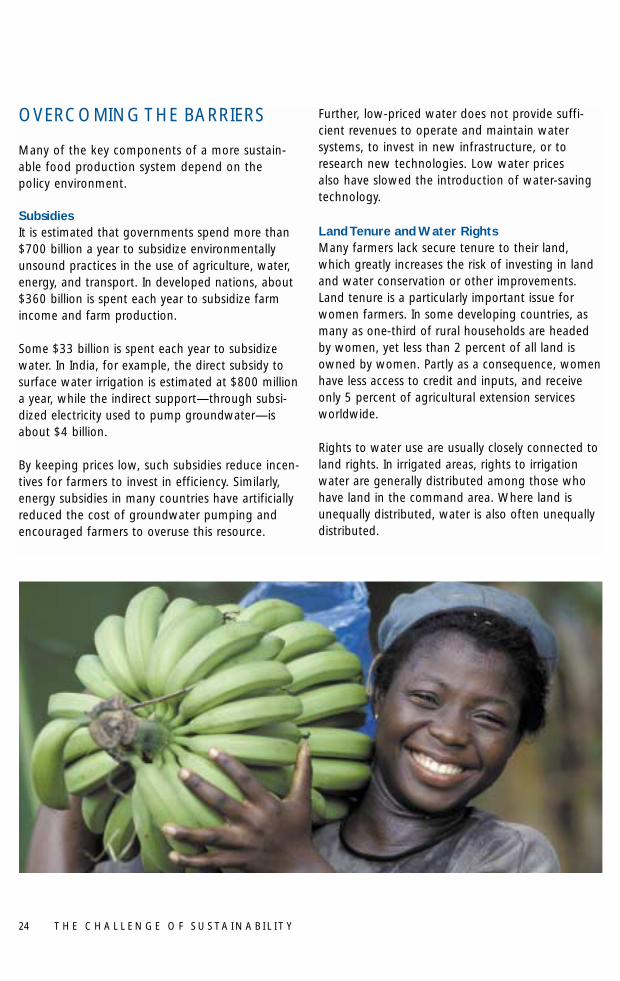
OVERCOMING THE BARRIERS
Many of the key components of a more sustain-able food production system depend on thepolicy environment.
SubsidiesIt is estimated that governments spend more than$700 billion a year to subsidize environmentallyunsound practices in the use of agriculture, water,energy, and transport. In developed nations, about$360 billion is spent each year to subsidize farmincome and farm production.
Some $33 billion is spent each year to subsidizewater. In India, for example, the direct subsidy tosurface water irrigation is estimated at $800 milliona year, while the indirect support—through subsi-dized electricity used to pump groundwater—isabout $4 billion.
By keeping prices low, such subsidies reduce incen-tives for farmers to invest in efficiency. Similarly,energy subsidies in many countries have artificiallyreduced the cost of groundwater pumping andencouraged farmers to overuse this resource.
Further, low-priced water does not provide suffi-cient revenues to operate and maintain watersystems, to invest in new infrastructure, or toresearch new technologies. Low water pricesalso have slowed the introduction of water-savingtechnology.
Land Tenure and Water RightsMany farmers lack secure tenure to their land,which greatly increases the risk of investing in landand water conservation or other improvements.Land tenure is a particularly important issue forwomen farmers. In some developing countries, asmany as one-third of rural households are headedby women, yet less than 2 percent of all land isowned by women. Partly as a consequence, womenhave less access to credit and inputs, and receiveonly 5 percent of agricultural extension servicesworldwide.
Rights to water use are usually closely connected toland rights. In irrigated areas, rights to irrigationwater are generally distributed among those whohave land in the command area. Where land isunequally distributed, water is also often unequallydistributed.
T H E C H A L L E N G E O F S U S TA I N A B I L I T Y24
L A N D , W AT E R , A N D F O O D P R O D U C T I O N 25
Obstacles to New Technologies and Management PracticesIn Sub-Saharan Africa, the lack of access to afford-able technologies for small farmers has slowed thespread of irrigation. In many countries in the region,small-scale farmers account for 80 percent or moreof the farm population.
In addition to the land tenure and gender issuesmentioned above, other obstacles aggrevating thisproblem include:
� High costs of equipment, often 220 times moreexpensive than in Asia.
� Poor transportation and marketing facilities,which reduce the profitability of agriculturalinvestments.
Lack of an Integrated ApproachLand and water management institutions tend to becentralized, technically oriented agencies that sup-port one or two specific aspects of management,such as water supply utilities or irrigation agencies.
Although it often leads to short-term economicgains, the single-sector approach to land and watermanagement can result in long-term environmentaldegradation because it fails to account for thecomplex linkages among various components of theecosystem. It typically seeks to maximize the bene-fits of one sector, such as irrigated agriculture, with-out considering effects on other sectors. In addition,this approach tends to rely heavily on technical andengineering solutions, making little or no attemptto address related policy and institutional issues.
Development activities in the Senegal River valleyhighlight many of the unintended environmentaland social impacts of the single-sector approach.Two dams were constructed on the Senegal Riverin the 1970s to support intensive rice production,electricity generation, and year-round navigation.Environmental and social considerations were notfully addressed in the design of the projects. Asa result, about 50 percent of the irrigation fieldshave been lost to soil salinization, dams and dikes
have reduced traditional grazing lands from80,000 to 4,000 hectares, water pollution frompesticides and other agrochemicals is significant,and fish production in the river and estuary hasdropped by 90 percent.
PROMISING APPROACHES
Despite the barriers described above, there aremany encouraging examples of initiatives to pro-mote environmentally sound food production.
Improving Water-use EfficiencyA critical need in the next few decades is toimprove the efficiency of water use, especially foragriculture. World Water Vision lists a range oftechnical and management options to improve productivity, including:
� Developing new crop varieties with higher yieldsper unit of water—for example, crops with com-parable yields but shorter growth periods
� Switching to crops that consume less water oruse water more efficiently
� Improving soil management, fertilization, andpest and weed control
� Improving the reliability of water supplies at criti-cal crop growth periods; this would encouragefarmers to invest more in other inputs and leadto higher output per unit of water
� Promoting deficit irrigation, which can increaseproductivity per unit of water by providing less-than-full irrigation requirements; and supple-mental irrigation, which uses limited irrigationat critical periods to supplement rainfall. In theSyrian Arab Republic, for example, researchershave demonstrated that reducing full irrigationby 50 percent results in a yield loss of only 10percent.
A broad range of irrigation technologies now avail-able can increase water productivity. For example,drip irrigation, which uses a network of perforatedplastic tubes that deliver water directly to the roots
T H E C H A L L E N G E O F S U S TA I N A B I L I T Y26
of plants, can cut water use by 30–70 percent andincrease crop yields by 20–90 percent.
Another efficient sprinkler system known as low-energy precision application has drop tubes extend-ing vertically from the sprinkler arm. These tubesdeliver water much closer to the plants, reducingevaporation losses. Used in combination with time-controlled surge valves, which distribute water moreuniformly down furrows, these systems can producewater savings of 25–37 percent compared withconventional furrow irrigation.
There are also a variety of management techniquesthat can improve irrigation efficiency. These includeimproving irrigation timing, improving canal opera-tions for more efficient deliveries, applying water onlyat crucial periods, using water-conserving tillage andfield preparation methods, improving canal mainte-nance, and recycling drainage and tail water. In theArys-Turkestan region of south Kazakhstan, for exam-ple, the International Center for Agricultural Researchin the Dry Areas (ICARDA) is experimenting withalternative furrow irrigation, which supplies everyother furrow with water. Combined with the use ofshallow groundwater, this system uses about half asmuch water as traditional irrigation and loses two-thirds less in runoff, resulting in substantial watersavings and enhanced productivity.
In addition, there are a wide array of small-scale irri-gation strategies for areas with scarce water sup-plies. For example, check dams built across gulliescan trap large amounts of runoff, which can bechanneled to fields or stored for later use.
Above all, reducing water subsidies will help pro-mote more efficient water use (see Chapter 1). TheWorld Water Vision recommends that consumersbe charged the full cost of providing water services,including the cost of obtaining the water and ofcollecting, treating, and disposing of wastewater.Full cost pricing will make water suppliers account-able to users, reduce water withdrawals fromecosystems, and provide the revenue needed tocover operation and maintenance costs. Such policies
must be accompanied by targeted, transparent subsi-dies to low-income communities and individuals.
Conserving Soil ResourcesA wide variety of strategies are available to rebuildand conserve soil resources. In less-favored areas inthe East African highlands, for example, inexpen-sive ways to improve nutrient management includeimproved fallows, biomass transfer, crop residuemanagement, manure management, and compost-ing. In steeply sloping areas prone to erosion,solutions include bench-terracing, natural vegeta-tive strips, stone walls, and perennial tree cropsystems. In the Southeast Asian uplands, contourhedgerows are effective in controlling soil erosion.Agroforestry, which combines annual andperennial plants, can help maintain soil fertilitybecause perennial crops help recycle nutrientsand reduce erosion.
Conservation agriculture is gaining acceptancearound the world. Recent studies estimate that con-servation agriculture is practiced on about 58 millionhectares of farmland, mainly in North and SouthAmerica, but also in Southern Africa and South Asia.
Under this approach, farmers leave crop residues inthe ground as soil cover. Rather than tilling the soilat the start of the next cropping season, they usespecial equipment to drill the seeds directly into thesoil. The surface cover reduces mineralization, ero-sion, and water loss. In addition, it inhibits the ger-mination of weeds, protects soil microorganisms,and helps build up organic matter.
Conservation agriculture does not preclude the useof chemical inputs. Herbicides are an importantcomponent, particularly in the transition phase untila new balance in the weed population is achieved.Conservation agriculture generally uses fewer chem-ical inputs than conventional farmers. Over theyears, the use of inputs tends to decline. In the longrun, disease problems do not increase if sound croprotations are adopted. The system can be used togrow grains, pulses, sugar cane, potatoes, beets,and cassava.
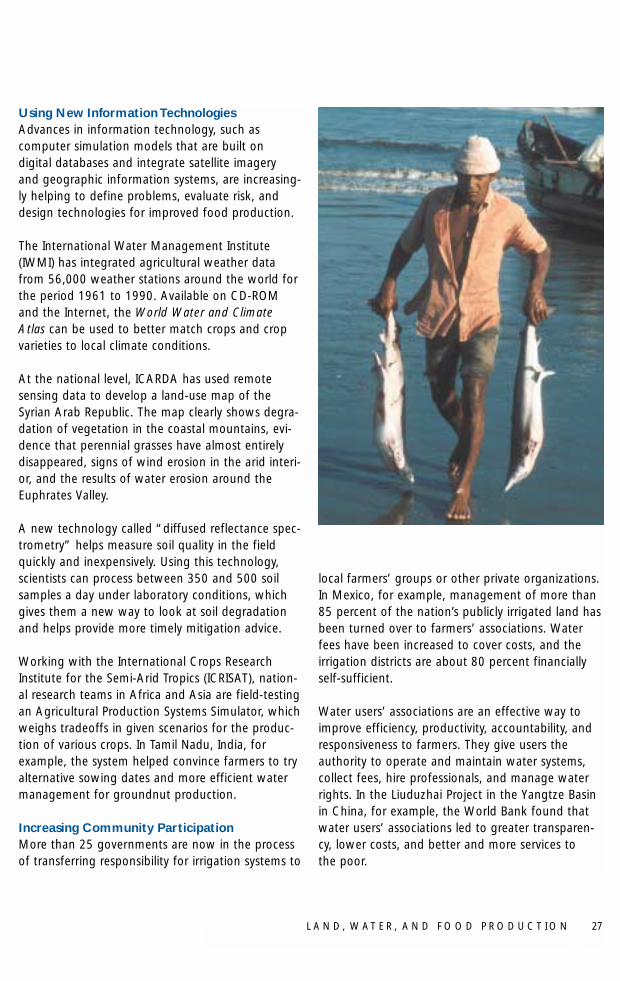
L A N D , W AT E R , A N D F O O D P R O D U C T I O N 27
Using New Information TechnologiesAdvances in information technology, such ascomputer simulation models that are built ondigital databases and integrate satellite imageryand geographic information systems, are increasing-ly helping to define problems, evaluate risk, anddesign technologies for improved food production.
The International Water Management Institute(IWMI) has integrated agricultural weather datafrom 56,000 weather stations around the world forthe period 1961 to 1990. Available on CD-ROMand the Internet, the World Water and ClimateAtlas can be used to better match crops and cropvarieties to local climate conditions.
At the national level, ICARDA has used remotesensing data to develop a land-use map of theSyrian Arab Republic. The map clearly shows degra-dation of vegetation in the coastal mountains, evi-dence that perennial grasses have almost entirelydisappeared, signs of wind erosion in the arid interi-or, and the results of water erosion around theEuphrates Valley.
A new technology called “diffused reflectance spec-trometry” helps measure soil quality in the fieldquickly and inexpensively. Using this technology, scientists can process between 350 and 500 soilsamples a day under laboratory conditions, whichgives them a new way to look at soil degradationand helps provide more timely mitigation advice.
Working with the International Crops ResearchInstitute for the Semi-Arid Tropics (ICRISAT), nation-al research teams in Africa and Asia are field-testingan Agricultural Production Systems Simulator, whichweighs tradeoffs in given scenarios for the produc-tion of various crops. In Tamil Nadu, India, forexample, the system helped convince farmers to tryalternative sowing dates and more efficient watermanagement for groundnut production.
Increasing Community ParticipationMore than 25 governments are now in the processof transferring responsibility for irrigation systems to
local farmers’ groups or other private organizations.In Mexico, for example, management of more than85 percent of the nation’s publicly irrigated land hasbeen turned over to farmers’ associations. Waterfees have been increased to cover costs, and theirrigation districts are about 80 percent financiallyself-sufficient.
Water users’ associations are an effective way toimprove efficiency, productivity, accountability, andresponsiveness to farmers. They give users theauthority to operate and maintain water systems,collect fees, hire professionals, and manage waterrights. In the Liuduzhai Project in the Yangtze Basinin China, for example, the World Bank found thatwater users’ associations led to greater transparen-cy, lower costs, and better and more services tothe poor.
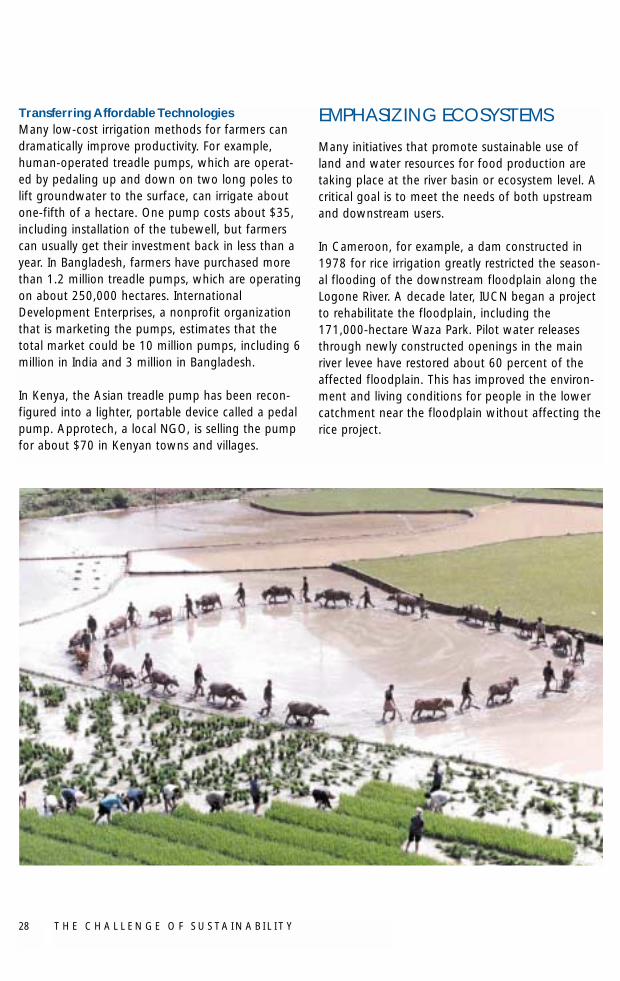
T H E C H A L L E N G E O F S U S TA I N A B I L I T Y28
Transferring Affordable TechnologiesMany low-cost irrigation methods for farmers candramatically improve productivity. For example,human-operated treadle pumps, which are operat-ed by pedaling up and down on two long poles tolift groundwater to the surface, can irrigate aboutone-fifth of a hectare. One pump costs about $35,including installation of the tubewell, but farmerscan usually get their investment back in less than ayear. In Bangladesh, farmers have purchased morethan 1.2 million treadle pumps, which are operatingon about 250,000 hectares. InternationalDevelopment Enterprises, a nonprofit organizationthat is marketing the pumps, estimates that thetotal market could be 10 million pumps, including 6million in India and 3 million in Bangladesh.
In Kenya, the Asian treadle pump has been recon-figured into a lighter, portable device called a pedalpump. Approtech, a local NGO, is selling the pumpfor about $70 in Kenyan towns and villages.
EMPHASIZING ECOSYSTEMS
Many initiatives that promote sustainable use ofland and water resources for food production aretaking place at the river basin or ecosystem level. Acritical goal is to meet the needs of both upstreamand downstream users.
In Cameroon, for example, a dam constructed in1978 for rice irrigation greatly restricted the season-al flooding of the downstream floodplain along theLogone River. A decade later, IUCN began a projectto rehabilitate the floodplain, including the171,000-hectare Waza Park. Pilot water releasesthrough newly constructed openings in the mainriver levee have restored about 60 percent of theaffected floodplain. This has improved the environ-ment and living conditions for people in the lowercatchment near the floodplain without affecting therice project.
L A N D , W AT E R , A N D F O O D P R O D U C T I O N 29
In Lesotho, the Lesotho Highlands Water Project isan interbasin transfer project that would exportwater from the Senqu/Orange River in Lesotho toSouth Africa. As part of the project, the World Bankfinanced an environmental flow assessment thatstudied the complete river ecosystem. Based on thefindings of the assessment, the design of the pro-ject’s Mohale Dam was changed to a multiple outletstructure. This will allow releases of varying quantityand quality, including occasional flood flows, tomeet the requirements of downstream ecosystems.
Mexico’s 1992 National Water Law authorizes thecreation of river basin councils to provide a forumfor identifying and evaluating problems and needs;developing consensus between the various govern-ment entities, water users, and other interested par-ties; recommending actions and obtaining commit-ments to implement them; and ensuring continuingcommitment and compliance with agreed-upon ini-tiatives. The councils are responsible for making theplanning process dynamic, participatory, and results-oriented.
The new South African and Brazilian water laws arealso important examples of an integrated ecosystemapproach (see Chapter 1), as is the Murray-DarlingBasin Initiative in Australia, which is described laterin this chapter.
Local Adaptation StrategiesThere are several encouraging examples of effectivelocal responses to drought conditions in developingcountries. In Burkina Faso, the Mossi plateaureceives only about 700 millimeters of rainfall peryear, which varies in extent, duration, and intensity.Since 1976, rainfall levels have been falling, leadingto migration, food shortages, and land degradation.
At the village level, self-help groups known collec-tively as the Naam Movement developed a numberof strategies to manage water shortages. As oneresponse, they built diguettes, or stone lines con-structed along contours that were designed to temporarily restrict water movement across fields,increase infiltration time, and catch organic debris.
The lines, which are often reinforced with vetivergrass, are effective at increasing agricultural produc-tion, reducing soil erosion, reclaiming degradedfields, and replenishing aquifers. They were builtthroughout the Mossi plateau and significantlyincreased food and water security.
Many other traditional water harvesting technologieswere also spread through Naam groups, including zai,which are small pits dug in the field with a little com-post to trap water; demi-lunes, or half-moons, whichwere constructed out of earth on the downside of acontour and used to trap water; and erosion bunds,which were dug on contours with a depth of abouthalf a meter to increase water availability for crops.
In the Machakos district southeast of Nairobi inKenya, the Akamba people have managed to devel-op successful hillside farming systems in semiaridconditions. At the turn of the twentieth century, thenew British colonial government imposed bound-aries on the Akamba and other native people inKenya. The Akamba retained most of their tradi-tional lands, but the new boundaries precludedmovement to new fields during periods of drought,population growth, or declining soil fertility. From1900 to 1930, the population more than doubled,soils became exhausted, and crop yields fell. Duringthe mid-1930s, droughts occurred during six of theeight semiannual growing seasons. When the rainsdid come, the parched and deforested hillsides suf-fered severe erosion.
The colonial government began investing in landconservation projects in the 1930s, requiring theAkamba in compulsory work gangs to construct nar-row-based terraces, or contour ditches. These effortslost favor with Akamba farmers, but later Akambainnovations in the 1950s used a variation of this ideacalled fanya juu terraces. These terraces are con-structed by digging a trench along the contour of aslope and throwing the excavated soil uphill to forma gently sloping field with an earth embankmentthat collects rainfall and slows runoff. Though labor-intensive, these bench terraces soon become stableand require only periodic maintenance.
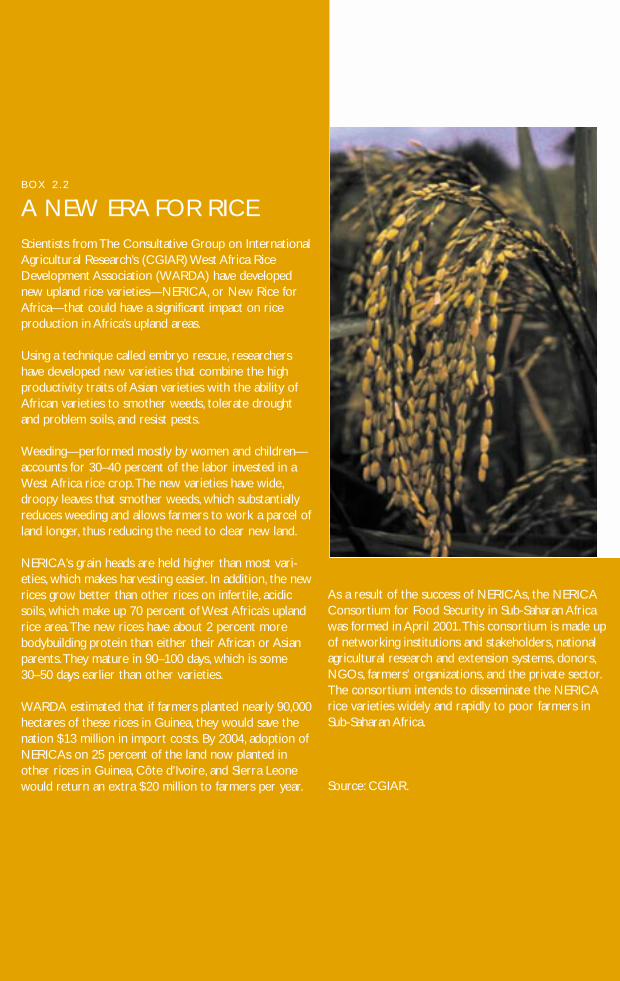
B OX 2 . 2
A NEW ERA FOR RICEScientists from The Consultative Group on InternationalAgricultural Research’s (CGIAR) West Africa RiceDevelopment Association (WARDA) have developednew upland rice varieties—NERICA, or New Rice forAfrica—that could have a significant impact on rice production in Africa’s upland areas.
Using a technique called embryo rescue, researchershave developed new varieties that combine the highproductivity traits of Asian varieties with the ability ofAfrican varieties to smother weeds, tolerate droughtand problem soils, and resist pests.
Weeding—performed mostly by women and children—accounts for 30–40 percent of the labor invested in aWest Africa rice crop.The new varieties have wide,droopy leaves that smother weeds, which substantiallyreduces weeding and allows farmers to work a parcel ofland longer, thus reducing the need to clear new land.
NERICA’s grain heads are held higher than most vari-eties, which makes harvesting easier. In addition, the newrices grow better than other rices on infertile, acidicsoils, which make up 70 percent of West Africa’s uplandrice area.The new rices have about 2 percent morebodybuilding protein than either their African or Asianparents.They mature in 90–100 days, which is some30–50 days earlier than other varieties.
WARDA estimated that if farmers planted nearly 90,000hectares of these rices in Guinea, they would save thenation $13 million in import costs. By 2004, adoption ofNERICAs on 25 percent of the land now planted inother rices in Guinea, Côte d’Ivoire, and Sierra Leonewould return an extra $20 million to farmers per year.
As a result of the success of NERICAs, the NERICAConsortium for Food Security in Sub-Saharan Africawas formed in April 2001.This consortium is made upof networking institutions and stakeholders, nationalagricultural research and extension systems, donors,NGOs, farmers’ organizations, and the private sector.The consortium intends to disseminate the NERICArice varieties widely and rapidly to poor farmers in Sub-Saharan Africa.
Source: CGIAR.
During the 1950s, more than 40,000 hectares wereterraced in Machakos, partly pushed by the govern-ment’s decision to allow Akamba farmers to growcoffee for export for the first time. Coffee can onlybe planted on steep slopes if they are terraced.
In 1956, the new and mainly African-staffed com-munity development service replaced the compulso-ry work gangs with the mwethyas, or traditionalwork party, whose members chose each other andtheir own leaders. For the first time in Akamba his-tory, women participated in the groups and wereelected to leadership positions. Without any gov-ernment aid, more terraces were built from 1960 to1980 than were built during the 1950s. In the early1980s, some 8,500 kilometers of terraces were builtannually. A 1998–99 aerial survey suggests thatabout 60 percent of the fields in Machakos are ter-raced, and many farmers also are using other con-servation measures.
Machakos also was helped by expanding marketopportunities, not only for coffee but for otherexport crops such as French beans, citrus, and man-goes. In addition, an estimated 41 percent of ruralincome came from nonfarm business and wages,which was often invested in farm improvementssuch as terraces and water storage tanks. Anotherimportant factor was a shift from central govern-ment decisionmaking about ecosystem issues togreater district-level participation.
AN ACTION AGENDA FOR LAND,WATER,AND FOOD PRODUCTION
Successfully promoting environmentally sound foodproduction requires action in five key areas: main-streaming integrated approaches to land and watermanagement; strengthening the enabling environ-ment; adopting good management practices andenvironmentally sound technologies; expanding andaccelerating capacity development; and strengthen-ing partnerships.
This action agenda is drawn from the March 2002GEF Roundtable on Land, Water, and Food Security,including both the background paper and the sum-mary of the meeting. The roundtable was co-chaired by H.E. Dr. S.W. Kazibwe, vice president ofthe Republic of Uganda, and Dr. M. S. Swaminathan,chairman of the M.S. Swaminathan ResearchFoundation.
Mainstreaming Integrated Approaches to Landand Water Management Integrated land and water management approachesprovide a comprehensive framework for countriesto manage land and water resources in a way thatrecognizes political and social factors as well as theneed to protect the integrity and function of eco-logical systems.
Resource owners, managers, upstream and down-stream users, and other stakeholders should partici-pate in resource allocation and management deci-sions, taking into account ecological, economic, andsocial factors. Such an approach minimizes conflictsover resource allocation and management. It alsofacilitates the integration of technical and engineeringsolutions with needed policy and institutional reforms.
Traditional or indigenous systems of naturalresources management are based on the same prin-ciples of integration.
Several countries have established river basin man-agement programs in an attempt to use integratedapproaches. For example, the Murray-Darling Basin(MDB) Initiative in Australia, which was started in1987, has:
� Introduced improved land management tech-niques to minimize the amount of irrigationwater being added to the water table. Newcrops and more efficient irrigation technologywill help support more sustainable land use.
� Constructed engineering works to intercepthighly saline groundwater and pump it to suitabledisposal sites before it flows into the main riversystem.
31L A N D , W AT E R , A N D F O O D P R O D U C T I O N
T H E C H A L L E N G E O F S U S TA I N A B I L I T Y32
� Adopted new operating rules to reduce evapora-tion losses from reservoirs.
The MDB also recognizes the importance of wet-lands in enhancing river water quality. The project isworking to enhance floodplain wetlands ecosys-tems. In addition, constructed wetlands are beingspecifically designed to reduce nutrient loads fromfarm runoff, sewage treatment, industrial plants,and urban runoff.
Throughout Australia, farmers and other ruralindustries are working with government and otherrural communities to solve rural problems. Morethan 2,000 voluntary landcare community groupsare currently working to develop more sustainablesystems of land and water use within catchments.
Strengthening the Enabling EnvironmentTo succeed, integrated land and water managementapproaches must be supported by appropriate poli-cies, regulations, and institutional arrangements.Countries should, therefore, give priority tostrengthening these arrangements in ways that
facilitate wider adoption of integrated and cross-sectoral approaches to land and water management.
Subsidies and pricing of inputs such as land, water,seeds, and agrochemicals are major policy issues.There is ample evidence that underpricing of naturalresources and subsidies for agricultural inputs canlead to overexploitation of those resources anddegradation of the environment (see Chapter 1).
Full-cost pricing of water is desirable in the longrun, but there are many alternatives that could bepolitically easier to initiate now. Under a tiered pric-ing scheme, for example, farmers would be chargedthe customary rate for perhaps 80 percent of theirwater use, a much higher rate for the next 10 percent,and the full marginal cost for the last 10 percent.
Another major policy issue is the security of landtenure and water rights. As described earlier,resource users are less willing to make investmentsto protect the environment when they have noownership or when access is restricted. In theabsence of such security, they focus on maximizing
L A N D , W AT E R , A N D F O O D P R O D U C T I O N 33
short-term benefits, often to the detriment ofthe environment. Policies on subsidies, pricing,tenure security, and other key issues should pro-mote equitable and reliable resource access, effi-cient resource use, and environmental protection.
Adopting Good Management Practices andEnvironmentally Sound TechnologiesAn important priority is to facilitate the develop-ment and wider adoption of good managementpractices and technologies, such as low or zerotillage and farming systems that use drought-resist-ant or low-water-consuming crop varieties as well asmore water-efficient irrigation systems. The develop-ment and adoption of better management practicesand technologies could be facilitated by collabora-tion among public and private international agricul-tural research centers, national research centers,policymakers, NGOs, and local resource users.
It is noteworthy, for example, that in Bangladeshthe treadle pump mentioned earlier has spreadentirely through activities of the private sector, withno government subsidies. A significant support sys-tem in Bangladesh—70 manufacturers, 830 dealers,and 2,500 installers—has also helped create jobsand raise incomes.
The 16 centers supported by CGIAR are playing avaluable role in facilitating the adoption of moresustainable practices. For example, the InternationalInstitute of Tropical Agriculture (IITA) is using inte-grated pest management strategies in many proj-ects in Sub-Saharan Africa. In dry savannah andSahel sites, striga (a parasitic weed), stemborers,and poor soil fertility are badly damaging cereal-based cropping systems. In Kenya, farmers arefighting striga and stemborers by combining astriga-tolerant maize variety developed by theKenya Agricultural Research Institute with the fod-der legume desmodium in an intercropping andhabitat management system that includes the useof Napier grass. More than 100 farmers in a pilotproject have experienced a 20-percent increase inmaize yields, and have a new market opportunityfor the sale of desmodium and Napier grass.
Expanding and Accelerating CapacityDevelopmentThe best information on the enabling environmentand on resource management practices and tech-nologies will not result in wider adoption of inte-grated land and water management approaches—unless there are people with the skills needed toplan and implement such programs. Governmentsneed to expand and accelerate capacity develop-ment activities through in-country formal and infor-mal educational programs, advanced training, andstaff exchanges among developing countries andbetween developed and developing nations.
Capacity development programs should be tailoredto the needs of specific stakeholder groups involvedin a particular resource management issue, andshould draw on the expertise and experience oflocal and international organizations. These pro-grams can help raise environmental awareness,improve technical skills, and provide facilities andequipment to support integrated natural resourcemanagement activities.
There are four priority groups for capacity develop-ment: national and local economic and develop-
“Poverty is the most criti-cal threat to sustainabledevelopment. The gapbetween the poor andthe rich is widening bythe day.“
Mohammed Valli MoosaMinister of Environmental Affairs and Tourism,South Africa
T H E C H A L L E N G E O F S U S TA I N A B I L I T Y34
ment planners; resource owners such as govern-ment entities, local communities, individuals, andprivate firms; resource managers such as govern-ment and private-sector employees and local com-munities; and resource users such as governmentagencies, local communities, andthe private sector.
Strengthening PartnershipsOne of the positive lessons fromthe Green Revolution is that part-nerships involving a broad rangeof government and nongovern-mental stakeholders, includinggovernment and private researchinstitutions, bilateral and multilat-eral development agencies, andfoundations, can play a majorrole in addressing the issue offood insecurity. Box 2.2 describesa successful example of howsuch a partnership developednew rice varieties for the Africanuplands.
Countries need to strengthenexisting partnerships or createnew ones to provide an effectivemechanism to achieve food andenvironmental security through integrated land and water management. Partnership arrangementscan help mobilize funds from a variety of sources,including local and national budgets, bilateraldevelopment cooperation agreements, and countryassistance programs of multilateral agencies andfoundations. Improved coordination would help toavoid duplication of effort as well as piecemeal
approaches to addressing food and environmentalsecurity issues.
Partnerships can provide legitimacy and technicalresources to a program, which in turn can improve
opportunities to leverage in-country policies and institu-tional reforms in support ofintegrated land and watermanagement. Partnershipscan also help to strengtheninformation exchanges—forexample, by establishingclearinghouses or providingtechnical assistance. Informationshould be accessible not justto scientists but also to poli-cymakers, resource managers,and resource users.
Partnerships can also play avaluable role in supportingresearch on analytical tools,management models, farmingsystems, and environmentallysound technologies. Forexample, bringing togetherthe expertise of internationaland national research centers
and the knowledge and experience of local policy-makers and farmer associations can have a majorimpact on the pace, quality, and relevance ofresearch. Priority should be given to improving theinfrastructure and capacity of national research cen-ters in developing countries—to make them effec-tive partners in international efforts to address foodand environmental security.
LAND, WATER, ANDFOOD PRODUCTIONTARGETS FOR 2015
� Reduce the number ofpeople suffering fromhunger by half between1990 and 2015, with a spe-cial focus on small-scalefarmers who produce amajor share of food indeveloping countries.
� Achieve a 30-percent gainin the efficient use of irri-gation water by 2015, withno net increase in waterdiversion over that used in 2000.
Consultative Group onInternational AgriculturalResearch (CGIAR). 2001.Nourishing a Peaceful Earth:The CGIAR’s Contributions.Washington, D.C.: CGIAR.
Dixon, J., A. Gulliver and D.Gibbon . 2001. Global FarmingSystems Study: Challenges andPriorities to 2030. Rome: FAO.
Food and Agriculture Organizationof the U.N. (FAO), Committeeon World Food Security. 2001.New Challenges to theAchievements of the WorldFood Summit Goals. Rome:FAO.
Global Environment Facility (GEF).“GEF Roundtable on Land,Water, and Food Security:Summary of the Co-Chairs.”New York, March 26, 2002.
———. “Integrated Land andWater Management for Foodand Environmental Security.”Paper prepared for the GEFRoundtable on Land, Water,and Food Security, New York,March 26, 2002.
———. “Strengthening theEnvironmental Dimensions ofSustainable Development:Toward an Action Agenda.”Paper prepared for theMinisterial Roundtable onFinancing Environment andSustainable Development,Second Session, Bali, Indonesia,June 4, 2002.
International Water ManagementInstitute (IWMI). World Waterand Climate Atlas. Available atwww.cgiar.org/iwmi/WAtlas/atlas.htm.
Kemper, Karin E., and DouglasOlson. 2000. “Water Pricing:The Dynamics of InstitutionalChange in Mexico and Ceara,Brazil.” In Dinar, Ariel, ed. ThePolitical Economy of WaterPricing Reforms. New York:Oxford University Press.
Pender, John, and Peter Hazell,eds. 2000. “PromotingSustainable Development inLess-Favored Areas.” InInternational Food PolicyResearch Institution 2020Vision, Focus 4. Washington,D.C.: IFPRI.
Pirot, J-Y, P-J Meynell, and D.Elder, eds. 2000. EcosystemManagement: Lessons fromAround the World: A Guide forDevelopment and ConservationPractitioners. Gland,Switzerland: IUCN.
Postel, Sanda. “RedesigningIrrigated Agriculture.” 2000. InState of the World 2000. NewYork: W.W. Norton & Co.
Rosegrant, Mark W., et. al..2001. Global Food Projectionsto 2020. Washington, D.C.:IFPRI.
Rosegrant, Mark. 1997. WaterResources in the Twenty-FirstCentury: Challenges andImplications for Action.Washington, D.C.: IFPRI.
Scherr, Sara J. 1999. “SoilDegradation: A Threat toDeveloping-Country FoodSecurity by 2020?” IFPRI Food, Agriculture, and theEnvironment Discussion Paper27. Washington, D.C.: IFPRI.
UNDP, UNEP, World Bank, andWorld Resources Institute.2000. World Resources 2000-2001: People and Ecosystems.Washington, D.C.: WorldResources Institute.
UNEP. 1999. GEO-2000: UNEP’sMillennium Report on theEnvironment. London:Earthscan Publications.
World Conservation Union(IUCN). 2000. Vision for Waterand Nature. Gland,Switzerland: IUCN.
World Water Council. 2000.World Water Vision: MakingWater Everybody’s Business.London: Earthscan Publications.
Worldwatch Institute. 2001. Stateof the World 2001. New York:W.W. Norton and Co..
———. 2002. State of the World2002. New York: W.W. Nortonand Co.
REFERENCES
L A N D , W AT E R , A N D F O O D P R O D U C T I O N 35
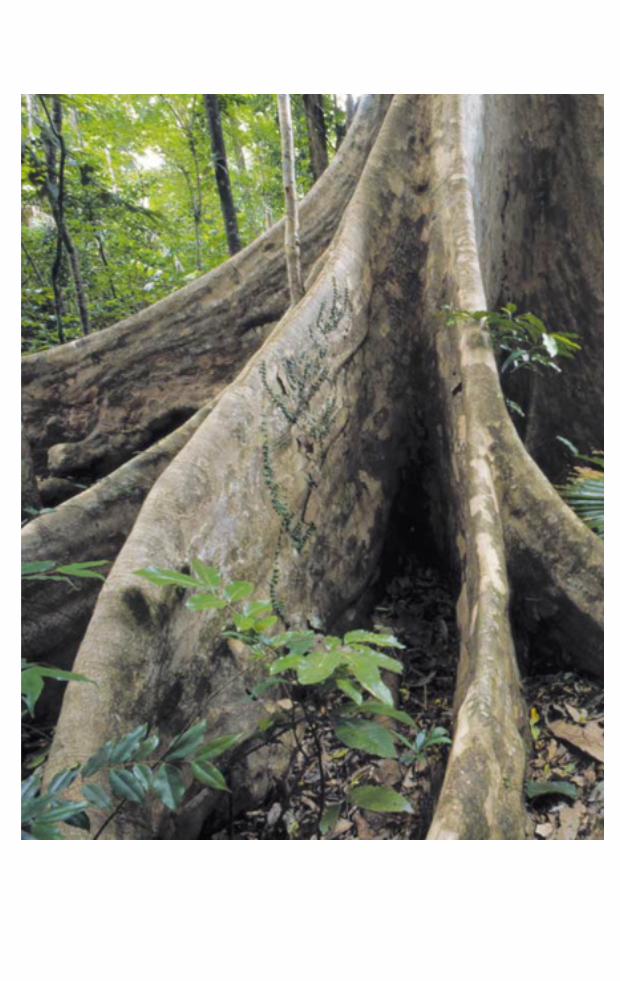
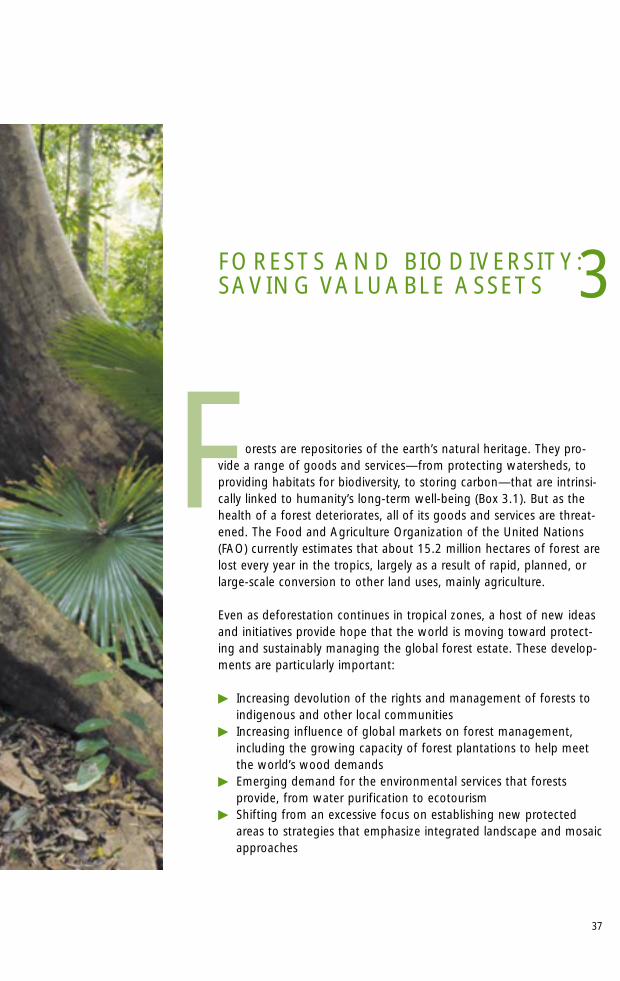
37
FORESTS AND BIODIVERSITY:SAVING VALUABLE ASSETS
F orests are repositories of the earth’s natural heritage. They pro-vide a range of goods and services—from protecting watersheds, toproviding habitats for biodiversity, to storing carbon—that are intrinsi-cally linked to humanity’s long-term well-being (Box 3.1). But as thehealth of a forest deteriorates, all of its goods and services are threat-ened. The Food and Agriculture Organization of the United Nations(FAO) currently estimates that about 15.2 million hectares of forest arelost every year in the tropics, largely as a result of rapid, planned, orlarge-scale conversion to other land uses, mainly agriculture.
Even as deforestation continues in tropical zones, a host of new ideasand initiatives provide hope that the world is moving toward protect-ing and sustainably managing the global forest estate. These develop-ments are particularly important:
� Increasing devolution of the rights and management of forests toindigenous and other local communities
� Increasing influence of global markets on forest management,including the growing capacity of forest plantations to help meetthe world’s wood demands
� Emerging demand for the environmental services that forests provide, from water purification to ecotourism
� Shifting from an excessive focus on establishing new protectedareas to strategies that emphasize integrated landscape and mosaicapproaches
3
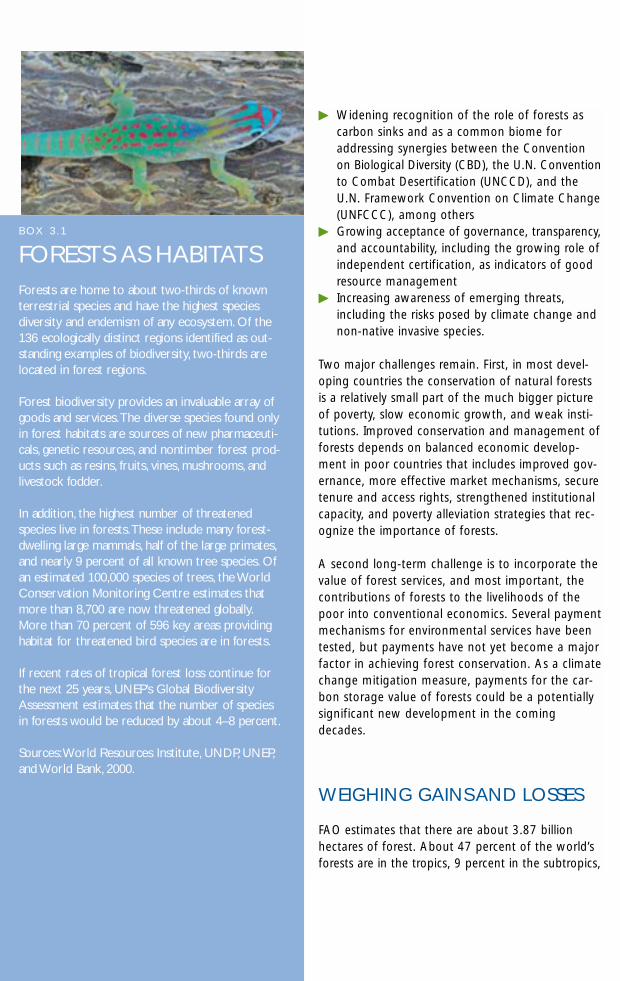
� Widening recognition of the role of forests ascarbon sinks and as a common biome foraddressing synergies between the Conventionon Biological Diversity (CBD), the U.N. Conventionto Combat Desertification (UNCCD), and theU.N. Framework Convention on Climate Change(UNFCCC), among others
� Growing acceptance of governance, transparency,and accountability, including the growing role ofindependent certification, as indicators of goodresource management
� Increasing awareness of emerging threats,including the risks posed by climate change andnon-native invasive species.
Two major challenges remain. First, in most devel-oping countries the conservation of natural forestsis a relatively small part of the much bigger pictureof poverty, slow economic growth, and weak insti-tutions. Improved conservation and management offorests depends on balanced economic develop-ment in poor countries that includes improved gov-ernance, more effective market mechanisms, securetenure and access rights, strengthened institutionalcapacity, and poverty alleviation strategies that rec-ognize the importance of forests.
A second long-term challenge is to incorporate thevalue of forest services, and most important, thecontributions of forests to the livelihoods of thepoor into conventional economics. Several paymentmechanisms for environmental services have beentested, but payments have not yet become a majorfactor in achieving forest conservation. As a climatechange mitigation measure, payments for the car-bon storage value of forests could be a potentiallysignificant new development in the comingdecades.
WEIGHING GAINS AND LOSSES
FAO estimates that there are about 3.87 billionhectares of forest. About 47 percent of the world’sforests are in the tropics, 9 percent in the subtropics,
B OX 3 . 1
FORESTS AS HABITATSForests are home to about two-thirds of knownterrestrial species and have the highest speciesdiversity and endemism of any ecosystem. Of the136 ecologically distinct regions identified as out-standing examples of biodiversity, two-thirds arelocated in forest regions.
Forest biodiversity provides an invaluable array ofgoods and services.The diverse species found onlyin forest habitats are sources of new pharmaceuti-cals, genetic resources, and nontimber forest prod-ucts such as resins, fruits, vines, mushrooms, andlivestock fodder.
In addition, the highest number of threatenedspecies live in forests.These include many forest-dwelling large mammals, half of the large primates,and nearly 9 percent of all known tree species. Ofan estimated 100,000 species of trees, the WorldConservation Monitoring Centre estimates thatmore than 8,700 are now threatened globally.More than 70 percent of 596 key areas providinghabitat for threatened bird species are in forests.
If recent rates of tropical forest loss continue forthe next 25 years, UNEP’s Global BiodiversityAssessment estimates that the number of speciesin forests would be reduced by about 4–8 percent.
Sources:World Resources Institute, UNDP, UNEP,and World Bank, 2000.
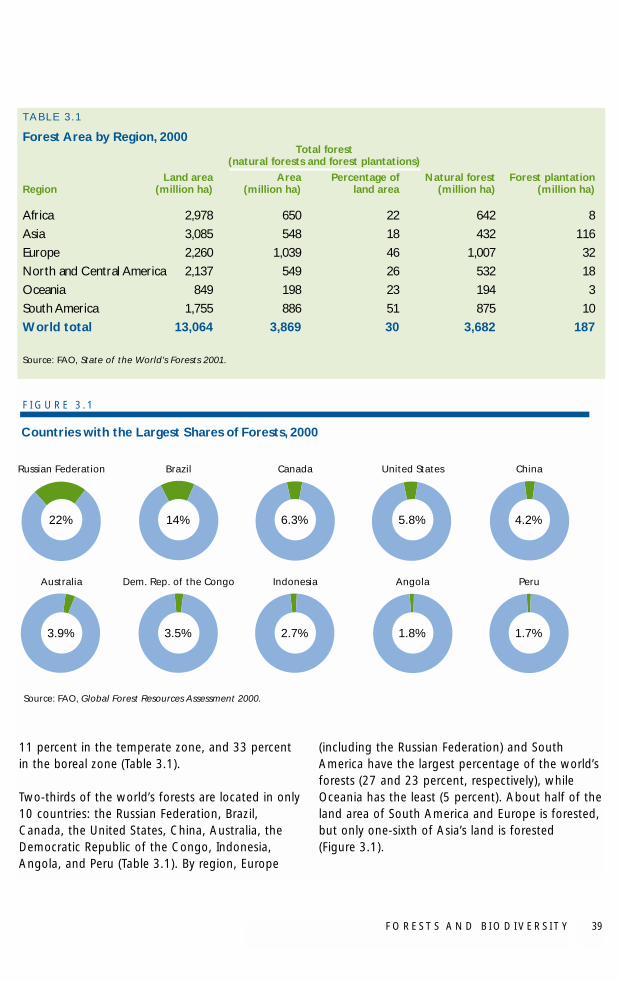
F O R E S T S A N D B I O D I V E R S I T Y 39
11 percent in the temperate zone, and 33 percentin the boreal zone (Table 3.1).
Two-thirds of the world’s forests are located in only10 countries: the Russian Federation, Brazil,Canada, the United States, China, Australia, theDemocratic Republic of the Congo, Indonesia,Angola, and Peru (Table 3.1). By region, Europe
(including the Russian Federation) and SouthAmerica have the largest percentage of the world’sforests (27 and 23 percent, respectively), whileOceania has the least (5 percent). About half of theland area of South America and Europe is forested,but only one-sixth of Asia’s land is forested(Figure 3.1).
TA B L E 3 . 1
Forest Area by Region, 2000Total forest
(natural forests and forest plantations)
Land area Area Percentage of Natural forest Forest plantationRegion (million ha) (million ha) land area (million ha) (million ha)
Africa 2,978 650 22 642 8
Asia 3,085 548 18 432 116
Europe 2,260 1,039 46 1,007 32
North and Central America 2,137 549 26 532 18
Oceania 849 198 23 194 3
South America 1,755 886 51 875 10
World total 13,064 3,869 30 3,682 187
Source: FAO, State of the World’s Forests 2001.
Countries with the Largest Shares of Forests, 2000
Source: FAO, Global Forest Resources Assessment 2000.
Russian Federation Brazil Canada United States China
Australia Dem. Rep. of the Congo Indonesia Angola Peru
F I G U R E 3 . 1
22% 14% 6.3% 5.8% 4.2%
3.9% 3.5% 2.7% 1.8% 1.7%
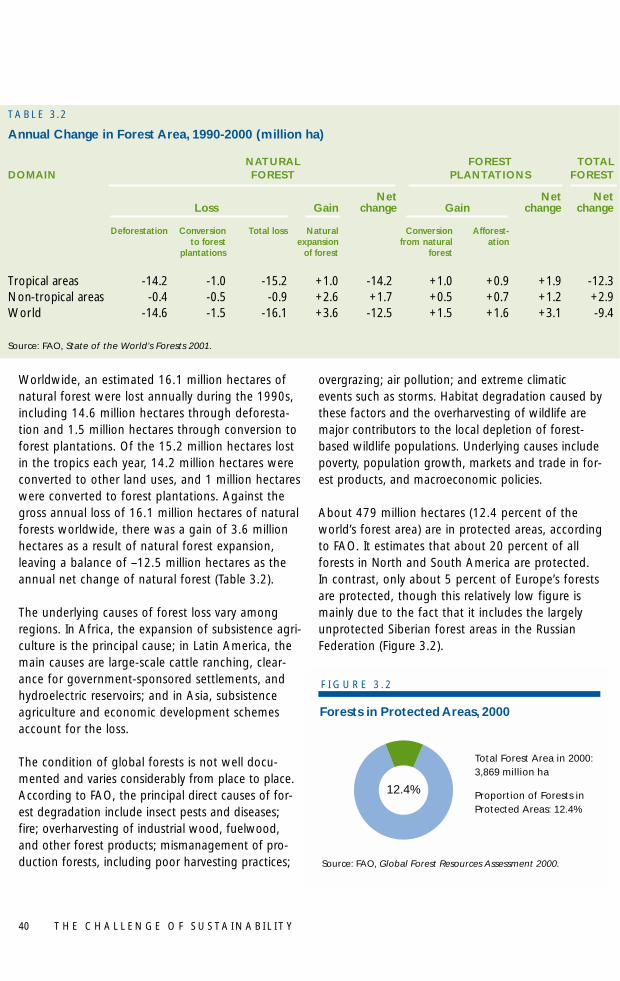
Worldwide, an estimated 16.1 million hectares ofnatural forest were lost annually during the 1990s,including 14.6 million hectares through deforesta-tion and 1.5 million hectares through conversion toforest plantations. Of the 15.2 million hectares lostin the tropics each year, 14.2 million hectares wereconverted to other land uses, and 1 million hectareswere converted to forest plantations. Against thegross annual loss of 16.1 million hectares of naturalforests worldwide, there was a gain of 3.6 millionhectares as a result of natural forest expansion,leaving a balance of –12.5 million hectares as theannual net change of natural forest (Table 3.2).
The underlying causes of forest loss vary amongregions. In Africa, the expansion of subsistence agri-culture is the principal cause; in Latin America, themain causes are large-scale cattle ranching, clear-ance for government-sponsored settlements, andhydroelectric reservoirs; and in Asia, subsistenceagriculture and economic development schemesaccount for the loss.
The condition of global forests is not well docu-mented and varies considerably from place to place.According to FAO, the principal direct causes of for-est degradation include insect pests and diseases;fire; overharvesting of industrial wood, fuelwood,and other forest products; mismanagement of pro-duction forests, including poor harvesting practices;
overgrazing; air pollution; and extreme climaticevents such as storms. Habitat degradation caused bythese factors and the overharvesting of wildlife aremajor contributors to the local depletion of forest-based wildlife populations. Underlying causes includepoverty, population growth, markets and trade in for-est products, and macroeconomic policies.
About 479 million hectares (12.4 percent of theworld’s forest area) are in protected areas, accordingto FAO. It estimates that about 20 percent of allforests in North and South America are protected.In contrast, only about 5 percent of Europe’s forestsare protected, though this relatively low figure ismainly due to the fact that it includes the largelyunprotected Siberian forest areas in the RussianFederation (Figure 3.2).
T H E C H A L L E N G E O F S U S TA I N A B I L I T Y40
Source: FAO, Global Forest Resources Assessment 2000.
Total Forest Area in 2000:3,869 million ha
Proportion of Forests in Protected Areas: 12.4%
12.4%
Forests in Protected Areas, 2000
F I G U R E 3 . 2
TA B L E 3 . 2
Annual Change in Forest Area, 1990-2000 (million ha)
NATURAL FOREST TOTALDOMAIN FOREST PLANTATIONS FOREST
Net Net NetLoss Gain change Gain change change
Deforestation Conversion Total loss Natural Conversion Afforest-to forest expansion from natural ation
plantations of forest forest
Tropical areas -14.2 -1.0 -15.2 +1.0 -14.2 +1.0 +0.9 +1.9 -12.3Non-tropical areas -0.4 -0.5 -0.9 +2.6 +1.7 +0.5 +0.7 +1.2 +2.9World -14.6 -1.5 -16.1 +3.6 -12.5 +1.5 +1.6 +3.1 -9.4
Source: FAO, State of the World’s Forests 2001.
F O R E S T S A N D B I O D I V E R S I T Y 41
By region, FAO found that:
� The bulk of tropical forests in the African GreatLakes region are unprotected.
� In Asia, most closed forests in Papua New Guineaand Indonesia are unprotected and threatenedby logging, agricultural clearing, or mining.
� Europe’s last few large blocks of forest area inSweden and Finland are well protected.
� Russia’s boreal forests are still largely intact, butthe percentage of protected area is very low.
These estimates are based on a new global map ofprotected forest areas developed for FAO in collabo-ration with the U.N. Environment Programme’sWorld Conservation Monitoring Centre (UNEP-WCMC). In addition, industrial countries reportedon protected forest areas in response to question-naires prepared by the U.N. Economic Commissionfor Europe and FAO. Protected areas are classifiedaccording to the categories established by theIUCN. The raw data in the UNEP-WCMC databaseincludes all land under protected management sta-tus, not just forestland. The UNEP-WCMC globalprotected areas map was overlaid with a global for-est cover map to develop an updated global pro-tected forests map.
FAO noted that there are continuing difficulties inobtaining a consistent approach for comparing for-est areas that countries report as protected, sothese global statistics may not be representativeof the actual protection afforded to forests indifferent countries. Further, many parks mayonly be “paper” parks. In China, for example,by 1997 only two-thirds of all nature reservesactually had staff and budgets for managementand protection.
CHANGING LANDSCAPES
Since the 1992 Rio Earth Summit, a great deal haschanged in the forest sector, providing opportuni-ties for expanded conservation and sustainable use
of forests and biodiversity in support of poverty alle-viation. For example:
� In the environmental area, important develop-ments include increased recognition of majorenvironmental threats such as invasive speciesand climate change, and the growing interest in wider approaches to forest and biodiversityprotection.
� In the economic area, key trends include marketchanges such as the increased role of forestplantations, the greater influence of global mar-kets on forest management, and the emerginginterest in systems of payment for ecologicalservices.
� In the social and political areas, major changesinclude a dramatic increase in indigenous andother community forest ownership and manage-ment, greater attention to governance, and thegrowing role of independent certification.
New Environmental Perspectives
Emerging threats. Partly as a result of the rise inglobal trade, the problem of non-native speciesinvasions has increased dramatically. Between 1965and 1998, imports of agricultural products andindustrial raw materials increased ninefold. In theprocess, many non-native species were uninten-tionally introduced as contaminants in the move-ment of goods.
Non-native invasive species in forests can createunstable ecosystems, increase the negative impactsof fire, impede or stop vital species interactions,promote the extinction of species that are symbioticwith native forest species, and alter key ecosystemfunctions (Box 3.2).
As consensus builds that global climate change isunder way, there is a heightened understanding ofthe implications for forests. Studies show that thegreater frequency of extreme climatic events affectsforests significantly. High-intensity windstorms andfloods become “gap-forming” processes that favorintroduced species, which tend to be reproduced
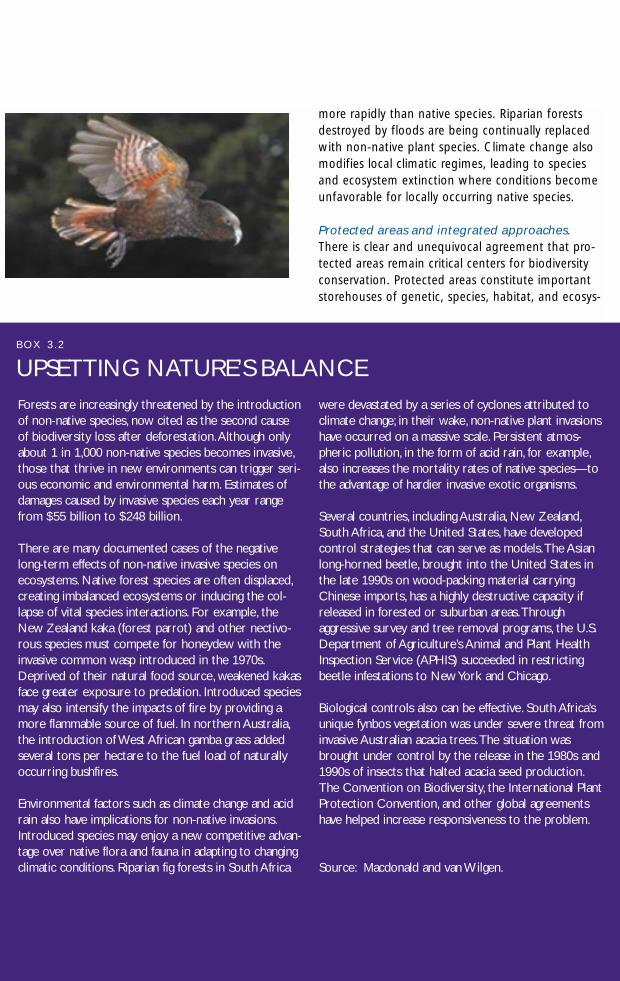
more rapidly than native species. Riparian forestsdestroyed by floods are being continually replacedwith non-native plant species. Climate change alsomodifies local climatic regimes, leading to speciesand ecosystem extinction where conditions becomeunfavorable for locally occurring native species.
Protected areas and integrated approaches.There is clear and unequivocal agreement that pro-tected areas remain critical centers for biodiversityconservation. Protected areas constitute importantstorehouses of genetic, species, habitat, and ecosys-
Forests are increasingly threatened by the introductionof non-native species, now cited as the second causeof biodiversity loss after deforestation.Although onlyabout 1 in 1,000 non-native species becomes invasive,those that thrive in new environments can trigger seri-ous economic and environmental harm. Estimates ofdamages caused by invasive species each year rangefrom $55 billion to $248 billion.
There are many documented cases of the negativelong-term effects of non-native invasive species onecosystems. Native forest species are often displaced,creating imbalanced ecosystems or inducing the col-lapse of vital species interactions. For example, theNew Zealand kaka (forest parrot) and other nectivo-rous species must compete for honeydew with theinvasive common wasp introduced in the 1970s.Deprived of their natural food source, weakened kakasface greater exposure to predation. Introduced speciesmay also intensify the impacts of fire by providing amore flammable source of fuel. In northern Australia,the introduction of West African gamba grass addedseveral tons per hectare to the fuel load of naturallyoccurring bushfires.
Environmental factors such as climate change and acidrain also have implications for non-native invasions.Introduced species may enjoy a new competitive advan-tage over native flora and fauna in adapting to changingclimatic conditions. Riparian fig forests in South Africa
were devastated by a series of cyclones attributed toclimate change; in their wake, non-native plant invasionshave occurred on a massive scale. Persistent atmos-pheric pollution, in the form of acid rain, for example,also increases the mortality rates of native species—tothe advantage of hardier invasive exotic organisms.
Several countries, including Australia, New Zealand,South Africa, and the United States, have developedcontrol strategies that can serve as models.The Asianlong-horned beetle, brought into the United States inthe late 1990s on wood-packing material carryingChinese imports, has a highly destructive capacity ifreleased in forested or suburban areas.Throughaggressive survey and tree removal programs, the U.S.Department of Agriculture’s Animal and Plant HealthInspection Service (APHIS) succeeded in restrictingbeetle infestations to New York and Chicago.
Biological controls also can be effective. South Africa’sunique fynbos vegetation was under severe threat frominvasive Australian acacia trees.The situation wasbrought under control by the release in the 1980s and1990s of insects that halted acacia seed production.The Convention on Biodiversity, the International PlantProtection Convention, and other global agreementshave helped increase responsiveness to the problem.
Source: Macdonald and van Wilgen.
B OX 3 . 2
UPSETTING NATURE’S BALANCE
F O R E S T S A N D B I O D I V E R S I T Y 43
tem diversity and are supported by a wide range ofstakeholders. However, there is also a strong emerg-ing consensus that—for pragmatic, scientific, andtechnical reasons—conservation efforts must extendbeyond protected areas. There are limits to a coun-try’s set-aside areas. Even the most ambitious sup-porters of biodiversity protection recognize thatmost countries will resist designating more thanabout 10 percent of their land as protected areas,so there is clearly a need to balance conservationwith sustainable use and sustainable developmentoptions to satisfy economic and social needs.
From a scientific standpoint, the scope for biodiver-sity conservation would be enhanced through theadoption of a landscape approach that involves amosaic of land uses, including protected and pro-duction landscapes. There is also evidence thatmany species may only be conserved within amatrix of land uses, and that such spatial arrange-ments are necessary for long-term solutions.
Building on its experience and responding to newguidance from the Convention on BiologicalDiversity (CBD), GEF is embarking on strategicchanges in the way it targets biodiversity conserva-tion, including forests. In particular, GEF has adopteda program on Integrated Ecosystem Managementthat deals with forest conservation issues in abroader socioeconomic and political context.Recent support provided by GEF to China andTanzania has sought to mainstream biodiversity considerations into forest-sector reforms.
Through its small grants program, GEF has support-ed about 40 projects to help biodiversity conserva-tion within Brazil’s vast Cerrado ecosystem. Projectactivities include extraction and commercial process-ing of medicinal plants, flowers, and native fruits;actions to control the use of fire; promotion of solarenergy; income generation from ecotourism; andgeneration of sustainable livelihoods from beekeep-ing and other rural technologies.
Another important strategy that has emerged fromthis integrated approach is the use of “corridors” to
connect protected areas into a much larger land-scape. A mosaic of land use corridors enableswildlife to move across wider ranges, promotesgenetic exchange, and helps preserve and increaseexisting populations. The Mesoamerican BiologicalCorridor in Central America, which GEF is supporting,has been a model of the corridor concept (Box 3.3).
New Economics
Production and consumption trends. Domesticdemand for forest products is growing in relationto export demand, especially in developing coun-tries; in fact, almost 90 percent of all commercialroundwood is traded domestically. For a varietyof reasons, including the higher costs of naturalforest management, forest plantations are gaininga competitive advantage over natural forests.In 2002, plantations occupied only 5 percent ofthe global forest cover but supplied 35 percentof global roundwood; this trend is expectedto continue.
In Chile and New Zealand, plantation forests nowmeet all domestic wood needs and support a signifi-cant export industry. In Brazil, plantations suppliedmore than 70 percent of the industrial roundwoodused in 1997, even though plantations cover only4.5 million hectares, and natural forests cover over360 million hectares. Asia’s plantations accountedfor 62 percent of the global industrial total in 2000,according to FAO. In Australia, Brazil, Chile, Indonesia,Malaysia, New Zealand, and South Africa, planta-tions are meeting the growing demand for wood,and this trend is expected to continue, with the private sector increasingly involved.
The expansion of plantations affects natural forestconservation in two ways. First, plantations decreasethe pressure on natural forests for wood by gener-ating alternative supplies. Yet their much higherproductivity per hectare supplies the wood marketwith cheaper wood, indirectly diminishing the valueof natural forests as wood producers and reducingthe competitiveness of natural forests relative toalternative land uses.
Second, the collapse of production from naturalforests would be unwelcome, particularly for theindigenous and other communities that have onlyrecently begun to regain the authority to use theirforest assets. Balancing the tradeoffs between plan-tation and natural forest supply, and strengtheningthe role of communities and smallholders in both ofthese activities will be increasingly important. Thekey issue is how to generate returns and revenuefrom natural forests.
Globalization. The increased globalization of theforest sector poses uncertainties for developingcountries, but it provides opportunities as well.Investor and consumer demands for socially andenvironmentally responsible forestry are beginningto drive improved management. For example,socially responsible investment funds, with morethan $1.4 trillion in assets under management, aredeveloping positive indicators for sustainableforestry investments, using certification as a bench-mark to verify sound practices in the global market.
This demand for sound forestry is also giving rise toa new generation of forest companies such asGlobal Forest Products in South Africa andRenewable Resources LLC in the Brazilian Amazon.These companies use business models that combineprofitability with sound social and environmentalmanagement. With more communities and indige-nous groups involved in forest ownership, manycompanies are forming partnerships with indige-nous and other community suppliers. In Canada,Weyerhaeuser and other firms are joining with indige-nous groups to manage natural forests and supplymills. There are now community–private sector part-nerships in at least 57 countries.
Valuing forests. Forests provide a host of valuableecological services. Although these have quantifiableeconomic value, they are generally provided at no cost.For example:
� Forests contain about two-thirds of known ter-restrial species, have the highest species diversityof any ecosystem, and the highest number of
threatened species. Most forest plant species,including timber trees and other forest productssuch as sago palms and rattans, depend on ani-mal pollination for reproduction. Without a widevariety of forest habitats, animal pollinationcould be disrupted. Many plants, especially intropical forests, also require animals for success-ful seed dispersal.
� Forest vegetation and soils hold almost 40 per-cent of all carbon stored in terrestrial ecosys-tems. And release of carbon as a result of defor-estation contributes to global climate change.For example, a closed primary forest containssome 280 tons of carbon per hectare; if convert-ed to pasture or permanent agriculture, it wouldrelease more than 200 tons of carbon into theatmosphere.
� By filtering freshwater and reducing soil erosionand sedimentation, forests play an importantrole in maintaining clean water supplies andreducing the severity of flooding. For example,erosion rates in slash-and-burn crop fields are 10times higher than in natural forests. Road con-struction associated with logging, though only asmall percentage of the logged area, can con-tribute as much as 80 percent of the sedimentthat enters streams.
� By providing shade and surface cooling, forestshelp moderate local temperature extremes.
� An estimated 99 percent of potential crop pestsare controlled by natural enemies, many ofwhich require forest habitats. If this natural pestcontrol had to be replaced with chemical pesti-cides, the annual cost to U.S. agriculture alone isestimated at $54 billion.
Experience to date suggests that watershed protec-tion can be an inexpensive way to save water andavoid the costs of filtration. In the United States,many cities have found that every $1 invested inwatershed protection can save up to $200 in costsfor new filtration and water treatment facilities. In South Africa, the Working for Water Programclears non-native tree species and increases stream-flow at a fraction of the cost of new diversion orreservoir projects.
T H E C H A L L E N G E O F S U S TA I N A B I L I T Y44
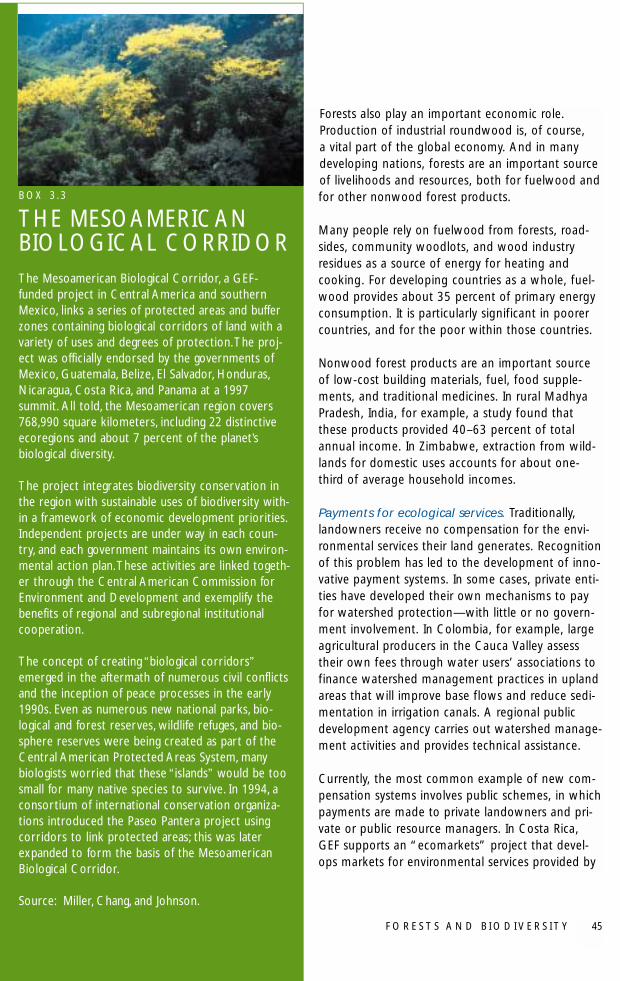
Forests also play an important economic role.Production of industrial roundwood is, of course, a vital part of the global economy. And in manydeveloping nations, forests are an important sourceof livelihoods and resources, both for fuelwood andfor other nonwood forest products.
Many people rely on fuelwood from forests, road-sides, community woodlots, and wood industryresidues as a source of energy for heating andcooking. For developing countries as a whole, fuel-wood provides about 35 percent of primary energyconsumption. It is particularly significant in poorercountries, and for the poor within those countries.
Nonwood forest products are an important sourceof low-cost building materials, fuel, food supple-ments, and traditional medicines. In rural MadhyaPradesh, India, for example, a study found thatthese products provided 40–63 percent of totalannual income. In Zimbabwe, extraction from wild-lands for domestic uses accounts for about one-third of average household incomes.
Payments for ecological services. Traditionally,landowners receive no compensation for the envi-ronmental services their land generates. Recognitionof this problem has led to the development of inno-vative payment systems. In some cases, private enti-ties have developed their own mechanisms to payfor watershed protection—with little or no govern-ment involvement. In Colombia, for example, largeagricultural producers in the Cauca Valley assesstheir own fees through water users’ associations tofinance watershed management practices in uplandareas that will improve base flows and reduce sedi-mentation in irrigation canals. A regional publicdevelopment agency carries out watershed manage-ment activities and provides technical assistance.
Currently, the most common example of new com-pensation systems involves public schemes, in whichpayments are made to private landowners and pri-vate or public resource managers. In Costa Rica,GEF supports an “ecomarkets” project that devel-ops markets for environmental services provided by
F O R E S T S A N D B I O D I V E R S I T Y 45
B OX 3 . 3
THE MESOAMERICANBIOLOGICAL CORRIDORThe Mesoamerican Biological Corridor, a GEF-funded project in Central America and southernMexico, links a series of protected areas and bufferzones containing biological corridors of land with avariety of uses and degrees of protection.The proj-ect was officially endorsed by the governments ofMexico, Guatemala, Belize, El Salvador, Honduras,Nicaragua, Costa Rica, and Panama at a 1997summit. All told, the Mesoamerican region covers768,990 square kilometers, including 22 distinctiveecoregions and about 7 percent of the planet’sbiological diversity.
The project integrates biodiversity conservation inthe region with sustainable uses of biodiversity with-in a framework of economic development priorities.Independent projects are under way in each coun-try, and each government maintains its own environ-mental action plan.These activities are linked togeth-er through the Central American Commission forEnvironment and Development and exemplify thebenefits of regional and subregional institutionalcooperation.
The concept of creating “biological corridors”emerged in the aftermath of numerous civil conflictsand the inception of peace processes in the early1990s. Even as numerous new national parks, bio-logical and forest reserves, wildlife refuges, and bio-sphere reserves were being created as part of theCentral American Protected Areas System, manybiologists worried that these “islands” would be toosmall for many native species to survive. In 1994, aconsortium of international conservation organiza-tions introduced the Paseo Pantera project usingcorridors to link protected areas; this was laterexpanded to form the basis of the MesoamericanBiological Corridor.
Source: Miller, Chang, and Johnson.
T H E C H A L L E N G E O F S U S TA I N A B I L I T Y46
forests and compensates private landowners forprotecting biodiversity on their lands. In Ecuador,the municipal water authorities in the cities of Quitoand Cuenca are allocating part of their revenues toprotect their water sources. Quito receives the bulkof its water from several protected areas, and ispaying for improved management in those areas.
In about six states in Brazil, an ecological value-added tax finances payments to landowners whomaintain natural forests. This mechanism generatesabout $22 million a year in the state of Paraná and$6 million a year in Minas Gerais. In less than adecade, each state has placed more than 1 millionhectares under protection.
For these compensation systems to be successful, aWorld Bank study found that payments need to beongoing and carefully targeted, and that care needsto be taken to avoid inappropriate incentives.
New Politics On the social and political front, significant newdevelopments include increased community controlof forests and greater attention to governance,international standards, and transparency mecha-nisms such as certification.
Community control. As part of the global trendtoward decentralization and the recognition ofindigenous and community rights, many developingnations are transferring either legal or administra-tive control over forests to indigenous and commu-nity groups. In the most forest-rich developingcountries, nearly one-fourth of the forest estate isnow legally owned (14 percent) or officially admin-istered (8 percent) by indigenous and rural commu-nities. Communities legally own or administer atleast 380 million hectares of forest. The percentageof forest under community control has doubled inthe last 10 years, and could double again by 2020.This change is supported by parallel trends in manycountries to reform land tenure and enhance thesecurity of private property rights.
This transition represents great progress in rational-izing and securing forest ownership and establish-ing more conducive conditions for sustainable forestmanagement, as well as a historic opportunity todramatically improve the livelihoods of millions offorest inhabitants.
Certification. When efforts to halt deforestation intropical forests made little progress in the late 1980sand early 1990s, some environmental groups beganthinking about ways to encourage markets to givepreference to timber from sustainably managedtropical forests. The result was forest certification, a procedure that uses predetermined standards toassure the quality of forest management operations.Certification may include an agreement on the rightor license to use a special label on traded forestproducts, coupled with independent verification ofcompliance to these standards.
Since the early 1990s, some important strides havebeen made in forest certification:
� The area certified by accredited certifiers of theForest Stewardship Council has reached 22 millionhectares, up from 10 million in 1998. Sweden andPoland account for 61 percent of the total.
� In Europe, 21.9 million hectares of Finland’sforests have been certified under the FinnishForest Certification System; another 6.9 millionhectares have been certified in Norway andSweden under national certification schemes.And in Canada, about 44 million hectares offorestland have been certified according to the ISO14001 standard of the International Organizationfor Standardization.
� The Pan-European Forest CertificationFramework provides a mechanism for mutualrecognition among different Europeannational systems.
� The Indonesia Ecolabelling Institute (LEI) hasdeveloped criteria and indicators for the auditingof forest management on logging concessions,as well as ecolabelling of products from these
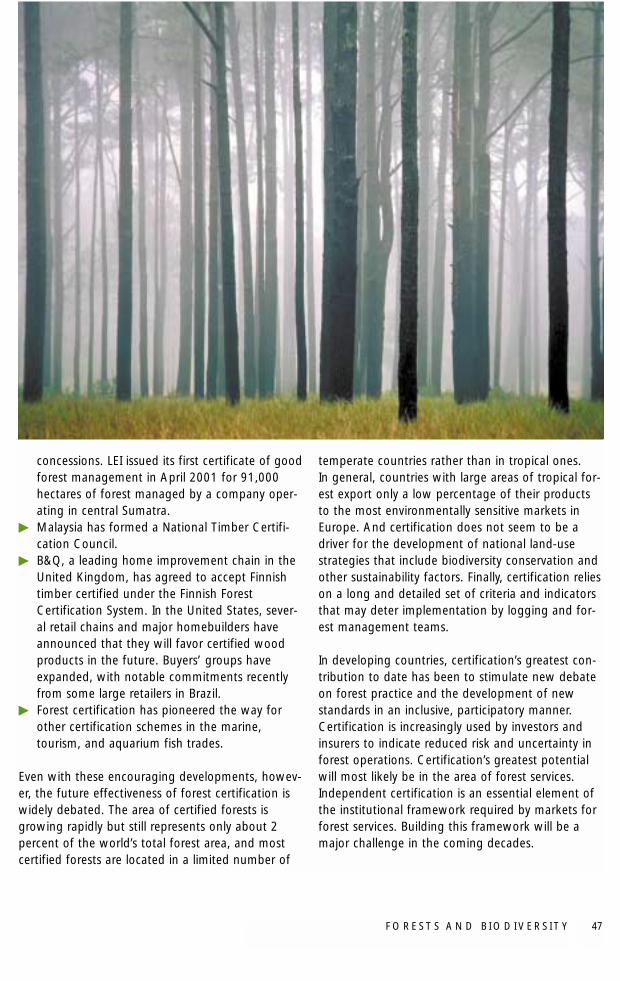
F O R E S T S A N D B I O D I V E R S I T Y 47
concessions. LEI issued its first certificate of goodforest management in April 2001 for 91,000hectares of forest managed by a company oper-ating in central Sumatra.
� Malaysia has formed a National Timber Certifi-cation Council.
� B&Q, a leading home improvement chain in theUnited Kingdom, has agreed to accept Finnishtimber certified under the Finnish ForestCertification System. In the United States, sever-al retail chains and major homebuilders haveannounced that they will favor certified woodproducts in the future. Buyers’ groups haveexpanded, with notable commitments recentlyfrom some large retailers in Brazil.
� Forest certification has pioneered the way forother certification schemes in the marine,tourism, and aquarium fish trades.
Even with these encouraging developments, howev-er, the future effectiveness of forest certification iswidely debated. The area of certified forests isgrowing rapidly but still represents only about 2percent of the world’s total forest area, and mostcertified forests are located in a limited number of
temperate countries rather than in tropical ones.In general, countries with large areas of tropical for-est export only a low percentage of their productsto the most environmentally sensitive markets inEurope. And certification does not seem to be adriver for the development of national land-usestrategies that include biodiversity conservation andother sustainability factors. Finally, certification relieson a long and detailed set of criteria and indicatorsthat may deter implementation by logging and for-est management teams.
In developing countries, certification’s greatest con-tribution to date has been to stimulate new debateon forest practice and the development of newstandards in an inclusive, participatory manner.Certification is increasingly used by investors andinsurers to indicate reduced risk and uncertainty inforest operations. Certification’s greatest potentialwill most likely be in the area of forest services.Independent certification is an essential element ofthe institutional framework required by markets forforest services. Building this framework will be amajor challenge in the coming decades.
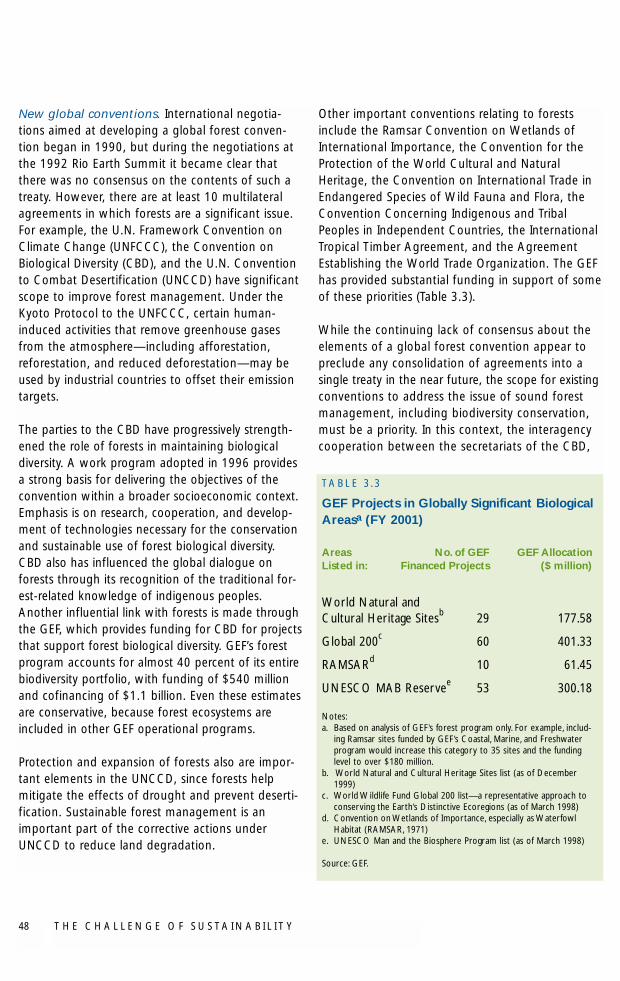
T H E C H A L L E N G E O F S U S TA I N A B I L I T Y48
New global conventions. International negotia-tions aimed at developing a global forest conven-tion began in 1990, but during the negotiations atthe 1992 Rio Earth Summit it became clear thatthere was no consensus on the contents of such atreaty. However, there are at least 10 multilateralagreements in which forests are a significant issue.For example, the U.N. Framework Convention onClimate Change (UNFCCC), the Convention onBiological Diversity (CBD), and the U.N. Conventionto Combat Desertification (UNCCD) have significantscope to improve forest management. Under theKyoto Protocol to the UNFCCC, certain human-induced activities that remove greenhouse gasesfrom the atmosphere—including afforestation,reforestation, and reduced deforestation—may beused by industrial countries to offset their emissiontargets.
The parties to the CBD have progressively strength-ened the role of forests in maintaining biologicaldiversity. A work program adopted in 1996 providesa strong basis for delivering the objectives of theconvention within a broader socioeconomic context.Emphasis is on research, cooperation, and develop-ment of technologies necessary for the conservationand sustainable use of forest biological diversity.CBD also has influenced the global dialogue onforests through its recognition of the traditional for-est-related knowledge of indigenous peoples.Another influential link with forests is made throughthe GEF, which provides funding for CBD for projectsthat support forest biological diversity. GEF’s forestprogram accounts for almost 40 percent of its entirebiodiversity portfolio, with funding of $540 millionand cofinancing of $1.1 billion. Even these estimatesare conservative, because forest ecosystems areincluded in other GEF operational programs.
Protection and expansion of forests also are impor-tant elements in the UNCCD, since forests help mitigate the effects of drought and prevent deserti-fication. Sustainable forest management is animportant part of the corrective actions underUNCCD to reduce land degradation.
Other important conventions relating to forestsinclude the Ramsar Convention on Wetlands ofInternational Importance, the Convention for theProtection of the World Cultural and NaturalHeritage, the Convention on International Trade inEndangered Species of Wild Fauna and Flora, theConvention Concerning Indigenous and TribalPeoples in Independent Countries, the InternationalTropical Timber Agreement, and the AgreementEstablishing the World Trade Organization. The GEFhas provided substantial funding in support of someof these priorities (Table 3.3).
While the continuing lack of consensus about theelements of a global forest convention appear topreclude any consolidation of agreements into asingle treaty in the near future, the scope for existingconventions to address the issue of sound forestmanagement, including biodiversity conservation,must be a priority. In this context, the interagencycooperation between the secretariats of the CBD,
TA B L E 3 . 3
GEF Projects in Globally Significant BiologicalAreasa (FY 2001)
Areas No. of GEF GEF AllocationListed in: Financed Projects ($ million)
World Natural and Cultural Heritage Sitesb 29 177.58
Global 200c 60 401.33
RAMSARd 10 61.45
UNESCO MAB Reservee 53 300.18
Notes:a. Based on analysis of GEF’s forest program only. For example, includ-
ing Ramsar sites funded by GEF’s Coastal, Marine, and Freshwaterprogram would increase this category to 35 sites and the fundinglevel to over $180 million.
b. World Natural and Cultural Heritage Sites list (as of December1999)
c. World Wildlife Fund Global 200 list—a representative approach toconserving the Earth’s Distinctive Ecoregions (as of March 1998)
d. Convention on Wetlands of Importance, especially as WaterfowlHabitat (RAMSAR, 1971)
e. UNESCO Man and the Biosphere Program list (as of March 1998)
Source: GEF.
UNFCCC and UNCCD, as well as the role of theCollaborative Partnership on Forests, must be fullyexploited.
AN AGENDA FOR FORESTS
The agenda for forests in the coming decade mustaddress a wide array of issues. Three are particularlysignificant: creating a conservation infrastructure;providing incentives for conservation and sustain-able forest management; and intensifying efforts toscale up and replicate successful initiatives.
The agenda described here was drawn largely fromthe GEF Roundtable on Forests held in New York inMarch 2002; from the summary of the roundtableprepared by Jeffrey Sayer, roundtable chair and seniorassociate at the World Wide Fund for Nature; andfrom a background paper prepared for the round-table by Andy White, the director of Forest Trends.
A Conservation InfrastructureBetter governance in developing countries couldimprove incentives for conservation-oriented pri-vate-sector participation, encourage more effectivemodels of community forest management, andgenerate international support and additional finan-cial resources for public forest management.
Costa Rica’s exemplary management of forestshinges on the fact that it has invested substantiallyin its institutional and legislative framework andnurtured capacity so that public, private, and com-munity stakeholders can benefit from forest conser-vation measures. The challenge for developingcountries is to create or strengthen their “conserva-tion infrastructure” so they have the tools andcapacity needed to capitalize on and benefit fromopportunities in the forest and other related sectors.Targeting policies, institutional frameworks, andhuman capacity is critical.
Another important challenge is to develop a newgeneration of institutions with the capacity to deal
F O R E S T S A N D B I O D I V E R S I T Y 49
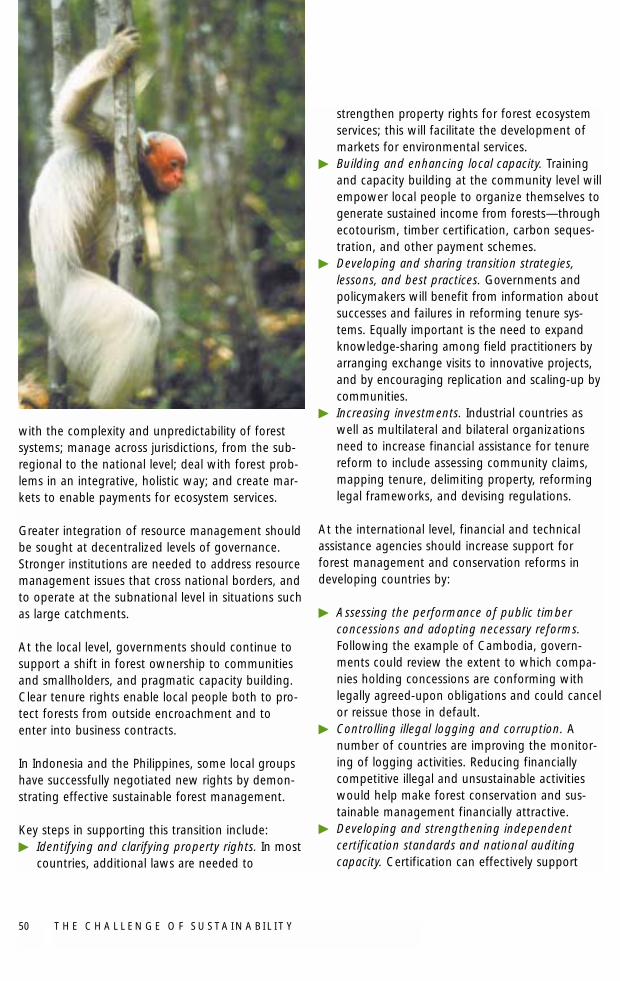
T H E C H A L L E N G E O F S U S TA I N A B I L I T Y50
with the complexity and unpredictability of forestsystems; manage across jurisdictions, from the sub-regional to the national level; deal with forest prob-lems in an integrative, holistic way; and create mar-kets to enable payments for ecosystem services.
Greater integration of resource management shouldbe sought at decentralized levels of governance.Stronger institutions are needed to address resourcemanagement issues that cross national borders, andto operate at the subnational level in situations suchas large catchments.
At the local level, governments should continue tosupport a shift in forest ownership to communitiesand smallholders, and pragmatic capacity building.Clear tenure rights enable local people both to pro-tect forests from outside encroachment and toenter into business contracts.
In Indonesia and the Philippines, some local groupshave successfully negotiated new rights by demon-strating effective sustainable forest management.
Key steps in supporting this transition include:� Identifying and clarifying property rights. In most
countries, additional laws are needed to
strengthen property rights for forest ecosystemservices; this will facilitate the development ofmarkets for environmental services.
� Building and enhancing local capacity. Trainingand capacity building at the community level willempower local people to organize themselves togenerate sustained income from forests—throughecotourism, timber certification, carbon seques-tration, and other payment schemes.
� Developing and sharing transition strategies, lessons, and best practices. Governments andpolicymakers will benefit from information aboutsuccesses and failures in reforming tenure sys-tems. Equally important is the need to expandknowledge-sharing among field practitioners byarranging exchange visits to innovative projects,and by encouraging replication and scaling-up bycommunities.
� Increasing investments. Industrial countries aswell as multilateral and bilateral organizationsneed to increase financial assistance for tenurereform to include assessing community claims,mapping tenure, delimiting property, reforminglegal frameworks, and devising regulations.
At the international level, financial and technicalassistance agencies should increase support forforest management and conservation reforms indeveloping countries by:
� Assessing the performance of public timber concessions and adopting necessary reforms.Following the example of Cambodia, govern-ments could review the extent to which compa-nies holding concessions are conforming withlegally agreed-upon obligations and could cancelor reissue those in default.
� Controlling illegal logging and corruption. Anumber of countries are improving the monitor-ing of logging activities. Reducing financiallycompetitive illegal and unsustainable activitieswould help make forest conservation and sus-tainable management financially attractive.
� Developing and strengthening independentcertification standards and national auditingcapacity. Certification can effectively support
F O R E S T S A N D B I O D I V E R S I T Y 51
governance, yet national-level capacity is oftenlimited, thereby increasing the costs of adoption.
� Adopting systematic independent audits of gov-ernment performance in public forest manage-ment. Several countries, notably Malaysia, haveadopted a process of independent audits. Theseassessments help governments check their ownperformance and provide assurance to citizensand buyers.
� Setting conservation goals. Governments couldheighten the visibility of forest conservation bycreating conservation goals.
Incentives for ConservationPolicy reforms can encourage investment, help makeforests more competitive with alternate land uses,and strengthen the role of forestry in poverty reduc-tion. Reducing the regulatory burden on local forestproducers can help them use their own forests orpublic stands to enter markets. In many cases, regu-lations can be replaced by technical assistance pro-grams that promote and monitor best practices, orby certification. But the requirements of forest man-agement plans and certification programs need tobe simplified if small-scale producers are to complyand benefit from them.
It is also important to level the playing field forsmall-scale producers. In Bolivia, forest policyreforms have included formal recognition of indige-nous groups’ forest rights and have exemptedsmall-scale forest producers from some require-ments. Reforms included lower concession fees, asimplified process for accessing municipal forests,and assistance with marketing and forest certifica-tion. In addition, the active involvement of localproducers in forest policy negotiations will lead tomore practical, realistic, and lower-cost laws, marketregulations, and development plans.
Promoting community forest enterprises and jointventures is important. There are many examples ofsound community management where forest har-vest levels appear sustainable, and where benefitsare distributed to community members. In Mexico,for example, community-owned forests contribute
substantially to community livelihoods and domesticwood supply.
There are important new opportunities for small-holders and communities in managing forests, espe-cially given the reduced supply of tropical hard-woods and the increased environmental conscience ofinvestors and forest product companies. Capturingthese opportunities will require a number of steps,including:
� Characterizing and establishing markets for low-income producers. Preliminary studies indicatethere is high potential for low-income producers,but more research is needed to better charac-terize the potential in each market segment,identify where the potential is strongest, anddescribe the steps required to enable communityparticipation.
� Improving market position. Long-term growth intimber and nontimber forest products requiresbuilding supply networks that link producers todomestic markets with increased production effi-ciency. To raise incomes significantly, producersneed to establish a competitive position. This maymean improving production and marketing tech-nology, product quality, and reliability of supply.
� Strengthening producer organizations. Wheremarket institutions are underdeveloped, produc-er organizations can fill the gaps by, for exam-ple, setting up transport services, scaling up sup-ply, or leveraging credit. Producer organizationsalso need to develop the skills to make capitalinvestments and establish and maintain qualitycontrols.
� Promoting strategic business partnerships.Partnerships can benefit both private industryand local producers. Industrial firms gainaccess to wood fiber and nonwood products ata competitive cost, while local producers canobtain high-quality planting materials, technicalassistance, quality control, and investmentresources for expansion, marketing, and busi-ness expertise. In Canada, for example, IisaakForest Resources is jointly owned by the FirstNations groups of Clayoquot Sound and
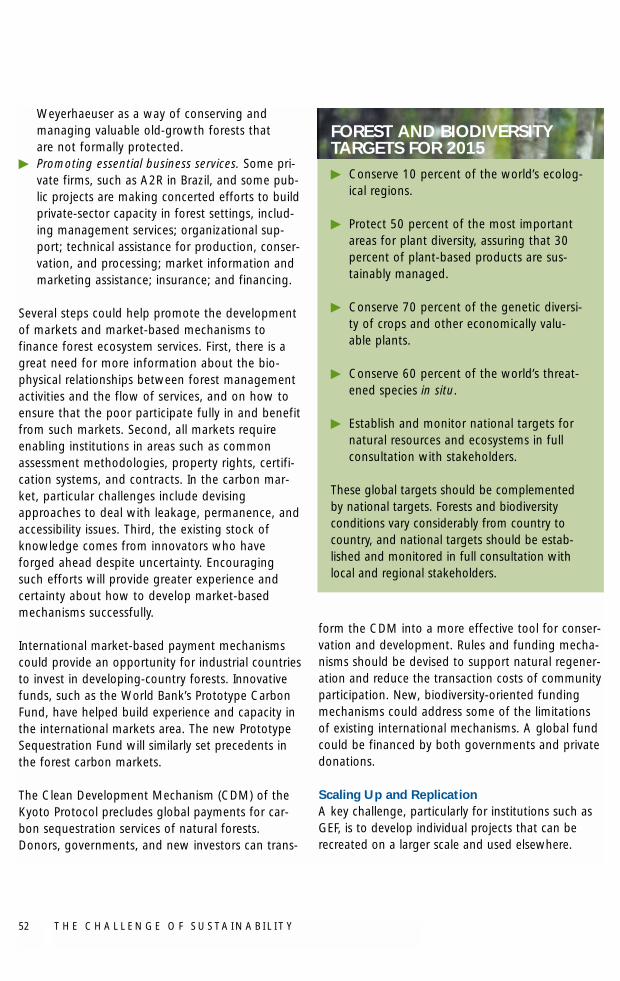
T H E C H A L L E N G E O F S U S TA I N A B I L I T Y52
Weyerhaeuser as a way of conserving andmanaging valuable old-growth forests thatare not formally protected.
� Promoting essential business services. Some pri-vate firms, such as A2R in Brazil, and some pub-lic projects are making concerted efforts to buildprivate-sector capacity in forest settings, includ-ing management services; organizational sup-port; technical assistance for production, conser-vation, and processing; market information andmarketing assistance; insurance; and financing.
Several steps could help promote the developmentof markets and market-based mechanisms tofinance forest ecosystem services. First, there is agreat need for more information about the bio-physical relationships between forest managementactivities and the flow of services, and on how toensure that the poor participate fully in and benefitfrom such markets. Second, all markets requireenabling institutions in areas such as commonassessment methodologies, property rights, certifi-cation systems, and contracts. In the carbon mar-ket, particular challenges include devisingapproaches to deal with leakage, permanence, andaccessibility issues. Third, the existing stock ofknowledge comes from innovators who haveforged ahead despite uncertainty. Encouragingsuch efforts will provide greater experience andcertainty about how to develop market-basedmechanisms successfully.
International market-based payment mechanismscould provide an opportunity for industrial countriesto invest in developing-country forests. Innovativefunds, such as the World Bank’s Prototype CarbonFund, have helped build experience and capacity inthe international markets area. The new PrototypeSequestration Fund will similarly set precedents inthe forest carbon markets.
The Clean Development Mechanism (CDM) of theKyoto Protocol precludes global payments for car-bon sequestration services of natural forests.Donors, governments, and new investors can trans-
form the CDM into a more effective tool for conser-vation and development. Rules and funding mecha-nisms should be devised to support natural regener-ation and reduce the transaction costs of communityparticipation. New, biodiversity-oriented fundingmechanisms could address some of the limitationsof existing international mechanisms. A global fundcould be financed by both governments and privatedonations.
Scaling Up and ReplicationA key challenge, particularly for institutions such asGEF, is to develop individual projects that can berecreated on a larger scale and used elsewhere.
FOREST AND BIODIVERSITYTARGETS FOR 2015� Conserve 10 percent of the world’s ecolog-
ical regions.
� Protect 50 percent of the most importantareas for plant diversity, assuring that 30percent of plant-based products are sus-tainably managed.
� Conserve 70 percent of the genetic diversi-ty of crops and other economically valu-able plants.
� Conserve 60 percent of the world’s threat-ened species in situ.
� Establish and monitor national targets fornatural resources and ecosystems in fullconsultation with stakeholders.
These global targets should be complementedby national targets. Forests and biodiversityconditions vary considerably from country tocountry, and national targets should be estab-lished and monitored in full consultation withlocal and regional stakeholders.
F O R E S T S A N D B I O D I V E R S I T Y 53
Several GEF biodiversity projects have been repli-cated by governments, conservationists, and localpopulations.
� Trust funds initiated in the Uganda MgahingaGorilla National Park and Bwindi ImpenetrableNational Park projects have produced sustainablefunding for GEF biodiversity projects in a countrywhere budget allocations for conservation arevery low.
� An integrated management system developedfor the Dana Nature Reserve in Jordan hasbeen applied to all five other protected areasin the country.
� The success of the Southern Africa BotanicalNetwork in capacity development for taxonomyhas been replicated in Eastern Africa and theCaribbean.
� In Samoa, the Marine Protected Area project hasraised extensive community support, and othervillages are copying the project.
One important way to encourage scaling up andreplication is through further cooperation with theprivate sector. GEF is building direct partnershipswith private-sector entities, UNDP is involving majorcompanies in biodiversity conservation as cofundersand sources of advice, and the World Bank andInternational Finance Corporation are catalyzingprivate-sector participation in the climate portfoliothrough instruments such as the PrototypeCarbon Fund.
Natural resource management projects can be sus-tained and enlarged when they generate work,income, and economic progress. GEF has used avariety of instruments to encourage such outcomes,including direct investment, subsidies, credits, con-servation trusts, and alternative livelihood activities.
Education and outreach also are important tools toencourage scaling up and replication. In Africa,GEF has disseminated information about projectactivities and ways to manage global environmen-tal issues through outreach programs, interpreta-tion centers, signage, and newsletters. In Uganda,for example, key awareness messages on the glob-al benefits of managing the Minziro forest areyielding tangible results: 8,400 people in morethan 1,800 households in three villages are pro-moting reforestation.
Another valuable strategy is to broaden the baseof public consultation. For example, the GEF hashelped to develop an NGO culture in some coun-tries where such groups are not routinely accept-ed. There is a similar need to engage a broadrange of entities in the private sector.
“The protection ofthe environment andsustainable develop-ment are equallypressing challenges of our time.“
Fernando Henrique CardosoPresident of Brazil
T H E C H A L L E N G E O F S U S TA I N A B I L I T Y54
Black-Arbelaez, Thomas. 2002.“Applying CDM to BiologicalRestoration Projects inDeveloping Nations: Key Issuesfor Policy Makers and ProjectManagers.” Discussion paperprepared for the GEF ForestsRoundtable, New York, March11, 2002.
Cavendish, William. “RuralLivelihoods and Non-TimberForest Products.” Unpublishedpaper. Centre for the Study ofAfrican Economies, Universityof Oxford, U.K.
Food and AgricultureOrganization of the UnitedNations (FAO). 2000. GlobalForest Resources Assessment2000. Rome: FAO.
———. 2001. State of theWorld’s Forests 2001. Rome:FAO.
Global Environment Facility (GEF)Secretariat. 2000. “GEF’sStrategy for AchievingSustained Benefits inBiodiversity Conservation.”Washington, D.C.
———. 2001. Second OverallPerformance Study (OPS2).Washington, D.C.
———. 2000. CapacityDevelopment Initiative, CountryCapacity Development Needsand Priorities: A Synthesis.Washington, D.C.: GEF.
———. 2002. “Strengtheningthe Environmental Dimensionsof Sustainable Development:Toward an Action Agenda.”Paper prepared for theMinisterial Roundtable onFinancing Environment andSustainable Development,Second Session, Bali,Indonesia, June 4, 2002.
International Finance Corporation(IFC). 2002. The Environmentaland Social Challenges of PrivateSector Projects: IFC’sExperience. Washington, D.C.:IFC.
International Tropical TimberOrganization (ITTO). 2001.“Forest Certification andBiodiversity: Opposites orComplements?” Paper pre-pared by the Secretariat ofITTO for the GlobalEnvironment Facility, November2001. Yokohama, Japan.
Johnson, Nels, Andy White, andDanièle Perrot-Maître. 2001.Developing Markets for WaterServices from Forests: Issuesand Lessons for Innovators.Washington, D.C.: ForestTrends, WRI, and theKatoomba Group.
Macdonald, Ian A.W., Brian W.van Wilgen, et. al. 2002.“Invasive Alien Species: AGlobal Threat to ForestEcosystems.” Paper preparedfor the GEF Forests Roundtable,New York, March 11, 2002.
Matthews, Emily, Richard Payne,Mark Rohweder, and SiobhanMurray. 2000. Pilot Analysis ofGlobal Ecosystems: ForestEcosystems. Washington, D.C:World Resources Institute.
Miller, Kenton, Elsa Chang, andNels Johnson. 2001. DefiningCommon Ground for theMesoamerican BiologicalCorridor. Washington, D.C.:World Resources Institute.
Nasi, Robert, Sven Wunder andJose J. Campos. 2002. “ForestEcosystem Services: WhereforeArt Thou?” Discussion paperprepared for the GEF ForestsRoundtable, New York, March11, 2002.
REFERENCES
F O R E S T S A N D B I O D I V E R S I T Y 55
Pagiola, Stefano. 2002. “Payingfor Water Services in CentralAmerica: Learning from CostaRica.” In Stefano Pagiola,Joshua Bishop, and NatashaLandell-Mills, eds. SellingEnvironmental Services:Market-based Mechanisms forConservation, London:Earthscan.
Pagiola, Stefano, and G. Platais.Forthcoming. Payments forEnvironmental Services.Washington, D.C.: World Bank.
Powell, Ian, Andy White andNatasha Landell-Mills. 2002.Developing Markets for theEcosystem Services of Forests.Washington, D.C.: ForestTrends.
Rice, Richard E., Cheri A. Sugal,Shelley M. Ratay, and GustavoA. B. da Fonseca. 2001.“Sustainable ForestManagement: A Review ofConventional Wisdom.”Advances in AppliedBiodiversity Science, no. 3.
Ruis, B.M.G.S. 2001. “No ForestConvention But Ten TreeTreaties.” Unasylva 52: 3-13.
Sayer, Jeff, “Chairman’sSummary.” Paper prepared forthe GEF Forests Roundtable,New York, March 11, 2002.
Scherr, Sara J., Andy White andDavid Kaimowitz. 2002.Making Forest Markets Workfor Low-Income Producers.Washington, D.C.: ForestTrends.
White, Andrew, Augusta Molnar,Alejandra Martin, and ArnoldoContreras-Hermosilla, “ToJohanneseburg and Beyond:Strategic Options to Advancethe Conservation of NaturalForests.” Discussion paper pre-pared for the GEF ForestsRoundtable, New York, March11, 2002.
World Bank. 2001. GlobalDevelopment Finance: BuildingCoalitions for EffectiveDevelopment Finance.Washington, D.C.: World Bank.
———. 2001. Indonesia:Environment and NaturalResource Management in aTime of Transition.Washington, D.C.: World Bank
World Resources Institute, UNDP,UNEP, and the World Bank.2000. World Resources 2000-2001: People and Ecosystems.Washington, D.C.: WorldResources Institute.
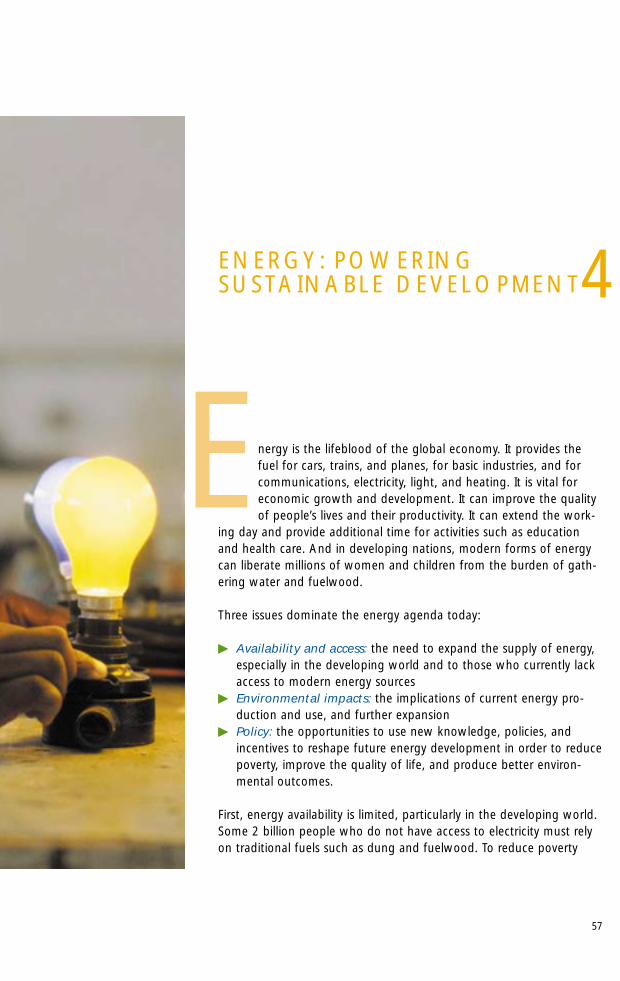
57
ENERGY: POWERING SUSTAINABLE DEVELOPMENT
nergy is the lifeblood of the global economy. It provides thefuel for cars, trains, and planes, for basic industries, and forcommunications, electricity, light, and heating. It is vital foreconomic growth and development. It can improve the qualityof people’s lives and their productivity. It can extend the work-
ing day and provide additional time for activities such as educationand health care. And in developing nations, modern forms of energycan liberate millions of women and children from the burden of gath-ering water and fuelwood.
Three issues dominate the energy agenda today:
� Availability and access: the need to expand the supply of energy,especially in the developing world and to those who currently lackaccess to modern energy sources
� Environmental impacts: the implications of current energy pro-duction and use, and further expansion
� Policy: the opportunities to use new knowledge, policies, andincentives to reshape future energy development in order to reducepoverty, improve the quality of life, and produce better environ-mental outcomes.
First, energy availability is limited, particularly in the developing world.Some 2 billion people who do not have access to electricity must relyon traditional fuels such as dung and fuelwood. To reduce poverty
4
E
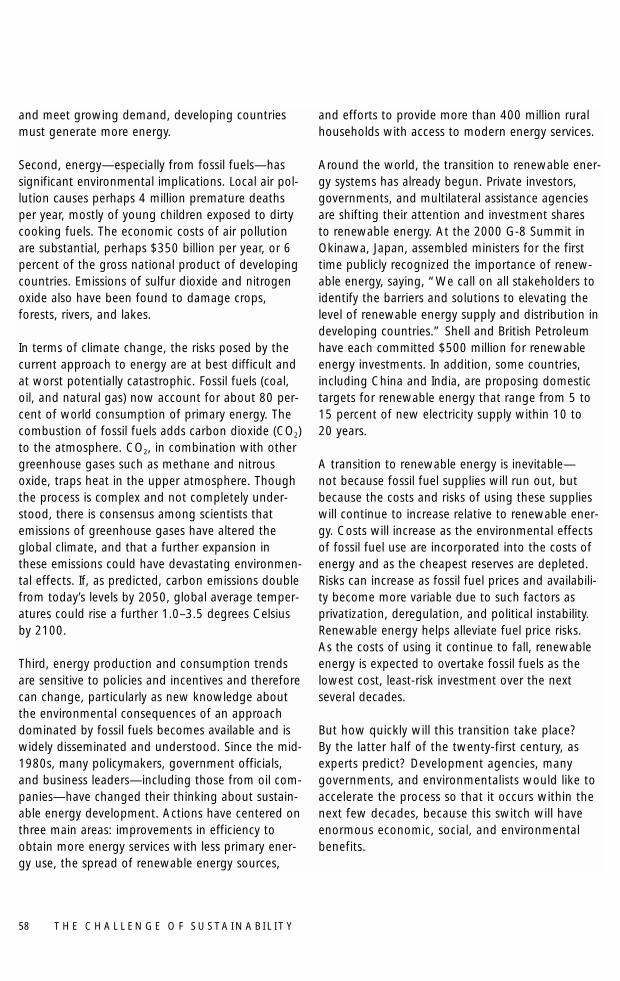
and meet growing demand, developing countriesmust generate more energy.
Second, energy—especially from fossil fuels—hassignificant environmental implications. Local air pol-lution causes perhaps 4 million premature deathsper year, mostly of young children exposed to dirtycooking fuels. The economic costs of air pollutionare substantial, perhaps $350 billion per year, or 6percent of the gross national product of developingcountries. Emissions of sulfur dioxide and nitrogenoxide also have been found to damage crops,forests, rivers, and lakes.
In terms of climate change, the risks posed by thecurrent approach to energy are at best difficult andat worst potentially catastrophic. Fossil fuels (coal,oil, and natural gas) now account for about 80 per-cent of world consumption of primary energy. Thecombustion of fossil fuels adds carbon dioxide (CO2)to the atmosphere. CO2, in combination with othergreenhouse gases such as methane and nitrousoxide, traps heat in the upper atmosphere. Thoughthe process is complex and not completely under-stood, there is consensus among scientists thatemissions of greenhouse gases have altered theglobal climate, and that a further expansion inthese emissions could have devastating environmen-tal effects. If, as predicted, carbon emissions doublefrom today’s levels by 2050, global average temper-atures could rise a further 1.0–3.5 degrees Celsiusby 2100.
Third, energy production and consumption trendsare sensitive to policies and incentives and thereforecan change, particularly as new knowledge aboutthe environmental consequences of an approachdominated by fossil fuels becomes available and iswidely disseminated and understood. Since the mid-1980s, many policymakers, government officials,and business leaders—including those from oil com-panies—have changed their thinking about sustain-able energy development. Actions have centered onthree main areas: improvements in efficiency toobtain more energy services with less primary ener-gy use, the spread of renewable energy sources,
and efforts to provide more than 400 million ruralhouseholds with access to modern energy services.
Around the world, the transition to renewable ener-gy systems has already begun. Private investors,governments, and multilateral assistance agenciesare shifting their attention and investment shares to renewable energy. At the 2000 G-8 Summit inOkinawa, Japan, assembled ministers for the firsttime publicly recognized the importance of renew-able energy, saying, “We call on all stakeholders toidentify the barriers and solutions to elevating thelevel of renewable energy supply and distribution indeveloping countries.” Shell and British Petroleumhave each committed $500 million for renewableenergy investments. In addition, some countries,including China and India, are proposing domestictargets for renewable energy that range from 5 to15 percent of new electricity supply within 10 to20 years.
A transition to renewable energy is inevitable—not because fossil fuel supplies will run out, butbecause the costs and risks of using these supplieswill continue to increase relative to renewable ener-gy. Costs will increase as the environmental effectsof fossil fuel use are incorporated into the costs ofenergy and as the cheapest reserves are depleted.Risks can increase as fossil fuel prices and availabili-ty become more variable due to such factors as privatization, deregulation, and political instability.Renewable energy helps alleviate fuel price risks. As the costs of using it continue to fall, renewableenergy is expected to overtake fossil fuels as thelowest cost, least-risk investment over the next several decades.
But how quickly will this transition take place? By the latter half of the twenty-first century, asexperts predict? Development agencies, many governments, and environmentalists would like toaccelerate the process so that it occurs within thenext few decades, because this switch will haveenormous economic, social, and environmentalbenefits.
T H E C H A L L E N G E O F S U S TA I N A B I L I T Y58
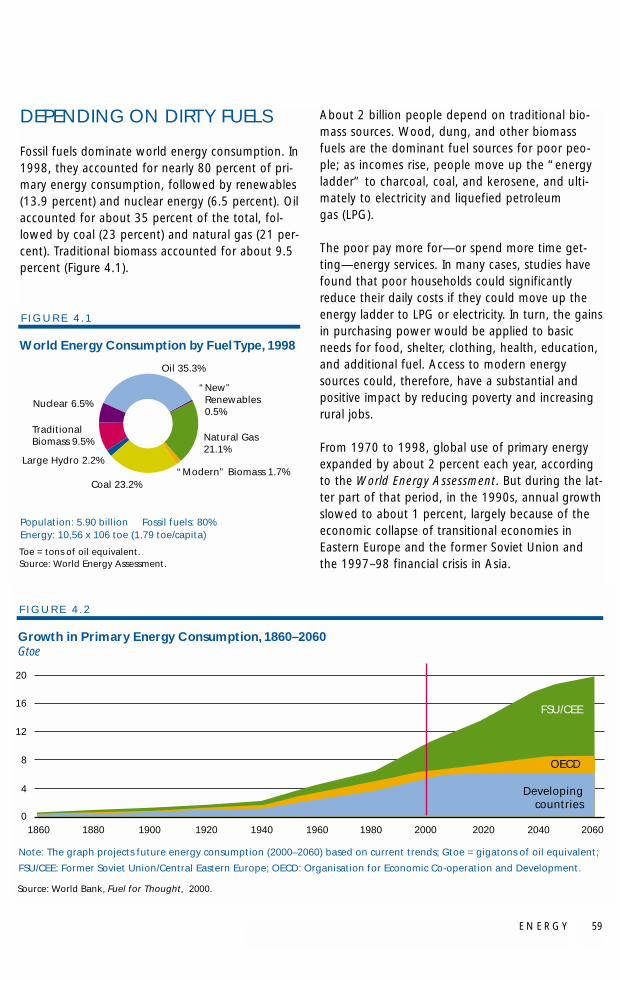
E N E R G Y 59
DEPENDING ON DIRTY FUELS
Fossil fuels dominate world energy consumption. In1998, they accounted for nearly 80 percent of pri-mary energy consumption, followed by renewables(13.9 percent) and nuclear energy (6.5 percent). Oilaccounted for about 35 percent of the total, fol-lowed by coal (23 percent) and natural gas (21 per-cent). Traditional biomass accounted for about 9.5percent (Figure 4.1).
About 2 billion people depend on traditional bio-mass sources. Wood, dung, and other biomassfuels are the dominant fuel sources for poor peo-ple; as incomes rise, people move up the “energyladder” to charcoal, coal, and kerosene, and ulti-mately to electricity and liquefied petroleumgas (LPG).
The poor pay more for—or spend more time get-ting—energy services. In many cases, studies havefound that poor households could significantlyreduce their daily costs if they could move up theenergy ladder to LPG or electricity. In turn, the gainsin purchasing power would be applied to basicneeds for food, shelter, clothing, health, education,and additional fuel. Access to modern energysources could, therefore, have a substantial andpositive impact by reducing poverty and increasingrural jobs.
From 1970 to 1998, global use of primary energyexpanded by about 2 percent each year, accordingto the World Energy Assessment. But during the lat-ter part of that period, in the 1990s, annual growthslowed to about 1 percent, largely because of theeconomic collapse of transitional economies inEastern Europe and the former Soviet Union andthe 1997–98 financial crisis in Asia.
Toe = tons of oil equivalent.Source: World Energy Assessment.
Population: 5.90 billion Fossil fuels: 80%Energy: 10,56 x 10⁶ toe (1.79 toe/capita)
World Energy Consumption by Fuel Type, 1998
F I G U R E 4 . 1
Nuclear 6.5%
Oil 35.3%
“New” Renewables 0.5%
Natural Gas 21.1%
“Modern” Biomass 1.7%Coal 23.2%
Large Hydro 2.2%
Traditional Biomass 9.5%
Source: World Bank, Fuel for Thought, 2000.
Note: The graph projects future energy consumption (2000–2060) based on current trends; Gtoe = gigatons of oil equivalent;
FSU/CEE: Former Soviet Union/Central Eastern Europe; OECD: Organisation for Economic Co-operation and Development.
Growth in Primary Energy Consumption, 1860–2060Gtoe
F I G U R E 4 . 2
01860 1880 1900 1920 1940 1960 1980 2000 2020 2040 2060
4
8
12
16
20
FSU/CEE
OECD
Developingcountries
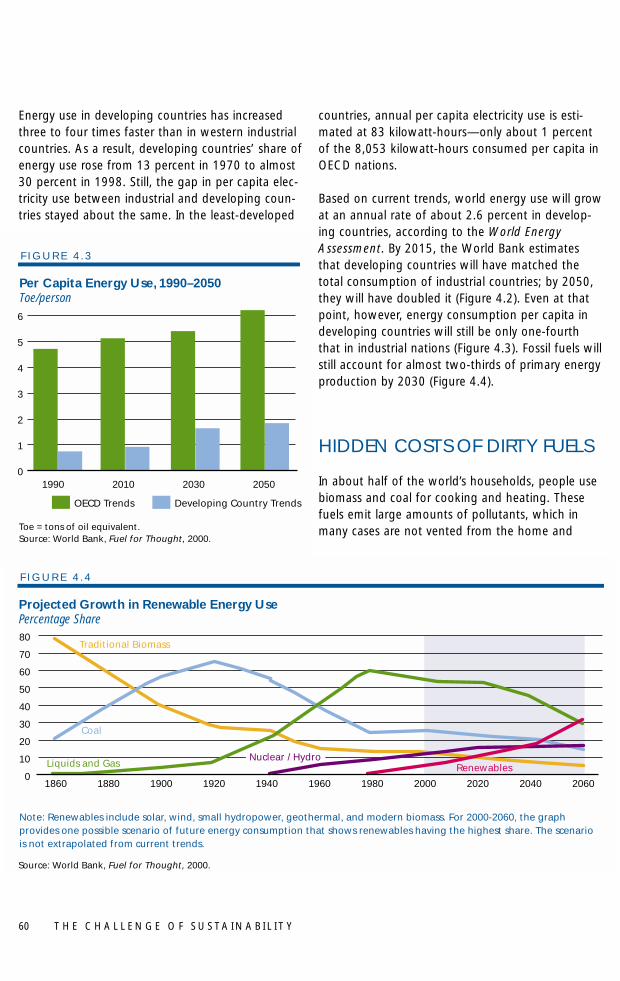
Energy use in developing countries has increasedthree to four times faster than in western industrialcountries. As a result, developing countries’ share ofenergy use rose from 13 percent in 1970 to almost30 percent in 1998. Still, the gap in per capita elec-tricity use between industrial and developing coun-tries stayed about the same. In the least-developed
countries, annual per capita electricity use is esti-mated at 83 kilowatt-hours—only about 1 percentof the 8,053 kilowatt-hours consumed per capita inOECD nations.
Based on current trends, world energy use will growat an annual rate of about 2.6 percent in develop-ing countries, according to the World EnergyAssessment. By 2015, the World Bank estimatesthat developing countries will have matched thetotal consumption of industrial countries; by 2050,they will have doubled it (Figure 4.2). Even at thatpoint, however, energy consumption per capita indeveloping countries will still be only one-fourththat in industrial nations (Figure 4.3). Fossil fuels willstill account for almost two-thirds of primary energyproduction by 2030 (Figure 4.4).
HIDDEN COSTS OF DIRTY FUELS
In about half of the world’s households, people usebiomass and coal for cooking and heating. Thesefuels emit large amounts of pollutants, which inmany cases are not vented from the home and
T H E C H A L L E N G E O F S U S TA I N A B I L I T Y60
Toe = tons of oil equivalent.Source: World Bank, Fuel for Thought, 2000.
Per Capita Energy Use, 1990–2050Toe/person
F I G U R E 4 . 3
0
1
2
3
4
5
6
Developing Country TrendsOECD Trends
2050203020101990
0
10
20
30
40
50
60
70
80
Source: World Bank, Fuel for Thought, 2000.
Note: Renewables include solar, wind, small hydropower, geothermal, and modern biomass. For 2000-2060, the graphprovides one possible scenario of future energy consumption that shows renewables having the highest share. The scenariois not extrapolated from current trends.
Projected Growth in Renewable Energy UsePercentage Share
F I G U R E 4 . 4
Renewables
Traditional Biomass
Nuclear / HydroLiquids and Gas
Coal
20602040202020001980196019401920190018801860
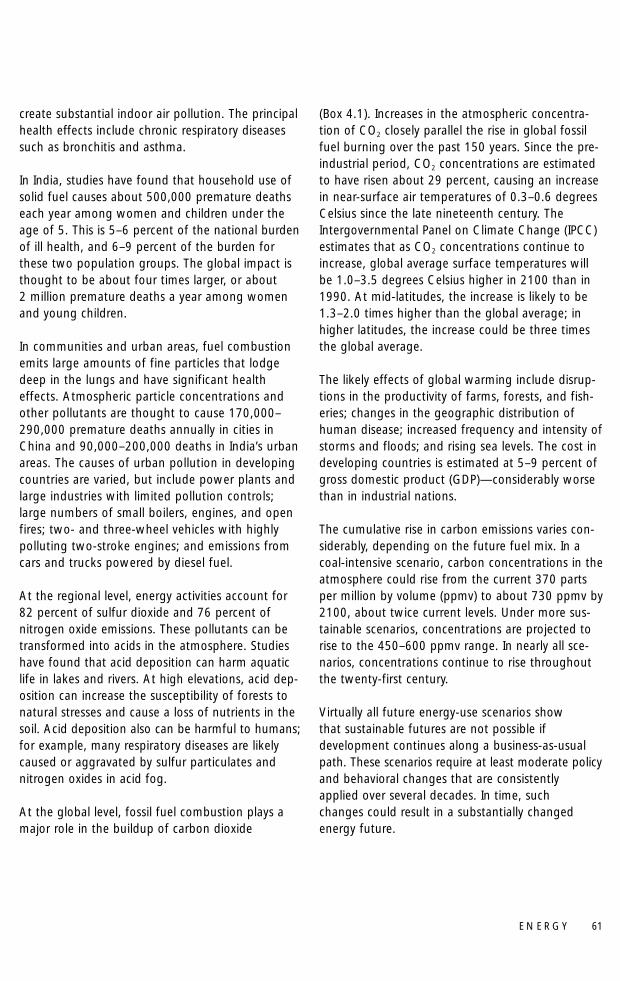
create substantial indoor air pollution. The principalhealth effects include chronic respiratory diseasessuch as bronchitis and asthma.
In India, studies have found that household use ofsolid fuel causes about 500,000 premature deathseach year among women and children under theage of 5. This is 5–6 percent of the national burdenof ill health, and 6–9 percent of the burden forthese two population groups. The global impact isthought to be about four times larger, or about 2 million premature deaths a year among womenand young children.
In communities and urban areas, fuel combustionemits large amounts of fine particles that lodgedeep in the lungs and have significant healtheffects. Atmospheric particle concentrations andother pollutants are thought to cause 170,000–290,000 premature deaths annually in cities inChina and 90,000–200,000 deaths in India’s urbanareas. The causes of urban pollution in developingcountries are varied, but include power plants andlarge industries with limited pollution controls;large numbers of small boilers, engines, and openfires; two- and three-wheel vehicles with highlypolluting two-stroke engines; and emissions fromcars and trucks powered by diesel fuel.
At the regional level, energy activities account for82 percent of sulfur dioxide and 76 percent ofnitrogen oxide emissions. These pollutants can betransformed into acids in the atmosphere. Studieshave found that acid deposition can harm aquaticlife in lakes and rivers. At high elevations, acid dep-osition can increase the susceptibility of forests tonatural stresses and cause a loss of nutrients in thesoil. Acid deposition also can be harmful to humans;for example, many respiratory diseases are likelycaused or aggravated by sulfur particulates andnitrogen oxides in acid fog.
At the global level, fossil fuel combustion plays amajor role in the buildup of carbon dioxide
(Box 4.1). Increases in the atmospheric concentra-tion of CO2 closely parallel the rise in global fossilfuel burning over the past 150 years. Since the pre-industrial period, CO2 concentrations are estimatedto have risen about 29 percent, causing an increasein near-surface air temperatures of 0.3–0.6 degreesCelsius since the late nineteenth century. TheIntergovernmental Panel on Climate Change (IPCC)estimates that as CO2 concentrations continue toincrease, global average surface temperatures willbe 1.0–3.5 degrees Celsius higher in 2100 than in1990. At mid-latitudes, the increase is likely to be1.3–2.0 times higher than the global average; inhigher latitudes, the increase could be three timesthe global average.
The likely effects of global warming include disrup-tions in the productivity of farms, forests, and fish-eries; changes in the geographic distribution ofhuman disease; increased frequency and intensity ofstorms and floods; and rising sea levels. The cost indeveloping countries is estimated at 5–9 percent ofgross domestic product (GDP)—considerably worsethan in industrial nations.
The cumulative rise in carbon emissions varies con-siderably, depending on the future fuel mix. In acoal-intensive scenario, carbon concentrations in theatmosphere could rise from the current 370 partsper million by volume (ppmv) to about 730 ppmv by2100, about twice current levels. Under more sus-tainable scenarios, concentrations are projected torise to the 450–600 ppmv range. In nearly all sce-narios, concentrations continue to rise throughoutthe twenty-first century.
Virtually all future energy-use scenarios showthat sustainable futures are not possible ifdevelopment continues along a business-as-usualpath. These scenarios require at least moderate policyand behavioral changes that are consistentlyapplied over several decades. In time, suchchanges could result in a substantially changedenergy future.
E N E R G Y 61
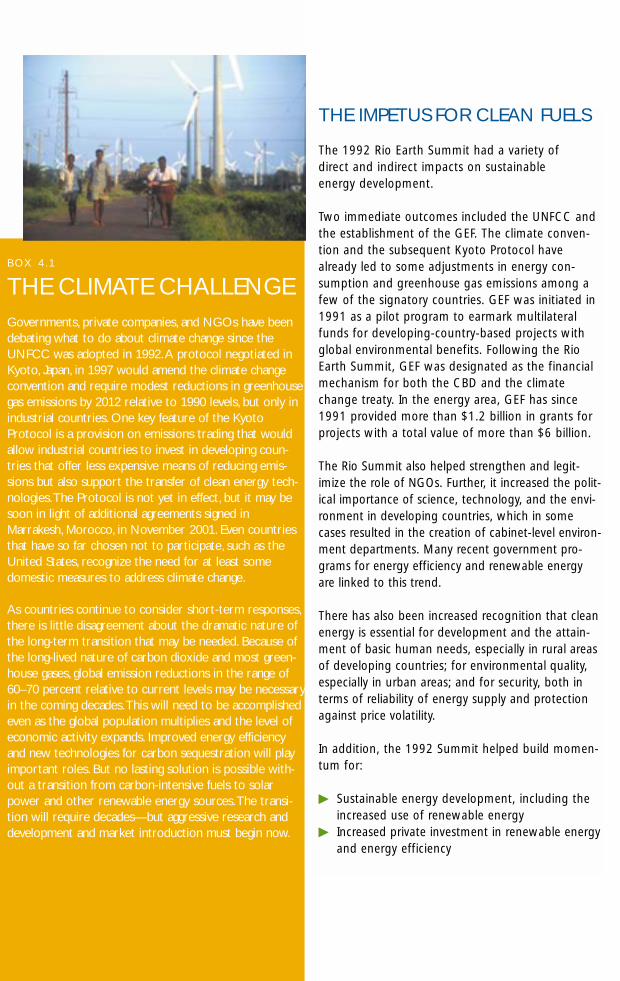
THE IMPETUS FOR CLEAN FUELS
The 1992 Rio Earth Summit had a variety ofdirect and indirect impacts on sustainableenergy development.
Two immediate outcomes included the UNFCC andthe establishment of the GEF. The climate conven-tion and the subsequent Kyoto Protocol havealready led to some adjustments in energy con-sumption and greenhouse gas emissions among afew of the signatory countries. GEF was initiated in1991 as a pilot program to earmark multilateralfunds for developing-country-based projects withglobal environmental benefits. Following the RioEarth Summit, GEF was designated as the financialmechanism for both the CBD and the climatechange treaty. In the energy area, GEF has since1991 provided more than $1.2 billion in grants forprojects with a total value of more than $6 billion.
The Rio Summit also helped strengthen and legit-imize the role of NGOs. Further, it increased the polit-ical importance of science, technology, and the envi-ronment in developing countries, which in somecases resulted in the creation of cabinet-level environ-ment departments. Many recent government pro-grams for energy efficiency and renewable energyare linked to this trend.
There has also been increased recognition that cleanenergy is essential for development and the attain-ment of basic human needs, especially in rural areasof developing countries; for environmental quality,especially in urban areas; and for security, both interms of reliability of energy supply and protectionagainst price volatility.
In addition, the 1992 Summit helped build momen-tum for:
� Sustainable energy development, including theincreased use of renewable energy
� Increased private investment in renewable energyand energy efficiency
B OX 4 . 1
THE CLIMATE CHALLENGEGovernments, private companies, and NGOs have beendebating what to do about climate change since theUNFCC was adopted in 1992.A protocol negotiated inKyoto, Japan, in 1997 would amend the climate changeconvention and require modest reductions in greenhousegas emissions by 2012 relative to 1990 levels, but only inindustrial countries. One key feature of the KyotoProtocol is a provision on emissions trading that wouldallow industrial countries to invest in developing coun-tries that offer less expensive means of reducing emis-sions but also support the transfer of clean energy tech-nologies.The Protocol is not yet in effect, but it may besoon in light of additional agreements signed inMarrakesh, Morocco, in November 2001. Even countriesthat have so far chosen not to participate, such as theUnited States, recognize the need for at least somedomestic measures to address climate change.
As countries continue to consider short-term responses,there is little disagreement about the dramatic nature ofthe long-term transition that may be needed. Because ofthe long-lived nature of carbon dioxide and most green-house gases, global emission reductions in the range of60–70 percent relative to current levels may be necessaryin the coming decades.This will need to be accomplishedeven as the global population multiplies and the level ofeconomic activity expands. Improved energy efficiencyand new technologies for carbon sequestration will playimportant roles. But no lasting solution is possible with-out a transition from carbon-intensive fuels to solarpower and other renewable energy sources.The transi-tion will require decades—but aggressive research anddevelopment and market introduction must begin now.
E N E R G Y 63
� Greater reliance on markets and the private sector� Power sector reform and utility restructuring� Declining energy intensities.
Increased Use of Renewable EnergyEspecially in rural areas, there have been significantimprovements in access to commercial energy overthe past decade, including access to LPG, modernbiogas, and village-scale electricity grids. Use ofrenewable energy, including solar, wind, and smallhydropower, also has increased dramatically.
For example, solar home systems using photovoltaic(PV) technology, which was virtually unknown in1992, now provide lighting, television, and radio tomore than 1 million rural households. Thousands ofrural communities now receive drinking water fromsolar PV-powered purifiers and pumps. Smallhydropower and biomass generation capacityworldwide increased 20–30 percent over the pastdecade, to 25,000 megawatts and 16,000megawatts, respectively. More than 50 millionhouseholds are served by small-hydro village-scalemini-grids, mostly in China. Wind power generationcapacity has increased from virtually zero to over1,700 megawatts, mostly in India. In addition, thenumber of households served by solar hot waterheaters has tripled, to roughly 10 million house-holds, mostly in China. Programs for improved bio-mass cooking stoves in China, India, and severalAfrican countries have benefited some 220 millionhouseholds through reduced fuel costs or fuelwoodcollection burdens.
Increased Private Investment in RenewableEnergy and Energy EfficiencyWith the encouragement of the World BusinessCouncil for Sustainable Development and otherbusiness councils in industrial and developing coun-tries, a large number of leading industries havebecome increasingly engaged in renewable energyand energy efficiency investments. It is estimatedthat between $500 million and $1.5 billion ofrenewable energy projects in developing countriesare being financed each year, a market that is grow-ing 5–10 percent annually.
At least 30 major firms have made commitments toinvest billions of dollars in renewable energy over thenext two to five years. Shell InternationalRenewables was one of the first to make a large-scale commitment, with $500 million pledged in1998. Others have since followed with similar com-mitments, some for over $1 billion. Total commitments now amount to at least$10–$15 billion.
Greater Reliance on Markets and thePrivate SectorDuring the past decade, commercial markets forrenewable energy have expanded, shifting invest-ment patterns away from traditional governmentand international donor sources to greater relianceon private firms and banks. These changing invest-ment patterns have made it more important to thinkabout markets for renewable energy, along with thepolicy and social conditions that underlie markets,rather than simply about the technologies them-selves and their economic characteristics. The policyand social conditions vary widely from country tocountry, resulting in a diverse range of market condi-tions that require a similarly diverse range of market-oriented approaches. Changing investment patternsalso elicit increased decisionmaking and participationfrom a wider variety of stakeholders—not just tradi-tional donor agencies and governments, but alsomanufacturers, rural entrepreneurs, individual house-holds, local technicians, NGOs, community groups,utility companies, and commercial banks.
These are recent examples:
� In Koudia el Baida, Morocco, a 50-watt windfarm is one of several wind projects in develop-ing countries to be constructed largely on com-mercial terms. A consortium of three firms,including Electricité de France, is building andoperating the farm with financing from a num-ber of commercial and development banks. Withexceptional wind resources, the facility wasexpected to provide an unprecedented capacityfactor of 46 percent when it began operation inlate 2000. Ownership of the wind farm will be
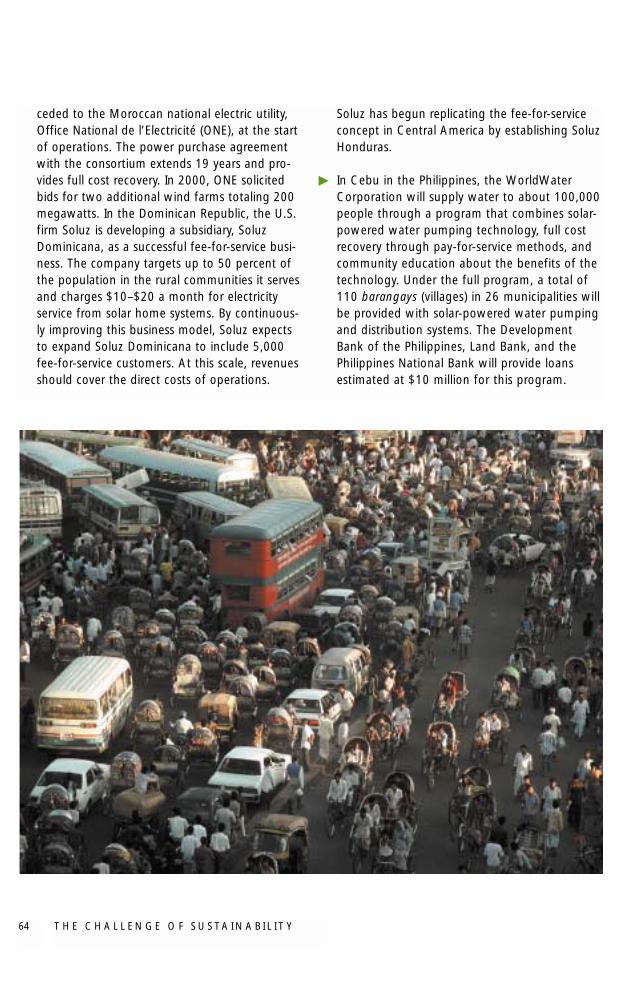
ceded to the Moroccan national electric utility,Office National de l’Electricité (ONE), at the startof operations. The power purchase agreementwith the consortium extends 19 years and pro-vides full cost recovery. In 2000, ONE solicitedbids for two additional wind farms totaling 200megawatts. In the Dominican Republic, the U.S.firm Soluz is developing a subsidiary, SoluzDominicana, as a successful fee-for-service busi-ness. The company targets up to 50 percent ofthe population in the rural communities it servesand charges $10–$20 a month for electricityservice from solar home systems. By continuous-ly improving this business model, Soluz expectsto expand Soluz Dominicana to include 5,000fee-for-service customers. At this scale, revenuesshould cover the direct costs of operations.
Soluz has begun replicating the fee-for-serviceconcept in Central America by establishing SoluzHonduras.
� In Cebu in the Philippines, the WorldWaterCorporation will supply water to about 100,000people through a program that combines solar-powered water pumping technology, full costrecovery through pay-for-service methods, andcommunity education about the benefits of thetechnology. Under the full program, a total of110 barangays (villages) in 26 municipalities willbe provided with solar-powered water pumpingand distribution systems. The Development Bank of the Philippines, Land Bank, and thePhilippines National Bank will provide loans estimated at $10 million for this program.
T H E C H A L L E N G E O F S U S TA I N A B I L I T Y64
Power Sector Reform and Utility Restructuring Many developing countries are either beginning toconsider or already have power sector reforms inplace, driven primarily by free-market, privatization,and institutional efficiency agendas. Globally, six keytrends in power sector reform are most relevant tosustainable energy in developing countries:
� competitive wholesale power markets andremoval of price regulation on generation
� self-generation by end-users� smaller-scale generation facilities and
technologies� privatization or commercialization of utilities� unbundling of generation, transmission, and
distribution� competitive retail power markets.
When new institutional and contractual reforms areadopted, environmental considerations are oftenoverlooked, either because policymakers and theiradvisors have higher priorities or because they sim-ply assume that reforms will automatically lead toenvironmental improvement.
Declining Energy IntensitiesSince 1980, energy conservation and increasedenergy efficiency have been pushing downward theenergy required to produce a unit of GDP. Amongdeveloping countries, China is a prominent exampleof declining energy intensity in the economy. Whilethe economy grew on average 12 percent per yearfrom 1980 to 1995, primary energy consumptiononly grew on average about 4 percent annually—anunprecedented situation for a developing country.Chinese energy consumption in 1995 would havebeen 2.2 times greater had the economy used ener-gy at the same intensity as it did in 1977. This hasbeen attributed to policies directed at energy effi-ciency, particularly reductions in industrial intensi-ties. It is also the result of a concerted drive awayfrom central planning and toward a market econo-my, which has raised energy prices (often within atwo-tier system of coexisting state prices and mar-ket prices) and forced enterprises to consider prof-itability and cost minimization.
PROMISING APPROACHES
In developing countries, many promising approach-es to promote energy efficiency and renewableenergy have been tried over the past decade. Thelessons from these programs are still emerging, butthey suggest that some approaches could beexpanded to larger scales and introduced inmore countries.
The more promising approaches include:
� energy-efficiency labels for consumer appliances� voluntary agreements with the private sector� integrated market transformation � promotion of fuel switching� rural energy service concessions� renewable energy portfolio standards� rural entrepreneurship for solar PVs� promotion of productive uses of renewable
energy in rural areas� financing and regulatory frameworks for grid-
based renewable power producers.
Energy-Efficiency Labels for Consumer AppliancesEnergy-efficiency labels for consumer appliances area prominent part of efficiency strategies in Brazil,China, the Philippines, and Thailand. In China, forinstance, new refrigerator standards were enactedduring development of a GEF project to promotethe market for high-efficiency units, and they havecontributed to developing the market for moreenergy-efficient products.
In Thailand, the national electric utility (EGAT) hasactively promoted both refrigerator and air condi-tioner labeling. In 1994, EGAT negotiated a volun-tary refrigerator labeling scheme with manufactur-ers. In 1998, the labeling scheme was mademandatory, and in 1999 EGAT reached an agree-ment to increase energy efficiency requirements foreach label by 20 percent. The program has con-tributed to a 21-percent reduction in overall refrig-erator energy consumption. EGAT was unable tonegotiate a labeling agreement with the air condi-
E N E R G Y 65
T H E C H A L L E N G E O F S U S TA I N A B I L I T Y66
tioner industry, which is diverse and fragmented.Instead, it began offering both interest-free con-sumer loans to cover the incremental cost of high-efficiency units and rebates to shop owners who sellhigh-efficiency units.
Voluntary Energy Efficiency Agreements withthe Private SectorVoluntary agreements with the private sector haveproven to be one of the most cost-effective approachesto promoting energy efficiency. However, such ini-tiatives are generally limited to situations where thegains from switching to more efficient technologiesare large to neutral and the switching costs are notinordinately high.
In Thailand, for example, the World Bank and GEFsupported a comprehensive 5-year demand-sidemanagement program with EGAT. As part of thisprogram, EGAT reached a voluntary agreement withall five Thai light manufacturers and one importerto switch from lower-efficiency to higher-efficiencyfluorescent tubes. EGAT supported the manufacturerswith an $8 million consumer information program,which explained that thin tubes give you more lightfor your money. In one year, the more efficienttubes increased their market share from 40 to 100percent, so that all new tubes sold currently arehigher-efficiency models.
Integrated Market Transformation ApproachesMarket transformation programs attempt to alterthe fundamental structure of the marketplace forspecific energy-efficient products. Though still rela-tively uncommon in developing countries, severalGEF-supported projects are promising:
� In China, a GEF/UNDP project to transform themarket for energy-efficient refrigerators has justbegun, but it has already influenced the marketfor energy-efficient refrigerators. New refrigera-tor standards, enacted with support from theproject preparation budget, also contributed tothe future market.
� In Poland, a GEF/IFC project has had a significantimpact on the market for compact fluorescent
lamps (CFLs). Lower CFL prices through a manu-facturer subsidy, combined with a mass mediacampaign, resulted in sales of over 1.2 millionCFLs from 1995 to 1997. The percentage ofPolish households using CFLs increased from 10to 30 percent.
� In Mexico, the national utility CFE sold 2.5 mil-lion CFLs in 2.5 years through promotional cam-paigns and sales through utility billing offices.Sales were higher than the 1.7 million initiallytargeted, and the utility has launched other CFLprograms since the first program ended.
Fuel SwitchingThe Brazilian ethanol fuel program is a model forrenewable energy development worldwide. Underthe ProAlcool program, production of ethanol wasstimulated through a combination of policies,including low-interest loans for the construction ofethanol distilleries, guaranteed purchase of ethanolby the state-owned oil company at a price consid-ered adequate to provide a reasonable profit toethanol producers, pricing of ethanol to be compet-itive with a gasoline-ethanol blend, and sales taxincentives during the 1980s to stimulate the pur-chase of ethanol vehicles.
During the first phase of the program, in the late1970s, ethanol producers received heavily subsi-dized loans to finance their capital investments,and the government reached an agreement withautomobile makers that led to large-scale manufac-turing by 1980 of vehicles that ran on ethanol.Between 1979 and 1983, total production ofethanol more than doubled. By 1998, ethanol pro-vided about one-third of the fuel consumed by carsand light trucks in Brazil. During 1976–96, ethanolproduction saved Brazil about $33 billion in oilimports (in 1996 dollars). It now supports about700,000 jobs in rural areas at a low investmentcost per worker.
From an environmental perspective, the use ofethanol has had many benefits. It reduced lead, sul-fur, hydrocarbon, and carbon monoxide emissionsin Brazil, while nitrogen oxide emissions remained
E N E R G Y 67
about the same. Ethanol fuel played a significantrole in reducing urban air pollution in Brazil’s largecities. In addition, the nation avoided about 13 mil-lion metric tons of carbon emissions due to ethanolsubstitution for gasoline in 1996–97, which isequivalent to nearly 30 percent of its actual carbonemissions from burning fossil fuels.
On the downside, however, burning sugarcaneleaves and tops in the field produces air pollution,and disposal of stillage from ethanol production canpollute rivers and groundwater. Considerable atten-tion is now being devoted to expanding uses forsugarcane and ethanol residues, including cogener-ation of electricity from bagasse and leaves andproduction of animal feed. Recent initiatives tocommercialize biomass gasification technologies canfurther improve the efficiency of using thesewastes.
Rural Energy Service ConcessionsRural energy service concessions are private compa-nies that provide energy services in rural markets. Atpresent, pilot programs are under way in Argentinaand South Africa. Concessions in Argentina, whichoperate at the province level, are free to selectwhich technology to apply in any given situation,including diesel-only village power systems. They areobligated to provide electricity services to rural off-grid customers anywhere in the province for at least15 years; to carry out all necessary maintenance andrepairs of components; to manage connectionrequests, billing, collection, and claim handling; andto provide the provincial utility regulatory agencywith periodic reports on the status of the conces-sion. In return, donors provide concessions withtraining, technical support, and partial reimburse-ment for the costs of installed systems.
Renewable Portfolio StandardsRenewable portfolio standards (RPS) require that aminimum percentage of power demand in a givenregion or service territory be met by renewableenergy sources. Usually proposed along with RPSare power trading schemes, whereby retail providersmay trade their “renewable energy” generation
with one another as long as all meet their respec-tive standards.
RPS-type programs have been adopted in Denmark,Italy, the Netherlands, and the United States and arebeing proposed in other countries such as Japan andPortugal. Among developing countries, China andIndia have proposed RPS-like policies. India has sug-gested that 10 percent of new capacity additions
through 2012 come from renewable energy, whichwould mean an additional 10,000 megawatts.China’s latest five-year plan calls for a fivefoldincrease in wind power, to 1,500 megawatts by2005. The plan also proposes to require that 5 per-cent of all new power generation come from renew-ables, which could mean an additional 20,000megawatts by 2010. Such policies must overcomepolitical and institutional hurdles, must fit into utility-sector restructuring, and must resolve how the extracosts of renewables (compared with conventionalgeneration) will be allocated among utility con-sumers or society-at-large.
“Our objective shouldnot be to rely on technology, but to utilize resource-efficienttechnology as the passageway to a low-energy infrastructure in the 21st century.”
Gro Harlem BrundtlandChair, World Commission on EnvironmentalDevelopment
T H E C H A L L E N G E O F S U S TA I N A B I L I T Y68
Rural Entrepreneurship for Solar PVRural entrepreneurs are selling small solar home sys-tems to rural households in several countries,notably Bangladesh, China, the Dominican Republic,Guatemala, India, Kenya, Mexico, Morocco, andVietnam. Although many of these efforts have arisenfrom private-sector initiatives, in most cases govern-ment policies or programs for developing rural solarhome systems markets have paved the way. Dealerstypically sell systems for cash to the wealthiest ruralhouseholds. In a few cases, dealers or third-party fin-anciers extend consumer credit that improves afford-ability and thus allows less-wealthy rural householdsto purchase systems.
In Sri Lanka, several rural entrepreneurs have soldmore than 5,000 solar home systems through aunique microfinance model. In this case, dealersmarket, sell, service, and warranty their products torural consumers through their own local sales/serv-ice offices. Consumers obtain loans from Sarvodaya,a national microfinance institution with many localbranches and strong ties to the communities inwhich it operates. A customer signs a credit agree-ment with Sarvodaya, which pays the supplier andis responsible for repayment and collections. Thesupplier provides maintenance service for the first 3years, a 1-year warranty for the system, and a 10-year warranty for the PV module.
Promotion of Productive Uses of RenewableEnergy in Rural AreasProductive uses of electricity can increase incomesand provide significant social and development ben-efits. In turn, as incomes rise, rural populations areable to afford even more energy services. The majoremerging productive uses of renewable energy are:
� Agriculture: water pumping, drip irrigation,crop drying, electric livestock fences
� Health: drinking water, vaccine refrigeration,medical/surgical equipment
� Education: distance education, Internet access,school lighting, computer training
� Commercial services: personal telephony, commercial communications, fax, Internet, photocopying
� Small industry: craft tools, retail lighting,sewing, grinding, freezing.
Applications in all categories are emerging, butresults are still limited. Even fewer documentedexamples exist of good ways to raise rural incomesand extend rural social services with renewableenergy. Models are still lacking that demonstratefinancial, social, technical, and institutional viabilityin different contexts. Three emerging potentialareas of focus are drinking water purification andpumping with solar PV; renewable energy thatsupports rural entrepreneurship, such as villagemini-grids powering local industries; and“telecenters” for teacher training, distanceeducation, distance medicine, entertainment,and commercial services.
Financing and Regulatory Frameworks for Grid-Based Renewable-Power ProducersSpecific instruments for incorporating clean energywithin power sector reform can be found in manycountries. Brazil and India are two of the bestexamples.
Brazil has recently adopted several policies to pro-mote the use of grid-connected renewable energy.Utilities are allowed to purchase renewable powerat higher prices than conventional electricity, withthe cost difference spread among the whole cus-tomer base. Independent power producers maysupply electricity on a competitive basis to any thirdparty, and receive open access to the transmissionand distribution system based on wheeling fees.Small hydro producers receive 50-percent discountson transmission wheeling fees.
In India, GEF support for wind power coincidedwith the explosive market growth of the mid-1990s, which was fueled by favorable investmenttax policies, availability of commercial financing,
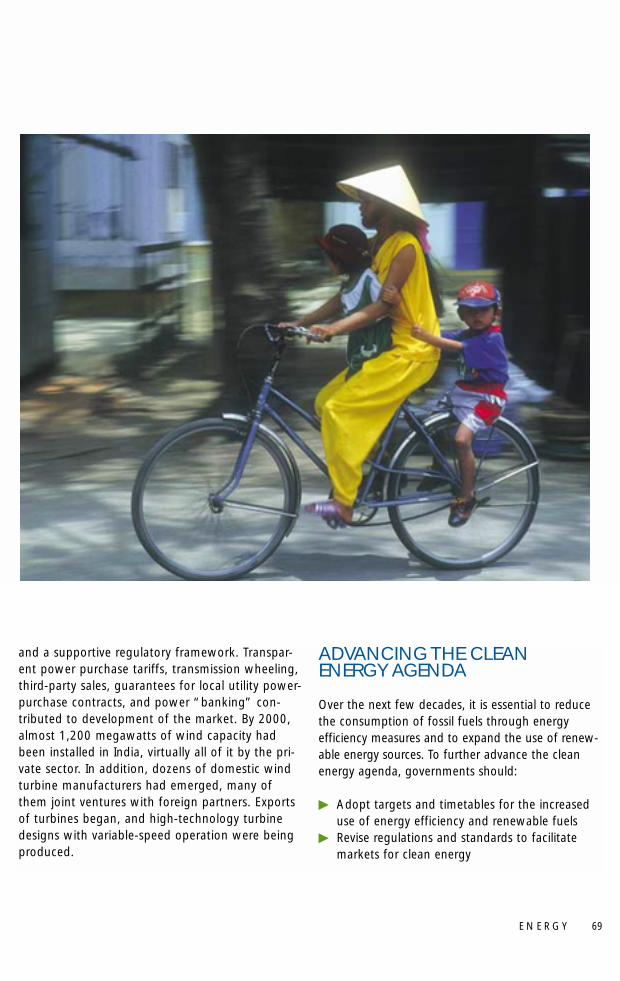
and a supportive regulatory framework. Transpar-ent power purchase tariffs, transmission wheeling,third-party sales, guarantees for local utility power-purchase contracts, and power “banking” con-tributed to development of the market. By 2000,almost 1,200 megawatts of wind capacity hadbeen installed in India, virtually all of it by the pri-vate sector. In addition, dozens of domestic windturbine manufacturers had emerged, many ofthem joint ventures with foreign partners. Exportsof turbines began, and high-technology turbinedesigns with variable-speed operation were beingproduced.
ADVANCING THE CLEAN ENERGY AGENDA
Over the next few decades, it is essential to reducethe consumption of fossil fuels through energyefficiency measures and to expand the use of renew-able energy sources. To further advance the cleanenergy agenda, governments should:
� Adopt targets and timetables for the increaseduse of energy efficiency and renewable fuels
� Revise regulations and standards to facilitatemarkets for clean energy
E N E R G Y 69
T H E C H A L L E N G E O F S U S TA I N A B I L I T Y70
� Work with multilateral agencies to enhance theenvironmental and social dimensions of energy-sector reform and restructuring.
Donors and multilateral assistance agencies canadvance the clean energy agenda by focusing on:
� Capacity building for appropriate regulation,good policy, and sound business practices
� New financing mechanisms and institutions thatcan effectively channel small amounts of credit
� Transfer of technical know-how throughalliances and joint ventures.
Governments, NGOs, and the private sector couldcreate strategic alliances to promote specific cleanenergy and development goals. Networks of institu-tions also could play a greatly expanded role ininformation sharing, training, knowledge transfer,and monitoring progress on agreed-upon targets.
In January 2002, experts from around the worldparticipated in a GEF Roundtable on SustainableEnergy, chaired by Professor José Goldemberg, oneof the world’s leading authorities on energy anddevelopment. The meeting offered a vision and setof actions to promote clean energy for sustainabledevelopment. Participants included representativesof industrial- and developing-country govern-ments, private businesses, NGOs, and multilateralagencies.
The GEF Roundtable advanced 10 key priorities forincorporating clean energy into sustainable develop-ment in the coming years.
� Important reductions in technology costs willarise from expanded markets in industrialcountries. Clean energy targets adopted inindustrial countries mean expanded markets andreduced costs for energy efficiency and renew-ables, both of which benefit developing coun-tries. Governments should adopt targetsaccording to their respective conditions.Carefully crafted subsidies with sunset clausesshould be considered.
� Moderating or, when possible, phasing outfossil fuel subsidies is fundamental to improv-ing market conditions for energy efficiency andrenewable energy in all countries. Tax and sub-sidy policies should treat fossil fuels and renew-able energy sources equally.
� Capital is available for clean energy if newmechanisms can channel funds to those whoneed it, and can divide large pools of creditinto smaller increments with low transactioncosts. Needs exist at three levels: householdsand community groups need micro-credit;entrepreneurs need long-term “patient capital”that allows them time to develop products andservices based on renewable energy; andinvestors need reduced or shared credit risksuntil confidence in renewables grows and suc-cessful track records emerge.
� Regulatory frameworks and policies can pro-vide “market access” to renewable-energypower producers, enabling those producers to
ENERGY TARGETS FOR 2015
� Provide modern energy services to half ofthe 2 billion people who currently have noaccess to these services by 2015.
� Seek to derive 5 percent of total worldenergy from renewable sources by 2010.
� Improve the efficiency of—and reduce pol-lution from—traditional cook stoves, pro-vide access to renewable energy for 300million people in rural areas, and serve anadditional 300 million people in developingcountries with electricity from grid-connect-ed sources.
� Provide power for 100,000 primary healthcare centers, 1 million water pumps, and50,000 schools and other community serv-ices using renewable energy sources.
sell power to utilities or end-users. Such frame-works and policies can “level the playing field”for renewable energy and energy efficiency byremoving inherent biases and barriers. Key ele-ments are legal access rights and stable and fairprices. Renewable energy certificates are anotherpolicy for encouraging competitive investmentand access.
� Modern cooking fuels, such as biogas andLPG, should be rapidly integrated into devel-opment programs, because of their health andeconomic benefits. Linkages to agriculture andforestry and sustainable biomass harvesting areimportant. The special situation of women, who
spend much time gathering fuelwood and whoreceive the greatest exposure to indoor air pollu-tants, should not be neglected.
� Integration of renewable energy into agri-culture, education and health care, and ruralindustries is often the least-cost option foraddressing these productive and social needswithout relying on purchases (and subsidies) ofnonrenewable fuels. Renewable energy needsto be on the agendas of donors and officialsworking in these sectors.
� Despite significant progress in improvingenergy efficiency, significant reductions inenergy intensity—that is, reductions in energy
Worldwide there are enormous disparities in people’saccess to clean energy. At a time when most peoplescarcely think twice when they flip a light switch or listento a radio—and increasing numbers take access to theInternet for granted—two billion people live withoutthe benefits of modern energy. Nearly half a billion peoplehave limited or unreliable access.
According to the World Energy Assessment, the lack ofaccess to clean energy directly or indirectly contributesto many of the problems of the world’s poorest people.The Assessment concludes,“Allowing one-third of theworld’s population to continue to endure the constraintsassociated with traditional energy is unacceptable from ahumanitarian and moral standpoint.”
But there are many real life examples of how the availabil-ity of modern renewable energy can help reduce povertyand provide global environmental benefits. For example:
� In China, a GEF project is helping rural health clinicsswitch from coal-fired electricity to solar and PV sys-tems, at 30 percent lower cost. As the health deliv-ery expenses are reduced, clinics become more self-sufficient and can re-channel income toward improv-ing health services.The target is to rehabilitate from2,000 to 4,000 clinics per year in 10 provincesthroughout the country. The passive solar health clin-ics are designed by local villagers, who also volunteertheir labor for construction and maintenance.
� In Guatemala, a GEF project helped the governmentredefine its postwar rehabilitation program. Followinga 36-year civil war that affected Maya-Quiche andMaya-Ixil indigenous communities, the governmentwas able to provide a mini-hydropower system andPV lighting in homes in just one year. The original planto connect the villages to a provincial electricity gridwould have taken 3 to 5 years. Savings from switchingto renewable energy allowed the government to setup credit lines for eco-enterprise development.
� Household solar PV systems are being promoted inmore than 10 countries through GEF projects using avariety of strategies, from micro-credit schemes toloans for small entrepreneurs. The goal is to createsustainable business models that provide affordable,small amounts of high-quality electricity for lightingand other low-power needs. In Uganda, a privatefirm—SEAf, Incorporated—is the main contractor fora GEF-financed project to provide 840 householdswith solar home systems and another 2,000 house-holds with PV-based energy.The Uganda Solar EnergyIndustry Association completed a technical study toexpand use of solar energy, including creation of arevolving fund that would cover some of the instal-lation costs.
Source: GEF.
B OX 4 . 2
RENEWABLE ENERGY: KEY TO POVERTY REDUCTION
T H E C H A L L E N G E O F S U S TA I N A B I L I T Y72
use in providing goods and services—remainpossible, especially in transport, buildings, andindustry. Opportunities for such reductions existeven in countries with low per-capita energy use.
� Rural entrepreneurs are key drivers of newclean-energy technologies, particularly forhousehold lighting and productive uses in smallindustry, agriculture, and water supply. But fewclean-energy enterprises exist, and the chal-lenges of rural-enterprise development andfinancing are large. New models of enterprisedevelopment and financing are needed, alongwith adoption of proven models.
� There is a willingness to pay for “green”attributes of products and services, and such“green consumerism” should be encouraged.Large numbers of people avoid specific productsfor environmental reasons and favor productscertified as “green.”
� Socially and environmentally responsibleinvestment funds could be channeled moreexplicitly into meeting clean energy needs.
Taken together, these actions can make a significantdifference in accelerating the trend toward cleanenergy and improving the availability of energy inthe developing world.
E N E R G Y 73
Global Environment Facility (GEF).2001. New Business:Geothermal, Biomass, Wind,Fuel Cells, Solar. Washington,D.C.: GEF.
———. 2002. “Strengtheningthe Environmental Dimensionsof Sustainable Development:Toward an Action Agenda.”Paper prepared for theMinisterial Roundtable onFinancing Environment andSustainable Development,Second Session, Bali,Indonesia, June 4, 2002.
Goldemberg, José, Eric Martinotand Alan Miller. 2002. “EnergySince Rio: Achievement andPromising Strategies.” Draftpaper prepared for the GEFEnergy Panel, New York,January 30, 2002.
Gupta, Ajit. 2000. “PolicyApproaches: The IndiaExperience.” Paper presentedat the International Conferenceon Accelerating Grid-BasedRenewable Energy, March 7-8.Washington, DC: World Bank.
International Energy Agency (IEA).2001. Toward a SustainableEnergy Future. Paris: IEA.
Jagadeesh, A. 2000. “WindEnergy Development in TamilNadu and Andhra Pradesh,India: Institutional Dyanamicsand Barriers.” Energy Policy28:157-68.
Kozloff, Keith. 1998. ElectricitySector Reform in DevelopingCountries: Implications forRenewable Energy. RenewableEnergy Policy Project ResearchReport No. 2. Washington,D.C.: REPP.
Martinot, Eric. 2001. “The GEFPortfolio of Grid-ConnectedRenewable Energy: EmergingExperience and Lessons.”Working Draft. Washington,D.C.: GEF.
Martinot, Eric, AkankshaChaurey, Debra Lew, JoséRoberto Moreira, and NjeriWamukonya. 2002.“Renewable Energy Markets inDeveloping Countries.” AnnualReview of Energy and theEnvironment 27.
Martinot, Eric, RameshRamankutty, and Frank Rittner.2000. ”The GEF Solar PVPortfolio: Emerging Experiencesand Lessons.“ GEF Monitoringand Evaluation Working PaperNo. 2. Washington, D.C.
McVeigh, James, Dallas Burtraw,Joel Darmstadter, and KarenPalmer. 1999. “Winner, Loseror Innocent Victim: HasRenewable Energy Performedas Expected?” RenewableEnergy Policy Project ResearchReport No. 7. Washington,D.C.: REEP.
Sinton, J. E., Levine, M. D. 1998.“Energy Efficiency in China:Accomplishments andChallenges.” Energy Policy26(11): 813-29.
World Bank. 2000. Fuel forThought: An EnvironmentalStrategy for the Energy Sector.Washington, D.C.: World Bank.
United Nations DevelopmentProgramme (UNDP), UnitedNations Department ofEconomic and Social Affairs,and World Energy Council.2000. World EnergyAssessment: Energy and theChallenge of Sustainability.New York: UNDP.
REFERENCES

75
ur Common Future—the report of the 1987 WorldCommission on Environment and Development chaired byGro Harlem Brundtland—was a pioneering attempt to illus-
trate economic and environmental interdependence. Itdemonstrated that economic development must not only be
economically and financially viable, but also socially acceptable andenvironmentally sound. Without one of these components, gains innational output and progress toward global sustainability are likely tobe limited and ephemeral.
Historically, official development assistance (ODA) has supported eco-nomic growth and financial stability in developing countries. In the lastdecade, it has also supported social and human development. Butfinancial support for the environment continues to lag, underminingthe ecosystems and natural resources that billions of people—especiallythe poor—depend on for survival. Today, land degradation and waterscarcity threaten food security and livelihoods, particularly in Africa.And, increasingly, air and water pollution are having a negative impacton human health and the productivity of natural resources.
The 1.2 billion people who live on less than $1 a day are also the mostvulnerable to environmental degradation. They depend on naturalresources for sustenance, and they suffer disproportionately from poorenvironmental conditions. Any successful strategy for addressing globalpoverty must address the serious degradation of the environment andnatural resources.
5
O
F INANCING THEENVIRONMENT ANDSUSTAINABLE DEVELOPMENT
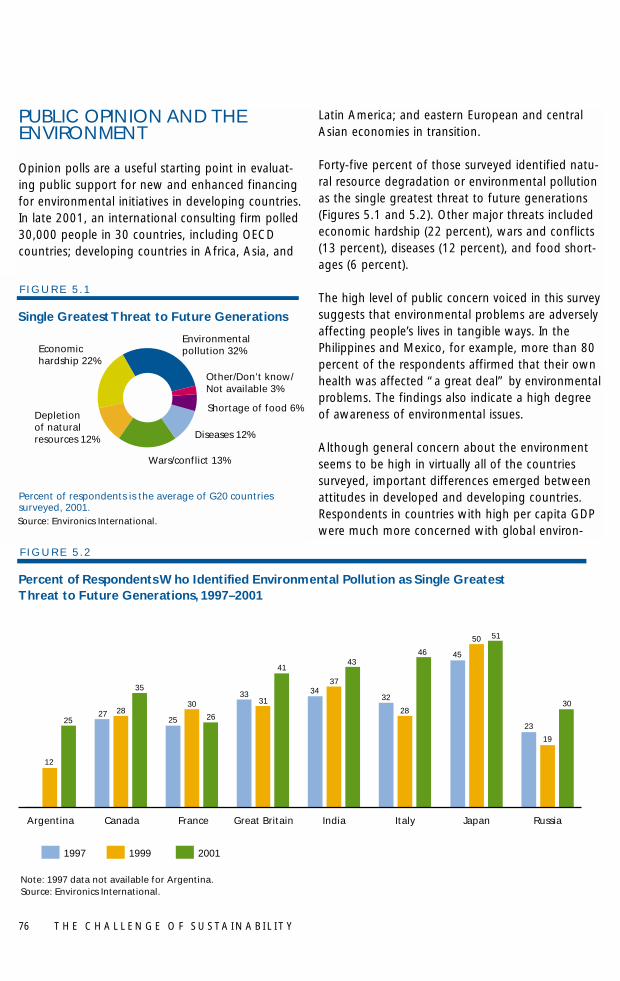
PUBLIC OPINION AND THEENVIRONMENT
Opinion polls are a useful starting point in evaluat-ing public support for new and enhanced financingfor environmental initiatives in developing countries.In late 2001, an international consulting firm polled30,000 people in 30 countries, including OECDcountries; developing countries in Africa, Asia, and
Latin America; and eastern European and centralAsian economies in transition.
Forty-five percent of those surveyed identified natu-ral resource degradation or environmental pollutionas the single greatest threat to future generations(Figures 5.1 and 5.2). Other major threats includedeconomic hardship (22 percent), wars and conflicts(13 percent), diseases (12 percent), and food short-ages (6 percent).
The high level of public concern voiced in this surveysuggests that environmental problems are adverselyaffecting people’s lives in tangible ways. In thePhilippines and Mexico, for example, more than 80percent of the respondents affirmed that their ownhealth was affected “a great deal” by environmentalproblems. The findings also indicate a high degreeof awareness of environmental issues.
Although general concern about the environmentseems to be high in virtually all of the countries surveyed, important differences emerged betweenattitudes in developed and developing countries.Respondents in countries with high per capita GDPwere much more concerned with global environ-
T H E C H A L L E N G E O F S U S TA I N A B I L I T Y76
Source: Environics International.
Percent of respondents is the average of G20 countries surveyed, 2001.
Single Greatest Threat to Future Generations
F I G U R E 5 . 1
Wars/conflict 13%
Other/Don’t know/Not available 3%
Shortage of food 6%
Diseases 12%
Depletion of natural resources 12%
Environmental pollution 32%Economic
hardship 22%
Percent of Respondents Who Identified Environmental Pollution as Single Greatest Threat to Future Generations, 1997–2001
Note: 1997 data not available for Argentina.Source: Environics International.
F I G U R E 5 . 2
12
2527 28
35
25
30
26
3331
41
3437
43
32
28
46 45
50 51
23
19
30
RussiaJapanItalyIndiaGreat BritainFranceCanadaArgentina
1999 20011997
mental issues than were those in countries with lowor medium per capita GDP. Those in low-incomecountries were relatively more concerned with localand national issues related to air and water pollu-tion, particularly the health effects. These surveyresults parallel the views of scientists in a similarsurvey reported in UNEP’s Global EnvironmentOutlook 2000 report.
IT’S ALL IN THE FINANCING
This high level of public concern about environ-mental issues provides a political foundation forgenerating additional financing for the environ-ment and sustainable development. Governments,international finance institutions, and the privatesector all have critical and mutually reinforcingroles to play. Financing packages must be designedto involve more than one component of this “trian-gle” and to foster close coordination andinnovative partnerships.
Governments have the ultimate responsibility andshould make the budget and policy reforms neededto promote sustainable development. For example,substantial resources could be freed, and economicefficiency improved, through the reduction or elimi-nation of subsidies that encourage the excessive useof natural resources. A recent study of six develop-ing countries and Russia found that fossil fuel subsi-dies alone amounted to some $50 billion a year.Governments can also promote sustainable develop-ment by levying environmental taxes and throughinitiatives that sell environmental services like the“ecomarkets” program in Costa Rica (Box 5.1). It isincreasingly important for governments to fosterprivate investment through regulatory, tax, andother reforms.
Although it accounts for a dwindling proportion ofthe resources flowing to developing countries, ODAcontinues to be essential. A greater share of ODAfunds could be used to support capacity buildingand institutional and policy reforms at the country
B OX 5 . 1
COSTA RICA’SECOMARKETS PROGRAMWith GEF support, the government of Costa Ricahas developed an ecomarkets program designed toincrease forest conservation.The objective is tofoster biodiversity conservation and preserve impor-tant forest ecosystems through conservation ease-ments on privately owned lands outside of nationalparks and biological reserves in the MesoamericanBiological Corridor in Costa Rica.
Costa Rica’s efforts to protect forest ecosystemswere considerably strengthened in 1996 by theenactment of a forestry law that explicitly recog-nizes four environmental benefits of forest ecosys-tems: mitigation of greenhouse gas emissions, hydro-logical services, biodiversity conservation, and scenicbeauty for recreation and ecotourism.
The Environmental Services Program (ESP) meets itsforest conservation goals through site-specific con-tracts with individual small- and medium-scale farm-ers. Participants are required to submit a sustainableforest management plan certified by a licensedforester, and to carry out conservation or sustain-able forest management activities throughout the lifeof individual contracts. Several types of contracts areavailable, including forest conservation easements,sustainable forest management, and reforestation.Forest conservation easement contracts, which payfarmers $200 per hectare over a five-year period($40 per year per hectare), target the conservationof vegetative cover in primary and mature second-ary forest areas.
Principal sources of funding for the program includea tax on fuel sales; payments to the National ForestryFinancing Fund from private sector renewable energyproducers, which are used for the conservation ofcritical watersheds; and the sale of Certified TradableOffsets derived from greenhouse gas emissionsreductions resulting from forest conservation.
Source: GEF.
level. International financial institutions, in particular,could promote greater use of innovative financialinstruments such as partial risk and credit guaranteesand payments for environmental services. This wouldleverage increasingly scarce ODA by attracting privatefinancing for sustainable development, especially inthe areas of water and energy use.
The private sector is the largest potential source offinancing for sustainable development in developingcountries. Attracting substantial private funding forenvironmentally oriented investments will, however,continue to be a major challenge because of highperceived risk. With the help of donors and interna-tional financial institutions, developing country gov-ernments can take steps to improve the generalinvestment climate and help overcome the reluc-tance of private investors.
Progressive business organizations such as theWorld Business Council for Sustainable Develop-ment can also assist by highlighting the compati-bility between sustainable development and prof-itability (Box 5.2). The growing emphasis on social-ly responsible investment, discussed later in thischapter, also has the potential to expand invest-ments in firms that have adopted sustainabledevelopment practices.
MARSHALLING PUBLICRESOURCES
Addressing current and emerging environmentalthreats will require a greater commitment from theinternational community in the coming decades. It isgenerally acknowledged that environmental initiativesare underfunded, particularly in developing countries.Donors did not live up to commitments to devote 0.7percent of their GDPs to ODA. During the 1990s,total ODA flows stagnated in nominal terms—andactually fell in relation to the donor countries’ GDPs,from 0.33 percent in 1992 to 0.22 percent in 2000
(Box 5.3). This drop undercuts the targets designatedin the Millennium Development Goals.
Some recent trends, however, have been positive.One such development is that the portion of ODAallocated to global environmental initiatives hasrisen as a percentage of total development assis-tance since the 1970s. This trend is partly attributa-ble to the role of the GEF—the only significantsource of additional financing for the environmentto emerge from the Rio Earth Summit. Thirty-fournations pledged $2 billion to support the GEF in1994, 36 nations agreed to $2.75 billion in 1998,and the GEF’s third replenishment in 2002 totaled$2.92 billion, the highest ever.
During the 1990s, the GEF was the major source ofgrant financing for environmental initiatives in itsfour main areas of concern: conserving biodiversity,reducing risks of climate change, preventing thedegradation of international waters, and protectingthe ozone layer. In its first decade, GEF’s financialcommitments for the environment totaled $4.2 bil-lion, and leveraged an additional $12.4 billion in co-financing. Although more modest in size and scope,other important funding sources for global environ-mental initiatives include the Multilateral Fund forthe Implementation of the Montreal Protocol, whichhas provided resources to help countries phase outthe use of ozone-depleting substances, and the G7Pilot Program to Conserve the Brazilian Rain Forest.
Despite these impressive efforts, additionalresources must be found to meet today’s expandedsustainable development agenda—especially thefinancing of activities that address the environ-ment. For equity reasons, these new resourcesshould flow from developed countries. At the sametime, developing countries should both continue toseek additional resources for local and nationalenvironmental problems and strengthen their ownenvironmental laws and policy frameworks.
A number of options to enhance public sectorresource mobilization have been proposed.
T H E C H A L L E N G E O F S U S TA I N A B I L I T Y78
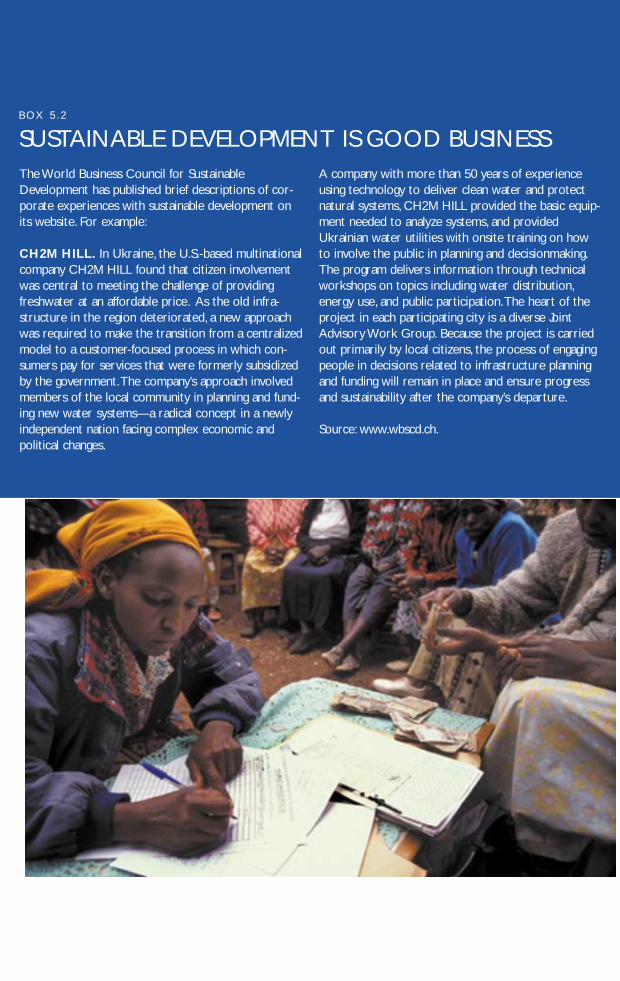
The World Business Council for SustainableDevelopment has published brief descriptions of cor-porate experiences with sustainable development onits website. For example:
CH2M HILL. In Ukraine, the U.S.-based multinationalcompany CH2M HILL found that citizen involvementwas central to meeting the challenge of providingfreshwater at an affordable price. As the old infra-structure in the region deteriorated, a new approachwas required to make the transition from a centralizedmodel to a customer-focused process in which con-sumers pay for services that were formerly subsidizedby the government.The company’s approach involvedmembers of the local community in planning and fund-ing new water systems—a radical concept in a newlyindependent nation facing complex economic andpolitical changes.
A company with more than 50 years of experienceusing technology to deliver clean water and protectnatural systems, CH2M HILL provided the basic equip-ment needed to analyze systems, and providedUkrainian water utilities with onsite training on howto involve the public in planning and decisionmaking.The program delivers information through technicalworkshops on topics including water distribution,energy use, and public participation.The heart of theproject in each participating city is a diverse JointAdvisory Work Group. Because the project is carriedout primarily by local citizens, the process of engagingpeople in decisions related to infrastructure planningand funding will remain in place and ensure progressand sustainability after the company’s departure.
Source: www.wbscd.ch.
B OX 5 . 2
SUSTAINABLE DEVELOPMENT IS GOOD BUSINESS
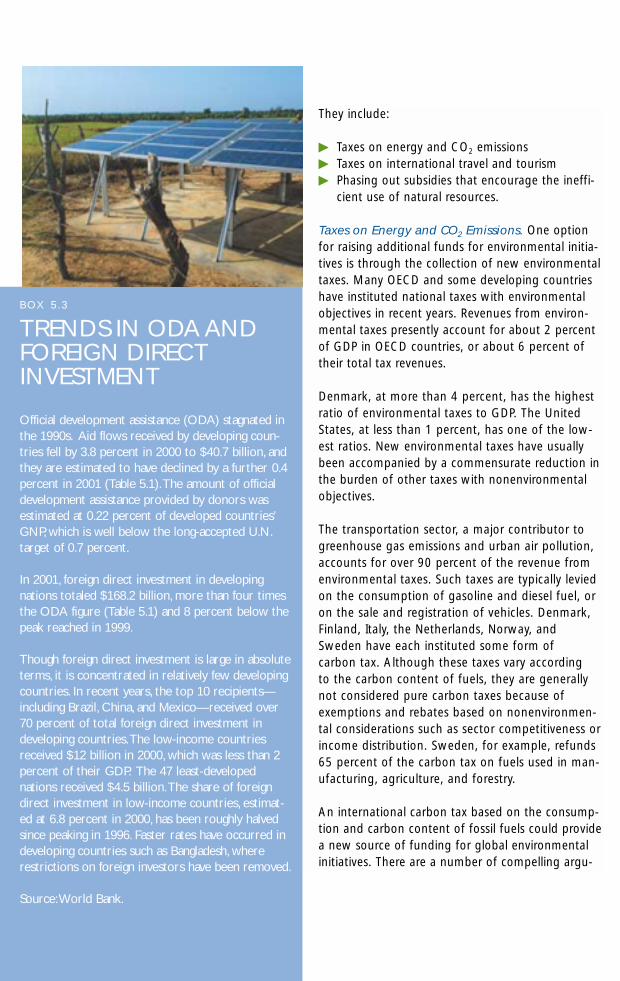
They include:
� Taxes on energy and CO2 emissions� Taxes on international travel and tourism� Phasing out subsidies that encourage the ineffi-
cient use of natural resources.
Taxes on Energy and CO2 Emissions. One optionfor raising additional funds for environmental initia-tives is through the collection of new environmentaltaxes. Many OECD and some developing countrieshave instituted national taxes with environmentalobjectives in recent years. Revenues from environ-mental taxes presently account for about 2 percentof GDP in OECD countries, or about 6 percent oftheir total tax revenues.
Denmark, at more than 4 percent, has the highestratio of environmental taxes to GDP. The UnitedStates, at less than 1 percent, has one of the low-est ratios. New environmental taxes have usuallybeen accompanied by a commensurate reduction inthe burden of other taxes with nonenvironmentalobjectives.
The transportation sector, a major contributor togreenhouse gas emissions and urban air pollution,accounts for over 90 percent of the revenue fromenvironmental taxes. Such taxes are typically leviedon the consumption of gasoline and diesel fuel, oron the sale and registration of vehicles. Denmark,Finland, Italy, the Netherlands, Norway, andSweden have each instituted some form ofcarbon tax. Although these taxes vary accordingto the carbon content of fuels, they are generallynot considered pure carbon taxes because ofexemptions and rebates based on nonenvironmen-tal considerations such as sector competitiveness orincome distribution. Sweden, for example, refunds65 percent of the carbon tax on fuels used in man-ufacturing, agriculture, and forestry.
An international carbon tax based on the consump-tion and carbon content of fossil fuels could providea new source of funding for global environmentalinitiatives. There are a number of compelling argu-
B OX 5 . 3
TRENDS IN ODA ANDFOREIGN DIRECTINVESTMENT
Official development assistance (ODA) stagnated inthe 1990s. Aid flows received by developing coun-tries fell by 3.8 percent in 2000 to $40.7 billion, andthey are estimated to have declined by a further 0.4percent in 2001 (Table 5.1).The amount of officialdevelopment assistance provided by donors wasestimated at 0.22 percent of developed countries’GNP, which is well below the long-accepted U.N.target of 0.7 percent.
In 2001, foreign direct investment in developingnations totaled $168.2 billion, more than four timesthe ODA figure (Table 5.1) and 8 percent below thepeak reached in 1999.
Though foreign direct investment is large in absoluteterms, it is concentrated in relatively few developingcountries. In recent years, the top 10 recipients—including Brazil, China, and Mexico—received over70 percent of total foreign direct investment indeveloping countries.The low-income countriesreceived $12 billion in 2000, which was less than 2percent of their GDP. The 47 least-developednations received $4.5 billion.The share of foreigndirect investment in low-income countries, estimat-ed at 6.8 percent in 2000, has been roughly halvedsince peaking in 1996. Faster rates have occurred indeveloping countries such as Bangladesh, whererestrictions on foreign investors have been removed.
Source:World Bank.
F I N A N C I N G 81
ments in its favor. First, there is a clear linkagebetween a carbon tax and a reduction in CO2 emis-sions, which closely conforms to the “polluter-pays-principle” adopted by the OECD in 1972 as theappropriate way to recover the costs of pollution. Intheory, imposing this tax at high rates would dis-courage consumption of polluting fuels andincrease the competitiveness of more environmen-tally benign fuels. Second, a carbon tax is clearlydefined, since it is already in force in six countries.Finally, the revenue-generating potential is largeeven at relatively low rates of taxation. While rev-enue estimates vary greatly depending upon theassumptions used regarding tax rates and coverage,a recent U.N. technical note concluded that a car-bon tax on gasoline applied universally—equal to4.8 cents per U.S. gallon—has the potential to raise$125 billion a year. A U.N. High-Level Panel onFinancing for Development concluded that the“international community should recognize the carbon tax as a promising possibility.”
Taxes on International Travel and Tourism. TheIntergovernmental Panel on Climate Change (IPCC)estimates that CO2 emissions from aircraft accountedfor 2.4 percent of total emissions from fossil fuelsin 1992. The IPCC also estimates that aviation’sshare of greenhouse gas emissions could grow tobetween 3.5 and 15 percent by the year 2050.
Despite its substantial impact on climate change,international aviation is not included in internationalagreements on quantitative reductions of green-house gas emissions. Levying taxes and fees oninternational travel could provide incentives toreduce emissions and also help finance investmentsin environmental protection.
Taxes or fees on international travel, which wouldadhere in a general way to the polluter-pays-principle, could be assessed in a variety of ways.One simple approach would be a surcharge on allpassenger tickets and air freight. The revenue-generating potential of such a tax could be substantial.It is estimated that a 1-percent tax on passengertickets and air freight would yield approximately
$2.2 billion per year—$800 million on passengertickets alone. Similar revenues could be raisedthrough the collection of the equivalent of $3.50from each traveler; worldwide, tourist arrivalsreached about 618 million in 1998. Such fees couldbe collected as a flat rate or as a percentage of atravel package.
Another potential revenue source is aviation fuel.Currently, aviation fuel used on domestic flights isseldom taxed—and fuel used on internationalflights is exempt from taxation. This latter exemp-tion, based on the 1944 Chicago Convention onCivil Aviation, was originally designed to stimulatecommercial aviation and to ensure fair internationalcompetition. In order to tax aviation fuel used forinternational flights, an international agreementwould be needed, including decisions on the appro-priate taxing authority. An important issue would beto mitigate the possible effects of such a tax on theeconomies of developing countries that rely ontourism for a significant share of their foreignexchange earnings.
An emissions-based user charge determined bythe aircraft type, engine type, air route, distance,and weight is another possible approach. TheInternational Civil Aviation Organization could playan important role in collecting an emissions-basedlevy, which could be used to improve energy-efficient technologies or to intensify the use ofrenewable energy sources.
Phasing out Resource Subsidies. In many devel-oped and developing countries, government subsi-dies lower the prices of resources such as energyand water, and encourage excessive use. If largeenough, subsidies can also contribute to publicbudget deficits and macroeconomic instability, anddiscourage investment by the private sector.
For example, subsidies associated with the produc-tion and sale of electricity were estimated at $112billion per year in 1996 in developing and transi-tional economies. These huge subsidies encouragewaste and contribute not only to local air pollution,
but to global climate change as well. Phasing outelectricity subsidies could have a “win-win” effect.A reduction of 10 percent would generate annualrevenues of $11 billion, reduce greenhouse gasemissions, and—as part of internationally agreed-upon emissions trading mechanisms—enable thesale of these emission reductions in the internation-al market.
Water used for drinking, irrigation, and sanitation is also heavily subsidized in many developed anddeveloping countries—annual water subsidies wereestimated at $56 billion in 1996. These subsidiesdirectly contribute to the overuse of water resourcesand are creating critical water scarcity conditions insome regions. It is estimated that 2 billion peoplecurrently face water scarcity, a figure that coulddouble by 2025.
The World Commission on Water estimates that$100 billion more than is currently being spent oninfrastructure is required each year just to meet thebasic needs of people in developing countries. Sinceofficial development assistance to this sector issmall, most of this financing will have to come fromprivate sources. However, it is unlikely that the pri-vate sector will make investments of this magnitudeunless national policies are changed to permit full-
cost pricing of water resources (see Chapter 1).Finally, in OECD countries, agricultural subsidiesamount to about $360 billion each year. Phasingout even 5 percent of these subsidies would free$18 billion for environmental and sustainable devel-opment initiatives in developing countries.
COURTING THE PRIVATE SECTOR
Increased globalization, sparked in part by the endof the Cold War and rapidly falling costs oftelecommunications, gave rise to greatly expandedforeign direct investment during the 1990s. Thispositive development is tempered, however, by thefact that just a handful of developing countries—including Argentina, Brazil, China, Malaysia,Mexico, and Singapore—have benefited.
In 1991, foreign direct investments in developingcountries totaled $124 billion. In 2001, privateflows totaled $160 billion in nominal terms, a sub-stantial decline from the peak of $341 billion in1997, but still more than four times higher thanODA (Table 5.1). Given this reality, two key concernsare how to increase capital flows to low-incomecountries, particularly those that have been largelyignored by investors, and how to maximize the useof foreign investment to help solve developingcountries’ social and environmental problems.
Recent studies suggest that improved environmentalperformance and an improved bottom line for pri-vate corporations can be compatible. Several factorsare strengthening linkages between profitability andenvironmental progress. First, partly as a result ofincreased pressure from shareholders and con-sumers in OECD countries, multinational corpora-tions that operate in developing countries have astrong incentive to engage in environmentallysound practices. For example, an “Eco-OK” certifi-cation program for bananas was established inCosta Rica in 1993 in response to the environmen-tal concerns of foreign consumers. Improved pro-ductivity, or “eco-efficiency,” is a second factor that
T H E C H A L L E N G E O F S U S TA I N A B I L I T Y82
“In addition to beingthe right thing to do,preserving the environ-ment is a competitiveadvantage and a majorbusiness opportunity.“
William Clay Ford IIIChairman/CEO, Ford Motor Company
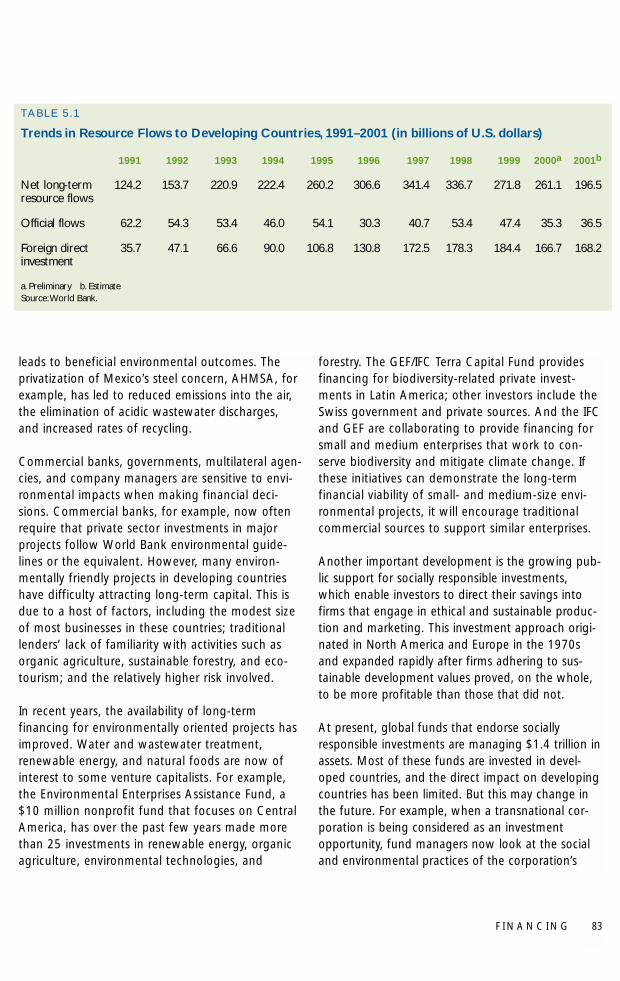
leads to beneficial environmental outcomes. Theprivatization of Mexico’s steel concern, AHMSA, forexample, has led to reduced emissions into the air,the elimination of acidic wastewater discharges,and increased rates of recycling.
Commercial banks, governments, multilateral agen-cies, and company managers are sensitive to envi-ronmental impacts when making financial deci-sions. Commercial banks, for example, now oftenrequire that private sector investments in majorprojects follow World Bank environmental guide-lines or the equivalent. However, many environ-mentally friendly projects in developing countrieshave difficulty attracting long-term capital. This isdue to a host of factors, including the modest sizeof most businesses in these countries; traditionallenders’ lack of familiarity with activities such asorganic agriculture, sustainable forestry, and eco-tourism; and the relatively higher risk involved.
In recent years, the availability of long-termfinancing for environmentally oriented projects hasimproved. Water and wastewater treatment,renewable energy, and natural foods are now ofinterest to some venture capitalists. For example,the Environmental Enterprises Assistance Fund, a$10 million nonprofit fund that focuses on CentralAmerica, has over the past few years made morethan 25 investments in renewable energy, organicagriculture, environmental technologies, and
forestry. The GEF/IFC Terra Capital Fund providesfinancing for biodiversity-related private invest-ments in Latin America; other investors include theSwiss government and private sources. And the IFCand GEF are collaborating to provide financing forsmall and medium enterprises that work to con-serve biodiversity and mitigate climate change. Ifthese initiatives can demonstrate the long-termfinancial viability of small- and medium-size envi-ronmental projects, it will encourage traditionalcommercial sources to support similar enterprises.
Another important development is the growing pub-lic support for socially responsible investments,which enable investors to direct their savings intofirms that engage in ethical and sustainable produc-tion and marketing. This investment approach origi-nated in North America and Europe in the 1970sand expanded rapidly after firms adhering to sus-tainable development values proved, on the whole,to be more profitable than those that did not.
At present, global funds that endorse sociallyresponsible investments are managing $1.4 trillion inassets. Most of these funds are invested in devel-oped countries, and the direct impact on developingcountries has been limited. But this may change inthe future. For example, when a transnational cor-poration is being considered as an investmentopportunity, fund managers now look at the socialand environmental practices of the corporation’s
F I N A N C I N G 83
TA B L E 5 . 1
Trends in Resource Flows to Developing Countries, 1991–2001 (in billions of U.S. dollars)
1991 1992 1993 1994 1995 1996 1997 1998 1999 2000a 2001b
Net long-term 124.2 153.7 220.9 222.4 260.2 306.6 341.4 336.7 271.8 261.1 196.5resource flows
Official flows 62.2 54.3 53.4 46.0 54.1 30.3 40.7 53.4 47.4 35.3 36.5
Foreign direct 35.7 47.1 66.6 90.0 106.8 130.8 172.5 178.3 184.4 166.7 168.2investment
a. Preliminary b. EstimateSource:World Bank.
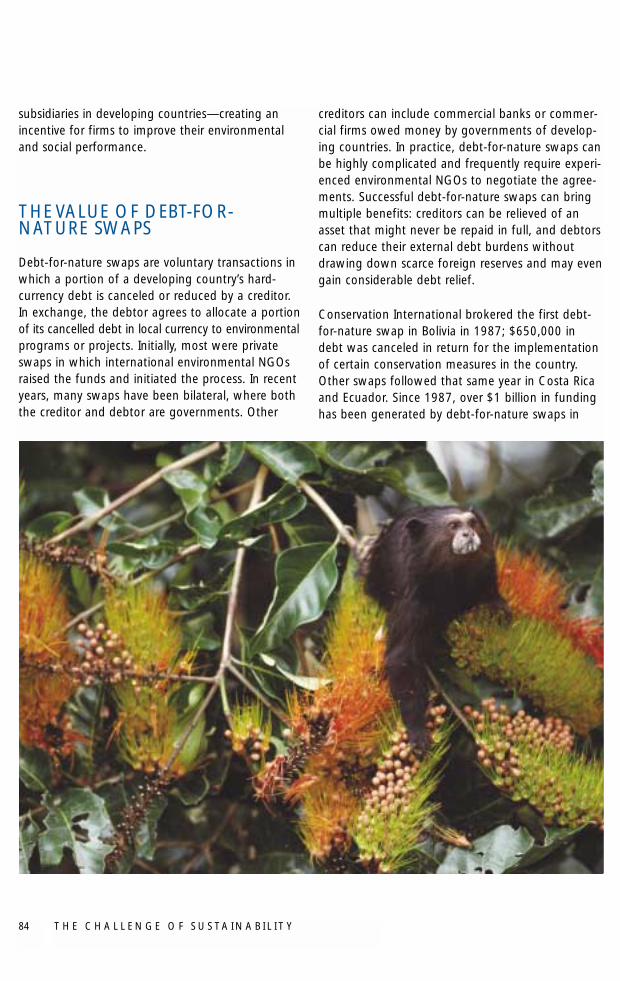
T H E C H A L L E N G E O F S U S TA I N A B I L I T Y84
subsidiaries in developing countries—creating anincentive for firms to improve their environmentaland social performance.
THE VALUE OF DEBT-FOR-NATURE SWAPS
Debt-for-nature swaps are voluntary transactions inwhich a portion of a developing country’s hard-currency debt is canceled or reduced by a creditor.In exchange, the debtor agrees to allocate a portionof its cancelled debt in local currency to environmentalprograms or projects. Initially, most were privateswaps in which international environmental NGOsraised the funds and initiated the process. In recentyears, many swaps have been bilateral, where boththe creditor and debtor are governments. Other
creditors can include commercial banks or commer-cial firms owed money by governments of develop-ing countries. In practice, debt-for-nature swaps canbe highly complicated and frequently require experi-enced environmental NGOs to negotiate the agree-ments. Successful debt-for-nature swaps can bringmultiple benefits: creditors can be relieved of anasset that might never be repaid in full, and debtorscan reduce their external debt burdens withoutdrawing down scarce foreign reserves and may evengain considerable debt relief.
Conservation International brokered the first debt-for-nature swap in Bolivia in 1987; $650,000 indebt was canceled in return for the implementationof certain conservation measures in the country.Other swaps followed that same year in Costa Ricaand Ecuador. Since 1987, over $1 billion in fundinghas been generated by debt-for-nature swaps in
F I N A N C I N G 85
nearly 30 countries. Bilateral swaps typically allowdeveloping country governments to reduce theirdebt obligations in part through buy-backs at dis-counted prices, or in full through debt forgiveness.The converted debt is usually deposited—in theform of local currency-denominated governmentbonds—in a conservation trust fund that dispersesthe funds (derived from interest and amortization ofthe bonds) for agreed-upon conservation purposes.
To date, only a few developed countries—Canada,Finland, Germany, the Netherlands, Switzerland,and the United States—have used bilateral debt-for-nature swaps. The most significant is the U.S.-sponsored Enterprise for the Americas Initiativeestablished in 1990. The program provides for areduction in debt owed to the U.S. government andallows interest payments in local currency to beapplied to local environmental programs and proj-ects. To date, Argentina, Bolivia, Chile, Colombia, ElSalvador, Jamaica, and Uruguay have participated.The initiative has provided $876 million in debtrelief, plus $154 million in local donations. TheAmericas Initiative was reinforced in 1998 throughthe U.S. Tropical Forest Conservation Act, whichpromotes debt relief in exchange for local currencyfunding of tropical forest conservation. The U.S.government has budgeted $225 million for this pro-gram during 2002–04.
Developing countries’ external debt reached approxi-mately $2 trillion in 2000. In many countries, servic-ing external debt is a major constraint to financingsustainable development programs, including envi-ronmental initiatives. The international donor com-munity has responded to this issue by sharply ratch-eting up debt relief measures. The Heavily IndebtedPoor Countries (HIPC) Initiative proposed by theWorld Bank and the IMF in 1996 is the most ambi-tious and comprehensive of these measures. TheInitiative targets developing countries with the mostunsustainable debts. In the 26 countries that areparticipating, most in Sub-Saharan Africa, overallannual debt service paid during 2001-05 is expectedto be cut by about 30 percent relative to actualannual debt service payments made in 1998-99.
The HIPC Initiative requires countries receiving debtrelief to increase social spending as part of theirpoverty alleviation efforts. If environmental spend-ing were included, debt relief could be used toencourage increased government spending onlabor-intensive environmental programs such asreforestation and soil conservation. Such programsgenerate income and promote economic growth,reinforcing the links between poverty alleviation andthe environment.
THE CASE FOR VOLUNTARY“GREEN” PAYMENTS
Bolstered in part by surveys showing strong publicsupport, many governments and private companieshave adopted voluntary payment systems to financeenvironmental initiatives. Utility companies, forexample, use “green pricing” to encourage greateruse of renewable energy sources. In addition, someU.S. state governments allow taxpayers to con-tribute to various environmental causes by checkingboxes on their tax forms. BP Amoco’s Global Choiceprogram is linked to the introduction of a new typeof gasoline that is being marketed as a highlyrefined, low-emissions product in Australia. When amotorist fills a gasoline tank with this new brand offuel, BP Australia agrees to invest a percentage ofthe purchase price in environmental projects—forexample, renewable energy, new forests, innovativetechnology—designed to offset greenhouse gasemissions. All such activities are certified by thegovernment and are independently verified.
Since automobiles are major contributors to green-house gas emissions and urban air pollution, itwould be environmentally beneficial to link greenpayments to new car sales or annual registrations.Available estimates suggest that over the 100,000-mile useful lifetime of an automobile, total carbonemissions are around 10 tons for a 35-mile per gal-lon car and 20 tons for a 20-mile per gallon car. Ifthe costs of remedial action to offset these emis-sions are assumed to be a conservative $10 per ton
T H E C H A L L E N G E O F S U S TA I N A B I L I T Y86
of carbon, each new owner of a 20-mile per gallonvehicle could be asked to contribute a maximum of$200 for the environment. Specific contributionscould vary according to a vehicle’s fuel economyand emissions.
If only 10 percent of new-car buyers in the UnitedStates each voluntarily agreed to contribute $200,annual receipts would be on the order of $200 mil-lion. If the same assumptions were applied to Japanand other OECD countries, this sum would roughlydouble. If owners of all motor vehicles, not just newones, were asked to make voluntary green contribu-tions, the potential for revenue generation would bemuch greater. For example, assuming a 100-percentparticipation rate, a $1 green contribution added toannual car and truck vehicle registration fees inOECD countries would generate about $500 millionper year.
The prospect of low participation rates raises ques-tions about whether voluntary schemes conform tothe polluter-pays principle and to ethical concernsabout fairness. Many potential contributors may notwish to give a “free ride” to those who choose notto contribute. A survey on green pricing carried outin Germany, for example, found that many cus-tomers thought mandatory premiums were moreequitable than voluntary contributions. Potentialcontributors would also have to be convinced thatrevenues generated through voluntary contributionswere being applied efficiently and effectively in wor-thy environmental projects. Such programs wouldrequire a simple and highly transparent administra-tive structure.
The support of major automobile manufacturersand retailers is, of course, essential to the success ofany program of voluntary contributions based onnew-car sales. And in the case of the proposed $1voluntary contribution linked to the collection ofannual vehicle registration fees, the cooperation ofgovernments would be required as well.
Demonstrating environmental leadership is becom-ing a shrewd business decision. Automobile dealers,for example, could offer participating customers“green certificates” or some other symbol of envi-ronmental commitment. To encourage customers tocontribute at the time of purchase, dealers mightalso solicit contributions in lieu of low-interestfinancing options or “cash back” programs.
THE BOTTOM LINE
Sustainable development is one of the most urgentchallenges now facing humankind. In order toreverse negative environmental trends, the worldcommunity must mobilize additional financialresources.
Public-private partnerships can achieve objectivesthat individual parties cannot achieve alone. Whilegovernments must continue to exert leadership,there is much to be gained from forging partner-ships to promote sustainable development amongthe public and private sectors, local and nationalgovernments, national and international agencies,NGOs, and civil society.
Partnerships can leverage public sector financing,and innovative financing can often be best promotedthrough public-private partnerships. Developmentassistance can catalyze other sources of financing,build capacity, strengthen institutions, share risks,and reduce transaction costs for private investment.
As this chapter shows, there are many options forinnovative and creative approaches to financing sus-tainable development. But the world communitymust find the ingenuity and political will to adoptmechanisms that will mobilize the financialresources needed to move the agenda forward.
F I N A N C I N G 87
Environics International. 2002.International EnvironmentalMonitor.(www.EnvironicsInternational.com/sp-iem.asp).
Global Environment Facility (GEF).1999. “Experience withConservation Trust Funds.”Evaluation Report 1-99.Washington, D.C.
———. 2002. “Financing forEnvironment and SustainableDevelopment in DevelopingCountries.“ Background paperprepared for the GEF MinisterialRoundtable on Financing forEnvironment and SustainableDevelopment, Monterrey,Mexico, March 17–18, 2002.
Jeucken, Marcel. 2001.Sustainable Finance andBanking: The Financial Sectorand the Future of the Planet.London: Earthscan.
Moosa, Mohammed Valli, andKjell Larsson. 2002. “Summaryof the Co-Chairs of the GEFMinisterial Roundtable onFinancing Environment andSustainable Development.”Unpublished paper preparedfor the Roundtable Session,Bali, Indonesia, June 4, 2002.
United Nations EnvironmentalProgramme (UNEP). 2000.Global Environment Outlook2000. New York: UNEP.
Wheeler, David. 2001. “Racing tothe Bottom? ForeignInvestment and Air Pollution inDeveloping Countries.” WorldBank Development ResearchGroup Working Paper 2524.Washington, D.C.
World Bank. 2001. GlobalDevelopment Finance 2001:Building Coalitions for EffectiveDevelopment Finance.Washington, D.C.: World Bank.
———. 2001. MakingSustainable Commitments: AnEnvironment Strategy for theWorld Bank. Washington, D.C.:World Bank.
———. 2002. GlobalDevelopment Finance 2002:Financing the PoorestCountries. Washington, D.C.:World Bank.
World Commission onEnvironment and Development(WCED). 1987. Our CommonFuture. New York: OxfordUniversity Press.
REFERENCES
88
CONCLUSION
ot long ago, tackling environmental problems was viewed as simply banninga toxic chemical or establishing a protected area or national park. The grow-ing demand for ecosystem services—more timber, agricultural land, or fresh-water—was met by tapping unexploited resources.
But today’s challenges—and those looming on the horizon—are complicated bymany variables that interact in complex and often misunderstood ways, makingsuccessful solutions more difficult. The magnitude of human demands on fragileecosystems has reached the point where tradeoffs among goods and serviceshave become the rule. Caught in the middle are decisionmakers in government,communities, and the private sector who are sometimes forced to make impor-tant resource decisions without an adequate understanding of the effects theirchoices will have.
In addition, peace and stability have eluded a number of developing countriesbecause the root causes of people’s suffering have been ignored.
Environmental degradation, poor economic policies, and the population explo-sion have pushed millions of people into cities that are unprepared for them—and into ways of life for which they are unprepared. For many young people,there is little hope. A lack of education, training, and job opportunities can ignitetheir discontent and lead to extremism, crime, and even terrorism. Providinghope for all citizens, not just certain segments of society, will require a compre-hensive program of economic development and environmental protection andrehabilitation.
N
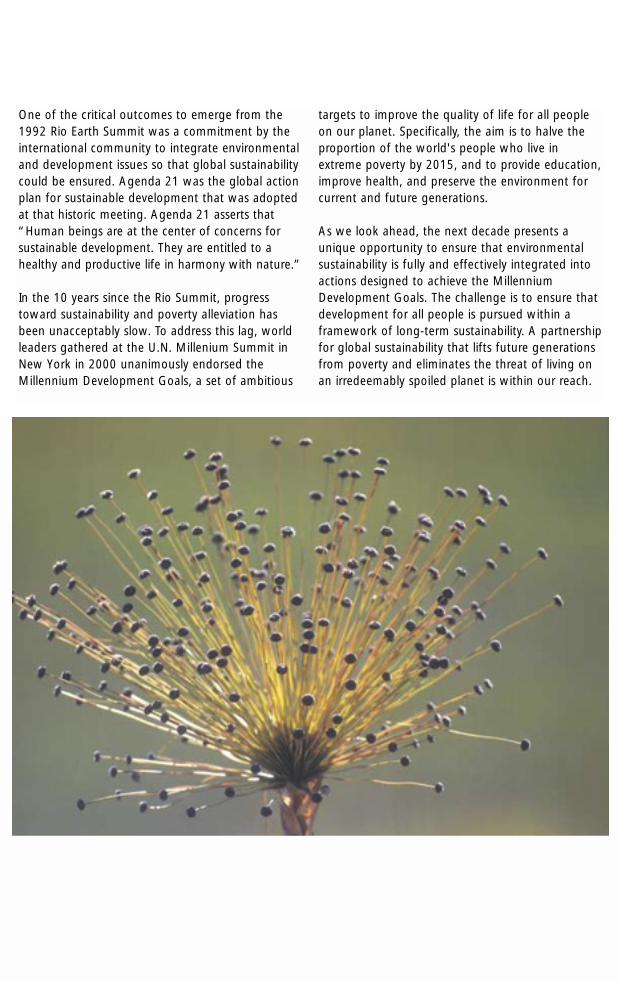
One of the critical outcomes to emerge from the1992 Rio Earth Summit was a commitment by theinternational community to integrate environmentaland development issues so that global sustainabilitycould be ensured. Agenda 21 was the global actionplan for sustainable development that was adoptedat that historic meeting. Agenda 21 asserts that“Human beings are at the center of concerns forsustainable development. They are entitled to ahealthy and productive life in harmony with nature.”
In the 10 years since the Rio Summit, progresstoward sustainability and poverty alleviation hasbeen unacceptably slow. To address this lag, worldleaders gathered at the U.N. Millenium Summit inNew York in 2000 unanimously endorsed theMillennium Development Goals, a set of ambitious
targets to improve the quality of life for all peopleon our planet. Specifically, the aim is to halve theproportion of the world's people who live inextreme poverty by 2015, and to provide education,improve health, and preserve the environment forcurrent and future generations.
As we look ahead, the next decade presents aunique opportunity to ensure that environmentalsustainability is fully and effectively integrated intoactions designed to achieve the MillenniumDevelopment Goals. The challenge is to ensure thatdevelopment for all people is pursued within aframework of long-term sustainability. A partnershipfor global sustainability that lifts future generationsfrom poverty and eliminates the threat of living onan irredeemably spoiled planet is within our reach.
ENSURING A SUSTAINABLEFUTURE
The preceding chapters provide dozens of success-ful examples of sustainable development initiativesthat are models for the future. They address keyelements for meeting the challenge of global sustainability:
� Phasing out subsidies that encourage economicinefficiency and the excessive use of naturalresources
� Creating business environments and public poli-cies that attract more foreign direct investmentby private firms
� Creating conditions that foster socially responsi-ble investments in developing countries
� Promoting public-private partnerships that fullyintegrate long-term sustainability into povertyeradication and economic development
� Mobilizing additional financial resources for envi-ronmental improvement
� Removing barriers in developed countries toimports from developing countries, particularlyin the agricultural sector
� Strengthening institutional capacity and policiesto protect the environment and support sustain-able development
� Implementing commitments by all countries—developed and developing—to internationalenvironmental agreements
� Expanding and replicating successful pilotprograms, experimental projects, and innovativepolicies
� Setting clear goals, targets, and means formonitoring progress toward achieving them.
The preceding chapters also highlight how each ofthese strategies contributes to the achievement ofthe Millennium Development Goals. Despite theproblems we face, there are promising and positivetrends that we can build upon:
� Clean renewable fuels are now the world’sfastest-growing energy technologies. They stillrepresent only 2 percent of the world’s energyconsumption, but the use of wind and solarpower is increasing from 20 to 40 percenteach year.
� More countries are devolving control of their for-est resources to local communities and indige-nous groups, providing unique opportunities forsound and sustainable forest management.
� There is growing awareness that ignoring theenvironmental effects of agriculture complicatesthe already difficult challenge of increasing foodproduction to feed a growing global population.
These trends are promising. But progress towardglobal sustainability and attaining the MillenniumDevelopment Goals will require removing the fol-lowing major constraints and barriers:
Lack of appreciation for and recognition of theenvironment as natural capital and as the foun-dation of social and economic systems, whichhinders large-scale investment in global sustain-ability. Forests, for example, are primarily valued astimber, not for providing habitats for biodiversityand other genetic resources, regulating the climateand the flow of water, protecting soils, and offeringbeautiful landscapes and opportunities for ecotourism.
Lack of international cooperation on the man-agement of natural resources found in cross-boundary areas such as a watershed or globalcommons, providing little incentive for individ-ual countries to be concerned with the conse-quences of their actions. One of the important les-sons gleaned from the depletion of the ozone layer
T H E C H A L L E N G E O F S U S TA I N A B I L I T Y90
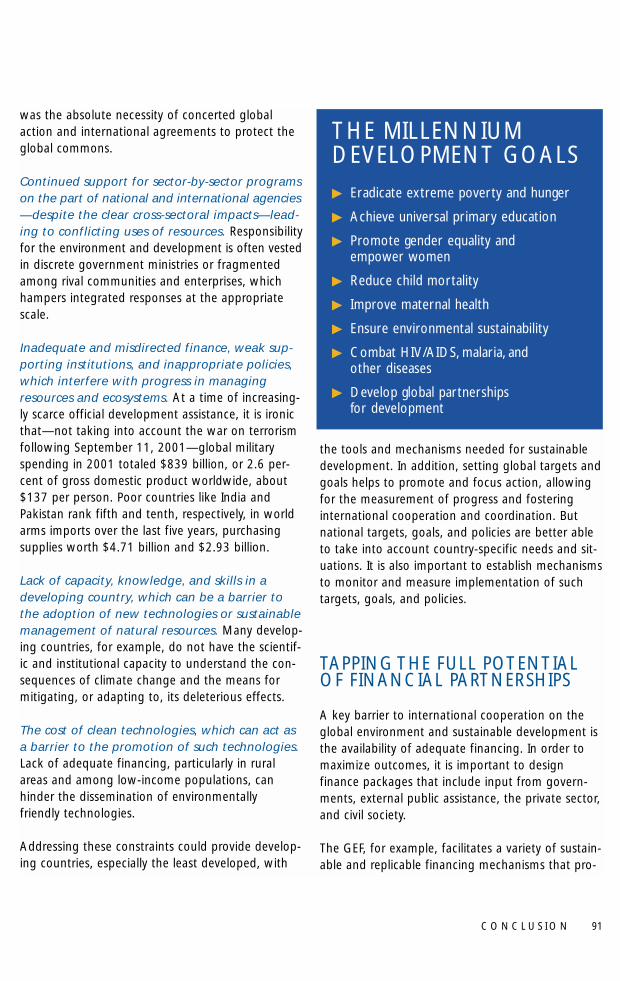
was the absolute necessity of concerted globalaction and international agreements to protect theglobal commons.
Continued support for sector-by-sector programson the part of national and international agencies—despite the clear cross-sectoral impacts—lead-ing to conflicting uses of resources. Responsibilityfor the environment and development is often vestedin discrete government ministries or fragmentedamong rival communities and enterprises, whichhampers integrated responses at the appropriatescale.
Inadequate and misdirected finance, weak sup-porting institutions, and inappropriate policies,which interfere with progress in managingresources and ecosystems. At a time of increasing-ly scarce official development assistance, it is ironicthat—not taking into account the war on terrorismfollowing September 11, 2001—global militaryspending in 2001 totaled $839 billion, or 2.6 per-cent of gross domestic product worldwide, about$137 per person. Poor countries like India andPakistan rank fifth and tenth, respectively, in worldarms imports over the last five years, purchasingsupplies worth $4.71 billion and $2.93 billion.
Lack of capacity, knowledge, and skills in adeveloping country, which can be a barrier tothe adoption of new technologies or sustainablemanagement of natural resources. Many develop-ing countries, for example, do not have the scientif-ic and institutional capacity to understand the con-sequences of climate change and the means formitigating, or adapting to, its deleterious effects.
The cost of clean technologies, which can act asa barrier to the promotion of such technologies.Lack of adequate financing, particularly in ruralareas and among low-income populations, canhinder the dissemination of environmentallyfriendly technologies.
Addressing these constraints could provide develop-ing countries, especially the least developed, with
the tools and mechanisms needed for sustainabledevelopment. In addition, setting global targets andgoals helps to promote and focus action, allowingfor the measurement of progress and fosteringinternational cooperation and coordination. Butnational targets, goals, and policies are better ableto take into account country-specific needs and sit-uations. It is also important to establish mechanismsto monitor and measure implementation of suchtargets, goals, and policies.
TAPPING THE FULL POTENTIALOF FINANCIAL PARTNERSHIPS
A key barrier to international cooperation on theglobal environment and sustainable development isthe availability of adequate financing. In order tomaximize outcomes, it is important to designfinance packages that include input from govern-ments, external public assistance, the private sector,and civil society.
The GEF, for example, facilitates a variety of sustain-able and replicable financing mechanisms that pro-
C O N C L U S I O N 91
THE MILLENNIUMDEVELOPMENT GOALS� Eradicate extreme poverty and hunger
� Achieve universal primary education
� Promote gender equality and empower women
� Reduce child mortality
� Improve maternal health
� Ensure environmental sustainability
� Combat HIV/AIDS, malaria, and other diseases
� Develop global partnerships for development
mote renewable energy by assisting both smallhouseholds and large power producers.
In collaboration with GEF and commercial banks,NGOs in Sri Lanka, Bangladesh, and Vietnam areserving as community-based microfinance offices.These offices channel credit financing to small deal-ers in household energy systems, creating a financ-ing infrastructure that will be sustainable after theGEF project is completed.
For power generation projects like India’s, whereindependent power producers contract with localcommunities and firms for power service, GEF pro-vides commercial credit guarantees, facilitates poli-cies that encourage private investment, and helpsbuild the confidence financiers need to invest inrenewable energy projects. By “mainstreaming” thefinancing of renewable energy technologies amongpublic and private investors and lenders, GEF helpsto sustain industry growth beyond one-time projectsand in turn accelerate reductions of greenhouse gasemissions.
Promoting sustainable development must becomea greater priority for governments. And by poolingresources and political will they can mobilize behindwinning environmental strategies. Governments canand should make the budget allocations and policyreforms that are necessary to support sustainabledevelopment. They can free substantial resources,and improve economic efficiency through thereduction or elimination of subsidies that encouragethe excessive use of natural resources, particularlywater and energy. A key role for governments is thecreation of enabling environments for private invest-ment—through regulatory reforms, and by makingdomestic capital more readily available for invest-ments in sustainable development.
Donors should increase public external assistancefor both capacity building and institutional and poli-cy reforms at the country level, because externalresources can play an important role in leveraging
private financing of sustainable development.Private businesses are often best positioned to sup-port successful investments in the areas of water,sanitation, and energy. Greater use of innovativefinancial instruments, such as partial risk and creditguarantees and payment for environmental services,should also be promoted.
Civil society’s financial contributions, including thoseof individuals and local communities, should be rec-ognized and harnessed in support of sustainabledevelopment. Through socially responsible invest-ments, people in both developed and developingcountries can invest in firms that follow sustainabledevelopment practices. And better mechanismsshould be developed to tap into the interest of indi-viduals who choose to invest in an environmentallysustainable future.
Although governments must continue to take thelead in promoting sustainable development, there ismuch to be gained from the formation of partner-ships among the public and private sectors, variousgovernment entities, national and internationalagencies, NGOs, and private citizens. But to reapthe full benefit of those partnerships, a comprehen-sive policy framework should be developed with thegoal of achieving specified outcomes.
GEF is a novel, multilateral entity that engages in an array of partnerships of varying dimensions andbuilds upon the comparative strengths of its part-ners. One partnership is between developed anddeveloping countries working to achieve globalenvironmental benefits.
GEF has also forged partnerships with its threeimplementing agencies—UNDP, UNEP, and theWorld Bank—and this level of partnership is growingto include other organizations. Finally, NGOs havehad an unprecedented role in the GEF; currentlymore than 700 NGOs participate in GEF activities asco-executing agents or service contractors—morethan three-quarters of them in developing countries.
T H E C H A L L E N G E O F S U S TA I N A B I L I T Y92
IT WILL TAKE ALL OF OUR WILLAND INGENUITY
So, what will it take to protect our biological heritage,avoid the devastation that climate change couldbring, sustain the soil and water that give us life,protect human health, and reduce the scourge ofpoverty and hunger? It will take leaders from allwalks of life who are willing to think and act differ-ently and lead the way. And we must all internalizethe lessons learned and replicate our successes.Most importantly, we must build on what we havelearned in the past.
� We must share the benefits of new knowledgeand opportunities by utilizing environmentallyfriendly technologies and approaches.
� We must move beyond traditional financial for-mulas and restraints to cultivate new financialresources—ones that will allow greater coopera-tion and investment in global sustainability.
� We must foster better understanding of thepotential that lies in our natural world, its peo-ple, and other living things.
� We must make polluters pay, but we can also gofurther by building sustainable livelihoods andfacilitating joint ventures.
� We must move beyond corporate greed and“irresponsibility,” and use pressure from govern-ments, investors, and consumers to advance cor-porate citizenship, self-regulation, and the busi-ness case for sustainability.
� We must use advances in science and technolo-gy to shape the future and confront the chal-lenges of the twenty-first century.
The central message of this book is one of hope,and of new strength and determination. In manyways, we have entered one of the most creativephases in human history, where science, technology,and communications advance at breathtaking speedand offer unmatched opportunities for political con-sensus and responsible change. We have new toolsat our disposal, and a vastly increased understand-ing that our strength lies in working together toovercome the threats facing our planet. The actionswe take and investments we make in the decadesahead will determine both our own evolution andthat of future generations.
Our fates are intertwined. We owe it to each other,and to our children and their children, to combineforces and ensure a sustainable future on earth.
Mohamed T. El-AshryChief Executive Officer and ChairmanGlobal Environment Facility
C O N C L U S I O N 93
T H E C H A L L E N G E O F S U S TA I N A B I L I T Y94
INDEX
AAcid rain, 42Afghanistan, 3Africa. See also individual countries
agriculture in, 21, 22, 23, 25, 26, 27, 30, 40
conserving soil resources in, 27cropland in, 22, 23forests in, 40HIPC Initiative and, 85irrigation management in, 14Lesotho Highlands Water Project in, 13, 29malaria in, 4public opinion poll in, 76renewable energy use in, 63river basins in, 4Southern Africa Botanical Network and, 53water resources in, 3, 4water scarcity in, xiii, 21, 75water stress in, 3
Agenda 21, 7, 89Agreement Establishing the World Trade
Organization, 48Agricultural Production Systems Simulator, 27Agriculture, 18–34
conservation, 26cropland area and, 22–23farm size and, 23fertilizer use and, 23irrigation and. See Irrigationland degradation and, 21, 75management and, 25, 33renewable energy use and, 68, 71technologies and, 15, 25, 28, 33water use and, 3. See also Irrigation
Akamba people, 29, 31Altos Hornos de México (AHMSA), 83Amu Darya River, 4Angola
Benguela Current Large Marine Ecosystem (BCLME) and, 9
forests in, 39Animal and Plant Health Inspection Service
(APHIS), USDA, 42APHIS (Animal and Plant Health Inspection
Service), 42Approtech, 28Arabian Peninsula, 3Aral Sea, 4Argentina
debt-for-nature swaps in, 85foreign direct investment in, 82rural energy service concessions in, 67
Asia. See also individual countriesagriculture in, 20, 22, 23, 27conserving soil resources in, 27cropland area in, 23
forests in, 39, 41public opinion poll in, 76rivers of, sanitation of, 4water scarcity in, 3water stress in, 3
AustraliaBP Amoco’s Global Choice program and, 85conserving ecosystems in, 13forests in, 39, 42, 43invasion of non-native species and, 42Murray-Darling Basin Initiative in, 29, 31–32
A2R, 52
BBaltic Sea, 5Bangladesh
agriculture in, 23, 28, 33community-based microfinance offices in,
92farm size in, 23foreign direct investment in, 80renewable energy use in, 68treadle pumps in, 28, 33
Belize, 45BENEFIT, 9Benguela Current Large Marine Ecosystem
(BCLME), 9, 16Bill and Melinda Gates Foundation, xiiiBiodiversity, ix, 9, 38, 43, 45, 48, 52, 90Black Sea, xiv, 1
non-native invasive species in, 4pollution in, 5regional cooperative efforts regarding, xii, 7,
8–9, 16Bolivia
debt-for-nature swaps in, 84, 85forests in, 51
Botswana, 10BOTT (Build-Operate-Train-Transfer)
Partnership, 12–13BP Amoco, xii, 58. See also British PetroleumB&Q, xii, 47Brazil
Cerrado ecosystem in, 43certified forest products purchased in, 47dengue fever in, 4energy-efficient labels for consumer
appliances in, 65ethanol fuel program in, 66–67foreign direct investment in, 80, 82forests in, 39, 43, 44, 52payment for ecological services in, 46renewable energy use in, 68sewer system in, 13water law enacted in, 1, 9, 10, 29
British Petroleum, BP Amoco’s Global Choice Program and, xii, 58
Build-Operate-Train-Transfer (BOTT) Partnership, 12–13
Burkina Faso, 29Bwindi Impenetrable National Park project, 53
CCambodia, 50Cameroon, dam constructed in, 14, 28Canada
debt-for-nature swaps in, 85forests in, 39, 44, 46, 51–52
Capacity development programs, 33–34Carbon dioxide (CO2) emission taxes, 80–81Caribbean Natural Resources Institute, xiiiCauca Valley, 45CBD (United Nations Convention on
Biological Diversity), 38, 42, 43, 48, 62Cebu, Philippines, 64Central America. See also Latin America;
individual countriesEnvironmental Enterprises Assistance Fund
financing in, 83Mesoamerican Biological Corridor in, 43, 45
renewable energy use in, 64Central American Commission for
Environment and Development, 45Central American Protected Areas System, 45Cernovka, Romania, 9Certified Tradable Offsets, 77CGIAR. See Consultative Group on
International Agricultural ResearchChicago Convention on Civil Aviation, 81Chile
debt-for-nature swaps in, 85forests in, 43
Chilia Veche, Romania, 9China
agriculture in, 23declining energy intensity in, 65demand for food in, 19, 21energy-efficient labels for consumer
appliances in, 65fertilizer use and, 23foreign direct investment in, 80, 82forests in, 39, 41, 43higher-efficiency energy programs in, 65, 66Huang He (Yellow) River in, 4irrigated area in, 23Liuduzhai Project (Yangtze Basin) in, 27renewable energy use in, 58, 63, 67, 68, 71renewable portfolio standards (RPS)
programs and, 67water scarcity in, 21
CH2M HILL, 79Clean Development Mechanism (CDM) of the
Kyoto Protocol, 52Climate Action Network, xiii
I N D E X 95
Climate change. See also United Nations Framework Convention on Climate Changedirty fuels and, 61, 62invasion of non-native species and, 42water and, 5–6
Collaborative Partnership on Forests, 49Colombia
debt-for-nature swaps in, 85payment for ecological services in, 45
Colorado River, 4Community participation
in fisheries management, 10–11in irrigation, 27in water resource management, 10–12
Congo, Democratic Republic of, 39Congo River, 3Conservation agriculture, 26Conservation International, 84Consultative Group on International
Agricultural Research (CGIAR), 30, 33. See also ICARDA; ICRISAT; IFPRI; IITA; IWMI; WARDA
Consumer appliances, energy-efficient labels for, 65–66
Convention Concerning Indigenous and TribalPeoples in Independent Countries, 48
Convention for the Protection of the WorldCultural and Natural Heritage, 48Convention on International Trade in
Endangered Species of Wild Fauna and Flora, 48
Coral reefs, 6Costa Rica
debt-for-nature swap in, 84“Eco-OK” certification program for bananas
in, 82forests in, 49, 77Mesoamerican Biological Corridor project
and, 45, 77payment for ecological services in, 46, 77
Côte d’Ivoire, 30Cropland area, 22–23Cuenca, Ecuador, 46
DDana Nature Reserve, 53Danube River
pollution and, 5regional cooperative efforts regarding, xii, 7,
8–9, 16Debt-for-nature swaps, 84–85Democratic Republic of the Congo, 39Denmark
environmental taxes in, 80renewable portfolio standards (RPS) programs in, 67
Development Bank of the Philippines, 64Development, sustainable. See Sustainable
developmentDirty fuels
dependence on, 59–60hidden costs of, 60–62
Disease, water-related, 4, 6
Dnieper River, 5Dniester River, 5Dominican Republic, renewable energy use
in, 64, 68Don River, 5DuPont, xiiDurban, South Africa, 12, 13
EEast Africa, conserving soil resources in, 27.
See also Africa; individual countriesEcological services, payment for, 45–46, 77Ecosystems
conserving, 13–14emphasizing, 28–29, 31managing large marine, 9, 15–16protection of, 15
Ecuadorconserving ecosystems in, 13debt-for-nature swap in, 84payment for ecological services in, 46
Ecuadorian Forest and Natural Areas Institute,13
Electricité de France, 63–64El Salvador
debt-for-nature swaps in, 85Mesoamerican Biological Corridor project
and, 45Energy, 57–73
access to, 57–58availability of, 57–58carbon dioxide (CO2) emission taxes and,
80–81clean, agenda for, 69–72clean fuels and, 62–65consumption of, 59–60declining energy intensity and, 65dirty fuels and, 59–62environmental implications and, 57, 58ethanol and, 66–67fuel switching and, 66–67market transformation programs and, 66policies and incentives regarding, 57, 58promoting efficiency in, 65–69renewable. See Renewable energyrural energy service concessions and, 67taxes on, 80–81
Enterprise for the Americas Initiative, 85Environment. See also Biodiversity; Forests;
Waterfinancing of, 75–86. See also Global
Environment Facilitypublic opinion and, 76–77, 85, 86
Environmental Enterprises Assistance Fund, 83
Environmental technologies, 83Ethanol fuel program, 66–67Euphrates valley, 27Europe. See also individual countries
agriculture in, 23cropland area in, 23fertilizer use and, 23food exports from, 21
forests in, 39, 40, 41, 46European Union, Danube and Black Sea
project and, 8
FFAO. See Food and Agriculture Organization
Farm size, 23Fertilizer use, 23Financing
debt-for-nature swaps and, 84–85governments and, 77-82for renewable energy, 68–69, 71, 83, 85,
91–92of the environment, 75–87. See also Global
Environment Facilityof sustainable development, 75–87private sector, 82-83subsidies and 81-82voluntary “green” payments and, 85–86
Finlanddebt-for-nature swaps in, 85environmental taxes in, 80forests in, 41, 46
Finnish Forest Certification System, 46, 47First Nations Group of Clayoquot Sound,
51–52Fisheries
community-based management of, 10–11global, trends in, 5managing large marine ecosystems and, 9Reykjavik Conference on, 7stress of, 20
Fooddemand for, 19–21production of. See Agriculturesecurity of, action agenda for, 31–34
Food and Agriculture Organization of the U.N. (FAO), 5, 23, 37, 38–39, 40, 41Code of Conduct of, for Responsible
Fisheries, 7Foreign direct investment, 80, 82, 83Forests, 37–53
agenda for, 49–55certification of, 46–47, 50–51community control and, 46conservation of, 49–52consumption trends and, 43–44converted to forest plantations, 41deforestation and, 37, 41emerging threats to, 41–42globalization and, 44as habitats, 38invasion of non-native species and, 41, 42locations of, 38–41losses of, 38–41new economics and, 43–46new global conventions regarding, 48–49new politics and, 46–49production trends and, 43–44valuing, 44–45
Forest Stewardship Council, 46Forest Trends, 49
T H E C H A L L E N G E O F S U S TA I N A B I L I T Y96
GGanges River, 4GEF. See Global Environment FacilityGender, land ownership and, 24Germany
debt-for-nature swaps in, 85public opinion poll in, 86voluntary “green” payments and, 86
Global Alliance for Improved Nutrition, xiiiGlobal Environment Facility (GEF), 21
Benguela Current Large Marine Ecosystem (BCLME) project and, 9, 16
biodiversity conservation programs and, 43, 48, 52–53, 83
Bwindi Impenetrable National Park project and, 53
Dana Nature Reserve project and, 53Danube and Black Sea project and, 8development of NGO culture and, 53“ecomarkets” project in Costa Rica and,
45–46, 77forest programs and, 43, 48GEF/IFC Terra Capital Fund of, 83higher-efficiency energy program in
Thailand and, 66initiation of, xiii, 62, 78Integrated Ecosystem Management program
and, 43Lake Victoria project and, 11Marine Protected Area in Samoa and, 53Mesoamerican Biological Corridor in Central
America and, 43, 45Mgahinga Gorilla National Park project and,
53NGOs’ role in, xiii, 53, 92Nile River project and, 9, 15projects in internationally significant
biological areas and, 48renewable energy financing and, 71, 91–92role of, ix, xiii, 78, 91–92Romanian project and, 9Roundtable on Forests of, 49Roundtable on Land, Water, and Food
Security of, 31Roundtable on Sustainable Energy of,
70–72Southern Africa Botanical Network and, 53Strategic Partnership for the Danube and
Black Sea Basin and, 8, 16wind power in India supported by, 68–69
Global Environment Outlook 2000 (UNEP), 77Global Forest Products, 44Global Programme of Action (GPA) for the
Protection of the Marine Environment from Land-Based Activities, 7
GPA (Global Programme of Action) for the Protection of the Marine Environment from Land-Based Activities, 7
GPA Intergovernmental Review Meeting, 7“Green” payments, 85–86Green Revolution, 34Guatemala
Mesoamerican Biological Corridor project
and, 45renewable energy use in, 68, 71
Guinea, 30Gulf of Mannar Biosphere Reserve, 10G7 Pilot Program to Conserve the Brazilian
Rain Forest, 78G-8 Summit (2000), 58
HHealth
dirty fuels and, 61renewable energy use and, 68, 71water and, 6, 7, 11, 14–15
Home Depot, xiiHonduras
Mesoamerican Biological Corridor project and, 45
renewable energy use in, 64Huang He (Yellow) River, 4
IICARDA (International Center for Agricultural
Research in the Dry Areas), 26, 27ICRISAT (International Crops ResearchInstitute for the Semi-Arid Tropics), 27IFC (International Finance Corporation), 53,
83IFPRI (International Food Policy Research
Institute), 19, 21, 23IITA (International Institute of Tropical
Agriculture), 33IWMI (International Water Management
Institute), 27India
agriculture in, 20, 21, 23, 27, 28arms imports by, 91Centre for Science and Environment (CSE)
and, 11–12Ganges River in, 4demand for food in, 19, 21farm size in, 23fertilizer use and, 23forests in, 45Gulf of Mannar Biosphere Reserve and, 10
irrigated area in, 23irrigation subsidies in, 24
rainwater harvesting and, 11–12renewable energy use in, 58, 63, 67, 68–69renewable portfolio standards (RPS)
programs and, 67results of solid fuel use in, 61water scarcity in, 21
Indonesia Ecolabelling Institute (LEI), 46–47Indonesia, forests in, 39, 41, 43, 46–47, 50Information technologies, 27Intergovernmental Panel on Climate Change,
61Intergovernmental Review Meeting, 7International Civil Aviation Organization, 81International Conference on Freshwater, 7International Consortium for Cooperation on
the Nile, 9International Coral Reef Initiative, 6
International Development Enterprises, 28International Finance Corporation (IFC), 53,
83International Monetary Fund (IMF), 85International Organization for
Standardization, 46International Plant Protection Convention, 42International travel and tourism, taxes on, 81International Tropical Timber Agreement, 48Iran, Islamic Rep. of, 3Irrigation, 22, 23
alternative furrow, 26community participation in, 27deficit, 25efficiency in, 25–26government subsidies and, 24, 32, 81–82innovative technologies and, 13, 15, 28, 33management and, 14
Italyenvironmental taxes in, 80renewable portfolio standards (RPS)
programs in, 67IUCN (World Conservation Union), 14, 28, 41IWMI (International Water Management
Institute), 27
JJamaica, 85Japan
agriculture in, 23fertilizer use and, 23renewable portfolio standards (RPS)
programs and, 67voluntary “green” payments and, 86
JordanDana Nature Reserve project and, 53Royal Society for the Conservation of Nature
and, xiii
KKazakhstan, 26Kenya
agriculture in, 28, 29, 31, 33Lake Victoria project and, 11pedal pumps in, 28renewable energy use in, 68
Kenya Agricultural Research Institute, 33Knabur River, 3Koudia el Baida, Morocco, 63–64Kyoto Protocol, 48
Clean Development Mechanism (CDM) of, 52
LLake Geneva, 7Lake Victoria
management of land and water resources and, 11
non-native invasive species in, 4Land Bank, 64Land degradation, 21, 75Land management
capacity development and, 33–34
I N D E X 97
integrated approaches to, 31–32Land tenure, 8, 24, 32–33Latin America. See also Central America;
South America; individual countriesagriculture in, 22, 23
cropland in, 22, 23fertilizer use and, 23forests in, 40GEF/IFC Terra Capital Fund financing in, 83public opinion poll in, 76water quality in, 4water stress in, 3
LEI (Indonesia Ecolabelling Institute), 46–47Lesotho Highlands Water Project, 13, 29Lesotho River, 13Lisaak Forest Resources, 51–52Liuduzhai Project, 27Logone River, 14, 28
MMachakos, Kenya, 29, 31Madhya Pradesh, India, 45Malaysia
foreign direct investment in, 82forests in, 43, 47, 51
Mankote, St. Lucia, 12Marine Protected Area in Samoa, 53Marrakesh, Morocco, 62Mesoamerican Biological Corridor, xii, 43, 45,
77Mexico
community participation in irrigation in, 27foreign direct investment in, 80, 82forests in, 51higher-efficiency energy program in, 66
Mesoamerican Biological Corridor project and, xii, 45privatization of steel concern, AHMSA, in,
83public opinion poll in, 76renewable energy use in, 68water law enacted in, 1, 9, 10, 29water scarcity in, 21
Mgahinga Gorilla National Park project, 53Microfinance, 92Middle East, water scarcity in, 21. See also
individual countriesMillennium Development Goals, ix, xiv, 78,
89–91Minas Gerais, Brazil, 46Mohale Dam, 29Montreal Protocol, Multilateral Fund for the
Implementation of, 78Montreal Protocol on Substances that Deplete
the Ozone Layer (1987), xiiMorocco, renewable energy use in, 63–64,
68Mossi plateau, 29Multilateral Fund for the Implementation of
the Montreal Protocol, 78Munich Reinsurance Company, 5Murray-Darling River basin, 13Murray-Darling Basin Initiative and, 29, 31–32
NNaam movement, 29Nairobi, Kenya, 29Namibia
Benguela Current Large Marine Ecosystem (BCLME) and, 9
water resources in, 9National Forestry Financing Fund, 77National Water Act (South Africa, 1998),
9–10National Water Commission (Mexico), 10National Water Harvester’s Network, 11–12National Water Law (Mexico, 1992), 10, 29Nature Conservancy, The, 13NERICA (New Rice for Africa), 30Netherlands
debt-for-nature swaps in, 85environmental taxes in, 80renewable portfolio standards (RPS)
programs in, 67New Zealand
forests in, 42, 43invasion of non-native species and, 42
NGOs (nongovernmental organizations)climate change debate and, 62debt-for-nature swaps and, 84Rio Earth Summit and, 62role of, in the GEF, xiii, 53, 92strategic alliances and, 70
Nicaragua, 45Niger River, 4Nile Basin Initiative, 9, 15Nile Council of Ministers, 9Nile River, xiv, 1, 4
regional cooperative efforts regarding, xii, 9,15
Nongovernmental organizations. See NGOsNon-native species, 4, 41, 42, 44North America, forests in, 40. See also
individual countriesNorthern China, water scarcity in, 21. See
also ChinaNorth Sea, 7Norway
environmental taxes in, 80forests in, 46
OOceania
agriculture in, 23cropland area in, 23forests in, 39
ODA. See Official development assistanceOECD (Organisation for Economic Co-
operation and Development), 4, 15, 76, 80, 81, 82
Official development assistance (ODA)foreign direct investment versus, 82, 83function of, 75, 77–78stagnation of flows of, 78, 80trends in, 80
Office National de l’Electricite (ONE), Morocco, 64
Okavango River basin, 7Okinawa, Japan, 58
PPakistan, 91Panama, 45Panchayat councils (India), 11Pan-European Forest Certification Framework,
46Papua New Guinea, 41Paraná, Brazil, 46Paris Conference on Oceans and Coasts, 7Partnerships
promoting, 90public-private, 12–13, 90regional, 8–9strengthening, 34tapping full potential of, 91–92water resource management and, 8–9,
12–13, 34Pedal pump, 28. See also treadle pumpPeriprava, Romania, 9Peru, 39Philippines
coral reefs in, 6energy-efficient labels for consumer
appliances in, 65forests in, 50public opinion poll in, 76renewable energy use in, 64–65
Philippines National Bank, 64Photovoltaic (PV) technology, xii, 63, 65, 68,
71Poland
forests in, 46higher-efficiency energy project in, 66
Pollutionmarine, 4–5sewage, 4water, 4–5, 14
Portugal, 67Poverty
renewable energy and, 71water and, 6
ProAlcool program, 66–67Prototype Carbon Fund, 52, 53Prototype Sequestration Fund, 52Public opinion, environment and, 76–77, 85,
86PV (photovoltaic) technology, xii, 63, 64, 68,
71
QQuito, Ecuador, 13, 46
RRainwater harvesting, 11–12, 29Ramsar Convention on Wetlands of
International Importance, 48Renewable energy
financing for, 68–69, 71, 83, 85, 91–92grid-based producers of, 68–69increased use of, xii, 63–65, 67–69
T H E C H A L L E N G E O F S U S TA I N A B I L I T Y98
poverty reduction and, 71private investment in, 63promising approaches to, 65–69regulatory frameworks for, 68–69renewable portfolio standards (RPS) and, 67transition to, 58voluntary “green” payments and, 85
Renewable portfolio standards (RPS), 67Renewable Resources LLC, 44Reykjavik Conference on Responsible Fisheries
in the Marine Ecosystem, 7Rhine River basin, 7Rice, new varieties of (NERICA), 30Rio de Janeiro, Brazil, 4Rio Earth Summit (1992), ix, x, xiii, 7, 41, 89
GEF emergence and, 62, 78impacts of, 62–63
Rio Plus Ten, 7Romania, 9Royal Dutch Shell, xiiRPS (renewable portfolio standards), 67Rural energy service concessions, 67Russian Federation
forests in, 39, 40, 41fossil fuel subsidies in, 77
SSamoa, Marine Protected Area in, 53Sanitation, viii, 1, 4Sarvodaya, 68SEAF, Incorporated, 71Senegal River, 7, 25Senqu/Orange River, 29Sewage pollution, 4Shared Vision Program of the Nile Basin
Initiative, 9Shell, 58
Shell International Renewables and, 63Sierra Leone, 30Singapore, 82Soil conservation, 26Soluz Dominicana, 64Soluz Honduras, 64South Africa
Benguela Current Large Marine Ecosystem (BCLME) and, 9
BOTT (Build-Operate-Train-Transfer) Partnership and, 12–13
forests in, 42, 43, 44invasion of non-native species and, 42rural energy service concessions in, 67water law enacted in, 1, 9–10, 12, 29water resources in, 9–10, 44Working for Water Program in, 44
South America. See also Central America; Latin America; South America; individual
countriesforests in, 39, 40river basins in, 4
South Asia, river basins in, 4. See also Asia; individual countries
Southeast Asia, conserving soil resources in, 27. See also Asia; individual countries
Southern Africa. See also Africa; individual countriesLesotho Highlands Water Project in, 13, 29
Southern Africa Botanical Network and, 53Southern Africa Botanical Network, 53Sri Lanka
community-based microfinance offices in, 92
renewable energy use in, 68Starbucks, xiiSt. Lucia, xiiiStrategic Partnership for the Danube and
Black Sea Basin, 8, 16Streamflow regulation, 13Sub-Saharan Africa. See also Africa; individual
countriesagriculture in, 21, 22, 23, 25, 30cropland in, 22, 23HIPC Initiative and, 85
Subsidiesagricultural, 82electricity, 81–82fossil fuel, 77water, 24, 32, 81–82
Sustainable developmentchallenge of, ix, x-xv, 92financing of, 75–86foreign direct investment and, 80, 82, 83as good business, 79official development assistance (ODA) and.
See Official development assistanceSwaminathan, M. S. Research Foundation, 31Sweden
environmental taxes in, 80forests in, 41, 46
Switzerlanddebt-for-nature swaps in, 85financing of environmental projects by, 83
Syr Darya River, 4Syrian Arab Republic
deficit irrigation in, 25land-use map of, 27water scarcity in, 3
TTamil Nadu, India, 27Tanzania
forests in, 43Lake Victoria project and, 11
Taxeson carbon dioxide (CO2) emissions, 80–81on energy, 80–81on international travel and tourism, 81
Technology(ies)in agriculture, 15, 25, 28, 33environmental, 83information, 27in irrigation, 13, 28photovoltaic (PV), xii, 63, 64, 68, 71transfer of, 28
Thailandcoral reefs in, 6higher-efficiency energy programs in, 65–66
Tourism, international, taxes on, 81Transboundary Environmental Analysis, 9Transboundary issues and projects, xii, 2, 11,
50, 90Travel, international, taxes on, 81Treadle pump, 15, 28, 33Tropical Forest Conservation Act (United
States, 1998), 85
UUganda, 31
Bwindi Impenetrable National Park project and, 53forests in, 53Lake Victoria project and, 11Mgahinga Gorilla National Park project and,
53Minziro forest in, 53renewable energy use in, 71
Uganda Energy Industry Association, 71Ukraine, 79UNCCD (United Nations Convention to
Combat Desertification), 38, 48, 49UNCLOS (United Nations Convention on the
Law of the Sea), 7UNDP. See United Nations Development
ProgrammeUNEP. See United Nations Environment
ProgrammeUNFCCC. See United Nations Framework
Convention on Climate ChangeUnited Kingdom, 47United Nations. See also other entries
beginning with United NationsFood and Agriculture Organization of. SeeFood and Agriculture Organization (FAO)United Nations Convention
on Biological Diversity (CBD), 38, 42, 43, 48, 49, 62
to Combat Desertification (UNCCD), 38, 48,49
on the Law of Non-navigational Uses of International Watercourses, 7
on the Law of the Sea (UNCLOS), 7United Nations Development Programme
(UNDP), ix, 53Danube and Black Sea project and, 8as implementing agency of GEF, 92village marine conservation councils
(VMCCs) and, 10–11United Nations Economic Commission, 41United Nations Environment Programme
(UNEP), ix, 8, 39Global Biodiversity Assessment of, 38Global Environment Outlook 2000 report
of, 77as implementing agency of GEF, 92World Conservation Monitoring Centre of,
38, 41United Nations Foundation, xiiiUnited Nations Framework Convention on
Climate Change (UNFCCC), 38, 48, 49adoption of, 62
I N D E X 99
initiation of Global Environment Facility and,62
Kyoto Protocol to. See Kyoto ProtocolUnited Nations High-Level panel on Financing
for Development, 81United Nations Millennium Declaration, 2United Nations Millennium Summit, 89United States
agriculture in, 23certified forest products purchased in, 47cropland area in, 23debt-for-nature swaps in, 85environmental taxes in, 80fertilizer use and, 23food exports from, 21forests in, 39, 42invasion of non-native species and, 42renewable portfolio standards (RPS)
programs in, 67water resources in, 44
United States Department of Agriculture (USDA), Animal and Plant Health Inspection
Service (APHIS), 42U.N. See United NationsUruguay, 85
VVienna Convention for the Protection of the
Ozone Layer (1985), x–xiVietnam
community-based microfinance offices in, 92
renewable energy use in, 68Village marine conservation councils
(VMCCs), 10–11VMCCs (village marine conservation councils),
10–11Volta River, 4Voluntary “green” payments, 85–86
WWARDA (West Africa Rice Development
Association), 30Water, 1–17
in agriculture, 3. See also Irrigationclimate change and, 5–6coral reefs and, 6cost of, to user, 6, 10, 12–13, 14, 24, 32,
33, 81–82drinking, 4efficiency of using, 15fishing in. See Fisheriesglobal crisis and, 2–6government subsidies and, 24, 32, 81–82health and, 6, 7, 11, 14–15institutional reforms and, 14international agreements regarding, 7–8legal reforms and, 1, 9–10, 14management of. See Water resource
managementMillennium Declaration on, 2national policy and, 14non-native invasive species and, 4
pollution and, 4–5, 14poverty and, 6quality of, 4, 14–15rainwater harvesting and, 11–12, 29rights to, 24, 32–33sanitation and, 4scarcity of, xiii, 2–4, 21–22, 75streamflow regulation and, 13stress and, 3user’s cost for, 6, 10, 12–13, 14, 24, 32, 33,
81–82watershed protection and, 44weather events and, 5–6wetlands restoration and, 9
Water resource managementaction agenda for, 14–16, 31–34capacity development and, 33–34community participation and, 10–12conserving ecosystems and, 13–14innovative irrigation technologies and, 13,
15, 28large marine ecosystems and, 9legal reforms and, 1, 9–10, 14mainstreaming integrated approaches to,
31–32partnerships and, 8–9, 12–13, 34. See also
Partnershipspromising strategies for, 8–14
Watershed protection, 44Weather events, 5–6West Asia. See also Asia; individual countries
agriculture in, 23cropland area in, 23water scarcity in, 3
Western Africa, irrigation management in, 14.See also Africa; individual countries
Western Europe. See also Europe; individual countriesagriculture in, 23cropland area in, 23
Wetlandsrestoration of, 9Ramsar Convention on, 48
Weyerhaeuser, 44, 52WHO (World Health Organization), 4World Bank, ix, 60
Danube and Black Sea project and, 8environmental guidelines of, 83Heavily Indebted Poor Countries (HIPC)
Initiative and, 15, 85higher-efficiency energy program in Thailand
and, 66as implementing agency of GEF, 92Lesotho Highlands Water Project and, 13,
29Liuduzhai Project in Yangtze Basin in China
and, 27Prototype Carbon Fund and, 52, 53Prototype Sequestration Fund and, 52
World Business Council for Sustainable Development, 63, 78, 79
World Commission on Environment and Development, 75
World Commission on Water for the 21st Century, 3, 7, 14, 82
World Conservation Monitoring Centre, 38, 41
World Conservation Union (IUCN), 14, 28, 41World Energy Assessment, 59, 60, 71World Health Organization (WHO), 4World Summit on Sustainable Development,
ixWorld Trade Organization (WTO), Agreement
Establishing, 48World Water and Climate Atlas, 27World Water Council, 23World Water Forum, 7World Water Vision (World Water Council),
23, 25, 26World Wide Fund for Nature, 49Worldwatch Institute, 23WorldWater Corporation, 64
YYangtze Basin, 27Yellow (Huang He) River, 4
ZZambezi River, 4Zimbabwe, 45

A C K N O W L E D G M E N T S 101
Senior Author Robert Livernash
Contributing AuthorsMohamed T. El-Ashry, Herbert Acquay, Alfred Duda, Shirley Geer,Kanta Kumari, Eric Martinot, Alan Miller, Dennis Mahar
Additional ContributionsHutton Archer, Patricia Bliss-Guest, Maria C. J. Cruz, Ken King,Walter Lusigi, Andrea Merla, Mario Ramos, Avani Vaish
Senior EditorShirley Geer
Contributing EditorsKim E. Kelley, Linda Starke
ResearchersShelly McKenzie, Asha Richards
ProductionKim E. Kelley, Ilma Kramer
Photo ResearchShelly McKenzie
DesignPatricia Hord Graphik Design
PrintingJ.D. Lucas
ACKNOWLEDGMENTS
T H E C H A L L E N G E O F S U S TA I N A B I L I T Y102
COVER
An oasis in the Sahara Desert ■ Roberto Arakaki, Image State
INTRODUCTION
Page xi: Underwater water lilies in Okavango Delta, Botswana ■ Frans Lanting, Minden Pictures
CHAPTER 1
Page xvi: Boy bathing at a well in Keoladeo Ghana NP, India ■ Bernard Castelein, naturepl.com
Page 2: Waterfall at Elands River Falls, South Africa ■ Roger de la Harpe, Africa Imagery
Page 5: Sea anemone in Bonaire ■ Topham Picturepoint
Page 6: Girl drinking water from a bamboo pipe, Davao, Philippines ■ Ron Giling, Still Pictures
Page 8: Fog over the Danube, near Budapest ■ Douglas Peebles, Age fotostock
Page 11: Man fishing in the Amazon, Brazil ■ Ricardo Beliel, www.socialphotos.com
Page 12: Penguins at the beach, Chile ■ Curt Carnemark, World Bank
Page 14: Fisherman throwing nets in Santa Marta, Colombia ■ Edwin Huffman, World Bank
CHAPTER 2
Page 18: Rice paddies in Thailand ■ Mark Downey, Getty Images
Page 22: Crossing the Lakhya River during monsoon, Bangladesh ■ Trygve Bolstad, Panos Pictures
Page 24: Woman with bananas harvested for export, Ghana ■ Ron Giling, Lineair/Still Pictures
Page 27: Man with his catch of the day, Ecuador ■ Edwin G. Huffman, World Bank
Page 28: Farmers preparing rice fields in Asia ■ Topham Picturepoint
Page 31: NERICA rice tassle ■ WARDA
Page 32: Child in rural China ■ Duan Xing-yun, UNEP/Topham Picturepoint
CHAPTER 3
Page 36: Lowland rainforest interior in Belize ■ Tui de Roy, Minden Pictures
Page 38: Forest Day gecko, Ile aux Aigrettes, Mauritius ■ Roger de la Harpe, Africa Imagery
Page 42: Kaka parrot in flight, North Island, New Zealand ■ John Cancalosi, naturepl.com
Page 45: Vegetation in Guatemala ■ Curt Carnemark, World Bank
Page 47: Forest in the mist, Thailand ■ Kitprempool Natta, Topham Picturepoint
Page 49: Girls walking in a forest in India ■ Anish Dua/UNEP, Still Pictures
Page 50: Tropical monkey ■ World Bank
PHOTO CREDITS
P H OTO C R E D I T S 103
CHAPTER 4
Page 56: Student learning about electricity, Zambia ■ Giacomo Pirozzi, Panos Pictures
Page 62: Farmers walking home from work in Nagercoil, India ■ Daniel O’Leary, Panos Pictures
Page 64: Rush hour near the old town, Dhaka, Bangladesh ■ Heldur Netocny, Panos Pictures
Page 69: Mother and children on a bicycle in Hoi An, Vietnam ■ Julien Frebet, Still Pictures
CHAPTER 5
Page 74: Young spice vendor in India ■ Nicholas DeVore, Getty Images
Page 79: Woman signing micro-credit loan forms in Kenya ■ Giacomo Pirozzi, Panos Pictures
Page 80: Solar energy panels in Mali ■ Curt Carnemark, World Bank
Page 84: Saddleback tamarin feeding in the Madre de Dios rainforest, Peru ■ Peter Oxford, naturepl.com
CONCLUSION
Page 89: A perennial from Brazil’s cerrado ■ José Caldas, www.socialphotos.com

lkfl;fjgfdk;ljglkfdjklj
Document1 5/2/97 8:55 AM Page 1
THE HUMAN COMMUNITY FACES AN ARRAY OF CHOICES
ABOUT THE QUALITY OF OUR LIVES AND THE STATE OF
THE GLOBAL ENVIRONMENT. EACH OF THOSE CHOICES
WILL HELP TO DETERMINE WHAT KIND OF WORLD OUR
CHILDREN AND GRANDCHILDREN WILL LIVE IN . . .
THE LEGACY IS LARGELY OURS TO SHAPE.
KOFI ANNAN
U.N. SECRETARY GENERAL
For more information contact:
Hutton Archer
Senior External Affairs Coordinator
Global Environment Facility
1818 H Street NW
Washington, DC 20433 USA
Tel: 202 473 0508
Fax: 202 522 3240
Internet: www.gefweb.org
PRINTED ON ENVIRONMENTALLY FRIENDLY PAPER
TH
E C
HA
LL
EN
GE
OF SU
STA
INA
BIL
ITY
ABOUT THE CHALLENGE OF SUSTAINABILITY
IN MANY WAYS, WE HAVE ENTERED ONE OF THE MOST CREATIVE PHASES IN HUMAN
HISTORY, WHERE SCIENCE, TECHNOLOGY, AND COMMUNICATIONS ADVANCE AT
BREATHTAKING SPEED AND OFFER UNMATCHED OPPORTUNITIES FOR POLITICAL
CONSENSUS AND RESPONSIBLE CHANGE. WE HAVE NEW TOOLS AT OUR DISPOSAL,
AND A VASTLY INCREASED UNDERSTANDING THAT OUR STRENGTH LIES IN WORKING
TOGETHER TO OVERCOME THE THREATS FACING OUR PLANET.THE ACTIONS WE TAKE
AND INVESTMENTS WE MAKE IN THE DECADES AHEAD WILL DETERMINE BOTH OUR
OWN EVOLUTION AND THAT OF FUTURE GENERATIONS.
OUR FATES ARE INTERTWINED. WE OWE IT TO EACH OTHER,AND TO OUR CHILDREN
AND THEIR CHILDREN, TO COMBINE FORCES AND ENSURE A SUSTAINABLE FUTURE
ON EARTH.
MOHAMED T. EL-ASHRY
CHIEF EXECUTIVE OFFICER AND CHAIRMAN
GLOBAL ENVIRONMENT FACILITY
THE CHALLENGE OF SUSTAINABILITY
G l o b a lE n v i r o n m e n tFa c i l i t yISBN 1-884122-79-5
GEF
G l o b a lE n v i r o n m e n tFa c i l i t y