the unraveling of the american dream: foreclosures and communities of color in minneapolis ryan...
TRANSCRIPT
The Unraveling of the American Dream: Foreclosures and Communities of Color in Minneapolis
Ryan Allen
May 14, 2009
National Neighborhood Indicators Partnership
Research Dilemma
Minority households have increased their presence in the housing market Minority homeownership rate 1994
= 43% Minority homeownership rate 2007
= 51% Strong economy, looser mortgage
underwriting and new mortgage products
Foreclosure crisis! Minorities disproportionately hold
subprime mortgages To what extent have minority
households experienced foreclosure?
Existing Research Findings Only two studies have focused on
race/ethnicity and foreclosures Boston Metro Area California
Blacks, Hispanics and Asians more likely to experience a foreclosure compared to Whites
No studies have focused on nativity status or household composition
Why Study Foreclosures, Immigrants and Kids? Increased presence of
immigrants in housing markets
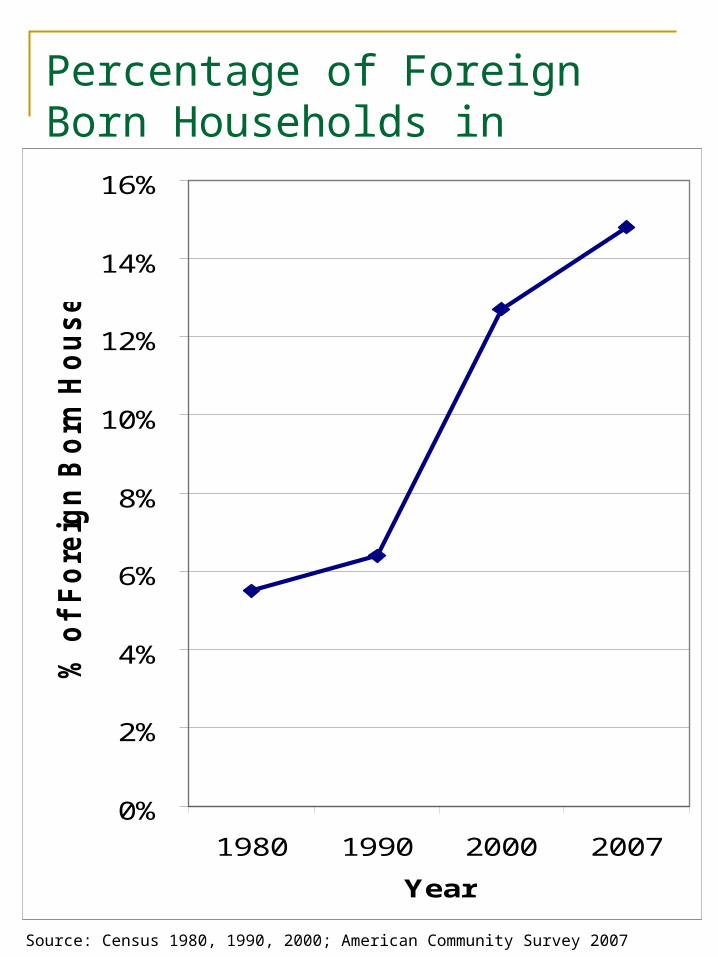
Percentage of Foreign Born Households in Minneapolis, 1980-2007
0%
2%
4%
6%
8%
10%
12%
14%
16%
1980 1990 2000 2007
Year
% o
f F
ore
ign
Bo
rn H
ou
se
ho
lds
Source: Census 1980, 1990, 2000; American Community Survey 2007
Why Study Foreclosures and Immigrants? Increased presence of
immigrants in housing markets Households with children may
be especially vulnerable
Why Study Foreclosures and Immigrants? Increased presence of
immigrants in housing markets Households with children may be
especially vulnerable Foreclosures are increasingly
common
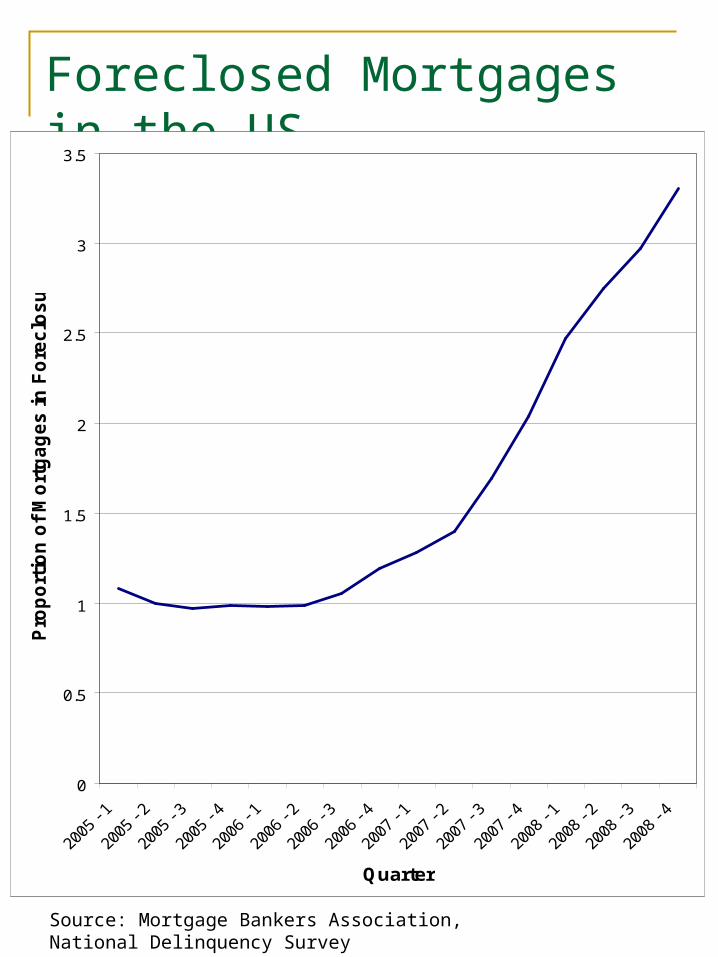
Foreclosed Mortgages in the US
Source: Mortgage Bankers Association, National Delinquency Survey
0
0.5
1
1.5
2
2.5
3
3.5
Quarter
Pro
po
rtio
n o
f M
ort
ga
ge
s i
n F
ore
clo
su
re
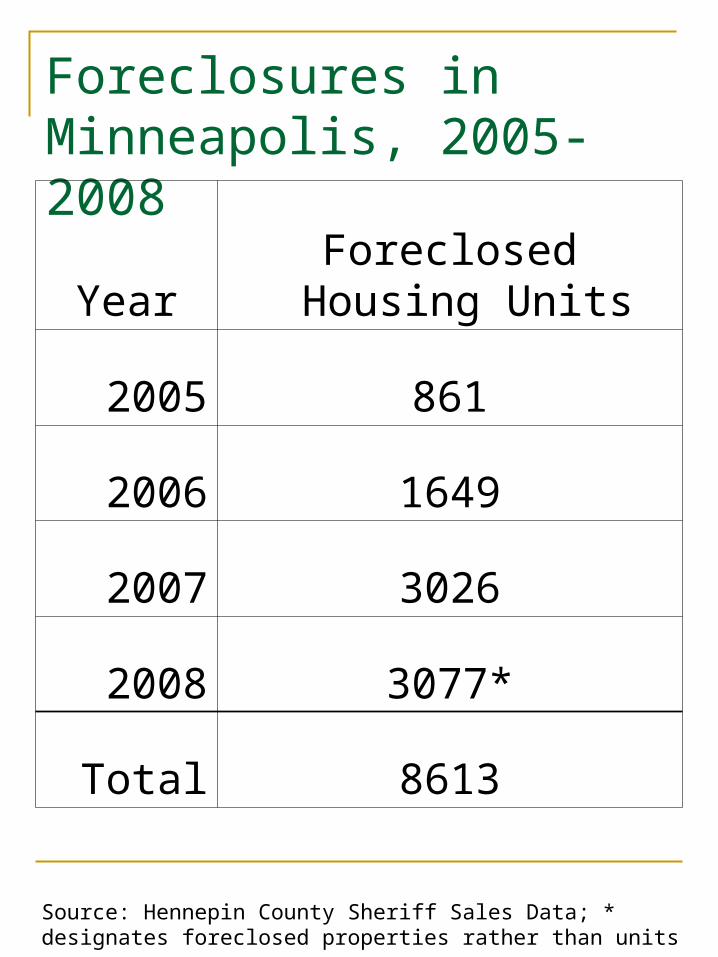
Foreclosures in Minneapolis, 2005-2008
YearForeclosed Housing
Units
2005 861
2006 1649
2007 3026
2008 3077*
Total 8613
Source: Hennepin County Sheriff Sales Data; * designates foreclosed properties rather than units
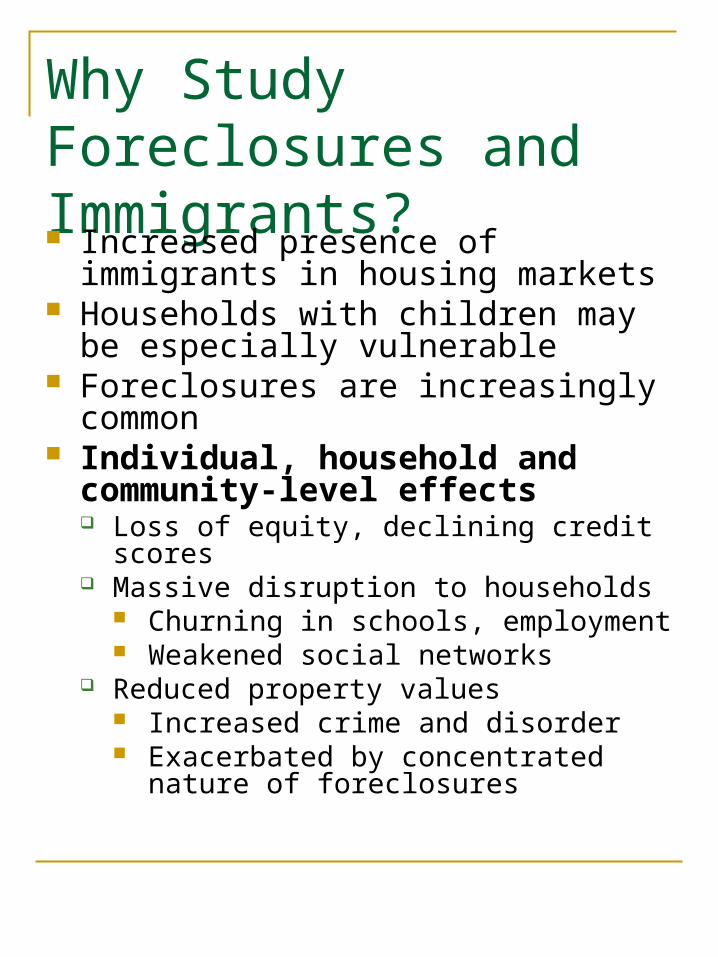
Why Study Foreclosures and Immigrants? Increased presence of immigrants in
housing markets Households with children may be
especially vulnerable Foreclosures are increasingly
common Individual, household and
community-level effects Loss of equity, declining credit scores Massive disruption to households
Churning in schools, employment Weakened social networks
Reduced property values Increased crime and disorder Exacerbated by concentrated nature of
foreclosures
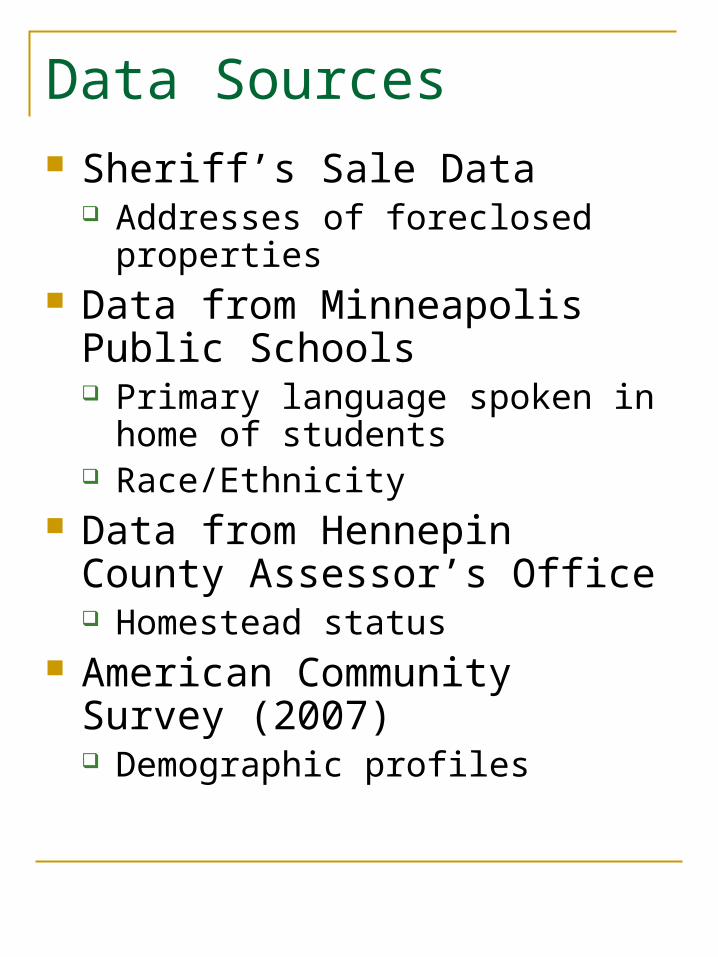
Data Sources Sheriff’s Sale Data
Addresses of foreclosed properties Data from Minneapolis Public
Schools Primary language spoken in home
of students Race/Ethnicity
Data from Hennepin County Assessor’s Office Homestead status
American Community Survey (2007) Demographic profiles
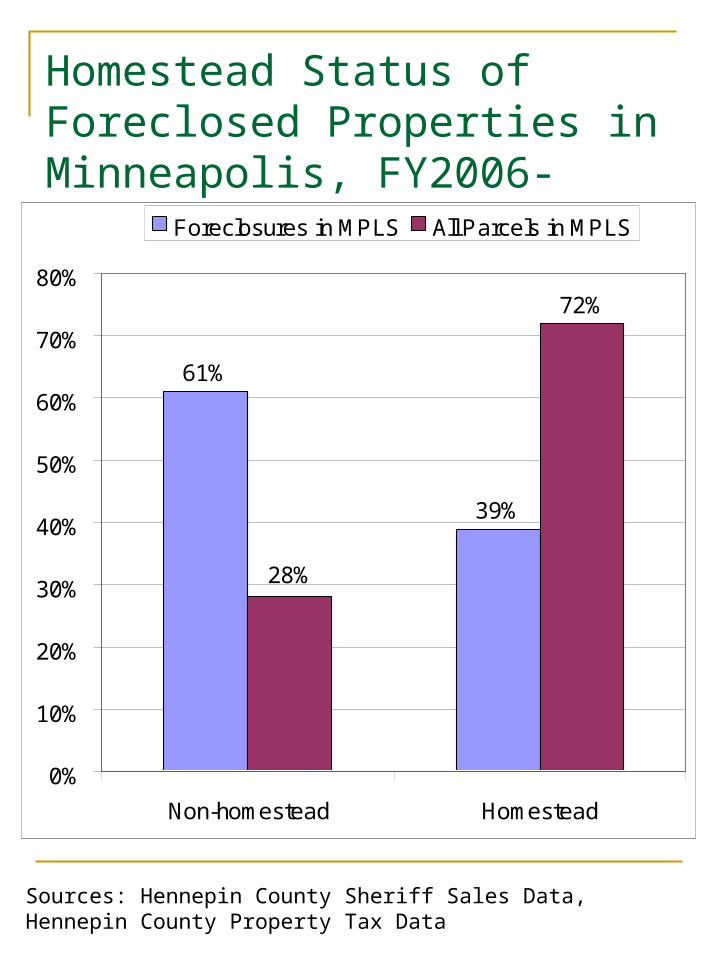
Homestead Status of Foreclosed Properties in Minneapolis, FY2006-FY2007
Sources: Hennepin County Sheriff Sales Data, Hennepin County Property Tax Data
61%
39%
72%
28%
0%
10%
20%
30%
40%
50%
60%
70%
80%
Non-homestead Homestead
Foreclosures in MPLS All Parcels in MPLS
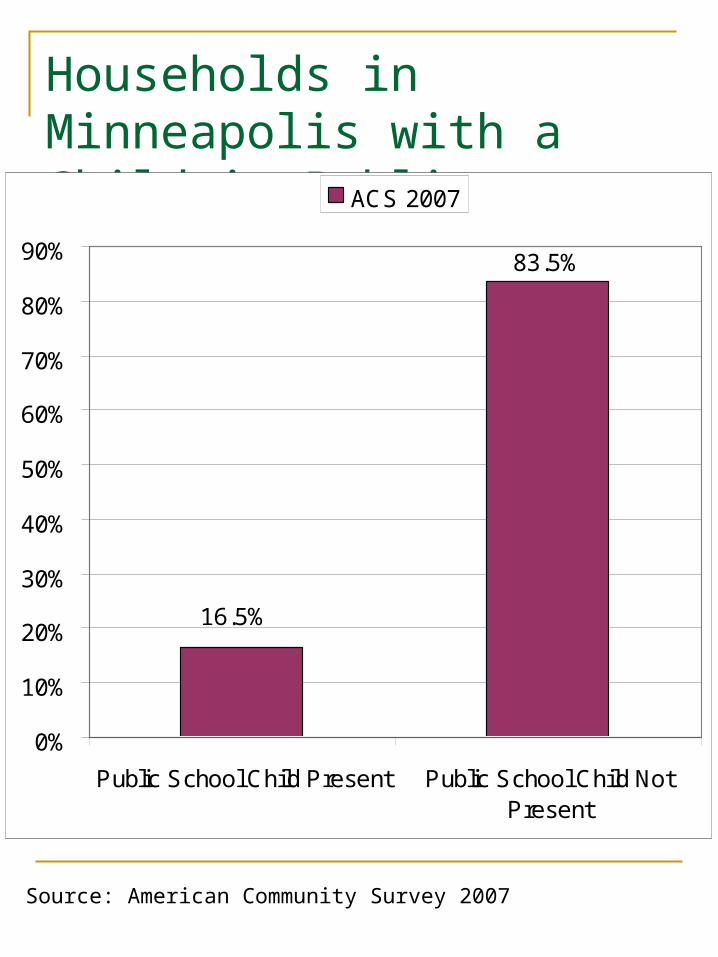
Households in Minneapolis with a Child in Public School, 2007
Source: American Community Survey 2007
83.5%
16.5%
0%
10%
20%
30%
40%
50%
60%
70%
80%
90%
Public School Child Present Public School Child NotPresent
ACS 2007
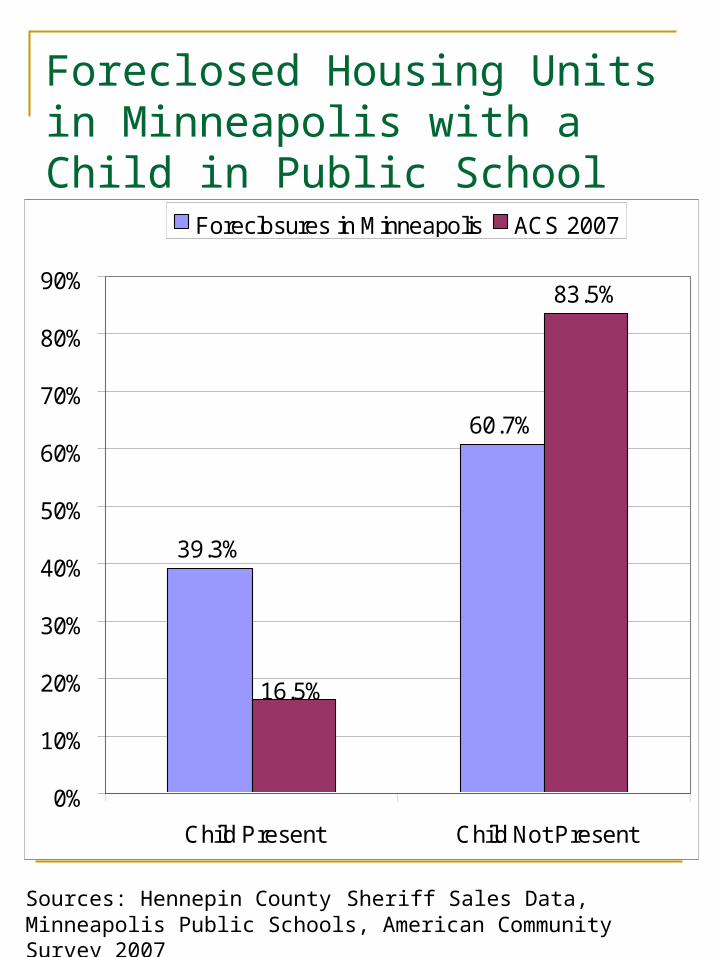
Foreclosed Housing Units in Minneapolis with a Child in Public School Present, FY06-07
39.3%
60.7%
83.5%
16.5%
0%
10%
20%
30%
40%
50%
60%
70%
80%
90%
Child Present Child Not Present
Foreclosures in Minneapolis ACS 2007
Sources: Hennepin County Sheriff Sales Data, Minneapolis Public Schools, American Community Survey 2007
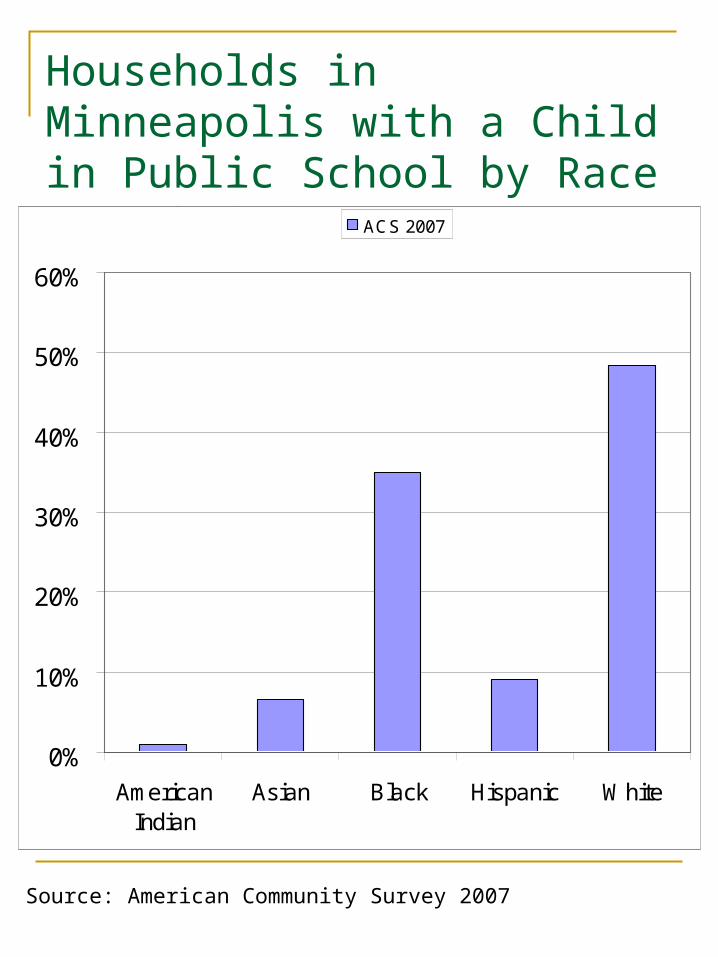
Households in Minneapolis with a Child in Public School by Race or Ethnicity, 2007
Source: American Community Survey 2007
0%
10%
20%
30%
40%
50%
60%
AmericanIndian
Asian Black Hispanic White
ACS 2007
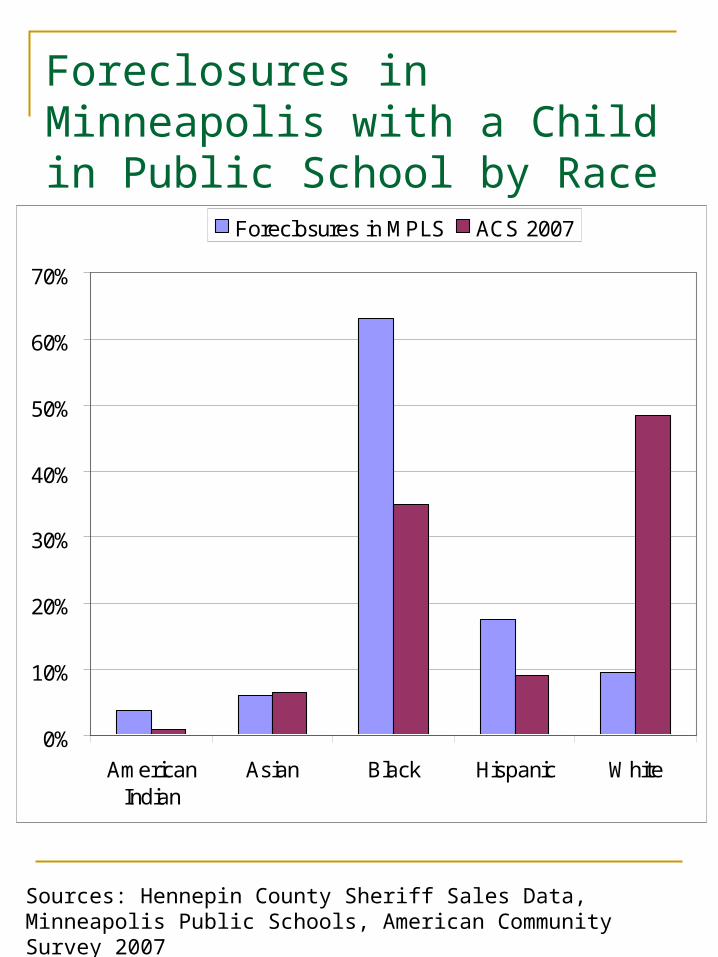
Foreclosures in Minneapolis with a Child in Public School by Race or Ethnicity, FY06-07
0%
10%
20%
30%
40%
50%
60%
70%
AmericanIndian
Asian Black Hispanic White
Foreclosures in MPLS ACS 2007
Sources: Hennepin County Sheriff Sales Data, Minneapolis Public Schools, American Community Survey 2007
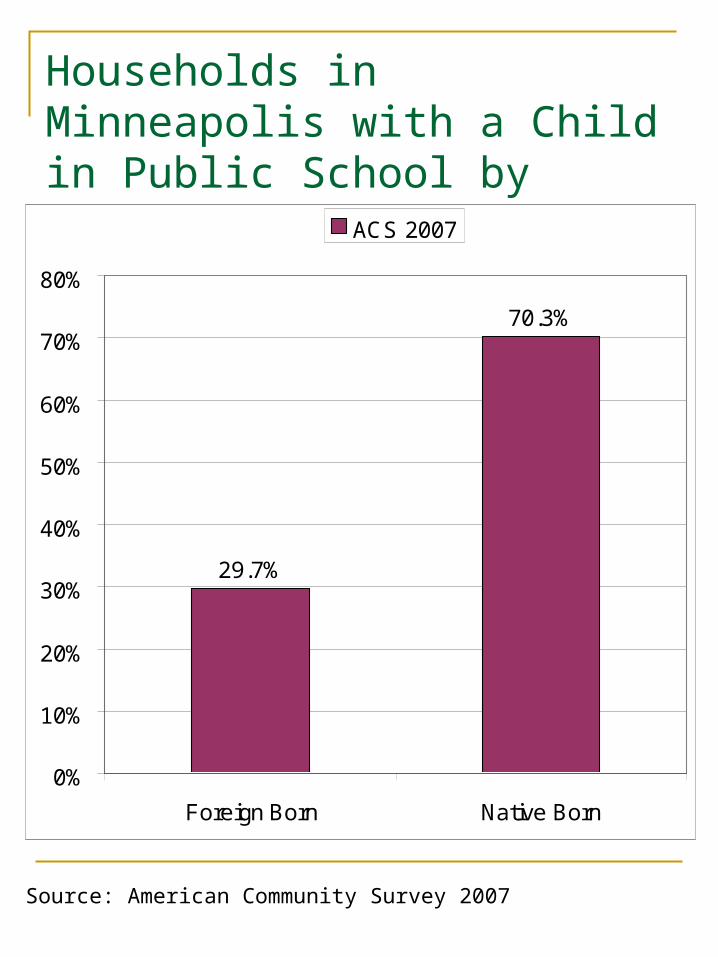
Households in Minneapolis with a Child in Public School by Nativity, 2007
Source: American Community Survey 2007
29.7%
70.3%
0%
10%
20%
30%
40%
50%
60%
70%
80%
Foreign Born Native Born
ACS 2007
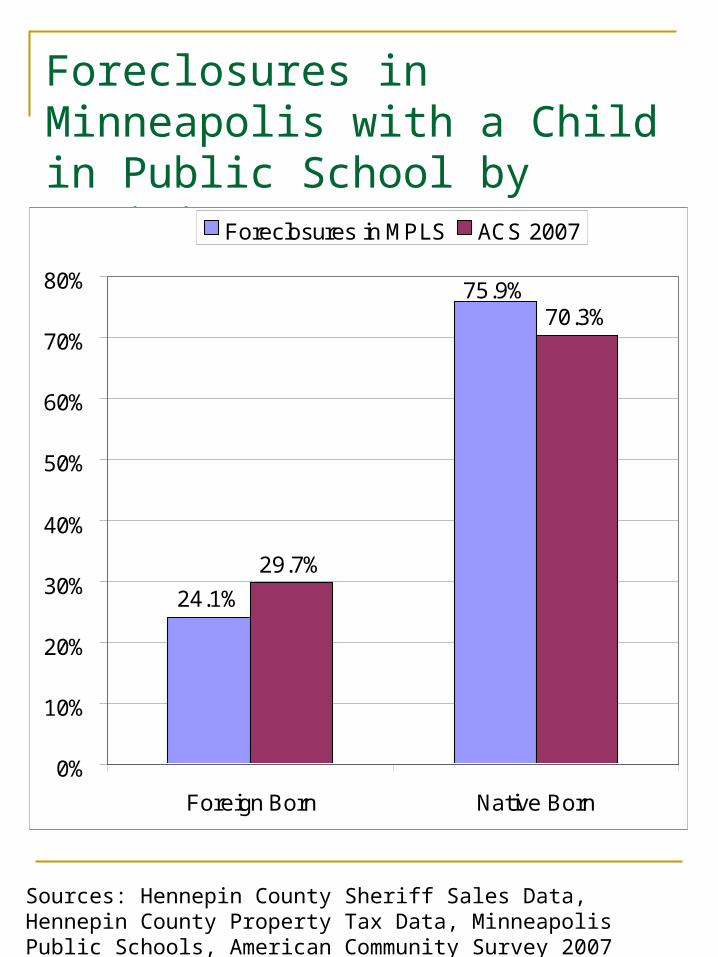
Foreclosures in Minneapolis with a Child in Public School by Nativity, FY06-07
24.1%
29.7%
70.3%75.9%
0%
10%
20%
30%
40%
50%
60%
70%
80%
Foreign Born Native Born
Foreclosures in MPLS ACS 2007
Sources: Hennepin County Sheriff Sales Data, Hennepin County Property Tax Data, Minneapolis Public Schools, American Community Survey 2007
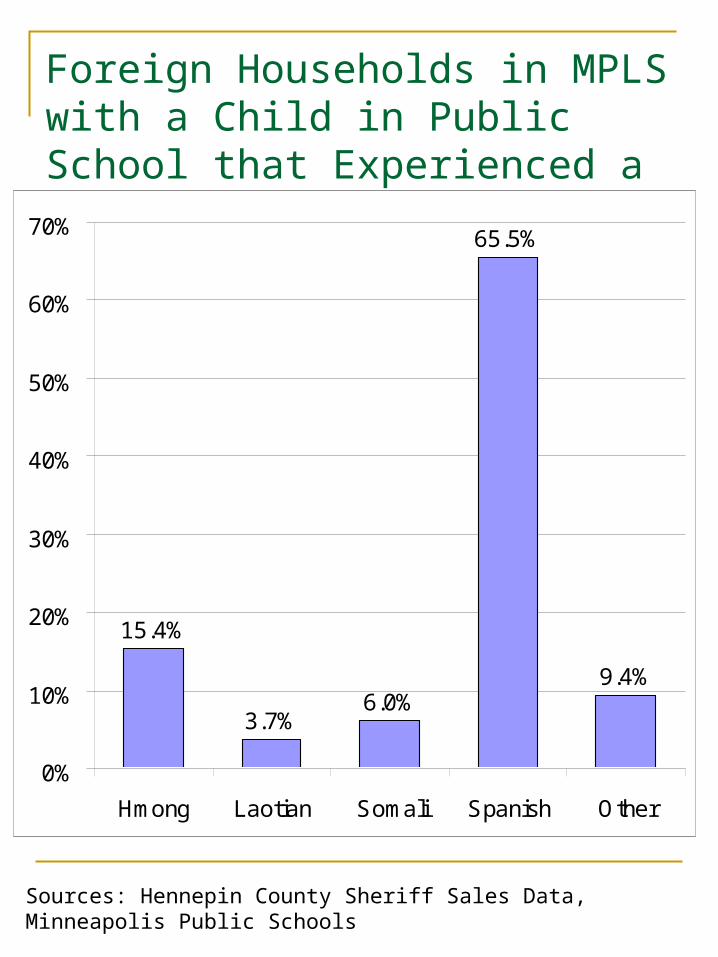
Foreign Households in MPLS with a Child in Public School that Experienced a Foreclosure by Language, FY06-07
15.4%
3.7%6.0%
65.5%
9.4%
0%
10%
20%
30%
40%
50%
60%
70%
Hmong Laotian Somali Spanish Other
Sources: Hennepin County Sheriff Sales Data, Minneapolis Public Schools
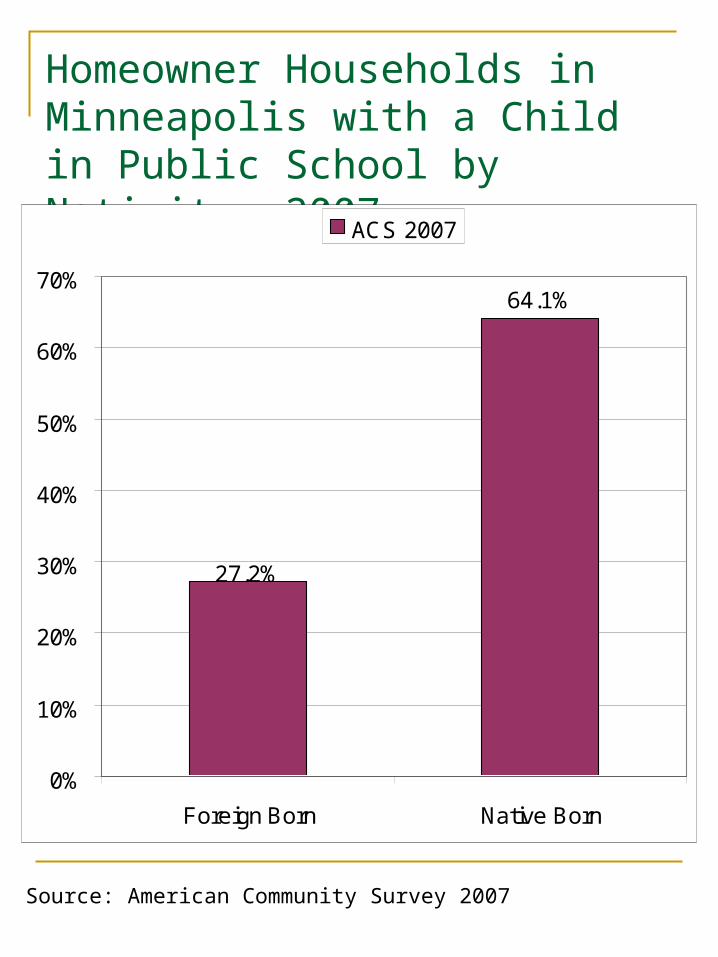
Homeowner Households in Minneapolis with a Child in Public School by Nativity, 2007
Source: American Community Survey 2007
64.1%
27.2%
0%
10%
20%
30%
40%
50%
60%
70%
Foreign Born Native Born
ACS 2007
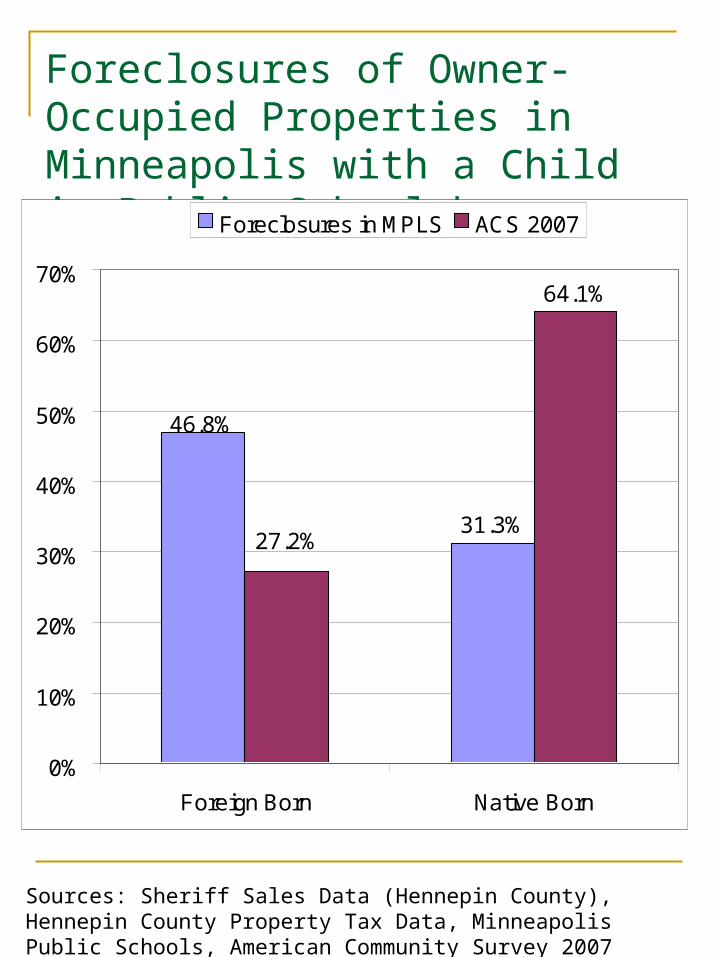
Foreclosures of Owner-Occupied Properties in Minneapolis with a Child in Public School by Nativity, FY06-07
31.3%
64.1%
46.8%
27.2%
0%
10%
20%
30%
40%
50%
60%
70%
Foreign Born Native Born
Foreclosures in MPLS ACS 2007
Sources: Sheriff Sales Data (Hennepin County), Hennepin County Property Tax Data, Minneapolis Public Schools, American Community Survey 2007
How Does Predatory Lending Occur?
Forceful, direct marketing (supply side) Sophisticated demographic and
geographic analyses Recruitment from within the
community (“cultural broker”)
Social networks (demand side) Expectations and the role of history Trust of institutions vs. trust of
individuals
Policy Implications
Reorient focus of foreclosure prevention programs Focus on supply side and the
demand side Rebuilding trust Linguistically appropriate?
Moratorium on foreclosures? Evidence of disproportionate
impact Freddie and Fannie Political will?