the state of aging and health in america 2004 · about this series of reports: the state of aging...
TRANSCRIPT

The State of Aging and Health
in America2004
www.cdc.gov/agingwww.miahonline.org

About this Series of Reports:
The State of Aging and Health in America 2004 is the third annual volume in a series that presents a snapshot of the entire health and aging landscape in the United States or anotherarea of the world. The reports are produced by the Merck Institute of Aging & Health(MIAH) and various partnership organizations that are recognized leaders in the aging field.Previous partners include the Gerontological Society of America and the Pan AmericanHealth Organization.
These reports are the signature publication of MIAH, and they present the most currentinformation and statistics, often commissioned specifically for the report, on the health ofolder adults.
MIAH is a non-profit organization, funded by the Merck Company Foundation, and locatedin Washington, DC. The organization is dedicated to improving the health and independence ofolder adults around the world through information and education. It is especially concernedwith the education of primary care physicians in geriatrics. The Institute currently funds projectsin the United States, Europe and Latin America.

Executive Summary
I
"As the nation's health protection agency, CDC strives to help older adults come to realize thatpoor health or disabilities are not inevitable consequences of aging. The State of Aging and Healthin America 2004 is an important tool for all professionals striving to ensure that older adultsachieve their full life expectancy."
— Julie Louise Gerberding, MD, MPH, Director, Centers for Disease Control and Prevention
“In the United States, 20% of all Americans, or about 70 million people, will have passed their 65th birthday by 2030. The demographic tidal wave is coming. Aging in the 21st century, however,is more than just a matter of numbers. The average 75-year-old has three chronic conditions and uses five prescription drugs. Older adults also have unique challenges and differentmedical needs than younger adults. Consequently, it is not enough to be aware of the demo-graphic imperative; we must also be prepared for it. That is exactly what this publication isdesigned to help us do. This report presents information and recommendations on what policymakers, practicing physicians and patients can and must do to ensure not just longer lives butbetter lives for Americans. It presents specific calls to action to help promote good health, preventchronic disease and postpone disability for older adults. Most of all, this report forces us to realizethat we must face our demographic challenge with sustained attention and significant action.”
— Patricia P. Barry, MD, MPH, Executive Director, Merck Institute of Aging & Health
“The mission of the Gerontological Society of America is to bring together research, education andpractice to improve the quality of life as we age. That very same idea echoes throughout The Stateof Aging and Health in America 2004. This report shows that if we, as a nation, are to help olderadults not simply survive, but thrive, we must increase research, intensify education and improve prac-tice in geriatrics. This report will also fill a unique niche on any bookshelf, in that it is simultaneously reference book, Blueprint and roadmap. In terms of transforming the promise of active aging intoreality for all Americans, this publication points out where we are, where we must go and, throughits thoughtful calls to action, how to get there. Perhaps, above all, this report provides further hopethat Browning was correct when he wrote, ‘Come grow old with me, the best is yet to be.’ TheGerontological Society of America is proud to be a part of this year’s publication.”
— Terrie Fox Wetle, PhD, President, Gerontological Society of America
II
The Merck Institute of Aging & Health (MIAH), theCenters for Disease Control and Prevention (CDC) andthe Gerontological Society of America (GSA) are releasingthis report to assess the health status of the growingnumber of older Americans and to make recommendationsto improve the mental and physical health of all Americansin their later years.
This report is divided into six sections. Two sectionsoffer report cards—one at the national level and one forindividual states and the District of Columbia—that showwhether older Americans are meeting specific health targets set in Healthy People 2000. The other four sectionsexamine issues that are critical to improving our ability tomeet these targets. The following is a brief description ofeach of the report’s six main sections:
An Introduction to the Health of Older Americans More Americans are living longer, and the proportion ofthe U.S. population that is age 65 or older is growing rapidly. Life expectancy increased dramatically duringthe past century, from 47 years for Americans born in1900 to 77 years for those born in 2001. These same factors—improved medical care and prevention efforts—that are partly responsible for the dramatic increases in lifeexpectancy have also produced a major shift in the leadingcauses of death in the United States in the past century,from infectious diseases and acute illnesses to chronic diseases and degenerative illnesses.
The tragedy of the leading chronic disease killers is thatthey are often preventable. Although the risk of disease anddisability clearly increases with age, poor health is not aninevitable consequence of aging. Adopting healthierbehaviors—regular physical activity, a healthy diet and a smoke-free lifestyle—and getting regular screenings(mammograms and colonoscopies, for example) can dramatically reduce a person’s risk for many chronic dis-eases, including the leading causes of death and disability.
The National Report Card on Healthy AgingThe national report card presents data on 15 indicatorsrelated to older adult health status, health behaviors, preventive care and screening, and injuries. These indicators were chosen because they are each modifiableand present a comprehensive picture of older adult health:• Physically unhealthy days
• Frequent mental distress
• Oral health: Complete tooth loss
• Disability
• No leisure-time physical activity
• Eating five or more fruits and vegetables daily
• Obesity
• Current smoking
• Flu vaccine in past year
• Pneumonia vaccine
• Mammogram within past two years
• Ever had a sigmoidoscopy or colonoscopy
• Up-to-date on select preventive services
• Cholesterol screening
• Hip fracture hospitalizations
The national report card shows the most current datafor each indicator and assigns a grade of “pass” or “fail”based on Healthy People 2000 targets.
The State-by-State Report Card on Healthy AgingThe report card for the 50 states and the District ofColumbia presents, for each indicator, the best- and worst-ranked states and the number of states that met eachtarget. The report card shows mixed progress since TheState of Aging and Health in America 2002 report wasreleased and considerable variation among the states inmeeting the targets.
Spotlight: Physical Activity and Older AmericansRegular physical activity is a critical element of an overallhealthy lifestyle, which can extend years of independentliving, reduce disability and improve the quality of life ofolder people. However, our knowledge of the benefits ofphysical activity for older adults has not yet been fullyturned into action. The challenge, and the opportunity, isto make physical activity more accessible to older adults ofall ages, abilities and interests.
Our Nation’s Health Care Workforce: Is it Ready for the Graying of America?Beginning in 2012, nearly 10,000 Americans will turn 65every day, and by 2030 20% of the population will havepassed their 65th birthday. The aging of America, however,is more than a matter of numbers. The average 75 yearold has three chronic conditions and uses five differentprescription drugs; older patients also have unique healthcare challenges and different medical needs than youngeradults. Unfortunately, America’s health care workforcelacks the training to provide appropriate care at the present time, and it is wholly unprepared for the comingsenior boom. There are far too few health care providersspecifically trained in geriatrics; moreover, there is a gapbetween what many primary care providers know, andwhat they need to know, to optimally treat older patients.
III
Addressing this problem requires immediate attention andaction at the national level and calls for:• Increasing the funding for geriatric training
• Quickly incorporating new research into practice
• Adopting new practices to achieve change
• Enlisting the support of professional organizations toaffect change
• Recruiting new people into geriatrics
• Enhancing the skills of community practitioners
• Developing interest in geriatrics across clinical disciplines
• Increasing geriatric education in health care at all levels
State ExamplesAcross the United States, states are engaged in innovativeefforts to improve the health and quality of life of olderAmericans. Four examples of these efforts are included inthis report: Kansas, Maine, North Carolina, andWashington.
Goals for Improving the Health of Older Americans:• To achieve the national goals for reducing health risk
behaviors
• To increase opportunities for all older Americans to reapthe benefits of regular physical activity
• To encourage states and communities to adopt innovativemethods to promote healthy aging among the adultsthey serve
To assist in meeting these goals, MIAH, CDC andGSA have included Calls to Action on the following topicsrelated to older adult health:
• Monitoring recent physical health
• Addressing frequent mental distress
• Improving oral health
• Promoting healthy behaviors
• Increasing the use of clinical preventive services
• Implementing a national falls prevention plan
• Increasing physical activity among older adults
• Preparing our health care workforce for an agingsociety


V
An Introduction to the Health of Older Americans 01
The National Report Card on Healthy Aging 07
The State-by-State Report Card on Healthy Aging 17
Spotlight: Physical Activity and Older Americans 21
Our Nation’s Health Care Workforce: Is it Ready for the Graying of America? 27
State Examples 31
Appendix 35
Table of Contents

The dramatic gain in life expectancy in the 20th centurywas, in large measure, due to improved sanitation, bettermedical care and increased use of preventive health services. A key challenge for the 21st century will be toensure that these added years are quality years.
Chronic Diseases Are Now theLeading Causes of DeathThe same factors—improved medical care and preventionefforts—that are largely responsible for the dramaticincreases in life expectancy have also produced a majorshift in the leading causes of death in the United Statesin the past century, from infectious diseases and acute illnesses to chronic diseases and degenerative illnesses.2
In 1900, the leading killers of all age groups in theUnited States were pneumonia and influenza, tuberculosis,and gastritis and enteritis.3 In 2000, the top three causesof death for all ages were heart disease (30% of alldeaths), cancer (23%) and stroke (7%).4 These same
three chronic diseases were also the leading causes ofdeath among Americans age 65 and older in 2000,accounting for 60% of all deaths in this age group(Figure 2).4
The tragedy of these leading killers is that they areoften preventable. Although the risk of disease and disability clearly increases with advancing age, poorhealth is not an inevitable consequence of aging. Threebehaviors—smoking, poor diet and physical inactivity—were the actual causes of almost 35% of U.S. deaths in2000.5 These behaviors often underlie the developmentof the nation’s leading chronic disease killers: heart disease, cancer, stroke and diabetes. Adopting healthierbehaviors—regular physical activity, a healthy diet and asmoke-free lifestyle—and getting regular screenings(mammograms and colonoscopies, for example) can dramatically reduce a person’s risk for most chronic diseases, including the leading causes of death.6
01
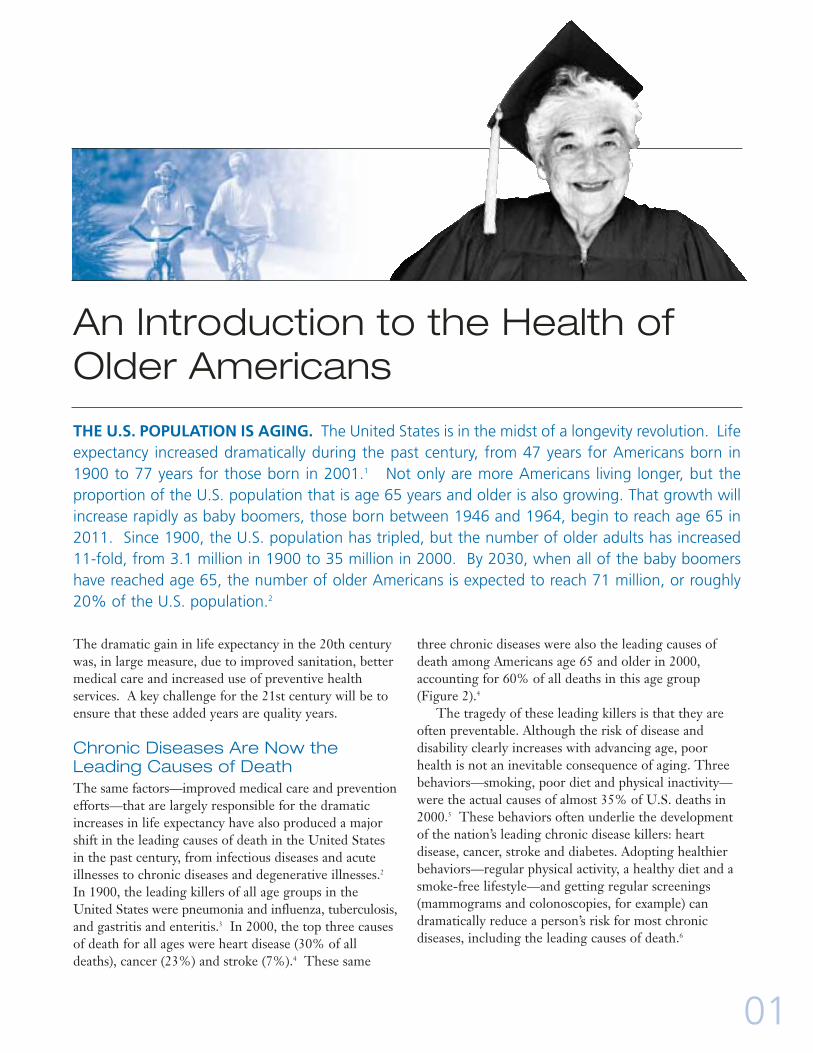
THE U.S. POPULATION IS AGING. The United States is in the midst of a longevity revolution. Lifeexpectancy increased dramatically during the past century, from 47 years for Americans born in1900 to 77 years for those born in 2001.1 Not only are more Americans living longer, but the proportion of the U.S. population that is age 65 years and older is also growing. That growth willincrease rapidly as baby boomers, those born between 1946 and 1964, begin to reach age 65 in2011. Since 1900, the U.S. population has tripled, but the number of older adults has increased11-fold, from 3.1 million in 1900 to 35 million in 2000. By 2030, when all of the baby boomershave reached age 65, the number of older Americans is expected to reach 71 million, or roughly20% of the U.S. population.2
An Introduction to the Health ofOlder Americans

Chronic Diseases Cause Pain andDisability and Increase Health CareCostsDeaths are only part of the picture of the burden of chronic diseases among older Americans. These conditions can cause years of pain, disability, and loss of function and independence before resulting in death.Currently, at least 80% of older Americans are living withat least one chronic condition, and 50% have at leasttwo.2 Diabetes, for example, with its deadly and debilitat-ing complications, affects approximately one in fiveAmericans age 65 and older, and the aging of the U.S.population, in conjunction with the obesity epidemic, willonly intensify its impact. The number of adults age 75and older with diabetes is projected to increase fromabout 1 million in 2000 to more than 4 million in 2050.2
In addition to the hardships that chronic diseasesimpose on individuals and their families, these diseasesare a major contributor to health care costs. Over two-thirds of current health care costs are for treating chronic illnesses; among older Americans, almost 95% of health care expenditure is for chronic diseases.7
Alzheimer’s disease alone, for example, costs the nationmore than $50 billion each year in Medicare andMedicaid expenditures. As the population ages and thisdevastating disease becomes more prevalent, these costsare projected to rise by as much as 54% by 2010.8
02
f.2IN 2001, CHRONIC DISEASES WERE THELEADING CAUSES OF DEATH AMONGU.S. ADULTS AGE 65 AND OVER
Heart Disease
Cancer
Stroke
Chronic LowerRespiratory
Diseases
Influenza &Pneumonia
0% 5% 10%
15%
20%
25%
Percent of all deaths
Source: CDC, National Center for Health Statistics, National Vital StatisticsReport, 2002
Diabetes
Alzheimer’sDisease
All Other Causes
30%
35%
22.8%
3.0%
3.0%
3.1%
5.9%
8.0%
21.7%
32.4%
f.1
2000 2015
2025
THE PERCENTAGE OF THE U.S. POPULATION AGE 65 AND OVER WILL DRAMATICALLY INCREASE IN THE NEXT 20 YEARS
Source: US Bureau of the Census, 2003
5%-9.9%
15%-19.9%
10%-14.9%
20%-30%

The burden of many chronic diseases and conditions—especially hypertension, diabetes and cancer—varieswidely by race and ethnicity. For example, among adultsage 65 and older in 2000–2001, 65% of Blacks had hyper-tension, compared with 49% of Hispanic Americans and47% of Whites.9 Twenty-five percent of Hispanic
Americans and 23% of Blacks had diabetes, comparedwith 14% of Whites.9 Twenty-two percent of Whites hadsome form of cancer, compared with 10% of HispanicAmericans and Blacks.9
Chronic Diseases Diminish Quality ofLife for Older AdultsAmong older adults, chronic diseases and their relatedactivity limitations are a major health problem, and theseconditions often reduce seniors’ health-related quality oflife. The percentage of older adults who report verygood or excellent health decreases with age. Data fromthe 2001 National Health Interview Survey (NHIS) indicated that 43% of men and women aged 65 years and older reported very good or excellent health, compared with 34% of those age 75–84 and only 28% of those 85 or older.10
The same NHIS data showed that the percentage ofolder adults who reported very good or excellent healthvaried by race. Among adults aged 65 years and older, forexample, 40% of Whites but only 25% of Blacks reportedvery good or excellent health (Figure 4).
The Challenges of Preserving theHealth of an Aging SocietyThe increase in lifespan and the growing burden ofchronic diseases among older Americans have createdseveral new challenges. Chief among these are healthcare costs, an increase in the number of Americans whoserve as caregivers to family members, the complexitiesof managing multiple medications, and greater long termcare needs. Meeting these challenges is critical to ensuringthat the years that Americans can look forward to are alsoquality years.
Health Care Costs
The increasing number of Americans age 65 or older hasthe potential to greatly increase the nation’s already highhealth care costs: • The cost of providing health care for one person age
65 or older is three to five times greater than the costfor someone younger than 65.2
• By 2030, health care spending will increase by 25%simply because the population will be older, and this isbefore inflation or new technologies are taken intoaccount.11
• Medicare spending has grown more than seven-fold inthe past two decades, from $33.9 billion in 1980 to$252.2 billion in 2002, and is projected to double againby 2012.12
03
f.3PREVALENCE OF SELECTED CHRONICCONDITIONS AMONG ADULTS AGE 65AND OVER, 2000-2001
Stroke
Diabetes
Any Cancer
0% 10%
20%
30%
40%
50%
*A respondent was considered to have “arthritic symptoms” if s/he answered “yes”to the following questions: “During the past 12 months, have you had pain, aching,stiffness, or swelling in or around a joint?” and “Were these symptoms present onmost days for at least one month?”
Source: CDC, National Center for Health Statistics, National Health InterviewSurvey, 2000-2001
Coronary HeartDisease
Arthritic Symptoms*
Hypertension
60%
49.2%
35.9%
20.4%
19.9%
15.2%
8.6%
0
f.4SELF-REPORTED HEALTH STATUS FOR ADULTS AGE 65 AND OVER VARIES BY RACE
All races
Source: CDC, National Center for Health Statistics, National Health InterviewSurvey, 2001
Fair/Poor
Excellent/Very Good
Good
10%
20%
30%
40%
50%
60%
70%
80%
90%
100%
White Black
26.6%
35.3%
38.1%
24.9%
35.6%
39.5%
41.3%
33.4%
25.2%

Caregiving
Nearly 79% of people who need long-term care live at home or in community settings rather than in institutions. In 1997, about 22 million U.S. households(roughly one in every four households) were involved incaring for someone age 50 or older, and this number isexpected to rise to 39 million households by 2007.13
Fifty-nine percent of the adult U.S. population eitheris or expects to be a family caregiver. The value of theservices that family caregivers provide for “free” is estimated to be $257 billion a year.13 Although caregivinghas its rewards, which usually include increased satisfactionwith the level of care that the loved one is receiving, providing these services creates additional health andsocial burdens:
• Of those who provide at least 21 hours of care a weekfor a family member or friend, 61% have sufferedfrom depression.14
• Older caregivers who have a history of chronic illnessthemselves and caregiving-related stress have a 63%higher death rate than their peers who are not care-givers.14
• American businesses lose between $11 billion and $29billion each year as a result of employees caring forfamily members age 50 and older.14
Medications Management
Especially when combined with a healthy lifestyle, medications can lessen the burden of illness and disabilityon individuals, their families and society. When appropriately prescribed, administered and monitored,medications are a cost-effective way to help older adultsmaintain health, recover from illness or control symptoms of chronic disease.
Despite these potential benefits, medication for olderadults poses several serious challenges, including the following:
• People age 65 and older make up 13% of the U.S.population, yet they account for 34% of all prescriptionmedications and 30% of all nonprescription medications.Because older adults often take numerous medications
prescribed by multiple providers, their risk for adversereactions to a medication or combination of medica-tions is greater than that of younger, healthier adults.15
• Among older adults, adverse reactions such as dizziness,numbness, dehydration, loss of appetite, nausea anddiarrhea can have more dramatic consequences thanamong younger adults. These consequences caninclude falls, depression, confusion, hallucinations, and malnutrition.15
• Because the aging process affects how an older person’sbody absorbs, uses and eliminates medications, olderpeople are at risk of being given medications ordosages that are inappropriate for their age.15
• Memory impairment and sensory changes such asvision loss that often occur among older adults cancreate additional challenges for correctly adhering tocomplex medication regimens.15
Long Term Care
Perhaps the greatest challenges for both families and oursociety are those associated with long term care needs.
In 1997, more than 1.4 million older Americans, or4% of the older population, were in nursing homes. Thelikelihood of being in a nursing home increases as peopleget older: in 1997, 13% of the nursing home populationwas age 65–74, 33% was age 75-84, and 46% was age 85or older.13
The costs of long term care are expected to continueincreasing as the population ages. However, publichealth programs that decrease disability among olderAmericans and help them maintain their independenceoffer opportunities to lessen these increases.
Twentieth-century advances in our knowledge of thecritical factors in protecting and promoting health havegiven us many opportunities for overcoming these challenges. The health indicators presented in the following chapters point the way to these opportunities.By working to meet the goals for each of these key indicators, our nation can help ensure that all of its citizens can look forward not just to living long, but toliving well.
04

05
REFERENCES
1. National Center for Health Statistics. Health, United States, 2003. Hyattsville, MD: U.S. Department of Health and Human Services,Centers for Disease Control and Prevention; 2003.
2. Centers for Disease Control and Prevention. Public health and aging: trends in aging—United States and worldwide. MMWR2003;52(06):101-106.
3. Centers for Disease Control and Prevention. Unrealized Prevention Opportunities: Reducing the Health and Economic Burden ofChronic Disease. Atlanta: U.S. Department of Health and Human Services; 2000.
4. National Center for Health Statistics. Mortality Report. Hyattsville, MD: U.S. Department of Health and Human Services; 2002. 5. Mokdad AH, Marks JS, Stroup DF, Gerberding JL. Actual causes of death in the United States, 2000. JAMA 2004;291(10):1238-1245.6. Blackman DK, Kamimoto LA, Smith SM. Overview: surveillance for selected public health indicators affecting older adults—United
States. MMWR 1999;48(SS8):1-6. 7. Hoffman C, Rice D, Sung HY. Persons with chronic conditions: their prevalence and costs. JAMA 1996;276(18):1473-1479.8. Alzheimer’s Association. Medicare and Medicaid costs for people with Alzheimer’s disease. April 3, 2001. Available at
http://www.alz.org/Media/newsreleases/alzreport.pdf (accessed April 30, 2004).9. National Center for Health Statistics. Prevalence of selected chronic conditions by age, sex, race, and Hispanic origin: United States,
1997-2001. (Table) Available at http://209.217.72.34/aging/eng/TableViewer/Wdsview/ dispviewp.asp?ReportId=144 (accessed April 30,2004).
10. National Center for Health Statistics. Respondent-assessed health by age, sex, and race: United States, 1982-2001. NHIS (NHIH01d-c)(Table). Available at http://209.217.72.34/aging/eng/TableViewer/Wdsview/dispviewp.asp?ReportId=8 (accessed May 4, 2004).
11. Agency for Healthcare Research and Quality, Centers for Disease Control and Prevention. Physical Activity and Older Americans:Benefits and Strategies. June 2002. Available at http://www.ahrq.gov/ppip/activity.htm (accessed June 22, 2004).
12. Medicare Payment Advisory Commission. A Data Book: Healthcare Spending and the Medicare Program. June 2003. Section 5:National health care and Medicare spending. Available at http://www.medpac.gov/ (accessed May 5, 2004).
13. Family Caregiver Alliance. Fact sheet: selected long term care statistics. Available athttp://www.caregiver.org/caregiver/jsp/content_node.jsp?nodeid=440 (accessed May 5, 2004).
14. National Family Caregivers Association. Fact sheet: family caregiving statistics. Available at http://www.nfcacares.org (accessed May5, 2004).
15. American Society on Aging. Live Well, Live Long: Health Promotion and Disease Prevention for Older Adults. Optimal medicationsuse module. Available at http://www.americansocietyonaging.org/cdc/module3/phase1 (accessed June 22, 2004).

07
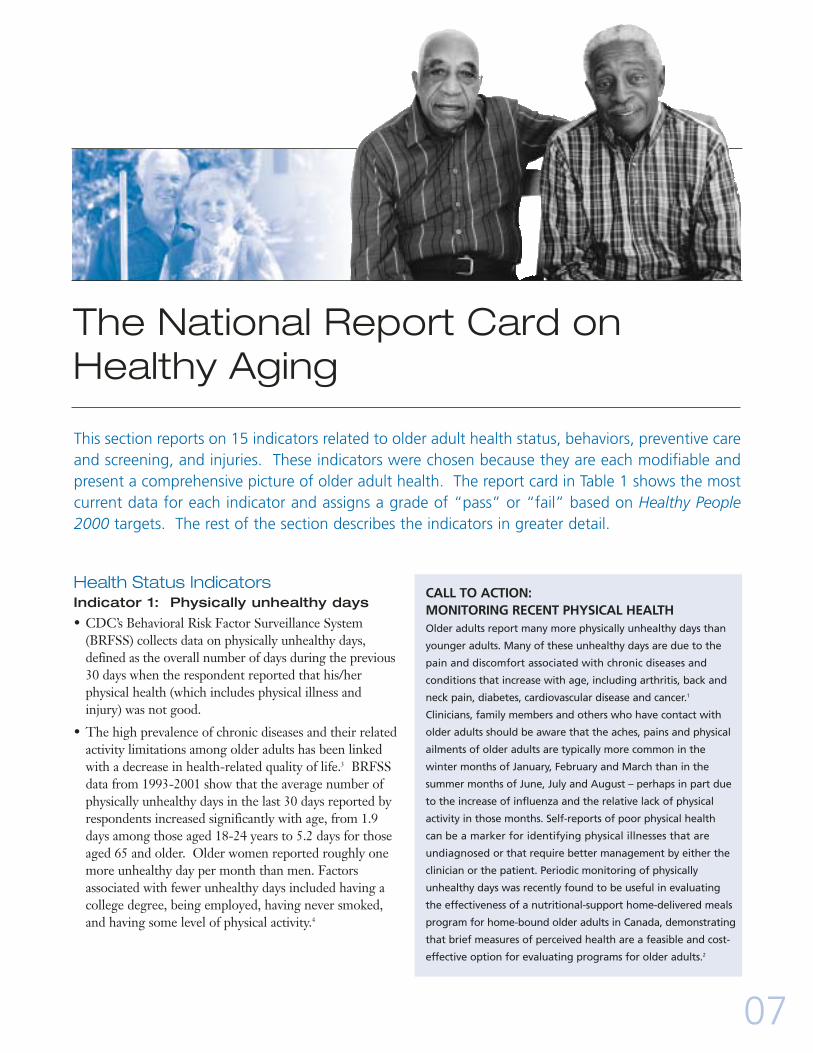
This section reports on 15 indicators related to older adult health status, behaviors, preventive careand screening, and injuries. These indicators were chosen because they are each modifiable andpresent a comprehensive picture of older adult health. The report card in Table 1 shows the mostcurrent data for each indicator and assigns a grade of “pass” or “fail” based on Healthy People2000 targets. The rest of the section describes the indicators in greater detail.
The National Report Card onHealthy Aging
Health Status IndicatorsIndicator 1: Physically unhealthy days
• CDC’s Behavioral Risk Factor Surveillance System(BRFSS) collects data on physically unhealthy days,defined as the overall number of days during the previous30 days when the respondent reported that his/her physical health (which includes physical illness andinjury) was not good.
• The high prevalence of chronic diseases and their relatedactivity limitations among older adults has been linkedwith a decrease in health-related quality of life.3 BRFSSdata from 1993-2001 show that the average number ofphysically unhealthy days in the last 30 days reported byrespondents increased significantly with age, from 1.9days among those aged 18-24 years to 5.2 days for thoseaged 65 and older. Older women reported roughly onemore unhealthy day per month than men. Factors associated with fewer unhealthy days included having acollege degree, being employed, having never smoked,and having some level of physical activity.4
CALL TO ACTION: MONITORING RECENT PHYSICAL HEALTHOlder adults report many more physically unhealthy days than
younger adults. Many of these unhealthy days are due to the
pain and discomfort associated with chronic diseases and
conditions that increase with age, including arthritis, back and
neck pain, diabetes, cardiovascular disease and cancer.1
Clinicians, family members and others who have contact with
older adults should be aware that the aches, pains and physical
ailments of older adults are typically more common in the
winter months of January, February and March than in the
summer months of June, July and August – perhaps in part due
to the increase of influenza and the relative lack of physical
activity in those months. Self-reports of poor physical health
can be a marker for identifying physical illnesses that are
undiagnosed or that require better management by either the
clinician or the patient. Periodic monitoring of physically
unhealthy days was recently found to be useful in evaluating
the effectiveness of a nutritional-support home-delivered meals
program for home-bound older adults in Canada, demonstrating
that brief measures of perceived health are a feasible and cost-
effective option for evaluating programs for older adults.2

08
TABLE 1. THE NATIONAL REPORT CARD ON HEALTHY AGING: HOW HEALTHY ARE AMERICA’S SENIORS?
* Data for Indicators 1-14 were collected by CDC’s Behavioral Risk Factor Surveillance System (BRFSS). Data for Indicator 15, hip fracture hospitalizations, come from CDC’s National Center for Health Statistics, National Hospital Discharge Survey. See Appendix for a full description of these data sources.
† Grade is based on the attainment of Healthy People 2000 targets. See Appendix for a full description of Healthy People 2000 and Healthy People 2010 targets.‡ Indicators 1, 2, 4, and 13 are more recently developed measures and, as such, do not have Healthy People 2000 targets. Data related to Indicator 7, obesity, were combined with the over
weight category in Healthy People 2000 and, therefore, obesity has no individual Healthy People 2000 target.ç Frequent mental distress is defined as having had 14 or more mentally unhealthy days in the previous month. Data from the 2000 and 2001 BRFSS are combined here to get a
sufficient sample size. ƒ Disability was defined on the basis of an affirmative response to either of the following two questions on the 2001 BRFSS: “Are you limited in any way in any activities because of physical, mental
or emotional problems?” or “Do you now have any health problem that requires you to use special equipment, such as a cane, wheelchair, a special bed, or a special telephone?”¶ Healthy People 2010 segments the nutrition target into multiple categories of fruits and vegetables. See Appendix for a full description of this change.# Healthy People 2000 defined a target for overweight, but not obesity. Because current standards separate these two conditions, obesity data are included in this report. The Healthy
People 2010 definition of obesity is a body mass index (BMI) of >30 kg/m2.** For men, three services are included: flu vaccine in past year, ever had a pneumonia vaccine, and ever had sigmoidoscopy or colonoscopy. For women, these same three services plus a
mammogram within past two years are included.†† Healthy People 2010 has separate hip fracture hospitalization targets for men and women, and no target for the total number.
Data for Persons Age 65 or Older* Healthy People Grade Healthy PeopleIndicator (Data Year) 2000 Target (pass/fail)† 2010 Target
Health Status
1. Physically unhealthy days (mean 5.5 (2001) ‡ ‡ ‡number of days in past month)
2. Frequent mental distress (%)ç 6.3 (2000-2001) ‡ ‡ ‡
3. Oral health: Complete 22.4 (2002) 20 Fail 20tooth loss (%)
4. Disability (%)ƒ 30.8 (2001) ‡ ‡ ‡
Health Behaviors
5. No leisure time physical activity 32.9 (2002) 22 Fail 20in past month (%)
6. Eating 5+ fruits and vegetables 32.4 (2002) 50 Fail N/A¶daily (%)
7. Obesity (%)# 19.5 (2002) ‡ ‡ 15
8. Current smoking (%) 10.1 (2002) 15 Pass 12
Preventive Care & Screening
9. Flu vaccine in past year (%) 68.6 (2002) 60 Pass 9010. Ever had pneumonia 63.0 (2002) 60 Pass 90
vaccine (%)
11. Mammogram within past 77.2 (2002) 60 Pass 702 years (%)
12. Ever had sigmoidoscopy or 58.3 (2002) 40 Pass 50colonoscopy (%)
13. Up to date on select preventive services (%)**
Men 34.4 (2002) ‡ ‡ ‡Women 33.4 (2002) ‡ ‡ ‡
14. Cholesterol checked within 85.4 (2001) 75 Pass 80past 5 years (%)
Injuries
15. Hip fracture hospitalizations 525 (men) 607 (total) Fail 474 (men)(per 100,000 persons) 1127 (women) 416 (women)
877 (total) (2002) N/A (total) ††
Summary of Findings: • The nation has met targets for 6 of the 10 indicators in this report that are measured by Healthy People 2000.• In 2002, the target for pneumonia vaccination was reached.
Indicator 2: Frequent mental distress
• To assess general mental health status, the BRFSS asksrespondents for the number of days in the past 30 daysthat their mental health was not good because ofstress, depression and problems with emotions.Respondents who report 14 or more days of poormental health are defined as having frequent mentaldistress (FMD). This 14-day minimum period isselected because a similar period is often used byhealth care providers and researchers as a marker forclinical depression and anxiety disorders, and a longerduration of reported symptoms is associated with ahigher level of activity limitation.5
• The presence of frequent mental distress varies by raceand ethnicity (Figure 5). Individuals of Asian/PacificIslander descent have a much lower prevalence of FMDcompared with other racial and ethnic groups, whileHispanic Americans have the highest prevalence.
• Unlike physical health, mental health seems to improvewith age. BRFSS data from 1993-2001 show that 10.5%of adults aged 18-24 years reported frequent mental distress, whereas FMD was reported by only about 6%of adults aged 65 years and older. Some researchersattribute this improvement to more personal and socialresources, better coping skills, and stronger social andspiritual supports among older Americans.
Indicator 3: Oral health: Complete tooth loss
• The percentage of older adults who have lost all of theirnatural teeth has declined substantially since the 1950s,when more than half of adults older than age 65 weretoothless.9, 10 This decline is the result of enormousimprovements in the field of oral health in the last 50 years, including community water fluoridation,advanced dental technology, better oral hygiene, andmore frequent use of dental services (Figure 6).
• Despite this increase in tooth retention, almost a quarterof Americans aged 65 and older in 2002 had lost all oftheir teeth. Tooth loss among older adults is morecommon in some parts of the country (e.g., Appalachia)and among groups defined by certain socioeconomic,racial/ethnic and health characteristics, including havingan annual income of less than $15,000, having less than a high school education, having diabetes and being anon-Hispanic black.
09
CALL TO ACTION: ADDRESSING FREQUENT MENTAL DISTRESSAlthough older adults usually report fewer mental health
problems than do younger people, many still suffer from
unnecessary mental distress.6 Some older adults have
untreated or inadequately treated mental conditions and
could benefit from diagnosis by a health professional and
full access to the best available mental health treatment.
Others who find themselves suffering from loneliness, lacking
resources to overcome health-related activity limitations, or
living in a difficult family or community situation could
lessen their distress by getting involved with group support,
self-care, and other community-based social service
programs.
Self-reports of mental distress should be monitored
as an indicator of the overall burden of mental health
problems in older populations. Although mental distress
is undesirable by itself, it has also been associated with
unhealthy and risky behaviors that can inhibit recovery
from an illness or cause new physical or mental health
problems.7 Clinicians, social workers, and others who have
contact with older adults could help to identify
those who might be suffering from mental distress by
periodically asking them how their mental (as well as
physical) health has been lately. They could also help these
older persons by alerting them to situations that could
trigger frequent mental distress and informing them of
mental health and social services that are provided by their
particular health insurance or medical provider, the
Veterans Administration, the aging services network
supported by the Administration on Aging (AOA), the
Substance Abuse and Mental Health Services
Administration (SAMHSA), United Way organizations,
AARP, and other health and social service organizations.
Recently, SAMHSA, AOA and the National Council on
the Aging partnered to create a toolkit for organizations
that provide services to older adults, such as senior centers,
adult day care services, nutrition programs, state agencies,
health and social service programs, and faith-based initia-
tives. Called Get Connected! Linking Older Adults with
Medication, Alcohol and Mental Health Resources, the
toolkit introduces service providers to substance abuse and
misuse issues and mental health problems among older
adults. The toolkit also outlines a five-step process for
establishing a program, developing resources, conducting
education sessions and planning future programming.8
To order the Get Connected! toolkit, contact SAMHSA’s
National Clearinghouse for Alcohol and Drug Information
call (800) 729-6686 (English and Spanish) or 1-(800) 487-
4889 (TDD), or e-mail [email protected]. Ask for GCKIT.

• Older adults who have retained their natural teethremain at risk for the two oral diseases most prevalent inall age groups: dental caries (cavities) and periodontaldisease. About 30% of adults with their natural teethhave untreated dental caries, and about 25% of olderadults have lost tooth-supporting structures because ofadvanced periodontal disease.
Indicator 4: Disability
• In this report, disability is defined as an affirmativeresponse to either of the following two questions asked in the 2001 BRFSS: “Are you limited in any way inany activities because of physical, mental or emotional problems?” or “Do you now have any health problemthat requires you to use special equipment, such as acane, wheelchair, a special bed or a special telephone?”
• Older adults are particularly affected by disability: theoverall rate of disability in the United States is 18%;however, among Americans age 65 and older, rates ofdisability increase to 30.8%.
• Although people with disabilities report poor healthmore often than those without disabilities,11 disabilitydoes not necessarily equate to poor health.12
10
f.5IN 2000-2001, THE PREVALENCE OFFREQUENT MENTAL DISTRESS VARIEDWIDELY BY RACE/ETHNICITY
Native American/Alaska Native
Asian/ Pacific Islander
0% 2% 4% 6% 8%
Source: CDC, Behavioral Risk Factor Surveillance System, 2000-2001
Hispanic
Black, non-Hispanic
White, non-Hispanic
10%
12%
0%
f.6FROM 1957 TO 1994, COMPLETE TOOTHLOSS DECLINED AMOUNG ADULTS OVERAGE 65
1957-1958
Sources: U.S. Public Health Service, 1960 and CDC, National Center for HealthStatistics, National Health and Nutrition Examination Surveys I and III, 1975,1996
10%
20%
30%
40%
50%
60%
1971-1974 1988-1994
20%-Healthy
People 2000target
CALL TO ACTION: IMPROVING ORAL HEALTHPractices such as drinking fluoridated water, carefullybrushing and flossing teeth, and getting regular professional oral health care have been shown to beinstrumental in maintaining and improving oral health.These measures are the only ways that older adults canavoid losing their teeth or requiring extensive treatmentto curb infection and restore tooth function. Rates ofthese conditions vary widely among older people of different socioeconomic backgrounds, and this variationoffers strong evidence that many older adults have notbenefited fully from improvements in preventing andcontrolling oral diseases.
The following guidelines can help all older adultsimprove their oral health and lower their risk for dentaldecay and tooth loss:
• Drink fluoridated water and use fluoride toothpaste.Fluoride provides protection against dental decay atall ages.
• Practice good oral hygiene. Careful tooth brushingand flossing to reduce dental plaque can help preventperiodontal disease.
• Get professional oral health care. Professional carehelps to maintain the overall health of the teeth andmouth and helps to detect precancerous or cancerouslesions early in their development.
• Avoid tobacco. Smokers have a seven times greaterrisk of developing periodontal disease than non-smokers. Spit tobacco containing sugar also increasesthe risk of dental decay.
• Limit alcohol. Drinking excessive amounts of alcoholis a risk factor for oral and throat cancers. Alcoholand tobacco used together are the primary risk factors for these cancers.
• Get dental care before undergoing chemotherapy orradiation to the head or neck. These therapies candamage or destroy oral tissues and can cause severemucosal inflammation and ulcers, loss of salivaryfunction, rampant decay and bone destruction.
7.9%
2.1%
10.0%
8.6%
5.9%
55.4%
45.6%
28.6%

11
• Disability among older adults, as measured by limitations in instrumental activities of daily living, hasdeclined since the early 1980s.13
Health Behavior IndicatorsIndicator 5: Physical activity
• Few factors contribute as much to successful aging ashaving a physically active lifestyle. Being physically activehelps older people remain mobile and independent. In fact, regular physical activity can help prevent or controlmany of the health problems that often reduce the qualityand length of life of older adults, including obesity, arthritis, high blood pressure, diabetes, osteoporosis,stroke, depression and colon cancer.
• Older people do not need to engage in strenuous physicalactivity to improve their health. Daily walking, alone orin conjunction with other leisure-time activities such asgardening, offers many health benefits.16
• Despite the proven health benefits of physical activity,data from the 2002 BRFSS show that one-third of adultsage 65 and older do not engage in leisure time physicalactivities.
Indicator 6: Eating five or more fruits andvegetables daily
• Eating a diet rich in fruits and vegetables may help reducethe risk of some cancers and other chronic conditions,such as diabetes and cardiovascular disease.
• Compared with other age groups, a higher proportion of older Americans are eating five or more fruits and vegetables daily, but they are still not meeting the HealthyPeople 2000 target (Figure 7).
Indicator 7: Obesity
• Maintaining a healthy body weight is important to olderadults’ health because being obese is associated with agreater risk of chronic diseases such as cardiovascular disease and diabetes. Obesity can also worsen conditionssuch as arthritis.
• An individual whose body mass index (BMI) is greaterthan or equal to 30kg/m2 is classified as obese.
• BRFSS data show that the prevalence of obesity amongadults age 65 and older increased from approximately12% in 1990 to 19% in 2002.17
Indicator 8: Current smoking
• An estimated 46.2 million adults in the United Statessmoke cigarettes even though this single behavior willresult in death or disability for half of all regular smokers.Cigarette smoking is responsible for more than 440,000premature deaths each year in the United States.18
• Although most older adults who were regular smokershave quit smoking, about 10% of Americans older thanage 65 still smoked cigarettes in 2002.
• Even elderly smokers who quit can gain significant healthbenefits. For example, a smoker’s risk of heart diseasebegins to fall almost immediately after quitting, regardlessof how long that person has smoked.19
CALL TO ACTION: PROMOTING HEALTHY BEHAVIORS AMONGOLDER ADULTS The current gap between life expectancy and healthyyears of life can be narrowed. Research shows thatsimple behavioral changes can improve the healthcondition of older adults.14 These improvements inhealth can be achieved through a combination ofpracticing healthful behaviors, effectively identifyingdisease, modifying health risks, and managing chronic conditions. An important way to promotehealthy behaviors among older adults is to improvepatient-provider communication and to provide time for counseling and referral regarding lifestylemodifications, so that older adults can adopt ormaintain these behaviors. To reach these goals,providers need more time to provide counseling andready access to community resources from the publichealth and aging services networks on lifestyle interventions. In particular, older adults with disabilities such as vision problems and literacy difficulties require special attention. Many of thesechallenges could be addressed through general systems improvement recommended for primarycare, improved communications and identification of community resources.15
0%
f.7THE PERCENTAGE OF PEOPLE MEETINGTHE “5-A-DAY” FRUIT AND VEGETABLERECOMMENDATION VARIES BY AGE
18-24
Source: CDC, Behavorial Risk Factor Surveillance System, 2002
10%
20%
30%
40%
50%
60% 50%-Healthy People
2000 target
25-34 35-44 45-54 55-64 65+
Age groups
19.3% 19.2% 21.0% 21.7%24.6%
32.2%

12
Preventive Care and ScreeningIndicatorsIndicator 9: Flu vaccine in past yearIndicator 10: Ever had pneumonia vaccine
• Although influenza and pneumonia can largely be prevented through vaccination, these two diseases stillkill thousands of older adults each year. Of the roughly36,000 deaths due to influenza each year during the1990s, 90% were among people age 65 or older. In1998, an estimated 3,400 adults age 65 or older died as a result of invasive pneumococcal disease.
• The Healthy People 2000 targets of vaccinating 60% ofnoninstitutionalized older Americans against influenza and 60% against pneumonia appear to have been met nationally; however, vaccination rates vary significantlyamong different racial and ethnic groups. Older Blackand Hispanic American adults are immunized for thesetwo diseases much less frequently than their Whitecounterparts (Figure 8).
Indicator 11: Mammogram within pasttwo years
• Mammography is the best available method to detectbreast cancer in its earliest, most treatable stage, severalyears before a lump can be felt.21
• Timely mammography screening among women olderthan age 40 could prevent approximately 17% of alldeaths from breast cancer, and this reduction in riskincreases as women get older.22
• Seventy-five percent of all diagnosed cases of breastcancer are among women aged 50 years of age andolder.21 Even though mammograms for women age 65and older are covered by Medicare, in 2002 more than
0%
f.8IN 2002, OLDER BLACK AND HISPANICADULTS WERE NOT IMMUNIZED AS FREQUENTLY AS OLDER WHITE ADULTS
Source: CDC, Behavioral Risk Factor Surveillance System, 2002
10%
20%
30%
40%
50%
60%
60%-Healthy People
2000 target
Influenza Vaccine Pneumonia Vaccine
70%
80%
CALL TO ACTION: INCREASING THE USE OFCLINICAL PREVENTIVE SERVICESBroader use of clinical preventive services is one ofthe keys to preserving and extending the health ofolder Americans. Medicare covers many essentialclinical preventive services for older adults, includingimmunization for influenza and pneumococcal dis-ease and screening for the early detection of selectedcancers (e.g., breast, cervical and colorectal cancers),diabetes, cardiovascular disease, osteoporosis andglaucoma. These services, coupled with appropriatefollow-up, are effective in preventing disease ordetecting disease in the early stages, when treatmentis more effective.
Because research has shown that older adults aremotivated by health care providers’ recommendationsfor screening and immunization, better educating seniors on recommended preventive measures is essential.20 Community organizations can promoteand facilitate access to preventive measures by host-ing health fairs and “Immunization Days” whereolder people live and congregate and by widely publi-cizing the benefits and local availability of immuniza-tion and screening services.
A variety of players—health care providers, agingservices providers, public health agencies, hospitals,nursing agencies, health insurance programs, faith-based institutions, senior centers, and community-based organizations—all have key roles in ensuringthat older Americans benefit from these services.Communities should ensure that they have a desig-nated focal point for coordinating and facilitating theefforts of these important community players inincreasing the use of preventive services.
One example of a successful coordinating effort isthe Sickness Prevention Achieved through RegionalCollaboration (SPARC) program. SPARC coordi-nates and nurtures a regional network of providersand organizations that implement local strategies forincreasing access to clinical preventive services.Partners include representatives of local hospitals, medical practices, public health agencies, social serv-ice organizations and community advocacy groups.SPARC serves as the bridge between medicine andpublic health. Although it does not directly provideservices, SPARC helps medical practices more effec-tively provide preventive services, helps make preven-tion measures more widely available, and helps estab-lish local accountability for the delivery of care. Formore information, visit www.sparc-health.org.
69.0%
50.6% 54.8% 64.8%
44.5% 44.4%
HispanicWhite, non-Hispanic Black, non-Hispanic

20% of women in this age group had not had a mammogram within the past two years.
Indicator 12: Colorectal cancer screening
• Colorectal cancer is the second-leading cause of cancerdeath in the U.S.23 Early detection through screeninggreatly increases the chances of survival and is coveredby Medicare for adults age 65 and older.
• The data included in this report are graded against theHealthy People 2000 goals, which used the target of “atleast 40% of people age 50 and older who have everreceived a sigmoidoscopy.” Current screening recom-mendations from the U.S. Preventive Services TaskForce, however, are more comprehensive for adults age50 and older who are at average risk. For this population,routine screening with one or a combination of the following tests is recommended: a fecal occult blood test(FOBT) annually, a flexible sigmoidoscopy every 5 years,a double-contrast barium enema every 5 years, and acolonoscopy every 10 years.24
Indicator 13: Up-to-date on select preventive services
• The “up-to-date” indicator presents a composite pictureof the preventive care and screening behaviors of olderadults. Indicators 9 - 12 measure the use of selectedclinical preventive services that are covered by Medicareand recommended for adults age 65 and older (mam-mography is covered for women only). While each isindependently important, older adults need to use all ofthem, not just one or two, to protect their health.
• Many older Americans are not getting the benefits ofimmunizations and cancer screening, medicine’s mosteffective tools for preventing some of the leading causesof death. Although these services are covered byMedicare, in 2002 only one third of older Americansreceived these measures on the recommended schedule.
Indicator 14: Cholesterol screening
• Because high serum cholesterol is a major risk factor forcoronary heart disease (CHD), which is the leadingcause of illness and death among older men and women,periodic cholesterol screening is an essential componentof preventive health care.
• Lowering the cholesterol levels of older adults who haveCHD can prolong and improve the quality of their livesand reduce their risk of heart attack or stroke. For olderadults without CHD, lowering cholesterol levels reducesthe high risk that it will develop.25
Indicator 15: Hip fracture hospitalizations
• Hip fracture, the most serious type of all fall-relatedfractures, is a leading contributor to death, disability,and reduced quality of life among older adults.26, 27 Upto 25% of hip fracture patients die within one year.28
For those who survive, hip fractures often substantiallyreduce the ability to remain independent.29
• In 2002, there were more than double the number of hospitalizations for hip fractures for women thanmen (1,127 hospitalizations per 100,000 persons forwomen, compared with 525 hospitalizations per100,000 persons for men).
• From 1990 to 2002, hospitalization rates for hip fracture varied from year to year, but always remainedsignificantly above the Healthy People 2000 target of607 per 100,000 (Figure 9).
1990
1991
1992
1993
1994
1995
1996
1997
1998
1999
2000
2001
2002
f.9HIP FRACTURE HOSPITALIZATION RATESCONSISTENTLY EXCEED THE NATIONALTARGET
0
200
400
600
800
1000
rate per 100,000 persons
Source: CDC, National Center for Health Statistics, National HospitalDischarge Survey, 1990-2002
607 per 100,000-Healthy People 2000
target
13
776
814
757
841
815
818
934
879
863
852
840
825
877

14
Selected Additional Resources
For additional information on the indicators describedabove, please refer to the following internet-basedresources (please see the Spotlight: Physical Activity andOlder Adults section for resources related to physical activity):
Healthy People 2000 and Healthy People 2010www.healthypeople.gov
Health-Related Quality of Lifewww.cdc.gov/hrqol
Oral Healthwww.cdc.gov/OralHealth/index.htm
Disabilitywww.cdc.gov/ncbddd/dh/default.htmwww.asaging.org/media/pressrelease.cfm?id=8
Nutrition and Obesitywww.cdc.gov/nccdphp/dnpa/nutrition.htmwww.cdc.gov/nccdphp/dnpa/obesity/index.htmwww.5aday.gov www.nal.usda.gov/fnic/etext/000002.htmlwww.smallstep.gov www.niddk.nih.gov/health/nutrit/pubs/choose.htm
Tobaccowww.cdc.gov/tobacco www.cancer.orgwww.lungusa.org
Immunizationswww.cdc.gov/nip www.asaging.org/media/pressrelease.cfm?id=38
Cancer Screeningwww.cdc.gov/health/cancer.htmwww.cancer.org
Cholesterol Screeningwww.cdc.gov/cvh
Falls Preventionwww.cdc.gov/ncipc/duip/spotlite/falls.htmwww.asaging.org/media/pressrelease.cfm?id=9
Healthy Agingwww.cdc.gov/aging
CALL TO ACTION: IMPLEMENTING A NATIONALFALLS PREVENTION PLANRecognizing the need for a national strategy for preventing falls among older adults, the ArchstoneFoundation and the Home Safety Council recentlyfunded the National Council on the Aging’s Center forHealthy Aging to spearhead a Falls Free Summit todevelop and advance a national action plan. A SteeringCommittee of nationally recognized experts in the fieldare working with key stakeholders from public health,communities, researchers, policy makers, medical professionals, businesses, and consumers to reach consensus on goals and to commit to specific strategies.
The development of a national plan to preventfalls and related injuries is just the first step. Toensure older adults benefit from this important work,implementation will require a broad partnershipamong stakeholder groups.

References
1. Dominick KL, Ahern FM, Gold CH, Heller DA. Health-related quality of life among older adults with activity-limiting health conditions.Journal of Mental Health and Aging 2003;9(1):43–53.
2. Keller HH, Ostbye T, Goy R. Nutritional risk predicts quality of life in elderly community-living Canadians. Journals of Gerontology,Series A, Biological Sciences and Medical Sciences 2004;59(1):68–74.
3. Centers for Disease Control and Prevention. Surveillance for sensory impairment, activity limitation, and health-related quality of lifeamong older adults—United States, 1993–1997. MMWR Surveillance Summaries 1999;48(No.SS-8):131–156.
4. Centers for Disease Control and Prevention. Measuring Healthy Days. Atlanta, Georgia: U.S. Department of Health and HumanServices; 2000.
5. Milazzo-Sayre LJ, Henderson MJ, Manderscheid RW. Serious and severe mental illness and work: what do we know? In: Bonnie RJ,Monahan J, eds. Mental Disorder, Work Disability, and the Law. Chicago, Illinois: University of Chicago Press; 1997.
6. Strine TW, Balluz LI, Chapman DP, Moriarty DG, Owens MG, Mokdad AH. Risk behaviors and health care coverage among adults byfrequent mental distress status, 2001. American Journal of Preventive Medicine 2004;26(3):213–216.
7. Moriarty DG, Zack MM, Kobau R. The Centers for Disease Control and Prevention’s Healthy Days Measures – Population tracking ofperceived physical and mental health over time. Health and Quality of Life Outcomes 2003 (Sept 2);1(37):1–8. Available atwww.hqlo.com/content/1/1/37 (accessed 7/20/04).
8. Substance Abuse and Mental Health Services Administration. Kit links service providers to resources for older adults. SAMHSA News2004 (May/June);12(3). Available at http://alt.samhsa.gov/samhsa_news/VolumeXII_3/article9.htm (accessed 7/21/04).
9. U.S. Public Health Service. Loss of teeth—United States, June 1957–June 1958. PHS Publ No 584-B22, Series B No. 22. Washington,CD: Government Printing Office, 1960.
10. National Center for Health Statistics (NCHS). Third National Health and Nutrition Examination Survey (NHANES III) Reference Manualsand Reports [CD-ROM]. Hyattsville, MD: U.S. Department of Health and Human Services; 1996.
11. Centers for Disease Control and Prevention. Health-related quality of life and activity limitation—eight states, 1995. Morbidity andMortality Weekly Report 1998-2; 47:239–244.
12. Chamie M. What does morbidity have to do with disability? Disability and Rehabilitation 1995;17(7):323–337.13. Centers for Disease Control and Prevention. Public health and aging: trends in aging—United States and worldwide. Morbidity and
Mortality Weekly Report 2003;52(06):101–106.14. Fries JF. Measuring and monitoring success in compressing morbidity. Annals of Internal Medicine 2003;139:455–459.15. Stone EG, Morton SC, Hulscher ME, et al. Interventions that increase use of adult immunization and cancer screening services: a meta-
analysis. Annals of Internal Medicine 2002;136:641–651.16. U.S. Department of Health and Human Services. Physical Activity and Health: A Report of the Surgeon General. Atlanta, GA: U.S.
Department of Health and Human Services, Centers for Disease Control and Prevention, National Center for Chronic DiseasePrevention and Health Promotion; 1996.
17. Centers for Disease Control and Prevention. Behavioral Risk Factor Surveillance System Online Trends Database. Available athttp://apps.nccd.cdc.gov/brfss/Trends/TrendData.asp (accessed 6/21/04).
18. Centers for Disease Control and Prevention. Annual smoking-attributable mortality, years of potential life lost, and economic costs—United States, 1995–1999. Morbidity and Mortality Weekly Report 2002;51(14):300–303.April 12, 2002 / 51(14);300-3.
19. Centers for Disease Control and Prevention. Healthy Aging: Preventing Disease and Improving Quality of Life Among OlderAmericans, At A Glance 2002. Atlanta, GA: U.S. Department of Health and Human Services, 2002.
20. Elder JP. Williams SJ. Drew JA. Wright BL. Boulan TE. Longitudinal effects of preventive services on health behaviors among an elderlycohort. American Journal of Preventive Medicine. 11(6):354-9, 1995.
21. American Cancer Society. Breast Cancer Quick Facts. Available atwww.cancer.org/docroot/GI/content/GI_2_9_Breast_Cancer_Quick_Facts.asp?sitearea=GI (accessed June 22, 2004).
22. Centers for Disease Control and Prevention. Breast Cancer and Mammography Information. Available at www.cdc.gov/cancer/nbc-cedp/info-bc.htm (accessed June 22, 2004).
23. American Cancer Society. Cancer Facts and Figures, 2003. Atlanta, Georgia: American Cancer Society; 2003 [publication no. 5008.03].24. Centers for Disease Control and Prevention. Colorectal cancer test use among persons aged >50 Years – United States, 2001. Morbidity
and Mortality Weekly Report 2003;52(10);193–196.25. National Institutes of Health. National Cholesterol Education Program. Available at
www.nhlbi.nih.gov/health/prof/heart/other/hm_sp00/ncep.htm (accessed 6/21/04).26. Wolinsky FD, Fitzgerald JF, Stump TE. The effect of hip fracture on mortality, hospitalization, and functional status: a prospective
study. American Journal of Public Health 1997;87(3):398–403.27. Hall SE, Williams JA, Senior JA, Goldswain PR, Criddle RA. Hip fracture outcomes: quality of life and functional status in older adults
living in the community. Australian and New Zealand Journal of Medicine 2000;30(3):327–332.28. Lu-Yao GL, Baron JA, Barrett JA, Fisher ES. Treatment and survival among elderly Americans with hip fracture: a population-based
study. American Journal of Public Health 1994;84(8):1287–1291.29. Magaziner J, Hawkes W, Hebel JR, et al. Recovery from hip fracture in eight areas of function. Journal of Gerontology: Medical
Sciences 2000;55A(9):M498–M507.
15

17
The State-by-State Report Cardon Healthy Aging
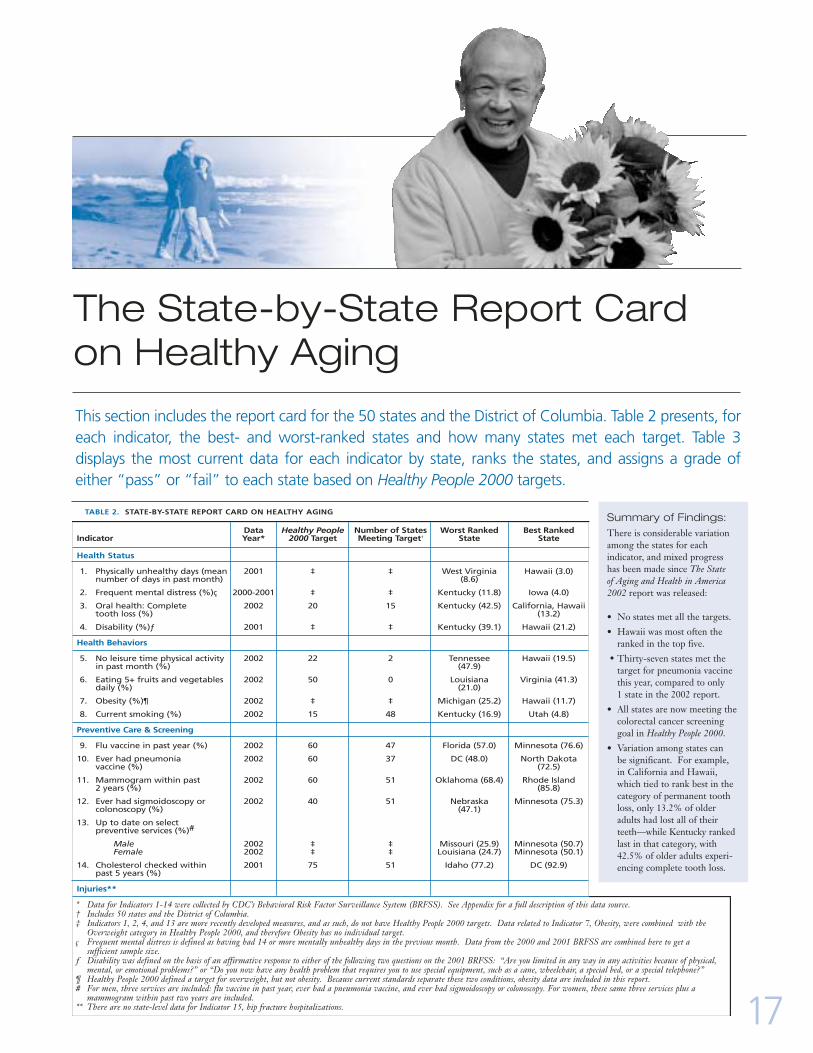
This section includes the report card for the 50 states and the District of Columbia. Table 2 presents, foreach indicator, the best- and worst-ranked states and how many states met each target. Table 3 displays the most current data for each indicator by state, ranks the states, and assigns a grade of either “pass” or “fail” to each state based on Healthy People 2000 targets.
Summary of Findings: There is considerable variationamong the states for each indicator, and mixed progresshas been made since The State of Aging and Health in America2002 report was released:
• No states met all the targets.
• Hawaii was most often theranked in the top five.
• Thirty-seven states met thetarget for pneumonia vaccinethis year, compared to only 1 state in the 2002 report.
• All states are now meeting thecolorectal cancer screeninggoal in Healthy People 2000.
• Variation among states can be significant. For example, in California and Hawaii,which tied to rank best in the category of permanent toothloss, only 13.2% of olderadults had lost all of theirteeth—while Kentucky rankedlast in that category, with42.5% of older adults experi-encing complete tooth loss.
Data Healthy People Number of States Worst Ranked Best RankedIndicator Year* 2000 Target Meeting Target† State State
Health Status
1. Physically unhealthy days (mean 2001 ‡ ‡ West Virginia Hawaii (3.0)number of days in past month) (8.6)
2. Frequent mental distress (%)ç 2000-2001 ‡ ‡ Kentucky (11.8) Iowa (4.0)
3. Oral health: Complete 2002 20 15 Kentucky (42.5) California, Hawaiitooth loss (%) (13.2)
4. Disability (%)ƒ 2001 ‡ ‡ Kentucky (39.1) Hawaii (21.2)
Health Behaviors
5. No leisure time physical activity 2002 22 2 Tennessee Hawaii (19.5)in past month (%) (47.9)
6. Eating 5+ fruits and vegetables 2002 50 0 Louisiana Virginia (41.3)daily (%) (21.0)
7. Obesity (%)¶ 2002 ‡ ‡ Michigan (25.2) Hawaii (11.7)
8. Current smoking (%) 2002 15 48 Kentucky (16.9) Utah (4.8)
Preventive Care & Screening
9. Flu vaccine in past year (%) 2002 60 47 Florida (57.0) Minnesota (76.6)
10. Ever had pneumonia 2002 60 37 DC (48.0) North Dakotavaccine (%) (72.5)
11. Mammogram within past 2002 60 51 Oklahoma (68.4) Rhode Island2 years (%) (85.8)
12. Ever had sigmoidoscopy or 2002 40 51 Nebraska Minnesota (75.3)colonoscopy (%) (47.1)
13. Up to date on select preventive services (%)#
Male 2002 ‡ ‡ Missouri (25.9) Minnesota (50.7)Female 2002 ‡ ‡ Louisiana (24.7) Minnesota (50.1)
14. Cholesterol checked within 2001 75 51 Idaho (77.2) DC (92.9)past 5 years (%)
Injuries**
TABLE 2. STATE-BY-STATE REPORT CARD ON HEALTHY AGING
* Data for Indicators 1-14 were collected by CDC’s Behavioral Risk Factor Surveillance System (BRFSS). See Appendix for a full description of this data source.† Includes 50 states and the District of Columbia. ‡ Indicators 1, 2, 4, and 13 are more recently developed measures, and as such, do not have Healthy People 2000 targets. Data related to Indicator 7, Obesity, were combined with the
Overweight category in Healthy People 2000, and therefore Obesity has no individual target. ç Frequent mental distress is defined as having had 14 or more mentally unhealthy days in the previous month. Data from the 2000 and 2001 BRFSS are combined here to get a
sufficient sample size. ƒ Disability was defined on the basis of an affirmative response to either of the following two questions on the 2001 BRFSS: “Are you limited in any way in any activities because of physical,
mental, or emotional problems?” or “Do you now have any health problem that requires you to use special equipment, such as a cane, wheelchair, a special bed, or a special telephone?”¶ Healthy People 2000 defined a target for overweight, but not obesity. Because current standards separate these two conditions, obesity data are included in this report.# For men, three services are included: flu vaccine in past year, ever had a pneumonia vaccine, and ever had sigmoidoscopy or colonoscopy. For women, these same three services plus a
mammogram within past two years are included.** There are no state-level data for Indicator 15, hip fracture hospitalizations.

18
7.7 49 9.0 49 29.9 42 Fail 37.9 48 36.3 39 Fail3.7 2 6.0 18 24.4 32 Fail 29.1 14 32.5 24 Fail5.9 40 7.3 38 19.4 12 Pass 33.3 38 26.9 7 Fail7.7 49 7.7 46 29.2 41 Fail 37.8 47 38.2 42 Fail5.1 12 5.9 17 13.2 1 Pass 29.7 17 25.8 6 Fail5.7 33 6.8 35 18.7 10 Pass 25.4 4 25.5 5 Fail5.1 12 5.2 9 15.9 5 Pass 27.8 9 31.1 17 Fail5.5 24 6.3 28 25.0 36 Fail 23.6 3 33.9 29 Fail5.2 17 8.3 47 16.7 7 Pass 27.5 7 33.4 27 Fail4.7 5 5.9 16 20.9 18 Fail 26.3 5 35.8 36 Fail5.8 38 6.7 32 31.7 44 Fail 27.9 10 36.2 38 Fail3.0 1 4.4 3 13.2 1 Pass 21.2 1 19.5 1 Pass 4.9 8 6.3 29 22.0 24 Fail 30.0 18 29.1 9 Fail4.9 8 6.4 30 23.7 30 Fail 32.0 31 38.8 46 Fail6.4 44 5.7 13 24.3 31 Fail 32.2 33 38.4 44 Fail4.7 5 4.0 1 21.1 21 Fail 29.5 16 34.3 30 Fail5.2 17 6.3 26 22.4 26 Fail 28.4 12 31.8 20 Fail5.7 33 11.8 51 42.5 51 Fail 39.1 51 38.8 46 Fail5.3 21 6.8 34 31.9 45 Fail 30.9 23 40.6 50 Fail5.3 21 7.7 45 30.1 43 Fail 31.2 26 36.3 39 Fail5.2 17 5.8 15 19.5 14 Pass 30.3 19 31.7 19 Fail5.8 38 7.4 39 22.7 27 Fail 31.1 24 32.0 22 Fail5.7 33 5.7 13 18.5 8 Pass 32.2 34 33.5 28 Fail5.3 21 4.3 2 14.2 3 Pass 29.4 15 21.3 2 Pass 7.5 48 6.1 20 34.2 48 Fail 38.4 50 38.6 45 Fail5.5 24 6.1 19 26.0 40 Fail 30.8 22 39.6 48 Fail4.4 3 4.9 7 20.9 18 Fail 31.4 27 30.2 15 Fail4.5 4 6.3 25 25.3 37 Fail 32.1 32 29.7 12 Fail5.6 31 7.6 42 20.5 16 Fail 31.9 30 30.0 14 Fail4.8 7 4.7 5 21.5 22 Fail 28.5 13 31.3 18 Fail5.0 11 6.2 22 20.0 15 Pass 23.4 2 31.8 20 Fail6.3 43 8.3 48 24.7 35 Fail 33.6 39 29.3 11 Fail5.9 40 7.5 41 18.5 8 Pass 32.6 36 35.5 33 Fail7.1 47 7.6 43 32.4 46 Fail 34.2 42 39.9 49 Fail5.1 12 4.7 6 22.9 28 Fail 31.5 28 29.9 13 Fail5.2 17 5.4 12 23.5 29 Fail 27.6 8 35.7 35 Fail6.8 45 6.7 33 32.9 47 Fail 35.8 44 38.2 42 Fail5.6 31 6.2 23 18.8 11 Pass 37.8 46 24.2 4 Fail5.7 33 5.2 10 25.3 37 Fail 30.6 21 35.2 32 Fail5.5 24 7.4 39 22.2 25 Fail 26.8 6 35.6 34 Fail6.2 42 7.6 43 24.6 33 Fail 31.1 24 29.2 10 Fail5.5 24 6.2 21 24.6 33 Fail 34.1 41 32.9 26 Fail5.1 12 4.6 4 35.6 49 Fail 28.3 11 47.9 51 Fail5.5 24 6.9 37 19.4 12 Pass 30.5 20 34.6 31 Fail4.9 8 6.2 24 14.5 4 Pass 32.4 35 32.7 25 Fail5.5 24 6.9 36 21.6 23 Fail 31.7 29 32.3 23 Fail6.9 46 6.3 26 21.0 20 Fail 33.9 40 36.6 41 Fail5.7 33 5.4 11 16.5 6 Pass 37.7 45 23.3 3 Fail8.6 51 10.0 50 41.3 50 Fail 38.3 49 36.1 37 Fail5.1 12 6.6 31 20.5 16 Fail 32.9 37 27.7 8 Fail5.5 24 5.2 8 25.5 39 Fail 34.5 43 30.7 16 Fail
AlabamaAlaskaArizonaArkansasCaliforniaColoradoConnecticutDelawareDist. of ColumbiaFloridaGeorgiaHawaiiIdahoIllinoisIndianaIowaKansasKentuckyLouisianaMaineMarylandMassachusettsMichiganMinnesotaMississippiMissouriMontanaNebraskaNevadaNew HampshireNew JerseyNew MexicoNew YorkNorth CarolinaNorth DakotaOhioOklahomaOregonPennsylvaniaRhode IslandSouth CarolinaSouth DakotaTennesseeTexasUtahVermontVirginiaWashingtonWest VirginiaWisconsinWyoming
Physically UnhealthyDays (mean number
of days in past month)2001
Frequent MentalDistress† (%)
2000-2001
Oral Health: CompleteTooth Loss (%)
2002Disability† (%)
2002
No Leisure-TimePhysical Activity
(%) 2002
TABLE 3. STATE-BY-STATE REPORT CARD ON HEALTHY AGING*
Data Rank Grade Data Rank Grade Data Rank Grade Data Rank Grade Data Rank Grade
N/A‡ N/A‡ N/A‡
* Grades based on the attainment of Healthy People 2000 targets. See Appendix for full description of these targets.† Defined in Table 2. ‡ Indicators 1, 2, 4, and 13 are more recently developed measures, and as such, do not have Healthy People 2000 targets. Data related to Indicator 7, obesity, were combined with
the overweight category in Healthy People 2000, and therefore obesity has no individual Healthy People 2000 target.NOTE: Rankings are based on the relative numeric scores for each indicator, with a ranking of “1” representing the greatest achievement.
Source: CDC Behavioral Risk Factor Surveillance System. See Appendix for full description of this data source.

19
AlabamaAlaskaArizonaArkansasCaliforniaColoradoConnecticutDelawareDist. of ColumbiaFloridaGeorgiaHawaiiIdahoIllinoisIndianaIowaKansasKentuckyLouisianaMaineMarylandMassachusettsMichiganMinnesotaMississippiMissouriMontanaNebraskaNevadaNew HampshireNew JerseyNew MexicoNew YorkNorth CarolinaNorth DakotaOhioOklahomaOregonPennsylvaniaRhode IslandSouth CarolinaSouth DakotaTennesseeTexasUtahVermontVirginiaWashingtonWest VirginiaWisconsinWyoming
Eating 5 or MoreFruits and Vegetables
Daily (%)2001
Obesity† (%)2002
Current Smoking (%)2002
Flu Vaccine in PastYear (%)
2002
Ever HadPneumonia Shot
(%) 2002
Data Rank Grade Data Rank Grade Data Rank Grade Data Rank Grade Data Rank Grade
28.4 40 Fail 21.4 35 12.0 38 Pass 64.8 42 Pass 58.5 42 Fail31.9 29 Fail 23.8 48 15.7 50 Fail 69.5 22 Pass 59.8 38 Fail35.8 9 Fail 14.7 4 9.7 22 Pass 69.7 21 Pass 68.0 6 Pass32.0 28 Fail 18.0 16 11.1 34 Pass 69.0 25 Pass 58.7 41 Fail35.6 10 Fail 19.1 22 9.9 24 Pass 71.5 15 Pass 66.7 10 Pass33.0 21 Fail 13.2 2 9.1 14 Pass 73.3 10 Pass 68.1 5 Pass36.0 8 Fail 17.6 13 9.4 16 Pass 71.4 17 Pass 64.5 18 Pass26.2 46 Fail 23.6 47 9.8 23 Pass 71.5 15 Pass 64.3 19 Pass40.7 2 Fail 22.7 40 10.1 25 Pass 58.7 49 Fail 48.0 51 Fail33.3 19 Fail 17.2 11 9.2 15 Pass 57.0 51 Fail 57.2 45 Fail26.9 45 Fail 22.4 38 10.8 31 Pass 59.3 48 Fail 57.3 44 Fail24.7 48 Fail 11.7 1 7.3 3 Pass 73.9 4 Pass 59.5 39 Fail35.1 12 Fail 17.1 10 8.4 8 Pass 65.1 40 Pass 57.5 43 Fail29.0 38 Fail 23.5 46 11.8 37 Pass 61.1 45 Pass 56.7 47 Fail31.0 30 Fail 20.7 30 11.5 36 Pass 66.3 35 Pass 61.2 34 Pass33.3 19 Fail 23.3 44 7.1 2 Pass 73.5 9 Pass 66.2 12 Pass29.3 36 Fail 18.5 18 10.6 28 Pass 68.6 27 Pass 62.1 31 Pass28.2 41 Fail 22.0 37 16.9 51 Fail 65.7 38 Pass 56.6 49 Fail21.0 51 Fail 25.1 50 11.0 32 Pass 57.3 50 Fail 56.3 50 Fail38.8 3 Fail 19.0 20 7.6 4 Pass 73.8 6 Pass 66.8 9 Pass36.5 6 Fail 16.1 7 12.0 38 Pass 65.9 36 Pass 63.4 23 Pass35.1 12 Fail 18.8 19 8.6 10 Pass 72.6 12 Pass 63.4 23 Pass33.0 21 Fail 25.2 51 8.6 10 Pass 67.7 31 Pass 63.0 26 Pass33.4 18 Fail 19.5 26 8.6 10 Pass 76.6 1 Pass 70.4 3 Pass22.9 49 Fail 20.8 31 14.0 47 Pass 63.0 44 Pass 58.9 40 Fail29.1 37 Fail 21.4 35 12.1 40 Pass 68.7 26 Pass 60.8 36 Pass29.5 34 Fail 13.8 3 12.8 44 Pass 67.7 31 Pass 67.3 8 Pass28.1 42 Fail 21.2 34 10.6 28 Pass 68.2 28 Pass 61.3 33 Pass27.7 43 Fail 20.8 31 15.3 49 Fail 60.3 47 Pass 65.0 14 Pass37.6 4 Fail 17.4 12 9.4 16 Pass 72.3 13 Pass 63.8 20 Pass33.8 16 Fail 16.3 8 9.5 19 Pass 69.1 24 Pass 63.1 25 Pass29.5 34 Fail 16.7 9 11.4 35 Pass 66.6 33 Pass 62.7 29 Pass32.8 23 Fail 22.7 40 10.7 30 Pass 64.7 43 Pass 62.4 30 Pass26.0 47 Fail 22.9 43 14.0 47 Pass 68.1 29 Pass 63.0 26 Pass32.8 23 Fail 23.4 45 8.2 6 Pass 73.9 4 Pass 72.5 1 Pass28.7 39 Fail 22.8 42 12.3 41 Pass 66.6 33 Pass 63.7 21 Pass22.0 50 Fail 17.9 15 11.0 32 Pass 72.7 11 Pass 65.5 13 Pass33.9 15 Fail 15.8 6 9.4 16 Pass 68.0 30 Pass 65.0 14 Pass33.7 17 Fail 24.7 49 9.6 21 Pass 70.5 20 Pass 63.5 22 Pass37.1 5 Fail 19.3 24 8.6 10 Pass 73.7 7 Pass 67.6 7 Pass30.5 33 Fail 20.4 29 10.1 25 Pass 69.4 23 Pass 64.9 17 Pass32.4 26 Fail 18.0 16 8.5 9 Pass 74.2 2 Pass 56.7 47 Fail32.1 27 Fail 19.0 20 12.6 43 Pass 71.6 14 Pass 61.4 32 Pass34.1 14 Fail 22.5 39 12.9 46 Pass 61.0 46 Pass 56.9 46 Fail32.7 25 Fail 19.4 25 4.8 1 Pass 71.1 18 Pass 65.0 14 Pass35.4 11 Fail 19.2 23 7.6 4 Pass 73.6 8 Pass 66.3 11 Pass41.3 1 Fail 19.7 28 10.2 27 Pass 65.3 39 Pass 60.8 36 Pass30.6 32 Fail 17.8 14 9.5 19 Pass 65.1 40 Pass 63.0 26 Pass27.7 43 Fail 20.9 33 12.3 41 Pass 65.8 37 Pass 61.2 34 Pass36.4 7 Fail 19.6 27 8.3 7 Pass 74.0 3 Pass 70.6 2 Pass30.9 31 Fail 15.6 5 12.8 44 Pass 70.6 19 Pass 68.2 4 Pass
N/A‡

20
* Grades based on the attainment of Healthy People 2000 targets. See Appendix for full description of these targets.† Defined in Table 2.‡ Indicators 1, 2, 4, and 13 are more recently developed measures, and as such, do not have Healthy People 2000 targets. Data related to Indicator 7, obesity, were combined
with the overweight category in Healthy People 2000, and therefore obesity has no individual Healthy People 2000 target.NOTE: Rankings are based on the relative numeric scores for each indicator, with a ranking of “”1”” representing the greatest achievement.
Source: CDC Behavioral Risk Factor Surveillance System. See Appendix for full description of this data source.
Mammogram in Past 2 Years (%)
2002
Ever HadSigmoidoscopy orColonoscopy† (%)
2002
Up-to-date on SelectPreventive Services
(men) (%) 2002
Up-to-date on SelectPreventive Services
(women) (%) 2002
Cholesterol Check in past 5
years (%) 2001
Data Rank Grade Data Rank Grade Data Rank Grade Data Rank Grade Data Rank Grade
TABLE 3. CONTINUED
AlabamaAlaskaArizonaArkansasCaliforniaColoradoConnecticutDelawareDist. of ColumbiaFloridaGeorgiaHawaiiIdahoIllinoisIndianaIowaKansasKentuckyLouisianaMaineMarylandMassachusettsMichiganMinnesotaMississippiMissouriMontanaNebraskaNevadaNew HampshireNew JerseyNew MexicoNew YorkNorth CarolinaNorth DakotaOhioOklahomaOregonPennsylvaniaRhode IslandSouth CarolinaSouth DakotaTennesseeTexasUtahVermontVirginiaWashingtonWest VirginiaWisconsinWyoming
N/A‡ N/A‡80.1 15 Pass 55.4 32 Pass 32.5 34 31.0 37 85.4 25 Pass76.6 33 Pass 68.6 3 Pass 26.4 50 44.3 2 82.6 38 Pass81.0 11 Pass 62.2 13 Pass 46.4 3 35.5 17 85.6 24 Pass68.4 50 Pass 50.9 44 Pass 33.9 29 31.6 34 83.2 35 Pass80.7 12 Pass 62.2 13 Pass 43.9 8 38.5 11 82.6 38 Pass75.2 35 Pass 61.0 19 Pass 45.4 4 32.5 29 82.2 41 Pass81.9 7 Pass 63.3 10 Pass 42.5 10 39.6 6 86.7 16 Pass83.3 2 Pass 62.8 11 Pass 37.5 19 37.7 12 86.4 18 Pass82.7 5 Pass 71.4 2 Pass 29.1 43 31.8 32 92.9 1 Pass81.8 8 Pass 61.2 17 Pass 33.4 32 34.3 23 91.2 4 Pass77.5 25 Pass 57.9 27 Pass 30.4 41 28.9 43 81.2 44 Pass72.4 42 Pass 48.2 49 Pass 32.7 33 32.1 31 92.2 2 Pass70.3 46 Pass 56.1 31 Pass 31.2 40 31.2 36 77.2 51 Pass78.0 22 Pass 52.2 41 Pass 27.3 47 28.1 46 83.8 33 Pass72.9 40 Pass 50.5 45 Pass 29.9 42 27.3 49 84.6 31 Pass76.7 31 Pass 57.5 29 Pass 36.3 22 38.9 9 82.5 40 Pass80.1 15 Pass 53.8 36 Pass 40.8 14 29.4 40 83.2 35 Pass77.2 26 Pass 51.7 42 Pass 31.5 38 27.0 50 86.4 18 Pass79.6 18 Pass 48.4 48 Pass 28.4 46 24.7 51 89.3 7 Pass82.8 4 Pass 57.9 27 Pass 41.6 12 33.4 26 87.9 13 Pass77.6 24 Pass 63.9 9 Pass 44.6 6 29.3 41 89.9 6 Pass82.3 6 Pass 61.1 18 Pass 41.2 13 37.7 12 89.2 8 Pass79.4 19 Pass 65.9 6 Pass 42.3 11 34.4 22 87.6 14 Pass81.2 9 Pass 75.3 1 Pass 50.7 1 50.1 1 81.2 44 Pass69.4 47 Pass 53.1 38 Pass 26.5 49 29.6 39 81.2 44 Pass72.6 41 Pass 50.2 46 Pass 25.9 51 31.7 33 83.2 35 Pass73.8 39 Pass 58.9 23 Pass 36.2 23 39.5 7 80.0 49 Pass73.9 38 Pass 47.1 51 Pass 27.1 48 29.2 42 80.6 48 Pass76.9 29 Pass 58.3 26 Pass 32.3 36 35.0 20 84.9 29 Pass79.7 17 Pass 59.6 21 Pass 36.5 21 35.5 17 85.1 28 Pass74.8 36 Pass 56.4 30 Pass 34.4 26 34.6 21 88.2 12 Pass71.9 43 Pass 55.4 32 Pass 37.8 18 31.5 35 83.8 33 Pass77.7 23 Pass 59.7 20 Pass 39.9 17 28.5 44 88.5 11 Pass81.1 10 Pass 53.5 37 Pass 37.1 20 35.2 19 86.4 18 Pass78.7 21 Pass 64.1 8 Pass 45.1 5 40.9 4 86.1 21 Pass77.1 27 Pass 52.5 40 Pass 31.4 39 33.6 24 85.4 25 Pass68.4 50 Pass 50.2 46 Pass 35.4 25 27.8 47 84.7 30 Pass83.0 3 Pass 66.3 5 Pass 34.0 27 42.2 3 78.6 50 Pass77.0 28 Pass 55.4 32 Pass 34.0 27 33.5 25 87.5 15 Pass85.8 1 Pass 62.3 12 Pass 40.7 15 39.5 7 91.5 3 Pass80.5 13 Pass 59.3 22 Pass 40.0 16 36.6 15 88.6 9 Pass76.5 34 Pass 51.5 43 Pass 32.5 34 27.8 47 84.1 32 Pass74.3 37 Pass 52.7 39 Pass 33.5 31 30.8 38 85.7 22 Pass70.6 45 Pass 58.5 25 Pass 29.1 43 32.3 30 85.7 22 Pass70.8 44 Pass 61.7 16 Pass 43.6 9 32.8 27 81.4 42 Pass78.9 20 Pass 62.2 13 Pass 46.5 2 37.7 12 85.3 27 Pass76.7 31 Pass 58.8 24 Pass 32.3 36 32.7 28 86.6 17 Pass76.8 30 Pass 66.6 4 Pass 36.1 24 38.7 10 80.9 47 Pass69.3 48 Pass 48.2 49 Pass 28.6 45 28.5 44 90.1 5 Pass80.3 14 Pass 65.4 7 Pass 44.4 7 40.6 5 81.4 42 Pass69.0 49 Pass 55.4 32 Pass 33.6 30 35.6 16 88.6 9 Pass

Regular physical activity can have substantial physical and mental health benefits for people of allages. However, our knowledge of the benefits of physical activity for older adults has not yet beenfully translated into action.1
Spotlight: Physical Activity andOlder Americans
21
Benefits of Physical ActivityPhysical Health Benefits
A strong body of scientific evidence shows that physicalactivity can help older people maintain their health andfunctional abilities. The following are examples of thesebenefits:
• Regular physical activity can help reduce a person’srisk for cardiovascular disease by increasing levels ofhigh-density lipoprotein (HDL) cholesterol, some-times called the “good cholesterol.” Middle-aged andolder men and women who are regularly active havesignificantly higher HDL cholesterol levels than thosewho are sedentary.1
• Regular physical activity can help prevent the development of diabetes, high blood pressure, andcolon cancer and can reduce a person’s risk of dyingprematurely.2
• Balance training can help to prevent falls among olderpeople by helping them maintain and improve theirbalance.3
• Regular physical activity helps maintain healthy bonesand muscles. It can also help to increase joint mobilityand improve the functional capacity of people withosteoarthritis.2
Mental Health Benefits
Just as physical activity can reduce the risk of coronaryheart disease, type 2 diabetes, colon cancer, and otherchronic diseases and disabilities, it can also reduce therisk of distress, anxiety and depression that may accom-pany these conditions. Physical activity can also helpalleviate symptoms of depression and anxiety from othercauses and improve the quality of life of older adults byenhancing their psychological well-being.2 According toMental Health: A Report of the Surgeon General, 8%–20%of older adults in the community and up to 37% in primary health care settings have symptoms of depression.4
Social support, a key component of good mentalhealth, has been consistently associated with being regularly physically active, and this relationship seems to be reciprocal: social support from friends and familymembers may help older people be more physicallyactive, and being physically active can help older peoplebuild their social networks.
There is also evidence that higher levels of physicalactivity and physical fitness are associated with bettercognitive functioning, including more efficient processingnecessary to perform complex cognitive tasks. However,research is needed to determine to what extent these scientific findings relate to the performance of routine daily activities among older adults.5, 6

22
Financial Benefits
The many benefits of physical activity for older adultsextend beyond better health, improved functioning, andincreased quality of life to include significantly reducedhealth care costs. Increasing physical activity could reducedirect medical costs by $77 billion annually (in 2000 dollars). Inactive adults have significantly higher directmedical costs than active adults, and the costs associatedwith physical inactivity increase with age, especially forwomen (Figure 10).7 According to data from the 1987National Medical Expenditures Survey, inactive women45 years of age and older had at least double the healthcare costs of their active counterparts.8
The impact of a lack of physical activity on medicalcare costs is likely to grow as a result of an aging population, unless trends in physical activity change.
Among adults age 65 years and older, 95% of all healthcare spending is for chronic diseases such as diabetes,heart disease and stroke, cancer and arthritis. Becausephysical activity can help prevent and control many ofthese conditions, increasing physical activity among olderAmericans has potential for reducing the financial burdenof chronic diseases.
In addition, fall-related injuries among older peoplecost the nation more than $20 billion each year. By 2020,the total annual cost of these injuries is expected to reach$32.4 billion.6 By improving balance and musclestrength, physical activity can reduce an older person’srisk of falling and thus further reduce medical costs.1, 3
Trends in Physical ActivityCDC’s Behavioral Risk Factor Surveillance System(BRFSS) data show that the percentage of older adultswho meet the recommended level of physical activity(i.e., 30 minutes of moderate intensity activity, such asbrisk walking, five or more days per week) increasedmodestly from 1988 to 2000 but is still relatively low(Figure 11). The percentage of men age 65 years andolder who met the recommended level increased from27.6% in 1988 to 35.1% in 2000. Women had consistentlylower levels of recommended activity than men andshowed less of an increase over time (from 23.4% in1988 to 26.6% in 2000). These data suggest that, whileall older adults could benefit from increased levels ofphysical activity, initially focusing interventions on olderwomen could help to reduce the disparity between thesexes.
Levels of Physical Activity in SelectedLocal AreasThe BRFSS recently developed the SelectedMetropolitan/Micropolitan Area Risk Trends (SMART)project, which provides local-level data that can be usedto track trends, identify health issues in the community,and develop and evaluate health programs and policies.The data available through this project include the levelsof physical activity among adults in participating metropolitan/micropolitan statistical areas (MMSAs).
Figure 12 shows the levels of physical activity (recommended, insufficient, and inactive) among olderadults in a selected group of geographically diverseMMSAs that asked the physical activity questions in2002. Among these eight selected areas, Phoenix-Mesa-Scotsdale, AZ, had the highest percentage (43.2%)of older adults meeting recommended levels of physicalactivity, and St. Louis, MO, had the lowest percentage
f.10IN 1987, MEDICAL COSTS ROSE WITHINCREASING AGE, ESPECIALLY FOR INACTIVE WOMEN
Source: Pratt M, Macera CA, Wang G. Higher Direct Medical Costs Associatedwith Physical Inactivity. The Physician and Sportsmedicine 28; No. 10, 2000; 63-70.
5000
4000
3000
2000
1000
0
45-54
6000
55-64 65-74 75+
Active women
Inactive women
Age group
Med
ical c
osts
($)
f.11MORE MEN THAN WOMEN AGE 65 AND OVER ARE ENGAGING IN RECOMMENDED* LEVELS OF PHYSICALACTIVITY DURING THEIR LEISURE TIME
* Moderate intensity physical activity for >=5 days per week for >= 30 minutes each time.
Source: CDC, Behavioral Risk Factor Surveillance System, 1988-2000.
1988
40%
35%
30%
25%
20%
15%
10%
5%
0%
Men
Women
1989
1990
1991
1992
1993
1994
1995
1996
1997
1998
1999
2000

(27.5%). The highest percentage of inactive seniors(30.3%) was found in the Chicago-Naperville-Joliet, ILMMSA, whereas Phoenix-Mesa-Scotsdale and Honolulueach had only 14.7% of seniors reporting inactivity.
Activity PatternsThe 2000 BRFSS asked respondents to report the twophysical activities or exercises that they had participatedin the most during the past month. Nearly 70% ofphysically active older adults reported walking as thetype of physical activity or exercise they had spent themost time doing during the past month. The next mostcommon physical activities were gardening (reported by9.6%), bicycling (3.9%), home exercises (3.3%), and golf(2.8%). About 12% of older adults reported participatingin other types of activities, which included aerobics classes,swimming, weight lifting, running/jogging and tennis(Figure 13). These data can help planners in healthdepartments, area agencies on aging, senior centers,community agencies and other organizations as theydecide what types of physical activity programs to offerolder adults.
f.12
**Recommended physical activity is defined as reported moderate-intensity activities ina usual week (i.e., brisk walking, bicycling for at least 30 minutes per day, at least 5 days per week.) Insufficient physical activity is defined as doing more than 10 minutes total per week of moderate intensity lifestyle activities, but less than the recommended level of activity. Inactivity is defined as less than 10 minutes total perweek of moderate intensity lifestyle activities.
Source: CDC Behavioral Risk Factor Surveillance System, 2002
PHYSICAL ACTIVITY LEVELS VARY BYMETROPOLITAN/MICROPOLITANSTATISTICAL AREAS
Ashville, NC
Baltimore, MD
Chicago-Naperville-
Joilet, IL
Denver-Aurora,CO
Hartford, CT
Honolulu, HI
Phoenix-Mesa-Scotsdale, AZ
St. Louis, MO
Inactive
Insufficient
Recommended**
0% 10%
20%
30%
40%
50%
60%
f.13OLDER ADULTS ENGAGE IN A VARIETYOF PHYSICAL ACTIVITIES
Source: CDC, Behavioral Risk Factor Surveillance System, 2000
100%
90%
80%
70%
60%
50%
40%
30%
20%
10%
0%
68.3%
9.6%
3.9%2.8%3.3%
12.1%
Other
Home Exercise
Golf
Bicycling
Gardening
Walking
23
27.6%
37.4%
41.9%
54.7%
40.2%
43.1%
34.0%
39.9%
36.8%
17.9%
16.1%
23.7%
24.2%
36.6%
28.4%
27.8%
31.8%
23.7%
24.2%
35.1%
18.0%
32.0%
25.0%
23.3%

24
CALL TO ACTION: INCREASING PHYSICAL ACTIVITYStrategies to increase physical activity among olderadultsDespite ample evidence of the benefits of regular physi-cal activity for older adults, most seniors do not achieve recommended levels of physical activity. The challenge,and the opportunity, is to make physical activity moreaccessible to older adults of all ages, abilities and interests.
In 2001, the National Blueprint: Increasing PhysicalActivity Among Adults Age 50 and Older1
(www.agingblueprint.org) was released as a joint effort ofmany organizations. The publication was sponsored byAARP, the American College of Sports Medicine, theAmerican Geriatrics Society, CDC, the NationalInstitute on Aging, and the Robert Wood JohnsonFoundation; approximately 50 other organizations provided input and support. This planning documentprovides background information on the importance ofphysical activity, identifies barriers to increasing physicalactivity among older adults and recommends numerousstrategies for overcoming these barriers and helpingolder adults be more physically active.
In 2002, National Blueprint partners prioritized thestrategies and selected 18 of them (the top three in six different program areas). National organizations havebeen selected to take the lead for each strategy as tacticsare developed and implemented over the next 12 to 24months. These are described in a new document,Strategic Priorities for Increasing Physical Activity AmongAdults Age 50 and Over: The National Blueprint ConsensusConference Summary Report, which is available atwww.agingblueprint.org/StrategicPriorities.cfm.9
While these 18 nationally-focused strategies arebeing implemented, there remain additional strategiesfrom the initial Blueprint document that states, communities, program planners, researchers, policymakers and health care providers can put into practice to increase physical activity among their own populations.The following is a sampling of what can be done at thelocal level:
Research Strategies• Identify barriers to walking for adults age 50 and older,
determine why these barriers exist, and develop specificrecommendations for how to overcome them.
Home and Community Strategies• Establish partnerships among health, aging,
urban/community planning, transportation, environmental groups, recreation, social services and the private sector. Encourage these groups to work
together to define, create, promote and sustain communities that support lifelong physical activity.
Workplace Strategies• Provide financial incentives for employers to incorporate
facilities that offer opportunities for physical activityinto their corporate land-use plans.
• Communicate to business leaders the benefits of physicalactivity for older workers, especially those that supportmanagement goals (e.g. cost-savings, reduced employeeabsenteeism).
Medical Systems Strategies• Identify community resources (e.g., YMCAs/YWCAs,
certified trainers, fitness clubs, etc.) that are qualitysources of information related to physical activity formidlife and older adults, and share this informationthrough medical settings.
Policy/Advocacy Strategies• Channel tools and funds to communities so they can
implement actions to increase physical activity amongresidents age 50 and older.
• Provide funding to community organizations to makephysical activity opportunities more readily accessibleand available to low-income populations.
PROGRAMS THAT WORKAs part of the Blueprint project, a variety of national-levelactivities have been initiated to identify programs thatsuccessfully increase seniors’ levels of physical activity.For example, in 2002, the National Council on theAging’s (NCOA) Center for Healthy Aging, with supportfrom the Robert Wood Johnson Foundation, conducted anational competition to identify best practices in physicalactivity programming. After a thorough review, 10 pro-grams were awarded $1,000 and a certificate of achieve-ment. For more information on this project, please visitwww.healthyagingprograms.org.
1. Lifetime Fitness ProgramOne of the 10 programs selected by NCOA was theSeattle/King County, WA-based Lifetime FitnessProgram. This evidence-based physical activity programprovides seniors with low-cost fitness classes taught bycertified fitness instructors. The one-hour classes meetthree times per week in ongoing, five-week sessions. Theclasses include strength training with wrist and ankleweights, as well as aerobics, stretching, and balancingexercises. The program is designed to be safe and effectivefor seniors with a wide range of physical abilities. This
program began as a partnership between Senior Services ofSeattle/King County, Group Health Cooperative of PugetSound, and the University of Washington Health PromotionResearch Center, but now is being replicated in sites acrossthe U.S. Studies have shown a marked improvement inparticipants’ physical and social functioning, as well as adecline in areas such as pain, fatigue and depression.10
For information on this program, visit their website:www.seniorservices.org/wellness/replication.htm.
2. PACE: People with Arthritis Can ExercisePACE is an exercise program that was developed by theArthritis Foundation specifically for people with arthritis.It uses gentle activities to help increase joint flexibility andrange of motion to maintain muscle strength. Two levelsof PACE, basic and advanced, are available to address thevarying levels of fitness and limitation among those witharthritis. PACE participants have experienced such benefits as increased functional ability, increased self-carebehaviors, decreased pain and decreased depression.11
Trained leaders are required to implement thiscourse. For help in identifying trained leaders in yourarea or for information on how to become a trainedleader, contact the Arthritis Program Director at thestate health department or the state/local ArthritisFoundation Chapter. (For a listing of directors by state,visit www.chronicdisease.org/NEW/cdd_members.htm.For a listing of chapters, visit www.arthritis.org.)
3. Exercise: A Guide from the National Institute on AgingThe National Institute on Aging has developed a manualand companion video that guides older adults throughsafe and effective endurance, strength training, balanceand flexibility exercises. The program can be completedon an individual basis or in a group setting. The 80-pagemanual is available online for free, or may be orderedalong with the video for a cost of $7.00. The video features Margaret Richard, star of PBS’ exercise showBody Electric. A Spanish language version is also available. For more information, visit www.nia.nih.gov/exercisebook/index.htm.
Selected Additional ResourcesFor additional information on the importance of physicalactivity and programs for older adults, please refer to thefollowing internet-based resources:
AARP Get Movin’ at 50 Pluswww.aarp.org/learn/course/Articles/a2003-06-13-keepactivedescription.html
Administration on Aging’s You Can! Programwww.aoa.gov/youcan/
American Association for Active Lifestyles and Fitness(AAALF) Training and Encouraging Senior Activity (TESA)Projectwww.aahperd.org/aaalf/template.cfm?template=tesa.html
American Society on Aging/CDC Media Backgrounder onPhysical Activitywww.asaging.org/media/pressrelease.cfm?id=40
Arthritis Foundation PACE Programwww.arthritis.org/events/getinvolved/ProgramsServices/PACE.asp
Boston University Strong For Life Programwww.bu.edu/roybal/products/life.html
CDC Division of Nutrition and Physical Activity GrowingStronger Program www.cdc.gov/nccdphp/dnpa/physical/growing_stronger/index.htm
CHAMPS: Community Healthy Activities Model Programfor Seniorswww.ucsf.edu/champs/
Healthier U.S.www.healthierUS.gov
Lifetime Fitness Programwww.seniorservices.org/wellness/replication.htm
National Blueprint: Increasing Physical Activity AmongAdults Age 50 and Olderwww.agingblueprint.org
NCOA Best Practices in Physical Activity Programmingwww.healthyagingprograms.org
NIA Exercise Guide for Older Adultswww.nia.nih.gov/exercisebook/index.htm
Silver Sneakers Programwww.silversneakers.com
Texas Department on Aging’s Texercise Programwww.texercise.com
Chronic Disease Directors Associationwww.chronicdisease.org
25

26
References
1. National Blueprint on Physical Activity Among Adults Age 50 and Older. Princeton, NJ: Robert Wood Johnson Foundation; 2001. 2. U.S. Department of Health and Human Services. Physical Activity and Health: A Report of the Surgeon General. Atlanta, GA: U.S.
Department of Health and Human Services, Centers for Disease Control and Prevention, National Center for Chronic DiseasesPrevention and Health Promotion; 1996.
3. American Geriatrics Society, British Geriatrics Society, American Academy of Orthopedic Surgeons Panel on Falls Prevention.Guideline for the prevention of falls in older persons. Journal of the American Geriatrics Society 2001;49:664-672.
4. U.S. Department of Health and Human Services. Mental Health: A Report of the Surgeon General. Rockville, MD: U.S. Department ofHealth and Human Services, Substance Abuse and Mental Health Services Administration, Center for Mental Health Services,National Institutes of Health, National Institute of Mental Health,1999.
5. Colcombe S, Kramer AF. Fitness effects on the cognitive function of older adults: A meta-analytic study. Psychological Science (InPress).
6. Kramer, A.F., Colcombe S., Erickson, K., Belopolsky, A., McAuley, E., Cohen, N.J., Webb A., Jerome, G.J., Marquex, D.X., & Wszalek,T.M. (2002)., Effects of Aerobic Fitness Training on Human Cortical Functioning. Journal of Molecular Neuroscience, 19, 227-231.
7. Agency for Healthcare Research and Quality, Centers for Disease Control and Prevention. Physical Activity and Older Americans:Benefits and Strategies. June 2002. http://www.ahrq.gov/ppip/activity.htm. Accessed April 26, 2004.
8. Pratt M, Macera CA, Wang G. Higher direct medical costs associated with physical inactivity. The Physician and Sportsmedicine2000;28(10):63-70.
9. Strategic Priorities for Increasing Physical Activity Among Adults Age 50 and Over: The National Blueprint Consensus ConferenceSummary Report. Princeton, NJ: Robert Wood Johnson Foundation; 2002.
10. Wallace, J. I. et al. Implementation and effectiveness of a community-based health promotion program for older adults. Journal ofGerontology: Medical Sciences 1998;53a(4): M301-M306.
11. Brady TJ, Kruger J, Helmick CG, Callahan LF, Boutaugh ML. Intervention programs for arthritis and other rheumatic diseases. HealthEducation and Behavior. 2003;30(1):44-63.

27
The Graying of AmericaStarting in 2012, nearly 10,000 Americans will turn 65every day. The total number of Americans over age 65 andeligible for Medicare will double to over 70 million withinthis generation, while the population over age 85 willincrease nearly five-fold, to almost 19 million, by mid-century. Obviously, the “baby boom” will soon becomethe “senior boom.”
The aging of America, however, is more than a simplematter of numbers. As noted in the 2002 State of Aging & Health in America and other sources, older adults usemore health care services than any other age group.Americans over age 65 today are only 13% of the population, but account for half of physicians’ visits andhalf of all hospital stays. The average 75 year old has threechronic conditions and uses five different prescriptiondrugs. Older patients also have unique health challengesand different medical needs than younger adults.
Health Care Workforce: A Growing NeedUnfortunately, there is often a gap between what manyhealth care providers know, and what they need to know,to optimally treat older patients. For example, a 2002
Merck Institute of Aging & Health (MIAH) survey of 250practicing primary care physicians found that only halfbelieve their colleagues can adequately treat even commongeriatric problems.
Only a small proportion of practicing health careproviders have had any formal training in geriatrics. Outof 650,000 practicing physicians in the U.S., less than9,000 are geriatricians, or about 2.5 geriatricians per10,000 elderly, and that number is expected to fall toabout 6,000 in the near future. Fewer than 3% of currentmedical students take any elective geriatric courses.Additionally, only 720 pharmacists, out of 200,000, havegeriatric certification. A 1997 survey of 600 nursing baccalaureate programs showed than only 23% of schoolsrequired a single course in geriatrics, and less than one-half of one percent of nurses have advanced certificationin geriatrics. Among social workers, only 5% identify theirprimary practice area as geriatrics.
The shortage of qualified providers is only part of thestory. Too few geriatric specialists exist to train others.The majority of educational curricula, including nursing,pharmacy, medicine and dentistry, do not require geriatric training. Only 600 medical school faculty, out of 100,000, list geriatrics as their primary specialty.Geriatricians compromise only one-half of one percent of
By 2030, 20% of all Americans will be age 65 or older. Unfortunately, America’s health care work-force is unprepared for the coming senior boom. There are too few health care providers specifi-cally trained in geriatrics; moreover, there is a gap between what many primary care providersknow, and what they need to know, to optimally treat older patients. Addressing this problemrequires immediate attention and action at the national level.
Our Nation’s Health Care Workforce:Is it Ready for the Graying of America?
28
all medical educators in the U.S., which represents thelargest educational training gap in any field. Additionally,60% of nursing schools have no geriatric faculty.
Despite these numbers, there are a few encouragingrecent trends. In family medicine, 92% of all residencyprograms in 2002 reported geriatrics as part of theirrequired curriculum. Many medical schools now havedepartments or divisions of geriatrics within departmentsof family medicine or internal medicine. All medicalschools also currently have a contact person for geriatricmedicine.
Even with these somewhat encouraging statistics, thecurrent Medicare system, with low reimbursement ratesfor geriatric primary care, may discourage young physiciansfrom entering the field; these doctors are choosing more
lucrative, procedure-driven specialties. Also, manyphysicians still see geriatrics as something “extra” not“essential,” despite the demographic imperative.
Overall, the healthcare workforce lacks the training toprovide appropriate care at the present time, and it iswholly unprepared for the graying of America. Despiteefforts to improve the situation, there is still an immediateand continuing crisis. Demographic trends and an everexpanding geriatric knowledge base demand not onlyattention but immediate action.
Given the urgency, many individuals and organizations,both public and private, have been working for years tofund geriatric research, training, and education, and toensure geriatric training for all health care professionals.

CALL TO ACTION: PREPARING OUR HEALTH CAREWORK FORCE FOR AN AGING SOCIETYIn April 2003, many of the leaders in the field of geriatricsmet in Washington, DC to discuss and recommend solutions to the shortage of healthcare workers specificallytrained in geriatrics. This landmark conference*, Bridgingthe Workforce Gap for our Aging Society, was sponsored byMIAH, the Department of Veterans Affairs (VA), theNational Institute on Aging (NIA), and the HealthResources and Services Administration (HRSA).
The following recommendations were largely providedand suggested by the conference participants. They areprimarily targeted to practicing primary care physicians,because studies have shown they are usually the first lineof treatment for older adults. These recommendationsshould be considered a viable national blueprint for helping older adults in the U.S. enjoy optimal health care.
1. Increase Funding for TrainingFederal funding for geriatric research is over 50 times thatprovided for geriatric training. Geriatric research cannothelp a single person unless it is translated into practice.
2. New Research Must be IncorporatedResearch that leads to advances in the prevention andtreatment of debilitating diseases must be incorporatedinto practice quickly. Federal agencies should participatein and encourage timely dissemination of new researchfindings into clinical practice.
3. New Practices for Achieving Widespread ChangeMust be AdoptedMedicare performance measurement systems must thoroughly audit both quality of geriatric care and the useof evidence-based best practices. They must also createincentives, such as additional provider reimbursements,for improvements in the quality of geriatric care. We also need new structures and systems to measure the effectiveness of local and individual approaches to changingprovider behavior, and therefore improving geriatric care.
4. Professional Organizations Must Help Affect ChangeOrganizations currently involved in evidence-based education need to coordinate their efforts. Credentialingorganizations need to offer professional development programs for practitioners.
5. New People Must be Recruited to GeriatricsProviding incentives, such as loan repayment, couldencourage more health professional students to choose
geriatrics. Additionally, the paradigm of aging as beingsynonymous with “old and sick” must be changed; thiscould help attract practitioners to geriatric fields. Mediacampaigns could be utilized to create a more positive picture of aging.
6. The Skills of Community Practitioners Must be EnhancedGeriatric information resources must be developed thataddress specific geriatric syndromes and conditions, andtherefore, provide convenient access to specialized information for health care providers. A broad coalition of geriatric advocates must advance a national agenda thatstresses geriatric professional development and qualityimprovement that is linked to certification and higherMedicare reimbursement.
7. Interest in Geriatrics Must be Developed acrossClinical DisciplinesGeriatric specialists must work to build bridges withother disciplines, helping to foster interdisciplinaryapproaches as well as increasing knowledge of best-practice geriatrics care.
8. Geriatric Education in Health Care Must beIncreased at All LevelsMedical schools must initiate exposure to geriatrics byrequiring geriatric education. Residency programs mustalso do more to incorporate geriatrics into training.
* Conference coordinators: Patricia P. Barry, MD, MPH (MIAH);Marsha Goodwin-Beck, RN, MA, MSN (VA); Judith Salerno, MD,MS (NIA); and Joan Weiss, PhD, RN, CRNP (HRSA).
Conference participants: Robert Roswell, MD (VA); GreggWarshaw, MD (University of Cincinnati); Terry Fulmer, PhD, RN(New York University); William J. Hall, MD (University ofRochester); Dan Perry (Alliance for Aging Research); RichardHodes, MD (NIA); Robert Butler, MD (International LongevityCenter); Jerry C. Johnson, MD (American Geriatrics Society);Carol Shultz (Gerontological Society of America); Capt. KerryNesseler, OPHS, RN, MS (HRSA).
29


31
State Examples
Kansas ElderCount: County, AAA,and State-Level Data Available forActionKansas ElderCount is a collection of three geographiclevels of data: county, area agency on aging, and state.The purpose of the data is to describe the well-being ofolder adults in Kansas. These data were collected toenhance public policy, program planning and generalunderstanding of the health and socioeconomic status ofolder adults. Data were collected at the county levelbecause the smaller the geography, the more useful thedata for policy and planning purposes. Older populationsin urban and rural counties in Kansas are very different,and reporting state-level data would only mask theseimportant differences.
Staff at the Center on Aging worked with a 32-personstatewide advisory committee to identify and locate thebest indicators and secure county-level data for the year2000. Data are also presented for the 11 area agencieson aging in Kansas. The 36 indicators are grouped intofive categories: population, economics, health, communityliving and nursing homes. The number and percentageof adults in the county and state are reported for eachindicator. Counties are grouped into quintiles to illustratehow each county compares with the other 104 counties inthe state on each indicator.
Kansas State Senator Sandy Praeger secured fundingfrom the Kansas Health Foundation and the MilbankMemorial Fund to produce this 172-page booklet in2002, which is also available on the Internet atwww2.kumc.edu/coa/eldercount. Having a State Senatorchampion this project opened many doors of cooperation.Other project partners included the Kansas Departmenton Aging, the Kansas Task Force on Long Term CareServices and the Center on Aging at the University ofKansas Medical Center.
Kansas was unable to obtain county-level data on all of the indicators that it would have liked to include. Inparticular, data were not available on abuse, neglect andexploitation of older adults; projections of growth of thepopulation aged 65 years and older; and data describingthe differences between the number of people receiving community-based services and the number needing them.
Kansas hopes to fill in many of these data gaps when thebook is eventually updated. In the meantime, this reportprovides vital data for public policy and planning decisionsto prepare for the growth in the elder population inKansas, as in other states, in the coming decades.
Maine Elder Women’s HealthIndicator Framework In the spring of 2001, the Maine Bureau of Health(BOH) received a small grant from the Health Resourceand Services Administration’s Office on Women’s Health,Region 1. The goals of the project were:
• To develop a set of indicators for monitoring thehealth status of Maine’s elder women
• To identify data sources for these indicators and togather baseline data
• To identify opportunities for collaboration betweenBOH and the Bureau of Elder and Adult Services
• To formulate recommendations for programs and policies to improve the health status of Maine’s elderwomen
This project culminated with the report Assessing andMonitoring the Health Status of Maine’s Elder Women: theElder Women’s Health Indicators Project. It is a startingpoint, or place to begin the process of systematicallyassessing and monitoring elder women’s health so thatinterventions can be targeted, improvements can bemeasured and policies can be formulated to ensurefocused approach to improving the health of Maine’selder women.
The framework for and content of this report weredesigned for state policy makers and decision makers andprofessionals in public health and elder services as well asa general audience. The intent was to keep the frame-work as user-friendly as possible and to use language thatwould communicate to the general public but to be specific enough to remain useful to public health andsocial service professionals. The state-level data usedthroughout the report come primarily from the MaineDepartment of Human Services, Bureau of Health, Office
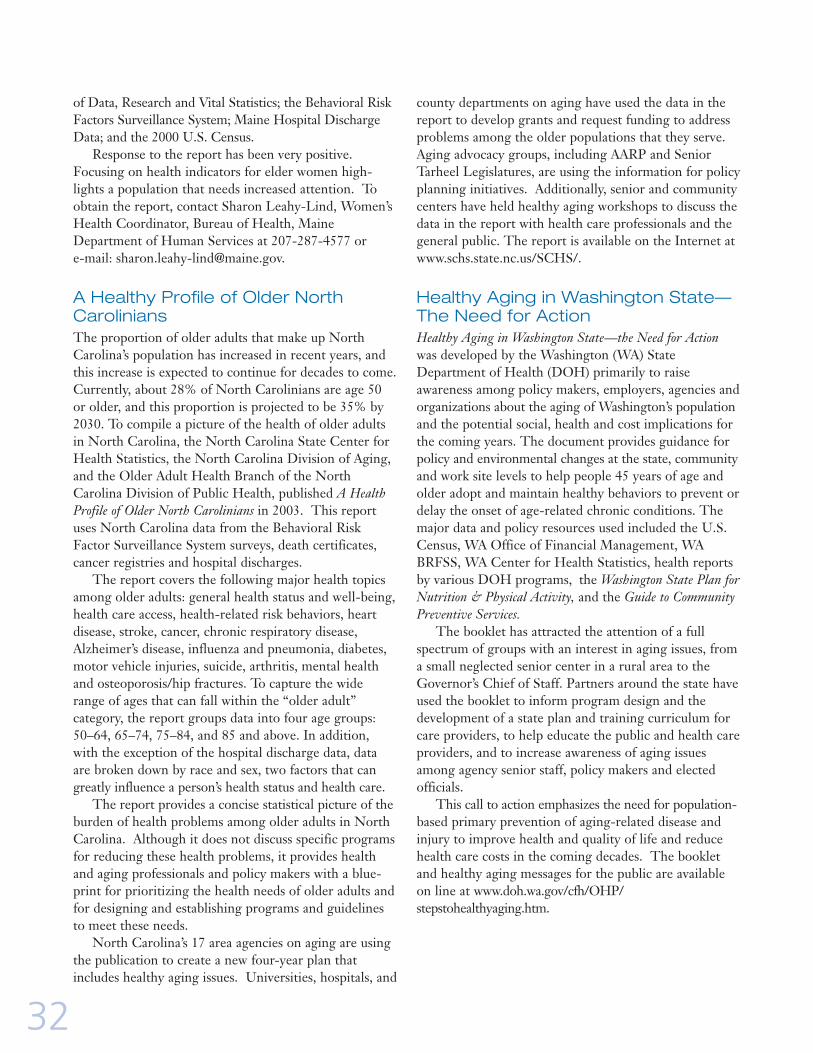
32
of Data, Research and Vital Statistics; the Behavioral RiskFactors Surveillance System; Maine Hospital DischargeData; and the 2000 U.S. Census.
Response to the report has been very positive.Focusing on health indicators for elder women high-lights a population that needs increased attention. Toobtain the report, contact Sharon Leahy-Lind, Women’sHealth Coordinator, Bureau of Health, MaineDepartment of Human Services at 207-287-4577 or e-mail: [email protected].
A Healthy Profile of Older NorthCaroliniansThe proportion of older adults that make up NorthCarolina’s population has increased in recent years, andthis increase is expected to continue for decades to come.Currently, about 28% of North Carolinians are age 50or older, and this proportion is projected to be 35% by2030. To compile a picture of the health of older adultsin North Carolina, the North Carolina State Center forHealth Statistics, the North Carolina Division of Aging,and the Older Adult Health Branch of the NorthCarolina Division of Public Health, published A HealthProfile of Older North Carolinians in 2003. This reportuses North Carolina data from the Behavioral RiskFactor Surveillance System surveys, death certificates,cancer registries and hospital discharges.
The report covers the following major health topicsamong older adults: general health status and well-being,health care access, health-related risk behaviors, heartdisease, stroke, cancer, chronic respiratory disease,Alzheimer’s disease, influenza and pneumonia, diabetes,motor vehicle injuries, suicide, arthritis, mental healthand osteoporosis/hip fractures. To capture the widerange of ages that can fall within the “older adult” category, the report groups data into four age groups:50–64, 65–74, 75–84, and 85 and above. In addition,with the exception of the hospital discharge data, dataare broken down by race and sex, two factors that cangreatly influence a person’s health status and health care.
The report provides a concise statistical picture of theburden of health problems among older adults in NorthCarolina. Although it does not discuss specific programsfor reducing these health problems, it provides healthand aging professionals and policy makers with a blue-print for prioritizing the health needs of older adults andfor designing and establishing programs and guidelinesto meet these needs.
North Carolina’s 17 area agencies on aging are usingthe publication to create a new four-year plan thatincludes healthy aging issues. Universities, hospitals, and
county departments on aging have used the data in thereport to develop grants and request funding to addressproblems among the older populations that they serve.Aging advocacy groups, including AARP and SeniorTarheel Legislatures, are using the information for policyplanning initiatives. Additionally, senior and communitycenters have held healthy aging workshops to discuss thedata in the report with health care professionals and thegeneral public. The report is available on the Internet atwww.schs.state.nc.us/SCHS/.
Healthy Aging in Washington State—The Need for ActionHealthy Aging in Washington State—the Need for Actionwas developed by the Washington (WA) StateDepartment of Health (DOH) primarily to raise awareness among policy makers, employers, agencies andorganizations about the aging of Washington’s populationand the potential social, health and cost implications forthe coming years. The document provides guidance forpolicy and environmental changes at the state, communityand work site levels to help people 45 years of age andolder adopt and maintain healthy behaviors to prevent ordelay the onset of age-related chronic conditions. Themajor data and policy resources used included the U.S.Census, WA Office of Financial Management, WABRFSS, WA Center for Health Statistics, health reportsby various DOH programs, the Washington State Plan forNutrition & Physical Activity, and the Guide to CommunityPreventive Services.
The booklet has attracted the attention of a full spectrum of groups with an interest in aging issues, froma small neglected senior center in a rural area to theGovernor’s Chief of Staff. Partners around the state haveused the booklet to inform program design and thedevelopment of a state plan and training curriculum forcare providers, to help educate the public and health careproviders, and to increase awareness of aging issuesamong agency senior staff, policy makers and electedofficials.
This call to action emphasizes the need for population-based primary prevention of aging-related disease andinjury to improve health and quality of life and reducehealth care costs in the coming decades. The bookletand healthy aging messages for the public are availableon line at www.doh.wa.gov/cfh/OHP/stepstohealthyaging.htm.


35
Appendix
Major Data Sources and TechnicalInformationCDC’s Behavioral Risk Factor Surveillance System
For the past two decades, CDC’s Behavioral Risk FactorSurveillance System (BRFSS) has helped states surveyU.S. adults to learn about the wide range of personalbehaviors that affect their health. The BRFSS hasfocused primarily on four behaviors: physical activity,nutrition, tobacco use, and the use of proven preventive services (such as cancer screenings), all of which have atremendous impact on the rates of the nation’s leadingkillers. The BRFSS describes these personal healthbehaviors in terms of how common they are, whetherthey are increasing over time, and which populationsmight be most at risk. The information gatheredthrough this state-based telephone survey system isessential to national, state, and local public health agencies as they monitor the need for and the effectiveness of various public health interventions.
While the BRFSS is one of the most useful tools forassessing the health of the older adult population, it hasat least three limitations. First, BRFSS excludes peoplewho don’t have land line telephones or are in institutions(e.g. nursing homes). Second, people who are severelyimpaired may not be adequately represented because ofthe functional capacity required to participate in thesurvey. Third, the data included in the BRFSS are allself-reported and therefore have not been confirmed by a health care provider.
The BRFSS is administered and supported by theDivision of Adult and Community Health, NationalCenter for Chronic Disease Prevention and HealthPromotion, CDC. For more information, please visitwww.cdc.gov/brfss.
CDC’s National Hospital Discharge Survey
The National Hospital Discharge Survey (NHDS),which has been conducted annually since 1965, is anational probability survey designed to meet the need forinformation on characteristics of inpatients dischargedfrom non-Federal, short-stay hospitals in the UnitedStates. The NHDS collects data from approximately
270,000 inpatient records acquired from a nationalsample of about 500 hospitals. Only hospitals with anaverage length of stay of fewer than 30 days for allpatients, general hospitals and children’s general hospitalsare included in the survey. The survey excludes federal,military, and Department of Veterans Affairs hospitals, as well as hospital units of institutions (such as prisonhospitals) and hospitals with fewer than six beds staffedfor patient use.
The NHDS is administered and supported by theHospital Care Statistics Branch, National Center forHealth Statistics, CDC. Data are disseminated annuallythrough published documents, public-use data tapes, data diskettes, CD-ROMs, and downloadable files. Formore information, please visitwww.cdc.gov/nchs/about/major/hdasd/nhds.htm.
CDC’s Data Warehouse on Trends in Health and AgingWith support from the National Institute on Aging,CDC’s National Center for Health Statistics (NCHS)has created the Data Warehouse on Trends in Healthand Aging, a Web-based, user-friendly tool that providesaccess to up-to-date information on the health of olderAmericans. This system is designed to show trends inhealth–related behaviors, health status, health care useand health care costs among older adults. A data dissem-ination tool called Beyond 20/20® is used to retrieve anddisplay customized tables of health information on oldermen and women of various ages, races, and ethnicities.
For more information, please visitwww.cdc.gov/nchs/agingact.htm.
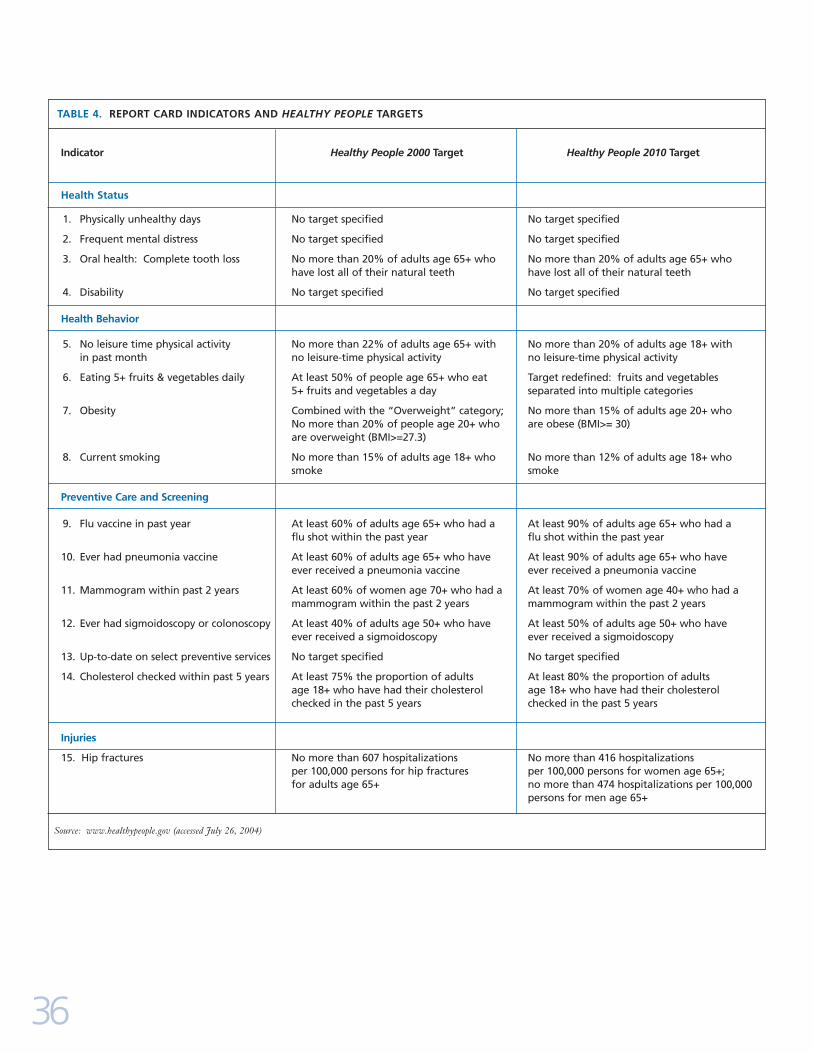
36
Indicator Healthy People 2000 Target Healthy People 2010 Target
Health Status
1. Physically unhealthy days No target specified No target specified
2. Frequent mental distress No target specified No target specified
3. Oral health: Complete tooth loss No more than 20% of adults age 65+ who No more than 20% of adults age 65+ who have lost all of their natural teeth have lost all of their natural teeth
4. Disability No target specified No target specified
Health Behavior
5. No leisure time physical activity No more than 22% of adults age 65+ with No more than 20% of adults age 18+ with in past month no leisure-time physical activity no leisure-time physical activity
6. Eating 5+ fruits & vegetables daily At least 50% of people age 65+ who eat Target redefined: fruits and vegetables 5+ fruits and vegetables a day separated into multiple categories
7. Obesity Combined with the “Overweight” category; No more than 15% of adults age 20+ whoNo more than 20% of people age 20+ who are obese (BMI>= 30)are overweight (BMI>=27.3)
8. Current smoking No more than 15% of adults age 18+ who No more than 12% of adults age 18+ who smoke smoke
Preventive Care and Screening
9. Flu vaccine in past year At least 60% of adults age 65+ who had a At least 90% of adults age 65+ who had a flu shot within the past year flu shot within the past year
10. Ever had pneumonia vaccine At least 60% of adults age 65+ who have At least 90% of adults age 65+ who have ever received a pneumonia vaccine ever received a pneumonia vaccine
11. Mammogram within past 2 years At least 60% of women age 70+ who had a At least 70% of women age 40+ who had a mammogram within the past 2 years mammogram within the past 2 years
12. Ever had sigmoidoscopy or colonoscopy At least 40% of adults age 50+ who have At least 50% of adults age 50+ who have ever received a sigmoidoscopy ever received a sigmoidoscopy
13. Up-to-date on select preventive services No target specified No target specified
14. Cholesterol checked within past 5 years At least 75% the proportion of adults At least 80% the proportion of adults age 18+ who have had their cholesterol age 18+ who have had their cholesterol checked in the past 5 years checked in the past 5 years
Injuries
15. Hip fractures No more than 607 hospitalizations No more than 416 hospitalizations per 100,000 persons for hip fractures per 100,000 persons for women age 65+; for adults age 65+ no more than 474 hospitalizations per 100,000
persons for men age 65+
TABLE 4. REPORT CARD INDICATORS AND HEALTHY PEOPLE TARGETS
Source: www.healthypeople.gov (accessed July 26, 2004)

Margaret J. Moore, MPH
Public Health Advisor,
Centers for Disease Control and Prevention
Principal Writer
Project Co-Director
Phyllis Moir, MA
Technical Publications Writer/Editor,
Centers for Disease Control and Prevention
Principal Writer
Michele M. Patrick, MGA
Communications Director,
Merck Institute of Aging & Health
Project Co-Director
Members of Working GroupLynda A. Anderson, PhD
Acting Chief, Health Care and Aging Studies Branch,
Centers for Disease Control and Prevention
Greg O’Neill, PhD
Director, National Academy on an Aging Society
Nancy Whitelaw, PhD
Vice-President, National Council on the Aging
Acknowledgements for State of Aging and Health Report, 2004

ContributorsJeanne Alongi, MPH
Bonita Lynn Beattie, MPT, MHA, PT
Laurence G. Branch, PhD
Mercedes Burn-Klug, MSW, MA
Sylvia E. Furner, MPH, PhD
Sharon Leahy-Lind, MPPM
Harold Lentzner, PhD
Christopher Maylahn, MPH
Ruth Palombo, PhD, MS, RD
Douglas Shenson, MD, MPH, MS
Betty H. Wiser, EdD
Continued...
Lina Balluz, MPH, ScD
Julie Bolen, PhD, MPH
David R. Brown, PhD
David Buchner, MD, MPH
John E. Crews, DPA
Deborah A. Galuska, PhD
Barbara F. Gooch, DMD, MPH
Kurt Greenlund, PhD
Andree C. Harris
Jennifer M. Hootman, PhD, ATC, FACSM
Susan Jernick, DPM, MPH
Rosemarie Kobau, MPH
Judy Kruger, PhD, MS
Jason E. Lang, MPH, MS
Yao-Hua Luo, PhD
Dolores Malvitz, DrPH
David G. Moriarty, BSEE
Louise Murphy
Wilmon Murphy
Suzanne M. Smith, MD, MPH, MPA
Joe Sniezek, MD, MPH
Judy A. Stevens, PhD
Carla P. White, MPH
Pascale Wortley, MD, MPH
Hatice Sahin Zahran, MD, MPH
CDC Foundation
Center for the Advancement of Health and
participants in the May 2004 Making Health
Count for Older Americans Summit
Centers for Disease Control and Prevention

2004 State of Aging and HealthAdvisory Board MembersDavid Baldridge, PhD
Director, American Association for International Aging
William F. Benson
Consultant
James P. LoGerfo, MD
Professor, Medicine and Health Services
Director, University of Washington Health Promotion Research
Center
Bob Meyers
President, National Press Foundation
Judith A. Salerno, MD, MS
Deputy Director, National Institute on Aging
www.cdc.gov/agingwww.miahonline.org