the state of aging and health in america 2007 state of aging and health in america 2007 the state of...
TRANSCRIPT

The State of Aging and
Health in America
2007

The State of Aging and Health in America 2007
The State of Aging and Health in America 2007 is the fi fth volume of a series that
presents a snapshot of the health and aging landscape in the United States and
other regions of the world. This series presents the most current information
and statistics, often specifi cally commissioned for the report, on the health of
older adults. The State of Aging and Health reports are supported by The Merck
Company Foundation and produced with various partner organizations that are
recognized as leaders in the aging fi eld.
Suggested Citation: Centers for Disease Control and Prevention and The Merck Company Foundation. The State of Aging and Health in America 2007. Whitehouse Station, NJ: The Merck Company Foundation; 2007.
Available at www.cdc.gov/aging and www.merck.com/cr An interactive version of The State of Aging and Health in America 2007 report is available online
at www.cdc.gov/aging
Forward | I
“Entirely supported by Merck & Co., Inc., The Merck Company Foundation
is a philanthropic organization that strives to enhance the health and
well-being of people around the world. As demonstrated by Merck’s
century-long commitment to the Merck Manuals, this includes getting
health information into the hands of everyone who needs it. The State of
Aging and Health in America 2007 is part of that effort. The report presents
information and recommendations to help older Americans live not just
longer but better lives. In terms of transforming the promise of active aging
into reality in America, this publication shows us where we are, where we
must go and, through its thoughtful calls to action, how to get there.”
– Steven B. Kelmar, President, The Merck Company Foundation
“ The aging of the U.S. population is one of the major public health
challenges we face in the 21st century. One of CDC’s highest priorities as
the nation’s health protection agency is to increase the number of older
adults who live longer, high-quality, productive, and independent lives.
The State of Aging and Health in America 2007 is an important tool for
supporting this goal. This report identifi es key older adult health issues,
assesses our success in addressing them, and provides suggestions and
resources for further action. CDC values its role as a contributor to this
report and looks forward to working with our partners to achieve better
health and quality of life for all older Americans.”
– Julie Louise Gerberding, MD, MPH, Director, Centers for Disease Control and Prevention,
U.S. Department of Health and Human Services
Forward
Executive Summary
Twentieth-century advances in protecting and promoting health among older
adults have given us many opportunities for overcoming the challenges of an
aging society. The health indicators presented in The State of Aging and Health
in America 2007 highlight these opportunities. By working to meet the goals for
each of these key indicators, our nation can help to ensure that all of its citizens
can look forward not just to living longer, but to living well.

By 2030,
There will be 71 million American older adults accounting for roughly 20% of the U.S. population.
The nation’s health care spending is projected to increase by 25% due to these demographic shifts.
Executive Summary | III
Th e State of Aging and Health in America 2007 provides a
snapshot of our nation’s progress in promoting the health
and well-being of older adults and reducing behaviors that
contribute to premature death and disability. Th e report
also highlights three key areas that can signifi cantly improve
the quality of life for older adults: reducing falls, maintaining
cognitive health, and improving end-of-life care.
Demographic changes create an urgent need
Improved medical care and prevention eff orts have contributed
to dramatic increases in life expectancy in the United States
over the past century. Th ey also have produced a major shift in
the leading causes of death for all age groups, including older
adults, from infectious diseases and acute illnesses to chronic
diseases and degenerative illnesses. Currently, about 80% of
older Americans are living with at least one chronic condition.
Th e growth in the number and proportion of older adults is
unprecedented in the history of the United States. Two factors
— longer life spans and aging baby boomers — will combine
to double the population of Americans aged 65 and older
during the next 25 years. By 2030, there will be 71 million
American older adults accounting for roughly 20% of the
U.S. population.
America’s older adult population also is becoming more
racially and ethnically diverse. At the same time, the health
status of racial and ethnic minorities lags far behind that of
non-minority populations. Th e burden of many chronic
diseases and conditions — especially high blood pressure,
diabetes and cancer — varies widely by race and ethnicity.
Data from the 2004 National Health Interview Survey
(NHIS) indicated that 39% of non-Hispanic white adults
aged 65 years or older reported very good or excellent
health, compared with 24% of non-Hispanic blacks and
29% of Hispanics.(5)
There is a strong economic incentive for action
Th e cost of providing health care for an older American is
three to fi ve times greater than the cost for someone younger
than 65. As a result, by 2030, the nation’s health care spending
is projected to increase by 25% due to these demographic shifts.
More than one-third of U.S. deaths are preventable
Th ree behaviors — smoking, poor diet, and physical inactivity
— were the root causes of almost 35% of U.S. deaths in
2000. Th ese behaviors are risk factors that often underlie the
development of the nation’s leading chronic disease killers:
heart disease, cancer, stroke, and diabetes.
Th e above statistics highlight the need to focus on improving
the health of older adults by encouraging them to adopt
healthier behaviors and obtain regular health screenings that
can reduce the risk for many chronic diseases, help decrease
health disparities, and lower health care costs.

IV | Executive Summary
The Report Cards
Th e National Report Card on Healthy Aging (page 9) reports on
15 indicators of older adult health, 11 of which are identifi ed
by the Healthy People 2010 initiative of the U.S. Department
of Health and Human Services. Th ose 15 indicators are grouped
into four areas: Health Status, Health Behaviors, Preventive
Care and Screening, and Injuries. Th e report also assigns a
“met” or “not met” grade (based on 2003 or 2004 data) to
those indicators with specifi c Healthy People 2010 targets.
Taken together, these indicators present a comprehensive
picture of older adult health in the United States.
The United States has met 4 of the 11 Healthy People 2010 targets — six years ahead of schedule . . .
• Mammograms within past two years (75% vs. goal of 70%)• Colorectal cancer screenings (63% vs. goal of 50%)• Cholesterol checked within the past fi ve years (90% vs. goal of 80%)• People currently smoking (9% vs. goal of 12%)
But has more room for improvement on the remaining Healthy People 2010 targets . . .
• Oral Health: Complete tooth loss (21% vs. goal of 20%)• No leisure time physical activity in past month (32% vs. goal of 20%)• Obesity (20% vs. goal of 15%)• Flu vaccine in past year (68% vs. goal of 90%)• Pneumonia vaccine (65% vs. goal of 90%)• Hip fracture hospitalizations per 100,000 persons (558 men/1113 women vs. goal of 474 men/416 women)• Eating at least fi ve fruits and vegetables daily (The 2010 nutrition target is segmented into multiple goals
for different fruits and vegetables, but the current national percentage of 29.8% is below all of the 2010 nutrition targets.)
Th e State-by-State Report Card on Healthy Aging (page 22)
ranks the 50 states and the District of Columbia (D.C.) for
each health indicator, and assigns each a grade according to its
performance relative to the other states. Hawaii, for example,
was most often ranked among the fi ve top performing states
(eight times), while Kentucky was most often ranked in the
bottom fi ve (nine times).
Variation among states can be signifi cant. For example,
Connecticut ranked fi rst in the oral health indicator, with
only 12.4% of older adults having lost all of their teeth,
while West Virginia ranked last in this category, with 42.9%
of older adults experiencing complete tooth loss.
The vast majority of states are well ahead of schedule on four health indicators . . .
• Mammograms 46 states and D.C. met the 2010 target • Colorectal cancer screenings 49 states and D.C. met the 2010 target • Cholesterol screenings 50 states and D.C. met the 2010 target • People currently smoking 46 states and D.C. met the 2010 target
Yet all states have more work to do on the other indicators . . .
• No leisure time physical activity in past month 0 states met the 2010 target• Flu vaccine in past year 0 states met the 2010 target • Pneumonia vaccine 0 states met the 2010 target • Eating fruit and vegetables daily 0 states met the 2010 target • Obesity 3 states met the 2010 target • Oral Health: complete tooth loss 21 states and D.C. met the 2010 target • Hip fracture hospitalizations per 100,000 persons No data for states available

Executive Summary | V
Opportunities for Enhancing Quality of Life
Th e State of Aging and Health in America 2007 report focuses
on several areas of concern that, if eff ectively addressed,
will signifi cantly improve the quality of life for older adults.
Preventing cognitive decline; Addressing end-of-life issues (page 5)
As more and more Americans reach the age of 65, society is
increasingly challenged to help them grow old with dignity
and comfort. Th e State of Aging and Health in America 2007
report identifi es the prevention of cognitive decline and
alleviation of end-of-life suff ering as key areas where the public
health arena can help make signifi cant improvements in
quality of life. Meeting these challenges is critical to ensuring
that baby boomers can look forward to their “golden years.”
Th e report states that through research and education about
cognitive health, and public education about end-of-life issues,
both challenges can be eff ectively addressed.
Reducing falls among older adults (page 26)
Falls are the leading cause of injury deaths and the most
common cause of injuries and hospital admissions for trauma
among adults aged 65 or older. Fall-related injuries cause
signifi cant mortality, disability, loss of independence, and
early admission to nursing homes. Fractures are among
the most prevalent fall injuries. Each year, 360,000–480,000
older adults sustain fall-related fractures. Fall-related injuries
also create a signifi cant fi nancial burden for the United States.
Research has shown that many falls can be prevented by
addressing personal risk factors (such as monitoring medications,
improving balance, and correcting vision problems) and
environmental risk factors (such as removing tripping hazards
and installing safety features such as handrails).
Innovative Approaches
Many states and communities have developed innovative
ways to ensure that key information on the health of older
adults is readily available to those who need it for planning
programs, setting priorities, and tracking trends. Th is report
highlights two such programs:
• Orange County, California’s Condition of Older Adults report series — a comprehensive, user-friendly snapshot
of the general health and well-being of the county’s
older residents.
• The Missouri Senior Report — a document that provides
county-level data and other information to help state
and local policy makers, service providers, and seniors
themselves plan for future needs.
» CALLS TO ACTION »
The State of Aging and Health in America 2007 report presents several Calls to Action intended to encourage individuals, professionals, and communities to take specifi c steps to improve the health and well-being of older adults. They include the following recommendations:
» Address health disparities among older adults, particularly in racial and ethnic minority populations. (page 3)
» Encourage people to communicate their wishes about end-of-life care. (page 6)
» Improve the oral health of older adults. (page 11)
» Increase physical activity among older adults by promoting environmental changes. (page 12)
» Increase adult immunizations, particularly in racial and ethnic minority populations. (page 15)
» Increase screening for colorectal cancer. (page 16)
» Prevent falls, a leading cause of hospitalization and injury deaths among older adults. (page 32)
The State of Aging and Health in America 2007 report highlights the need to maintain the progress made in several health indicators, while increasing efforts to meet the goals on other equally crucial health issues. The key to improving the health and quality of life for all older Americans, the report shows, will be collaboration between multiple and diverse groups on the national, state and local levels, including members of the public, health care providers, government agencies and community groups.


Table of Contents | 1
Table of Contents
An Introduction to the Health of Older Americans ..................................................... 2
» CALL TO ACTION » Addressing health disparities among older adults .................. 3
Chronic Diseases .......................................................................................................... 4
New Opportunities for Public Health in Aging ............................................................ 5
» CALL TO ACTION » Communicating wishes about end-of-life ............................... 6
The National Report Card on Healthy Aging .............................................................. 8
» CALL TO ACTION » Improving the oral health of older Americans ...................... 11
» CALL TO ACTION » Encouraging physical activity by promoting changes to the physical environment .................................................. 12
» CALL TO ACTION » Increasing adult immunization in racial/ethnic minority populations .......................................................................... 15
» CALL TO ACTION » Increasing screening for colorectal cancer ........................... 16
The State-by-State Report Card on Healthy Aging ................................................. 20
Using Data for Action at the State and Local Levels ................................................ 25
Spotlight: Reducing Falls Among Older Adults ...................................................... 26
» CALL TO ACTION » Preventing falls ....................................................................... 32
Appendix ................................................................................................................... 34
Acknowledgements ........................................................................ Inside Back Cover

An Introduction to the Health of Older Americans
The U.S. Population Is Aging …
The current growth in the number and proportion of older adults living in the
United States is unprecedented in our nation’s history. Two factors — longer
lives and aging baby boomers — will double the population of Americans aged
65 or older during the next 25 years. Life expectancy in the U.S. has increased
from 47 years for Americans born in 1900 to 77 years for those born in 2001(1);
and baby boomers — those born between 1946 and 1964 — will begin to reach
age 65 in 2011. By 2030, the number of older Americans is expected to reach
71 million, or roughly 20% of the U.S. population.(2,3)

An Introduction to the Health of Older Americans | 3
… and Becoming More Racially and Ethnically Diverse
In 2003, 83% of older adults in the United States were
non-Hispanic white; 8% were non-Hispanic black; 6% were
Hispanic; and 3% were Asian. By 2030, the changing face
of older adults in the United States will be evident: only
72% of this population will be non-Hispanic white; 11%
will be Hispanic; 10% will be black; and 5% will be Asian
(Figure 1).(4)
» CALL TO ACTION »
Addressing Health Disparities Among Older Adults
An underlying theme of this report is the growing problem of racial and ethnic health disparities among older adults. Two factors continue to increase the urgency of this problem — the dramatic aging of the U.S. population and the growing proportion of racial and ethnic minority groups.
The health status of racial and ethnic minorities of all ages lags far behind that of non-minority populations. For a variety of reasons, older adults may experience the effects of health disparities more dramatically than any other population group. For one, older adults are more likely to have chronic illness and require frequent contact with the health care system. Also, many live in poverty, making access to health care a challenge. The care of older adults who are chronically ill, poor, and members of an ethnic community is an increasingly urgent health priority.
A major effort to help address these health disparities is the Racial and Ethnic Approaches to Community Health (REACH 2010) Program, which supports community-based coalitions in the design, implementation, and evaluation of innovative strategies to reduce or eliminate health disparities among racial and ethnic minorities. These groups include: African Americans; Hispanic Americans; American Indians; Alaska Natives; Asian Americans; and Pacifi c Islanders.
One example of a successful REACH 2010 Program is the Latino Education Project (LEP), in the Corpus Christi, Texas area, which targets midlife and older Latinos — a population that suffers disproportionately from diabetes and its complications. The need for assistance in these small, rural, and isolated communities is great. Approximately 80% to 95% of the residents are Hispanic; and almost 50% are aged 60 or older. The depressed economy and chronic unemployment rates that characterize these communities perpetuate poverty from generation to generation.
This area has been classifi ed as medically underserved for decades, and the high cost of health care, lack of access to health insurance, and limited community resources contribute signifi cantly to health disparities.
LEP Program activities focus on enabling and mobilizing key community institutions and organizations to respond to the diabetes crisis among midlife and older Hispanics. Community-wide health forums bring together health care providers, advocates, elected offi cials, radio, television and newspaper representatives, and local leaders to identify the best strategies for the prevention, early diagnosis, and management of diabetes. Small study circles allow for personalized attention, focusing on individual behavioral change through the selection of healthier foods, promoting and facilitating physical activity, and mobilizing informal support networks. Lay health educators (Promotores de Salud) use their leadership skills to assist communities and individual participants to access resources on their own. The educators provide case management that leads to healthier behaviors, better health, and improved management of diabetes. As a result of these activities, LEP participants have increased their levels of physical activity and consumption of water, fruits, and vegetables, as well as improved communication with their health care providers.
REACH 2010 Programs are fostering community commitment and active participation of seniors, stakeholders, and state and local offi cials — two key strategies for improving health and access to health care among older adult communities of color.
For more information about these programs, visit http://www.cdc.gov/reach2010.
FIGURE 1:
The U.S. Population aged 65 years or older is growing more diverse
Source: U.S. Census Bureau, 2004
0
10
20
30
40
50
60
70
80
90
100
83
72
61
8 10 12
3 58
1 2 36
11
Non-HispanicWhite
Black Asian All other races
Hispanic(any race)
18
2003PERCENTAGE 2030 2050

0 10 20 30 40 50 60 70 80
High Blood Pressure
Arthritis
Coronary HeartDisease
Any Cancer
Diabetes
Stroke
White, non-Hispanic Black, non-Hispanic Hispanic
PERCENT
45.068.4
49.7
42.653.4
48.6
14.317.4
21.9
8.811.2
22.7
21.924.5
14.9
8.09.6
8.6
4 | An Introduction to the Health of Older Americans
Chronic Diseases Are the Leading Causes of Death
Improved medical care and prevention eff orts have contributed
to dramatic increases in life expectancy in the United States
during the past century. However, they also have produced
a major shift in the leading causes of death for all age groups,
including older adults, from infectious diseases and acute
illnesses to chronic diseases and degenerative illnesses.(2) In
2002, the top three causes of death for U.S. adults aged 65
or older were heart disease (32% of all deaths), cancer (22%),
and stroke (8%). Th ese accounted for 61% of all deaths in
this age group (Figure 2).(5)
FIGURE 2:
Chronic diseases were the leading causes of death among U.S. adults aged 65 or older in 2002
Source: CDC, National Center for Health Statistics, National Vital Statistics System, 2006.
Behavioral Changes Could Improve Health
Th e tragedy of these leading killers — heart disease, cancer,
and stroke — is that they are often preventable. Although
the risk for disease and disability clearly increases with
advancing age, poor health is not an inevitable consequence
of aging. Th ree behaviors — smoking, poor diet, and physical
inactivity — were the root causes of almost 35% of U.S. deaths
in 2000.(6) Th ese behaviors often underlie the development
of the nation’s leading chronic disease killers: heart disease,
cancer, stroke, and diabetes. Adopting healthier behaviors,
such as engaging in regular physical activity, eating a healthy
diet, leading a tobacco-free lifestyle, and getting regular health
screenings (for example, mammograms and colonoscopies) can
dramatically reduce a person’s risk for most chronic diseases,
including the leading causes of death.(7)
Chronic Diseases Cause Pain and Disability and Increase Health Care Costs
Death is only part of the picture of the burden of chronic diseases
among older Americans. Th ese conditions can cause years of pain,
disability, and loss of function and independence before resulting
in death. Currently, at least 80% of older Americans are living
with at least one chronic condition, and 50% have at least two.(2)
In addition, the burden of many chronic diseases and conditions
— especially high blood pressure, diabetes, and cancer — varies
widely by race and ethnicity (Figure 3).
FIGURE 3:
Prevalence of chronic conditions among adults aged 65 years or older varied by race/ethnicity in 2002-2003
Source: CDC, National Center for Health Statistics, National Health Interview Survey, 2006.
0 5 10 15 20 25 30 35
Heart Disease
Cancer
Stroke
Chronic Lower Respiratory Diseases
Influenza & Pneumonia
Alzheimer’s Disease
Diabetes
All other causes
White, non-Hispanic Black, non-Hispanic Hispanic
PERCENT OF ALL DEATHS
32.432.031.8
21.022.7
21.5
7.48.3
7.9
3.93.4
6.4
3.52.7
3.3
2.22.0
3.4
6.35.0
2.6
23.323.9
23.1

An Introduction to the Health of Older Americans | 5
Th e nation’s health care costs, which are already high, also
will be aff ected by the increasing number of Americans aged
65 or older. Currently, more than two-thirds of health care
costs are for treating chronic illnesses; among older Americans,
almost 95% of health care expenditures is for chronic diseases.(9)
Th e cost of providing health care for one person aged 65 or
older is three to fi ve times greater than the cost for someone
younger than 65.(2) By 2030, health care spending will increase
by 25% largely because the population will be older, without
taking into account infl ation or the higher costs of new
technologies.(10) Medicare spending has grown about nine-
fold in the past two decades, from $37 billion in 1980 to
$336 billion in 2005.(11)
Th e large baby boomer population faces chronic health
issues that could increase the likelihood of functional
decline as this group ages. In 2003, 41.8% of adults aged
55–64 were told they had high blood pressure, and 56.6%
did not meet recommended guidelines for physical activity.
In 2004, 12.5% of adults in this age group were told they
had diabetes.(12) Th ese statistics highlight the need for
the nation’s public health community to focus more on
opportunities to prevent or delay disease and disability for
older adults and to stem rising health care costs.
Chronic Diseases Diminish Quality of Life for Older Adults
Among older adults, chronic diseases can lead to limitations
in daily activities and thus often reduce health-related quality
of life for seniors. Th e percentage of older U.S. adults who
report very good or excellent health decreases with age, and
the percentages are even lower for some minority populations.
Data from the 2004 National Health Interview Survey (NHIS)
indicated that 39% of non-Hispanic white adults aged 65
years or older reported very good or excellent health, compared
with 24% of non-Hispanic blacks and 29% of Hispanics.(5)
New Opportunities for Public Health in Aging
As more and more Americans reach the age of 65, society is
increasingly challenged to help them grow old with dignity
and comfort. Two key challenges that are new to the public
health arena — although they have long been the target of
health care and aging services professionals — are preventing
and treating cognitive decline and addressing end-of-life
issues. Meeting these challenges is critical to ensuring that
baby boomers can look forward to their later years.
Healthy Brain Initiative: A Public Health Roadmap to Maintaining Cognitive Health
Recent research is proving several myths about cognition
to be incorrect — notably, the beliefs that aging is a time of
irreversible mental decline and that dementia is universal and
inevitable.(13) As such, researchers and health professionals
have begun to focus on opportunities to maintain or possibly
improve cognitive health. Cognitive health means more than
just the absence of diseases of the brain. Cognitive health refers
to “a combination of mental processes we commonly think
of as ‘knowing’ and includes the ability to learn new things,
intuition, judgment, language, and remembering. At all ages,
having a clear and active mind is important, and is particularly
important for older adults because it can mean the diff erence
between dependence and independent living.”(14)
Opportunities to maintain cognitive health, and possibly
prevent cognitive decline, are growing as scientists gain a
Cognitive health is not static. When problems occur, they can range from mild cognitive impairment to severe dementia. Dementia is not a single disease but a collective term for numerous brain disorders that affect intellectual and social function and interfere with activities of daily living. In 2002, approximately 2.5 million Americans had a diagnosis of dementia. By 2030, the number of Americans with a confi rmed diagnosis of dementia is expected to more than double to 5.2 million (D.J. Thurman, MD, CDC, unpublished data, 2006).
Arthritis
One example of the far-reaching impact of chronic diseases is arthritis and other rheumatic conditions, which currently affect almost 43 million U.S. adults. Arthritis and related conditions are
associated with chronic pain and functional limitations and represent the leading cause of disability in the United States.(8) The aging of the U.S. population, in conjunction with the obesity epidemic, will only increase the impact of arthritis. The number of adults with arthritis is projected to increase to 67 million by 2030, and although 54% of this group will be aged 65 or older, working-age adults (45–64 years) also will be seriously affected, accounting for almost one-third of cases.(8)
better understanding of the factors that increase the risk of
developing cognitive impairment. Based on recent scientifi c
discussions, the following set of conditions and behaviors
are related to cognitive decline: high blood pressure; elevated
cholesterol; diabetes; overweight and obesity; smoking; and
physical inactivity.
Although current science linking cognitive decline and
dementia is not clear, the work on maintaining cognitive
function may hold future possibilities for preventing
dementias such as Alzheimer’s disease.
Major societal benefi ts from basic and clinical research
surrounding cognitive health will not be achieved unless
these fi ndings can be translated into real-world practice.
Promoting and protecting cognitive health require new
collaborations and investments to advance science and its
applications in this area. Th e public health community has
responded to this need with the following initial activities:
• Developing a national roadmap of recommendations
concerning public health opportunities to promote
and protect cognitive health. CDC and the Alzheimer’s
Association share leadership for the development of
the roadmap and, through this process, are fostering
critical partnerships with other federal, state, and local
organizations concerned with cognitive health.
• Supporting the Alzheimer’s Association as it expands
its focus to include the prevention of dementia and as
it develops new community-based programs to inform
special population groups about cognitive health.
• Assessing the public’s perceptions about cognition
and determining how best to inform the public about
cognitive health and associated risk factors for cognitive
decline through a national collaboration known as the
Healthy Aging Research Network of the Prevention
Research Centers.
Addressing End-of-Life Issues
Major advances in public health and medicine during the past
century have shifted the leading cause of death from infectious
disease to chronic disease, resulting in a longer lifespan. As a
result, most of us alive today will die at an advanced age following
a period of chronic illness. At the same time, with innovations
in medical technology and treatment, quality of life and of
dying have become increasingly important societal concerns.
While end-of-life issues have steadily gained recognition in the
health care system as an important area to address, the public
health community has only recently come to recognize this
as an area requiring its involvement.(15) End-of-life issues share
characteristics that are similar to other public health priorities,
namely a substantial burden (e.g., universal incidence), a major
impact on the individual and family members (e.g., eff ect
on caregiver health), fi nancial costs for individuals as well as
society, and the potential to prevent suff ering associated with
the dying process.
Th ere are substantial opportunities for public health professionals
to help in addressing end-of-life issues. Recent initiatives
involving diverse stakeholders have identifi ed a series of priorities
for the public health community regarding end-of-life issues.(16)
Based on this eff ort, the critical next steps include:
• Identifying end-of-life surveillance measures
• Educating the public health community about end-of-life issues
and public health’s role in improving end-of-life experiences
• Providing public education regarding end-of-life options,
such as hospice care, palliative care, and advance directives.
Communicating Wishes About End-Of-Life
Many people have considered whom they want to speak for them should they become unable to make health-related decisions for themselves. Unfortunately, this information is often unknown to family members and health care providers. Health care directives fi led with one’s will and other legal papers rarely fi nd their way into medical care settings, and family members are frequently called upon to make decisions on behalf of a loved one without having an understanding of his or her preferences. To avoid this situation, conversations about end-of-life decision-making should take place with family members and health care providers, preferably prior to the onset of a serious illness.
Having these conversations is the best way to protect one’s autonomy in many unpredictable situations. Such discussions also allow one to refl ect on his or her life and values and share this legacy with family and loved ones. Yet many fi nd it diffi cult to begin such discussions. To get started, several resources exist to help foster meaningful conversations and practical planning for end-of-life care. Caring Conversations™ is one such resource, offering workbooks (in English and Spanish) that include health care directives and a durable power of attorney for health care decisions.
6 | An Introduction to the Health of Older Americans
» CALL TO ACTION »
The free, downloadable workbooks can be obtained at: http://www.practicalbioethics.org/cpb.aspx?pgID=886.

An Introduction to the Health of Older Americans | 7
Our growing knowledge of critical factors that help to
protect and promote health has led to vast opportunities for
overcoming the health challenges facing the aging population.
Th e health indicators discussed in the following chapters point
the way to these opportunities, and how we will meet the
challenges of health disparities, widespread chronic disease,
and increasing health care costs. By working to meet the goals
for each of these key indicators, our nation can help to ensure
that all of its citizens can look forward not just to living longer,
but to living well.
Selected Additional Resources
Health Disparities
• American Medical Association, Eliminating Health Disparitieshttp://www.ama-assn.org/ama/pub/category/7639.html
• CDC, Offi ce of Minority Health and Health Disparitieshttp://www.cdc.gov/omh
• CDC, REACH 2010 Program http://www.cdc.gov/reach2010
• National Institutes of Health (NIH), National Center on Minority Health and Health Disparities http://ncmhd.nih.gov
• U.S. Department of Health and Human Services, Offi ce of Minority Healthhttp://www.omhrc.gov
Brain Health
• Alzheimer’s Associationhttp://www.alz.org
• AARP, Healthy Brainhttp://www.aarp.org/health/brain
• CDC, Healthy Aging Programhttp://www.cdc.gov/aging
• NIH, National Institute on Aging http://www.nia.nih.gov/Alzheimers
End-of-Life
• AARP, End-of-Life Resourceshttp://www.aarp.org/families/end_life
• Center for Practical Bioethics, Caring Conversations®
http://www.practicalbioethics.org/cpb.aspx?pgID=886
• Center for Practical Bioethics, Aging and End-of-Life Carehttp://www.practicalbioethics.org/cpb.aspx?pgID=885
• National Hospice and Palliative Care Organizationhttp://www.nhpco.org
• Robert Wood Johnson Foundation, A Record of Accomplishment in End-of-Life Carehttp://www.rwjf.org/newsroom/featureDetail.jsp?featureID=886&type=3
• Robert Wood Johnson Foundation, Means to a Better End: A Report on Dying in Americahttp://www.rwjf.org/fi les/publications/other/meansbetterend.pdf
References
1. Centers for Disease Control and Prevention. Health, United States, 2003. Hyattsville, MD: U.S. Department of Health and Human Services, National Center for Health Statistics; 2003.
2. Centers for Disease Control and Prevention. Public health and aging: trends in aging — United States and worldwide. Morbidity and Mortality Weekly Report 2003;52(06):101–106.
3. Wan H, Sengupta M, Velkoff VA, DeBarrow KA, U.S. Census Bureau. 65+ in the United States: 2005 (Current Population Reports). Washington DC: U.S. Government Printing Offi ce; 2005. Available at http://www.census.gov/prod/2006pubs/p23-209.pdf (accessed April 25, 2006).
4. National Institute on Aging. Dramatic changes in U.S. aging highlighted in new census [press release]. Bethesda, Maryland: National Institutes of Health; March 9, 2006.Available at www.nih.gov/news/pr/mar2006/nia-09.htm (accessed August 18, 2006).
5. Centers for Disease Control and Prevention. National Center for Health Statistics Data Warehouse. Trends in Health and Aging. Available at http://www.cdc.gov/nchs/agingact.htm (accessed June 5, 2006).
6. Mokdad AH, Marks JS, Stroup DF, Gerberding JL. Actual causes of death in the United States, 2000. JAMA 2004;291(10):1238–1245.
7. Blackman DK, Kamimoto LA, Smith SM. Overview: surveillance for selected public health indicators affecting older adults—United States. MMWR Surveillance Summaries 1999;48(No. SS-8):1– 6.
8. Hootman JM, Helmick CG. Projections of U.S. prevalence of arthritis and associated activity limitations. Arthritis and Rheumatism 2006;54(1):226–229.
9. Hoffman C, Rice D, Sung HY. Persons with chronic conditions: their prevalence and costs. JAMA 1996;276(18):1473–1479.
10. Agency for Healthcare Research and Quality, Centers for Disease Control and Prevention. Physical Activity and Older Americans: Benefi ts and Strategies. June 2002. Available at http://www.ahrq.gov/ppip/activity.htm (accessed May 21, 2006).
11. Medicare Payment Advisory Commission. A data book: healthcare spending and the Medicare program. June 2006. Section 1: National health care and Medicare spending. Available at http://www.medpac.gov (accessed August 13, 2006).
12. Centers for Disease Control and Prevention. Behavioral Risk Factor Surveillance System (Prevalence Data). Available at http://www.cdc.gov/brfss (accessed June 4, 2006).
13. Alzheimer’s Association Medical and Scientifi c Advisory Council. Alzheimer’s Association: 25 years of supporting science and shaping the Alzheimer’s research agenda. Alzheimer’s & Dementia: The Journal of the Alzheimer’s Association 2005;1(1):11-12.
14. Himes, C., Oettinger, E. N., Kenny, D.E. Aging in Stride: Plan ahead, stay connected, keep moving. Washington: Caresource Healthcare Communications, Inc., 2004.
15. Rao JK, Anderson LA, Smith SM. End of Life is a Public Health Issue. American Journal of Preventive Medicine 2002;23(3):215–220.
16. Rao JK, Alongi J, Anderson LA, Jenkins L, Stokes G, Kane M. Development of public health priorities for end-of-life initiatives. American Journal of Preventive Medicine 2005;29(5):453–460.

The National Report Card on Healthy Aging
This section reports on 15 indicators related to the health status of older adults,
health behaviors, preventive care and screening, and injuries. These indicators
were chosen because they are each modifi able and present a comprehensive
picture of older adult health. The report card in Table 1 shows the most current
data for the United States for each indicator. It also indicates whether the
national Healthy People 2010 target was met. A detailed description of each
indicator follows the report card.

* Data for Indicators 1–14 were collected by CDC’s Behavioral Risk Factor Surveillance System (BRFSS), and depict the median for the 50 states and the District of Columbia. Data for Indicator 15, hip fracture hospitalizations, are from CDC’s National Center for Health Statistics, National Hospital Discharge Survey. See Appendix for a full description of these data sources.
† Grade is based on attainment of Healthy People 2010 targets. See Appendix for a full description of Healthy People 2010.
‡ Indicators 1, 2, 4, and 13 are more recently developed measures and do not have Healthy People 2010 targets.
§ Frequent mental distress is defi ned as having had 14 or more mentally unhealthy days in the previous month. Data from the 2003 and 2004 BRFSS were combined in this report to achieve a suffi cient sample size.
Ð Disability was defi ned on the basis of an affi rmative response to either of the following two questions on the 2004 BRFSS: “Are you limited in any way in any activities because of physical, mental, or emotional problems?” or “Do you now have any health problem that requires you to use special equipment, such as a cane, a wheelchair, a special bed, or a special telephone?”
¶ Healthy People 2010 segments the nutrition target into multiple categories of fruits and vegetables. See Appendix for a full description.
# For men, three services are included: fl u vaccine in past year; ever had a pneumonia vaccine; and colorectal cancer screening. For women, these same three services are included, plus a mammogram within past two years.
The National Report Card on Healthy Aging | 9
Summary of Findings: • The United States has met targets for 4 of the 11 indicators in this report that are measured by Healthy People 2010: Current
smoking, mammogram within past two years, colorectal cancer screening, and cholesterol checked within past fi ve years.
IndicatorData for
Persons Aged 65 or Older*
Data YearHealthy People
2010 Target
Grade (met/not met
target)†
Health Status
1. Physically unhealthy days (mean number of days in past month)
5.5 2004 ‡ ‡
2. Frequent mental distress (%)§ 6.3 2003–2004 ‡ ‡
3. Oral health: Complete tooth loss (%) 21.3 2004 20 Not met
4. Disability (%)Ð 34.0 2004 ‡ ‡
Health Behaviors
5. No leisure time physical activity in past month (%)
31.9 2004 20 Not met
6. Eating ≥ 5 fruits and vegetables daily (%) 29.8 2003 ¶ ¶
7. Obesity (%) 20.2 2004 15 Not met
8. Current smoking (%) 9.3 2004 12 Met
Preventive Care and Screening
9. Flu vaccine in past year (%) 68.1 2004 90 Not met
10. Ever had pneumonia vaccine (%) 64.7 2004 90 Not met
11. Mammogram within past two years (%) 75.1 2004 70 Met
12. Colorectal cancer screening (%) 63.1 2004 50 Met
13. Up-to-date on selectedpreventive services (%)#
Men Women
38.431.6
20042004
‡‡
‡‡
14. Cholesterol checked within past fi ve years (%)
90.4 2003 80 Met
Injuries
15. Hip fracture hospitalizations (per 100,000 persons)
558 (men)1113 (women)
2004474 (men)
416 (women)Not met
TABLE 1
The National Report Card on Healthy Aging: How Healthy Are Older Adults in the United States?

INDICATOR 1: Physically unhealthy days
• CDC collects data on adults’ physically unhealthy days through the Behavioral Risk Factor
Surveillance System (BRFSS). Respondents were asked how many of the previous 30 days
they felt that their physical health (including physical illness and injury) was not good.
• Older adults suff er the highest rates of poor physical health and activity limitation,
according to 2004 BRFSS data.
• Racial and ethnic disparities have been reported through BRFSS in rates of physically
unhealthy days. In 2004, among adults aged 65 or older, the average number of physically
unhealthy days per month was 4.2 for Asians and Pacifi c Islanders; 5.5 for non-Hispanic
whites; 6.6 for Hispanics; and 6.8 for non-Hispanic blacks. Native Americans and Alaska
Natives had the highest level of physically unhealthy days at 7.4 per month.
INDICATOR 2: Frequent mental distress
• Th e BRFSS also assesses general mental health status. Respondents were asked to report how
many of the previous 30 days their mental health was not good because of stress, depression,
or problems with emotions. People who reported 14 or more days of poor mental health
were defi ned as having frequent mental distress (FMD). Th is defi nition uses a 14-day
minimum period because many health care providers and researchers use a similar duration
of mental distress as a marker for clinical depression and anxiety disorders.
• Th e prevalence of FMD varies among racial and ethnic groups. According to the 2004
BRFSS, among Americans aged 65 or older, the prevalence of FMD was lower among
non-Hispanic whites (5.9%) and Asians and Pacifi c Islanders (6.1%) compared with Native
Americans and Alaska Natives (8.4%), non-Hispanic blacks (9.8%), and Hispanics (11.2%).
INDICATOR 3: Oral health: Complete tooth loss
FIGURE 4:
Complete tooth loss declined among U.S. adults aged 65–74 during 1957–2002
Sources: U.S. Public Health Service, 1960, and CDC, National Center for Health Statistics, National Health and Nutrition Examination Surveys I, III, and 1999–2002, 1975, 1996, and 2005.
0
10
20
30
40
50
6055
46
29
24
1957-1958 1999-20021971-1974 1988-1994
PERCENT
YEAR
Healthy People 2010
target: 20%
• Th e percentage of older adults who have lost all their natural teeth has declined substantially
since the 1950s (Figure 4). Th is decline is the result of major improvements in the fi eld of
oral health, including community water fl uoridation; advanced dental technology; better
oral hygiene; and more frequent use of dental services.
• Periodontal (gum) diseases are associated with diabetes and possibly with cardiovascular disease
and stroke. Th ese and other oral health problems among older adults can lead to needless pain
and suff ering; diffi culty speaking, chewing, and swallowing; and loss of self-esteem.
10 | The National Report Card on Healthy Aging
Health Status Indicators

» CALL TO ACTION »
Improving the Oral Health of Older Americans
Oral health is integral to general health and well-being throughout one’s life. The oral health of older adults, however, is often neglected. Many older adults — especially those with low incomes or physical or cognitive limitations — are not able to maintain their oral health or visit a dentist. Medicare does not cover routine dental services; Medicaid coverage is limited and available in fewer than half the states.
Unmet oral health needs among older adults can be addressed only through the coordinated efforts of clinicians, public health professionals, the aging services network, and families. In the past, there has been little collaboration among these groups. CDC’s State-Based Examples of Network Innovation, Opportunity, and Replication (SENIOR) grant program includes an oral health component that is designed to identify unmet dental needs among older adults and promote partnerships and community strategies to address these needs.
For more information on the problem of poor oral health among older Americans, visit http://www.oralhealthamerica.org/OralHealthParity.html.
The National Report Card on Healthy Aging | 11
INDICATOR 4: Disability
Other promising approaches to improve the oral health of older adults include:
» State and local efforts to ensure that community drinking water has optimal fl uoride content.
» Health communication campaigns to increase public awareness of the importance of oral health and the benefi ts of fl uoride.
» Expanded partnerships among clinical and public health professionals and the aging services network to increase the likelihood that older adults with limited resources and functional abilities receive dental services.
» Development of innovative and effective strategies to prevent and treat dental disease.(1,2,3)
FIGURE 5:
Prevalence of risk factors and health behaviors varies by disability status among adults aged 65 or older
Source: CDC, Behavioral Risk Factor Surveillance System, 2001–2003.
0
10
20
30
40
50
60
70
80
42
26
17
28
65
71
59
69
PhysicallyActive
ReceivedPneumonia
Vaccine
Obese ReceivedInfluenzaVaccine
PERCENT Older adults without disabilities Older adults with disabilities
• In this report, disability is defi ned as an affi rmative response to either of the following two
BRFSS questions: “Are you limited in any way in any activities because of physical, mental, or
emotional problems?” or “Do you now have any health problem that requires you to use
special equipment, such as a cane, a wheelchair, a special bed, or a special telephone?”
• According to 2001–2003 BRFSS data, older adults with disabilities are less likely to be
physically active and more likely to be obese. However, they are more likely than those
without disabilities to have received an infl uenza or pneumococcal vaccine (Figure 5).

FIGURE 6:
Prevalence of no leisure-time physical activity increases as Americans age
Source: CDC, Behavioral Risk Factor Surveillance System, 2004.
0
5
10
15
20
25
30
35
40
19
22
25
28
36
18-29 75+30-44 65-7445-64
PERCENT
AGE GROUP
Healthy People 2010
target: 20%
• Being physically active contributes substantially to healthy aging. Regular physical activity
can help prevent or control many of the health problems (e.g., high blood pressure;
depression; obesity; and diabetes) that often reduce the quality and length of life for
older adults.
• Strength training is of particular importance to older adults, as it can provide relief from
arthritis pain; improve balance and reduce the risk of falling; strengthen bones; and reduce
blood glucose levels.(4)
• Adults in the United States, however, tend to become less active as they age (Figure 6).
12 | The National Report Card on Healthy Aging
Health Behavior Indicators
» CALL TO ACTION »
Encouraging Physical Activity by Promoting Changes to the Physical Environment
Many older adults are inactive despite efforts to promote the benefi ts of regular physical activity. Because walking is the most commonly reported form of physical activity among older adults, enhancing community environments to support walking is a promising approach to increase physical activity among seniors.(5)
Research shows that modifying a community’s physical environment to ensure access to appropriate exercise
venues and address barriers to walking may increase the physical activity of older adults. Specifi c measures include: repairing sidewalks and ensuring sidewalk availability(6); ensuring safety and protection from traffi c (for example, by using traffi c-calming devices)(7); and protecting older adults from crime.(8) In addition to such environmental enhancements, older adults also may benefi t from programs that encourage leisure-time activities. Helping older adults remain active in their own communities is an investment with documented cost savings(9), and making communities safe is benefi cial to everyone.
INDICATOR 5: Physical activity

The National Report Card on Healthy Aging | 13
INDICATOR 6: Eating fi ve or more fruits and vegetables daily
• Diets rich in fruits and vegetables may reduce the risk for some cancers and chronic diseases
such as diabetes and cardiovascular disease. Fruits and vegetables provide essential vitamins
and minerals, fi ber, and other substances that are important for good health.
• Compared with other age groups, a greater proportion of adults aged 65 or older eat fi ve or
more fruits and vegetables daily.
• BRFSS data from 2003 show that the percentage of older Americans who eat fi ve or more
fruits and vegetables varies by race and ethnicity. About 40% of Asian/Pacifi c Islander older
adults meet the fi ve-a-day recommendation, compared with only 31% of non-Hispanic
whites; 26% of Hispanics; 25% of non-Hispanic blacks; and 24% of Native Americans.
INDICATOR 7: Obesity
• Obesity is defi ned as having a body mass index (BMI) of 30 or greater. BMI is calculated
by dividing a person’s weight in kilograms by his or her height in meters squared (kg/m2).
• Older adults can benefi t from maintaining a healthy body weight. Obesity is a risk factor
for many chronic conditions, including 4 of the 10 leading causes of death in the United
States — coronary heart disease, type 2 diabetes, stroke, and several forms of cancer.
Obesity also can worsen conditions such as arthritis, and it is associated with activity
limitations and feelings of sadness and hopelessness.(10)
INDICATOR 8: Current smoking
• Although most older adults who were once regular smokers have quit, about 9% of adults
aged 65 or older were still smoking cigarettes in 2004 (see Table 1).
• Postmenopausal women who smoke have lower bone density and an increased risk for hip
fracture than women who never smoked.(11)
• Even adults who have smoked throughout their lives can gain signifi cant health benefi ts from
quitting. For example, the risk for heart attack declines and overall lung function improves
within just two weeks to three months of quitting.(12)
14 | The National Report Card on Healthy Aging
Preventive Care and Screening Indicators
INDICATOR 9: Flu vaccine in past year
INDICATOR 10: Ever had pneumonia vaccine
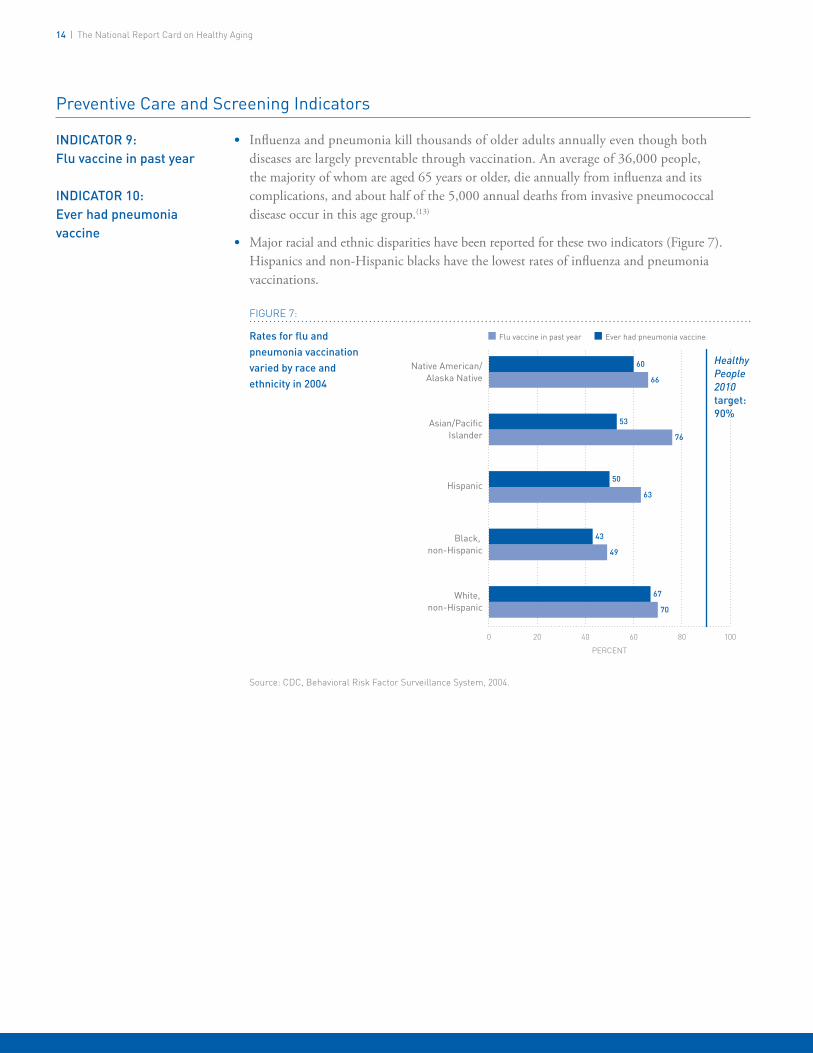
FIGURE 7:
Rates for fl u and pneumonia vaccination varied by race and ethnicity in 2004
Source: CDC, Behavioral Risk Factor Surveillance System, 2004.
0 20 40 60 80
Native American/Alaska Native
Asian/PacificIslander
Hispanic
Black, non-Hispanic
White, non-Hispanic
Flu vaccine in past year Ever had pneumonia vaccine
PERCENT
60
66
53
76
50
63
43
49
67
70
Healthy People 2010 target: 90%
• Infl uenza and pneumonia kill thousands of older adults annually even though both
diseases are largely preventable through vaccination. An average of 36,000 people,
the majority of whom are aged 65 years or older, die annually from infl uenza and its
complications, and about half of the 5,000 annual deaths from invasive pneumococcal
disease occur in this age group.(13)
• Major racial and ethnic disparities have been reported for these two indicators (Figure 7).
Hispanics and non-Hispanic blacks have the lowest rates of infl uenza and pneumonia
vaccinations.
100

The National Report Card on Healthy Aging | 15
INDICATOR 11: Mammogram within past two years
• Th e risk of getting breast cancer increases as a woman gets older. Nearly 8 of 10 cases of
breast cancer are found in women over age 50.(16)
• Early detection of breast cancer saves lives, and mammography is the best available method
to detect breast cancer in its earliest, most treatable stage, several years before a lump can be
felt. Timely mammography screening among women aged 40 or older could reduce breast
cancer mortality by approximately 16% compared with women who are not screened.(17)
• Mammograms for women aged 65 or older are covered by Medicare, but many women are
still not taking advantage of this opportunity.
» CALL TO ACTION »
Increasing Adult Immunization in Racial/Ethnic Minority Populations
National Healthy People 2010 objectives call for 90% of non-institutionalized persons aged 65 years or older to be vaccinated against infl uenza and pneumonia (see Appendix). Although all population groups currently fall short of this target, African-Americans and Hispanics have signifi cantly lower infl uenza and pneumococcal immunization rates compared with the rest of the population.
No single factor has been identifi ed that can account for the signifi cant racial/ethnic disparities in vaccination of older persons. Recent research provides evidence for multiple factors that may contribute to this problem, including lower education levels, lower likelihood of vaccination in non-medical settings among African Americans, less awareness about current vaccine recommendations, and possibly more missed opportunities for vaccination by providers.(14) Although the differences caused by any of these individual factors may be slight, in combination these could lead to the larger disparities observed in vaccination rates among racial/ethnic groups. Focus group research suggests that the desire to protect family members, particularly grandchildren, may be an important motivator for these groups.(15)
The READII (Racial and Ethnic Adult Disparities in Immunization Initiative) project has been a signifi cant effort to address
these disparities through multi-year demonstration projects. Conducted in fi ve areas (Monroe County, NY; Milwaukee, WI; San Antonio, TX; Chicago, IL; and 18 counties in the Mississippi Delta Region and Hinds County, MS) from August 2002 through December 2004, these projects aimed to improve infl uenza and pneumococcal vaccination levels among elderly non-Hispanic blacks and/or Hispanics. Each site identifi ed community partners and, together, identifi ed a plan for increasing vaccination rates in their target population(s) based on evidence-based interventions recommended in the Guide to Community Preventive Services. Examples of specifi c activities conducted included working with pharmacists to offer vaccinations, collaborating with the faith-based community, conducting assessment and feedback activities in physician offi ces, and implementing a tracking/recall/outreach system in clinics serving the target population.
Systematic offering of vaccine to all patients, as was conducted in Monroe County, NY, was shown to reduce disparities in participating practices. Another key outcome was the development of new partnerships that facilitated reaching the target populations, and have continued after the end of the demonstration period.
More information on this program may be found at http://www.cdc.gov/nip/specint/readii.

16 | The National Report Card on Healthy Aging
INDICATOR 12: Colorectal cancer screening
• Colorectal cancer is the third most common type of cancer for both men and women and
the second leading cause of cancer death in the United States.(18) More than 90% of cases
are diagnosed in people aged 50 or older. In 2002, a total of 70,651 men and 68,883
women received a diagnosis of colorectal cancer, and 28,471 men and 28,132 women died
from this disease.(19)
• Th e Healthy People 2010 target for colorectal cancer screening is to increase the proportion
of people aged 50 or older who have ever received a sigmoidoscopy to 50%. However, the
data included in this report are graded against the current screening recommendations from
the U.S. Preventive Services Task Force, which are more comprehensive. Th e Task Force
recommends the following screening tests and intervals for adults aged 50 or older who are
at average risk for colorectal cancer:(20)
A fecal occult blood test (FOBT) every year
Flexible sigmoidoscopy every 5 years
Double-contrast barium enema every 5 years
Colonoscopy every 10 years.
» CALL TO ACTION »
Increasing Screening for Colorectal Cancer
Colorectal cancer (CRC), one of the most commonly diagnosed cancers in the United States, is largely preventable. Although it is the second leading cancer killer, as many as 60% of deaths from CRC could be prevented if everyone aged 50 or older were screened regularly. Screening tests can detect precancerous polyps so they can be removed before they become malignant. Screening also can be effective in fi nding early-stage CRC.(21)
Despite recent increases in screening rates, much work is needed to achieve the Healthy People 2010 target for reducing CRC mortality. To further increase screening rates, barriers to screening must be addressed. These barriers include high costs, lack of insurance coverage, failure of many clinicians to recommend screening, and lack of awareness among populations at higher risk. Continuing efforts are needed to raise awareness, increase physician recommendations, and ensure that screening and follow-up care are available for underinsured and uninsured patients.
CDC is working to raise awareness about the importance of CRC screening through its Screen for Life: National Colorectal Cancer Action Campaign. This campaign is a collaborative effort of CDC and the Entertainment Industry Foundation; National Colorectal Cancer Research Alliance; 49 state health departments; two tribal organizations; and the District of Columbia, all of which are using or adapting campaign materials for their community education efforts. The campaign develops and disseminates multimedia public service announcements and educational materials for patients and health care providers in both English and Spanish. Target audiences include the general population aged 50 or older and health professionals.
For more information, visit http://www.cdc.gov/screenforlife.
Preventive Care and Screening Indicators

The National Report Card on Healthy Aging | 17
INDICATOR 13: Up-to-date on selected preventive services
• Th e “up-to-date” indicator presents a composite picture of the preventive care and screening
behaviors of older adults. Indicators 9–12 measure the use of selected clinical preventive
services that are covered by Medicare and recommended for adults aged 65 or older.
Although each indicator is essential independently, older adults need to obtain all of these
services to protect their health.
• Th is comprehensive approach aims to provide a more meaningful and practical measure
of the delivery of clinical preventive services. Th is approach also could enhance the ability of
health departments and community groups to assess disparities in the delivery of preventive
services; to better gauge progress toward measurable objectives; and to identify best practices
for achieving prevention goals.(22)
INDICATOR 14: Cholesterol screening
FIGURE 8:
Cholesterol screening within past fi ve years increases with education level among older adults
Source: CDC, Behavioral Risk Factor Surveillance System, 2003.
0
10
20
30
40
50
60
70
80
90
100
8582
9087
9490
Less thanhigh school
High school More thanhigh school
PERCENT Age 65-74 Age 75+
EDUCATION LEVEL
Healthy People 2010
target: 80%
• High serum cholesterol is a major risk factor for coronary heart disease, a leading cause
of illness and death among older adults. Periodic cholesterol screening is an essential
component of preventive health care. Fasting cholesterol levels should be measured every
fi ve years for all adults.(23)
• Among the major U.S. racial and ethnic groups, Hispanics were the least likely and
non-Hispanic blacks the most likely to have had their cholesterol measured within the
past fi ve years in 2003.(24)
• Cholesterol screening within the past fi ve years rose with education levels among older
adults in 2003 (Figure 8).
Injury Indicator
INDICATOR 15: Hip fracture hospitalizations
• Hip fracture, the most serious type of all fall-related fractures, is a major contributor to
death, disability, and diminished quality of life among older adults.(25,26)
• In 2004, women had nearly double the rate of hospitalizations for hip fractures than men
(1,113 per 100,000 persons compared with 558).
• Hip fracture hospitalizations have varied from year to year, but are always consistently above
the Healthy People 2010 targets of 474 per 100,000 persons for men and 416 per 100,000
persons for women.
Selected Additional Resources
Th e following resources provide more information on the
indicators described in this chapter. See the chapter titled
Spotlight: Reducing Falls Among Older Adults for resources
related to fall prevention and hip fractures.
Physically Unhealthy Days and Frequent Mental Distress
• CDC, Health-Related Quality of Life Programhttp://www.cdc.gov/hrqol
Oral Health
• CDC, Oral Health Programhttp://www.cdc.gov/OralHealth/index.htm
• Oral Health Americahttp://www.oralhealthamerica.org
Disability
• Administration on Aging, Aging and Disability Resource Centershttp://www.aoa.gov/prof/aging_dis/aging_dis.asp
• CDC, Disability Programhttp://www.cdc.gov/ncbddd/dh/default.htm
Nutrition and Obesity
• CDC, Nutrition Programhttp://www.cdc.gov/nccdphp/dnpa/nutrition.htm
• CDC, Obesity Programhttp://www.cdc.gov/nccdphp/dnpa/obesity/index.htm
• 5-a-Day Programhttp://www.5aday.gov
Physical Activity
• CDC, Physical Activity Programhttp://www.cdc.gov/nccdphp/dnpa/physical/index.htm
• CDC, Growing Stronger Programhttp://www.cdc.gov/nccdphp/dnpa/physical/growing_stronger/index.htm
• National Blueprint: Increasing Physical Activity Among Adults Aged 50 and Olderhttp://www.agingblueprint.org
Tobacco
• American Lung Associationhttp://www.lungusa.org
• CDC, Tobacco Control Programhttp://www.cdc.gov/tobacco
Immunizations
• CDC, Immunization Programhttp://www.cdc.gov/nip
Cancer Screening
• American Cancer Societyhttp://www.cancer.org
• CDC, Cancer Control Programhttp://www.cdc.gov/cancer
Cholesterol Screening
• CDC, Cholesterol Fact Sheethttp://www.cdc.gov/DHDSP/library/fs_cholesterol.htm
18 | The National Report Card on Healthy Aging

References
1. Centers for Disease Control and Prevention. Surveillance for dental caries, dental sealants, tooth retention, edentulism, and enamel fl uorosis—United States, 1988–1993 and 1999–2002. MMWR Surveillance Summaries 2005;54(No. SS-3):1–33.
2. Griffi n SO, Griffi n PM, Swann JL, Zlobin N. New coronal caries in older adults: implications for prevention. Journal of Dental Research 2005;84(8):715–720.
3. Griffi n SO, Griffi n PM, Swann, JL, Zlobin N. Estimating rates of new root caries in older adults. Journal of Dental Research 2004;83(8):634–638.
4. Centers for Disease Control and Prevention. Growing stronger: why strength training for older adults? Available at http://www.cdc.gov/nccdphp/dnpa/physical/growing_stronger/why.htm (accessed May 23, 2006).
5. Hoehner CM, Brennan Ramirez LK, Elliott MB, Handy SL, Brownson RC. Perceived and objective environmental measures and physical activity among urban adults. American Journal of Preventive Medicine 2005;28:105–116.
6. Wilcox S, Castro C, King AC, Houseman R, Brownson RC. Determinants of leisure-time physical activity in rural older and ethnically diverse women in the United States. Journal of Epidemiology and Community Health 2000;54:667–672.
7. Kitamura R, Patricia L, Laidit L. A micro-analysis of land use and travel in fi ve neighborhoods in the San Francisco Bay Area. Transportation 1997;24:125–158.
8. Centers for Disease Control and Prevention. Neighborhood safety and the prevalence of physical inactivity — selected states, 1996. Morbidity and Mortality Weekly Report 1999;48(7):143–146.
9. Pratt M, Macera CA, Wang G. Higher direct medical costs associated with physical inactivity. The Physician and Sportsmedicine 2000;28(10):63–70.
10. Center on an Aging Society. Obesity among older Americans (Data Profi le). Washington, DC: Georgetown University; 2003. Available at http://ihcrp.georgetown.edu/agingsociety/pubhtml/obesity2/obesity2.html (accessed April 24, 2006).
11. U.S. Department of Health and Human Services. Women and smoking: a report of the Surgeon General. Rockville, MD: U.S. Department of Health and Human Services, Centers for Disease Control and Prevention; 2001. Available at http://www.cdc.gov/tobacco/sgr/sgr_forwomen/index.htm (accessed May 23, 2006).
12. Centers for Disease Control and Prevention. Within 20 minutes of quitting (Poster). Available at http://www.cdc.gov/tobacco/sgr/sgr_2004/posters/20mins.htm (accessed May 23, 2006).
13. Centers for Disease Control and Prevention. Racial and Ethnic Adult Disparities in Immunization Initiative (READII) Web site. Available at http://www.cdc.gov/nip/specint/readii (accessed May 23, 2006).
14. Singleton J, Santibanez T, Wortley PM. Infl uenza and pneumococcal vaccination of adults ≥65: racial/ethnic differences. Am J Prev Med 2005;29:412-20.
15. Centers for Disease Control and Prevention. Infl uenza and pneumococcal immunization: a qualitative assessment of the beliefs of physicians and older Hispanic and African Americans. Atlanta, GA: U.S. Department of Health and Human Services, Centers for Disease Control and Prevention; 2002.
16. American Cancer Society. What causes breast cancer? Available at http://www.cancer.org/docroot/CRI/content/CRI_2_2_2X_What_causes_breast_cancer_5.asp?sitearea= (accessed May 23, 2006).
17. Centers for Disease Control and Prevention. The National Breast and Cervical Cancer Early Detection Program: saving lives through screening. Atlanta, GA: U.S. Department of Health and Human Services, Centers for Disease Control and Prevention; 2006. Available at http://www.cdc.gov/cancer/nbccedp/about2004.htm (accessed April 24, 2006).
18. American Cancer Society. What are the key statistics for colorectal cancer? Available at http://www.cancer.org/docroot/CRI/content/CRI_2_4_1X_What_are_the_key_statistics_for_colon_and_rectum_cancer.asp?rnav=cri (accessed May 23, 2006).
19. U.S. Cancer Statistics Working Group. U.S. cancer statistics: 2002 incidence and mortality. National Vital Statistics Report 2004;53(5).
20. Centers for Disease Control and Prevention. Colorectal cancer test use among persons aged >50 years — United States, 2001. Morbidity and Mortality Weekly Report 2003;52(1);193–196.
21. Seeff LC, King J, Pollack LA, Williams KN. Increased use of colorectal cancer tests — United States, 2002 and 2004. Morbidity and Mortality Weekly Report 2006;55(11);308–311.
22. Shenson D, Bolen J, Adams M, Seeff L, Blackman D. Are older adults up-to-date with cancer screening and vaccinations? Prevention of Chronic Diseases [serial online]; July 2005. Available at http://www.cdc.gov/pcd/issues/2005/jul/05_0021.htm (accessed May 23, 2006).
23. National Institutes of Health. Third Report of the National Cholesterol Education Program (NCEP) Expert Panel on Detection, Evaluation, and Treatment of High Blood Cholesterol in Adults (Adult Treatment Panel III) Executive Summary. 2001. Available at http://www.nhlbi.nih.gov/guidelines/cholesterol/atp3xsum.pdf (accessed May 23, 2006).
24. Centers for Disease Control and Prevention. Trends in cholesterol screening and awareness of high blood cholesterol — United States, 1991–2003. Morbidity and Mortality Weekly Report 2005;54(35):865 –870.
25. Wolinksy FD, Fitzgerald JF, Stump TE. The effect of hip fracture on mortality, hospitalization, and functional status: a prospective study. American Journal of Public Health 1997;87(3):498–503.
26. Hall SE, Williams JA, Goldswain, PR, Criddle RA. Hip fracture outcomes: quality of life and functional status in older adults living in the community. Australian and New Zealand Journal of Medicine 2000;30(3):327–332.
The National Report Card on Healthy Aging | 19

The State-by-State Report Cardon Healthy Aging
This section presents the State-by-State Report Card on Healthy Aging, which
includes data for the 50 states and the District of Columbia. Table 2 presents
the best- and worst-ranked states and the number of states that meet the
Healthy People 2010 targets for the national indicators that have targets. (Hip
fracture hospitalization data are not available for every state, and therefore are
not included in this section.) Table 3 displays the most current data for each
indicator by state, ranks the states, and assigns a grade to each state according
to its performance relative to the other states.

* Data for Indicators 1–14 were collected by CDC’s Behavioral Risk Factor Surveillance System (BRFSS). See Appendix for a full description of this data source.
† Includes all 50 states and the District of Columbia.‡ Indicators 1, 2, 4, and 13 are more recently developed measures and do not have
Healthy People 2010 targets.§ Frequent mental distress is defi ned as having had 14 or more mentally
unhealthy days in the previous month. Data from the 2003 and 2004 BRFSS are combined in this report to achieve a suffi cient sample size.
Ð Disability was defi ned on the basis of an affi rmative response to either of the following two questions on the 2004 BRFSS: “Are you limited in any way in any
activities because of physical, mental, or emotional problems?” or “Do you now have any health problem that requires you to use special equipment, such as a cane, a wheelchair, a special bed, or a special telephone?”
¶ Healthy People 2010 segments the nutrition target into multiple categories of fruits and vegetables. See Appendix for a full description.
# For men, three services are included: infl uenza vaccine in past year; ever had a pneumonia vaccine; and colorectal cancer screening. For women, these same three services are included, plus a mammogram within past two years.
** No state-level data exist for Indicator 15, hip fracture hospitalizations.
The State-by-State Report Card on Healthy Aging | 21
TABLE 2
State-by-State Report Card On Healthy Aging
Summary of Findings:There is considerable variation among the states for each indicator, and mixed progress has been made since The State of Aging and Health in America 2004 was released. For example,• No states have met all the targets.• Hawaii was most often ranked in the top fi ve (eight times). Kentucky was most often ranked in the bottom fi ve (nine times).• All states already meet the Healthy People 2010 target for cholesterol screening.• The vast majority of states are well ahead of schedule for meeting Healthy People 2010 targets for mammograms, colorectal
cancer screenings, and people currently smoking.• No states met the 2010 targets for physical activity, fl u or pneumonia vaccines and eating fruit and vegetables daily.
Only three states met the 2010 target on obesity, while 21 states and the District of Columbia met the target on oral health.• Variation among states can be signifi cant. For example, in Connecticut, only 12.4% of older adults had lost all of their teeth;
while West Virginia ranked last in this category, with 42.9% of older adults experiencing complete tooth loss.
Indicator Data Year*Healthy
People 2010 Target
Number of States Meeting Target†
Worst-Ranked State
(relevant data)
Best-Ranked State
(relevant data)
Health Status
1. Physically unhealthy days (mean number of days in past month)
2004 ‡ ‡ West Virginia (7.9) Hawaii (3.2)
2. Frequent mental distress (%)§ 2003–2004 ‡ ‡ Kentucky (10.3) Hawaii (3.8)
3. Oral health: complete tooth loss (%) 2004 20 22 West Virginia (42.9) Connecticut (12.4)
4. Disability (%)Ð 2004 ‡ ‡ West Virginia (42.3) Hawaii (20.6)
Health Behaviors
5. No leisure-time physical activity in past month (%)
2004 20 0 Mississippi (43.4) Minnesota (23.1)
6. Eating ≥5 fruits and vegetables daily (%) 2003 ¶ ¶ Mississippi (19.5) Vermont (40.2)
7. Obesity (%) 2004 15 3 Louisiana (25.6) Hawaii (10.2)
8. Current smoking (%) 2004 12 47 Nevada (14.5) Utah (4.7)
Preventive Care and Screening
9. Flu vaccine in past year (%) 2004 90 0 DC (54.9) Colorado (78.8)
10. Ever had pneumonia vaccine (%) 2004 90 0 DC (51.4) Montana (71.6)
11. Mammogram within past two years (%) 2004 70 47 Mississippi (66.3) Rhode Island (84.8)
12. Colorectal cancer screening (%) 2004 50 50 Hawaii (35.9) Maine (73.4)
13. Up-to-date on selectedpreventive services (%)#
Men Women
20042004
‡‡
‡‡
Hawaii (20.1)Mississippi (24.7)
Wisconsin (49.8)Minnesota (47.0)
14. Cholesterol checked within past fi ve years (%)
2003 80 51 Louisiana (86.6) Delaware (95.0)
Injuries**
15. Hip fracture hospitalizations ** ** ** ** **

Physically Unhealthy Days (mean number
of days in past month) 2004
Frequent Mental Distress†
(%)2003-2004
Oral Health: Complete Tooth Loss
(%)2004
Disability† (%)
2004
No Leisure-Time Physical Activity
(%)2004
Data Rank‡ Grade Data Rank Grade Data Rank Grade Data Rank Grade Data Rank GradeAlabama 7.3 49 9.6 50 31.9 47 35.9 36 39.7 48Alaska 5.0 8 8.1 47 23.0 31 35.7 35 34.9 39Arizona 5.0 8 6.3 24 15.0 5 ● 30.5 7 27.8 9 ●
Arkansas 6.0 39 6.4 27 24.7 36 34.4 28 34.4 37California 5.4 16 8.5 48 13.8 3 ● 32.4 21 25.5 3 ●
Colorado 5.4 16 5.3 8 ● 18.1 15 ● 32.5 22 29.1 15 ●
Connecticut 5.5 24 5.7 15 ● 12.4 1 ● 29.4 3 28.3 11 ●
Delaware 4.9 6 6.2 20 21.2 25 ● 31.6 14 28.6 13 ●
District of Columbia 4.6 2 ● 8.0 46 19.4 19 ● 29.8 5 36.9 43Florida 5.4 16 7.0 36 18.7 17 ● 31.7 18 27.5 8 ●
Georgia 6.8 47 6.3 24 28.3 42 41.2 50 40.0 49Hawaii ç 3.2 1 ● 3.8 1 ● NO DATA 20.6 1 ● 26.0 4 ●
Idaho 5.6 29 6.2 20 22.5 30 36.0 37 29.4 16 ●
Illinois 6.1 41 5.3 8 ● 18.8 18 ● 32.5 22 35.0 40Indiana 5.8 34 5.7 15 ● 27.3 40 31.5 13 37.2 45Iowa 4.8 3 4.2 2 ● 23.3 33 30.7 8 31.9 26Kansas 4.8 3 5.0 6 ● 27.8 41 36.2 38 33.9 35Kentucky 6.6 45 10.3 51 38.1 49 38.5 42 36.2 42Louisiana 5.4 16 7.2 41 31.4 46 31.6 14 40.9 50Maine 5.2 12 6.4 27 24.3 35 30.3 6 32.5 30Maryland 5.0 8 7.7 45 16.7 9 ● 31.8 20 31.7 24Massachusetts 4.9 6 6.2 20 16.5 7 ● 31.2 10 27.9 10 ●
Michigan 5.9 36 5.8 17 ● 17.2 13 ● 36.5 41 31.6 23Minnesota 5.2 12 4.2 2 ● 14.3 4 ● 38.5 42 23.1 1 ●
Mississippi 7.3 49 7.0 36 29.6 44 39.5 45 43.4 51Missouri 6.5 44 6.8 31 25.2 38 38.8 44 33.1 33Montana 5.8 34 5.6 14 ● 19.6 21 ● 31.6 14 29.4 16 ●
Nebraska 5.3 14 5.2 7 ● 23.1 32 34.8 32 26.9 7 ●
Nevada 5.6 29 7.2 41 16.5 7 ● 31.3 11 30.8 22New Hampshire 5.7 31 5.8 17 ● 21.1 24 ● 32.5 22 31.7 24New Jersey 5.4 16 7.1 38 17.0 12 ● 29.6 4 32.6 31New Mexico 7.2 48 6.5 29 21.8 27 ● 36.3 40 28.4 12 ●
New York 5.4 16 6.7 30 16.9 11 ● 34.6 30 35.6 41North Carolina 6.3 42 7.2 41 28.3 42 33.8 25 30.4 19North Dakota 5.4 16 5.4 11 ● 25.0 37 34.0 26 37.2 45Ohio 5.5 24 7.1 38 20.4 23 ● 31.4 12 32.7 32Oklahoma 6.0 39 7.3 44 31.2 45 39.6 46 34.6 38Oregon 5.4 16 6.3 24 17.8 14 ● 40.2 49 24.2 2 ●
Pennsylvania 5.5 24 4.9 5 ● 23.8 34 31.7 18 37.0 44Rhode Island 5.5 24 6.8 31 18.4 16 ● 28.4 2 34.3 36South Carolina 6.6 45 7.1 38 21.8 27 ● 34.5 29 33.3 34South Dakota 4.8 3 5.3 8 ● 26.1 39 34.7 31 28.8 14 ●
Tennessee 5.9 36 6.8 31 32.3 48 31.6 14 38.4 47Texas 6.3 42 6.9 35 16.8 10 ● 36.2 38 30.5 20Utah 5.7 31 6.2 20 13.6 2 ● 39.9 47 26.5 6 ●
Vermont 5.1 11 4.8 4 ● 21.3 26 ● 35.4 33 32.2 29Virginia 5.7 31 5.4 11 ● 19.4 19 ● 31.0 9 32.1 27Washington 5.5 24 5.8 17 ● 16.1 6 ● 40.1 48 26.0 4 ●
West Virginia 7.9 51 9.1 49 42.9 50 42.3 51 32.1 27Wisconsin 5.3 14 6.8 31 19.7 22 ● 34.1 27 29.9 18Wyoming 5.9 36 5.5 13 ● 21.8 27 ● 35.6 34 30.6 21
22 | The State-by-State Report Card on Healthy Aging
TABLE 3
State-by-State Report Card On Healthy Aging*
* Grades are calculated as tertiles (thirds) and show state performance relative to all other states; ● = upper third (top performing 33%), = middle third (middle 33%), = lower third (lowest performing 33%).
† Defi ned in Table 2.‡ Rankings are based on the relative numeric scores for each indicator, with
a ranking of “1” indicating the highest rank. When comparing states, we
recommend the use of confi dence intervals. For this information, please visit the online version of this report at www.cdc.gov/aging.
ç 2003 data are used for all the indicators for Hawaii because no 2004 data exist.
Source: CDC, Behavioral Risk Factor Surveillance System. See Appendix for full description of this data source.
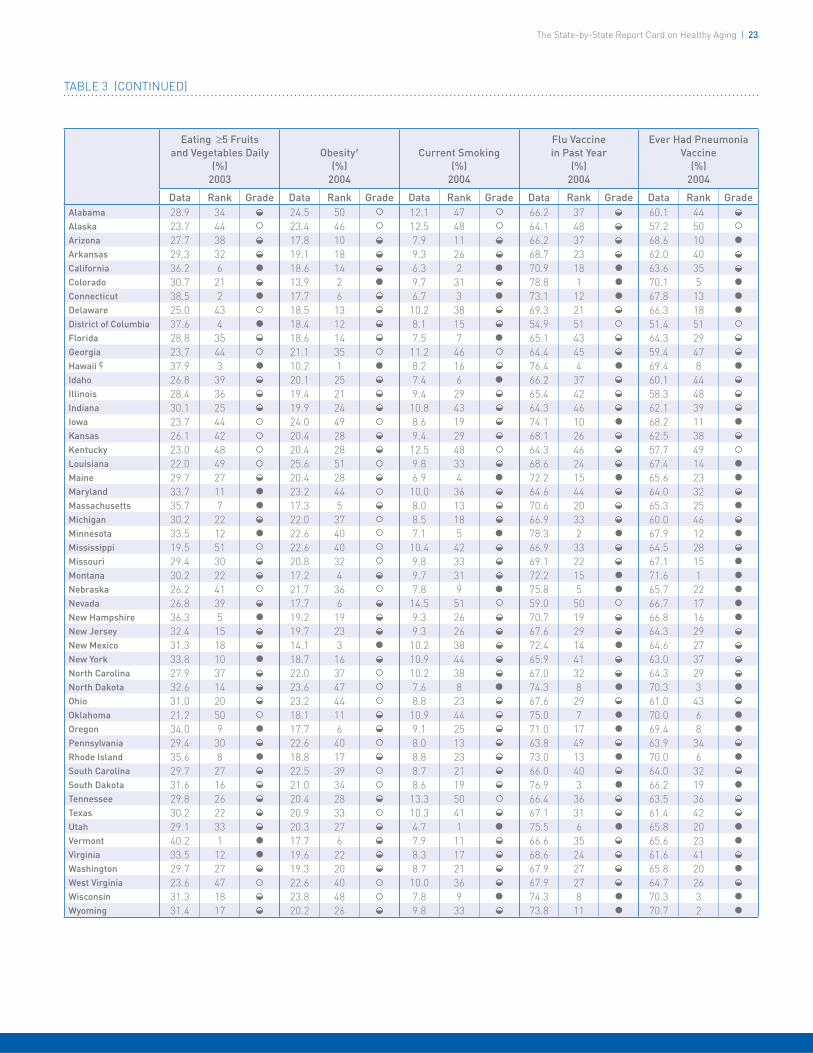
Eating ≥5 Fruits and Vegetables Daily
(%)2003
Obesity† (%)
2004
Current Smoking (%)
2004
Flu Vaccine in Past Year
(%)2004
Ever Had Pneumonia Vaccine
(%)2004
Data Rank Grade Data Rank Grade Data Rank Grade Data Rank Grade Data Rank GradeAlabama 28.9 34 24.5 50 12.1 47 66.2 37 60.1 44Alaska 23.7 44 23.4 46 12.5 48 64.1 48 57.2 50Arizona 27.7 38 17.8 10 7.9 11 66.2 37 68.6 10 ●
Arkansas 29.3 32 19.1 18 9.3 26 68.7 23 62.0 40California 36.2 6 ● 18.6 14 6.3 2 ● 70.9 18 ● 63.6 35Colorado 30.7 21 13.9 2 ● 9.7 31 78.8 1 ● 70.1 5 ●
Connecticut 38.5 2 ● 17.7 6 6.7 3 ● 73.1 12 ● 67.8 13 ●
Delaware 25.0 43 18.5 13 10.2 38 69.3 21 66.3 18 ●
District of Columbia 37.6 4 ● 18.4 12 8.1 15 54.9 51 51.4 51Florida 28.8 35 18.6 14 7.5 7 ● 65.1 43 64.3 29Georgia 23.7 44 21.1 35 11.2 46 64.4 45 59.4 47Hawaii ç 37.9 3 ● 10.2 1 ● 8.2 16 76.4 4 ● 69.4 8 ●
Idaho 26.8 39 20.1 25 7.4 6 ● 66.2 37 60.1 44Illinois 28.4 36 19.4 21 9.4 29 65.4 42 58.3 48Indiana 30.1 25 19.9 24 10.8 43 64.3 46 62.1 39Iowa 23.7 44 24.0 49 8.6 19 74.1 10 ● 68.2 11 ●
Kansas 26.1 42 20.4 28 9.4 29 68.1 26 62.5 38Kentucky 23.0 48 20.4 28 12.5 48 64.3 46 57.7 49Louisiana 22.0 49 25.6 51 9.8 33 68.6 24 67.4 14 ●
Maine 29.7 27 20.4 28 6.9 4 ● 72.2 15 ● 65.6 23 ●
Maryland 33.7 11 ● 23.2 44 10.0 36 64.6 44 64.0 32Massachusetts 35.7 7 ● 17.3 5 8.0 13 70.6 20 65.3 25 ●
Michigan 30.2 22 22.0 37 8.5 18 66.9 33 60.0 46Minnesota 33.5 12 ● 22.6 40 7.1 5 ● 78.3 2 ● 67.9 12 ●
Mississippi 19.5 51 22.6 40 10.4 42 66.9 33 64.5 28Missouri 29.4 30 20.8 32 9.8 33 69.1 22 67.1 15 ●
Montana 30.2 22 17.2 4 9.7 31 72.2 15 ● 71.6 1 ●
Nebraska 26.2 41 21.7 36 7.8 9 ● 75.8 5 ● 65.7 22 ●
Nevada 26.8 39 17.7 6 14.5 51 59.0 50 66.7 17 ●
New Hampshire 36.3 5 ● 19.2 19 9.3 26 70.7 19 66.8 16 ●
New Jersey 32.4 15 19.7 23 9.3 26 67.6 29 64.3 29New Mexico 31.3 18 14.1 3 ● 10.2 38 72.4 14 ● 64.6 27New York 33.8 10 ● 18.7 16 10.9 44 65.9 41 63.0 37North Carolina 27.9 37 22.0 37 10.2 38 67.0 32 64.3 29North Dakota 32.6 14 23.6 47 7.6 8 ● 74.3 8 ● 70.3 3 ●
Ohio 31.0 20 23.2 44 8.8 23 67.6 29 61.0 43Oklahoma 21.2 50 18.1 11 10.9 44 75.0 7 ● 70.0 6 ●
Oregon 34.0 9 ● 17.7 6 9.1 25 71.0 17 ● 69.4 8 ●
Pennsylvania 29.4 30 22.6 40 8.0 13 63.8 49 63.9 34Rhode Island 35.6 8 ● 18.8 17 8.8 23 73.0 13 ● 70.0 6 ●
South Carolina 29.7 27 22.5 39 8.7 21 66.0 40 64.0 32South Dakota 31.6 16 21.0 34 8.6 19 76.9 3 ● 66.2 19 ●
Tennessee 29.8 26 20.4 28 13.3 50 66.4 36 63.5 36Texas 30.2 22 20.9 33 10.3 41 67.1 31 61.4 42Utah 29.1 33 20.3 27 4.7 1 ● 75.5 6 ● 65.8 20 ●
Vermont 40.2 1 ● 17.7 6 7.9 11 66.6 35 65.6 23 ●
Virginia 33.5 12 ● 19.6 22 8.3 17 68.6 24 61.6 41Washington 29.7 27 19.3 20 8.7 21 67.9 27 65.8 20 ●
West Virginia 23.6 47 22.6 40 10.0 36 67.9 27 64.7 26Wisconsin 31.3 18 23.8 48 7.8 9 ● 74.3 8 ● 70.3 3 ●
Wyoming 31.4 17 20.2 26 9.8 33 73.8 11 ● 70.7 2 ●
The State-by-State Report Card on Healthy Aging | 23
TABLE 3 (CONTINUED)

24 | The State-by-State Report Card on Healthy Aging
TABLE 3 (CONTINUED)
Mammogram in Past 2 Years
(%)2004
Colorectal Cancer Screening†
(%)2004
Up-to-Date on Select Preventive Services
Men† (%)2004
Up-to-Date on Select Preventive Services
Women† (%)2004
Cholesterol Checked in Past 5 Years
(%)2003
Data Rank‡ Grade Data Rank Grade Data Rank Grade Data Rank Grade Data Rank GradeAlabama 78.1 20 59.9 36 30.3 50 26.9 42 88.4 42Alaska 67.8 50 60.6 32 37.1 30 28.4 35 90.3 27Arizona 82.7 6 ● 66.0 18 ● 40.8 14 ● 36.2 8 92.2 10 ●
Arkansas 68.0 49 59.0 38 38.8 23 25.6 47 88.6 40California 82.8 5 ● 68.1 13 ● 40.0 17 ● 34.8 14 94.6 2 ●
Colorado 76.9 23 65.5 20 ● 41.3 11 ● 38.9 3 90.3 27Connecticut 80.4 15 ● 71.4 6 ● 45.4 3 ● 36.2 8 92.7 7 ●
Delaware 83.0 4 ● 71.9 5 ● 43.0 5 ● 38.2 4 95.0 1 ●
District of Columbia 82.1 8 ● 68.7 10 ● 32.1 45 27.5 39 94.0 3 ●
Florida 82.3 7 ● 68.3 12 ● 41.8 8 ● 34.6 15 90.6 22Georgia 72.8 38 59.4 37 33.3 43 27.7 38 91.2 16Hawaii ç 84.7 2 ● 35.9 51 20.1 51 26.3 44 89.0 34Idaho 69.5 48 58.2 41 33.8 41 25.9 46 88.0 45Illinois 73.4 35 57.4 45 31.7 47 25.0 50 88.2 43Indiana 70.3 47 58.0 42 35.2 39 25.5 48 91.4 15Iowa 73.8 33 62.9 27 ● 38.4 26 34.4 17 90.5 24Kansas 76.9 23 58.8 39 36.9 31 30.7 29 88.9 36Kentucky 73.9 32 56.3 47 32.4 44 25.1 49 87.2 49Louisiana 75.0 28 58.7 40 36.8 32 31.2 28 86.6 51Maine 84.0 3 ● 73.4 1 ● 41.3 11 ● 35.8 11 90.0 29Maryland 82.1 8 ● 72.8 3 ● 42.3 7 ● 34.4 17 92.7 7 ●
Massachusetts 81.7 10 ● 68.4 11 ● 35.3 37 34.9 13 93.3 4 ●
Michigan 81.3 14 ● 70.5 9 ● 31.5 48 36.5 7 89.9 30Minnesota 81.7 10 ● 73.1 2 ● 41.4 10 ● 47.0 1 ● 90.4 26Mississippi 66.3 51 50.2 50 31.1 49 24.7 51 88.9 36Missouri 71.2 45 60.9 31 ● 36.8 32 28.4 35 88.5 41Montana 78.3 18 66.1 17 ● 46.0 2 ● 36.0 10 87.6 46Nebraska 75.1 26 56.7 46 36.5 34 31.6 26 87.5 47Nevada 72.7 41 60.5 33 33.8 41 26.1 45 89.6 31New Hampshire 81.7 10 ● 71.0 8 ● 41.8 8 ● 33.3 20 91.6 12New Jersey 74.2 31 63.1 26 ● 38.2 27 30.4 30 91.2 16New Mexico 71.3 44 61.3 30 ● 37.7 29 31.7 25 86.9 50New York 76.9 23 65.5 20 ● 40.3 16 ● 28.9 32 90.5 24North Carolina 79.0 17 ● 66.6 16 ● 40.0 17 ● 32.6 22 91.5 14North Dakota 74.7 30 60.5 33 38.9 22 34.6 15 91.1 19Ohio 81.7 10 ● 60.2 35 35.2 39 28.9 32 91.0 20Oklahoma 71.2 45 55.6 48 40.8 14 ● 28.8 34 88.8 39Oregon 75.1 26 64.2 24 ● 39.5 20 36.7 6 88.9 36Pennsylvania 72.8 38 62.0 29 ● 35.7 36 27.2 41 93.1 5 ●
Rhode Island 84.8 1 ● 72.3 4 ● 45.2 4 ● 37.0 5 92.5 9 ●
South Carolina 73.5 34 62.1 28 ● 36.5 34 28.1 37 93.1 5 ●
South Dakota 79.7 16 ● 64.3 23 ● 42.9 6 ● 35.3 12 89.4 32Tennessee 77.3 22 63.7 25 ● 38.2 27 32.2 24 91.6 12Texas 73.3 36 57.5 44 31.8 46 26.9 42 88.2 43Utah 73.1 37 65.1 22 ● 41.1 13 ● 31.6 26 87.4 48Vermont 72.8 38 68.0 14 ● 38.6 24 29.9 31 90.7 21Virginia 75.0 28 65.6 19 ● 39.0 21 32.4 23 90.6 22Washington 77.8 21 67.9 15 ● 38.5 25 34.1 19 91.2 16West Virginia 71.5 43 55.0 49 35.3 37 27.4 40 92.1 11Wisconsin 78.2 19 71.1 7 ● 49.8 1 ● 40.8 2 ● 89.0 34Wyoming 72.6 42 57.8 43 40.0 17 ● 32.8 21 89.1 33
* Grades are calculated as tertiles (thirds) and show state performance relative to all other states; ● = upper third (top performing 33%), = middle third (middle 33%), = lower third (lowest performing 33%).
† Defi ned in Table 2.‡ Rankings are based on the relative numeric scores for each indicator, with
a ranking of “1” indicating the highest rank. When comparing states, we
recommend the use of confi dence intervals. For this information, please visit the online version of this report at www.cdc.gov/aging.
ç 2003 data are used for all the indicators for Hawaii because no 2004 data exist.
Source: CDC, Behavioral Risk Factor Surveillance System. See Appendix for full description of this data source.

The State-by-State Report Card on Healthy Aging | 25
Using Data for Action at the State and Local Levels
Many states and communities have developed innovative ways
to ensure that important data on the health of older adults is
readily available to those who need it for planning programs,
setting priorities, and tracking trends. Two of these impressive
eff orts are taking place at the county level in Orange County,
California and at the state level in Missouri.
Condition of Older Adults in Orange County, California
The growth of Orange County, California’s older adult population has outpaced that of the state and the nation, increasing by 27% versus 14.7% for the state (California Long Term Care County Data Book 2002). More than 838,000 baby boomers live in Orange County according to the 2000 U.S. Census. While the current population of adults aged 60 and older is 75% white (non-Hispanic), the overall population is only 51% white (non-Hispanic), suggesting that the aging population will be increasingly diverse. Policy makers, service providers, and local community leaders need accurate and detailed information that will help them develop strategies to provide appropriate services for this increasingly diverse population.
In 2002, Orange County launched the Condition of Older Adults report series to provide a comprehensive picture of the general health and well-being of Orange County’s older adult population. The document compiles data from a variety of sources, including the nonprofi t Orange County Health Needs Assessment (OCHNA http://www.ochna.org), in a user-friendly format for policy makers, professionals, and concerned citizens. The series of reports include information on key indicators and trends in several broad topic areas, such as economics, housing, transportation, civic and social engagement, health status, health risks and behaviors, mental health, and health care. The Condition of Older Adults: 2003 Report, the most recent in the series, took an expanded look at family caregiving, which is an issue of growing importance to older adults, their families, and service providers.
A copy of this report is available at http://www.officeonaging.ocgov.com/demographics.asp.
Orange County offi cials understand that balancing needs and resources will be an ever-growing issue as the baby boomer generation ages and adds to the demand for a range of social supports and health services. Finding ways to develop and fi nance additional service capacity that meets the needs of older adults, allows choice, and ensures quality care will be a challenge for local governments — one that will demand strategic planning, collaboration, and partnership with the broad spectrum of service providers.
Ahead of the Baby Boom: Missouri Prepares
By 2020, the older adult population in Missouri is expected to exceed 1.2 million or nearly one in fi ve Missouri residents. To prepare for this shift in demographics, state offi cials have developed the Missouri Senior Report: Ahead of the Baby Boom: Missouri Prepares. This 2006 report provides county-level data and other useful information to help state and local policy makers, service providers, and older adults plan for future needs. Prior to this report, national and state-level data on older adults could only be obtained from multiple sources, and the data were rarely provided in a format that was user-friendly for consumers.
To develop this report, state offi cials collected input from Missouri’s 10 Area Agencies on Aging and from a series of 47 town hall meetings attended by more than 500 residents from around the state. Useful indicators and measures of the status of older adults for the report were identifi ed through these discussions and meetings. The report is available online at http://missouriseniorreport.org/download.shtml.
The report is a collaborative effort of the Missouri Department of Health and Senior Services (DHSS), the Offi ce of Social and Economic Data Analysis (OSEDA) at the University of Missouri-Columbia, and other agencies and organizations with an interest in promoting the health and quality of life of older adults. It provides demographic data; rates the state and each county on several key measures; and ranks the counties on the basis of a composite score for all measures. It also includes articles written by academic partners on the topics of mental health, health and socioeconomic disparities, and transportation. DHSS and University of Missouri Extension staff members are available to consult with communities on how to use the data for strategic planning.
The report serves not only as a source of data for planning and policy decisions, but also as a tool for health education and promotion. It provides information about the demographic shifts in the state’s population and the need for changes in areas such as housing, transportation, and employment. It will be updated annually and address emerging topics of concern.
To supplement the report, Missouri also has an interactive health data system, Missouri Information for Community Assessment (MICA). This system allows users to summarize data from a variety of sources; create and download tables; prepare geographic presentations; and choose priorities for health policy and planning initiatives based on county and state data. An evidence-based intervention component for selected topics that will enable users to choose interventions to address selected health issues is in development.
The MICA system is available at http://www.dhss.mo.gov/MICA.

Spotlight: Reducing Falls Among Older Adults
Falls and fall-related injuries cause signifi cant mortality, disability, and loss
of independence. These injuries impose an enormous burden on individuals,
society, and the nation’s health care system. Among older adults, falls are the
leading cause of injury deaths and the most common cause of injuries and
hospital admissions for trauma. As the U.S. population ages, the impact of
these injuries will increase unless we take steps now to implement effective
prevention strategies.

Spotlight: Reducing Falls Among Older Adults | 27
Fall-Related Morbidity and Mortality
In 2004, falls were the leading cause of injury deaths among
older adults and were responsible for about 14,900, or almost
43%, of all unintentional injury deaths in this age group.
Fall-related death rates rose sharply with increasing age and
the greatest increase occurred after age 79. Th is pattern was
similar for men and women, although men were more likely
to die from falls than women. Data from CDC’s Web-based
Injury Statistics and Query Reporting System (WISQARS)
show that in 2004, after adjusting for age, the overall fatality
rate was 51% higher for men than for women.(1) Th e underlying
causes for this disparity are unclear. Men may sustain more
severe injuries than women because they may fall from greater
heights, such as from a ladder; or they may have poorer health
from underlying chronic conditions than women of comparable
age and thus be less able to survive a fall-related injury.(2) A recent
study found that non-Hispanics consistently had higher fatal
fall rates than did Hispanics.(3)
Deaths from falls differ by race and state
In 2004, after adjusting for age, whites had the highest fall
death rate (41.4 per 100,000 people aged 65 and older);
followed by American Indians and Alaska Natives (25.7 per
100,000 people aged 65 and older); and Asians and Pacifi c
Islanders (25.1 per 100,000 people aged 65 and older).
Blacks had the lowest fall death rate (18.2 per 100,000 aged
65 and older) (Figure 9). In addition, the number of fall
deaths varied widely among states. In 2004, Alaska reported
only seven deaths, while Florida reported 1,236 — the highest
number for any state that year. Death rates, which more
accurately refl ect state diff erences, also varied widely (Table 4).
FIGURE 9:
In 2004, unintentional deaths from falls among older adults varied widely by race/ethnicity
Source: CDC, National Center for Injury Prevention and Control, Web-based Injury Statistics and Query Reporting System (WISQARS), 2006.
0 5 10 15 20 25 30 35 40 45
Asian/Pacific Islander
American Indian/Alaska Native
Black
White
RATE PER 100,000
25.1
25.7
18.2
41.4
Injury from falls most common for older adults
Falls also are the most common cause of nonfatal injuries
and of hospital admissions for trauma among older adults.
Ten to 20% of falls cause serious injuries such as fractures or
head traumas. In 2004, over 1.8 million seniors were treated
in U.S. hospital emergency departments for fall injuries, and
one out of four was subsequently hospitalized. Injury rates
increased sharply with age and were four to fi ve times higher
among people aged 85 and older than those ages 65 to 74.
Unlike fatality rates, nonfatal fall injury rates for people
ages 65 and older were consistently higher for women. After
adjusting for age, both the injury rate and the hospitalization
rate for women were almost twice that for men.(1)
Falls impact mind and body
Falls can have signifi cant psychological and social consequences.
Many older people, whether or not they have fallen, develop a
fear of falling. Th is fear can cause them to limit their activities,
which in turn leads to reduced mobility and physical fi tness
and subsequently to an increased risk of falls. Fear of falling
is strongly associated with future falls even among people who
have not fallen recently. Th is fear can lead to deteriorating
health, a decline in physical and social functioning, and
increased likelihood of admission to a nursing home.(2)

28 | Spotlight: Reducing Falls Among Older Adults
TABLE 4:
A State-by-State View of Unintentional Fall Deaths Among Adults Age 65 or Older, 2004
* Standard population is 2000, including all races, both sexes.** Rates based on 20 or fewer deaths may be unreliable,
and thus are not reported here.
Source: CDC, National Center for Injury Prevention and Control, Web-based Injury Statistics and Query Reporting System (WISQARS), 2006.
StateNumber of
DeathsCrude
Death RateAge-Adjusted Death Rate*
Alabama 117 19.6 20.3
Alaska 7 ** **
Arizona 463 62.9 64.8
Arkansas 124 32.6 32.7
California 1,228 32.2 30.8
Colorado 265 58.5 58.3
Connecticut 185 39.1 32.7
Delaware 42 38.4 38.8
District of Columbia 36 53.4 51.7
Florida 1,236 42.0 40.5
Georgia 420 49.2 52.3
Hawaii 56 32.6 29.0
Idaho 94 58.9 55.6
Illinois 420 27.6 26.0
Indiana 216 28.0 26.7
Iowa 271 62.5 53.3
Kansas 178 50.1 44.6
Kentucky 125 24.1 24.9
Louisiana 111 21.1 21.5
Maine 42 22.1 20.9
Maryland 240 37.8 36.4
Massachusetts 204 23.9 21.2
Michigan 509 40.8 38.3
Minnesota 479 77.8 67.9
Mississippi 143 40.4 42.3
Missouri 468 61.0 58.4
StateNumber of
DeathsCrude
Death RateAge-Adjusted Death Rate*
Montana 82 64.7 59.0
Nebraska 141 60.6 53.4
Nevada 72 27.5 32.3
New Hampshire 74 46.7 43.9
New Jersey 263 23.4 21.9
New Mexico 203 88.4 91.6
New York 794 31.8 29.4
North Carolina 480 46.4 47.6
North Dakota 68 72.8 55.5
Ohio 568 37.3 35.1
Oklahoma 157 33.8 34.4
Oregon 303 65.7 58.3
Pennsylvania 803 42.4 38.2
Rhode Island 105 69.9 56.3
South Carolina 144 27.6 28.3
South Dakota 90 82.1 68.2
Tennessee 299 40.5 42.2
Texas 803 36.1 37.6
Utah 80 38.0 38.3
Vermont 85 105.1 99.4
Virginia 294 34.6 34.9
Washington 459 65.1 59.6
West Virginia 131 47.2 47.9
Wisconsin 697 97.5 85.6
Wyoming 25 41.0 41.8
TOTAL 14,899 41.0 39.2

Spotlight: Reducing Falls Among Older Adults | 29
Trends
As older adults become a larger proportion of the U.S.
population, the number of fall injuries can be expected to
increase. From 1993 to 2003, the number of people aged 65
and older increased 13%, from 32.8 million to 36.9 million,
while the number of fatal falls more than doubled, from
7,130 to 14,899. After adjusting for age, fall death rates for
both men and women increased about 55% during this time
period and rates were consistently higher for men.(4) Th e rise in
fatal fall rates in part refl ects the 37% increase in the number
of people aged 85 and older, who are the fastest growing
segment of the older population and the one that is most
susceptible to falling.(2)
Fractures
Fractures are among the most prevalent fall injuries. Each year,
between 360,000 and 480,000 older adults sustain fall-related
fractures. Osteoporosis, a metabolic disease that causes bones
to become brittle, greatly increases the chances that a person
who falls will suff er a fracture, especially a fracture of the
vertebrae, forearm, wrist, or hip. One study found that women
with osteoporosis were three times more likely to sustain hip
fractures then those without this disease. A 1992 study found
that almost 60% of women ages 70 to 79 and 84% of women
over age 80 had osteoporosis.(5)
Th e most serious and disabling fracture is hip fracture. Th e
majority of hip fractures, up to 95%, are caused by falls, and
more than 76% of hip fractures occur among women. Th e
outcomes of these injuries are extremely serious. Mortality
following hip fracture is high — up to 20% of patients die
within a year following their injury. Th ose who survive often
experience signifi cant disability and diminished quality of
life. After being hospitalized for about one week, many hip
fracture patients are discharged to nursing homes. As many
as a quarter of formerly independent older adults remain in
nursing homes for at least a year.(2) However, since 1998, hip
fracture hospitalization rates among women have declined
17%.(4) In recent years, osteoporosis screening for women and
eff ective treatments to rebuild bone have become widespread,
and this public health measure might be refl ected in the
lower fracture rates. Men tend to have greater bone mass
and consequently less risk for hip fractures. However, men
do sustain hip fractures, especially after age 80, and the hip
fracture rates among men have not decreased. To counter
this trend, screening and osteoporosis treatment might be
broadened to include elderly men.
Costs of Fall Injuries
In 2000, there were almost 10,300 fatal fall injuries and 2.6
million medically treated nonfatal fall-related injuries. Direct
medical costs totaled $0.2 billion dollars for fatal and $19
billion for nonfatal injuries. Of the nonfatal injury costs, 63%
($12 billion) were for hospitalizations; 21% ($4 billion) were
for emergency department visits; and 16% ($3 billion) were
for treatment in outpatient settings. Medical expenditures for
women, who comprised 58% of the older adult population,
were two to three times higher than for men for all medical
treatment settings. Fractures accounted for just 35% of
nonfatal injuries but 61% of costs.(6) Hip fractures are the
most costly fall-related fractures. In 1991, Medicare costs for
this injury were estimated to be $2.9 billion. Th e total annual
cost of these injuries is projected to reach $240 billion by
the year 2040. Th ese costs do not account for the long-term
consequences of falls, such as disability, functional limitations,
decreased productivity, and diminished quality of life.(2)
Fall Risk Factors
Fall risk factors are personal or environmental characteristics
that increase a person’s chances of falling or of being injured
in a fall. Th e likelihood of falling increases with the number
of risk factors present.(2)
Personal risk factors include age, functional abilities and some
chronic conditions, and can be classifi ed as either modifi able
or non-modifi able. Non-modifi able risk factors include older
age, a past history of falls, and being female. Factors that are
potentially modifi able include lower-body weakness, problems
with gait and balance, taking four or more medications or
any psychoactive medications, and vision impairment. Th e
presence of certain chronic diseases such as Parkinson’s disease,
a history of stroke, and arthritis also increase the risk of falls.
Although these diseases are not modifi able, identifying and
treating symptoms (e.g., reducing arthritis pain and increasing
mobility) may reduce the risk of falling.(2)
Environmental risk factors may be present in and around the
home and in the community. Fall hazards include tripping
hazards such as throw rugs and clutter in walkways, lack of
stair railings or grab bars, slippery surfaces, unstable furniture
and poor lighting. Outdoor hazards include uneven pavement
or surfaces, pavement cracks, tree roots, slippery walking surfaces,
obstacles in walkways, snow or ice on walkways or steps, and poor
lighting. Hazards related to the built environment include poorly
maintained buildings and uneven steps; lack of safety features
such as handrails, curb cuts, and ramps; and inadequate lighting.(2)

Other State Efforts
Three other very strong state coalitions exist and are leading the way in promoting a variety of fall prevention strategies and initiatives:
These initiatives were created at the state level and were driven by the compelling state-level data about falls and fall-related injuries. Leadership within each of the coalitions has noted the need to have one organizing contact and a small leadership group, but to reach broadly into the community for inclusive coalition membership. Reducing falls and fall-related injuries is often seen as a long-term goal and these states recommend working with shorter term, realistic objectives that can demonstrate progress.
These states also stress the importance of always promoting the issue of fall prevention in the name of the coalition to create an interest in joining, and then connecting members through a leadership listserv. This broad communications strategy keeps community members up-to-date on coalition and research activities. Such strategies facilitate the participation and active involvement of local communities. New Hampshire hosts an annual conference for their broad membership that includes local teams who have worked on specifi c community or facility projects. Networking and sharing resources among the teams is encouraged.
30 | Spotlight: Reducing Falls Among Older Adults
Making Fall Prevention a Priority: Innovative State Efforts
Wisconsin’s Statewide Fall Prevention Initiative: The Power of Partnership in Action
Wisconsin’s Statewide Fall Prevention Initiative illustrates the power of partnerships in prevention efforts. Wisconsin consistently ranks second highest in the nation in fall deaths. To address this serious problem, in 1999 the Wisconsin Department of Health and Family Services (WI DHFS) launched a fall prevention initiative. Despite a lack of dedicated funding, WI DHFS established this initiative with representatives from the University of Wisconsin; gerontologists and staff from local fall prevention clinics; public health professionals; long term care and aging services; and community groups. In 2002, with the launch of a new health plan for the state, the initiative was formalized as the Statewide Fall Prevention Initiative. The initiative is coordinated by two WI DHFS divisions, Public Health and Disability and Elder Services. Key partners include local, county, and regional aging organizations and health departments; human and social service providers; the University of Wisconsin and the Wisconsin Medical Society.
The initiative has been successful on several fronts. A strong, diverse coalition has been established, and a statewide Fall Prevention Conference was held in 2005. Initiative activities include the development of community-based fall prevention programs and local coalitions to support such programs; promotional campaigns to encourage older adults to live healthy lifestyles that can reduce the risk of falls; and campaigns to encourage health providers to use evidence-based assessments of their patients’ fall risk factors. As a result of the coalition’s efforts, Wisconsin’s health plan for 2010, Healthiest Wisconsin 2010, included a specifi c fall prevention objective with short- and long-term outcomes. The state aging plan, Wisconsin State Plan for Serving Older People through the Older Americans Act, made reducing falls and fall deaths a priority. The Wisconsin Medical Society devoted the entire fall 2004 issue of Your Doctor, Your Health to the prevention of falls, and that year’s president, Dr. Michael Reineck, devoted his platform to fall prevention among older adults.
New Hampshire: Falls Risk Reduction Task Force
Michigan: Statewide Fall Prevention Workgroup
California: Fall Prevention Initiative

Spotlight: Reducing Falls Among Older Adults | 31
Reducing Falls: Effective Strategies
In recent years, research has determined that a number of
strategies can reduce falls among older adults: improving leg
strength and balance through exercise, managing medications,
improving vision, and, when combined with other strategies,
modifying the home environment. Th e most eff ective preventive
measures are multi-component interventions that combine
these approaches.(2)
The Role of Exercise
Exercise and physical therapy can address many risk factors
that predispose older adults to falling, including lower extremity
weakness, generalized deconditioning and poor endurance,
musculoskeletal stiff ness, slow reaction time to balance
disturbances, and slow walking speed. Recent research has
shown that overall, exercise interventions can reduce the
risk of falling by 12% and the number of falls by 19%.(2)
Diff erent types of exercise have been found to be eff ective.
Th ese include: Tai Chi, balance and gait training, and strength
building. A program of muscle strengthening and balance
retraining delivered at home by a trained health professional
also has been eff ective. Th ese exercise interventions have
employed a variety of approaches including group classes and
individualized in-home programs.(2,7)
The Role of Medication Management
Psychoactive medications, especially benzodiazepines,
antidepressants, and sedatives/hypnotics, increase the risk
of falling. Many older adults use these types of medications,
which can cause changes in mental and physical functioning,
dizziness or lightheadedness, balance diffi culties, confusion,
and sedation. Older adults who show such symptoms should
be referred to health professionals for a comprehensive
assessment. Physicians should regularly review each patient’s
medications for potential interactions and side eff ects that
may increase fall risk and where possible, reduce or eliminate
medications, or select alternatives. Reducing the number and
types of medications, particularly tranquilizers, sleeping pills
and anti-anxiety drugs, can be an eff ective fall prevention
strategy when used alone or as part of a multi-component
intervention.(2,8)
The Role of Environmental Changes
Home safety: More than half of all injuries among older
people occur in and around the home, and the home
environment itself is implicated in more than one-third of
these falls.(2) Eliminating hazardous conditions (e.g., clutter,
poor lighting) and adding supportive features (e.g. grab bars,
handrails) on stairs and in bathrooms are important fall
prevention strategies.(9) Home assessment and modifi cation
may be eff ective in reducing falls when conducted by trained
professionals such as occupational therapists and when
focused on those older adults who are at high risk of falling.(2)
A number of multi-component interventions that include
home modifi cations have proven eff ective among individuals
with a history of previous falls.(2)
Community safety: Outdoor community hazards include
uneven pavement or surfaces, pavement cracks, tree roots,
slippery walking surfaces, obstacles in walkways and snow
or ice on walkways or steps. Hazards related to the built
environment include uneven steps and unsafe stair design;
lack of safety features such as handrails, grab bars, curb cuts,
and ramps; and inadequate lighting. Eliminating existing
hazards and designing new communities with fall prevention
in mind are strategies that should be pursued.(9)
Multi-Component Strategies
Because falls are frequently caused by the interaction of
personal and environmental factors, eff ective interventions
include various components to address multiple risk factors.
Reviews of recent research suggest that the most eff ective
intervention strategy uses clinical assessment combined with
tailored fall risk-reduction strategies and patient follow-up.
Other eff ective multi-component interventions may incorporate
risk factor screening; tailored exercise or physical therapy to
improve gait, balance, and strength; medication management;
and other elements such as education about fall risk factors;
referrals to health care providers for treatment of chronic
conditions that may contribute to fall risk; and vision assessment
and correction.(2)

32 | Spotlight: Reducing Falls Among Older Adults
Preventing Falls
The National Action Plan
The Falls Free National Action Plan to prevent falls and fall-related injuries in older adults grew out of a meeting of leading fall prevention experts that was organized by the National Council on Aging’s Center for Healthy Aging, with support from the Archstone Foundation and the Home Safety Council. This strategic plan represents a state-of-the-art approach based on the diverse knowledge and experience of more than 58 national organizations, professional associations, and federal agencies that address fall prevention. The National Action Plan, released in March 2005, was developed as both a call to action and a guide for implementing an effective coordinated approach to reducing fall-related injuries and fatal falls among older adults. The 36 strategies and action steps described by the plan could be initiated within an 18-month timeframe, while actual implementation would require an extended time period and a signifi cant commitment of resources.
The contribution and collaboration of multiple and diverse groups — such as consumers, health care providers, policy makers, aging services professionals, representatives of building and construction industries, and community health professionals — will be needed to successfully carry out this plan. When implemented, these strategies will build greater community awareness and support and serve as a foundation for longer-term interventions. More importantly, these strategies will ensure that older adults have fewer falls and fall-related injuries, thereby maximizing their independence and quality of life.
The plan can be found on the Web at http://www.healthyagingprograms.org/resources/National%20Action%20Plan_Final.pdf.
National Action Plan Strategies
In developing the National Action Plan, participants felt it was essential to address the needs of both older adults and providers across four recognized risk factor areas: physical mobility, medication management, home safety, and community safety. It also was essential to balance the needs of both older adults and providers to ensure equality of supply and demand. For example, creating an awareness campaign may increase the demand for fall prevention services, but not the supply of knowledgeable providers. The cross-cutting goals were an attempt to link providers and the community.
Strategies from the action plan include the following:
Physical mobility:
» Increase awareness among older adults, their caregivers, and health care professionals of factors that can contribute to decline in physical mobility.
» Increase the availability of appropriate physical mobility programs and services for older adults.
Medications management:
» Increase the number of older adults who have annual medication reviews conducted by health care providers or pharmacists and ensure this review includes an adequate focus on falls and fall-related injury prevention, with the goal of reducing or eliminating medications that increase fall risk.
Home safety:
» Raise awareness and disseminate information about home safety practices and options for caregivers and older adults to reduce falls.
Environmental safety in the community:
» Increase awareness among local, state, and federal policy makers and regulatory offi cials of the scope and impact of falls and fall-related injuries and death among older adults.
» Focus on sidewalk safety with a clear priority of public environmental safety for older adults.
Cross-cutting issues:
» Improve fall risk management of those at increased risk for falls by promoting coordinated assessment and interventions targeting known fall risk factors.
The Falls Free™ Coalition was established as a result of this meeting and has since grown with the addition of other key organizations and statewide coalitions. Coalition goals include:
• Promoting collaboration among members;
• Bringing awareness to this issue;
• Publicizing the effectiveness of risk factor identifi cation and intervention; and
• Promoting and facilitating the implementation of the 36 strategies contained within the National Action Plan.
For more information on the coalition, visit http://www.healthyagingprograms.org.
» CALL TO ACTION »

Spotlight: Reducing Falls Among Older Adults | 33
A Program That Works
Fear of Falling: A Matter of Balance
Fear of falling is a common issue among older adults including those who have fallen and those who have not. Older people often restrict their activities because they think it will reduce their risk of falling, but this can actually lead to physical deconditioning and increased fall risk. The Boston University Roybal Center Consortium developed A Matter of Balance, which uses cognitive restructuring techniques and skills training to change perceptions and behaviors in older adults who have limited their activity levels because of fears about falling. The program has been implemented successfully by senior centers, senior housing sites, hospitals, and home health agencies.
A low-cost facilitator’s manual and videotape provide a step-by-step implementation guide for practitioners and providers in clinical and community settings. For more information about the program, visit The National Resource Center for Safe Aging at http://www.safeaging.org/model/programs/fearoffalling/fearoffalling.asp or the Boston University Web site at: http://www.bu.edu/hdr/products/balance/index.html.(10)
Recently, the National Council on the Aging and the Administration on Aging have been working with states to develop and test a “lay leader” model for A Matter of Balance. Initial fi ndings are very promising and published results should be available in the future.
For more information, visit http://www.mainehealth.org/mh_body.cfm?id=3394.
Selected Additional Resources
• American Geriatrics Society: Falls in Older Adults Management in Primary Practice www.americangeriatrics.org/education/falls.shtml
• CDC’s National Center for Injury Prevention and Control: Preventing Falls Among Older Adults http://www.cdc.gov/ncipc/duip/preventadultfalls.htm
• Center of Excellence for Fall Prevention www.stopfalls.org
• Home Safety Council: State of Home Safety Facts About Safety in the Home http://homesafetycouncil.org/state_of_home_safety/sohs_2004_p017.pdf
• Practicing Physician Education in Geriatrics Falls Toolkit http://www.gericareonline.net/tools/eng/falls/index.html
• National Center for Patient Safety Falls Toolkit www.patientsafety.gov/SafetyTopics/fallstoolkit/index.html
• National Center for Safe Agingwww.safeaging.org/model/default.asp
• National Council on the Aging’s Center for Healthy Aging and Falls Free Coalitionhttp://www.healthyagingprograms.com/content.asp?sectionid=113
• National Resource Center on Supportive Housing and Home Modifi cation www.homemods.org
• National Safety Council Fall Prevention Projecthttp://www.nsc.org/issues/healthy_aging.htm
• National Fire Protection Association: Remembering When: A Fire and Fall Prevention Program for Older Adults™ http://www.nfpa.org/categoryList.asp?categoryID=203&URL=Learning/Public%20Education/Programs/Remembering%20When™
References
1. Web-based Injury Statistics Query and Reporting System (WISQARS) (Online). National Center for Injury Prevention and Control, Centers for Disease Control and Prevention (producer). Available from: URL: www.cdc.gov/ncipc/wisqars (accessed Dec. 7, 2006).
2. Stevens JA. Falls among older adults — risk factors and prevention strategies. In Falls Free: Promoting a National Falls Prevention Action Plan. Washington, DC: The National Council on the Aging; 2005.
3. Stevens JA, Dellinger AM. Motor vehicle and fall related deaths among older Americans 1990–98: sex, race, and ethnic disparities. Injury Prevention 2002; 8(4):272-5.
4. Stevens JA, Ryan G, Kresnow M. Fatalities and injuries from falls among older adults—United States, 1993–2003 and 2001–2005. MMWR 2006;55(45):1222–1224.
5. Melton LJ, Chrischilles EA, Cooper C, Lane AW, Riggs BL. How many women have osteoporosis? Journal of Bone and Mineral Research 1992;7(9):1005-10.
6. Stevens JA, Corso PS, Finkelstein EA, Miller TR. Cost of Fatal and Nonfatal Falls among Older Adults. Injury Prevention 2006;12(5):290–295.
7. Rose DF. The role of exercise in reducing falls and fall-related injuries in older adults. In Falls Free: Promoting a National Falls Prevention Action Plan. Washington, DC: The National Council on the Aging; 2005.
8. Cameron KA. The role of medication modifi cation in fall prevention. In Falls Free: Promoting a National Falls Prevention Action Plan. Washington, DC: The National Council on the Aging; 2005.
9. Pynoos J, Sabata D, Choi IH. The role of the environment in fall prevention at home and in the community. In Falls Free: Promoting a National Falls Prevention Action Plan. Washington, DC: The National Council on the Aging; 2005.
10. Tennstedt S, Howland J, Lachman M, Peterson E, Kasten L, Jette A. A randomized, controlled trial of a group intervention to reduce fear of falling and associated activity restriction in older adults. Journals of Gerontology Series B- Psychological Sciences & Social Sciences. 53(6):P384-92, 1998 Nov.

Appendix
Healthy People 2010 Objectives
Healthy People 2010 objectives are national health goals for the United States to
achieve over the fi rst decade of the new century. These objectives set specifi c
targets to help guide states, communities, professional organizations, and
others in developing programs to improve health for all Americans. Healthy
People 2010 objectives and targets were developed in consultation with a wide
range of experts on the basis of the best available and most current scientifi c
knowledge. In this report, the 15 indicators used to assess the health of adults
aged 65 or older are based on the Healthy People 2010 targets.

Appendix | 35
TABLE 5
Report Card Indicators and Healthy People 2010 Targets
Source: U.S. Department of Health and Human Services, http://www.healthypeople.gov.
Indicator Healthy People 2010 Target
Health Status
1. Physically unhealthy days No target specifi ed.
2. Frequent mental distress No target specifi ed.
3. Oral health: complete tooth lossNo more than 20% of adults aged 65 years or older who have lost all of their natural teeth.
4. Disability No target specifi ed.
Health Behavior
5. No leisure-time physical activity in past month
No more than 20% of adults aged 18 years or older with no leisure-time physical activity.
6. Eating ≥ fi ve servings of fruits and vegetables daily
At least 75% of people aged 2 years or older who consume at least two daily servings of fruit.
At least 50% of people aged 2 years or older who consume at least three daily servings of vegetables, with at least one-third of these servings being dark green or orange vegetables.
7. Obesity No more than 15% of adults aged 20 years or older who are obese.
8. Current smoking No more than 12% of adults aged 18 years or older who smoke.
Preventive Care and Screening
9. Flu vaccine in past yearAt least 90% of adults aged 65 years or older who had a fl u shot within the past year.
10. Ever had pneumonia vaccineAt least 90% of adults aged 65 years or older who have ever received a pneumonia vaccine.
11. Mammogram within past two years At least 70% of women aged 40 years or older who had a mammogram within the past two years.
12. Ever had colorectal screening At least 50% of adults aged 50 years or older who have ever received a sigmoidoscopy.
13. Up-to-date on selectedpreventive services
No target specifi ed.
14. Cholesterol checked within past fi ve years
At least 80% the proportion of adults aged 18 years or older who have had their cholesterol checked in the past fi ve years.
Injuries
15. Hip fracturesNo more than 416 hospitalizations per 100,000 persons aged 65 years or older for women and no more than 474 for men.

36 | Appendix
Major Data Sources and Technical Information
Behavioral Risk Factor Surveillance System
For the past two decades, CDC’s Behavioral Risk Factor
Surveillance System (BRFSS) has helped states survey U.S.
adults regarding a wide range of personal behaviors that
aff ect their health. Th e BRFSS focuses primarily on physical
activity; nutrition; tobacco use; and use of proven preventive
services (such as cancer screenings). All of these factors can
have a tremendous impact on the rates of the nation’s leading
health-related causes of death. BRFSS survey questions assess
how many people engage in these and other health and risk
behaviors, whether these behaviors are increasing over time,
and which populations might be most at risk. Th e crucial
information gathered through this state-based telephone
survey system is used by national, state and local public health
agencies to monitor the need for and the eff ectiveness of
various public health interventions.
Although the BRFSS is one of our most useful tools for
assessing the health of the older adult population, it has at
least three limitations. First, it excludes people who do not
have telephones or who live in institutions such as nursing
homes. Second, it may underrepresent people who are severely
impaired because they lack the functional capacity required
to participate in the survey. Th ird, all responses to the BRFSS
are self-reported and therefore have not been confi rmed by
a health care provider.
Th e BRFSS is administered and supported by the Division of
Adult and Community Health, National Center for Chronic
Disease Prevention and Health Promotion, CDC.
For more information, visit http://www.cdc.gov/brfss.
National Hospital Discharge Survey
Th e National Hospital Discharge Survey (NHDS), which
has been conducted annually since 1965, gathers information
on characteristics of inpatients discharged from nonfederal
short-stay hospitals in the United States. Th e NHDS collects
data from approximately 270,000 inpatient records from a
national sample of about 500 hospitals. Th e survey covers
only hospitals with an average length of stay of fewer than
30 days for all patients, general hospitals, and children’s general
hospitals. It excludes federal, military, and Department
of Veterans Aff airs hospitals, as well as hospital units of
institutions (such as prison hospitals) and hospitals with
fewer than six patient beds.
Th e NHDS is administered and supported by the Hospital
Care Statistics Branch, National Center for Health Statistics,
CDC. Data are disseminated annually through published
documents; public-use data tapes; data diskettes; CD-ROMs;
and downloadable fi les.
For more information, visit http://www.cdc.gov/nchs/about/major/hdasd/nhds.htm.
Data Warehouse on Trends in Health and Aging
With support from the National Institute on Aging, CDC’s
National Center for Health Statistics (NCHS) created the Data
Warehouse on Trends in Health and Aging, a Web-based, user-
friendly tool that provides access to up-to-date information
on the health of older Americans. Th e Data Warehouse is a
collection of data tables that provide information on trends
in health-related behaviors, health status, health care use, and
health care costs among older adults. Th e system includes a data
dissemination tool called Beyond 20/20® that allows users to
retrieve and display customized tables of health information on
older men and women of various ages, races, and ethnicities.
For more information, visit http://www.cdc.gov/nchs/agingact.htm.
WISQARS™ (Web-based Injury Statistics Query and Reporting System)
WISQARS™ is CDC’s National Center for Injury Prevention
and Control’s interactive, online database that provides
customized injury-related mortality data and nonfatal injury
data. Th is data is useful for research and for making informed
public health decisions.
Mortality reports are based on data from U.S. death certifi cates,
and nonfatal reports are based on data from a representative
sample of nonfatal injuries treated in U.S. hospital emergency
departments. All reports can provide a statistical table about
a particular injury’s cause and other user-specifi ed details, such
as age range and sex.
For more information and an on-line tutorial, visit http://www.cdc.gov/ncipc/wisqars/default.htm.

Acknowledgements
Advisory Board Members David Baldridge, PhDExecutive DirectorAmerican Association for International Aging
William F. BensonPrincipalHealth Benefi ts ABCs
Yanira Cruz, MPHPresident and CEOThe National Hispanic Council on Aging
Karyne JonesPresident and CEOThe National Caucus and Center on Black Aged
Bob MeyersPresidentNational Press Foundation
Judy Salerno, MD, MSDeputy DirectorNational Institute on Aging, National Institutes of Health
Mary E. Tinetti, MDDirectorYale Program on Aging
Project Co-DirectorsMargaret J. Moore, MPHPublic Health AdvisorCenters for Disease Control and Prevention
Andrée C. HarrisPublic Health AnalystCenters for Disease Control and Prevention
Leslie M. Hardy, MHSVice PresidentThe Merck Company Foundation
Michele Patrick, MGAConsultant
Principal WritersLisa Jeannotte, MAConsultant
Margaret J. Moore, MPHPublic Health AdvisorCenters for Disease Control and Prevention
Falls Working Group Members Bonita Lynn Beattie, PT, MPT, MHAVice PresidentResearch and DemonstrationsNational Council on Aging
Catherine GordonSenior Public Health AnalystCenters for Disease Control and Prevention
Margaret J. Moore, MPHPublic Health AdvisorCenters for Disease Control and Prevention
Judy A. Stevens, PhDEpidemiologistCenters for Disease Control and Prevention
Special thanks to:CDC Foundation
ContributorsBarb Alberson, MPHBill Elder, PhDTracy EllingsonAnne Esdale, MPHHelen GrangeLinda HaleJulie D. Kosteas, MPHTricia SchlechteRhonda Siegel
Centers for Disease Control and PreventionLindsay Abraham, MPHLynda A. Anderson, PhDBrian Armour, PhDJulie Bolen, PhD, MPHCynthia Crocker Amanda CrowellKristine Day, MPHClark Denny, PhDCynthia GelbBarbara F. Gooch, DMD, MPHCheryl Holiness, MS Rosemarie Kobau, MPHJudy Kruger, PhD, MSJason E. Lang, MPH, MSLouise Murphy, PhDSarah O’Leary, MPH, MAStephanie Ramsey, MSJaya Rao, MD, MHSJudy A. Stevens, PhDKristina Theis, MPHSherry Williams, MPH, CHESHatice Sahin Zahran, MD, MPH
The State of Aging and Health in America 2007
Resources for JournalistsCDC has partnered with the American Society on Aging (ASA) to create background material for the media on several topics related to older adult health, ranging from West Nile Virus to epilepsy. These materials are available at http://www.asaging.org/media/cdc.cfm. Topics related to this report include the following:
• Cognitive Health
• Disability
• Physical Activity
• Immunizations
• Heart Disease
• Fall Prevention
An interactive version of The State of Aging and Health in America 2007 report is available online at www.cdc.gov/aging.

Centers for Disease Control and PreventionThe Centers for Disease Control and Prevention, as the sentinel for the health of people in the United States and throughout the world, strives to protect people’s health and safety, provide reliable health information, and improve health through strong partnerships. CDC’s mission is to promote health and quality of life by preventing and controlling disease, injury, and disability.
The Merck Company Foundation2007 marks the 50th anniversary of The Merck Company Foundation, a U.S.-based, private charitable foundation. Established in 1957 by the global research-driven pharmaceutical company Merck & Co., Inc., the Foundation is funded entirely by the Company and is Merck’s chief source of funding support to qualifi ed non-profi t, charitable organizations.
www.cdc.gov/agingwww.merck.com/cr