the social and economic value of adult grassroots …
TRANSCRIPT
THE SOCIAL AND ECONOMIC VALUE OF ADULT GRASSROOTS FOOTBALL IN ENGLANDAN ANALYSIS OF THE CONTRIBUTION OF GRASSROOTS FOOTBALL TO THE NATION’S ECONOMY AND WELLBEINGJULY 2019
For enquiries, please contact: [email protected]
The Football Association Limited THE SOCIAL AND ECONOMIC VALUE OF ADULT GRASSROOTS FOOTBALL IN ENGLAND - JULY 20192
Preface
The economic and social benefits of playing the beautiful game
Whether the measure is fans or participation, football is the most popular sport in the world. And in terms of global popularity, English
professional football often comes out top across a range of metrics – substantial TV revenue, large transfer fees and high attendances. But English football operates on multiple levels, including a large grassroots base, with over 12 million players participating in different forms of the game, including traditional 11-a-side and other recreational formats.
Grassroots football is ingrained and embedded in many local communities and, as this important report shows, it makes substantial contributions to the economy and to the quality of life of those who play the game. It has frequently been argued that playing football improves health, social engagement and self-efficacy. This report not only provides rigorous support for many of these benefits, it also provides quantitative estimates of the impacts which show the substantial social return from playing football.
The conventional approach to evaluating the impact of a range of activities (including sports) is to measure their direct contribution to the economy. This report shows that grassroots football directly contributes £2 billion a year to the national economy – through expenditure on kit, membership fees and socialising. This, in turn, generates tax revenue to help fund public services.
Although measuring direct economic impacts is important, this does not fully capture how activities, such as playing football, may influence the quality of life. As emphasised by the influential Fitoussi Report into ‘Measurement of Economic Performance and Social Progress’, it is important to evaluate the non-economic aspects of people’s lives including what they do, how they feel, and the environment that they live in.1 As this report shows, those who play football report significantly higher levels of general health, happiness, confidence and trust compared to those who do not play sport.
Participating in football is associated with improved physical and psychological health. Regular footballers are healthier than those who do not play the game, and this means that they visit the doctor less often. This report shows that the health benefits of playing regular grassroots football generate a cost saving to the NHS of £43.5million a year. This is important but it does not capture the broader impact of playing football on the quality of life.
Using the latest empirical techniques it is possible to capture the monetary value of the improvement in the quality of life which results from playing football. As demonstrated in this report this is equivalent to a total of £8.7 billion per year for those who play the game in England. This is a significant social rate of return on the investment and participation in grassroots football.
Grassroots football in England is evolving and developing: there are rising rates of female participation, new formats of the game and new opportunities to participate. This report shows the significant impact that playing football, in all its forms, has on the economy and on the quality of life of those playing the game. It is essential that the important evidence presented in this report is considered by all those who may invest in grassroots football and when evaluating the footballing needs of local communities.
Michael Kitson Economist Judge Business School University of Cambridge
1Commission on the Measurement of Economic Performance and Social Progress, Stiglitz, J. E., Sen, A., & Fitoussi, J. P. (2009), Report by the commission on the measurement of economic performance and social progress, available at: https://ec.europa.eu/eurostat/documents/118025/118123/Fitoussi+Commission+report
The Football Association Limited THE SOCIAL AND ECONOMIC VALUE OF ADULT GRASSROOTS FOOTBALL IN ENGLAND - JULY 2019 3
Contents
1. Executive Summary 4
2. Methodology and approach 6
3. Adult grassroots football: Quality of life analysis 8
4. Adult grassroots football: Economic analysis 9
5. Adult grassroots football expenditure: Economic analysis 10
6. Adult grassroots football: Estimating the value of the non-economic benefits of regular participation 13
7. Summary valuation table 18
8. Appendices: 21
8.1. Sample groups and QoL analysis methodology 22
8.2. Sports types included in FA participation tracker survey 30
8.3. An introduction to economic impact of grassroots football 31
8.4. Economic analysis methodology 32
8.5. Demographic breakdown of grassroots football 35
8.6. Technical notes: Regression analysis 37
8.7. Regression Tables from Section 6 (QoL analysis) 38
8.8. Aggregation of individual values to the national level 49
8.9. Sensitivity analysis: Association between higher football expenditure and commitment (frequency of playing football)
50
8.10. Secondary benefits: NHS savings analysis, based on general health of regular footballers 52
9. Authors 55
The Football Association Limited THE SOCIAL AND ECONOMIC VALUE OF ADULT GRASSROOTS FOOTBALL IN ENGLAND - JULY 20194
1. Executive Summary
The Football Association [The FA] is the not-for-profit governing body of football in England. It is responsible for promoting and developing every level of the game, from grassroots through to the professional game, and generates revenue to support the investment of well over £180m into English football each year.
The FA oversees 28 England international teams, across men’s, women’s, youth and disability football, as well as running FA Competitions, including the Emirates FA Cup and SSE Women’s FA Cup. It also operates the world-class facilities of Wembley Stadium and St. George’s Park, all aiming to ‘Unite the Game and Inspire the Nation’.
The FA invests approximately £1 million per week into grassroots football. For the first time in its history, The FA has sought to understand the social and economic value of adult grassroots football. In grassroots football, no-one is paid to play and no-one pays to watch. There are over 12 million people who play football in England – with over eight million adults (18+) playing the game.1
This report shows the contribution of adult grassroots football to the nation’s economy and to the wellbeing of society. The FA’s survey of approximately 9,000 respondents provides a nationally representative sample that allows for robust statistical analysis. This is the largest study of this type to date for a National Governing Body in the United Kingdom. This provides The FA’s first estimate of the value of football in monetary terms, which offers compelling evidence of the economic impact and value of adult grassroots football in England.
Key findingsAll the key findings below are true for both male and female adult participants, unless specifically stated.
Economic impacts:1. The value of regular grassroots football in England is £10.769 billion each year (p18)2, which comprises:
• Direct economic value of £2.050 billion per year.3
• Social wellbeing value of £8.712 billion per year.4
2. The average annual personal spend of regular grassroots footballers on football is £326 per person per year (p10).5
• The tax contribution to the Exchequer is £410 million per year.6
3. The health benefits of playing regular grassroots football produce cost savings to the NHS of £43.5 million per year through reduced GP visits only (p15).7
Other social outcomes:4. Grassroots football players report significantly higher levels of happiness, general health, confidence and trust compared with those who play no sport (p14).
5. Grassroots football players report significantly higher levels of general health, confidence, and trust compared with those who play other sports (p14).8
6. Grassroots football players report a stronger belief that playingfootball has improved their confidence, concentration, motivation, and social mixing, compared with individual and other team sports (p43).
7. Female grassroots football players report the highest levels of self-confidence as a result of playing football (p43).
8. Lower income groups experience some greater quality of life benefits from football compared with higher income groups, specifically in their health and confidence levels (p43).9
9. 11-a-side footballers report higher levels of health and happiness compared to other types of football (p44)
In summary, playing grassroots football is associated with positive quality of life benefits to all layers of society, and in some cases these benefits are higher for those from socially-disadvantaged groups (p43).
1Annual figures from FA Tracker survey based on those playing football in any format, and for any frequency of time. 2These figures are based on the value of regular football (playing in the past month), against reference group of rest of population, including those who play other sports and those who play no sports, and include both the male and female game. The stated value includes estimated impact of football on a person’s wellbeing in equivalent monetary terms, through market prices paid and wellbeing benefits. This value does not include wider multiplier effects on the economy or transfers back to the Exchequer in the form of taxes or Exchequer savings. Note, figure rounded to 3 decimal places from total figure of £10,769,270,352.3For all regular grassroots footballers in England this is measured through the average annual personal spend of regular grassroots footballers (£326 per person per year). 4This is estimated using the Wellbeing Valuation method, measured as the equivalent amount of income a person would need to make up for the wellbeing they gain from playing regular football. 5This includes equipment, football club membership fees, training courses, football pitch rentals and socialising. 6Given that VAT (20%) is paid on the expenditures in (3), the tax contributions to the Exchequer amount to £409,926,222 per year. 7The predicted savings to the NHS are made through reduction in costs based on reduced visits to GP. Note this is a partial value which does not include savings to other areas of the Exchequer such as hospitals and social care. 8Both team sports and individual. 9Reporting a stronger positive association between playing football and health, confidence and trust compared to higher income groups. Income groups based on household income level (lower income group classed as having household income below the sample median).
The Football Association Limited THE SOCIAL AND ECONOMIC VALUE OF ADULT GRASSROOTS FOOTBALL IN ENGLAND - JULY 2019 5

The Football Association Limited THE SOCIAL AND ECONOMIC VALUE OF ADULT GRASSROOTS FOOTBALL IN ENGLAND - JULY 20196
2. Methodology and approach
Name Included
Adults aged 18+
England residents
Regular footballers (played in the past month)
Males
Females
BAME
Age: Young (18-24)
Age: Mid (25-55)
Age: Older (>55)
Lower income
Higher income
11-a-side football
5/6/7-a-side football
Casual kick-about with friends/family in the park
Futsal
Expenditure on family members
Volunteers
Staff/officials
Youth (aged <18)
Rest of UK (Scotland, Wales, N.Ireland)
The research in this report is new analysis which combined The FA participation tracker survey with other national data.10 This project used data collected between August 2017 and March 2018, which provided an overall sample of 8,713 respondents aged 18+. This is a large dataset that enables nationally representative and robust statistical analysis.
The FA appointed Jump Projects to analyse the data to understand the impact of grassroots football using best practice methods of policy evaluation (in line with HM Treasury Green Book 2018), and rigorous statistical analysis and robust reporting methodologies.
The grid below summarises the groups included in this analysis.11 Full description of the sample groups, survey questions and analysis methodology are provided in Appendix 8.1.
The FA measures the impact of grassroots football against four key social and economic areas:
• Physical wellbeing (physical health; fitness levels; weight).
• Mental wellbeing (mental health; happiness; anxiety; quality of sleep).
• Social & community development (socialisation; social mixing; feeling part of community).
• Economic impact of grassroots football.
The FA’s four social and economic areas align closely with Government policy, in particular the Department for Digital, Culture, Media and Sport (DCMS) Sporting Future strategy: the ‘DCMS Five’ wellbeing outcomes.12 This strategy for improving wellbeing through sport which advocates that all sports are measured on five outcomes:
• Physical health.
• Mental health (subjective wellbeing).
• Individual development (self-efficacy, resilience, skills, employment).
• Community development (social cohesion, trust).
• Economic impact (impact on GDP).
10The participation tracker engages respondents via a 15 minute online quantitative survey. Fieldwork is conducted every month continuously (sample recruited via panel sample). 11Sample groups: Current football players (in the past 12 months); n=1,347;15.5%; Regular football players (played in the past month); n=1,189; 13.7%; Other team sport players (in the past 12 months); n=349; 4.0%; Individual sport players (in the past 12 months); n=4,424; 50.8%; Non-sport players (in the past 12 months); n=2,593; 29.8%; Plays other sport as well as football; n=1,193;13.7%. 12Sporting Future: A New Strategy for an Active Nation Department for Culture Media and Sport 2015: https://www.gov.uk/government/publications/sporting-future-a-new-strategy-for-an-active-nation
The Football Association Limited THE SOCIAL AND ECONOMIC VALUE OF ADULT GRASSROOTS FOOTBALL IN ENGLAND - JULY 2019 7
2. Methodology and approach
The analysis in this report is in two parts:
Quality of life (QoL) outcomes: The data is used to assess the statistical association between grassroots football and a range of QoL outcomes: physical health and wellbeing; mental wellbeing; and social & community development. Physical health, mental health and social & community development are measured in terms of individual-level health, wellbeing, and social outcomes. In addition, analysis of the data shows that the health and wellbeing effects differ between different target groups – female footballers, Black, Asian, Minority Ethnic (BAME) groups, and lower socio-economic groups – and different formats of football (11-a-side, 5/6/7 a-side, Futsal and casual kick-about with friends/family in the park).
Economic impact of grassroots football: The economic impact of grassroots football is measured by two methods (See Appendix 8.3 for a detailed Introduction to economic impact of grassroots football):
• The personal expenditure of footballers (membership, social, travel costs etc.) measured by market prices.
• The monetary value of improvements to health/QoL benefits to the individual from playing grassroots football, estimated using the ‘Wellbeing Value’ equivalent income method (explained in detail in Appendix 8.4). This method applies monetary values to the physical health outcomes associated with football by estimating the equivalent monetary amount that would be required to compensate an individual for the health and quality of life improvements provided by playing regular football.13
The analysis also estimates the associated savings to the Exchequer (NHS savings) produced by the healthier society that regular grassroots football creates (Section 6.3).
The economic analysis in this report is conservative for two reasons: it accounts only for those who play regular football, and not the value it provides to those who play less regularly; and it estimates monetary values by comparing the wellbeing of regular footballers to the rest of the population (both those who play other sports, and non-sport players), rather than making comparisons only with those who do not engage in sport.
13The Wellbeing Valuation (WV) method identifies what sum of money should be given to (or taken away from) the average respondent to make them as well-off as they were/would have been without playing football. This sum is then taken to be the monetary wellbeing value of our outcome of interest, in this case playing regular football. Wellbeing Valuation is adopted from previous academic and UK Government studies: Fujiwara et al. Quantifying and Valuing the Wellbeing Impacts of Culture and Sport: Research publication to assess the wellbeing impacts of culture and sport (DCMS 2014). https://assets.publishing.service.gov.uk/government/uploads/system/uploads/attachment_data/file/304899/Quantifying_and_valuing_the_wellbeing_impacts_of_sport_and_culture.pdf.
The Football Association Limited THE SOCIAL AND ECONOMIC VALUE OF ADULT GRASSROOTS FOOTBALL IN ENGLAND - JULY 20198
3. Adult grassroots football: Quality of life analysis
Outcomes: Comparisons between football, other team sports, individual sports and non-sports. The data enables detailed regression analysis to identify the QoL benefits of grassroots football (as outlined in Appendix 8.1) whilst taking account of a person’s income, age, sex and location in the UK (see Appendix 8.5 for demographic breakdown of who plays grassroots football). This provides greater confidence that the outcomes measured are associated with sport engagement, and not some other artefact of the data.14 This section compares the average QoL measures among footballers, other team sport players, other individual sport players, and those who play no sport:
• The difference in QoL between footballers and those who play no sport.
• The difference in QoL between footballers and those who play other team sports, and then individual sports.
Summary: QoL analysis of grassroots football.
The data shows that (full results reported in Appendix 8.7):
• Grassroots football players (on average) report higher QoL on multiple measures compared with those who play no sport (Appendix Table 8-8).
• The QoL benefits associated with grassroots football are greater than those from other sports: The coefficients also show that football has a much stronger association in this regard than other sports (both team and individual sports, acknowledging a low sample size within the other team sport subgroup) (Appendix Table 8-9).
Looking at QoL benefits for key marginal groups in society (Appendix Table 8-11):
• Lower income groups experience greater health and confidence benefits from playing football on average compared with higher income groups.
• There is a significant and positive association between playing football and health, trust and social mixing for both BAME and white groups.
In summary, the findings in this section suggest that playing football is good for your health, happiness, confidence, and trust in others compared to playing no sport, and that football may be better for you in all these regards compared to other types of sport.
These results may have wider implications, suggesting that the football team and club are an important part of both our individual lives and our communities. The findings of this report are consistent with findings elsewhere15 that show that playing team sports is associated consistently with higher QoL outcomes compared with engaging in non-team sports.
14Use of multivariate regressions to enable us to control for as many of the confounding factors that, alongside engagement in sport, may drive the outcome measures. 15Fujiwara et al. Quantifying and Valuing the Wellbeing Impacts of Culture and Sport: Research publication to assess the wellbeing impacts of culture and sport (DCMS 2014): https://www.gov.uk/government/publications/quantifying-and-valuing-the-wellbeing-impacts-of-culture-and-sport
The Football Association Limited THE SOCIAL AND ECONOMIC VALUE OF ADULT GRASSROOTS FOOTBALL IN ENGLAND - JULY 2019 9
4. Adult grassroots football: Economic analysis
The economic evaluation section of this report estimates the value of regular grassroots football both in terms of expenditure (Section 5), and health and wellbeing benefits to the individual (Section 6.1).
The value of football to the individual is then used to estimate the aggregate value that grassroots football providesto England using HM Treasury Green Book (2018) consistent methods. A full explanation of the methodolog applied in the economic analysis of grassroots football is provided in Appendix 8.4.
1. The value of regular grassroots football in England is £10.769 billion each year (p18)16, which comprises:
• Direct economic value of £2.050 billion per year17.
• Social wellbeing value of £8.712 billion per year18.
2. The average annual personal spend of regular grassroots footballers on football is £326 per person per year (p10).19
• The tax contribution to the Exchequer is £410 million per year20.
3. The health benefits of playing regular grassroots football produce cost savings to the NHS of £43.5 million per year through reduced GP visits only (p15).21
• Lower income groups experience greater health and confidence benefits from playing football on average compared with higher income groups.
• There is a significant and positive association between playing football and health, trust and social mixing for both BAME and white groups.
16These figures are based on the value of regular football (playing in the past month), against reference group of rest of population, including those who play other sports and those who play no sports, and include both the male and female game. The stated value includes estimated impact of football on a person’s wellbeing in equivalent monetary terms, through market prices paid and wellbeing benefits. This value does not include wider multiplier effects on the economy or transfers back to the Exchequer in the form of taxes or Exchequer savings. Note, figure rounded to 3 decimal places from total figure of £10,769,270,352. 17For all regular grassroots footballers in England this is measured through the average annual personal spend of regular grassroots footballers (£326 per person per year). 18This is estimated using the Wellbeing Valuation method, measured as the equivalent amount of income a person would need to make up for the wellbeing they gain from playing regular football. 19This includes equipment, football club membership fees, training courses, football pitch rentals and socialising. 20Given that VAT (20%) is paid on the expenditures in (17), the tax contributions to the Exchequer amount to £409,926,222 per year. 21The predicted savings to the NHS are made through reduction in costs based on reduced visits to GP. Note this is a partial value which does not include savings to other areas of the Exchequer such as hospitals and social care.
The Football Association Limited THE SOCIAL AND ECONOMIC VALUE OF ADULT GRASSROOTS FOOTBALL IN ENGLAND - JULY 201910
5. Adult grassroots football expenditure: Economic analysis
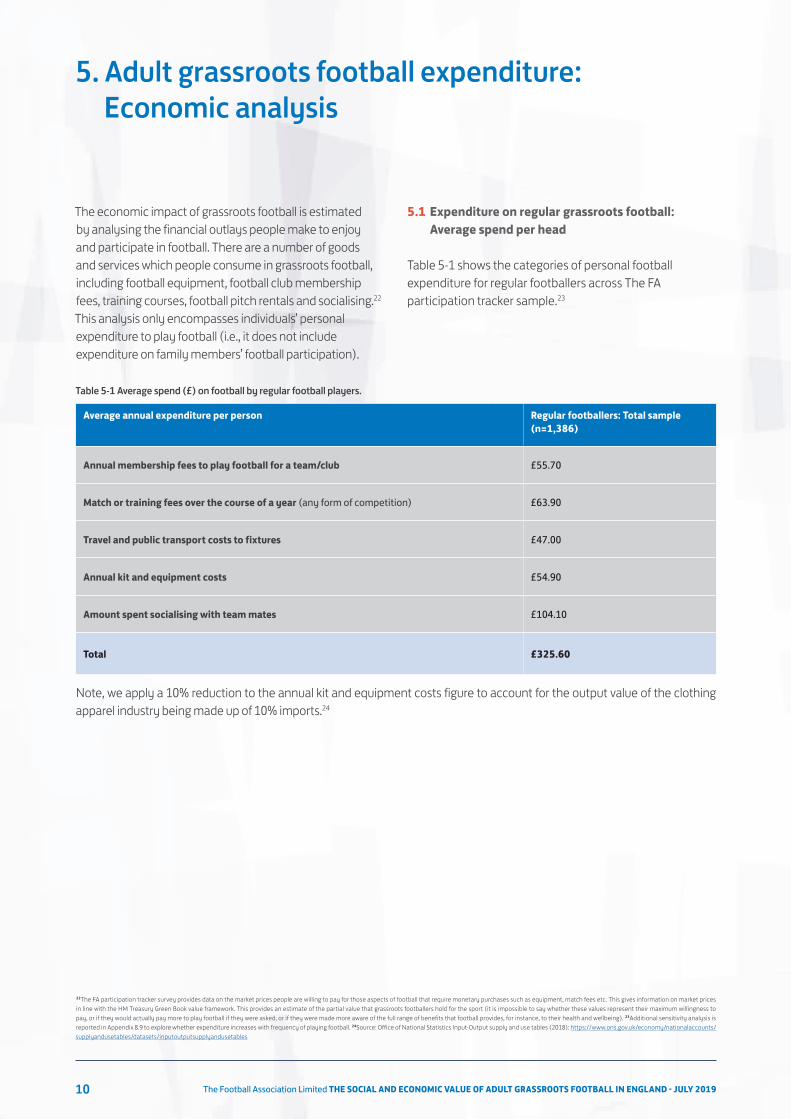
The economic impact of grassroots football is estimated by analysing the financial outlays people make to enjoy and participate in football. There are a number of goods and services which people consume in grassroots football, including football equipment, football club membership fees, training courses, football pitch rentals and socialising.22
This analysis only encompasses individuals’ personal expenditure to play football (i.e., it does not include expenditure on family members’ football participation).
Note, we apply a 10% reduction to the annual kit and equipment costs figure to account for the output value of the clothing apparel industry being made up of 10% imports.24
5.1 Expenditure on regular grassroots football: Average spend per head
Table 5-1 shows the categories of personal football expenditure for regular footballers across The FA participation tracker sample.23
22The FA participation tracker survey provides data on the market prices people are willing to pay for those aspects of football that require monetary purchases such as equipment, match fees etc. This gives information on market prices in line with the HM Treasury Green Book value framework. This provides an estimate of the partial value that grassroots footballers hold for the sport (it is impossible to say whether these values represent their maximum willingness to pay, or if they would actually pay more to play football if they were asked, or if they were made more aware of the full range of benefits that football provides, for instance, to their health and wellbeing). 23Additional sensitivity analysis is reported in Appendix 8.9 to explore whether expenditure increases with frequency of playing football. 24Source: Office of National Statistics Input-Output supply and use tables (2018): https://www.ons.gov.uk/economy/nationalaccounts/supplyandusetables/datasets/inputoutputsupplyandusetables
Average annual expenditure per person Regular footballers: Total sample (n=1,386)
Annual membership fees to play football for a team/club £55.70
Match or training fees over the course of a year (any form of competition) £63.90
Travel and public transport costs to fixtures £47.00
Annual kit and equipment costs £54.90
Amount spent socialising with team mates £104.10
Total £325.60
Table 5-1 Average spend (£) on football by regular football players.
The Football Association Limited THE SOCIAL AND ECONOMIC VALUE OF ADULT GRASSROOTS FOOTBALL IN ENGLAND - JULY 2019 11
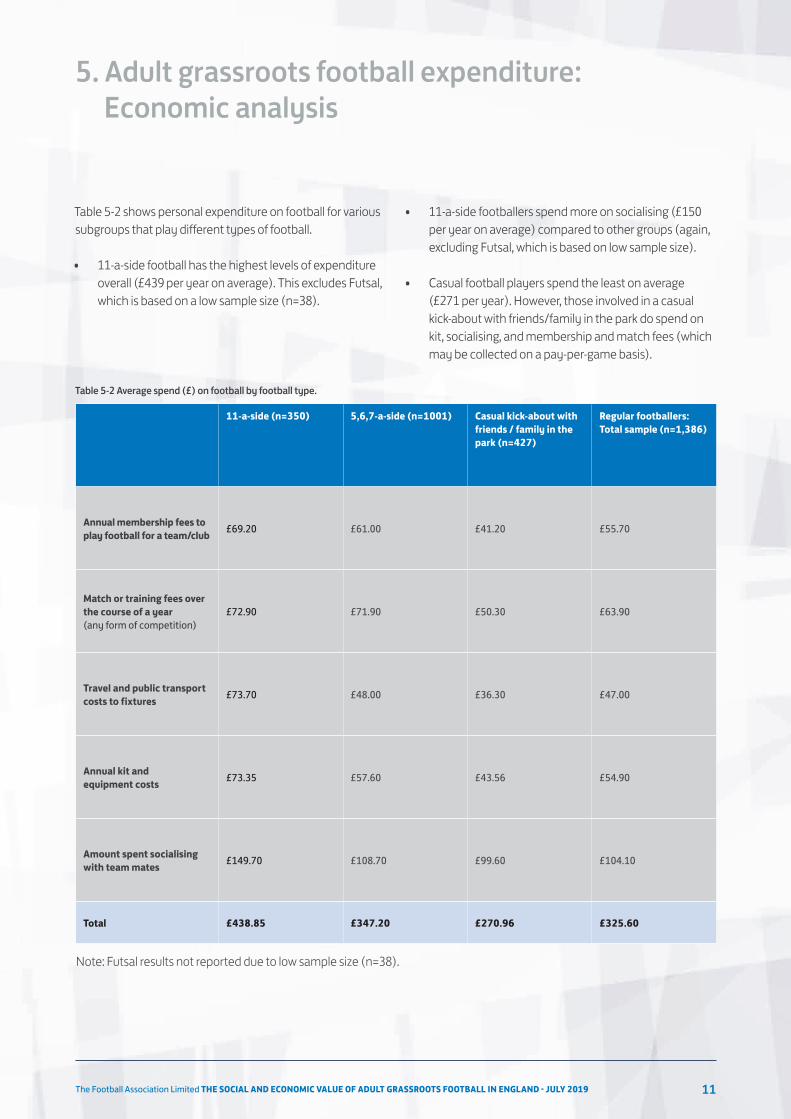
Table 5-2 shows personal expenditure on football for various subgroups that play different types of football.
• 11-a-side football has the highest levels of expenditure overall (£439 per year on average). This excludes Futsal, which is based on a low sample size (n=38).
11-a-side (n=350) 5,6,7-a-side (n=1001) Casual kick-about with friends / family in the park (n=427)
Regular footballers: Total sample (n=1,386)
Annual membership fees to play football for a team/club £69.20 £61.00 £41.20 £55.70
Match or training fees over the course of a year (any form of competition)
£72.90 £71.90 £50.30 £63.90
Travel and public transport costs to fixtures £73.70 £48.00 £36.30 £47.00
Annual kit and equipment costs £73.35 £57.60 £43.56 £54.90
Amount spent socialising with team mates £149.70 £108.70 £99.60 £104.10
Total £438.85 £347.20 £270.96 £325.60
Table 5-2 Average spend (£) on football by football type.
• 11-a-side footballers spend more on socialising (£150 per year on average) compared to other groups (again, excluding Futsal, which is based on low sample size).
• Casual football players spend the least on average (£271 per year). However, those involved in a casual kick-about with friends/family in the park do spend on kit, socialising, and membership and match fees (which may be collected on a pay-per-game basis).
5. Adult grassroots football expenditure: Economic analysis
The Football Association Limited THE SOCIAL AND ECONOMIC VALUE OF ADULT GRASSROOTS FOOTBALL IN ENGLAND - JULY 201912
5.2 The value of grassroots football to the English economy
By taking average expenditure per person on football as representative of the English population as a whole, it is possible to calculate the value of football in terms of the direct economic contributions to the economy (through purchase of equipment, contribution to wages of those working at sport facilities etc.). 25Full description of the aggregation methodology is outlined in Appendix 8.8.
• The direct economic value of grassroots football is estimated by multiplying the average annual per person total spend on football (£325.60/annum) by the population of regular footballers in England.
• The expenditure figure is based on an average of those who play any type of grassroots football regularly (played at least once in the past month).
• This percentage figure is multiplied by the adult English population aged 18+ (49 million). This provides us with an estimate of the current number of football players in England (6.3 million).
• The direct economic value of grassroots footbal = £2,049,631,112 per year.26
In summary, the economic value of regular grassroots football to the English economy as measured through average expenditure by players is £2 billion per year.
25There may also be indirect contributions related to the supply chain underlying sports and recreation services (e.g. gym membership to keep fit). However, these would apply only to certain kinds of expenditure, such as kit and equipment costs, while other areas of expenditure such as membership/match fees are unlikely to have extended supply chain impacts. We do not therefore include indirect supply chain estimates in our economic evaluation for football.26Annual total spend (£325.60) * number of regular footballers aged 18+ in England (played in past 4 weeks) (participation tracker data lower 5% confidence interval) 12.93% * 48,684,732 = 6294936) = £2,049,631,111.98.
5. Adult grassroots football expenditure: Economic analysis

The Football Association Limited THE SOCIAL AND ECONOMIC VALUE OF ADULT GRASSROOTS FOOTBALL IN ENGLAND - JULY 2019 13
This report produces two estimates of the ‘non-economic’ value of grassroots football to the individual depending on the choice of reference group (A or B):
A. The value of regular grassroots football compared to the rest of the population (‘Football vs Other’).
B. The value of regular grassroots football compared to non-sport players (‘Football vs Non-sport’).
Football vs Other (A) provides the most robust estimate for aggregation of non-economic values to the national level, by isolating the value of football as currently experienced by a nationally representative population (detailed explanation provided in Appendix 8.8).
6.1 Primary benefits: The wellbeing value of regular grassroots football
These QoL benefits are defined as ‘non-economic’ benefits of football, in that they are experienced in areas such as an individual’s health and wellbeing.
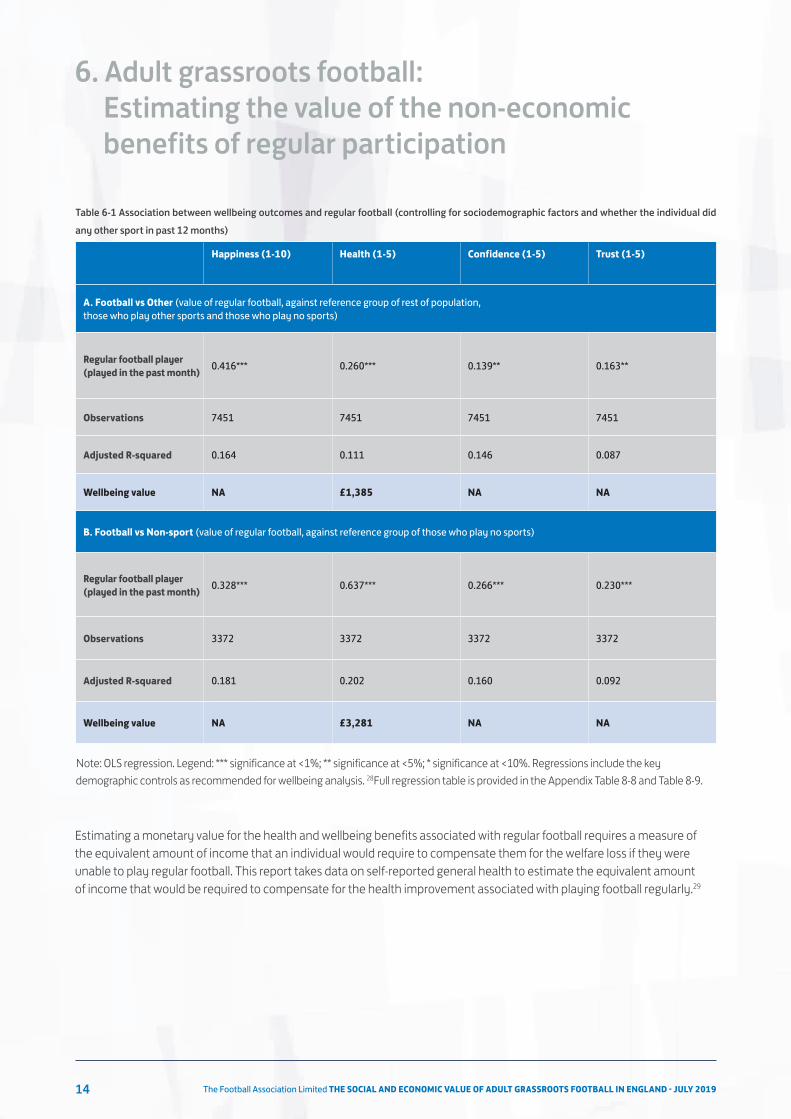
Table 6-1 presents the statistical association between regular football and the four main wellbeing outcomes used for valuation purposes. It shows a significant positive association in all cases.
To apply monetary values to these positive wellbeing benefits requires application of methods at the cutting-edge of the field. The Wellbeing Valuation (WV) method identifies the sum of money that would need to be given to the average respondent to make them as well-off as they would have been without playing football. 27This sum is the monetary wellbeing value of playing regular football (detailed methodology provided in Appendix 8.4).
27For additional robustness, the wellbeing analysis in Part 2 controls for whether the individual has done any other sport in past 12 months. This factors out any additional wellbeing benefits that individuals gain from playing other sports, and can better isolate the benefits specific to football (people who play football are also likely to play other sports so it’s important to ensure that the impact of football is not overstated). Note that the data for playing other sport as well as football does not include any information on how often that other sport has been played. This means that the ‘other sport’ control for football players is quite restrictive, including any type of sport activity in the past 12 months, which means that our final monetary estimate is more conservative.
6. Adult grassroots football: Estimating the value of the non-economic benefits of regular participation
The Football Association Limited THE SOCIAL AND ECONOMIC VALUE OF ADULT GRASSROOTS FOOTBALL IN ENGLAND - JULY 201914
6. Adult grassroots football: Estimating the value of the non-economic benefits of regular participation
Happiness (1-10) Health (1-5) Confidence (1-5) Trust (1-5)
A. Football vs Other (value of regular football, against reference group of rest of population, those who play other sports and those who play no sports)
Regular football player (played in the past month) 0.416*** 0.260*** 0.139** 0.163**
Observations 7451 7451 7451 7451
Adjusted R-squared 0.164 0.111 0.146 0.087
Wellbeing value NA £1,385 NA NA
B. Football vs Non-sport (value of regular football, against reference group of those who play no sports)
Regular football player (played in the past month) 0.328*** 0.637*** 0.266*** 0.230***
Observations 3372 3372 3372 3372
Adjusted R-squared 0.181 0.202 0.160 0.092
Wellbeing value NA £3,281 NA NA
Table 6-1 Association between wellbeing outcomes and regular football (controlling for sociodemographic factors and whether the individual did any other sport in past 12 months)
Note: OLS regression. Legend: *** significance at <1%; ** significance at <5%; * significance at <10%. Regressions include the key demographic controls as recommended for wellbeing analysis. 28Full regression table is provided in the Appendix Table 8-8 and Table 8-9.
Estimating a monetary value for the health and wellbeing benefits associated with regular football requires a measure of the equivalent amount of income that an individual would require to compensate them for the welfare loss if they were unable to play regular football. This report takes data on self-reported general health to estimate the equivalent amount of income that would be required to compensate for the health improvement associated with playing football regularly.29
The Football Association Limited THE SOCIAL AND ECONOMIC VALUE OF ADULT GRASSROOTS FOOTBALL IN ENGLAND - JULY 2019 15
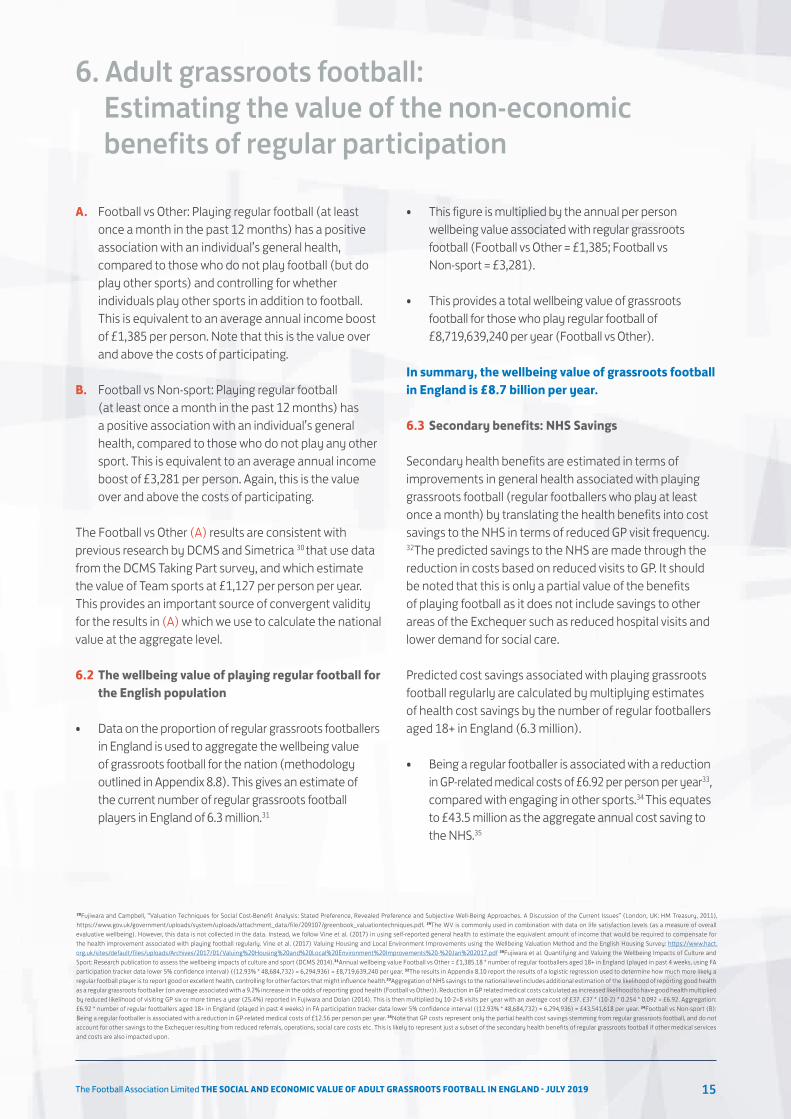
A. Football vs Other: Playing regular football (at least once a month in the past 12 months) has a positive association with an individual’s general health, compared to those who do not play football (but do play other sports) and controlling for whether individuals play other sports in addition to football. This is equivalent to an average annual income boost of £1,385 per person. Note that this is the value over and above the costs of participating.
B. Football vs Non-sport: Playing regular football (at least once a month in the past 12 months) has a positive association with an individual’s general health, compared to those who do not play any other sport. This is equivalent to an average annual income boost of £3,281 per person. Again, this is the value over and above the costs of participating.
The Football vs Other (A) results are consistent with previous research by DCMS and Simetrica 30 that use data from the DCMS Taking Part survey, and which estimate the value of Team sports at £1,127 per person per year. This provides an important source of convergent validity for the results in (A) which we use to calculate the national value at the aggregate level.
6.2 The wellbeing value of playing regular football for the English population
• Data on the proportion of regular grassroots footballers in England is used to aggregate the wellbeing value of grassroots football for the nation (methodology outlined in Appendix 8.8). This gives an estimate of the current number of regular grassroots football players in England of 6.3 million.31
28Fujiwara and Campbell, “Valuation Techniques for Social Cost-Benefit Analysis: Stated Preference, Revealed Preference and Subjective Well-Being Approaches. A Discussion of the Current Issues” (London, UK: HM Treasury, 2011), https://www.gov.uk/government/uploads/system/uploads/attachment_data/file/209107/greenbook_valuationtechniques.pdf. 29The WV is commonly used in combination with data on life satisfaction levels (as a measure of overall evaluative wellbeing). However, this data is not collected in the data. Instead, we follow Vine et al. (2017) in using self-reported general health to estimate the equivalent amount of income that would be required to compensate for the health improvement associated with playing football regularly. Vine et al. (2017) Valuing Housing and Local Environment Improvements using the Wellbeing Valuation Method and the English Housing Survey: https://www.hact.org.uk/sites/default/files/uploads/Archives/2017/01/Valuing%20Housing%20and%20Local%20Environment%20Improvements%20-%20Jan%202017.pdf 30Fujiwara et al. Quantifying and Valuing the Wellbeing Impacts of Culture and Sport: Research publication to assess the wellbeing impacts of culture and sport (DCMS 2014).31Annual wellbeing value Football vs Other = £1,385.18 * number of regular footballers aged 18+ in England (played in past 4 weeks, using FA participation tracker data lower 5% confidence interval) ((12.93% * 48,684,732) = 6,294,936) = £8,719,639,240 per year. 32The results in Appendix 8.10 report the results of a logistic regression used to determine how much more likely a regular football player is to report good or excellent health, controlling for other factors that might influence health.33Aggregation of NHS savings to the national level includes additional estimation of the likelihood of reporting good health as a regular grassroots footballer (on average associated with a 9.2% increase in the odds of reporting good health (Football vs Other)). Reduction in GP related medical costs calculated as increased likelihood to have good health multiplied by reduced likelihood of visiting GP six or more times a year (25.4%) reported in Fujiwara and Dolan (2014). This is then multiplied by 10-2=8 visits per year with an average cost of £37. £37 * (10-2) * 0.254 * 0.092 = £6.92. Aggregation: £6.92 * number of regular footballers aged 18+ in England (played in past 4 weeks) in FA participation tracker data lower 5% confidence interval ((12.93% * 48,684,732) = 6,294,936) = £43,541,618 per year. 34Football vs Non-sport (B): Being a regular footballer is associated with a reduction in GP-related medical costs of £12.56 per person per year. 35Note that GP costs represent only the partial health cost savings stemming from regular grassroots football, and do not account for other savings to the Exchequer resulting from reduced referrals, operations, social care costs etc. This is likely to represent just a subset of the secondary health benefits of regular grassroots football if other medical services and costs are also impacted upon.
• This figure is multiplied by the annual per person wellbeing value associated with regular grassroots football (Football vs Other = £1,385; Football vs Non-sport = £3,281).
• This provides a total wellbeing value of grassroots football for those who play regular football of £8,719,639,240 per year (Football vs Other).
In summary, the wellbeing value of grassroots football in England is £8.7 billion per year.
6.3 Secondary benefits: NHS Savings
Secondary health benefits are estimated in terms of improvements in general health associated with playing grassroots football (regular footballers who play at least once a month) by translating the health benefits into cost savings to the NHS in terms of reduced GP visit frequency. 32The predicted savings to the NHS are made through the reduction in costs based on reduced visits to GP. It should be noted that this is only a partial value of the benefits of playing football as it does not include savings to other areas of the Exchequer such as reduced hospital visits and lower demand for social care.
Predicted cost savings associated with playing grassroots football regularly are calculated by multiplying estimates of health cost savings by the number of regular footballers aged 18+ in England (6.3 million).
• Being a regular footballer is associated with a reduction in GP-related medical costs of £6.92 per person per year33, compared with engaging in other sports.34 This equates to £43.5 million as the aggregate annual cost saving to the NHS.35
6. Adult grassroots football: Estimating the value of the non-economic benefits of regular participation

The Football Association Limited THE SOCIAL AND ECONOMIC VALUE OF ADULT GRASSROOTS FOOTBALL IN ENGLAND - JULY 201916
The Football Association Limited THE SOCIAL AND ECONOMIC VALUE OF ADULT GRASSROOTS FOOTBALL IN ENGLAND - JULY 2019 17
The Football Association Limited THE SOCIAL AND ECONOMIC VALUE OF ADULT GRASSROOTS FOOTBALL IN ENGLAND - JULY 201918
Valuation method: Value of regular grassroots football (played in the past month)
Annual average per person Annual national aggregate value (England adult population 18+)
Primary benefits (direct value to the individual)
Economic impact of grassroots football (Section 5.2)
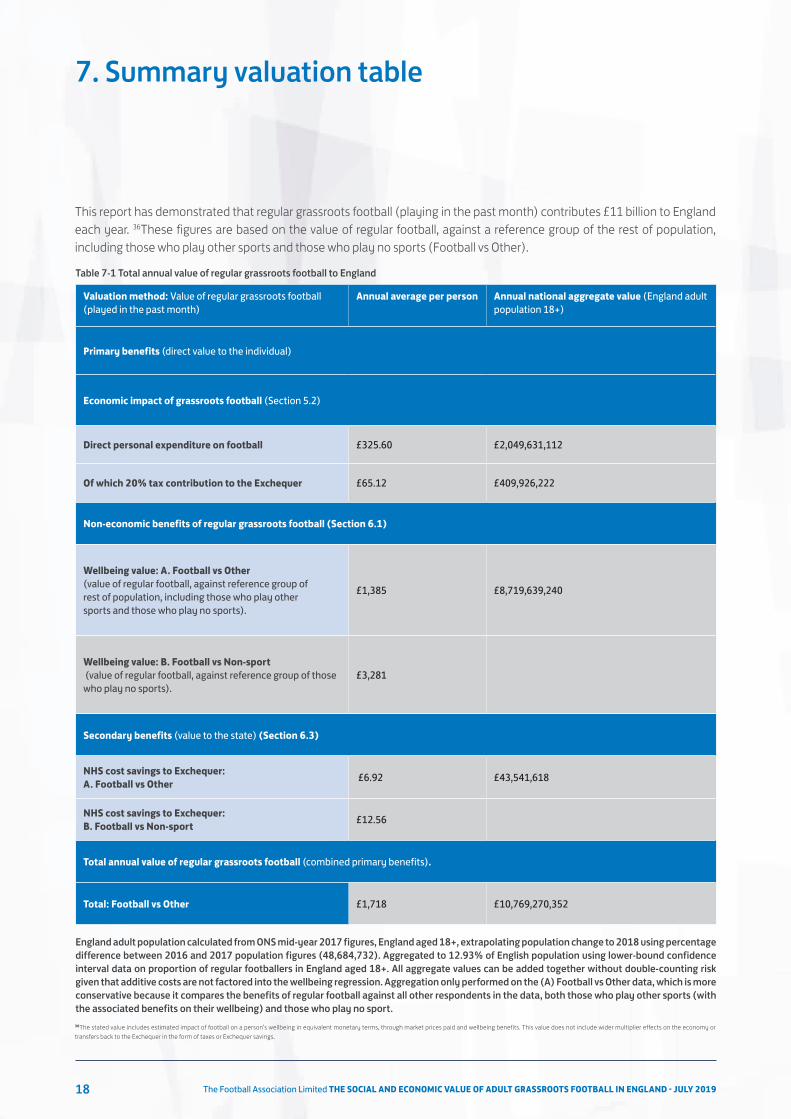
Direct personal expenditure on football £325.60 £2,049,631,112
Of which 20% tax contribution to the Exchequer £65.12 £409,926,222
Non-economic benefits of regular grassroots football (Section 6.1)
Wellbeing value: A. Football vs Other (value of regular football, against reference group of rest of population, including those who play other sports and those who play no sports).
£1,385 £8,719,639,240
Wellbeing value: B. Football vs Non-sport (value of regular football, against reference group of those who play no sports).
£3,281
Secondary benefits (value to the state) (Section 6.3)
NHS cost savings to Exchequer: A. Football vs Other £6.92 £43,541,618
NHS cost savings to Exchequer: B. Football vs Non-sport £12.56
Total annual value of regular grassroots football (combined primary benefits).
Total: Football vs Other £1,718 £10,769,270,352
Table 7-1 Total annual value of regular grassroots football to England
England adult population calculated from ONS mid-year 2017 figures, England aged 18+, extrapolating population change to 2018 using percentage difference between 2016 and 2017 population figures (48,684,732). Aggregated to 12.93% of English population using lower-bound confidence interval data on proportion of regular footballers in England aged 18+. All aggregate values can be added together without double-counting risk given that additive costs are not factored into the wellbeing regression. Aggregation only performed on the (A) Football vs Other data, which is more conservative because it compares the benefits of regular football against all other respondents in the data, both those who play other sports (with the associated benefits on their wellbeing) and those who play no sport.
This report has demonstrated that regular grassroots football (playing in the past month) contributes £11 billion to England each year. 36These figures are based on the value of regular football, against a reference group of the rest of population, including those who play other sports and those who play no sports (Football vs Other).
7. Summary valuation table
36The stated value includes estimated impact of football on a person’s wellbeing in equivalent monetary terms, through market prices paid and wellbeing benefits. This value does not include wider multiplier effects on the economy or transfers back to the Exchequer in the form of taxes or Exchequer savings.
The Football Association Limited THE SOCIAL AND ECONOMIC VALUE OF ADULT GRASSROOTS FOOTBALL IN ENGLAND - JULY 2019 19
An important caveat to note is that in many ways the aggregate value of grassroots football of £11 billion per year may be an underestimate. The analysis accounts only for those who play regular football, and it does not estimate the value provided to those who play less regularly. This report errs on the side of caution by comparing the wellbeing of regular footballers to the lower bound reference group rest of the population (both those who play other sports, and non-sport players).
The overall contribution of £11 billion includes £2 billion in direct expenditure (the money that regular footballers spend annually on match fees, kit, and socialising, among other things). Tax will be collected on much of this expenditure, and it is estimated that £410 million is contributed to the UK Exchequer through tax every year as a result of football.
It has also been demonstrated that regular grassroots football is associated with higher levels of wellbeing (health, happiness, trust and confidence). Given that regular football increases one’s wellbeing, and that higher income also increases one’s wellbeing, the equivalent amount of income that an individual would need to make up for the wellbeing they get from regular football can be calculated. This amounts to £1,385 per person per year, and is the value of playing regular grassroots football alone, unaffected by any other sports they may play. When this figure is applied to the population who report playing grassroots football regularly, the benefits of regular grassroots football to those who play is £8.7 billion per year.
37For the purposes of CBA, one should factor in only the primary benefits that are produced from this investment in grassroots football (measured through market prices and Wellbeing Valuation, but excluding savings to the Exchequer (£43.5million), in line with HM Treasury Green Book 2018 (Box 1).
Regular footballers are healthier, and this means that they visit the doctor less often. The associated NHS savings from regular grassroots football is £43.5 million per year.
The FA spends approximately £1million per week supporting grassroots football in England. This represents considerable return of nearly £11 billion per year for just £52 million invested.37
Understanding the value of grassroots football in monetary terms provides important evidence of the benefits of football to the national population. These results can help inform decision-making across the grassroots football landscape.
7. Summary valuation table
The Football Association Limited THE SOCIAL AND ECONOMIC VALUE OF ADULT GRASSROOTS FOOTBALL IN ENGLAND - JULY 201920

The Football Association Limited THE SOCIAL AND ECONOMIC VALUE OF ADULT GRASSROOTS FOOTBALL IN ENGLAND - JULY 2019 21
Appendices
This report - and the findings it contains - is based on advanced technical analysis. This analysis is contained in Appendices which follow.
Throughout the main report the reader is directed to the Appendix which supports the key findings and statistics presented.
The Football Association Limited THE SOCIAL AND ECONOMIC VALUE OF ADULT GRASSROOTS FOOTBALL IN ENGLAND - JULY 201922
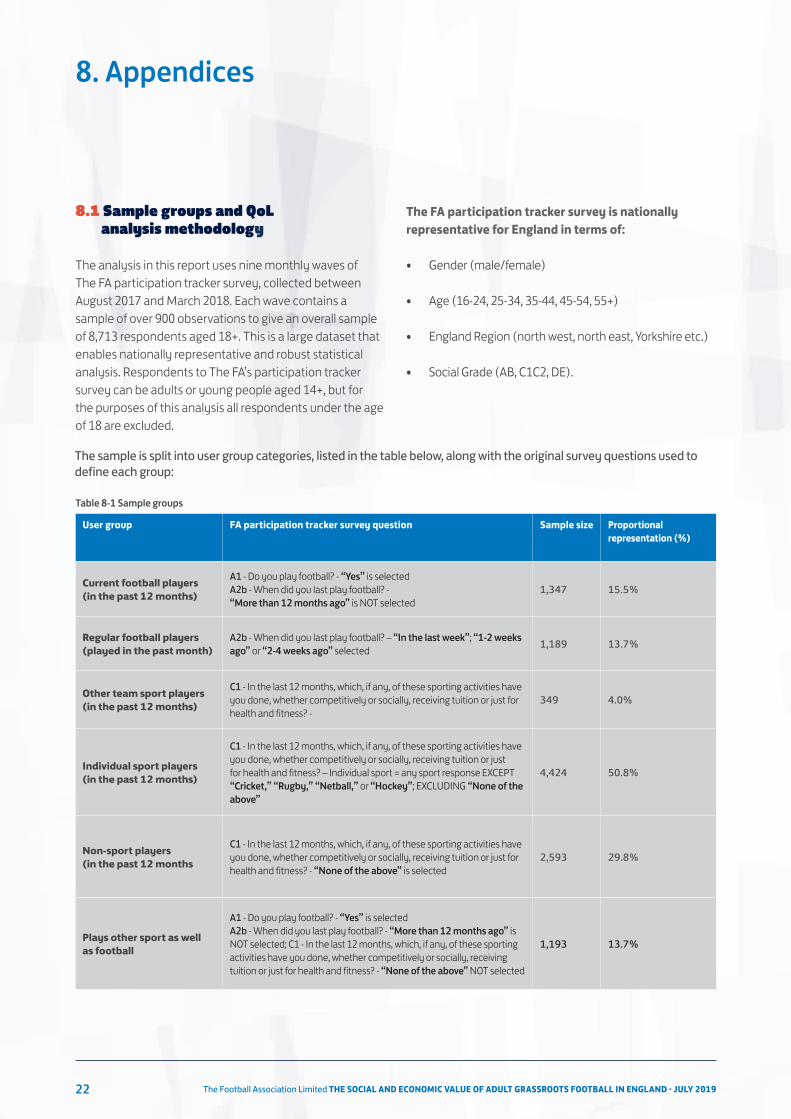
The sample is split into user group categories, listed in the table below, along with the original survey questions used to define each group:
8. Appendices
8.1 Sample groups and QoL analysis methodology
The analysis in this report uses nine monthly waves of The FA participation tracker survey, collected between August 2017 and March 2018. Each wave contains a sample of over 900 observations to give an overall sample of 8,713 respondents aged 18+. This is a large dataset that enables nationally representative and robust statistical analysis. Respondents to The FA’s participation tracker survey can be adults or young people aged 14+, but for the purposes of this analysis all respondents under the age of 18 are excluded.
The FA participation tracker survey is nationally representative for England in terms of:
• Gender (male/female)
• Age (16-24, 25-34, 35-44, 45-54, 55+)
• England Region (north west, north east, Yorkshire etc.)
• Social Grade (AB, C1C2, DE).
User group FA participation tracker survey question Sample size Proportional representation (%)
Current football players (in the past 12 months)
A1 - Do you play football? - “Yes” is selectedA2b - When did you last play football? - “More than 12 months ago” is NOT selected
1,347 15.5%
Regular football players (played in the past month)
A2b - When did you last play football? – “In the last week”; “1-2 weeks ago” or “2-4 weeks ago” selected 1,189 13.7%
Other team sport players (in the past 12 months)
C1 - In the last 12 months, which, if any, of these sporting activities have you done, whether competitively or socially, receiving tuition or just for health and fitness? -
349 4.0%
Individual sport players (in the past 12 months)
C1 - In the last 12 months, which, if any, of these sporting activities have you done, whether competitively or socially, receiving tuition or just for health and fitness? – Individual sport = any sport response EXCEPT “Cricket,” “Rugby,” “Netball,” or “Hockey”; EXCLUDING “None of the above”
4,424 50.8%
Non-sport players (in the past 12 months
C1 - In the last 12 months, which, if any, of these sporting activities have you done, whether competitively or socially, receiving tuition or just for health and fitness? - “None of the above” is selected
2,593 29.8%
Plays other sport as well as football
A1 - Do you play football? - “Yes” is selectedA2b - When did you last play football? - “More than 12 months ago” is NOT selected; C1 - In the last 12 months, which, if any, of these sporting activities have you done, whether competitively or socially, receiving tuition or just for health and fitness? - “None of the above” NOT selected
1,193 13.7%
Table 8-1 Sample groups
The Football Association Limited THE SOCIAL AND ECONOMIC VALUE OF ADULT GRASSROOTS FOOTBALL IN ENGLAND - JULY 2019 23
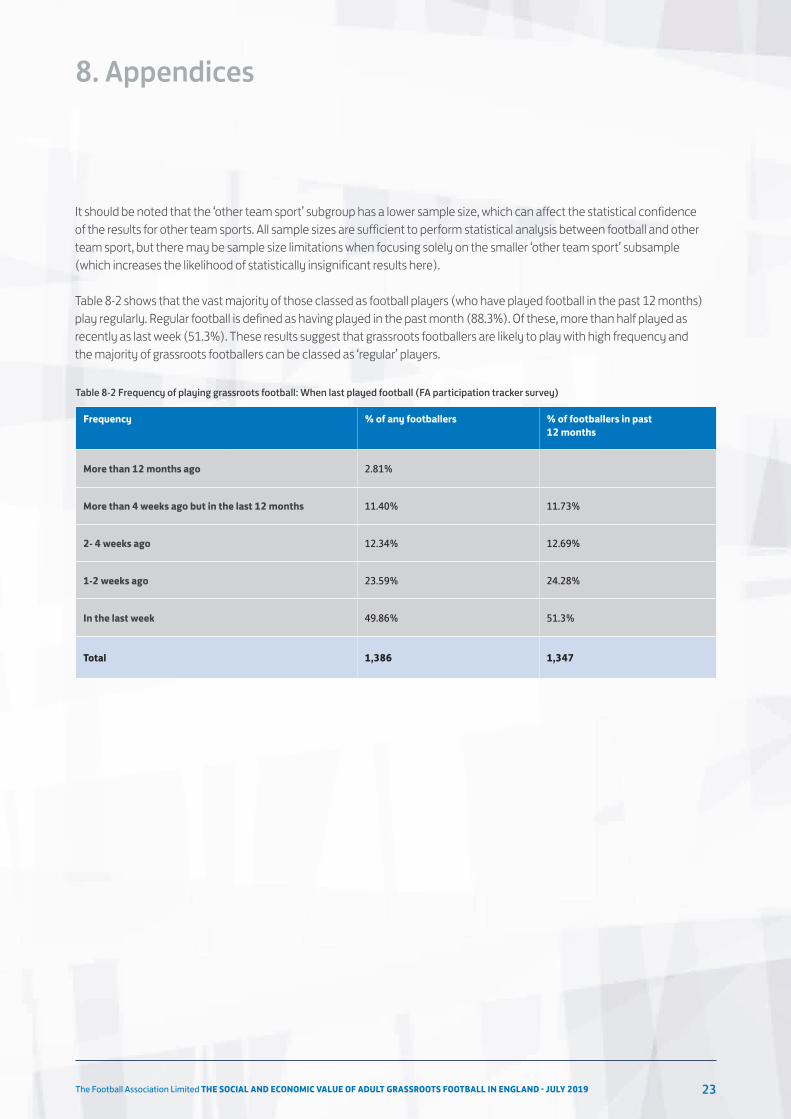
It should be noted that the ‘other team sport’ subgroup has a lower sample size, which can affect the statistical confidence of the results for other team sports. All sample sizes are sufficient to perform statistical analysis between football and other team sport, but there may be sample size limitations when focusing solely on the smaller ‘other team sport’ subsample (which increases the likelihood of statistically insignificant results here).
Table 8-2 shows that the vast majority of those classed as football players (who have played football in the past 12 months) play regularly. Regular football is defined as having played in the past month (88.3%). Of these, more than half played as recently as last week (51.3%). These results suggest that grassroots footballers are likely to play with high frequency and the majority of grassroots footballers can be classed as ‘regular’ players.
8. Appendices
Frequency % of any footballers % of footballers in past 12 months
More than 12 months ago 2.81%
More than 4 weeks ago but in the last 12 months 11.40% 11.73%
2- 4 weeks ago 12.34% 12.69%
1-2 weeks ago 23.59% 24.28%
In the last week 49.86% 51.3%
Total 1,386 1,347
Table 8-2 Frequency of playing grassroots football: When last played football (FA participation tracker survey)
The Football Association Limited THE SOCIAL AND ECONOMIC VALUE OF ADULT GRASSROOTS FOOTBALL IN ENGLAND - JULY 201924
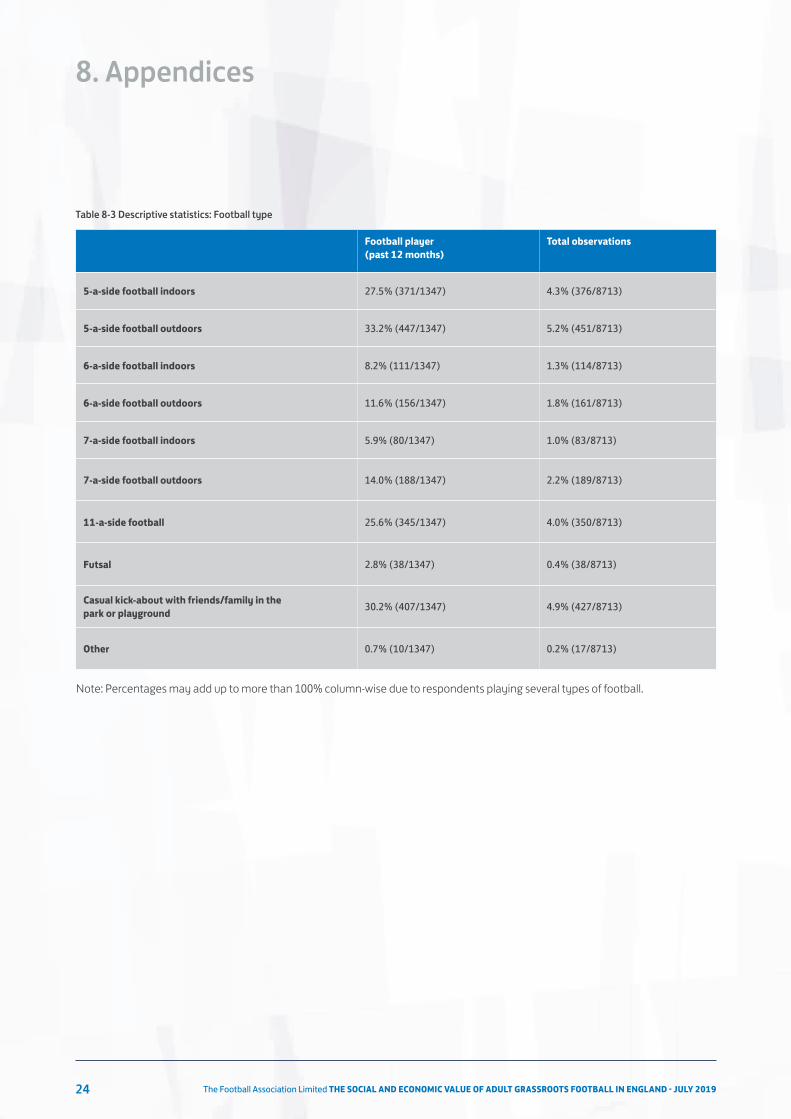
Football player (past 12 months)
Total observations
5-a-side football indoors 27.5% (371/1347) 4.3% (376/8713)
5-a-side football outdoors 33.2% (447/1347) 5.2% (451/8713)
6-a-side football indoors 8.2% (111/1347) 1.3% (114/8713)
6-a-side football outdoors 11.6% (156/1347) 1.8% (161/8713)
7-a-side football indoors 5.9% (80/1347) 1.0% (83/8713)
7-a-side football outdoors 14.0% (188/1347) 2.2% (189/8713)
11-a-side football 25.6% (345/1347) 4.0% (350/8713)
Futsal 2.8% (38/1347) 0.4% (38/8713)
Casual kick-about with friends/family in the park or playground 30.2% (407/1347) 4.9% (427/8713)
Other 0.7% (10/1347) 0.2% (17/8713)
Table 8-3 Descriptive statistics: Football type
Note: Percentages may add up to more than 100% column-wise due to respondents playing several types of football.
8. Appendices
The Football Association Limited THE SOCIAL AND ECONOMIC VALUE OF ADULT GRASSROOTS FOOTBALL IN ENGLAND - JULY 2019 25
Football player (past 12 months)
Other team sport (past 12 months)
Individual sport/pursui (past 12 months)
Non-sport player (past 12 months)
Total observations
Age 33.8* 38.0* 46.5* 53.8* 46.4
Household income £39,405 £42,023* £31,836* £24,834* £31,367
Female 23.3%* (314/1347)
51.3%* (179/349)
61.0% * (2697/4424) 47.3% (1227/2593) 50.7% (4417/8713)
Full- or part-time employed 75.9%*(1013/1335)
57.3% (197/344) 52.7% (2319/4400) 38.4%
(989/2576) 52.2% (4518/8655)
Socio-economic group (SEG): AB
31.9% (430/1347)
33.2% (116/349) 28.5% (1259/4424) 19.1%
(496/2593) 26.4% (2301/8713)
SEG: C1C2 50.5%* (680/1347)
49.9% (174/349) 48.0% (2124/4424) 39.1%*
(1014/2593) 45.8% (3992/8713)
SEG: DE 17.6%* (237/1347)
16.9%* (59/349) 23.5%* (1041/4424) 41.8%*
(1083/2593) 27.8% (2420/8713)
Dependent children 53.7%* (723/1347)
38.7% (135/349) 35.0%* (1550/4424) 27.1%*
(702/2593) 35.7% (3110/8713)
BAME 17.5%* (232/1327)
17.8%* (61/343)
6.7%* (293/4391)
4.1% (105/2572)
8.0% (691/8633)
Religious belief (any religion)
57.6%* (733/1272)
56.0% (190/339) 54.7% (2344/4284) 53.4%*
(1340/2510) 54.8% (4607/8405)
University or other higher education institution
41.6%* (560/1347)
35.5% (124/349) 33.8% (1497/4424) 22.0%*
(570/2593) 31.6% (2751/8713)
Region: Mid 24.9% (335/1347)
27.5% (96/349) 29.5% (1307/4424) 32.4%
(841/2593) 29.6% (2579/8713)
Region: North 30.1%* (405/1347)
29.8% (104/349) 29.3% (1296/4424) 30.7%
(797/2593) 29.9% (2602/8713)
Region: South 45.1%* (607/1347)
42.7% (149/349) 41.2% (1821/4424) 36.8%
(955/2593) 40.5% (3532/8713)
Gym use in past 12 months 34.4% (464/1347)
38.1% (133/349) 33.6% (1486/4424) 0.0%
(0/2593) 23.9% (2083/8713)
Played other sport in past two months
88.6% (1193/1347)
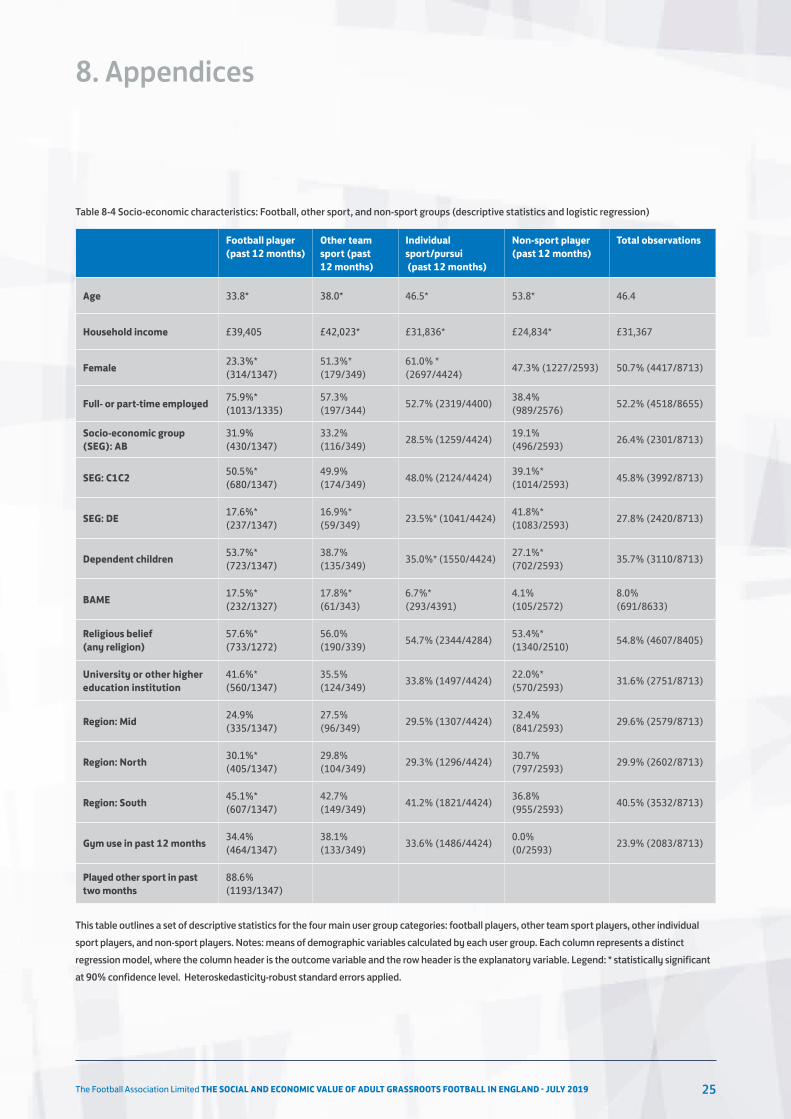
Table 8-4 Socio-economic characteristics: Football, other sport, and non-sport groups (descriptive statistics and logistic regression)
This table outlines a set of descriptive statistics for the four main user group categories: football players, other team sport players, other individual sport players, and non-sport players. Notes: means of demographic variables calculated by each user group. Each column represents a distinct regression model, where the column header is the outcome variable and the row header is the explanatory variable. Legend: * statistically significant at 90% confidence level. Heteroskedasticity-robust standard errors applied.
8. Appendices
The Football Association Limited THE SOCIAL AND ECONOMIC VALUE OF ADULT GRASSROOTS FOOTBALL IN ENGLAND - JULY 201926
Demographic characteristic
11-a-side football 5/6/7-a-side-football (indoors OR outdoors)
Casual kick-about with friends / family in the park
Futsal+
BAME 15.7% (54/345) 17.1% (169/986) 18.1% (76/421) 23.7% (9/38)
White 84.3% (291/345*) 82.9% (817/986) 81.9% (345/421) 76.3% (29/38)
Below median income/equal to median income 45.1% (143/317) 48.9% (450/920) 57.6% (215/373) 48.6% (17/35)
Above median income 54.9% (174/317)* 51.1% (470/920) 42.4% (158/373) 51.4% (18/35)
SEG: AB 37.4% (131/350) 33.0% (330/1001) 21.8% (93/427) 47.4% (18/38)
SEG: C1C2 49.7% (174/350) 50.3% (504/1001) 55.0% (235/427) 44.7% (17/38)
SEG: DE 12.9% (45/350 * 16.7% (167/1001) 23.2% (99/427) 7.9% (3/38)
Female 12.3% (43/350) 21.7% (217/1001) 30.9% (132/427) 31.6% (12/38)
Male 87.7% (307/350)* 78.3% (784/1001) 69.1% (295/427) 68.4% (26/38)
Student age <25 25.7% (90/350) 22.8% (228/1001) 26.2% (112/427) 21.1% (8/38)
Family age 25-55 69.7% (244/350) 74.1% (742/1001) 69.3% (296/427) 78.9% (30/38)
Retirement age >55 4.6% (16/350) * 3.1% (31/1001) 4.4% (19/427) 0.0% (0/38)
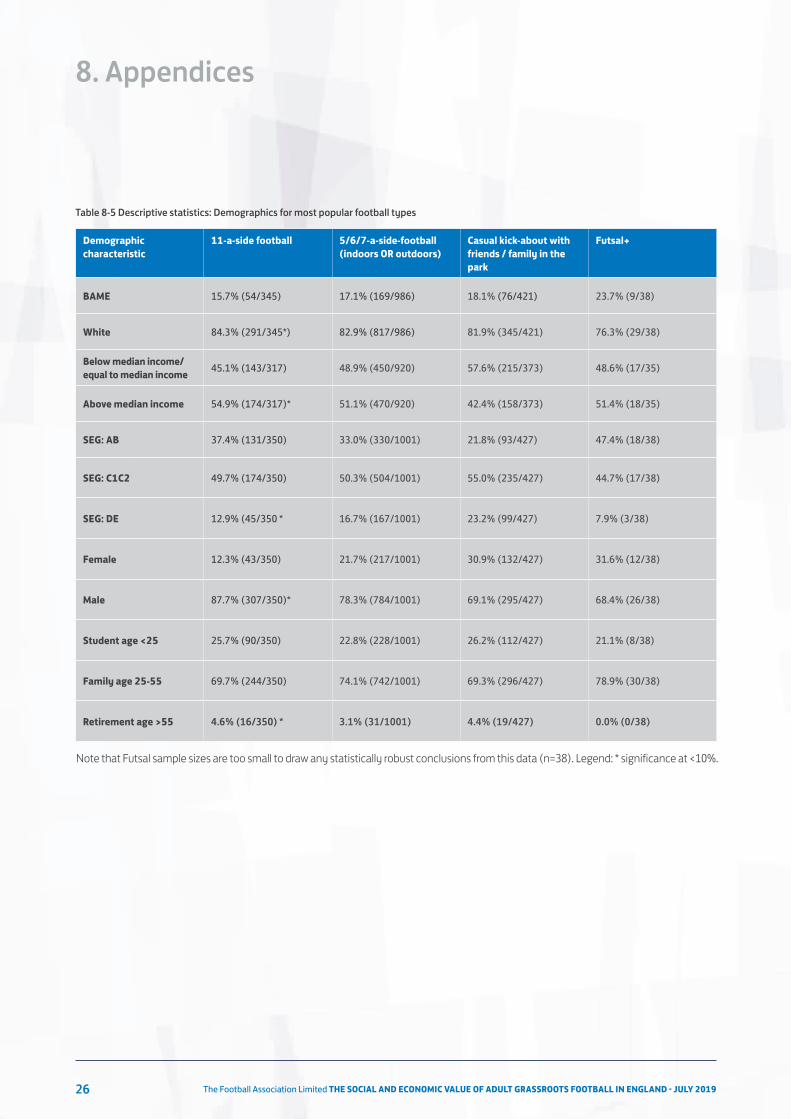
Table 8-5 Descriptive statistics: Demographics for most popular football types
8. Appendices
Note that Futsal sample sizes are too small to draw any statistically robust conclusions from this data (n=38). Legend: * significance at <10%.
The Football Association Limited THE SOCIAL AND ECONOMIC VALUE OF ADULT GRASSROOTS FOOTBALL IN ENGLAND - JULY 2019 27
8. Appendices
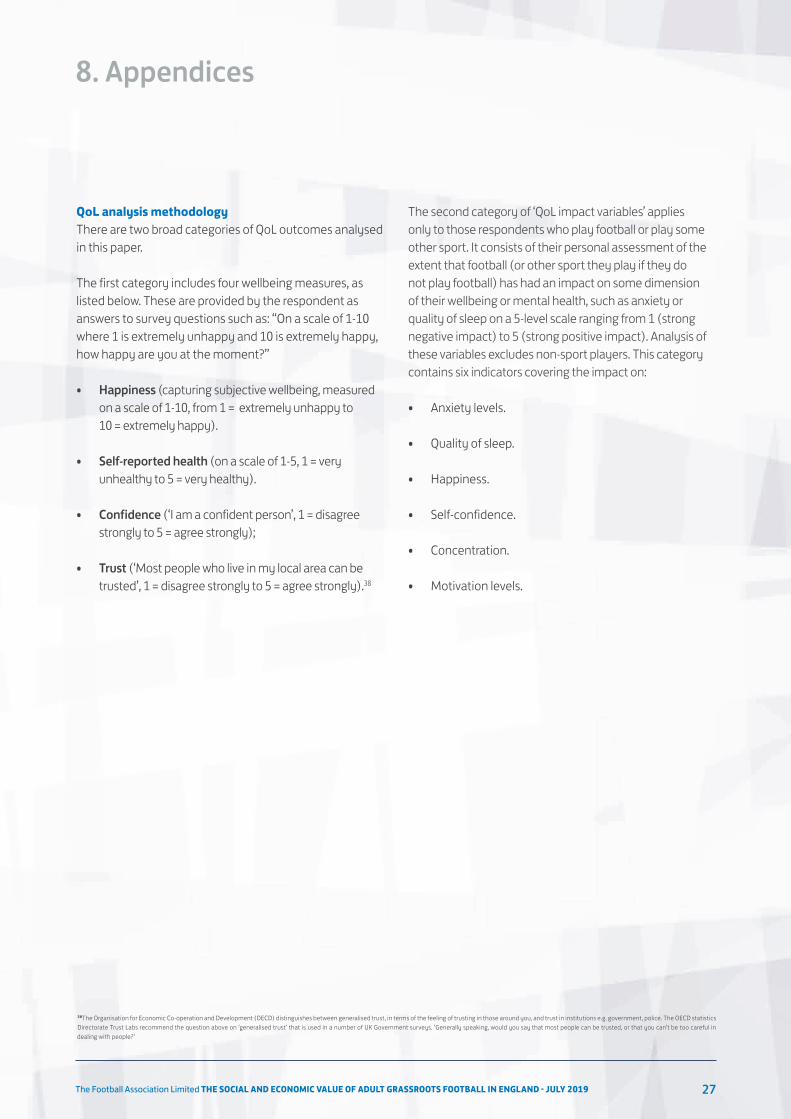
QoL analysis methodologyThere are two broad categories of QoL outcomes analysed in this paper.
The first category includes four wellbeing measures, as listed below. These are provided by the respondent as answers to survey questions such as: “On a scale of 1-10 where 1 is extremely unhappy and 10 is extremely happy, how happy are you at the moment?”
• Happiness (capturing subjective wellbeing, measured on a scale of 1-10, from 1 = extremely unhappy to 10 = extremely happy).
• Self-reported health (on a scale of 1-5, 1 = very unhealthy to 5 = very healthy).
• Confidence (‘I am a confident person’, 1 = disagree strongly to 5 = agree strongly);
• Trust (‘Most people who live in my local area can be trusted’, 1 = disagree strongly to 5 = agree strongly).38
The second category of ‘QoL impact variables’ applies only to those respondents who play football or play some other sport. It consists of their personal assessment of the extent that football (or other sport they play if they do not play football) has had an impact on some dimension of their wellbeing or mental health, such as anxiety or quality of sleep on a 5-level scale ranging from 1 (strong negative impact) to 5 (strong positive impact). Analysis of these variables excludes non-sport players. This category contains six indicators covering the impact on:
• Anxiety levels.
• Quality of sleep.
• Happiness.
• Self-confidence.
• Concentration.
• Motivation levels.
38The Organisation for Economic Co-operation and Development (OECD) distinguishes between generalised trust, in terms of the feeling of trusting in those around you, and trust in institutions e.g. government, police. The OECD statistics Directorate Trust Labs recommend the question above on ‘generalised trust’ that is used in a number of UK Government surveys. ‘Generally speaking, would you say that most people can be trusted, or that you can’t be too careful in dealing with people?’
The Football Association Limited THE SOCIAL AND ECONOMIC VALUE OF ADULT GRASSROOTS FOOTBALL IN ENGLAND - JULY 201928
8. Appendices
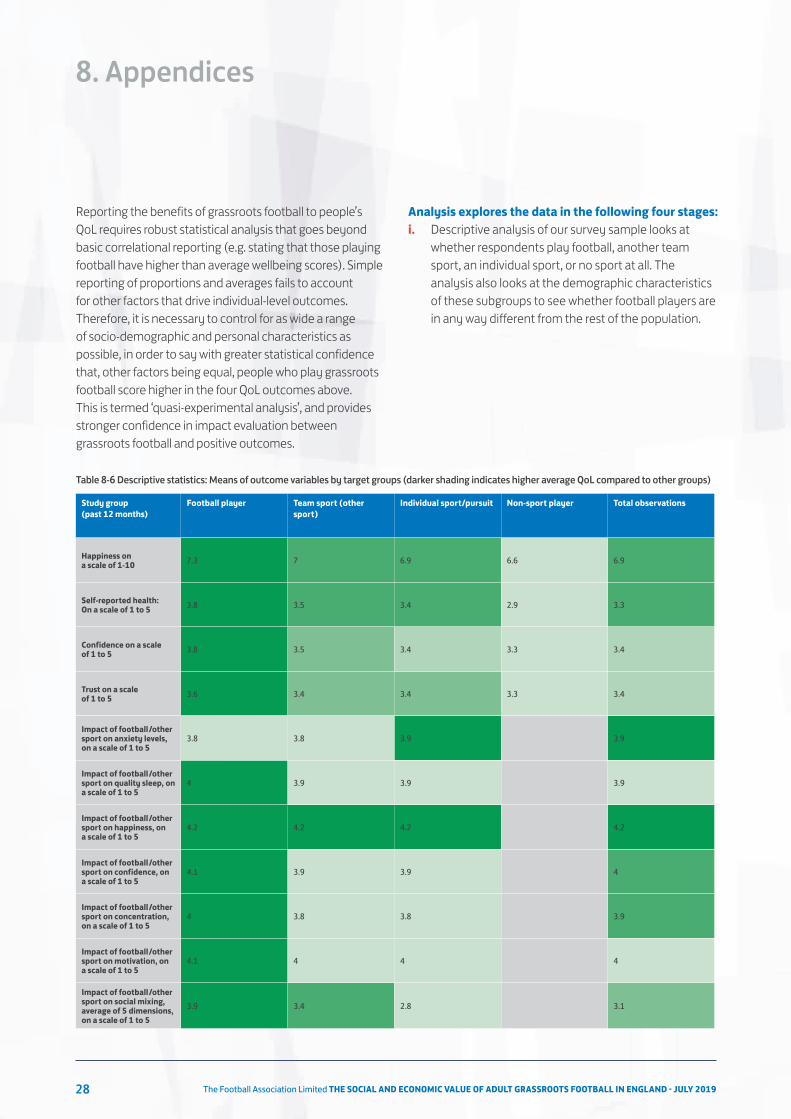
Reporting the benefits of grassroots football to people’s QoL requires robust statistical analysis that goes beyond basic correlational reporting (e.g. stating that those playing football have higher than average wellbeing scores). Simple reporting of proportions and averages fails to account for other factors that drive individual-level outcomes. Therefore, it is necessary to control for as wide a range of socio-demographic and personal characteristics as possible, in order to say with greater statistical confidence that, other factors being equal, people who play grassroots football score higher in the four QoL outcomes above. This is termed ‘quasi-experimental analysis’, and provides stronger confidence in impact evaluation between grassroots football and positive outcomes.
Analysis explores the data in the following four stages:i. Descriptive analysis of our survey sample looks at whether respondents play football, another team sport, an individual sport, or no sport at all. The analysis also looks at the demographic characteristics of these subgroups to see whether football players are in any way different from the rest of the population.
Table 8-6 Descriptive statistics: Means of outcome variables by target groups (darker shading indicates higher average QoL compared to other groups)
Study group (past 12 months)
Football player Team sport (other sport)
Individual sport/pursuit Non-sport player Total observations
Happiness on a scale of 1-10 7.3 7 6.9 6.6 6.9
Self-reported health: On a scale of 1 to 5 3.8 3.5 3.4 2.9 3.3
Confidence on a scale of 1 to 5 3.8 3.5 3.4 3.3 3.4
Trust on a scale of 1 to 5 3.6 3.4 3.4 3.3 3.4
Impact of football/other sport on anxiety levels, on a scale of 1 to 5
3.8 3.8 3.9 3.9
Impact of football/other sport on quality sleep, on a scale of 1 to 5
4 3.9 3.9 3.9
Impact of football/other sport on happiness, on a scale of 1 to 5
4.2 4.2 4.2 4.2
Impact of football/other sport on confidence, on a scale of 1 to 5
4.1 3.9 3.9 4
Impact of football/other sport on concentration, on a scale of 1 to 5
4 3.8 3.8 3.9
Impact of football/other sport on motivation, on a scale of 1 to 5
4.1 4 4 4
Impact of football/other sport on social mixing, average of 5 dimensions, on a scale of 1 to 5
3.9 3.4 2.8 3.1
The Football Association Limited THE SOCIAL AND ECONOMIC VALUE OF ADULT GRASSROOTS FOOTBALL IN ENGLAND - JULY 2019 29
8. Appendices
ii. Logistic multivariate regression’39 is conducted to investigate whether any of these demographic characteristics are associated with a higher likelihood of playing football compared to other sports or no sport, for example, if older or richer people are more likely to play football.
iii. Football players are compared to the other subgroups in four key areas of quality of life (QoL): happiness, health, confidence, social mixing and trust. The analysis also looks at how much respondents feel their sport has a positive impact on various aspects of their life, including social mixing.
iv. Regression-based wellbeing analysis reveals whether there is a statistically significant association between playing football (or other sports) and any of the QoL outcomes, holding a number of relevant factors constant.
Control variablesMuch of the research in the sporting sector uses simple bivariate balance tests (parametric t-tests) to assess statistically significant differences in outcome variables among key groups (grassroots football engagement, as well as sociodemographic groups). Analysis at this level will point to a positive link between football and wellbeing outcomes. However, it does not allow us to state with high statistical confidence that football is the key factor driving these outcomes. As stated in the DCMS report ‘Quantifying the Impact of Sports Participation’:
‘Essential to this process is the ability to control for as many of the determinants of a given outcome as possible using regression analysis. It is the optimal method given the nature of the data and hence we believe that the results presented in this paper are informative for policy-making purposes.’40
Control variables are included in the analysis to account for the fact that there are other factors that may affect the respondent’s wellbeing, other than involvement in sports. This includes factors that are known to affect people’s wellbeing including age, employment status, income etc. 41 42
Including these control variables in the analysis allows us to ‘cancel them out’ and better isolate the relationship between QoL outcomes and playing football/other sports. The data allows us to control for the following characteristics:
• Gender.
• Age.
• Household income.
• Whether the respondent is employed.
• Socio-economic grade (a broad indicator of social status).
• Whether the respondent has dependent children.
• Ethnic minority status.
• Whether the respondent is religious.
• Good health.
• Education (whether the respondent has a university degree).
• Region of residence.
39Regression analysis allows us to simultaneously explore the relationship between multiple variables, controlling for many other factors (known as control variables) in the data. This allows us to isolate the association between changes in a variable of interest, such as playing football, on an outcome, like health or wellbeing. Technically regression analyses capture association, rather than impact or causality, since we cannot exclude the full range of unobserved factors that may have a causal effect on people. Thus, cause and effect relationships are approximated using statistical methods such as regression analysis, as causation cannot be directly inferred. Notwithstanding, multiple regression analysis of the type employed here has been used extensively in the academic and policy evaluation literatures and so the analysis is informative for policy purposes.40https://www.gov.uk/government/uploads/system/uploads/attachment_data/file/304899/Quantifying_and_valuing_the_wellbeing_impacts_of_sport_and_culture.pdf. 41Fujiwara and Campbell, “Valuation Techniques for Social Cost-Benefit Analysis: Stated Preference, Revealed Preference and Subjective Well-Being Approaches. A Discussion of the Current Issues.” 42Fujiwara and Campbell, “Valuation Techniques for Social Cost-Benefit Analysis: Stated Preference, Revealed Preference and Subjective Well-Being Approaches. A Discussion of the Current Issues” (London, UK: HM Treasury, 2011), https://www.gov.uk/government/uploads/system/uploads/attachment_data/file/209107/greenbook_valuationtechniques.pdf.
The Football Association Limited THE SOCIAL AND ECONOMIC VALUE OF ADULT GRASSROOTS FOOTBALL IN ENGLAND - JULY 201930
8. Appendices
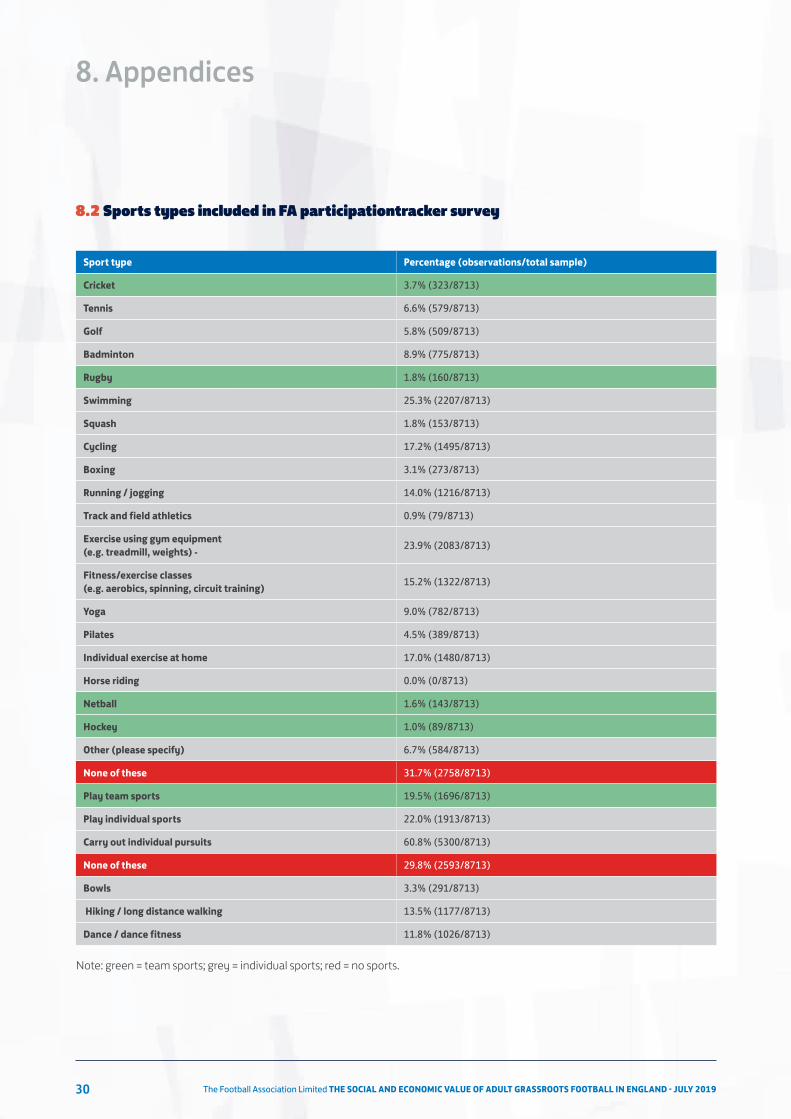
8.2 Sports types included in FA participationtracker survey
Sport type Percentage (observations/total sample)
Cricket 3.7% (323/8713)
Tennis 6.6% (579/8713)
Golf 5.8% (509/8713)
Badminton 8.9% (775/8713)
Rugby 1.8% (160/8713)
Swimming 25.3% (2207/8713)
Squash 1.8% (153/8713)
Cycling 17.2% (1495/8713)
Boxing 3.1% (273/8713)
Running / jogging 14.0% (1216/8713)
Track and field athletics 0.9% (79/8713)
Exercise using gym equipment (e.g. treadmill, weights) - 23.9% (2083/8713)
Fitness/exercise classes (e.g. aerobics, spinning, circuit training) 15.2% (1322/8713)
Yoga 9.0% (782/8713)
Pilates 4.5% (389/8713)
Individual exercise at home 17.0% (1480/8713)
Horse riding 0.0% (0/8713)
Netball 1.6% (143/8713)
Hockey 1.0% (89/8713)
Other (please specify) 6.7% (584/8713)
None of these 31.7% (2758/8713)
Play team sports 19.5% (1696/8713)
Play individual sports 22.0% (1913/8713)
Carry out individual pursuits 60.8% (5300/8713)
None of these 29.8% (2593/8713)
Bowls 3.3% (291/8713)
Hiking / long distance walking 13.5% (1177/8713)
Dance / dance fitness 11.8% (1026/8713)
Note: green = team sports; grey = individual sports; red = no sports.

The Football Association Limited THE SOCIAL AND ECONOMIC VALUE OF ADULT GRASSROOTS FOOTBALL IN ENGLAND - JULY 2019 31
8. Appendices
8.3 An introduction to economic impact of grassroots football
Sports clubs and organisations provide two types of value to society:
• Primary benefits (value to individuals) relate to individuals experiencing a benefit in terms of the impact on their wellbeing directly.
• Secondary benefits (value to the state) refer to values to society more widely resulting from the project outcomes. These are usually framed as impacts on public services and the public purse (Exchequer) and are key to understanding the full social value of an intervention. These are secondary in nature becausethey indirectly benefit individuals.
The analysis captures part of the primary benefits football provides through the market prices people are willing to pay to participate (Section 5). Market prices are the standard way in which economists understand the preferences that individuals have for different goods and activities, with the assumption that people prefer to buy more of the things that give them better quality of life.
However, the prices people pay to participate capture only part of the value that people hold because (a) it is not the maximum they would be willing to pay to continue to play football, and (b) it does not account for the spill-over benefits that football provides in terms of health and wellbeing. In the case of health and fitness outcomes, involvement in grassroots football is likely to impact both of these types of benefit.
Increased health has a primary benefit to the individual because their quality of life improves.
Increasing the number of healthy people will have secondary benefits for society in terms of impacts like reduced health costs to the NHS and increased tax receipts (income tax, National Insurance contributions etc.). Wider societal benefits can be measured as impacts on public services and on the public purse (Exchequer). For instance, engagement in grassroots football may lead to improvements in health, which can be valued in terms of their reduction in state health-related expenditure (Section 6.3).
The Football Association Limited THE SOCIAL AND ECONOMIC VALUE OF ADULT GRASSROOTS FOOTBALL IN ENGLAND - JULY 201932
8. Appendices
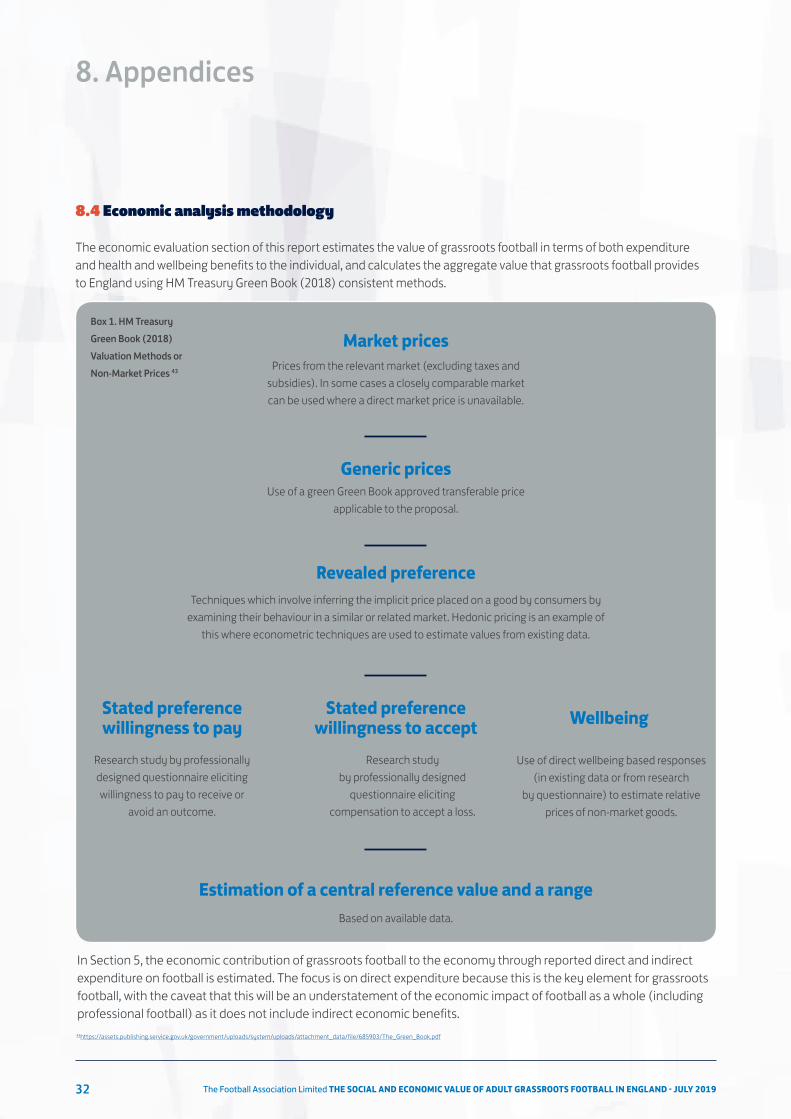
8.4 Economic analysis methodology
The economic evaluation section of this report estimates the value of grassroots football in terms of both expenditure and health and wellbeing benefits to the individual, and calculates the aggregate value that grassroots football provides to England using HM Treasury Green Book (2018) consistent methods.
In Section 5, the economic contribution of grassroots football to the economy through reported direct and indirect expenditure on football is estimated. The focus is on direct expenditure because this is the key element for grassroots football, with the caveat that this will be an understatement of the economic impact of football as a whole (including professional football) as it does not include indirect economic benefits.
Market pricesPrices from the relevant market (excluding taxes and
subsidies). In some cases a closely comparable market can be used where a direct market price is unavailable.
Generic pricesUse of a green Green Book approved transferable price
applicable to the proposal.
Stated preference willingness to pay
Stated preference willingness to accept Wellbeing
Research study by professionally designed questionnaire eliciting willingness to pay to receive or
avoid an outcome.
Research study by professionally designed
questionnaire eliciting compensation to accept a loss.
Use of direct wellbeing based responses (in existing data or from research
by questionnaire) to estimate relative prices of non-market goods.
Revealed preferenceTechniques which involve inferring the implicit price placed on a good by consumers by
examining their behaviour in a similar or related market. Hedonic pricing is an example of this where econometric techniques are used to estimate values from existing data.
Estimation of a central reference value and a rangeBased on available data.
Box 1. HM Treasury Green Book (2018) Valuation Methods or Non-Market Prices 43
43https://assets.publishing.service.gov.uk/government/uploads/system/uploads/attachment_data/file/685903/The_Green_Book.pdf
The Football Association Limited THE SOCIAL AND ECONOMIC VALUE OF ADULT GRASSROOTS FOOTBALL IN ENGLAND - JULY 2019 33
8. Appendices
Market price expenditure Market price expenditure methods in line with HM Treasury Green Book (2018) are used (see Box 1). It outlines the valuation methods available for estimating the value of football to the individual.
The FA participation tracker survey provides data on the market prices people are willing to pay for those aspects of football that require monetary purchases such as equipment, match fees etc. This provides information on market prices as in HM Treasury Green Book (2018) value framework (Box 1). This gives an estimate of the partial value that grassroots footballers hold for the sport. The value is partial because it is not known whether these values represent their maximum willingness to pay, or if they would actually pay more to play football if they were asked, or if they were made more aware of the full range of benefits that football provides (for instance to their health and wellbeing).
The analysis estimates total expenditure on grassroots football within the nationally representative FA participation tracker sample, and considers the contribution that this makes to the English economy by extrapolating to the national level, and considering their direct contributions to the economy. It should be noted that this is likely an underestimate of the total contribution of football to the economy, given that it does not include volunteer and in-kind contributions.
As discussed above, the market prices that an individual is willing to spend on playing grassroots football may not capture the full range of benefits and full value to the individual of grassroots football. These include the positive health, wellbeing, and social outcomes to the individual. In Section 6, the value of these non-economic benefits of regular football is estimated. These aspects of football have not been valued before and require application of methods at the cutting-edge of the field using the Wellbeing Valuation method described below.
Wellbeing Valuation Previous research by DCMS and Simetrica44 has shown it is possible to value a person’s improved wellbeing from playing sport. This approach to valuing ‘non-market’ outcomes is known as the Wellbeing Valuation (WV) approach.45 In line with HM Treasury Green Book (2018) (see Box 1), the WV approach applied in Section 6.1 investigates how the non-market outcome changes people’s wellbeing, under the assumption that the same change in wellbeing could have been achieved by a change in the respondent’s household income (using an instrument for income obtained from the British Household Panel Survey).46 This constitutes a valuation of the ‘primary benefits’ of regular football to the individual. The steps to this analysis are:
i. Establish in the data whether playing grassroots football regularly is associated with increases a person’s wellbeing (it can be seen from The FA participation tracker data that it does).
ii. Establish whether an increase in a person’s income also produces an increase in wellbeing (using evidence from instrumental variables within large national datasets like the British Household Panel Survey).
iii. Establish how much money would need to be paid to that person to make up the same increase in wellbeing as playing football regularly. This assumes that an individual’s wellbeing increases along the same (linear) scale, regardless of whether it comes from playing football, increasing income, or some other factor in their life (this is an established assumption within the academic literature).47
iv. Attribute this value to playing football as representative of the improvement in wellbeing experienced by all those who play regular football in England.
44Fujiwara et al. Quantifying and Valuing the Wellbeing Impacts of Culture and Sport: Research publication to assess the wellbeing impacts of culture and sport (DCMS 2014): https://assets.publishing.service.gov.uk/government/uploads/system/uploads/attachment_data/file/304899/Quantifying_and_valuing_the_wellbeing_impacts_of_sport_and_culture.pdf. 45Daniel Fujiwara, “A General Method for Valuing Non-Market Goods Using Wellbeing Data: Three-Stage Wellbeing Valuation,” in CEP Discussion Paper No 1233 (London, UK: Centre for Economic Performance, London School of Economics, 2013), 1–29, http://cep.lse.ac.uk/_new/publications/series.asp?prog=CEP; Daniel Fujiwara and Paul Dolan, “Happiness-Based Policy Analysis,” in Oxford Handbook of Wellbeing and Public Policy, ed. M Adler and M Fleurbaey, 2015. 46https://www.iser.essex.ac.uk/bhps/. 47Ada Ferrer-i-Carbonell and Paul Frijters, “How Important Is Methodology for the Estimates of the Determinants of Happiness?,” The Economic Journal 114, no. 497 (July 1, 2004): 641–59, https://doi.org/10.1111/j.1468-0297.2004.00235.x.

The Football Association Limited THE SOCIAL AND ECONOMIC VALUE OF ADULT GRASSROOTS FOOTBALL IN ENGLAND - JULY 201934
In other words, by comparing the wellbeing association with the outcome of interest (playing football) to the wellbeing association with income, it is possible to identify what sum of money should be given to (or taken away from) the average respondent to make them as well-off as they were /would have been without playing football. This is then taken to be the monetary wellbeing value of our outcome of interest, in this case playing regular football.
These are benefits to the individual’s quality of life and are additional to any economic/expenditure impact. Expenditure and wellbeing values are additive as expenditure is not factored into wellbeing regression. As there are no controls for expenditure within the regression it can be assumed that the individual has already internalised the wellbeing they gain from football through their expenditure (in terms of preference satisfaction). This means the wellbeing uplift identified in the data is the residual benefit that football provides over and above these satisfied preferences for playing.
Exchequer contributionsFinally, there are an additional set of values which are not typically included in HM Treasury calculations of costs and benefits (and do not feature in Box 1). These are secondary benefits, which constitute contributions to the state, either through Exchequer cost savings or tax contributions. In Section 6.3 the spill-over ‘secondary benefits’ to society associated with projected NHS cost savings are estimated from this healthier population of people who play football in England. Given that footballers are healthier on average, they are likely to visit their GP less often over the course of a year, and this leads to cost-savings for the NHS.
In addition, disaggregated analysis of health and wellbeing outcomes demonstrates which demographic groups experience the greatest health and wellbeing benefits of football.
The values derived in Sections 5 and 6 represent the economic and non-economic values of grassroots football. Together these two pieces of analysis are able to paint a comprehensive picture of the benefits of football to the individual and wider society.
8. Appendices
The Football Association Limited THE SOCIAL AND ECONOMIC VALUE OF ADULT GRASSROOTS FOOTBALL IN ENGLAND - JULY 2019 35
8. Appendices
8.5 Demographic breakdown of grassroots football
Key findingsCertain demographic groups have higher statistical odds of playing football:
• Within grassroots football, footballers are predominantly men of working age. A higher proportion of footballers are male (77%) and aged under 56 (95%) compared to the overall sample.
• When compared to the total sample (as a proxy for the wider national population), the analysis shows that on the average football pitch, footballers (both males and females) are more likely to be made up of economically employed (76%) and/or those with higher education qualifications (42%) compared to the general population (52% and 32% respectively). A significantly higher proportion of footballers are employed and/or have a university degree, compared to non-sport players.
• A higher proportion of football players (males and females) have families, compared to non-sport players. In other words, within an average group of footballers over half (54%) will have children, compared to only 27% of non-sport players and 36% of the general population.
• Grassroots football has a more inclusive and diverse participation base than is seen in the national population: Within football, a significantly higher proportion of footballers belong to a BAME group. In other words, the average football pitch is likely to have a higher than average proportion of footballers come from BAME groups (18%), compared to the national average of 8%.48
• Footballers have lower statistical odds of coming from lower socio-economic and older age groups, meaning people who are older and economically deprived are less likely to play football.
48It is notable that football and other team sports have a similarly high proportion of BAME players (18%) compared to the overall sample (8%). Only 7% of the individual sport sample is made up of BAME groups compared to the overall sample (8%).
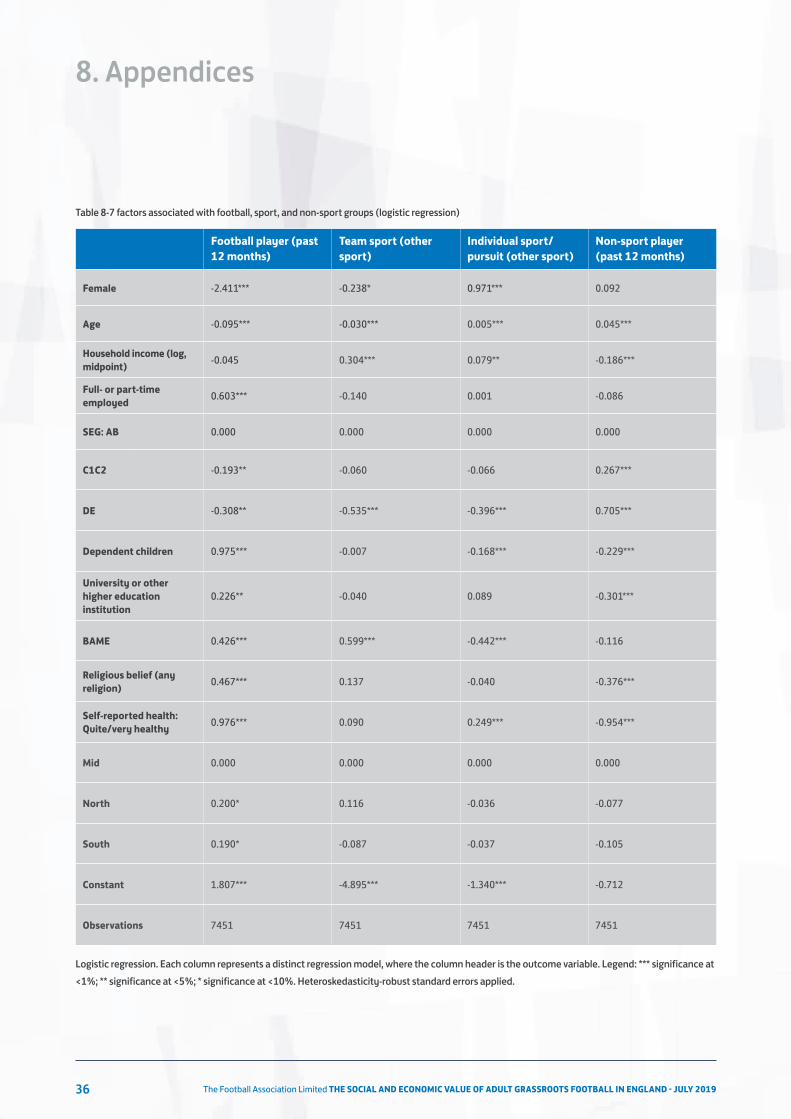
The Football Association Limited THE SOCIAL AND ECONOMIC VALUE OF ADULT GRASSROOTS FOOTBALL IN ENGLAND - JULY 201936
8. Appendices
Football player (past 12 months)
Team sport (other sport)
Individual sport/pursuit (other sport)
Non-sport player (past 12 months)
Female -2.411*** -0.238* 0.971*** 0.092
Age -0.095*** -0.030*** 0.005*** 0.045***
Household income (log, midpoint) -0.045 0.304*** 0.079** -0.186***
Full- or part-time employed 0.603*** -0.140 0.001 -0.086
SEG: AB 0.000 0.000 0.000 0.000
C1C2 -0.193** -0.060 -0.066 0.267***
DE -0.308** -0.535*** -0.396*** 0.705***
Dependent children 0.975*** -0.007 -0.168*** -0.229***
University or other higher education institution
0.226** -0.040 0.089 -0.301***
BAME 0.426*** 0.599*** -0.442*** -0.116
Religious belief (any religion) 0.467*** 0.137 -0.040 -0.376***
Self-reported health: Quite/very healthy 0.976*** 0.090 0.249*** -0.954***
Mid 0.000 0.000 0.000 0.000
North 0.200* 0.116 -0.036 -0.077
South 0.190* -0.087 -0.037 -0.105
Constant 1.807*** -4.895*** -1.340*** -0.712
Observations 7451 7451 7451 7451
Table 8-7 factors associated with football, sport, and non-sport groups (logistic regression)
Logistic regression. Each column represents a distinct regression model, where the column header is the outcome variable. Legend: *** significance at <1%; ** significance at <5%; * significance at <10%. Heteroskedasticity-robust standard errors applied.
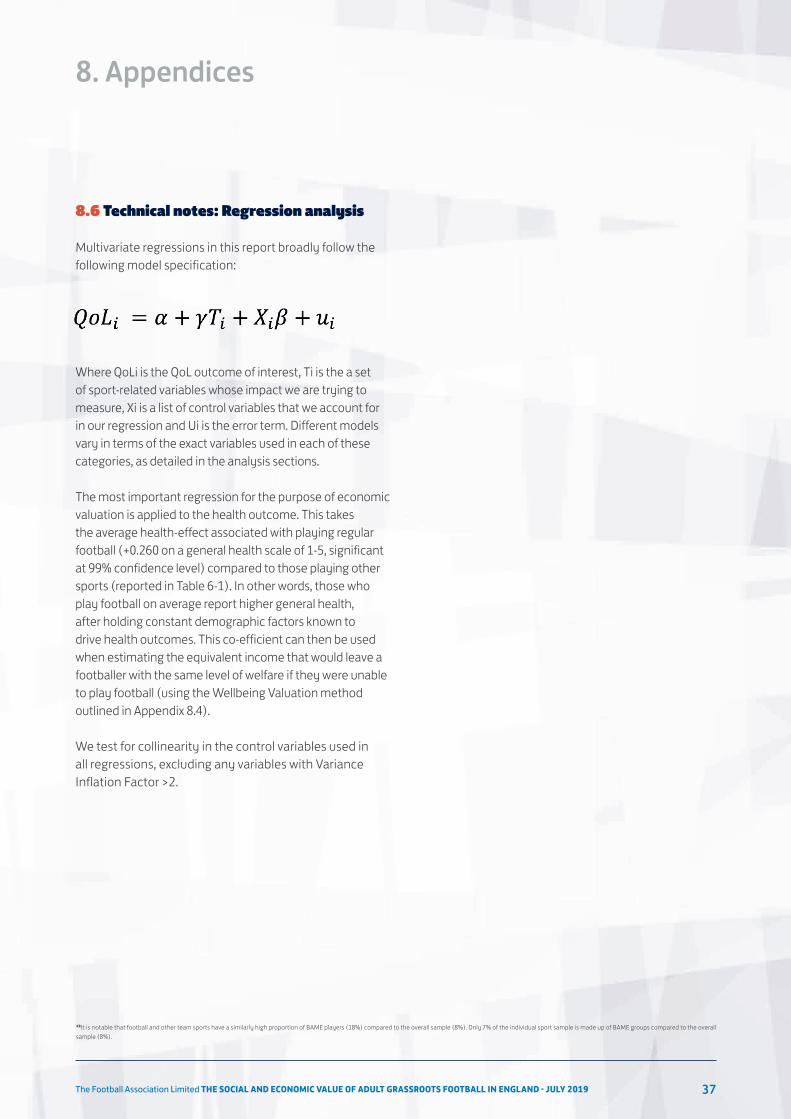
The Football Association Limited THE SOCIAL AND ECONOMIC VALUE OF ADULT GRASSROOTS FOOTBALL IN ENGLAND - JULY 2019 37
8. Appendices
8.6 Technical notes: Regression analysis
Multivariate regressions in this report broadly follow the following model specification:
Where QoLi is the QoL outcome of interest, Ti is the a set of sport-related variables whose impact we are trying to measure, Xi is a list of control variables that we account for in our regression and Ui is the error term. Different models vary in terms of the exact variables used in each of these categories, as detailed in the analysis sections.
The most important regression for the purpose of economic valuation is applied to the health outcome. This takes the average health-effect associated with playing regular football (+0.260 on a general health scale of 1-5, significant at 99% confidence level) compared to those playing other sports (reported in Table 6-1). In other words, those who play football on average report higher general health, after holding constant demographic factors known to drive health outcomes. This co-efficient can then be used when estimating the equivalent income that would leave a footballer with the same level of welfare if they were unable to play football (using the Wellbeing Valuation method outlined in Appendix 8.4).
We test for collinearity in the control variables used in all regressions, excluding any variables with Variance Inflation Factor >2.
48It is notable that football and other team sports have a similarly high proportion of BAME players (18%) compared to the overall sample (8%). Only 7% of the individual sport sample is made up of BAME groups compared to the overall sample (8%).
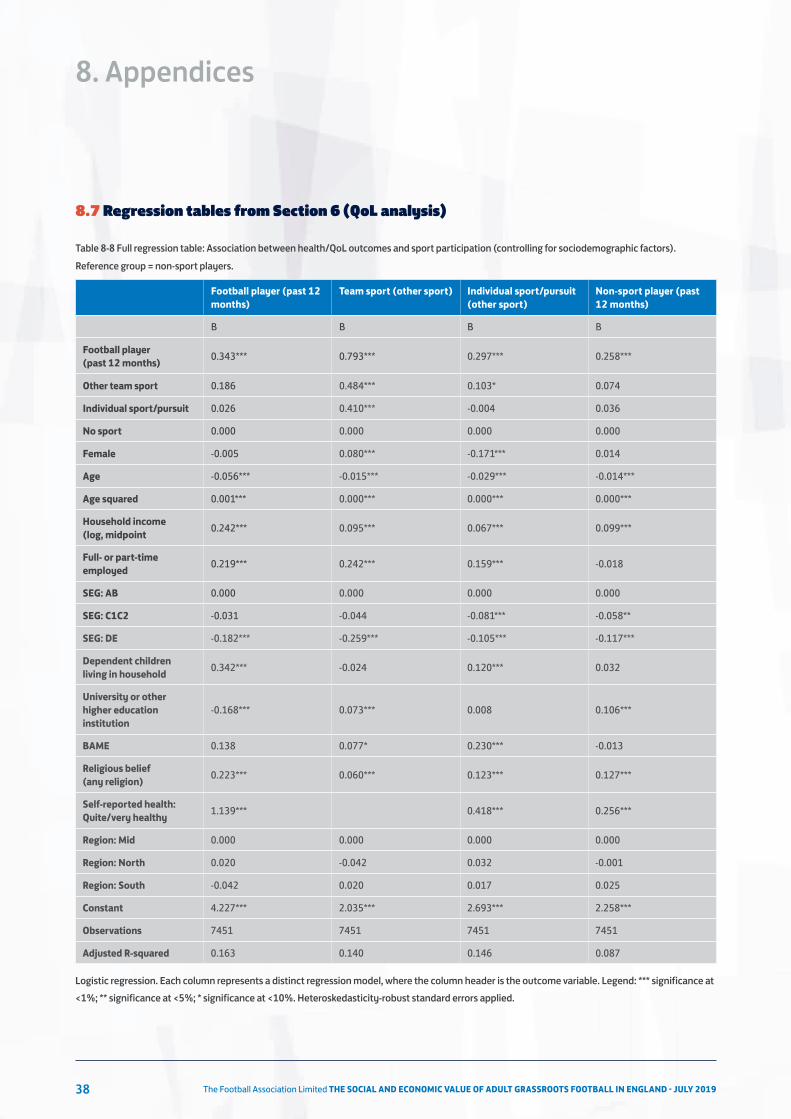
The Football Association Limited THE SOCIAL AND ECONOMIC VALUE OF ADULT GRASSROOTS FOOTBALL IN ENGLAND - JULY 201938
8.7 Regression tables from Section 6 (QoL analysis)
8. Appendices
Football player (past 12 months)
Team sport (other sport) Individual sport/pursuit (other sport)
Non-sport player (past 12 months)
B B B B
Football player (past 12 months) 0.343*** 0.793*** 0.297*** 0.258***
Other team sport 0.186 0.484*** 0.103* 0.074
Individual sport/pursuit 0.026 0.410*** -0.004 0.036
No sport 0.000 0.000 0.000 0.000
Female -0.005 0.080*** -0.171*** 0.014
Age -0.056*** -0.015*** -0.029*** -0.014***
Age squared 0.001*** 0.000*** 0.000*** 0.000***
Household income (log, midpoint 0.242*** 0.095*** 0.067*** 0.099***
Full- or part-time employed 0.219*** 0.242*** 0.159*** -0.018
SEG: AB 0.000 0.000 0.000 0.000
SEG: C1C2 -0.031 -0.044 -0.081*** -0.058**
SEG: DE -0.182*** -0.259*** -0.105*** -0.117***
Dependent children living in household 0.342*** -0.024 0.120*** 0.032
University or other higher education institution
-0.168*** 0.073*** 0.008 0.106***
BAME 0.138 0.077* 0.230*** -0.013
Religious belief (any religion) 0.223*** 0.060*** 0.123*** 0.127***
Self-reported health: Quite/very healthy 1.139*** 0.418*** 0.256***
Region: Mid 0.000 0.000 0.000 0.000
Region: North 0.020 -0.042 0.032 -0.001
Region: South -0.042 0.020 0.017 0.025
Constant 4.227*** 2.035*** 2.693*** 2.258***
Observations 7451 7451 7451 7451
Adjusted R-squared 0.163 0.140 0.146 0.087
Table 8-8 Full regression table: Association between health/QoL outcomes and sport participation (controlling for sociodemographic factors). Reference group = non-sport players.
Logistic regression. Each column represents a distinct regression model, where the column header is the outcome variable. Legend: *** significance at <1%; ** significance at <5%; * significance at <10%. Heteroskedasticity-robust standard errors applied.
The Football Association Limited THE SOCIAL AND ECONOMIC VALUE OF ADULT GRASSROOTS FOOTBALL IN ENGLAND - JULY 2019 39
8. Appendices
8.7.1 Football, other team sports, and individual sports versus those who play no sport
Key findings• The QoL benefits associated with football are greater than those from other sports (both team and individual sports, acknowledging low sample size within the other team sport subgroup) (Appendix Table 8-9).
• Football players report higher QoL on multiple measures compared to those who play no sport: A strong and statistically significant association between playing football and all the main QoL outcomes - happiness, self-perceived health, confidence and trust - compared to the reference group of not doing any sports, after controlling for demographic determinants of wellbeing.
8.7.2 Football vs. other team sports and individual sports
Directly comparing the QoL benefits associated with football directly to those who play other team sports and those who practice individual pursuits is informative, as it gives suggestive evidence of the QoL benefits that could be achieved by encouraging an individual who currently plays another sport to take up football (Appendix Table 8-9).49
Key findings• Football players report higher QoL, on multiple measures, compared with those who play other individual sports/pursuits: A strong and statistically significant association between playing football and all the main QoL outcomes – self-perceived health, confidence, and trust – compared to the reference group of individual sports, after controlling for demographic determinants of wellbeing.
• Football players also report higher QoL, on multiple measures, compared with those who play other team
sports: A strong and statistically significant association between playing football and self-perceived health, confidence and trust - but not happiness, where the difference is not significant - compared to the reference group of playing other team sports, after controlling for demographic determinants of wellbeing.
• Football players report stronger belief that playing football has improved their confidence, concentration, motivation, and social mixing, compared with individual and team sports.
49Note that the analysis in Section 3.1 does not control for those who may play football and other sports in combination.
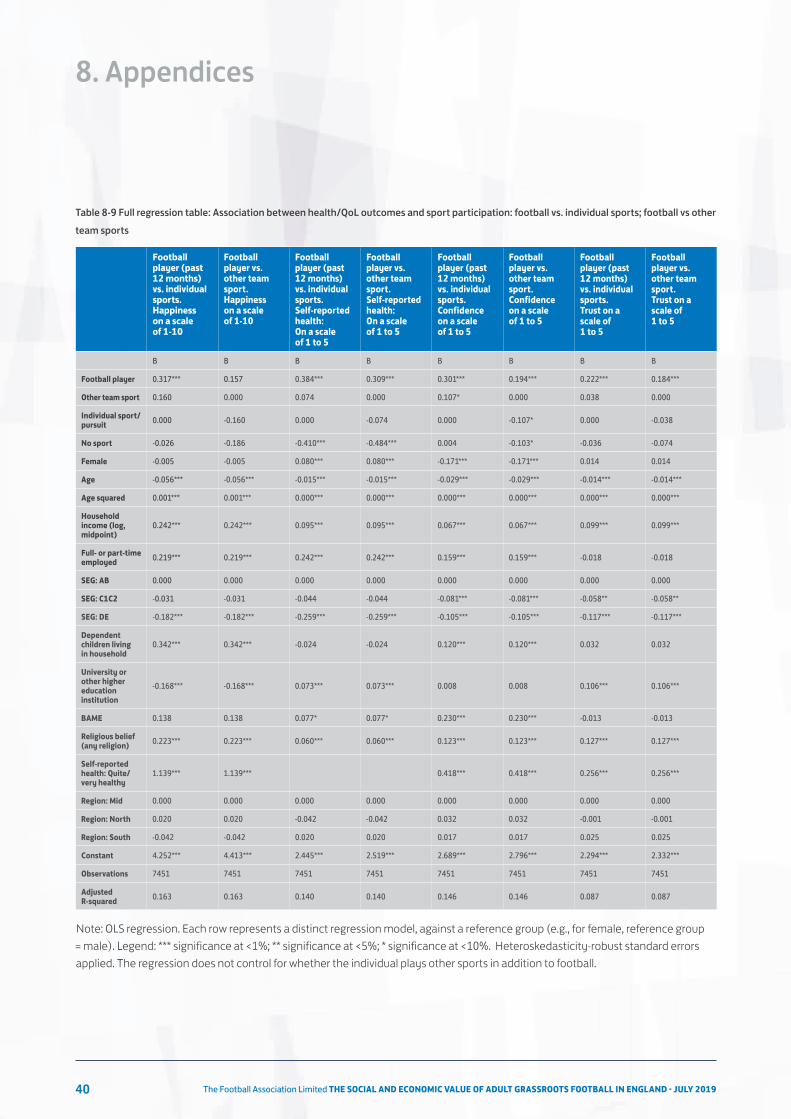
The Football Association Limited THE SOCIAL AND ECONOMIC VALUE OF ADULT GRASSROOTS FOOTBALL IN ENGLAND - JULY 201940
8. Appendices
Football player (past 12 months) vs. individual sports. Happiness on a scale of 1-10
Football player vs. other team sport. Happiness on a scale of 1-10
Football player (past 12 months) vs. individual sports. Self-reported health: On a scale of 1 to 5
Football player vs. other team sport. Self-reported health: On a scale of 1 to 5
Football player (past 12 months) vs. individual sports. Confidence on a scale of 1 to 5
Football player vs. other team sport. Confidence on a scale of 1 to 5
Football player (past 12 months) vs. individual sports. Trust on a scale of 1 to 5
Football player vs. other team sport. Trust on a scale of 1 to 5
B B B B B B B B
Football player 0.317*** 0.157 0.384*** 0.309*** 0.301*** 0.194*** 0.222*** 0.184***
Other team sport 0.160 0.000 0.074 0.000 0.107* 0.000 0.038 0.000
Individual sport/pursuit 0.000 -0.160 0.000 -0.074 0.000 -0.107* 0.000 -0.038
No sport -0.026 -0.186 -0.410*** -0.484*** 0.004 -0.103* -0.036 -0.074
Female -0.005 -0.005 0.080*** 0.080*** -0.171*** -0.171*** 0.014 0.014
Age -0.056*** -0.056*** -0.015*** -0.015*** -0.029*** -0.029*** -0.014*** -0.014***
Age squared 0.001*** 0.001*** 0.000*** 0.000*** 0.000*** 0.000*** 0.000*** 0.000***
Household income (log, midpoint)
0.242*** 0.242*** 0.095*** 0.095*** 0.067*** 0.067*** 0.099*** 0.099***
Full- or part-time employed 0.219*** 0.219*** 0.242*** 0.242*** 0.159*** 0.159*** -0.018 -0.018
SEG: AB 0.000 0.000 0.000 0.000 0.000 0.000 0.000 0.000
SEG: C1C2 -0.031 -0.031 -0.044 -0.044 -0.081*** -0.081*** -0.058** -0.058**
SEG: DE -0.182*** -0.182*** -0.259*** -0.259*** -0.105*** -0.105*** -0.117*** -0.117***
Dependent children living in household
0.342*** 0.342*** -0.024 -0.024 0.120*** 0.120*** 0.032 0.032
University or other higher education institution
-0.168*** -0.168*** 0.073*** 0.073*** 0.008 0.008 0.106*** 0.106***
BAME 0.138 0.138 0.077* 0.077* 0.230*** 0.230*** -0.013 -0.013
Religious belief (any religion) 0.223*** 0.223*** 0.060*** 0.060*** 0.123*** 0.123*** 0.127*** 0.127***
Self-reported health: Quite/very healthy
1.139*** 1.139*** 0.418*** 0.418*** 0.256*** 0.256***
Region: Mid 0.000 0.000 0.000 0.000 0.000 0.000 0.000 0.000
Region: North 0.020 0.020 -0.042 -0.042 0.032 0.032 -0.001 -0.001
Region: South -0.042 -0.042 0.020 0.020 0.017 0.017 0.025 0.025
Constant 4.252*** 4.413*** 2.445*** 2.519*** 2.689*** 2.796*** 2.294*** 2.332***
Observations 7451 7451 7451 7451 7451 7451 7451 7451
Adjusted R-squared 0.163 0.163 0.140 0.140 0.146 0.146 0.087 0.087
Table 8-9 Full regression table: Association between health/QoL outcomes and sport participation: football vs. individual sports; football vs other team sports
Note: OLS regression. Each row represents a distinct regression model, against a reference group (e.g., for female, reference group = male). Legend: *** significance at <1%; ** significance at <5%; * significance at <10%. Heteroskedasticity-robust standard errors applied. The regression does not control for whether the individual plays other sports in addition to football.
The Football Association Limited THE SOCIAL AND ECONOMIC VALUE OF ADULT GRASSROOTS FOOTBALL IN ENGLAND - JULY 2019 41
8. Appendices
8.7.3 Who benefits most from football? Socio-demographic differences within the football sample
The analysis in this section explores whether football has a different effect on different groups in the population. The analysis focuses on demographic groups, notably women, Black Asian and Minority Ethnic groups (BAME) and lower income groups (defined as those whose household income is lower than the median income in The FA’s nationally representative participation tracker data), as well as differentiating between the benefits reported by younger and older people to identify potential lifecycle differences in the footballing experience. The proportion of each target group present in the football, other sport and non-sport samples are shown in Appendix Table 8-10.
This report has analysed whether QoL benefits associated with playing football, or with other sports, are stronger for some demographic groups compared to others. This is tested by analysing the association between football and each of the QoL outcomes within each demographic subgroup (compared to playing no sports). (Appendix Table 8-11).
Key findings• The positive association between playing football and health is significant across all participant groups.
• On average grassroots football among females is associated with higher levels of health, confidence, and trust compared to male footballers.
• Lower income groups experience greater QoL benefits from football on average: The positive association between playing football and health and confidence is stronger for the lower income group compared to the higher income group.
• The association between football and sport’s perceived impact on social mixing remains considerably high across all subgroups.
• Playing grassroots football is associated with positive QoL benefits to all layers of society, and for some outcomes the QoL benefits are higher for socially disadvantaged groups, notably the health and confidence benefits to lower income groups.
• Some QoL benefits are higher for BAME groups, specifically trust.
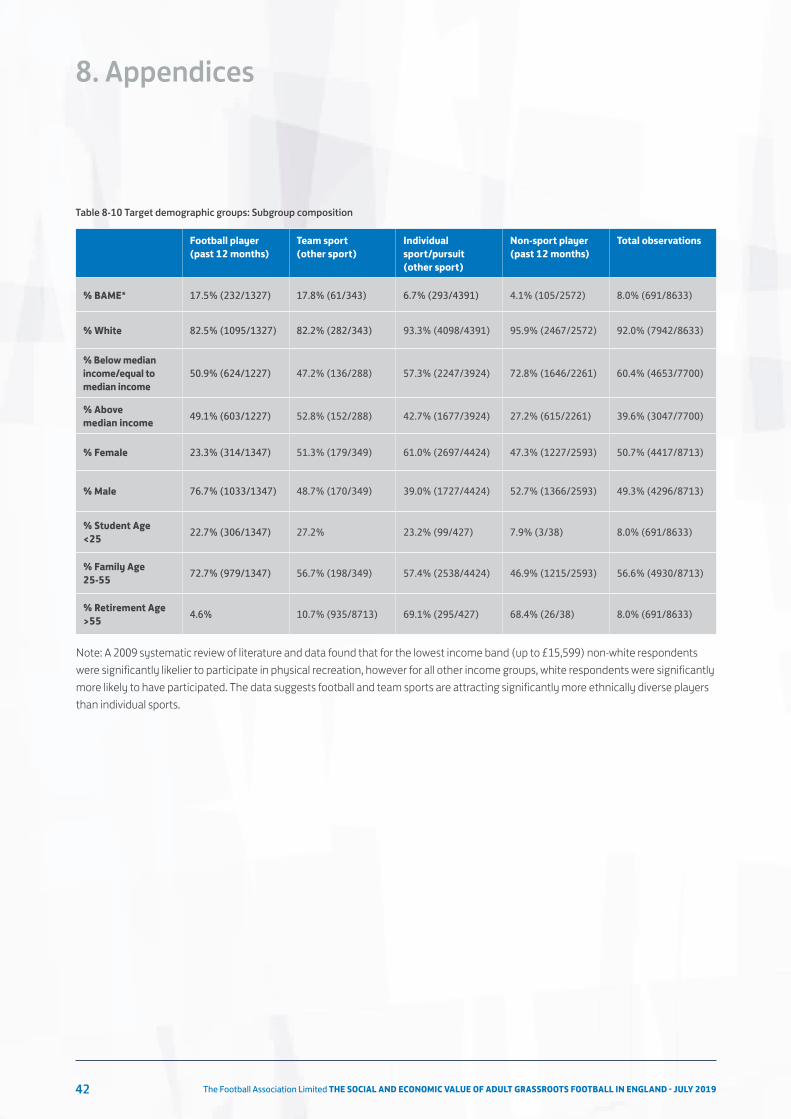
The Football Association Limited THE SOCIAL AND ECONOMIC VALUE OF ADULT GRASSROOTS FOOTBALL IN ENGLAND - JULY 201942
8. Appendices
Table 8-10 Target demographic groups: Subgroup composition
Football player (past 12 months)
Team sport (other sport)
Individual sport/pursuit (other sport)
Non-sport player (past 12 months)
Total observations
% BAME* 17.5% (232/1327) 17.8% (61/343) 6.7% (293/4391) 4.1% (105/2572) 8.0% (691/8633)
% White 82.5% (1095/1327) 82.2% (282/343) 93.3% (4098/4391) 95.9% (2467/2572) 92.0% (7942/8633)
% Below median income/equal to median income
50.9% (624/1227) 47.2% (136/288) 57.3% (2247/3924) 72.8% (1646/2261) 60.4% (4653/7700)
% Above median income 49.1% (603/1227) 52.8% (152/288) 42.7% (1677/3924) 27.2% (615/2261) 39.6% (3047/7700)
% Female 23.3% (314/1347) 51.3% (179/349) 61.0% (2697/4424) 47.3% (1227/2593) 50.7% (4417/8713)
% Male 76.7% (1033/1347) 48.7% (170/349) 39.0% (1727/4424) 52.7% (1366/2593) 49.3% (4296/8713)
% Student Age <25 22.7% (306/1347) 27.2% 23.2% (99/427) 7.9% (3/38) 8.0% (691/8633)
% Family Age 25-55 72.7% (979/1347) 56.7% (198/349) 57.4% (2538/4424) 46.9% (1215/2593) 56.6% (4930/8713)
% Retirement Age >55 4.6% 10.7% (935/8713) 69.1% (295/427) 68.4% (26/38) 8.0% (691/8633)
Note: A 2009 systematic review of literature and data found that for the lowest income band (up to £15,599) non-white respondents were significantly likelier to participate in physical recreation, however for all other income groups, white respondents were significantly more likely to have participated. The data suggests football and team sports are attracting significantly more ethnically diverse players than individual sports.
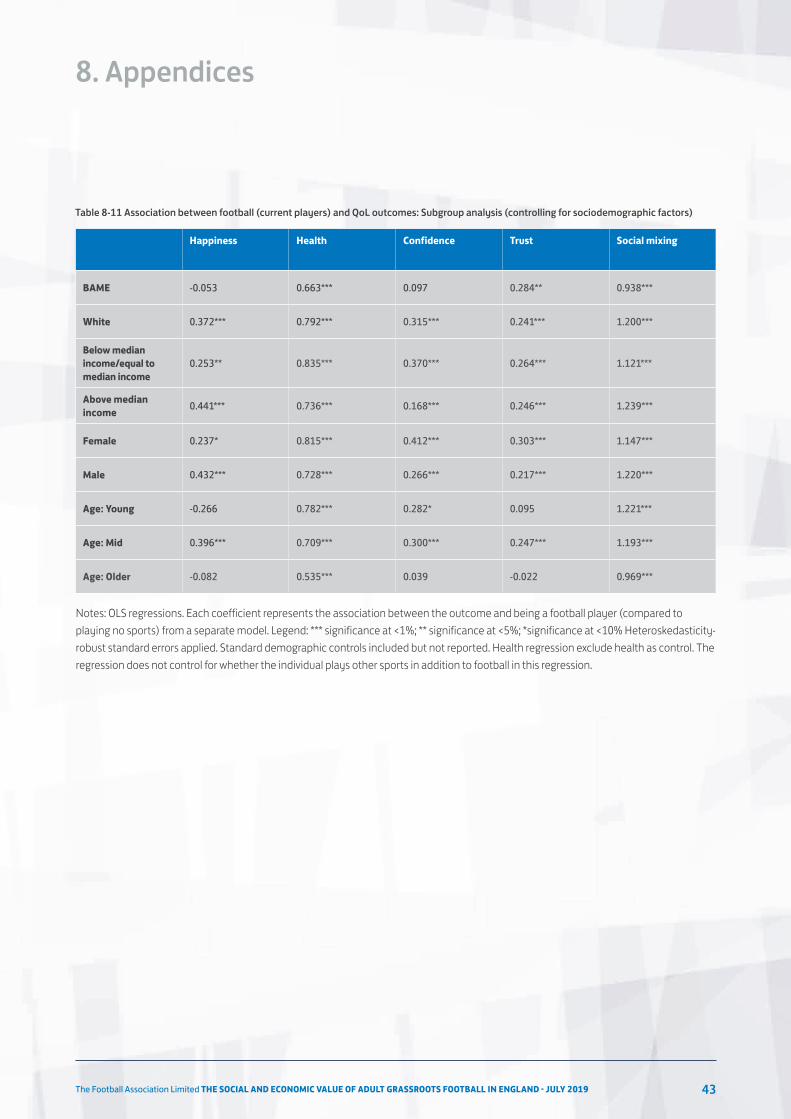
The Football Association Limited THE SOCIAL AND ECONOMIC VALUE OF ADULT GRASSROOTS FOOTBALL IN ENGLAND - JULY 2019 43
8. Appendices
Table 8-11 Association between football (current players) and QoL outcomes: Subgroup analysis (controlling for sociodemographic factors)
Happiness Health Confidence Trust Social mixing
BAME -0.053 0.663*** 0.097 0.284** 0.938***
White 0.372*** 0.792*** 0.315*** 0.241*** 1.200***
Below median income/equal to median income
0.253** 0.835*** 0.370*** 0.264*** 1.121***
Above median income 0.441*** 0.736*** 0.168*** 0.246*** 1.239***
Female 0.237* 0.815*** 0.412*** 0.303*** 1.147***
Male 0.432*** 0.728*** 0.266*** 0.217*** 1.220***
Age: Young -0.266 0.782*** 0.282* 0.095 1.221***
Age: Mid 0.396*** 0.709*** 0.300*** 0.247*** 1.193***
Age: Older -0.082 0.535*** 0.039 -0.022 0.969***
Notes: OLS regressions. Each coefficient represents the association between the outcome and being a football player (compared to playing no sports) from a separate model. Legend: *** significance at <1%; ** significance at <5%; *significance at <10% Heteroskedasticity-robust standard errors applied. Standard demographic controls included but not reported. Health regression exclude health as control. The regression does not control for whether the individual plays other sports in addition to football in this regression.
The Football Association Limited THE SOCIAL AND ECONOMIC VALUE OF ADULT GRASSROOTS FOOTBALL IN ENGLAND - JULY 201944
8. Appendices
8.7.4 11-a-side vs other-size games
Key findings• The most common type of football played is 5-a-side (both indoors and outdoors), with approximately 60% of football players playing this form of the game (all results for male/female combined). The second most popular form of the game is a casual kick-about with friends/family in the park (30%) followed by 11-a-side football (26%).
• 11-a-side football has a higher proportion of male and higher earners: A significantly higher proportion of 11-a-side footballers are male (88%), white (84%), and higher income group (55%), compared to other football types (Appendix Table 8-5).
• In contrast, a higher proportion of those who play casual football are lower income (58% below median income and 23% DE socioeconomic group) compared with other football types.
• 11-a-side footballers report higher levels of health and happiness (all results for male/female combined) compared to other types of football: 11-a-side football has a greater association with happiness and health, as well as confidence, concentration, motivation and social mixing, compared to other forms of the game (Appendix Table 8-12).50
• Organised team football is associated with higher levels of confidence and trust compared to the casual kick-about with friends/family in the park.
50Note that the indicator variables are not mutually exclusive as some people play several types of football.
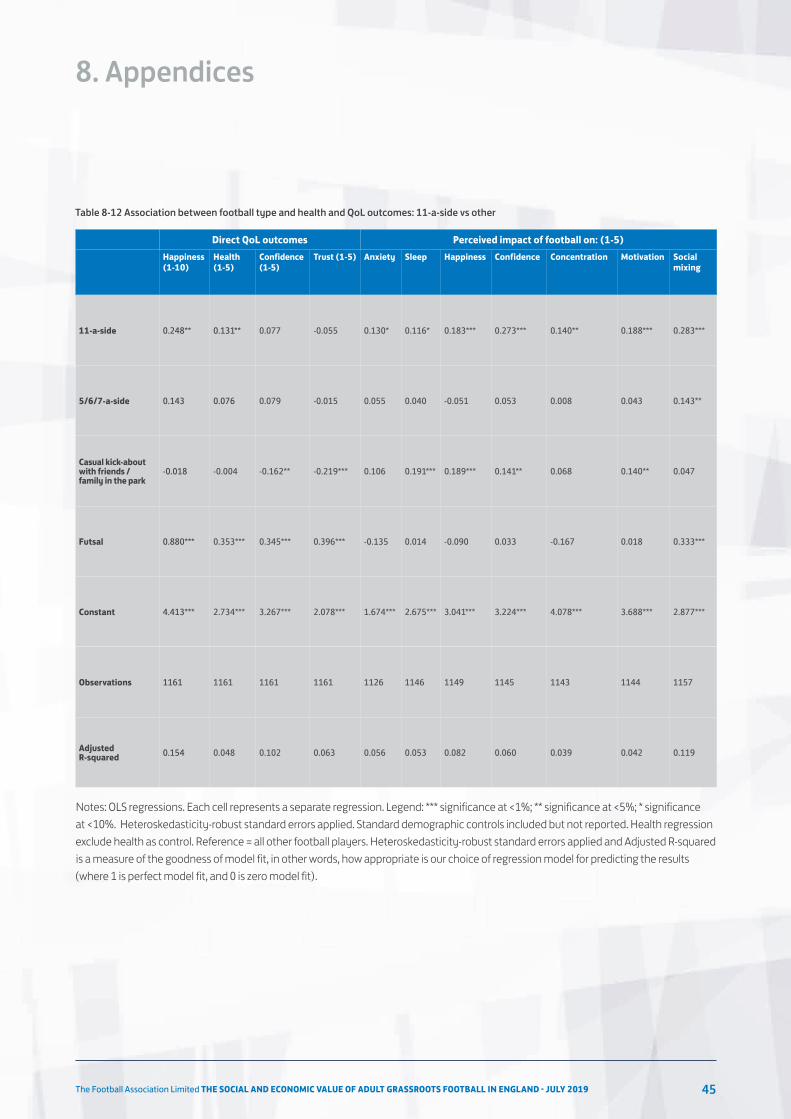
The Football Association Limited THE SOCIAL AND ECONOMIC VALUE OF ADULT GRASSROOTS FOOTBALL IN ENGLAND - JULY 2019 45
8. Appendices
Table 8-12 Association between football type and health and QoL outcomes: 11-a-side vs other
Notes: OLS regressions. Each cell represents a separate regression. Legend: *** significance at <1%; ** significance at <5%; * significance at <10%. Heteroskedasticity-robust standard errors applied. Standard demographic controls included but not reported. Health regression exclude health as control. Reference = all other football players. Heteroskedasticity-robust standard errors applied and Adjusted R-squared is a measure of the goodness of model fit, in other words, how appropriate is our choice of regression model for predicting the results (where 1 is perfect model fit, and 0 is zero model fit).
Happiness (1-10)
Health (1-5)
Confidence (1-5)
Trust (1-5) Anxiety Sleep Happiness Confidence Concentration Motivation Social mixing
11-a-side 0.248** 0.131** 0.077 -0.055 0.130* 0.116* 0.183*** 0.273*** 0.140** 0.188*** 0.283***
5/6/7-a-side 0.143 0.076 0.079 -0.015 0.055 0.040 -0.051 0.053 0.008 0.043 0.143**
Casual kick-about with friends / family in the park
-0.018 -0.004 -0.162** -0.219*** 0.106 0.191*** 0.189*** 0.141** 0.068 0.140** 0.047
Futsal 0.880*** 0.353*** 0.345*** 0.396*** -0.135 0.014 -0.090 0.033 -0.167 0.018 0.333***
Constant 4.413*** 2.734*** 3.267*** 2.078*** 1.674*** 2.675*** 3.041*** 3.224*** 4.078*** 3.688*** 2.877***
Observations 1161 1161 1161 1161 1126 1146 1149 1145 1143 1144 1157
Adjusted R-squared 0.154 0.048 0.102 0.063 0.056 0.053 0.082 0.060 0.039 0.042 0.119
Direct QoL outcomes Perceived impact of football on: (1-5)
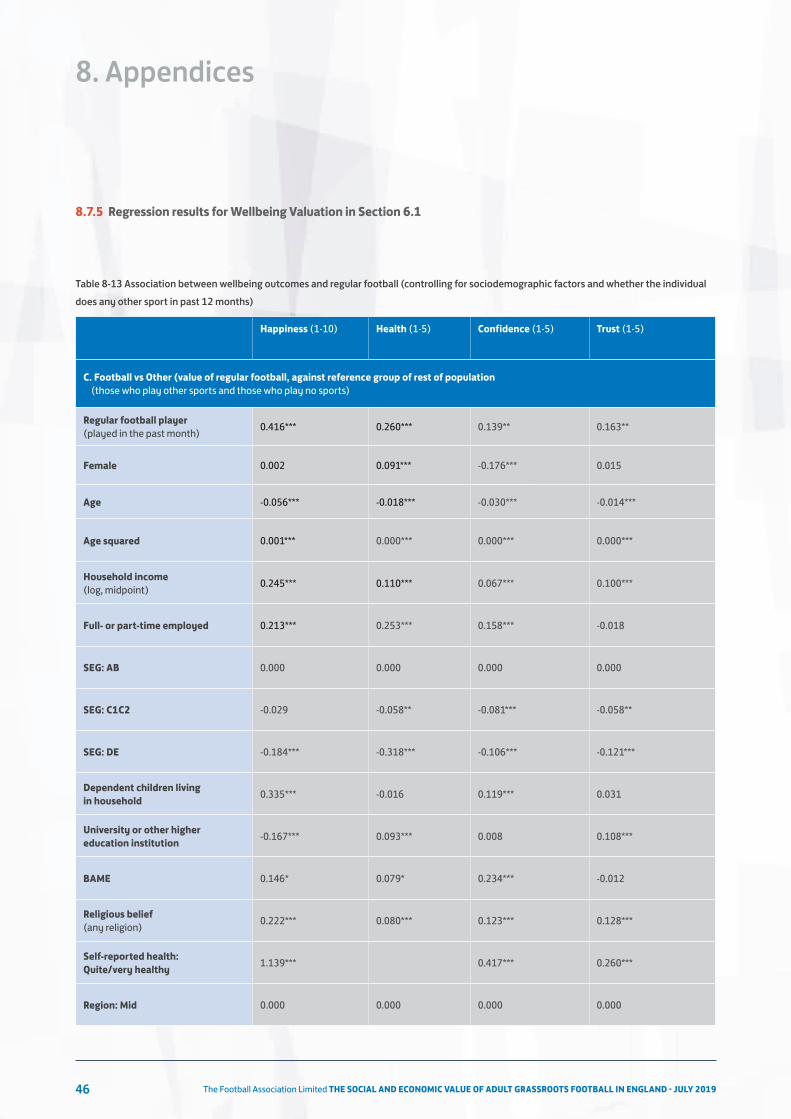
The Football Association Limited THE SOCIAL AND ECONOMIC VALUE OF ADULT GRASSROOTS FOOTBALL IN ENGLAND - JULY 201946
8. Appendices
8.7.5 Regression results for Wellbeing Valuation in Section 6.1
Happiness (1-10) Health (1-5) Confidence (1-5) Trust (1-5)
C. Football vs Other (value of regular football, against reference group of rest of population (those who play other sports and those who play no sports)
Regular football player (played in the past month) 0.416*** 0.260*** 0.139** 0.163**
Female 0.002 0.091*** -0.176*** 0.015
Age -0.056*** -0.018*** -0.030*** -0.014***
Age squared 0.001*** 0.000*** 0.000*** 0.000***
Household income (log, midpoint) 0.245*** 0.110*** 0.067*** 0.100***
Full- or part-time employed 0.213*** 0.253*** 0.158*** -0.018
SEG: AB 0.000 0.000 0.000 0.000
SEG: C1C2 -0.029 -0.058** -0.081*** -0.058**
SEG: DE -0.184*** -0.318*** -0.106*** -0.121***
Dependent children living in household 0.335*** -0.016 0.119*** 0.031
University or other higher education institution -0.167*** 0.093*** 0.008 0.108***
BAME 0.146* 0.079* 0.234*** -0.012
Religious belief (any religion) 0.222*** 0.080*** 0.123*** 0.128***
Self-reported health: Quite/very healthy 1.139*** 0.417*** 0.260***
Region: Mid 0.000 0.000 0.000 0.000
Table 8-13 Association between wellbeing outcomes and regular football (controlling for sociodemographic factors and whether the individual does any other sport in past 12 months)

The Football Association Limited THE SOCIAL AND ECONOMIC VALUE OF ADULT GRASSROOTS FOOTBALL IN ENGLAND - JULY 2019 47
Happiness (1-10) Health (1-5) Confidence (1-5) Trust (1-5)
C. Football vs Other (value of regular football, against reference group of rest of population (those who play other sports and those who play no sports)
Region: North 0.020 -0.038 0.032 -0.000
Region: South -0.042 0.023 0.017 0.025
Plays football alongside other sport (ref=pure football) -0.026 0.248*** 0.184*** 0.093
Constant 4.216*** 2.294*** 2.711*** 2.283***
Observations 7451 7451 7451 7451
Adjusted R-squared 0.164 0.111 0.146 0.087
Wellbeing value NA £1,385 NA NA
D. Football vs Non-sport (value of regular football, against reference group of those who play no sports)
Regular football player (played in the past month) 0.328*** 0.637*** 0.266*** 0.230***
Female 0.079 0.050 -0.159*** 0.048
Age -0.063*** -0.026*** -0.039*** -0.024***
Age squared 0.001*** 0.000*** 0.001*** 0.000***
Household income (log, midpoint) 0.299*** 0.067*** 0.092*** 0.096***
Full- or part-time employed 0.308*** 0.310*** 0.129*** 0.023
SEG: AB 0.000 0.000 0.000 0.000
SEG: C1C2 -0.053 -0.076* -0.099** -0.032
SEG: DE -0.194* -0.292*** -0.121** -0.091*
8. Appendices
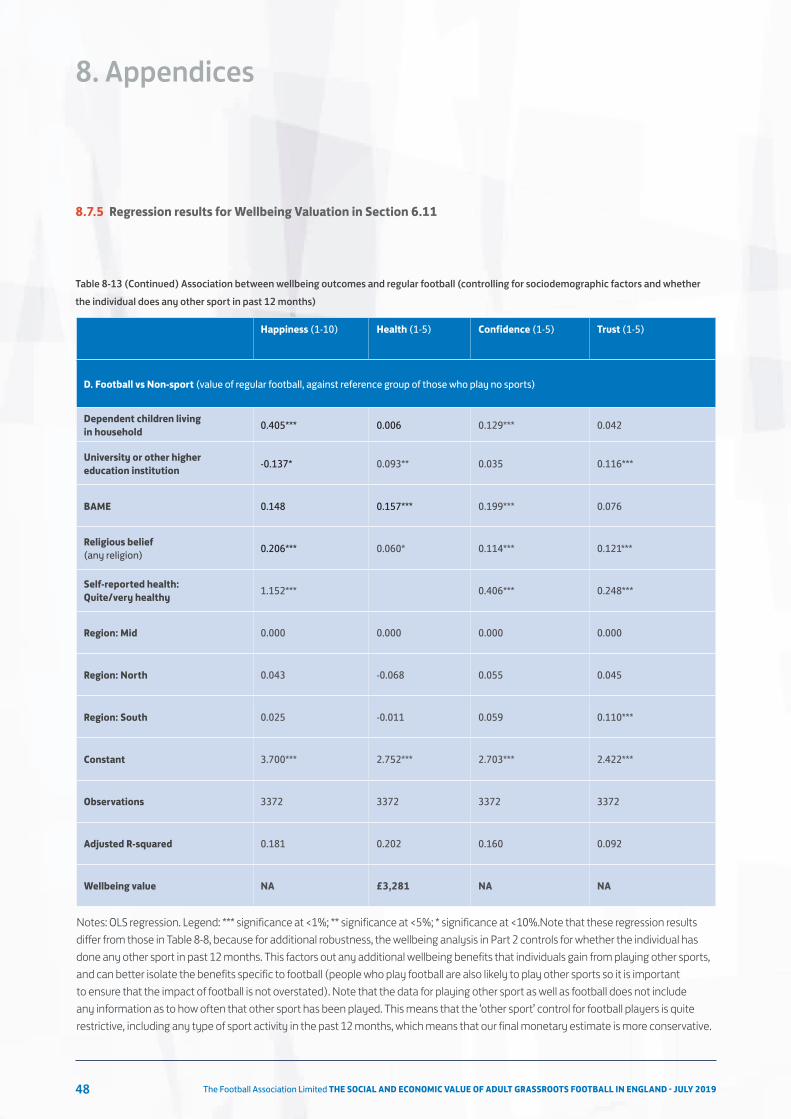
The Football Association Limited THE SOCIAL AND ECONOMIC VALUE OF ADULT GRASSROOTS FOOTBALL IN ENGLAND - JULY 201948
8. Appendices
8.7.5 Regression results for Wellbeing Valuation in Section 6.11
Happiness (1-10) Health (1-5) Confidence (1-5) Trust (1-5)
D. Football vs Non-sport (value of regular football, against reference group of those who play no sports)
Dependent children living in household 0.405*** 0.006 0.129*** 0.042
University or other higher education institution -0.137* 0.093** 0.035 0.116***
BAME 0.148 0.157*** 0.199*** 0.076
Religious belief (any religion) 0.206*** 0.060* 0.114*** 0.121***
Self-reported health: Quite/very healthy 1.152*** 0.406*** 0.248***
Region: Mid 0.000 0.000 0.000 0.000
Region: North 0.043 -0.068 0.055 0.045
Region: South 0.025 -0.011 0.059 0.110***
Constant 3.700*** 2.752*** 2.703*** 2.422***
Observations 3372 3372 3372 3372
Adjusted R-squared 0.181 0.202 0.160 0.092
Wellbeing value NA £3,281 NA NA
Table 8-13 (Continued) Association between wellbeing outcomes and regular football (controlling for sociodemographic factors and whether the individual does any other sport in past 12 months)
Notes: OLS regression. Legend: *** significance at <1%; ** significance at <5%; * significance at <10%.Note that these regression results differ from those in Table 8-8, because for additional robustness, the wellbeing analysis in Part 2 controls for whether the individual has done any other sport in past 12 months. This factors out any additional wellbeing benefits that individuals gain from playing other sports, and can better isolate the benefits specific to football (people who play football are also likely to play other sports so it is important to ensure that the impact of football is not overstated). Note that the data for playing other sport as well as football does not include any information as to how often that other sport has been played. This means that the ‘other sport’ control for football players is quite restrictive, including any type of sport activity in the past 12 months, which means that our final monetary estimate is more conservative.
The Football Association Limited THE SOCIAL AND ECONOMIC VALUE OF ADULT GRASSROOTS FOOTBALL IN ENGLAND - JULY 2019 49
8. Appendices
51The FA participation tracker survey has a total sample of 8,713 in of which n=1,189 are regular grassroots football players (at least once in past month). However, Active People has been replaced by Active Lives in the past two years (with Active Lives data not publicly available).
8.8 Aggregation of individual values to the national level
Throughout the report, the analysis focuses on the value of ‘regular grassroots football’ defined as those who played football at least once over the past month. This is a stricter definition of grassroots football playing, which provides a more conservative estimate of the value of football, but has the advantage of isolating a more specific value for those who have demonstrated their commitment to playing football regularly, which provides a more robust estimate of the individual-level benefits of football for the purposes of aggregation to the national population.
In all instances, the national population is aggregated using the data on the proportion of respondents aged 18+ who played grassroots football at least once in the past month. In The FA participation tracker this proportion is 13.65%. As a comparison, the Sport England Active People Survey is a nationally representative survey of over 100,000 respondents in each wave (phone and internet surveys), with over 4,000 of these regular grassroots footballers (at least once a month) aged 18+ in England (APS population weighting). Active People data reports the proportion of regular grassroots football players in England as 6.15%.51Although these differences are driven by the different methodologies applied in each survey, for aggregation purposes, a lower confidence interval estimate is taken (12.93%) to account for observed differences between The FA participation tracker and other national datasets.
Lower and upper bound estimatesFor the aggregation of the non-economic benefits of grassroots football, different estimates of the QoL benefits of grassroots football are obtained depending on whether footballers are compared with all other people in society (Football vs Other) (both those who play other sports and those who play none in our sample) or with only non-sport players (Football vs Non-sport).
Football vs Other is most appropriate to understand the current level of value that football provides to society more widely, since it isolates the benefits that football provides in a real-world setting where people have other sources of exercise, socialisation, and purpose. It also produces a lower bound estimate of the value of football to QoL because it avoids attributing to football the positive contributions of other sports. It is this ‘lower-bound’ value that is recommended when aggregating the benefits of grassroots football to the national level.
In contrast, the ‘Football vs Non-sport’ estimates compare the QoL associated with grassroots football against a reference group of non-sport players. This will produce higher estimates because it assumes that the alternative to playing football is to do no sport, which is not realistic in society more widely. This upper-bound figure is most relevant when considering a programme or investment which will convert non-sport players into footballers. At the aggregate level, this should be interpreted as the cost to society if all those who currently play football were to cease playing.
The Football Association Limited THE SOCIAL AND ECONOMIC VALUE OF ADULT GRASSROOTS FOOTBALL IN ENGLAND - JULY 201950
8. Appendices
52The FA participation tracker survey has a total sample of 8,713 in of which n=1,189 are regular grassroots football players (at least once in past month). However, Active People has been replaced by Active Lives in the past two years (with Active Lives data not publicly available).
8.9 Sensitivity analysis: Association between higher football expenditure and commitment (frequency of playing football)
Sensitivity analysis is conducted to investigate how football-related expenditures vary across different demographic subgroups of the population and different types of football (11-a-side, 5/6/7-a-side, casual kick-about with friends/family in the park etc.). The analysis uses the concept of recreation specialisation52, which has been widely used for explaining different kinds of behaviours and characteristics among people who play sport. It is expected that the differences in how much subgroups would be willing to pay for their sports participation (revealed through a real or hypothetical market) would show the level of commitment to their sporting activity. The analysis starts with descriptive statistics (the age, sex, socio-economic status of players) and then moves on to regression analysis to test the hypothesis that difference in expenditure on football are associated with individual levels of commitment and enjoyment, holding all other observable factors constant.
Regression analysis is then used to identify the main drivers of football expenditure. Frequency of football playing (when the individual last played football) is used as an indicator of commitment. Following the literature on leisure spending, it is expected that those who show most commitment (play most often) should have higher willingness to pay for the sport. It should be acknowledged that some shorter-term differences may be missed out in this frequency variable, such as those who have been temporarily unable to play due to injury or other circumstances.
The initial hypothesis is confirmed: frequency of playing football is significantly and positively associated with football expenditure – those who played football more recently spend considerably more (the distribution of football playing frequency in the sample is presented in Table 8-14).
11-a-side football is positively and significantly associated with higher football expenditure, both in absolute terms and relative to household income. The association with Futsal, while high, is not significant due to low sample size (less than n=40), and may be due to outliers.
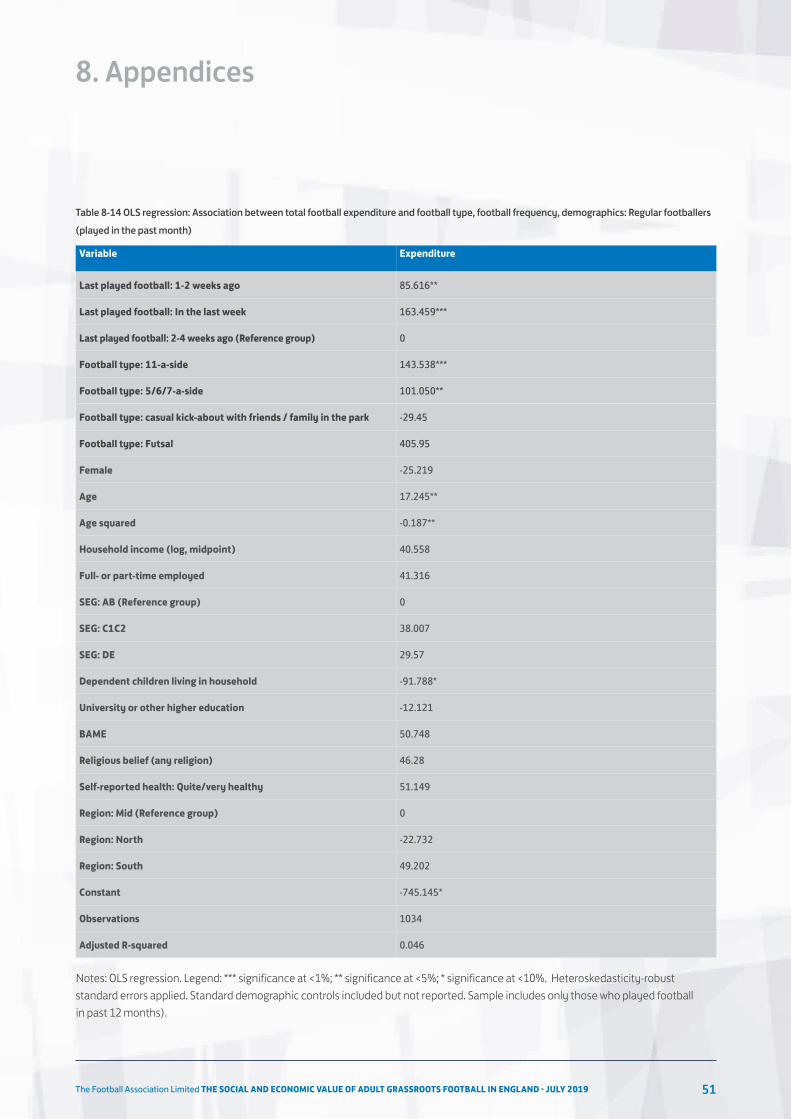
The Football Association Limited THE SOCIAL AND ECONOMIC VALUE OF ADULT GRASSROOTS FOOTBALL IN ENGLAND - JULY 2019 51
8. Appendices
Table 8-14 OLS regression: Association between total football expenditure and football type, football frequency, demographics: Regular footballers (played in the past month)
Variable Expenditure
Last played football: 1-2 weeks ago 85.616**
Last played football: In the last week 163.459***
Last played football: 2-4 weeks ago (Reference group) 0
Football type: 11-a-side 143.538***
Football type: 5/6/7-a-side 101.050**
Football type: casual kick-about with friends / family in the park -29.45
Football type: Futsal 405.95
Female -25.219
Age 17.245**
Age squared -0.187**
Household income (log, midpoint) 40.558
Full- or part-time employed 41.316
SEG: AB (Reference group) 0
SEG: C1C2 38.007
SEG: DE 29.57
Dependent children living in household -91.788*
University or other higher education -12.121
BAME 50.748
Religious belief (any religion) 46.28
Self-reported health: Quite/very healthy 51.149
Region: Mid (Reference group) 0
Region: North -22.732
Region: South 49.202
Constant -745.145*
Observations 1034
Adjusted R-squared 0.046
Notes: OLS regression. Legend: *** significance at <1%; ** significance at <5%; * significance at <10%. Heteroskedasticity-robust standard errors applied. Standard demographic controls included but not reported. Sample includes only those who played football in past 12 months).
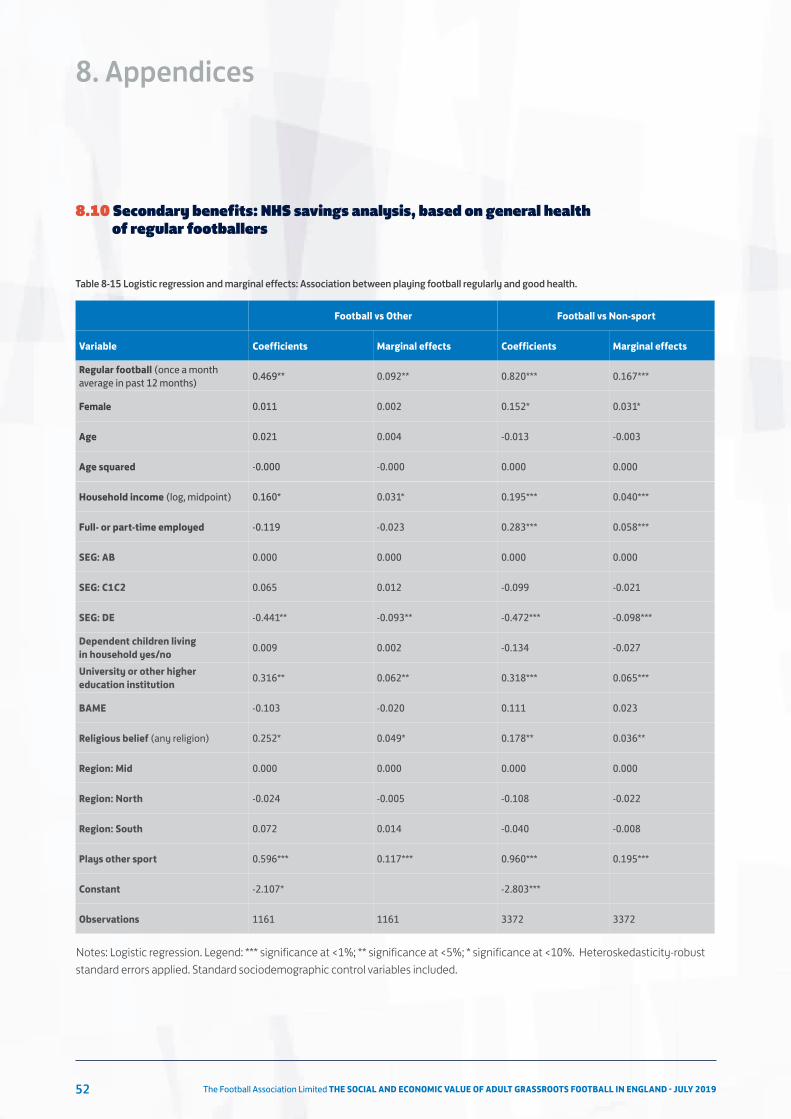
The Football Association Limited THE SOCIAL AND ECONOMIC VALUE OF ADULT GRASSROOTS FOOTBALL IN ENGLAND - JULY 201952
8. Appendices
8.10 Secondary benefits: NHS savings analysis, based on general health of regular footballers
Table 8-15 Logistic regression and marginal effects: Association between playing football regularly and good health.
Notes: Logistic regression. Legend: *** significance at <1%; ** significance at <5%; * significance at <10%. Heteroskedasticity-robust standard errors applied. Standard sociodemographic control variables included.
Variable Coefficients Marginal effects Coefficients Marginal effects
Regular football (once a month average in past 12 months) 0.469** 0.092** 0.820*** 0.167***
Female 0.011 0.002 0.152* 0.031*
Age 0.021 0.004 -0.013 -0.003
Age squared -0.000 -0.000 0.000 0.000
Household income (log, midpoint) 0.160* 0.031* 0.195*** 0.040***
Full- or part-time employed -0.119 -0.023 0.283*** 0.058***
SEG: AB 0.000 0.000 0.000 0.000
SEG: C1C2 0.065 0.012 -0.099 -0.021
SEG: DE -0.441** -0.093** -0.472*** -0.098***
Dependent children living in household yes/no 0.009 0.002 -0.134 -0.027
University or other higher education institution 0.316** 0.062** 0.318*** 0.065***
BAME -0.103 -0.020 0.111 0.023
Religious belief (any religion) 0.252* 0.049* 0.178** 0.036**
Region: Mid 0.000 0.000 0.000 0.000
Region: North -0.024 -0.005 -0.108 -0.022
Region: South 0.072 0.014 -0.040 -0.008
Plays other sport 0.596*** 0.117*** 0.960*** 0.195***
Constant -2.107* -2.803***
Observations 1161 1161 3372 3372
Football vs Other Football vs Non-sport
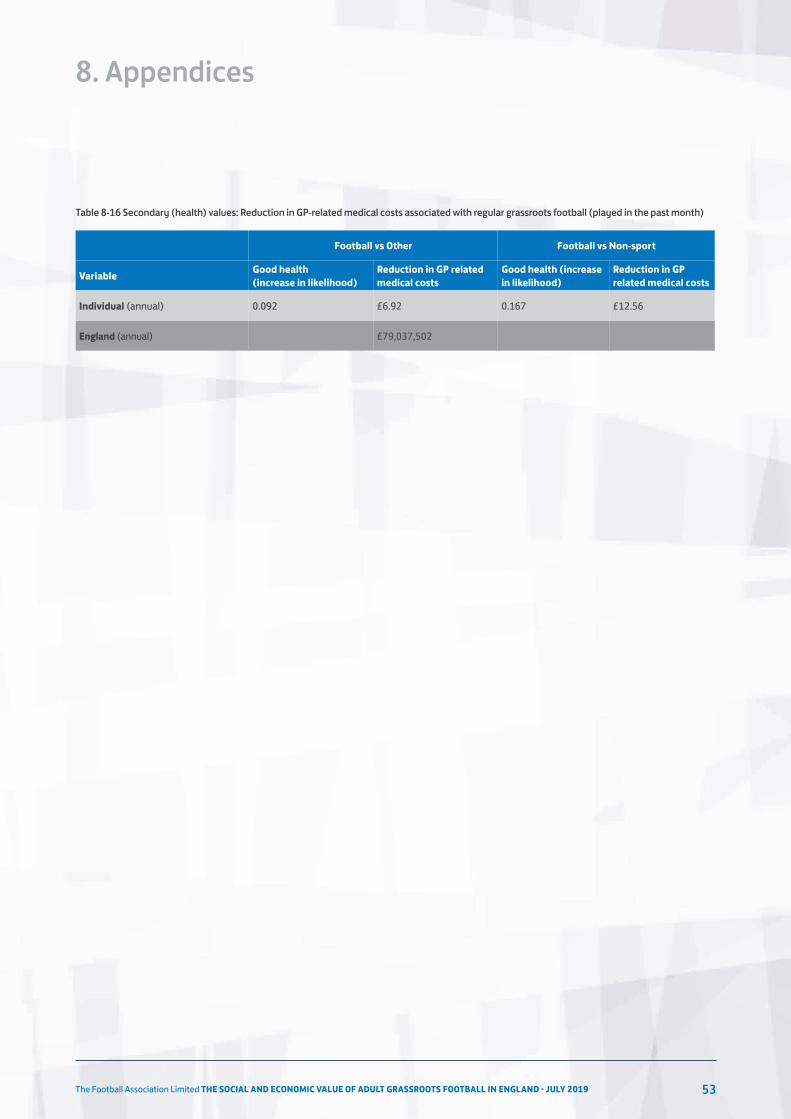
The Football Association Limited THE SOCIAL AND ECONOMIC VALUE OF ADULT GRASSROOTS FOOTBALL IN ENGLAND - JULY 2019 53
Variable Good health (increase in likelihood)
Reduction in GP related medical costs
Good health (increase in likelihood)
Reduction in GP related medical costs
Individual (annual) 0.092 £6.92 0.167 £12.56
England (annual) £79,037,502
Football vs Other Football vs Non-sport
8. Appendices
Table 8-16 Secondary (health) values: Reduction in GP-related medical costs associated with regular grassroots football (played in the past month)
The Football Association Limited THE SOCIAL AND ECONOMIC VALUE OF ADULT GRASSROOTS FOOTBALL IN ENGLAND - JULY 201954

The Football Association Limited THE SOCIAL AND ECONOMIC VALUE OF ADULT GRASSROOTS FOOTBALL IN ENGLAND - JULY 2019 55
9. Authors
Lottie Birdsall-Strong The Football Association
Will Watt Jump Projects
Dr Ricky Lawton Jump Projects
Lizzie Trotter Jump Projects
Dr Iulian Gramatki Jump Projects
Daniel Fujiwara Simetrica
16940