the economic value of underage drinking and adult
TRANSCRIPT

The National Center on Addiction and Substance Abuse at Columbia University
633 Third Avenue New York, NY 10017-6706
phone 212 841 5200 fax 212 956 8020 www.casacolumbia.org
Board of Directors
Joseph A. Califano, Jr. Chairman and President
Lee C. Bollinger Columba Bush Kenneth I. Chenault Jamie Lee Curtis James Dimon Mary Fisher Douglas A. Fraser Leo-Arthur Kelmenson Donald R. Keough David A. Kessler, M.D. LaSalle D. Leffall, Jr., M.D. Manuel T. Pacheco, Ph.D. Joseph J. Plumeri II E. John Rosenwald, Jr.Michael P. SchulhofLouis W. Sullivan, M.D.Michael A. Wiener
--- Directors Emeritus
James E. Burke (1992-1997) Betty Ford (1992-1998) Barbara C. Jordan (1992-1996) Nancy Reagan (1995-2000) Linda Johnson Rice (1992-1996) George Rupp, Ph.D. (1993-2002) Michael I. Sovern (1992-1993) Frank G. Wells (1992-1994)
The Economic Value of Underage Drinking and Adult Excessive Drinking to the Alcohol Industry
A CASA White Paper
February 2003

Board of Directors
Lee C. Bollinger President of Columbia University
Columba Bush First Lady of Florida
Joseph A. Califano, Jr. Chairman and President of CASA
Kenneth I. Chenault Chairman and Chief Executive Officer of American Express Company
Jamie Lee Curtis
James Dimon Chairman and CEO of Bank One Corporation
Peter R. Dolan Chairman and CEO of Bristol-Myers Squibb Company
Mary Fisher Mary Fisher Care Fund
Douglas A. Fraser Professor of Labor Studies at Wayne State University (former President of United Auto Workers)
Victor F. Ganzi President and Chief Executive Officer of The Hearst Corporation
Leo-Arthur Kelmenson Chairman of the Board of FCB Worldwide
Donald R. Keough Chairman of the Board of Allen and Company Incorporated (former President of The Coca-Cola Company)
David A. Kessler, M.D. Dean of Yale University School of Medicine
Manuel T. Pacheco, Ph.D. President of The University of Missouri
Joseph J. Plumeri II Chairman and CEO of The Willis Group Limited
E. John Rosenwald, Jr. Vice Chairman of Bear, Stearns & Co. Inc.
Michael P. Schulhof
Louis W. Sullivan, M.D. President Emeritus of Morehouse School of Medicine
John J. Sweeney President of AFL-CIO
Michael A. Wiener Founder and Chairman Emeritus of Infinity Broadcasting Corporation
Directors Emeritus
James E. Burke (1992-1997) Linda Johnson Rice (1992-1996) Betty Ford (1992-1998) George Rupp (1993-2002) Barbara C. Jordan (1992-1996) Michael I. Sovern (1992-1993) LaSalle D. Leffall, Jr., M.D., F.A.C.S. (1992-2001) Frank G. Wells (1992-1994) Nancy Reagan (1995-2000) Copyright © 2002. All rights reserved. May not be used or reproduced without the express written permission of The National Center on Addiction and Substance Abuse at Columbia University.

Table of Contents Accompanying Statement.................................................................................................. i Estimating the Proportion of the Population that Drinks..............................................1
Underage Drinkers ...................................................................................................1 Adult Drinkers .........................................................................................................3
Estimating the Amount of Alcohol Consumed ................................................................3 Underage Drinkers ...................................................................................................3 Adult Drinkers .........................................................................................................4 Calculating the Amount Consumed .........................................................................4
Calculating the Share of Alcohol Consumed by Underage and Adult Drinkers .........4 Estimating the Economic Impact of Underage Drinking ...............................................4 Estimating the Economic Impact of Adult Excessive Drinking.....................................5 The Link Between Underage Drinking and Adult Excessive Drinking ........................6 Summary.............................................................................................................................7 Notes ....................................................................................................................................9 Reference List...................................................................................................................13

Accompanying Statement
®By Joseph A. Califano, Jr. Chairman and President
Alcohol is far and away the top drug of abuse by America’s teenagers. As CASA and others have documented, more than five million high school students (31.5 percent) admit binge drinking at least once a month; the proportion of children who begin drinking in eighth grade or earlier jumped by 33 percent from 1975 to 1999; and the gender gap in alcohol consumption that once separated boys and girls has evaporated as male and female ninth graders are just as likely to drink (40.2 vs 41.0 percent) and binge drink (21.7 vs. 20.2 percent).1 Last year, the report of the College Task Force of the National Advisory Council on Alcohol Abuse and Alcoholism (NIAAA) described the stunning impact on college campuses of drinking among middle and high school children. That Task Force found that 44 percent of college students binge drink biweekly and 23 percent have binged on three or more occasions in the past two weeks. The Task Force set out the resulting annual human carnage of 1,400 deaths, 500,000 injuries, 600,000 assaults and more than 70,000 sexual assaults among college students.2 This CASA White Paper, The Economic Value of Underage Drinking and Adult Excessive Drinking to the Alcohol Industry, is based on an analysis conducted by CASA Fellows Foster, et al, published in the February 26, 2003 edition of JAMA, The Journal of the American Medical Association. It reveals that in 1999 (the last year for which necessary data are available), underage drinkers consumed 19.7 percent of the alcohol consumed in the United States, spending $22.5 billion of the $116.2 billion spent that year on beer, wine and liquor.3 This estimate is conservative for the reasons stated in this White Paper.

This exhaustive analysis also has identified the economic value to the industry in adult excessive drinking--consumption by men and women of more than two drinks a day, the maximum amount recommended for most males by the U.S. Departments of Agriculture and Health and Human Services.4 This White Paper finds that adult drinking in excess of this standard for men accounted for 30.4 percent of the alcohol consumed in the United States, $34.4 billion of the $116.2 billion spent that year on beer, wine and liquor.∗ Thus, eliminating underage drinking and adult excessive drinking would reduce the amount spent on alcohol by almost half--$56.9 billion. With such enormous amounts attributable to underage drinking and adult excessive drinking, the alcohol industry shares with the tobacco industry an economic interest in selling to minors and heavy users. To counter this interest, former U.S. Surgeons General Julius Richmond (President Carter), Antonia Novello (President George H.W. Bush) and David Satcher (President Clinton, President George W. Bush) and former First Lady Betty Ford have joined CASA in a nationwide call for action by the alcohol industry, parents and the public health community. (See Statements following.) Parents are the most important influence on their children and must do all in their power to encourage them to stay alcohol free. This is not an easy task, for while the public health message for cigarettes and illegal drugs is No for all children and all adults, with respect to alcohol the message is No for children and moderation for most adults. The economic interests uncovered in this White Paper also signal the need for government action at the federal, state and local levels: e.g.,
aggressive public health campaigns like those being conducted to deal with smoking and illegal drug use; increased taxes; tougher penalties on those who help minors obtain beer, wine and liquor and those who sell to them; clear labeling of the dangers of underage and excessive drinking and the nutritional profile of alcoholic beverages; and an end to advertising and marketing alcoholic beverages to children and underage drinkers.
∗ The minor variation between the percent of alcohol that underage drinkers and adult excessive drinkers consume (50.1 percent) and the amount spent on such drinking (49.0 percent) is attributable to the type of alcohol consumed (beer, wine or distilled spirits).
The message for the industry is clear: Its significant revenues from underage drinkers and adult excessive drinkers create an insurmountable conflict of interest with respect to curbing consumption of alcohol by such drinkers. If the beer, wine and liquor companies wish to deal with this public health epidemic, they should endow a completely independent foundation to aggressively work to curb underage and adult excessive drinking. The foundation should not be directed or advised or in any way influenced by the industry. The recent evaluation finding that American Legacy television ads discouraged children from smoking while the Phillip Morris Company’s “anti-smoking” ads were ineffective and appear to encourage children to smoke demonstrates the importance of such independence.5 Former First Lady Betty Ford joins me in calling on the alcohol industry to provide $1 billion to endow such a foundation. Action is urgent. The decline in alcohol consumption among minors over the past 20 years appears to have prompted campaigns, such as the increase in marketing “malternatives” and gelatin shots (Zippers), both appealing to children, and the efforts of the liquor industry to mount major advertising campaigns on television. We hope the alcohol industry will cooperate with the public health community to curb underage drinking and adult excessive drinking. Such cooperation is far preferable to the confrontational approach taken by the tobacco industry that has resulted in such a loss of its credibility and respect. Cooperating with the public health community offers a way for the alcohol industry to deal with its inherent conflict
-ii-

of interest between its interests in selling products and making profits and the public health interest in curbing underage drinking and adult excessive drinking. CASA staff responsible for this White Paper are Susan E. Foster, MSW, CASA Vice President and Director of Policy Research and Analysis and Roger Vaughan, DrPH, Head of CASA’s Substance Abuse and Data Analysis Center (SADACSM), Associate Professor of Clinical Public Health, Departments of Biostatistics, and Population and Family Health, Mailman School of Public Health at Columbia University and consulting editor for statistics and evaluation for the American Journal of Public Health. William Foster, PhD, CASA Senior Vice President and Chief Operating Officer, assisted and I edited the document. We have checked our analyses with a number of experts and are especially grateful for the advice and recommendations of Drew Altman, PhD, President, The Henry J. Kaiser Family Foundation; Peter Bearman, PhD, Professor and Chair, Department of Sociology and Director, Institute for Social and Economic Research and Policy at Columbia University; Joe Gfroerer, Substance Abuse and Mental Health Services Administration, Office of Applied Studies; Jo Anne Grunbaum, EdD, Team Leader, Surveillance Research Team, Division of Adolescent and School Health, Centers for Disease Control and Prevention; Tim Johnson, PhD, Director, Survey Research Laboratory, University of Illinois at Chicago; Alan Leshner, PhD, Chief Executive Officer of the American Association for the Advancement of Science and former Director of the National Institute on Drug Abuse; and Roger Tourangeau, PhD, Research Professor and Chair, Joint Program in Survey Methodology, the University of Maryland. However, as is always the case, CASA alone is responsible for the facts and conclusions herein.
-iii-

Statement of
Julius B. Richmond, MD – U.S. Surgeon General 1977-1981 Antonia C. Novello, MD, MPH, DrPH – U.S. Surgeon General 1990-1993
David Satcher, MD, PhD – U.S. Surgeon General 1998-2002
The article, “Alcohol Consumption and Expenditures for Underage Drinking and Adult Excessive Drinking” by Foster et al in the February 26 edition of JAMA, the Journal of the American Medical Association, reveals that underage drinking amounts to 19.7 percent of the alcohol consumed in the United States and that adult excessive drinking--the amount consumed by adults above the maximum of two drinks a day for men established by the U.S. Departments of Health and Human Services and Agriculture and the National Institute on Alcoholism and Alcohol Abuse--equals 30.4 percent of such consumption. The article estimates that eliminating underage drinking and adult excessive drinking would reduce alcohol consumption by 50.1 percent and in 1999 that would have decreased consumer expenditures for alcohol from $116.2 billion to $59.3 billion. The findings in this study call for action by parents, the public health community and the alcohol industry. Parents have the greatest influence on their children. We urge parents to use their influence to encourage their children to stay alcohol free. The public health community--governments and public health officials, physicians and other health care providers, and educators--should mount aggressive education campaigns, like those being conducted to deal with smoking and illicit drug use, to prevent underage drinking, to warn the public of the dangers of underage and adult excessive drinking and to encourage families and communities to take actions to curb such drinking. We urge the alcohol industry to partner with the public health community to curb underage drinking and adult excessive drinking. Such a partnership is far preferable to the confrontational approach taken by the tobacco industry that has resulted in such a loss of its credibility and respect. A partnership with the public health community offers a way for the alcohol industry to deal with its inherent conflict of interest between its legal obligation to sell products and make money and the public health interest in curbing underage drinking and adult excessive drinking. We call on the alcohol industry to:
1. Include in its advertising and product labels clear warnings of the dangers of underage drinking and adult excessive drinking and the definition of moderate drinking as defined by Nutritional Guidelines of the U.S. Departments of Health and Human Services and Agriculture--no more than one drink a day for women and two drinks a day for men;
2. Include in its product labels the nutritional health profile of the contents, including caloric
content; and
3. Endow an independent foundation with no ties to the alcohol industry to work exclusively to curb underage drinking and adult excessive drinking.

Statement of
Betty Ford, Chairman, The Betty Ford Center and
Joseph A. Califano, Jr., President and Chairman, The National Center on Addiction and Substance Abuse at Columbia University
The article, Alcohol Consumption and Expenditures for Underage Drinking and Adult Excessive Drinking by Foster et al in the February 26 edition of JAMA, the Journal of the American Medical Association, reveals that underage drinking and adult excessive drinking account for 50.1 percent--more than half--of the alcohol consumed in the United States and $53.6 billion in consumer expenditures for alcohol, 49 percent of the $116.2 billion market in 1999. This accurate, peer reviewed accounting of underage and excessive adult drinking reveals that we are dealing with an epidemic that threatens the health and safety of millions of children, families and adults. The alcohol industry has consistently underestimated the cost of underage and excessive drinking in the U.S. and this JAMA study gives the American people the facts for the first time. These findings also demonstrate that the alcohol industry has an inherent conflict of interest between public health and industry profits. We urge the alcohol industry to cooperate with the public health community to curb underage drinking and adult excessive drinking by immediately providing a $1 billion endowment for an independent foundation with no ties to the industry to work exclusively to curb underage drinking and adult excessive drinking. This foundation should be completely free of any ties to the beer, wine and hard liquor industries, and not be a non-profit arm of the industry like the Century Council. A $1 billion endowment represents less than two percent of consumer expenditures in 1999 for underage and adult excessive drinking and less than one percent of all 1999 expenditures on alcohol.

®
The Economic Value of Underage Drinking and Adult Excessive Drinking to the Alcohol Industry
CASA's analysis of the most recently available relevant data (1999) reveals that underage drinkers drink 19.7 percent of the alcohol consumed in the United States, accounting for $22.5 billion (19.4 percent) of the total $116.2 billion in consumer expenditures for alcohol. CASA's analysis also reveals that adult excessive drinking--consumption of more than the two drinks a day maximum level recommended for most men by the U.S. Departments of Agriculture (USDA) and Health and Human Services (DHHS)--accounts for 30.4 percent of the alcohol consumed in the United States, $34.4 billion (29.6 percent) in consumer expenditures for alcohol. Thus, eliminating underage drinking and reducing adult excessive drinking to two drinks a day would mean a reduction of 50.1 percent of the alcohol consumed in the United States and a loss of $56.9 billion (49.0 percent) in consumer expenditures for beer, wine and liquor--a catastrophic decline for the industry.6 Estimating the Proportion of the Population that Drinks Underage Drinkers To estimate the proportion of individuals under the age of 21 who drink, CASA considered the three essential national data sets for 1999 (the most recent year for which the necessary relevant data has been compiled by DHHS): • The National Household Survey on Drug
Abuse (NHSDA) administered by the Substance Abuse and Mental Health Services Administration (SAMHSA), a sample of 25,612 persons ages 12 to 20 and 27,948 persons ages 21 and over. This
survey is conducted in the home. For underage participants, a parent is present in the home but not necessarily in the room where the interview is conducted.7
• Monitoring the Future (MTF) administered
by the National Institute on Drug Abuse, a sample of 17,287 eighth graders, 13,885 tenth graders and 14,056 twelfth graders. The survey is administered in schools. When the survey is conducted, names and addresses of participants are collected on a separate sheet and identifying numbers are assigned to the name and the corresponding record so that follow-up can be made to correct the data if needed.8
• The Youth Risk Behavior Survey (YRBS)
administered by the Centers for Disease Control and Prevention (CDC), a sample of 15,349 persons ages 12 to 18 in the ninth through twelfth grades. The survey is administered in the schools. The survey is completely anonymous.9
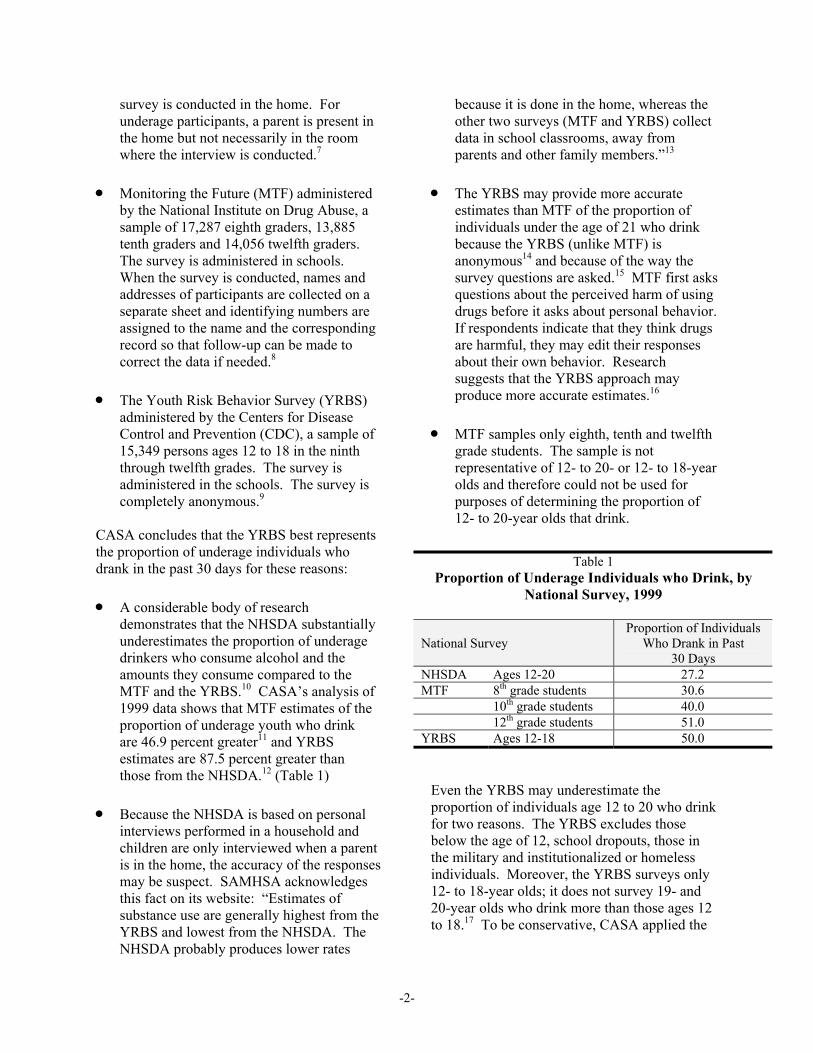
CASA concludes that the YRBS best represents the proportion of underage individuals who drank in the past 30 days for these reasons: • A considerable body of research
demonstrates that the NHSDA substantially underestimates the proportion of underage drinkers who consume alcohol and the amounts they consume compared to the MTF and the YRBS.10 CASA’s analysis of 1999 data shows that MTF estimates of the proportion of underage youth who drink are 46.9 percent greater11 and YRBS estimates are 87.5 percent greater than those from the NHSDA.12 (Table 1)
• Because the NHSDA is based on personal
interviews performed in a household and children are only interviewed when a parent is in the home, the accuracy of the responses may be suspect. SAMHSA acknowledges this fact on its website: “Estimates of substance use are generally highest from the YRBS and lowest from the NHSDA. The NHSDA probably produces lower rates
because it is done in the home, whereas the other two surveys (MTF and YRBS) collect data in school classrooms, away from parents and other family members.”13
• The YRBS may provide more accurate
estimates than MTF of the proportion of individuals under the age of 21 who drink because the YRBS (unlike MTF) is anonymous14 and because of the way the survey questions are asked.15 MTF first asks questions about the perceived harm of using drugs before it asks about personal behavior. If respondents indicate that they think drugs are harmful, they may edit their responses about their own behavior. Research suggests that the YRBS approach may produce more accurate estimates.16
• MTF samples only eighth, tenth and twelfth
grade students. The sample is not representative of 12- to 20- or 12- to 18-year olds and therefore could not be used for purposes of determining the proportion of 12- to 20-year olds that drink.
Table 1 Proportion of Underage Individuals who Drink, by
National Survey, 1999
National Survey
Proportion of Individuals Who Drank in Past
30 Days NHSDA Ages 12-20 27.2 MTF 8th grade students 30.6 10th grade students 40.0 12th grade students 51.0 YRBS Ages 12-18 50.0
Even the YRBS may underestimate the proportion of individuals age 12 to 20 who drink for two reasons. The YRBS excludes those below the age of 12, school dropouts, those in the military and institutionalized or homeless individuals. Moreover, the YRBS surveys only 12- to 18-year olds; it does not survey 19- and 20-year olds who drink more than those ages 12 to 18.17 To be conservative, CASA applied the
-2-

proportion of 12- to 18-year olds who drink (50 percent) to the 19- and 20-year olds as well. All of these surveys may underestimate alcohol use among those under age 21 since they are based on self-reports of alcohol use. In self-report surveys, young people typically underreport their substance use.18
Adult Drinkers To determine the proportion of adults ages 21 and over who drank alcohol in the past month, CASA examined two data sets:
• The NHSDA, described above; and
• The Behavioral Risk Factor Surveillance
Survey (BRFSS) administered by the Centers for Disease Control and Prevention. The BRFSS is a telephone survey administered annually and includes a sample of 159,989 persons ages 18 and over, including 148,283 age 21and over.19
The proportions of adults that both surveys identify as drinkers are similar: 49.6 percent for NHSDA and 52.8 percent for BRFSS. This suggests that the results are reasonably reliable, even though they may underestimate the proportion of adults who drink because they exclude individuals in the military, those institutionalized and the homeless. The similarity in results also indicates that the NHSDA does not suffer to the same extent from underreporting bias for adults as it does for underage drinkers.20 (Table 2)
CASA used the BRFSS data to determine the proportion of adults who drink because it
provides a method of calculating the proportion of those ages 21 and over who drink that parallels the YRBS survey data used to calculate the proportion of those ages 12 to 20 who drink.21 It should be noted that selecting the BRFSS where a higher proportion of adults drink will result in a more conservative estimate of the percent of alcohol consumed by underage drinkers: as the percent and number of the adult drinkers increases, the adult share of alcohol consumed also increases. Estimating the Amount of Alcohol Consumed Underage Drinkers The NHSDA asks these questions to determine the amount of alcohol consumed by underage drinkers: --“Think specifically about the past 30 days-that is, since [FILL DATE], up to and including today. During the past 30 days, on how many days did you drink one or more drinks of an alcoholic beverage?” --“On the days when you drank during the past 30 days, how many drinks did you usually have? Count as a drink a can or bottle of beer; a wine cooler or a glass of wine, champagne or sherry; a shot of liquor or mixed drink or cocktail.” The YRBS does not ask comparable questions from which CASA could compute the amount of alcohol consumption. The YRBS questions related to amount are: --“During the past 30 days, on how many days did you have at least one drink of alcohol? A. 0 days, B. 1 or 2 days, C. 3 to 5 days, D. 6 to 9 days, E. 10 to 19 days, F. 20 to 29 days, or G. All 30 days.” --“During the past 30 days, on how many days did you have 5 or more drinks of alcohol in a row, that is, within a couple of hours? A. 0 days, B. 1 day, C. 2 days, D. 3 to 5 days, E. 6 to 9 days, F. 10 to 19 days, or G. 20 or more days.”
Table 2 Proportion of Individuals Ages 21 and
Over who Drink, by National Survey, 1999
National Survey
Proportion Ages 21 and Over Who Drank in Past 30 Days
NHSDA 49.6 BRFSS 52.8
-3-

Therefore, CASA used the NHSDA to calculate the amount of alcohol that underage drinkers consume. Adult Drinkers The questions that NHSDA asks adults to determine the amount of alcohol consumed are identical to those it asks underage drinkers. The BRFSS asks a comparable question related to the quantity of alcohol consumed: “A drink is 1 can or bottle of beer, 1 glass of wine, 1 can or bottle of wine cooler, 1 cocktail, or 1 shot of liquor. On the days when you drank, about how many drinks did you drink on average?” The BRFSS does not, however, ask a comparable question related to the frequency of consumption: “During the past month, how many days per week or per month did you drink any alcoholic beverages, on the average?” The BRFSS records the response as days per week or days per month. When frequency is reported in weeks, an estimate must then be made of the number of days per month in which drinking occurred by multiplying by 4.333. Therefore CASA used the NHSDA to calculate the amount of alcohol that adult drinkers consume. Calculating the Amount Consumed Using responses to the NHSDA questions about the quantity and frequency of alcohol consumption, CASA multiplied for each individual in the sample the number of days on which that individual drank by the number of drinks that individual usually consumed in order to determine the average number of drinks consumed in the past month for each individual age 12 to 20 and each age 21 and over.22 The average number of drinks per month for each individual in each group were summed and divided by the number of individuals in that group to get the average number of drinks consumed in the past month for each group--46.4 drinks per month for underage drinkers and 32.5 drinks per month for adult drinkers.
Calculating the Share of Alcohol Consumed by Underage and Adult Drinkers From the U.S. Census 2000, CASA obtained the number of individuals ages 12 to 20 (35.8 million or 12.7 percent of the population) and the number ages 21 and over (196.9 million or 70.0 percent of the population).23 To calculate the share of alcohol consumed monthly by underage and adult drinkers, CASA multiplied the number of individuals in each group: • by the proportion in each group that drank
(50.0 percent for underage drinkers and 52.8 for adult drinkers), and then
• by the average number of drinks consumed
in the past month by those in each group (46.4 drinks per month for underage drinkers and 32.5 drinks per month for adult drinkers).24
Individuals ages 12 to 20 consumed 19.7 percent25 (830.6 million drinks per month) of all the alcohol consumed in the U.S.; those ages 21 and over drank 80.3 percent (3,376.5 million drinks per month). Estimating the Economic Impact of Underage Drinking To estimate consumer expenditures linked to underage drinking, CASA examined: • Alcohol industry data on consumption and
expenditures for alcohol by type of beverage.26
• Research documenting the types and
proportions of beverages consumed by underage and heavier adult drinkers. Research on underage drinking patterns reveals that underage drinkers consume all beverage types (beer, distilled spirits and wine), but CASA could find no data that
-4-

documents the amounts of each type they consume.27 CASA’s analysis of underage drinking shows that underage drinkers are more likely to binge drink than average adult drinkers.* 28 Their drinking patterns may therefore more resemble the drinking patterns of adult binge drinkers. For adult drinkers who have consumed five or more drinks in a day in the past year, 80 percent of the alcohol they consume is beer, 16 percent is distilled spirits and four percent is wine.29
Using the proportions of 80 percent for beer, 16 percent for distilled spirits and four percent for wine, CASA estimated the proportion of alcohol consumed by underage drinkers (19.7 percent)
by beverage type.30 This analysis reveals that underage drinkers accounted for $22.5 billion (19.4 percent) of the $116.2 billion in consumer expenditures for alcohol in 1999.31 Estimating the Economic Impact of Adult Excessive Drinking In the course of its analysis, CASA identified the economic value of adult excessive drinking; that is, drinking in excess of the maximum amount recommended by the USDA and DHHS of no more than two drinks a day for most men.32 These standards are based on dietary guidelines acknowledging the links between excessive drinking, particularly chronic excessive drinking, and serious health problems. These guidelines caution: “[t]aking more than one drink per day for women and two drinks per day for men can raise the risk for motor vehicle crashes, other injuries, high blood pressure, stroke, violence, suicide, and certain types of cancer.”33 A recent report by the American Medical Association clearly outlines the physical damage to the brain that can result from underage drinking.34 Heavy alcohol use is the most important risk factor for liver disease in the United States.35 As much as half of violent crime, including murder, rape, assault, child
molestation and spouse abuse, is connected with concurrent alcohol abuse.36 An estimated 89 percent of substance-abusing parents who abuse or neglect their children abuse alcohol alone or in combination with an illegal drug.37 Even one drink per day can slightly raise the risk of breast cancer,38 result in birth defects39 and impair one’s ability to drive.40 Although moderate drinking may not raise an individual’s blood alcohol content (BAC) over the legal limit for driving (.08 percent for adults), even moderate drinking increases the risk of being involved in a fatal crash.41
* Five or more drinks on any one drinking occasion.
Adult excessive drinkers account for 9.1 percent of drinkers but 46.3 percent of the total alcohol consumed. The amount of their drinking that is over the two drinks a day standard is 30.4 percent of the total alcohol consumed. To estimate consumer expenditures linked to adult excessive drinking, CASA examined: • The same alcohol industry data on
consumption and expenditures for alcohol by type of beverage used for the analysis of underage consumption.42
• Research documenting the types and
proportions of beverages consumed by excessive and the heaviest adult drinkers. Rogers and Greenfield found that among drinkers ages 18 and over, beer accounts for 67 percent of consumption, distilled spirits for 20 percent and wine for 13 percent. As discussed earlier, they also found that of adult drinkers who have consumed five or more drinks in a day in the past year, 80 percent of the alcohol they consume is beer, 16 percent is distilled spirits and four percent is wine.43
CASA estimated by beverage type (using the above percentages) the proportion of alcohol consumed by two groups of adult drinkers: the heaviest drinkers--the top 2.5 percent of drinkers--and adult excessive drinkers who consume less than these heaviest drinkers. • CASA selected the category of the top 2.5
percent of drinkers to conform with work
-5-

done by the Alcohol Research Group (ARG) which found that these heaviest adult drinkers drink 27 percent of all the alcohol consumed in the U.S.44 CASA’s independent analysis replicated the ARG results, also finding that the top 2.5 percent of adult drinkers drink 27 percent of the alcohol. These heaviest drinkers (who consume on average 12.7 drinks per day) account for $30.9 billion (26.6 percent) of the total $116.2 billion in consumer expenditures for alcohol.45
•
The remainder of the adult excessive drinkers consume 19.3 percent of the alcohol.46 These excessive drinkers (who consume on average 3.3 drinks per day) account for $22.7 billion (19.5 percent) of the total $116.2 billion in consumer expenditures for alcohol.47
If all adult excessive drinkers were converted to the maximum drinking level for moderate drinkers (two drinks a day), rather than spending $53.6 billion for alcohol, they would spend $19.2 billion, a loss of $34.4 billion (29.6 percent) in consumer expenditures for alcohol.48 In comparison, adults who drink two drinks a day or less--moderate drinkers--constitute 76.3 percent of drinkers but account for only 34.0 percent of total alcohol consumed and $40.1 billion (34.5 percent) of the total consumer expenditures for alcohol. (Table 3)
The Link Between Underage Drinking and Adult Excessive Drinking To investigate the link between underage drinking and adult excessive drinking, including alcohol abuse and addiction, CASA looked at a variety of indicators: • Those who begin drinking before the age of
21 are more than twice as likely to develop alcohol-related problems, such as being unable to stop or cut down on drinking or spending a great deal of time getting or drinking alcohol or getting over its effects, compared to those who began drinking at age 21 or older (15.7 percent vs. 5.9 percent).49
• Individuals who begin drinking before age
15 are four times likelier to become alcohol dependent than those who do not drink before age 21.50
• The incidence of lifetime alcohol abuse and
dependence is greatest for those who begin drinking between the ages of 11 and 14.51
• The average age of initiation of alcohol use
among 12- to 20-year olds is now 14.52 The economic reality of the alcohol industry is that it must maintain or increase consumption if it is to ensure future profits. This means that the industry must continually attract new drinkers as current drinkers quit or die. While data are not
Table 3 Impact of Legal and Moderate Drinking on Consumer Expenditures for Alcohol, 1999
Percent of Alcohol
Consumed
Estimated Current
Consumer Expenditures ($ Billions)
Estimated Consumer Expenditures if Only Legal
and Moderate Drinking ($ Billions)
Underage 19.7 $22.5 $0.0 Adult Heaviest 27.0 30.9 4.7 Other Adult Excessive 19.3 22.7 14.5 Adult Moderate 34.0 40.1 40.1 Total 100.0 $116.2 $59.3
-6-

available from which to predict the precise proportion of underage drinkers who will become adult excessive drinkers, earlier use of alcohol dramatically increases the risk that they will do so. These facts may help to explain current advertising and marketing practices of the alcohol industry. Recent analyses done by the Center for Alcohol Marketing and Youth at Georgetown University found that underage youth are exposed to 45 percent more beer ads in magazines than adults, 27 percent more hard liquor ads, and 60 percent more ads for “malternatives,” and they see more alcohol advertisements on television for alcoholic beverages than they do for jeans, sneakers or acne creams.53 New sweet tasting malt based beverages (“malternatives” or “alcopops”) are particularly appealing to underage drinkers.54
Summary This analysis of 1999 data reveals the significant financial interest of the alcohol industry in underage drinking and adult excessive drinking. If underage drinking were eliminated, if all moderate drinkers continued to drink two drinks a day or less, and if all adult excessive drinkers reduced their consumption to two drinks a day, the alcohol industry would lose 49.0 percent of its market, $56.9 billion. This economic interest in underage drinking and adult excessive drinking creates a situation for the alcohol industry similar to the economic conflict of interest of the cigarette industry. Federal, state and local governments should mount aggressive public health campaigns like those being conducted to deal with smoking and illegal drug use, increase taxes, impose tougher penalties on those who help minors obtain beer, wine and liquor and those who sell to them, and
require clear labeling of alcoholic beverages about the dangers of underage drinking and excessive adult drinking. Alcohol beverage manufacturers should be required to label their products with the nutritional health profile of the alcoholic beverages, including caloric content, and the recommended nutritional guidelines relevant to the product, and to cease advertising and marketing alcoholic beverages to youth. Parents and schools should recognize and exert their influence to help children stay alcohol free.
CASA hopes that the alcohol industry will cooperate with the public health community to curb underage drinking and adult excessive drinking. If the beer, wine and liquor companies wish to deal with this public health epidemic, they should endow a completely independent foundation to aggressively work to curb underage and adult excessive drinking. The foundation should not be directed or advised or in any way influenced by the industry. The alcohol industry should agree to clear labeling of its products of the dangers of underage drinking and of exceeding the moderate drinking standards for adults, and the nutritional profile of alcoholic beverages, including caloric content. It should immediately stop exposing those under the age of 21 to advertising and marketing of alcoholic beverages.
We do not condone illegal under-age drinking under any circumstances. This industry does not, and never has, targeted our advertising to people who can’t legally buy our products.55
--Jeff Becker, President Beer Institute
No one is policing what the industry is doing, and the industry is in denial.56
--David A. Kessler, MD Dean of Yale University, School of Medicine
-7-

-8-

Notes
1 The National Center on Addiction and Substance Abuse (CASA) at Columbia University. (2002). 2 Task Force of the National Advisory Council on Alcohol Abuse and Alcoholism. (2002); Wechsler, H., Kuo, M., Lee, H., & Dowdall, G. W. (2000). 3 Foster, S. E., Vaughan, R. D., Foster, W. H., & Califano, J. A. (2003). Inadvertently, the CASA report, Teen Tipplers: America's Underage Drinking Epidemic, February 2002, made an error in calculating that underage drinkers accounted for 25 percent of alcohol consumption by failing to adjust for the oversampling of 12- to 20-year olds in the National Household Survey on Drug Abuse. CASA has adopted procedures designed to avoid any such problem in the future and has worked for the past nine months to analyze the relevant data to determine as accurately as possible the value of underage drinking to the alcohol industry. Teen Tipplers has been revised to reflect the findings in this White Paper. Thomas K. Greenfield, PhD, Senior Scientist and Center Director of the Alcohol Research Group was acknowledged in Teen Tipplers for his consultation on CASA’s economic analysis of the financial interest of the alcohol industry. His consultation was not related to this error. 4 These standards are based on guidelines promulgated jointly by the U.S. Department of Agriculture and the U.S. Department of Health and Human Services (2000) which define moderate drinking as no more than one drink a day for most women and no more than two drinks a day for most men. National Institute on Alcohol Abuse and Alcoholism (2000) also recommended no more than one drink per day for persons over the age of 65. CASA used the two drink standard for all adults as a more conservative measure for its calculation of adult excessive drinking. 5 Farrelly, M. C., Healton, C. G., Davis, K. C., Messeri, P., Hersey, J. C., & Haviland, M. L. (2002). 6 The analysis described in this paper was published in Foster, S. E., Vaughan, R. D., Foster, W. H., & Califano, J. A. (2003). 7 Office of Applied Studies (2000). 8 Johnston, L. D., O’Malley, P. M., & Bachman, J. G. (2000). 9 National Center for Chronic Disease Prevention and Health Promotion. (2000b). 10 In several recent independent studies, researchers found that the NHSDA reported the lowest prevalence rates of other national surveys examined (MTF and YRBS). Cowan, C. D. (2001); Fendrich, M., & Johnson, T. P. (2001); Fowler, F. J., & Stringfellow, V. L. (2001); Harrison, L. D. (2001); Gfroerer, J., Wright, D., & Kopstein, A. (1997). For example, Fendrich, M. & Johnson, T. P. (2001) found that compared to 1997 estimates of past 30 day drinking among twelfth graders derived from the NHSDA, MTF estimates were 40 percent greater and YRBS estimates were 90 percent greater. 11 MTF only includes students in grades 8, 10 and 12. Adjusting the MTF percentages for the actual sample sizes of 8th, 10th and 12th graders results in an estimate that is 46.9 percent higher than the NHSDA estimate. 12 Even MTF and YRBS may underrepresent consumption. Fendrich, M., & Johnson, T. P. (2001) point out that response rates are likely depressed on both of these surveys, which are school based, because of the parental permission requirements. When seeking parental permission for students to participate in its survey, the YRBS provides detailed examples of questions to be asked and requires the student to agree to participate; MTF refers generally to categories of questions and administers the survey in the classroom without obtaining student assent. 13 Office of Applied Studies. (2000). 14 One reason why MTF’s estimates are slightly lower than YRBS’s may be that MTF is not anonymous. Fowler, F. J., & Stringfellow, V. L. (2001) point out that the anonymity of the MTF is eliminated by the questionnaire’s retention of serial numbers that can be used by investigators to identify individuals for additional contact. The 1999 MTF retains serial numbers in order to provide participants with a summary of nationwide results and to send a follow-up questionnaire to some students after a year. 15 Harrison, L. D., (2001); Fowler, F. J., & Stringfellow, V. L. (2001); Schuman, H., & Presser. S. (1981). 16 Harrison, L. D. (2001) points out that MTF respondents are exposed to attitudinal questions about the risk of harm of using drugs prior to items about personal substance use. This placement of items "creates an internal conflict" where respondents may indicate that these drugs are harmful and so edit their responses on the later behavioral questions about substance use to be consistent with their belief about harm. 17 The YRBS finds that 50 percent of 12- to 18-year olds drank in the past month. The Behavioral Risk Factor Surveillance Survey (BRFSS) (National Center for Chronic Disease Prevention and Health Promotion. [2000a]), also conducted by Centers for Disease Control and Prevention and which covers those 18 and older, finds that 51.4 percent of 19-year olds and 59.7 percent of 20-year olds drank in the past month. 18 Embree, B. G., & Whitehead, P. C. (1993); Cowan, C. D. (2001); Fendrich, M., & Johnson, T. P. (2001); Fowler, F. J., & Stringfellow, V. L. (2001); Harrison, L. D. (2001). 19 National Center for Chronic Disease Prevention and Health Promotion. (2000a).
-9-

20 Fowler, F. J., & Stringfellow, V. L. (2001); Harrison, L. D. (2001); Schuman, H., & Presser, S. (1981). Because adult drinking is not an illegal act, as is underage drinking, the degree of anonymity and perceived pressure to respond in a “socially desirable” way do not impact respondents age 21 and over the way they do underage respondents. 21 Both the YRBS and BRFSS are CDC data sets that provide estimates of the proportion that drinks. 22 If an individual reported drinking two days in the past month but did not indicate the quantity consumed, the reported amount was two drinks per month. Alternatively, if the individual reported drinking an average of five drinks per day on the days he/she drank but did not indicate the frequency of consumption, the reported amount was five drinks per month. The NHSDA indicated that the variable (i.e., iralcfm) holding the imputed measure of the number of days alcohol was consumed in the past 30 days might be a better measure of the truth. CASA found that the use of this imputed variable in the calculations increased the computed amount of drinking among underaged drinkers to 47.77 per month, and among adult drinkers to 33.0 per month. These higher amounts translated into underaged drinkers accounting for 19.9 percent of alcohol consumed. CASA chose to report the results obtained using the actual rather than imputed values. 23 U.S. Department of Commerce, & U.S. Census Bureau. (2000). 24 CASA’s analysis found that underage drinkers consume on average 1.5 drinks a day, and adults consume on average one drink a day. CASA’s analysis also found variation within underage drinking age categories; among drinkers, those 12 to 14 consume on average .91 drinks a day, those 15-17 consume on average 1.4 drinks a day, and those 18-20 consume on average 1.7 drinks a day. It is important to note that underage drinkers do not follow the same drinking pattern as adults. As found by Wechsler, H., Kuo, M., Lee, H., & Dowdall, G. W. (2000) teens drink less frequently than adults, but are more inclined to drink larger amounts at any one time. 25 Underage drinkers constitute 14.7 percent of drinkers. If the NHSDA had been used to calculate the proportion of adults who drink, the resulting share of alcohol consumed by underage drinkers would be 20.8; the share consumed by adult drinkers would be 79.2. If the NHSDA had been used to calculate the proportion of both adults and underage individuals who drink, the resulting share of alcohol consumed by underage drinkers would be 11.4 percent; the share consumed by adult drinkers would be 88.6 percent. 26 Total amount of beer consumed in 1999 was 65,453 million drinks; of distilled spirits, 29,269 million drinks; and of wine, 13,713 million drinks. Of total consumer expenditures for alcohol in 1999, 55 percent is attributable to beer, 31 percent to distilled spirits and 14 percent to wine. To determine the average cost per drink of each type of beverage in 1999 ($.98 for beer, $1.22 for distilled spirits and $1.21 for wine), CASA calculated the total drinks of alcoholic beverages by type by converting gallons or liters of beverage consumed by type to ounces of beverage consumed by type and dividing by the average number of ounces in each type of beverage--12 ounces per beer, 5 ounces per wine and 1.5 ounces per distilled spirits drink. Calculated from data from Adams Business Research (2001a, b, and c). Average number of ounces by type of drink from and U.S. Department of Agriculture, & U.S. Department of Health and Human Services (2000). 27 A survey done by the Parents’ Resource Institute for Drug Education (2001) of students in grades six through 12 (2000-2001) found that 19.5 percent reported monthly use of beer; 17.4 percent, distilled spirits; and 15.0 percent, wine. Unpublished tables from the Monitoring the Future Study cited in a report by the Federal Trade Commission (1999) show that when young people first start drinking they primarily consume beer and wine coolers; by 12th grade, students use all types of alcohol although beer use is most common, followed by distilled spirits, wine coolers and wine. The PRIDE survey found that 40 percent of 12th graders report monthly use of beer, 37 percent report monthly use of distilled spirits, and 25.3 percent report monthly use of wine coolers. 28 CASA’s analysis of data from the 1999 National Household Survey on Drug Abuse (Office of Applied Studies [2000]) reveals that underage drinkers drink on average just under six (5.92) days per month but consume on average more than five (5.85) drinks on each drinking day, whereas adults drink on average over eight (8.33) days per month and consume on average over three (3.33) drinks on each drinking day. CASA’s analysis also found variation within underage drinking age categories; among drinkers, those 12 to 14 drink on average 4.1 days a month and consume an average 3.9 drinks on each drinking day, those 15-17 drink on average 5.9 days a month and consume an average 4.7 drinks on each drinking day, and those 18-20 drink on average 6 days a month and consume on average 6.7 drinks on each drinking day. NOTE: multiplying these averages will not result in the average number of drinks consumed in a month by underage drinkers reported above since CASA calculated that average on the basis of each individual in the sample. 29 Rogers, J. D., & Greenfield, T. K. (1999) examined the drinking patterns of hazardous (occasions in which five or more drinks were consumed in a day) drinking among individuals age 18 and over.
-10-

30 This analysis finds that 15.8 percent of the total alcohol consumed is linked to underage consumption of beer; 3.1 percent, distilled spirits; and .8 percent, wine. 31 CASA multiplied the percent of alcohol consumed by underage drinkers for each beverage type times the total number of drinks consumed times the average price for that beverage. Calculating weighted averages by type of alcohol consumed for each category of drinkers (underage, adult heaviest, other adult excessive, adult moderate) yields total expenditures of $112.9 billion because a higher percentage of less expensive beverages are consumed. To account for the remaining $3.3 billion in consumer expenditures for alcohol, CASA distributed it among drinking groups according to the proportion each consumed. This analysis revealed that underage drinkers consume $17.2 billion in beer, $4.3 billion in distilled spirits and $1.0 billion in wine. Using total drinks from CASA’s analysis (4207.1 million/ month times 12 equals 50.5 billion drinks) would only account for about half of the total number of drinks derived from alcohol industry data (108.4 billion drinks). Adams Business Research. (2001a, b, and c). The difference between these two estimates underscores the problem of underreporting already discussed. 32 U.S. Department of Agriculture, & U.S. Department of Health and Human Services. (2000). The recommended standard for women and people age 65 and older is one drink per day, but CASA used the two drink standard for all adults as a more conservative measure for its calculation of adult excessive drinking. National Institute on Alcohol Abuse and Alcoholism. (2000); Dufour, M. C. (1999). 33 U.S. Department of Agriculture, & U.S. Department of Health and Human Services. (2000). 34 American Medical Association. (2002). 35 Centers for Disease Control and Prevention. (1993). 36 The National Center on Addiction and Substance Abuse (CASA) at Columbia University. (1998). 37 The National Center on Addiction and Substance Abuse (CASA) at Columbia University. (1999). 38 U.S. Department of Agriculture, & U.S. Department of Health and Human Services. (2000). 39 Jacobson, J., & Jacobson, S. (1999). 40 Hingson, R. W., Heeren, T., & Winter, M. R. (1999); Zador, P. L. (1991); Zador, P. L., Krawchuk, S. A., & Voas, R. B. (2000). 41 Hingson, R. W., Heeren, T., & Winter, M. R. (1999); Zador, P. L. (1991) found that compared with drivers who have not consumed alcohol, drivers with BAC’s between 0.02 and 0.04 are 1.4 times likelier to be involved in a single vehicle fatal crash. This risk increases to an estimated 11.1 times higher for drivers with BAC’s between 0.05 and 0.09, percent; 48 times higher for drivers with BAC’s between .10 and .14 percent , and 380 times higher for drivers with BAC’s at or above 0.15 percent. 42 See endnote 22. 43 Rogers, J. D. & Greenfield, T. K. (1999). Endnote 21 identifies the overall number of drinks consumed by type of beverage using alcohol industry data. Because CASA wanted to be sensitive to the differential drinking patterns across age groups and drinking amount categories, we used Rogers and Greenfield's estimates of consumption for underage drinkers and for the top 2.5 percent of adult drinkers. To maintain a consistent estimation source, CASA chose to use Rogers and Greenfield's estimates of consumption by beverage type for all drinkers in calculating the value of alcohol consumed by moderate and other adult excessive drinkers. We believe that these estimates of consumption across drinking type provides a better estimate of actual drinking patterns than would the assumption of a constant drinking pattern across age and drinking group. It should be noted that using the constant estimate derived from the alcohol industry would have resulted in a higher estimate of the economic impact on the industry of eliminating adult excessive drinking. 44 Greenfield, T. K., & Rogers, J. D. (1999). Greenfield’s analysis examined individuals age 18 and over, while CASA’s analysis examined adults age 21 and over. 45 For each beverage type, CASA multiplied the percent of alcohol consumed by the top 2.5 percent of drinkers times the total number of drinks consumed times the average price for that beverage. These drinkers account for 21.6 percent of the beer consumed, 4.3 percent of the distilled spirits and 1.1 percent of the wine and for $23.6 billion in consumer expenditures for beer, $5.9 billion for distilled spirits and $1.4 billion for wine. 46 This group equals 6.6 percent of drinkers. 47 For each beverage type, CASA multiplied the percent of alcohol consumed by adult excessive drinkers (excluding the heaviest drinkers) times the total number of drinks consumed times the average price for that beverage. These drinkers account for 12.9 percent of the beer consumed, 3.9 percent of the distilled spirits and 2.5 percent of the wine and for $14.1 billion in consumer expenditures for beer, $5.2 billion for distilled spirits and $3.4 billion for wine. 48 The heaviest adult drinkers would consume 84.0 percent fewer drinks per month than they currently consume; other adult excessive drinkers would consume 40.0 percent fewer drinks for a total of 65.8 percent fewer drinks.
-11-
49 Based on CASA’s analysis of 1999 NHSDA weighted data. The question in the survey is: In the past 12 months, indicate: (1) If you wanted or tried to stop or cut down on your use of alcohol but found that you couldn't. (2) Whether you had built up a tolerance for alcohol so that the same amount had less effect than before. (3) Whether you had a period of a month or more when you spent a great deal of time getting or using alcohol, or getting over its effects. (4) Whether you have used alcohol much more often or in larger amounts than you intended. (5) Whether your use of alcohol often kept you from working, going to school, taking care of children, or engaging in recreational activities. (6) Whether your use of alcohol caused you to have any emotional or psychological problems-such as feeling uninterested in things, feeling depressed, feeling suspicious of people, feeling paranoid, or having strange ideas. (7) Whether your use of alcohol caused you any health problems. A "yes" to any of the seven would mean that you "had a problem.” A table was constructed comparing having an alcohol problem and age of first drink. 50 Grant, B. F., & Dawson, D. A. (1997). 51 DeWit, D. J., Adlaf, E. M., Offord, D. R., & Ogborne, A. C. (2000). 52 Office of Applied Studies. (2001). 53 Center on Alcohol Marketing and Youth. (2002a); Center on Alcohol Marketing and Youth. (2002b). 54 Center for Science in the Public Interest. (2001); Roberts, C., Blakey, V., & Tudors-Smith, C. (1999); Sutherland, I., & Willner, P. (1998). 55 Schwartz, J. (2002). 56 Schwartz, J. (2002).
-12-

Reference List
Adams Business Research. (2001a). Adams beer handbook. Norwalk, CT: Adams Business Research.
Adams Business Research. (2001b). Adams liquor handbook. Norwalk, CT: Adams Business Research.
Adams Business Research. (2001c). Adams wine handbook. Norwalk, CT: Adams Business Research.
American Medical Association. (2002). Underage drinkers at higher risk of brain damage than adults, American Medical Association report reveals [Press release]. Chicago: American Medical Association.
Center on Alcohol Marketing and Youth. (2002a). Overexposed: Youth a target of alcohol advertising in magazines. Washington, DC: Center on Alcohol Marketing and Youth.
Center on Alcohol Marketing and Youth. (2002b). Television: Alcohol’s vast adland. Washington, DC: Center on Alcohol Marketing and Youth.
Center for Science in the Public Interest. (2001). National poll shows “alcopop” drinks lure teens: Groups demand government investigate “starter suds.” [On-line]. Retrieved May 9, 2001 from the World Wide Web: http://www.cspinet.org.
Centers for Disease Control and Prevention. (1993). Deaths and hospitalizations from chronic liver disease and cirrhosis: United States, 1980-1989. Morbidity and Mortality Weekly Report, 41(52-53), 969-973.
Cowan, C. D. (2001). Coverage, sample design, and weighting in three federal surveys. Journal of Drug Issues, 31(3), 599-614.
DeWit, D. J., Adlaf, E. M., Offord, D. R., & Ogborne, A. C. (2000). Age at first alcohol use: A risk factor for the development of alcohol disorders. American Journal of Psychiatry, 157(5), 745-750.
Dufour, M. C. (1999). What is moderate drinking? Defining “drinks” and drinking levels. Alcohol Research and Health, 23(1), 5-14.
Embree, B. G., & Whitehead, P. C. (1993). Validity and reliability of self-reported drinking behavior: Dealing with the problem of response bias. Journal of Studies on Alcohol, 54(3), 334-344.
Farrelly, M. C., Healton, C. G., Davis, K. C., Messeri, P., Hersey, J. C., & Haviland, M. L. (2002). Getting to the truth: Evaluating national tobacco countermarketing campaigns. American Journal of Public Health, 92(6), 901-907.
-13-

Federal Trade Commission. (2002). Self-regulation in the alcohol industry: A review of industry
efforts to avoid promoting alcohol to underage consumers. Washington, DC: U.S. Federal Trade Commission.
Fendrich, M., & Johnson, T. P. (2001). Examining prevalence differences in three national surveys of youth: Impact of consent procedures, mode, and editing rules. Journal of Drug Issues, 31(3), 615-642.
Foster, S. E., Vaughan, R. D., Foster, W. H., & Califano, J. A. (2003). Alcohol consumption and expenditures for underage drinking and adult excessive drinking. JAMA, 289(8), 989-995.
Fowler, F. J., & Stringfellow, V. L. (2001). Learning from experience: Estimating teen use of alcohol, cigarettes, and marijuana from three survey protocols. Journal of Drug Issues, 31(3), 643-664.
Gfroerer, J., Wright, D., & Kopstein, A. (1997). Prevalence of youth substance use: The impact of methodological differences between two national surveys. Drug and Alcohol Dependence, 47(1), 19-30.
Grant, B. F., & Dawson, D. A. (1997). Age at onset of alcohol use and its associations with DSM-IV alcohol abuse and dependence: Results from the National Longitudinal Alcohol Epidemiologic Survey. Journal of Substance Abuse, 9(2), 103-110.
Greenfield, T. K., & Rogers, J. D. (1999). Who drinks most of the alcohol in the U.S.? The policy implications. Journal of Studies on Alcohol, 60(1), 78-89.
Harrison, L. D. (2001). Understanding the differences in youth drug prevalence rates produced by the MTF, NHSDA, and YRBS studies. Journal of Drug Issues, 31(3), 665-694.
Hingson, R. W., Heeren, T., & Winter, M. R. (1999). Preventing impaired driving. Alcohol Research and Health, 23(1), 31-39.
Jacobson, J., & Jacobson, S. (1999). Drinking moderately and pregnancy: Effects on child development. Alcohol Research and Health, 23(1), 25-30.
Johnston, L. D., O'Malley, P. M., & Bachman, J. G. (1998). National survey results on drug use from the Monitoring the Future Study, 1975-1997, volume 1: Secondary school students (NIH Pub. No. 98-4345). Rockville, MD: U.S. Department of Health and Human Services, Public Health Service, National Institutes of Health, National Institute on Drug Abuse.
Johnston, L. D., O’Malley, P. M., & Bachman, J. G. (2000). Monitoring the future: A continuing study of American youth: 8th-, 10th-, and 12th-grade survey. [On-line]. Retrieved January 3, 2001 from the World Wide Web: http://www.icpsr.umich.edu:8080/SAMHDA-SERIES/00035.xml.
-14-

National Center for Chronic Disease Prevention and Health Promotion. (2000a). Behavioral Risk
Factor Surveillance System 1999. [On-line]. Retrieved January 3, 2001 from the World Wide Web: http://www.cdc.gov/brfss.
National Center for Chronic Disease Prevention and Health Promotion. (2000b). Youth Risk Behavior Surveillance System 1999. [On-line]. Retrieved June 12, 2000 from the World Wide Web: http://www.cdc.gov/nccdphp/dash/yrbs.
National Institute on Alcohol Abuse and Alcoholism. (2000). Health risks and benefits of alcohol consumption. Alcohol Research and Health, 24(1), 5-11.
Office of Applied Studies. (2000). National Household Survey on Substance Abuse 1999. [On-line]. Retrieved February 21, 2001 from the World Wide Web: http://www.samhsa.gov.
Office of Applied Studies. (2001). National Household Survey on Drug Abuse, 2000 [On-line]. Retrieved January 3, 2002 from the World Wide Web: http://www.samhsa.gov/oas.
Parents’ Resource Institute for Drug Education. (2001). PRIDE questionnaire report: 2000-01 national summary, grades 6 through 12. Bowling Green, KY: Parents’ Resource Institute for Drug Education.
Roberts, C., Blakey, V., & Tudor-Smith, C. (1999). The impact of “alcopops” on regular drinking by young people in Wales. Drugs: Education, Prevention and Policy, 6(1), 7-15.
Rogers, J. D., & Greenfield, T. K. (1999). Beer drinking accounts for most of the hazardous alcohol consumption reported in the United States. Journal of Studies on Alcohol, 60(6), 732-739.
Schuman, H., & Presser, S. (1981). Questions and answers in attitude surveys. New York: Academic Press.
Schwartz, J. (2002, December 18). Alcohol ads on TV find their way to teenagers, a study finds, despite industry guidelines. New York Times, p. C6.
Sutherland, I., & Willner, P. (1998). Patterns of alcohol, cigarette and illicit drug use in English adolescents. Addiction, 93(8), 1199-1208.
Task Force of the National Advisory Council on Alcohol Abuse and Alcoholism. (2002). A call to action: Changing the culture of drinking at U.S. colleges (NIH Pub. No. 02-5010). Washington, DC: U.S. Department of Health and Human Services, National Institutes of Health, Task Force of the National Advisory Council on Alcohol Abuse and Alcoholism.
The National Center on Addiction and Substance Abuse (CASA) at Columbia University. (1998). Behind bars: Substance abuse and America’s prison population. New York: The National Center on Addiction and Substance Abuse (CASA) at Columbia University.
-15-

The National Center on Addiction and Substance Abuse (CASA) at Columbia University.
(1999). No safe haven: Children of substance-abusing parents. New York: The National Center on Addiction and Substance Abuse (CASA) at Columbia University.
The National Center on Addiction and Substance Abuse (CASA) at Columbia University. (2002). Teen tipplers: America’s underage drinking epidemic. New York: The National Center on Addiction and Substance Abuse (CASA) at Columbia University.
U.S. Department of Agriculture, & U.S. Department of Health and Human Services. (2000). Nutrition and your health: Dietary guidelines for Americans. [On-line]. Retrieved June 17, 2002 from the World Wide Web: http://www.health.gov/dietaryguidelines.
U.S. Department of Commerce, & U.S. Census Bureau. (2000). United States Census, 2000. [On-line]. Retrieved March 6, 2002 from the World Wide Web: http://www.census.gov.
Wechsler, H., Kuo, M., Lee, H., & Dowdall, G. W. (2000). Environmental correlates of underage alcohol use and related problems of college students. American Journal of Preventive Medicine, 19(1), 24-29.
Zador, P. L. (1991). Alcohol-related relative risk of fatal driver injuries in relation to driver age and sex. Journal of Studies on Alcohol, 52(4), 302-310.
Zador, P. L., Krawchuk, S. A., & Voas, R. B. (2000). Alcohol-related relative risk of driver fatalities and driver involvement in fatal crashes in relation to driver age and gender: An update using 1996 data. Journal of Studies on Alcohol, 61(3), 387-395.
-16-