the scientific method. steps of scientific method 1.observation: notice and describe events or...
TRANSCRIPT

The Scientific Method

Steps of Scientific Method
1. Observation: notice and describe events or processes
2. Make a question1. Relate to observation
2. Should lead to an experiment
3. Inference- logical interpretation based on what already know
1. Requires research
2. Leads to a hypothesis

Steps of scientific method (Cont’d)
4. Hypothesis- a prediction of what will happen based on scientific reasoning
• If (change something), then (outcome ) will result.• After a hypothesis, explain your prediction.

Review
• I notice my grades are higher this year compared to last year

Steps of the scientific method: cont’d
5. Design controlled experiment- Includes
1. Control- same conditions as rest of experiment except you don’t change up the independent variable1. Used for comparison
2. Independent Variable- Variable the scientist changes up (not dependent on anything else)1. ‘If’ part of hypothesis
3. Dependent Variable- The results of the experiment (relies on independent variable)1. ‘Then’ part of hypothesis

Things to Avoid!
• Bias- design a lab so that results are no longer objective
• Placebo effect- the subject reacts as if they have received treatment when they have really not
• Blind trials for subject/scientist- the subject/scientist does not know the
treatment receiving

Sample Size
• Small sample sizes result in bias of results!
• Fewer samples, subject with ‘odd’ results skews your results

Number of Trials
• Small number of trials causes bias
• Fewer trials, experiments with ‘odd’ results skews your results

Steps of the Scientific Method: Cont’d
6. Collect Data– Quantitative Data
• Measure the amount (this will be a number)• The solution had a pH of 7
– Qualitative Data• Description of results• Example: After performing the Benedict’s Test, the
solution turned a brown color

The Scientific Method: Cont’d
7. Analyze Data: Statistics•Mean
– Average– Add values, divide
by total # of values
5,10, 15, 10, 12, 13
Mean:
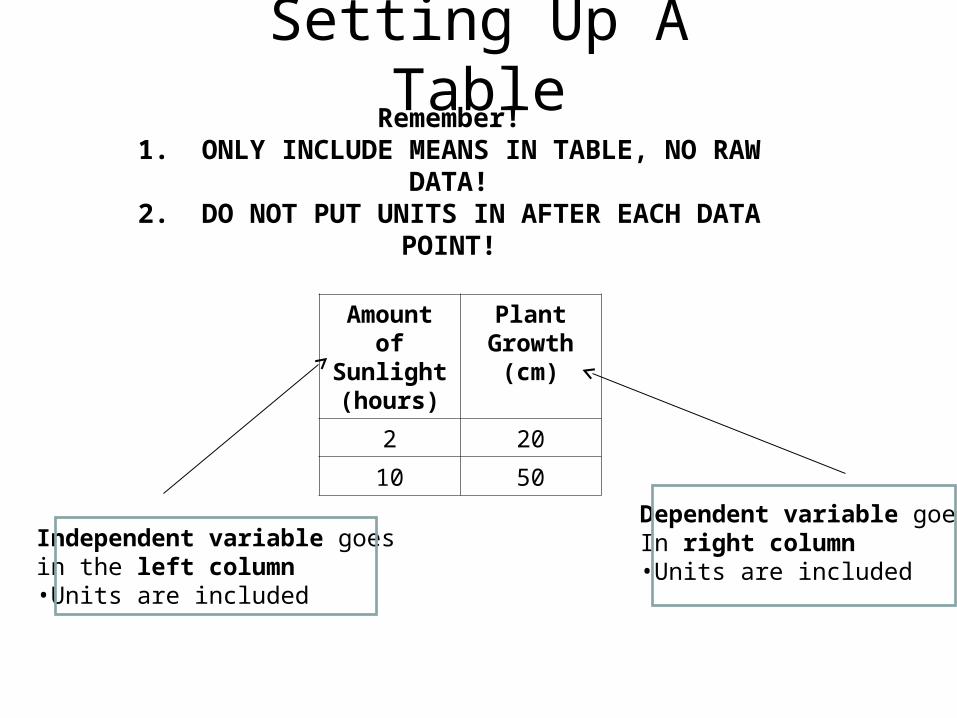
Setting Up A Table
Amount of Sunlight (hours)
Plant Growth
(cm)
2 20
10 50
Independent variable goesin the left column•Units are included
Dependent variable goesIn right column•Units are included
Remember!1. ONLY INCLUDE MEANS IN TABLE, NO RAW DATA!2. DO NOT PUT UNITS IN AFTER EACH DATA POINT!

Graphing
Bar Graph or Histogram
• Used for comparison• Data separated into
categories– Examples: red, blond,
brown hair
Line Graph
• Used to determine relationship between variables
• Data is continuous– Examples: Height, pH,
temperature

How to Make a Graph
Scale: takes up most of space
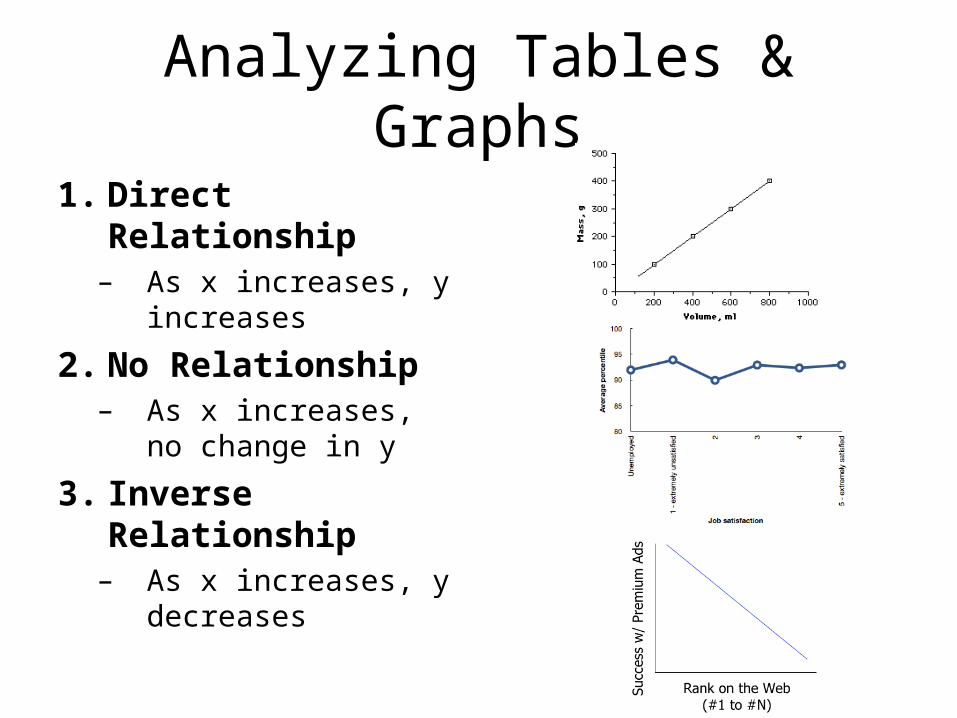
Analyzing Tables & Graphs
1. Direct Relationship– As x increases, y
increases
2. No Relationship– As x increases, no
change in y
3. Inverse Relationship
– As x increases, y decreases

Analyzing Tables and Graphs
4. Cyclical Relationship
5. Normal Distribution
Explanations
1. Make a claim- statement or explanation– This is your conclusion
2. Provide evidence to support your claim (from your results)
3. Describe factors that could be sources of error
4. Discuss future experiments that could stem from the one you just completed

Check the Validity of Your Experiment
• Repeat your experiment
• Check your experimental results with scientists who performed the same experiment as you

Theories & Laws
Theory
• Claim that is supported by many different types of experiments
• Dominant view among scientists
• NOT the absolute truth
• Examples:
Law
• Claim that is considered to be the truth
• Examples:

Communication in Science
• Spoken– Conferences– Lectures– Informal conversations
• Written– Journal articles– Peer review

Peer Review• Other scientists check your work• Questions to ask• Hypothesis
– If, then, because
• Experimental design– Sample size, bias, matches with hypothesis
• Results– Tables/graphs contain all elements, clear, & accurate– No interpretation in results
• Discussion– Claims supported by evidence– Indicates sources of error– Describes potential new experiments