the scenario analysis tool suite: a user's guidedtic.mil/dtic/tr/fulltext/u2/a500350.pdf ·...
TRANSCRIPT
Australian GovernmentDepartment of Defence
Defence Science andTechnology Organisation
The Scenario Analysis Tool Suite: A User's Guide
Cigdem Dilek
Joint Operations Division
Defence Science and Technology Organisation
DSTO-GD-0560
ABSTRACT
This document is a user guide for the software produd, the Scenario AnalysisTool Suite (version 1.5). The tool suite implements several scenario analysis techniques, Morphological analysis, Field Anomaly Relaxation analysis,Battelle approach, Bayesian approach, as well as an extended approach ofcombining methods. Thus the tool provides the opportunity to compare thesetechniques using a specific strategic question and provides computer supportfor the new combined technique.
APPROVED FOR PUBLIC RELEASE

DSTO-GD-0560
Published by
Joint Operations DivisionDSTO Defence Science and Technology OrganisationFairbairn Business Park,Department of Defence, Canberra, ACT 2600.
Telephone:Facsimile:
(02) 62659111(03) 62652741
© Commonwealth ofAustralia 2009AR No. AR 014-360January 2009
APPROVED FOR PUBLIC RELEASE
11
Contents
1 Introduction
2 Getting Started
2.1 Installation of the Scenario Analysis Tool Suite
2.2 Installation of Java Runtime Environment aRE)
3 Exploring the Morphological Analysis Tool Environment
3.1 Running MA Tool.
3.2 Navigation .
3.3 User Help .
3.4 Basic Functionality
3.4.1 New Analysis
3.4.2 Save Analysis
3.4.3 Open a Morphological Analysis .
3.4.4 Export Analysis
3.4.5 Exit Program. .
4 Exploring the Combined Approach Tool Environment
4.1 Running Combined Approach Tool
4.2 Navigation .
4.3 User Help .
4.4 Basic Functionality
4.4.1 Creating a New Combined Approach Analysis
4.4.2 Opening a Morphological Analysis . .
4.4.3 Create a New Morphological Analysis
5 Creating a Morphological Analysis
5.1 Brainstorming a Question
5.2 Sectors .
5.2.1 Creating a New Sector
5.2.2 Editing an Existing Sector
5.2.3 Attaching a Description to the Sector .
5.2.4 Selecting a Sector to be Used in the Analysis
DSTO-GD-0560
1
2
2
3
3
3
4
4
4
4
5
5
5
5
6
6
6
7
7
7
7
7
7
7
8
8
9
9
9
III

DSTO-GD-0560
5.3
5.4
5.2.5 Including all the Brainstormed Sectors in the Analysis .
5.2.6 Removing a Selected Sector from the Analysis .
5.2.7 Removing all Selected Sectors from the Analysis
5.2.8 Removing an Existing Sector Permanently.
Factors .
5.3.1 Purpose of Screen
5.3.2 Specifying a Letter Index for the Selected Sectors
5.3.3 Creating a New Factor . .
5.3.4 Editing an Existing Factor
5.3.5 Selecting a Factor to be Used in the Analysis
5.3.6 Attaching a Description to the Factor .....
5.3.7 Selecting all Brainstormed Factors to be Used in the Analysis.
5.3.8 Removing a Selected Factor from the Analysis .
5.3.9 Removing all Selected Factors from the Analysis
5.3.10 Removing an Existing Factor
Matrix of Pairs .
5.4.1 Viewing the Matrix of Pairs
5.4.2 Printing the Matrix of Pairs
9
9
10
10
10
10
10
11
11
12
12
12
12
13
13
13
13
14
6 Using Combined Approach
6.1 Initial Data Input .
6.1.1 Entering a Compatibility Rating of a Pair of Factors
6.1.2 Entering a Marginal Probability for a Factor .
6.1.3 Scenario Selection .
6.2 Selecting Compatible Scenarios Using Battelle Approach
6.3 Projecting Scenario Distribution Using Bayesian Approach .
6.4 Confirming Selected Compatible Scenarios
6.5 Cluster Analysis .
6.5.1 Viewing Cluster Information
6.5.2 Viewing Cluster Image
6.6 Integer Programming .....
6.6.1 Specifying the Number of Factors in the Scenario Set
6.6.2 Specifying the Probability of the Factors Occurring.
6.6.3 Finding a Integer Programming Solution .
IV
16
16
16
17
17
19
19
20
21
21
21
22
22
22
22
7 Summary
References
DSTO-GD-0560
23
24
Figures
1 Installation of the Scenario Analysis Tool Suite 2
2 Morphological Analysis Tool Welcome Screen. 4
3 Combined Approach Tool Welcome Screen 6
4 Brainstorm Question & Selecting Sectors .. 8
5 Assigning Symbolic Name & Selecting Factors 11
6 Matrix of Pairs . . . . . . . . . . . . . 14
7 Print-out of the Matrix of Pairs Table 15
8 Summary of Sectors/Factors ..... 15
9 Matrix of Pairs & Marginal Probabilities Panel 16
10 Initial Data Input Complete ... 18
11 Results using Battelle Approach . 19
12 Computation Time for Bayesian Approach 19
13 Outputs from Conducting Bayesian Approach 20
14 Cluster Analysis Panel 21
15 Cluster Information .. 22
16 Integer Programming Panel 23
v

DSTO-GD-0560
1 Introduction
The Scenario Analysis Tool Suite (version 1.5) which is comprised of both the Morphological Analysis Tool and the Combined Approach Tool, has been created as a practicalcompanion to the report on Scenario Analysis Methods in Defence Strategic Planning [6].The report itself compares several techniques used in scenario analysis and identifiestheir usefulness and limitations.
Noticeably, non-Bayesian method (e.g. Morphological Analysis (MA) [17], Battelleapproach [16], Field Anomaly Relaxation (FAR) [1, 2, 8, 9, 10]) does not consider theprobabilities of influencing factors on the problem investigated, therefore, the selectedscenarios may have very small probabilities and could not practically be a basis of ameaningful planning effort. While the Bayesian method (e.g. Cross-Impact Analysisusing System of Equations [11, 12], or Goal Programming (GP) [3]) requires marginaland conditional probabilities for the pairs of factors as input. High demands are thereforeplaced on the expert's ability and willingness to make these estimates. Furthermore, theBayesian method takes all scenarios into consideration. In consequence, the scenarioprobabilities are often very small.
The purpose of the strategic planning process is to reflect possible alternative developments which are constructed using quantitative data as well as the experience andintuition of experts and stakeholders. However, they are unlikely to be interested in themathematical aspects of the scenario analysis. Hence the information required from themshould be kept as simple as possible. A new technique which combines all the abovemethods in light of these requirements is created and the tool provides the opportunityto compare these techniques using a specific strategic question and provides computersupport for this new technique.
Scenario development is a function carried out by many groups within Defence. Many ofthese groups have been supported by analysis from DSTO and other organisations andsome have had associated software developed [7, 13, 15]. This tool differs from past workby incorporating various methods within a single program.
The Tool Suite is a software product which has the capability to conduct the following techniques: Morphological Analysis and Combined approach (thus including theField Anomaly Relaxation, Battelle approach, Bayesian approach, and some extendedmethods: Cluster analysis, Integer Programming). Its aim is to remove the limitationon scenario development by the use of manual methods as described in Rhyne [10]which states that the vast number of configurations, makes removing an incompatiblepair ' ... a tedious, error-prone task when done by hand'. The system will provide a meansof implementing the manual steps, through the use of software and provide capture(by means of saving and allowing the user to go back) of the process so that it may beexported for scenario composition. The capture must be 'whole' in the sense that thesystem may be exported at any stage and continued manually.
The free, open-source integrated development environment (IDE) NetBeans [14] wasused in the creation of Graphical User Interface (GUI) for the tool suite. Externalmathematical programming solver GLPK [5] and Statistical Package R [4] are the mainengines for solving mathematical models and analysing results.
1

DSTO-GD--0560
1be tool was designed for use by people who have a knowledge of the methodologiesbeing used. It is expected that they are familiar with the accompanying report [6]. It isnot the intention to release this software into the Public Domain, but to provide it withsupport to DSTO colleagues or Defence staff who might need it.
1be documentation also provides help on using the program with less potential trouble,by indicating which actions must be followed by 'must'. hnplementing these actions willensure that the program will function as expected.
1be tool was developed by Cigdem Dilek as part of her 'Industry Based Learning' year atDSTO. In her absence the primary points of contact for the work are Minh-Tuan Nguyenand Justin Beck both of Joint Operations Division.
2 Getting Started
2.1 Installation of the Scenario Analysis Tool Suite
To install the Scenario Analysis Tool Suite l , follow the steps below:
L Download a zip file2 "ScenarioAnalysisTooISuite-v1.5.zip".
2. Unzip it to get the executable file "ScenarioAnalysisTool Su ite-v1.5.exe"
3. Double-click the executable file to start the installation process. 1be screen shownin Figure 1 is the screen which the user will be prompted with.
[nstall
Welcome to bccelsior Installer for Scen~oAnalysis Tool Suite 1.5 v..s-
Excelsior Installer will guide you through installation of thesoftware on your computer. To proceed, click Next.
Figure 1: Installation of the Scenario Analysis Tool Suite
IThis documen tation refers to the installation of the version 1.5 of Scenario Analysis Tool Suite releasedon the 20-03-2008.
2The exact location of the file on the DSTO Community Portal can be obtained by contacting M.-T.Nguyen, [email protected].
2

DSTO-GD-0560
4. Clicking the Next> button and following the instructions detailed in the panels willinstall the software. It will then be available from the Start Menu in the directorywhich has been specified.
It should be noted that the two external tools, the mathematical programming solverGLPK [5] and the Statistical Package R [4] have been packaged into the above installationprogram.
2.2 Installation of Java Runtime Environment ORE)
JRE 1.6 is used for running the Tool Suite, thus it is recommended that this version isinstalled on the machine on which the executable will be run on. Java JRE 1.6 can bedownloaded from http://java.sun.com .
3 Exploring the Morphological Analysis ToolEnvironment
This section of the document aims to guide the user3 through the Morphological AnalysisTool, referred to from now as the MA Tool. It supports a brainstorming process thatultimately produces amongst other things a matrix of pairs of factors4 (also referred toas a morphological space in literature) thereby helping to explore a strategic questions.The tool and the documentation assume that the user using the tool is familiar with themorphological analysis method6 [17].
The MA Tool is a standalone tool that can be used to perform a complete morphologicalanalysis. It was designed with the intent that it would normally be used in combinationwith the Combined Analysis Tool that is described in Section 4 and 6 of this report.
3.1 Running MA Tool
To run the MA Tool:
1. From the Start Menu navigate to the directory in which the Scenario Analysis ToolSuite has been installed.
2. Click "Morphological Analysis Tool". This will run the tool and display the screenshown in Figure 2.
3The user has been identified as a decision maker in the field of strategic planning who is familiar withthe morphological analysis technique and does not require familiarization with the technique.
4The MA Tool employs the terminology used in the Field Anomaly Relaxation method [10] by replacingthe word component with sector and configuration with factor.
5The question being explored does not need to be one specific to strategy. The method allows explorationof any qualitative problem space.
6]t is also presumed that the user is familiar with the terminology of the Field Anomaly Relaxation.
3

DSTO-GD-0560
, ," II •••
File Morphological Analysis Help
Ge:U:ing5tarted-----,
Open an existing Morphological Analysis .. ,
Create a new Morphological Analysis...
User Documentation
Morphological Analysis---------------------------,
Usefulness and LimitationsMorphological analysis stimulates the imagination and enables one to scan the field of possibilities systematically. The first limitatlon of MA ~ems
from the choice of components, By leaving out a component or simply a configuration that is essential for the future) one runs the Tisk of leavingout one cQrnplete facet frornthe range of possibilities· a range which is not restricted but evolves through time. The second limitation, ofcourse, stems from the sheer bulk of combinations which can rapidly submerge the user.
InputThe technique requires that the user identifies and breaks down the sy'stem under analysis into descriptors and fields.
Output ~The technique derives a matrix of fields, ready for comparative analysis.
Figure 2: Morphological Analysis Tool Welcome Screen
3.2 Navigation
MA Tool interface as seen in Figure 2 allows the user to progress through the morphological analysis method by providing the use of Back and Next buttons located at the bottomright of each step (the welcome screen can be accessed from any stage of the method bychoosing Help> Welcome screen). There are three steps in the morphological analysis:
1. brainstorming a question and then brainstorming the problem at hand into sectorsthen selecting those sectors that will be used in the analysis,
2. brainstorming factors for each sector and then selecting those factors that will beused in the analysis, and
3. creating a morphological space.
The user may also use the steps listed (Brainstorm Problem, Breakdown Components andMatrix of Pairs) tmder the menu item Morphological Analysis (located at the top of the tool)by clicking the required step.
3.3 User Help
The user may retrieve assistance in using the program by choosingHelp> User Documentation. This will open the user documentation for reference whilstusing the tool. Or alternatively, click on User Documentation via the Welcome screenshown in Figure 2.
3.4 Basic Functionality
3.4.1 New Analysis
To create a new analysis:
4

DSTO-GD-0560
1. Choose File> New Analysis2. You will then be prompted to save the current analysis. Click Yes, to save the
analysis and follow the steps in Section 3.4.2. Click No, to continue without savingthe current analysis and this will take you to the first phase of the analysis. ClickingCancel will dismiss the action and return to the previous state of the program.
Alternatively, click Create a new Morphological Analysis when on the Welcome screen.This action will also prompt to save and go through the same procedure described inSection 3.4.2.
3.4.2 Save Analysis
An analysis that has been completed can be saved for future use and an incomplete onecan be saved so that it can be completed later. To save the current analysis:
1. Choose File> Save Analysis.2. At the Save prompt, choose a directory and enter a file name for the analysis in the
standard windows interface.3. Click Save to continue saving the analysis, or click Cancel to return to the program.
3.4.3 Open a Morphological Analysis
A previously saved file can be loaded for reference, completion or to be modified. Anexample save file is include in the base directory of the default package and is called'example.ma'. To open this or another existing morphological analysis:
1. Choose File> Open Morphological Analysis.2. Select the file from the standard windows interface. By convention files that are
able to be loaded should have the .ma extension.
3.4.4 Export Analysis
To export the current analysis: Choose File> Export Analysis. A readable form of theanalysis will be available in the default directory indicated by the message box. Thereadable form can be opened in an internet browser program. It can then be printed fromthere.
3.4.5 Exit Program
To exit the program: Choose File> Exit. A prompt to save the current analysis will appear,and the same procedure described in Section 3.4.2 can be followed to guide through thisprocess.
5
DSTO-GD-0560
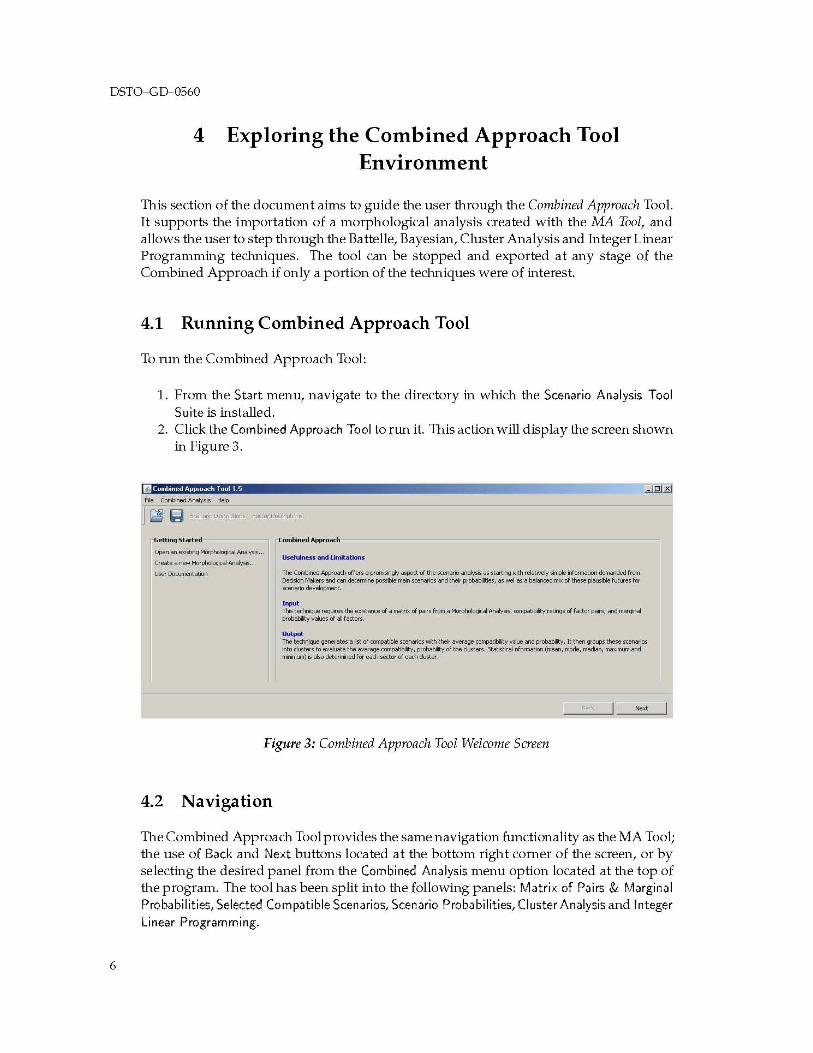
4 Exploring the Combined Approach ToolEnvironment
This section of the document aims to guide the user through the Combined Approach Tool.It supports the importation of a morphological analysis created with the lvfA Tool, andallows the user to step through the Battelle, Bayesian, Cluster Analysis and Integer LinearProgramming teclmiques. The tool can be stopped and exported at any stage of theCombined Approach if only a portion of the teclmiques were of interest.
4.1 Running Combined Approach Tool
To run the Combined Approach Tool:
1. From the Start menu, navigate to the directory in which the Scenario Analysis ToolSuite is installed.
2. Click the Combined Approach Tool to nm it. This action will display the screen shownin Figure 3.
File Ccmbi">od AnoI','m .....,
J~ ~ "'''f1iI''''~ foctorOe<a1ptjon<
(;c,ttinQ started Combined Approach
4>0<1"" ._.... ""'pI'>;Ao;jo<oI~
Cre"". , new _pt>ob;~01~
lJ>er DoxlSflOf)l:obon
User....,.. and limitation,
The Corrbi'>ed i'W"oodl orler, , ><~_t or the ><erw'<l~ i>< <t~ ...th reW",eIy~ rlorrMbon derMnded fromDed<ion M.>ker, ¥Jd , ..... deter""" possblo '"""' scemrio< ¥Jd theW ><ob.>bltie" i><~ i>< 0 MIoneod rrix or these pi.>usbIo fcl:lIe, forSCeMf;' deyeOopmert
'....n", tedY;qoe r~es the exist,...,;:e or, _ or pM, from, Morpl"do;jcoj """""sis, ,~''''~ ci fi>Ctor p.oir" ¥Jd """,.,.,..><~yy""",ci"fi>Ctor<
~..The tedriq..oe _",e, , 1stci,~ scemrio< I'<lI1 theW ""er_,~yYO ¥Jd ><~y. It ther1'¥0<.!P' these scemrio<rio arter, to evooWl:e the "".._ c~y, ><~y cithe art..,. 5I:_~oj rlorrMtoo (rne.Yl, mode, medon, rMxIDJn ¥Jd~)~ oIso deterrrr.ed for ei>C!1 sector or ei>C!1arter
Figure 3: Combined Approach Tool Welcome Screen
4.2 Navigation
The Combined Approach Tool provides the same navigation functionality as the MA Tool;the use of Back and Next buttons located at the bottom right corner of the screen, or byselecting the desired panel from the Combined Analysis menu option located at the top ofthe program. The tool has been split into the following panels: Matrix of Pairs & MarginalProbabilities, Selected Compatible Scenarios, Scenario Probabilities, Cluster Analysis and Integer
Linear Programming.
6
DSTO-GD-0560
4.3 User Help
The user may retrieve assistance in using the program by choosingHelp> User Documentation. This will open the user documentation for reference whilstusing the tool. Or alternatively! click on User Documentation via the Welcome screenshown in Figure 3.
4.4 Basic Functionality
4.4.1 Creating a New Combined Approach Analysis
A Combined Approach analysis requires the existence of a morphological analysis! thus acombined approach analysis cannot be created without first conducting a morphologicalanalysis. To create a morphological analysis! see Section 5! or follow the steps inSection 4.4.3. If a morphological analysis already exists! steps in Section 4.4.2 canbe followed to open the analysis. After which analysis can be saved as a CombinedApproach analysis.
An example morphological analysis named 'example.ma' is provided with the tool andcan be found in the base directory.
4.4.2 Opening a Morphological Analysis
To open a morphological analysis! implement the folloWing steps:
1. Click Fi Ie > Open Analysis. This will display a standard windows Open Dialog box.2. Locate the directory in which the morphological analysis file is located.3. Locate the analysis file with the .ma extension! and click on the filename. This will
update the File Name input field with the name of the file.4. Click the Open button.
4.4.3 Create a New Morphological Analysis
To create a new morphological analysis! either follow the steps in Section 5 or on theWelcome screen! click Create a new Morphological AnalysisE text on the left-hand GettingStarted category. This will launch the MA Tool.
5 Creating a Morphological Analysis
5.1 Brainstorming a Question
The user may brainstorm a question and record this by entering the question into thetext area adjacent to the question indicator in the Brainstorm Question step! as seen in
7

DSTO-GD-0560
Figure 4. This may be revised later even if the user has progressed to later screens byusing the back button.
IFie _»t>;lb;licol MoIym ~
J~Brain.torm !Ju<'.tlon
J.u~tralia'~ Joint Op~ration~ tor th~ 21~t c~ntury ~tat~~ H(lional tactor~ (~uch M ~tat~
trai;/ility, poor i;/ov~rnanc~ and ~conom1c uncl~rd~v~lop"",nt) _,. att~ct J.u~tral1a'~ ~~curity
intu..r_, both dinerly and indinctlv...... ruuH, .. h, t ... k ~or Au_tralia'. n.hnc.
force i~ to contribute to a ~table rei;/io,*,"l environment.
I
Figure 4: Brainstorm Question & Selecting Sectors
5.2 Sectors
The analysis technique requires that the problem be broken down into sub-systems orcomponents, which are referred to as sectors. These sectors could be brainstormed usingthe tool, or entered into the tool after a 'white board! brainstorming session. Instructionsin the next subsection refer to the sector screen shown in Figure 4.
5.2.1 Creating a New Sector
To create a new sector: Enter a sector name into the New Sector field and click the Createbutton adjacent to the field, as shown in Figure 4. This will add the newly created sectorto the list of brainstorm sectors on the left hand side. Additional sectors are created byrepeating this step.
8

DSTO-GD-0560
5.2.2 Editing an Existing Sector
To edit the name of an existing sector:
1. Select the sector and click the Edit button. This will display the input dialog box.2. Enter a new name into the input field and click the OK button. The changes will be
reflected in the list.
5.2.3 Attaching a Description to the Sector
To record a description or details of the sector:
1. Select the sector in either list. This will enable input into the description input field.2. Enter a description or details into the field. The text will be saved! when the cursor
is moved to another input field.
5.2.4 Selecting a Sector to be Used in the Analysis
To include a sector in the analysis:
1. Select a sector from the brainstorm sector list! which will highlight the sector.2. Click the Include> button. This will add the brainstorm sector to the selected list
on the right hand side of the window. This step can be repeated for each desiredsector.
5.2.5 Including all the Brainstormed Sectors in the Analysis
1. Click on any brainstorm sector. This will enable both the Include> and Include All»buttons for use.
2. Click the Include All» button. This will include all the sectors as selected sectorsthat will be used for further analysis.
5.2.6 Removing a Selected Sector from the Analysis
To remove a sector from the analysis:
1. Click on a sector in the selected list.2. Click the Remove button. This will result in the sector being removed from the
selected list and added to the brainstorm list. This step can be repeated to removethe desired sectors from the analysis.
9

DSTO-GD-0560
5.2.7 Removing all Selected Sectors from the Analysis
To remove all the sectors from the analysis back to the brainstorm list:
1. Click on a sector in the selected sector. This will enable the <Remove and«Remove All button.
2. Click the < <Remove All button to remove all the sectors from the selected list to thebrainstorm list.
5.2.8 Removing an Existing Sector Permanently
To remove a sector:
1. Click on a sector in either the brainstorm list or the selected list. This will highlightthe chosen sector
2. Click the Remove button. This action will result in the removal of the sector.
5.3 Factors
Many of the functions on the factors screen are identical to those on the sectors screen.This should aid the user to quickly become familiar with the tool.
5.3.1 Purpose of Screen
This screen allows the creation of factors for each sector. The factors describe possiblestates of the sector and should be entered in a sequential order. The screen itself is similarto the sectors screen. An example is shown in Figure 5.
5.3.2 Specifying a Letter Index for the Selected Sectors
A letter index for each sector is assigned initially by defaulf and displayed in the'Current Letter' box. This may be changed by entering a New Letter. These letters willuse as a symbolic name for the analysis.
1. If in the Brainstorm Question step, click the Next button to move to the BreakdownComponents step (or wait until you naturally progress to this stage).
2. You must select a sector from the drop-down Select Sector box. Selecting thefirst sector Political Governance from the list (Figure 5), shows that the letter indexassigned by default is P.
7By default the sector is assigned a letter index of the first letter of the sector name. If however, anothersector of the same first letter already exists in either the brainstorm or selected list, then it is given a letterindex of the same letter occurring multiple times.
10

DSTO-GD-0560
.. I
File Morphological Analysis Help
Sedor
Select Sector: Ipolitical Governance iJ-New letter: I Create I Current letter: Ip
Brainstorm Factor
New Factor: IColiapse or change in major playersl Ii Create I Remove- I 5# ISelel:t a factor to include in analysis: Unstable political environment I--=-J Political stability in most regions
IList of brainstormed sectors I
l:t Include All » 1~
«P.e[lJOVe Ali I~
Description:
I
Figure 5: Assigning Symbolic Name & Selecting Factors
3. Another letter index can be specified by selecting the sector from the list andentering the new letter index into the New Letter input field and clicking the Createbutton adjacent to the field.
Note that when the screen is first displayed the current letter of the first sector isincorrectly displayed. Switching sectors corrects this.
5.3.3 Creating a New Factor
1. Select a sector from the sector list.2. Enter the factor name into the New Factor input field and click the Create button
adjacent to the input field. The newly created factor will be added to the brainstormfactor list as can be seen on the left-hand side of the panel shown in Figure 5.
5.3.4 Editing an Existing Factor
To edit the name of an existing factor from either the brainstorm or selected list:
1. Select the factor from the list. This will highlight the factor selected.2. Click the Edit button, and this will display a dialog box which will prompt you to
enter a New Factor name.
11

DSTO-GD-0560
3. Enter a new name for the factor and click the OK button. This will change the nameof the factor.
5.3.5 Selecting a Factor to be Used in the Analysis
In order for a factor to be used in the analysis, it must be moved from the brainstormfactor list to the selected factor list for the selected sector. A factor can be moved to theselected factor list by:
1. Selecting a factor from the Brainstorm Factor list, so it is highlighted.2. Click the Include> button to remove the factor from the brainstorm factor list and
add it to the selected factor list on the right hand side.
5.3.6 Attaching a Description to the Factor
A description or note can be attached to the factor to record the ideas which werediscussed and present in the brainstorming session. This can be done by:
1. Selecting a factor by clicking on it, whether it is in the brainstorm factor list or theselected factor list. The selected factor will become highlighted, and enabled entryinto the input field labelled as Description.
2. Enter a description into this field.3. Selecting another factor or placing the cursor into another input field such as the
New Factor field will automatically save the description. After which point, thedescription of a factor may be viewed (or edited) by selecting that factor.
5.3.7 Selecting all Brainstormed Factors to be Used in the Analysis
If all the factors in the brainstorm list need to be added to the selected list follow the steps:
1. Select any factor in the brainstorm list so that the Include All» button can becomeactive.
2. Once the Include All» button is active, click on the button. This will then removeall brainstorm factors from the Brainstorm Factor list and add it to the selectedfactor list.
5.3.8 Removing a Selected Factor from the Analysis
To remove a single factor from the selected factor list and return it to the brainstorm factorlist, follow the steps below:
1. Click on the factor to remove in the selected factor list. This will highlight the factor,and enable the <Remove button.
2. Click on the <Remove button.
12

DSTO-GD-0560
5.3.9 Removing all Selected Factors from the Analysis
To remove all the selected factors from the selected factor list follow the steps below:
1. Click on any factor in the selected list. This will enabled the use of the <<Remove Allbutton.
2. Click the «Remove All button. This will remove all the selected factors from theselected list and add them to the brainstorm factor list so they may be added againif they are required. The tool allows the keeping a record of the factors that are notto be used in further analysis.
5.3.10 Removing an Existing Factor
A factor may be in either the brainstorm list or the selected list to be removed. It can beremoved by:
1. Selecting the factor to be removed by clicking on it from the required list.2. Click the Remove button adjacent to the Create button. This action will result in the
complete removal of the factor from both lists of factors.
5.4 Matrix of Pairs
5.4.1 Viewing the Matrix of Pairs
A matrix may be viewed at any point. The matrix will display only those selected factorsand sectors. In order to do this, follow the following steps:
1. Create sectors to be included in the analysis by creating a sector and moving it tothe selected sector list.
2. To those sectors attach selected factors.3. Click the Next button from the Breakdown Components panel to move to the Matrix
of Pairs panel.
13

DSTO-GD-0560
.. I
File Morphological Analysis Help
MatriHofPairs--------------------------------------,
The following table is produced for the analysis, click the 'Print' button to print.
PI
PI XP2 X
P3 X
El
E2E351
5253Tl
T2T3HIH2H3
Al
A2A3
ClC2C3
P2 P3 El
x XX Xx x
E2 E3 S1 52 S3 T1 T2 T3 HI H2 H3 At A2 A3 A4 C1 C2 C3
Bock I[["Fini'"]1L- -----'
Figure 6: Matrix of Pairs
The matrix of pairs can be seen as in Figure 6. All contain three factors with the exceptionof the second last sector'A' which have four. A labelling system which represents boththe sector and factor has been adopted. For example, El is the first selected factor ofthe sector with the letter index of E, thus each factor has both a row and column. A cellmarked with an 'X' represents an incompatible comparison as they are factors of the samesector. A cell marked with a '~' (dash) represents a red undant comparison as filling in thebottom left-triangle of the table will result in making this comparison. The table cannotbe edited but can be printeds.
Filling in the table is done as part of the combined analysis in the associated tool.
5.4.2 Printing the Matrix of Pairs
To print a matrix of pairs:
1. Navigate to the Matrix of Pairs panel which is the last panel.2. Click the Print button located at the top right-hand comer of the panel.3. This will prompt you with a standard Print dialog box of Windows origin and select
the required printer settings, and click the Print button. An example of a printoutversion can be seen in Figure 7, which is basically just the table seen in the Matrix ofPairs panel (see Figure 6).
SIt is assumed that the decision makers will require a copy of the matrix to go away and illl incompatibilities and incompatibilities which they think apply to the problem space.
14

P3 X
El
"E3,15'E3
nnTI
"1
"'"'1""4
P2. P3, ,, ,, ,S2 53 Tl
,,X
n TI "1
DSTO-GD-0560
~ ~ Al ~ M AA Cl 0 C3
Figure 7: Print-out of the Matrix ofPairs Table
P E 8 T ~ A CPoliucal Econcmic Social Cohesion I~';;'w"o,,, of ~eal1h and Habitat Type ofOi=€ration ADFGovernarce Growth required t¥ ADF Coocurrenl
OUigauoos
P1 E1 81 T1 ~1 A1 C1Poliucal Developing Tolerarce Cooflicl and Improving!S1J31ai nabl e
""VI """"" "I'ADF'rJ8Minor
stability in between groLPs uprising between commitmenl1omost r8gom group
I~~~:~nsP2 E2 82 T2 ~2 A2 C2Unstable Declining Faclionalisauon Icmlinuing Deg:-adauon Coonler Majorpolitical between groLPs "b commitmenl1oenvironment advancement of ITer;~:i~~'
I~~~:~nstechnology
P3 E3 53I~;ggng
~3 A3 C3Collapse C( Collapse Confiicl and ollaps8, m~ldo'ffl1 Coovenuonal warfare Ccmmilmenl10change in ulXising bemoon Oi=€rations!!@jor players grot.,p technology fLIther afield
Illlilil 1
M11~lJT1anitarianassistance I
Figure 8: Summary ofSectors/Factors
The sectors and factors with their description can also be printed by choosing File> Export Analysis in the menu. Figure 8 is the summary table of sectors/factors extracted fromthe Export Analysis printout.
15
DSTO-GD-0560
6 Using Combined Approach
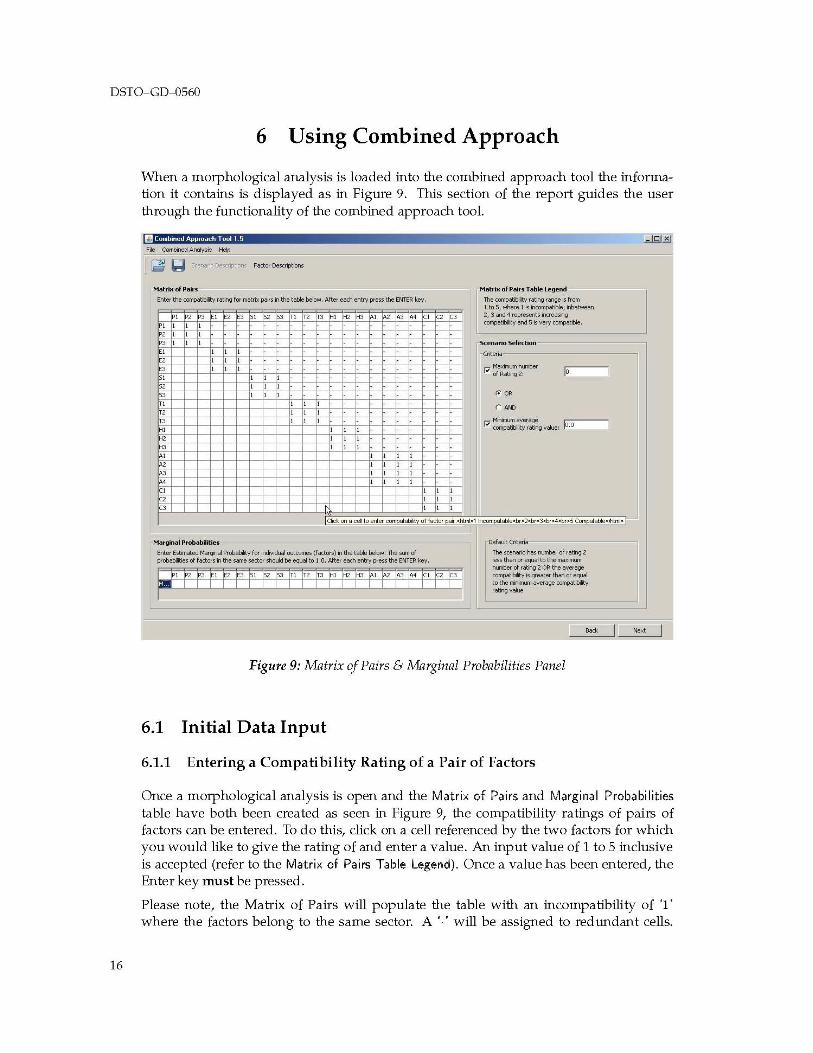
'When a morphological analysis is loaded into the combined approach tool the information it contains is displayed as in Figure 9. This section of the report guides the userthrough the functionality of the combined approach tool.
,.
MatriH orP....,
We< thec~y robn<j for _fix p.oif, nth< t.obIe....,.,.., After MCh entry pross the ENTER key
12312351, , ,, , ,, , ,1 2 T3 1 , ,
MatriH orP...., T"""" l~!I"nd
The<~yrotngr""90~ffom
1 to 5, I'<'ho<e 1 ~h;:oo#lbIe; rbet"",on2,3 ond i represerl:, ooe-"c~y ond 5;'; VOfy<~
Sc~nMio s.,"'ction
rCrm;."
17::=~"
nnn,
, ,, ,, ,
Marginal Probabilit"'.
Enter Estmotod _<TtaIProbobill:y for J>di¥dJol C'J.come, (Fodor,) n tho teble beO>w, Tho <un 01proboblJbes 01 fodor, n the ,""'" >ector stnJd be oq.a' to 1.0, After eoct. ero-y "'os, the ENTER f.ey
, , 3 1S;'S3T1T2T3 1 , , ,
De.'d~r1:ern
The >cernrio r.., runbef 01 robn<J 2~" ttJ,y, or eq.>aI to the ""x<runro-rbef 01 rao/irJg 2 uo. the .vor_(~y~ ,¥e¥.... thon or eq.Jaito the roUruo 0__ (~t.ilty
raotng v.....
Figure 9: Matrix of Pairs & Marginal Probabilities Panel
6.1 Initial Data Input
6.1.1 Entering a Compatibility Rating of a Pair of Factors
Once a morphological analysis is open and the Matrix of Pairs and Marginal Probabilitiestable have both been created as seen in Figure 9, the compatibility ratings of pairs offactors can be entered. To do this, click on a cell referenced by the two factors for whichyou would like to give the rating of and enter a value. An input value of 1 to 5 inclusiveis accepted (refer to the Matrix of Pairs Table Legend). Once a value has been entered, theEnter key must be pressed.
Please note, the Matrix of Pairs will populate the table with an incompatibility of '1'where the factors belong to the same sector. A '~' will be assigned to redillldant cells.
16

DSTO-GD-0560
Although all these cells should not be editable! the bottom left outer '1' values are. Thesevalues must not be changed and most have been disabled to prevent this from happening.
6.1.2 Entering a Marginal Probability for a Factor
The marginal probability of a factor can be entered by double-clicking the cell in theMarginal Probabilities table and entering a value. When a value has been entered the enterkey must be pressed. The factors in the sector should sum to equal to or less than 1. Awarning message will be displayed if they sum to something greater than one.
6.1.3 Scenario Selection
The scenarios can be filtered by using a selection criteria based on the maximum numberof rating 2 values and!or the minimum average compatibility rating value9 allowed.
• Entering a maximum number ofrating 2 value:
The maximum number of rating 2 criteria works by disallowing scenarios that havemore pair-wise rating 2 than this value. This value can be entered by entering aninteger in the Maximum number of Rating 2 input field. After a value has beenentered! the cursor must be placed in Minimum average compatibility rating valueinput field to register the rating 2 value criteria.
• Entering a minimum average compatibility rating value:
The minimum average compatibility rating value works by selecting those scenarios which have an average compatibility rating of the value or higher. To enter aminimum average compatibility rating value! by entering a value in the minimumaverage compatibility rating input field. After the value has been entered! the cursormust be placed in the maximum number of rating 2 input field. The input field acceptsreal (decimal) numbers between 1 and 5 inclusive.
• Specifying scenario selection filter technique: the first or the second criteria can beapplied! or both.
To specify only the first criteria: Ensure that the maximum number of rating 2 criteriais checked and the minimum average compatibility rating is not! regardless of whetherthe Or or And button is selected.
To specify only the second criteria: Ensure that the minimum average compatibilityrating criteria is checked and the maximum number of rating 2 is not! regardless ofwhether the Or or And button is selected.
To specify if either the first or the second criteria is met then the scenario shouldbe included: Ensure that the minimum average compatibility rating criteria and themaximum number of rating 2 is checked! and select the Or button.
9The terminology of 'upper-bound value' and 'lower-bound value' are used for the maximum number ofrating 2 values and the minimum average compatibility rating value respectively in the companion report [6,Section 6.2.3].
17
DSTO-GD-0560
To specify that a scenario must meet the first and the second criteria: Ensure thatthe minimum average compatibility rating criteria and the maximum number of rating 2is checked, and select the And button.
fie Cc<tliood""""Y'" ~
J~ 1;;1 5ter>O"IODe<o1ptiatl> Fi>Cte<De=ipo'ior;;
Matri><ofPair.
Enl:e< tho (~robnll f", rn.>b"ix pM,., tho toble below, After e""h emf ",es, the ENTER key
, ; , , ; " " n " n , , ; • , , ;, , , ,, , ,, , ,, , , , ,, , , , ,, , , , ,, , , ,~ , , ,~ , , , , , , , ,n , , , , , ,n , , • , , , ,n , , , , , , , ,, • , , ,
• , , ,, , , , , , , , , , ,, • • , , , • , , , , , , ,• , , , , , , , , , ,
", , , , , , , , , , , ,
• , , , , , , , , , , , , , , ,, • , , , , , , ,• , , • , , , , , , , ,, • • • , , , , , , ,
MatriH of Pair.T~l~gend
The (~blty roffiW '''''9'' ~ from1 to 5, _0 1 ~ O;:~_; metl'.'effi2, 3 MId" r...-e><f't, ooe-..(~yMJd5~¥e<)'(~
5c~nario s.,"'ction
r<ft:e<"
17=~ "1'----,
Marginal Prob_.,.
Erl:e< E_ed_~Pr_V for~ cUe"""" (foctCH) n tholoble bebw, The ><XI1 of",cNbllies fi foetor, J1 the SIlrrJe >ector~ be equ.oI to 1,0, Aft", eod1 m"l p<'" tho ENTER key
1 2 3 1 2 3 10,3,2,5,5,'115
3 1 2 31 6 3 1
DefdCr1:e<;'"
The ,,:0,"''00 Iw; rurber d ,01:..... 2less th.>n [f( oqu.oI to tr.. rMxmxnrurber of ro/:O;l2 00 tho .,0<09"~yis\TMl:erth.on",eQUoj
toltoerrrtrun""er_(~ty
rot.........,
Figure 10: Initial Data Input Complete
18
DSTO-GD-0560
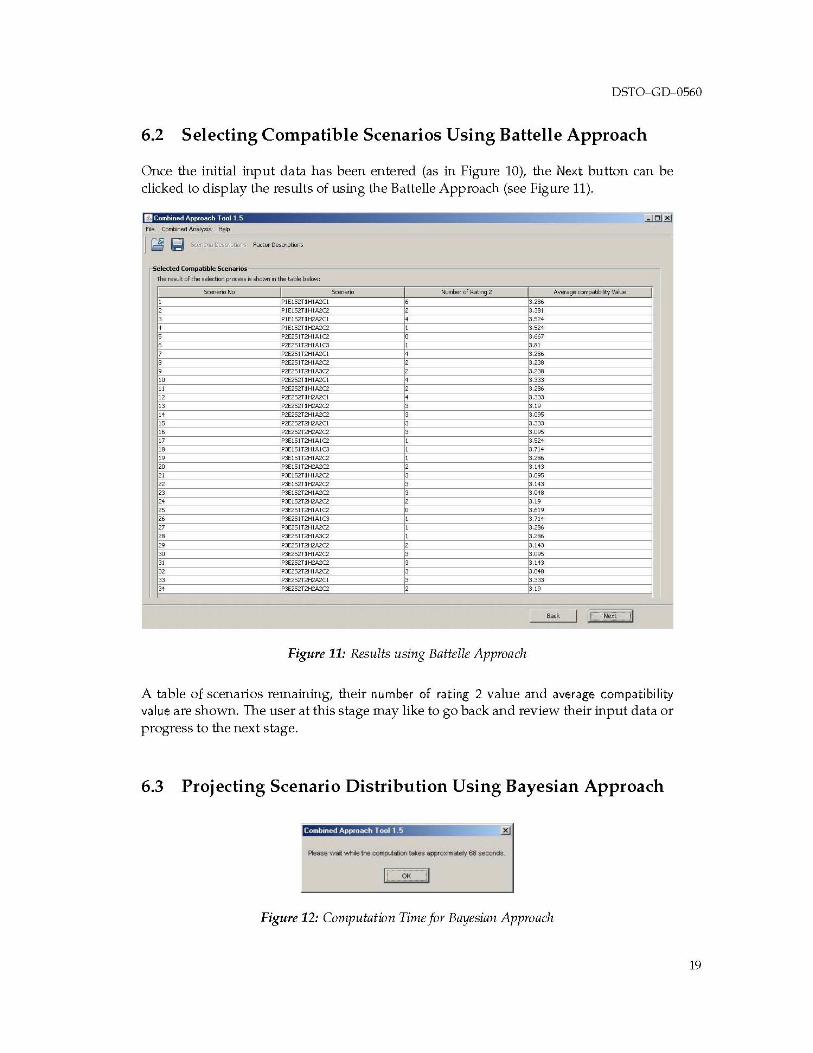
6.2 Selecting Compatible Scenarios Using Battelle Approach
Once the initial input data has been entered (as in Figure 10), the Next button can beclicked to display the results of using the Battelle Approach (see Figure 11).
.:.lQJ4.0 ee.mined~'" "" -JI2l I;:j ><en_ De<tlipMn< Fodor De>crVOris
r~o"" ,~.- ~."~.The re>oA ri the selection proces' ~~ n the t_ b"""",
,- ~rJRothJ2 A¥.."'I"c~yY"'"5c.....""No1 lE1S2T1H1A2Cl m
lE1S2T1H1A2C2 3,381, lE1S2T1K2A2Cl • 3,52'1
• lE1S2T1K2A2C2 , 3,52'1
lT2tHA1C2 3,66?
lT2tHA1C3 , 3,81, lT2tHA2Cl • mlT2tHA2C2 3,238
lT2tHAX2 3,238
W 2T1H1A2Cl • 3,~33
" 2T1H1A2C2 m
" 2T1K2A2Cl • 3,333
" 2T1K2A2C2 3,19
" 2T2tHA2C2 ,~
" 2T2H2A2Cl 3,333
" 2T2H2A2C2 ,~
" lSlT2tHA1C2 , 3,52'1
'" lSlT2tHA1C3 , 3,71'1
" lSlT2tHA2C2 , mlSlT2H2A2C2 3,1'13, 1S2T1H1A2C2 ,~
1S2T1K2A2C2 3,1'13
1S2T2tHA2C2 3.CM8
• lS2T2H2AZC2 "lSlT2tHA1C2 '"ZSlT2tHA1O , no, ZSlT2tHAZC2 , =I~,m
, =" lT2H2A2C2 '"" TlH1A2G' ~
" TlK2A2G' ,'"" T2tjlA2G' , .,
" T2H2A2Cl , m
" Z5.2T2H2A2C2 "
"'" I IC-NoXi- 11 -Figure 11: Results using Battelle Approach
A table of scenarios remaining, their number of rating 2 value and average compatibilityvalue are shown. The user at this stage may like to go back and review their input data orprogress to the next stage.
6.3 Projecting Scenario Distribution Using Bayesian Approach
Figure 12: Computation Time for Bayesian Approach
19

DSTO-GD-0560
Once the user has finalized the scenarios retrieved from condticting the Battelle Approach, the user can click the Next button to progress to the results of condticting theBayesian Approach. A message prompt estimating how long the calculation will takeis then display (Figure 12). When this has been acknowledged the calculations willstart. The results are shown in a table, where each scenario has its configuration andits probability displayed.
f"~~,,~
J~ L;I 5c«W>oDe~ Foctor De~Ons
5c~nario P,obabilit;".
The p",t>Oblties 01 tho >elected "'0Mr,,", ilfe >howe n tho totOe beOow, lndicol:. _h "'e<><If>OS wi be rerooved from flrlhe< consider.b""by morT>< Yt1 the "Remove 5cen,y",'- (cUm
""
lE152TlHlAZCl
lE1S2T1HlAZCZlE1S2T1H<AZCllE1SZWiZAZCZ2E25lT2H1AIC2
2E25lT2H1AIC3
2E25lT2H1A2Cl
2E25lT2H1A2C2
2E25lT2H1A3C2
2E2S2TIH1A2Cl
2E2S2TlH1A2C2
2E2S2TlK2A2Cl
2E2S2TlK2A2C2
2E2S2T2HIA2C2
2E2S2T2H2A2Cl2E2S2T2H2A2C2
lSlT2HIA1C2
lSlT2H1A1C3
lSlT2H1A2C2
lSlTZHZA2C2
lS2TlHIA2C2
lS2TIH2A2C2lS2T2tjlA2C2
1,18
"•1,18
Pr~y(%)
Fn>Ist_
For the fM "'_ 01 the cornbned onoIy>is, C\mor IIMIysis con be performed to choose represenl:otIve >cor>aor>os or lrl:OQOf Pr"7~ con to u<oed for , boIonced reOx 01 pIoustJIe>c.,...>OS, Oloose the """"'" _ ... be used n the fM "'_
r. Ol>tor I\naIy>i<
r Irl:OQOf Pr"7~
Figure 13: Outputs from Conducting Bayesian Approach
6.4 Confirming Selected Compatible Scenarios
By default, those scenarios which have a probability of zero have been set to be excludedfrom the next stage of the analysis.
• To remove additional scenarios from the analysis: enter a value of 'Y' in the RemoveScenario? colunm for the scenario which is to be removed .
• To not remove a scenario from the analysis: enter a value of 'N' in the Remove Scenario?colunm for the scenario which is not to be removed.
20
DSTO-GD-0560
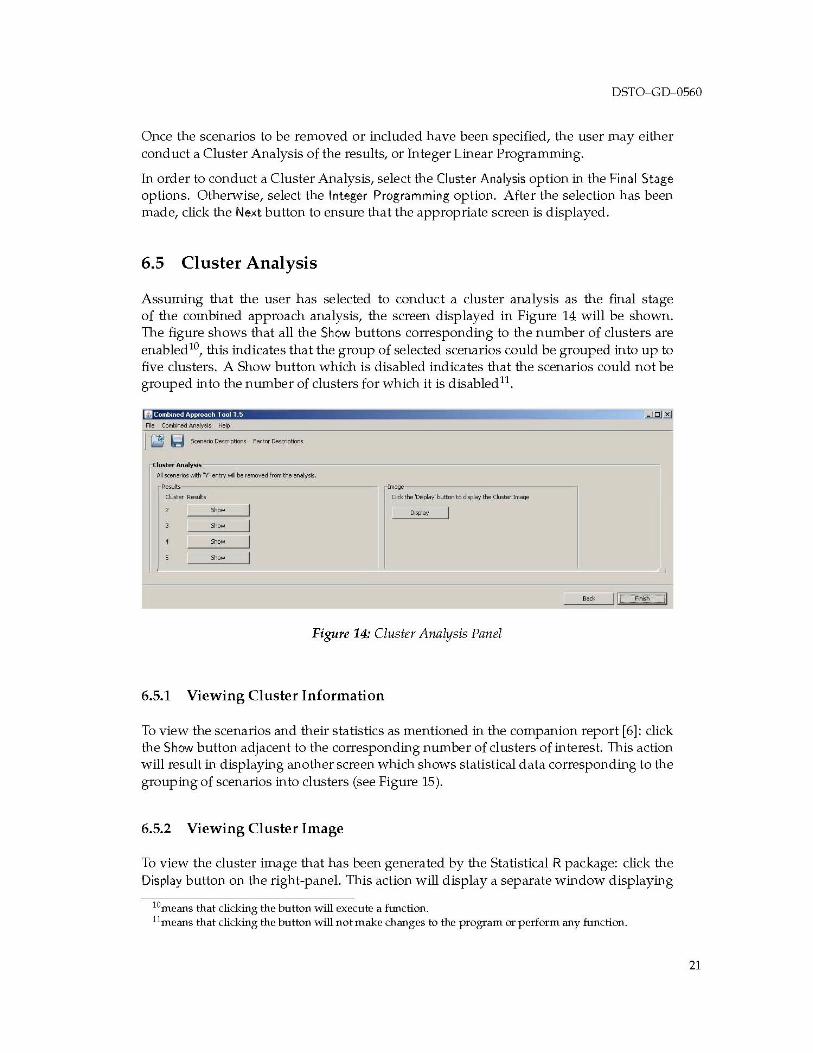
Once the scenarios to be removed or included have been specified, the user may eitherconduct a Cluster Analysis of the results, or Integer Linear Programming.
In order to conduct a Cluster Analysis, select the Cluster Analysis option in the Final Stageoptions. Otherwise, select the Integer Programming option. After the selection has beenmade, click the Next button to ensure that the appropriate screen is displayed.
6.5 Cluster Analysis
Assuming that the user has selected to conduct a cluster analysis as the final stageof the combined approach analysis, the screen displayed in Figure 14 will be shown.The figure shows that all the Show buttons corresponding to the number of clusters areenabled lO, this indicates that the group of selected scenarios could be grouped into up tofive clusters. A Show button which is disabled indicates that the scenarios could not begrouped into the number of clusters for which it is disabled11.
f"~~,,~
J~ L;I 5c«W>oDe~ foetor Desaipbons
( ....t~ Analysis
AI sc"""""" ..,;t!, 'Y erny I'<'iI be removed fre<n the~
Resets
OJst'" Resets
-'--
,~-
Cl<Ic the t>islM1 Wton to <isp/.>y the OJ<terI~-
Figure 14: Cluster Analysis Panel
6.5.1 Viewing Cluster Information
To view the scenarios and their statistics as mentioned in the companion report [6]: clickthe Show button adjacent to the corresponding number of clusters of interest. This actionwill result in displaying another screen which shows statistical data corresponding to thegrouping of scenarios into clusters (see Figure 15).
6.5.2 Viewing Cluster Image
To view the cluster image that has been generated by the Statistical R package: click theDisplay button on the right-panel. This action will display a separate window displaying
lOmeans that clicking the button will execute a flmction.llmeans that clicking the button will not make changes to the program or perform any function.
21

DSTO-GD-0560
[luster Analysis
(luster No I Scenario I Average Compatibility Value I94.4
5.6
Probability I
JJCluster Statistics and Representative5cenarios-----------------------------,
cluster No Sector Mean Mode Median Maximum Minimum Representative Scenario
1 p 2.5 3 3 3 1 31 E 1.62 2 2 2 1 21 5 1.58 2 2 2 1 21 T 1.65 2 2 2 1 21 H 1.23 1 1 2 1 11 • 1.88 2 2 3 1 21 C 1.92 2 2 3 1 22 P 1.5 1 1 2 1 12 E 1.5 1 1 2 1 12 5 1.5 1 1 2 1 12 T 1.5 1 1 2 1 12 H 1.5 1 1 2 1 12 • 1.5 1 1 k" 2 1 12 C 2 1 2 3 1 2
Figure 15: Cluster Information
the image. A file containing this image is generated as a bi-product of the analysis andcan be found in the program directory.
6.6 Integer Programming
If the Integer Programming option (see Figure 13) of the Combined Approach analysis wasselected then the panel show in Figure 16 will be displayed. It requires further inputbefore the calculations can be made.
6.6.1 Specifying the Number of Factors in the Scenario Set
In order to find the smallest number of scenarios that cover the number of factorsspecified, implement the following steps: for the factor of interest, change the value inthe column titled N by double clicking the cell and entering a new value.
6.6.2 Specifying the Probability of the Factors Occurring
The probability of the factor is specified as follows: for the factor of interest, change thevalue in the column labelled P. All factors in this column must to add up to a probabilityof equal to or less than 1. If this is not the case, the user will be notified.
6.6.3 Finding a Integer Programming Solution
In order to find a Integer Programming solution: click the Find (alternative) solution buttonlocated at the bottom-left of the panel. This action will display a separate panel.
22

DSTO-GD-0560
s"Mch for a balanc~d miH of p1....._ oc~nMio. usinQ Int~ p,_amming
Wor , ...., fe< N ond P n the toble~ ond pres< the ENTER key, N rOl"e>erl:, tho runber ri foetor OC(lIenee> irt the >C~ set,""""'eos p ~ tho probobilty 01 tho foetor «fcome
(}+5'!5i5'!5i5'!5i5'!SO
(}+S'!5iS'l5iS'l5iS'lSO
(}+S'!5i5'l5i5'l5i5'lSO
(}+S'!5iS'l5iS'l5iS'lSO
nnn,
IPfe->elected 5<"""""" (e.g, 2, 7, 11)
11'1,2'1,32
(}+S'!5i5'l5i5'l5i5'lSO
(}+S'!5iS'l5iS'l5iS'lSO
(}+S'!5i5'l5i5'l5i5'lSO
(}+S'!5iS'l5iS'l5iS'lSO
(}+S'!5i5'l5i5'l5i5'lSO
(}+S'!5iS'l5iS'l5iS'lSO
Figure 16: Integer Programming Panel
"
• If a feasible solution can be found, the scenario set and the values for N and P willbe shown in a table.
• If however, there is no feasible solution, there will be no output displayed in thepanel and the user will be prompted to re-enter input data in Figure 16.
7 Summary
This docwnment has described, in detail, how to use the Morphological Analysis Tool andthe Combined Approach Tool that forms the Scenario Analysis Tool Suite.
As with any piece of software, there may be bugs remaining in the code. To datethe program has not undergone extensive verification and validation due to a lack ofavailable resources, in particular the end of the primary progranuner's contract at DSfO.
Together with this user manual and the companion report on the scenario analysismethods, this tool provides an excellent resource for the conduct of strategic analysis.However, by itself the tool will not perfonn this analysis. Trained staff should still beused to interpret the inputs and the results of the model.
23

DSTO-GD-0560
References
1. Coyle, R. G. & McGlone, G. R. (1995) Projecting Scenarios for South-east Asia and theSouth-west Pacific, Futures 27(1), 65-79.
2. Coyle, R. G., Crawshay, R. & Sutton, L. (1994) Futures Assessment by Field AnomalyRelaxation, Futures 26(1),25-43.
3. De Kluyver, C. A. & Moskowitz, H. (1984) Assessing Scenario Probabilities viaInteractive Goal Programming, Management Science 30(3), 273-278.
4. Hornik, K. (2007) The R FAQ, http://CRAN.R-project.org/doc/FAQ/R-FAQ.html.
5. Makhorin, A. (2006) GLPKhttp://www.gnu.org/software/glpk/glpk.html.
(GNU Linear Programming Kit),
6. Nguyen, M.-T. & Dunn, M. (2009) Some Methods for Scenario Analysis in DefenceStrategic Planning, Technical Report Series DSTO-TR-2242, Defence Science andTechnology Organisation, Australia.
7. Nicholson, J. A. (2005) Scenario based planning and strategic risk managementapplied to the defence environment, in Proceedings ofthe Land Warfare Conference, GoldCoast, Australia.
8. Rhyne, R. (1974) Technological forecasting within alternative whole futuresprojections, Technological Forecasting and Social Change 6, 133-162.
9. Rhyne, R. (1981) Whole-Pattern Futures Projection, Using Field Anomaly Relaxation,Technological Forecasting and Social Change 19,331-360.
10. Rhyne, R. (1995) Field anomaly relaxation: the art of usage, Futures 27, 657-674.
11. Sarin, R. K. (1978) A sequential approach to cross impact analysis, Futures 10, 53-62.
12. Sarin, R. K. (1979) An approach for long-term forecasting with an application to solarelectric energy, Management Science 25, 543-554.
13. Stephens, A. K. (2006) Future Urban States: a Field Anomaly Relaxation Study, TechnicalReport Series DSTO-TR-1910, Defence Science and Technology Organisation,Australia.
14. Sun Microsystems & CollabNet (2008) NetBeans IDE 6.0, http://wwwnetbeans.org.
15. Tri, N., Boswell, S. & Dortmans, P. (2004) Developing Possible Future Contexts usingthe Field Anomaly Relaxation Process, Technical Report Series DSTO-TN-0604, DefenceScience and Technology Organisation, Australia.
16. von Reibnitz, U. (1985) Scenario Techniques, McGraw Hill, New York, USA.
17. ZWicky, F. (1967) Discovery, Invention, Research through the Morphological Approach,Macmillan, New York, USA.
24

Page classification: UNCLASSIFIED
DEFENCE SCIENCE AND TECHNOLOGY ORGANISATION 1. CAVEAT/PRIVACY MARKING
DOCUMENT CONTROL DATA
2. TITLE 3. SECURITY CLASSIFICATION
The Scenario Analysis Tool Suite: A User's Document (U)Guide Title (U)
Abstract (U)4. AUTHORS 5. CORPORATE AUTHOR
Cigdem Dilek Defence Science and Technology OrganisationFairbairn Business Park,Department of Defence, Canberra, ACT 2600.
6a. DSTO NUMBER 16b. AR NUMBER 6c. TYPE OF REPORT 17. DOCUMENT DATE
DSTo-GD-0560 AR 014-360 General Document January 20098. FILE NUMBER 9. TASK NUMBER 10. SPONSOR 11. No OF PAGES 12. No OF REFS
2008/1041544/1 07/064 Strategic Policy 24 17(Branch)
13. URL OF ELECTRONIC VERSION 14. RELEASE AUTHORITY
http:/ / www.dsto.defence.gov.au/corporate / Chief, Joint Operations Divisionreports /DSTO-GD-0560.pdf
15. SECONDARY RELEASE STATEMENT OF THIS DOCUMENT
Approved For Public Release
OVERSEAS ENQUIRIES OUTSIDE STATED LIMITATIONS SHOULD BE REFERRED 1HROUGH DOCUMENT EXCHANGE, PO BOX 1500, EDINBURGH, SOUTH AUSTRALIA 5111
16. DELIBERATE ANNOUNCEMENT
No Limitations17. CITATION IN OTHER DOCUMENTS
No Limitations18. DSTO RESEARCH LIBRARY THESAURUS
Strategic Analysis!Scenario!Operations Research!Application Software!Java!Department of Defence (Australia)19. ABSTRACT
This document is a user guide for the software product! the Scenario Analysis Tool Suite (version 1.5).The tool suite implements several scenario analysis techniques! Morphological analysis! FieldAnomaly Relaxation analysis! Battelle approach! Bayesian approach! as well as an extended approachof combining methods. Thus the tool provides the opportunity to compare these techniques using aspecific strategic question and provides computer support for the new combined technique.
Page classification: UNCLASSIFIED