the role of the export of tropical moisture into ...sbf1/papers/krichak2014.pdf · original paper...
TRANSCRIPT

ORIGINAL PAPER
The role of the export of tropical moistureinto midlatitudes for extreme precipitation eventsin the Mediterranean region
Simon O. Krichak & Joseph Barkan &
Joseph S. Breitgand & Silvio Gualdi & Steven B. Feldstein
Received: 11 November 2013 /Accepted: 23 July 2014# Springer-Verlag Wien 2014
Abstract The aims of the study are twofold: firstly, toinvestigate the role of the export of humid tropical airin the formation of cool season heavy precipitatingevents (HPEs) in the Mediterranean region (MR); andsecondly, to examine the possible linkage between theexport of humid tropical air and the multiyear trend inextreme precipitation in the region. For this purpose, weanalyze the spatial distributions of a number of keyatmospheric variables with a reanalysis data for morethan 50 intense HPEs for the MR. The results of thisevaluation for both individual and composite eventssuggest that the HPEs are associated with atmosphericrivers (ARs). The MR HPEs are being characterized bythe poleward export of humid air of tropical origin intothe midlatitude MR from the Atlantic Ocean andArabian Sea. These export events appear to be associ-ated with the effects of hurricanes or intense cyclones inthe North Atlantic. It was also found that the lineartrend (for 1979–2013) of the frequency of humid days(days with precipitable water greater than 20 kg m−2) isconsistent with recent changes in the character of pre-cipitation over the MR and southern Europe.
1 Introduction
TheMediterranean region (MR) is characterized by the remark-able occurrence of synoptic events with exceptionally intenserainfall (heavy precipitating events; HPEs) during thebaroclinically active cool season (Lionello et al. 2006).Among the HPEs are synoptic cases such as those ofNovember 4 1966, with up to 750 mm in 24 h in Florence,Italy (De Zolt et al. 2006; Malguzzi et al. 2006); 3–4 November1987, with 817 mm of rain in 24 h in Gandía (eastern Spain,province of Valencia) (Romero et al. 2000); 15 November 1985with more than 200 mm of rain in 2 h in the Balearic Islands(Ramis et al. 1986; Romero et al. 1998); 9 October 1994 with450 mm in 24 h in the province of Valencia, Spain (Ramis et al.1998); 1–6 November 1994 with more than 300 mm in 36 h inEgypt, Israel, and northern Italy (Buzzi et al. 1998; Jansa et al.2000); 4 December 2001 with greater than 260 mm of rainfallin less than 24 h in Israel (e.g., Krichak et al. 2004); 4–6December 2002 with more than 230 mm in 24 h in theAntalya region of southeastern Turkey (Kotroni et al. 2006);and many other extreme events (e.g., Ramis and Llasat 1994;Doswell et al. 1998; Romero et al. 1999, 2000; Homar et al.2007; Ramis et al. 2009; Buzzi et al. 2013). The precipitationintensities are far in excess of an ordinary heavyMR rain event,defined as a day with 60 mm of rain (Lionello et al. 2006).These extreme precipitation amounts allude the possibility thatmoist air from other regions may be playing a role.
A number of research projects have been devoted towardattaining a better understanding of the physical mechanismsresponsible for the formation of the extreme weather events.Among these projects are the Mediterranean Experiment(MEDEX, Jansa et al. 2000, 2014) and Hydrological cycle inthe Mediterranean Experiment (HyMEX, Ducrocq et al. 2013).A number of local physical factors affecting the development ofHPEs in the MR have been identified (e.g., Lionello et al. 2006;Reale and Lionello 2013). In particular, these events typically
S. O. Krichak (*) : J. Barkan : J. S. BreitgandDepartment of Geophysics and Planetary Sciences, Raymond andBeverly Sackler Faculty of Exact Sciences, Tel Aviv University, TelAviv, Israele-mail: [email protected]
S. GualdiIstituto Nazionale di Geofisica e Vulcanologia (INGV), CentroEuro-Mediterraneo per i Cambiamenti Climatici (CMCC), Bologna,Italy
S. B. FeldsteinDepartment of Meteorology, The Pennsylvania State University,University Park, USA
Theor Appl ClimatolDOI 10.1007/s00704-014-1244-6

develop during synoptic periods characterized by a trough–ridgepattern at the surface and a diffluent flow in the mid-troposphere(Kahana et al. 2002, 2004; Krichak et al. 2012; Ricard et al.2012). More intense and longer lasting HPEs seem to be char-acterized by higher values of convective available potentialenergy (CAPE), a more intense inflow of moist air, and a morehumid troposphere (e.g., Krichak et al. 2012). Mid-troposphericdynamics and potential vorticity (PV) streamers in the uppertroposphere (Massacand et al. 1998) have been also found tobe important for generating extreme events with hazardousweather in the MR. An important role from local topographyhas also been shown (e.g., Alpert et al. 1996; Jansa et al. 2000;Romero et al. 2000; Rebora et al. 2013).
Numerous studies have also been performed to determinethe moisture sources for the extreme precipitation events(Krichak and Alpert 1998; Turato et al. 2004; Winschallet al. 2012, 2014). During many HPEs, a role for evaporationfrom the Mediterranean Sea has been identified (Turato et al.2004). Trajectory analyses for the most extreme MR HPEsfind an essential source of moisture (Turato et al. 2004; Pintoet al. 2001, 2014; Winschall et al. 2012, 2014) from theevaporation over remote areas over the North AtlanticOcean. An importance of humid air originating from thetropical Atlantic and Indian oceans and tropical Africa in theformation of several extraordinary heavy precipitation MRevents has been also revealed (Krichak and Alpert 1998;Krichak et al. 2004, 2006; Rubin et al. 2007).
Realization of further analyses of the role of the factorappears timely. Additional research efforts also seem neces-sary for a better understanding of the mechanisms responsiblefor the precipitation intensity during HPEs. Midlatitudestorms that obtain their moisture from the tropics are in somecases characterized by a strongly confluent flow ahead of apolar cold front, which concentrates the water vapor intonarrow plumes (atmospheric rivers, AR) that are part of thebroader warm conveyor belts (Carlson 1980) associated withextratropical cyclones (Zhu and Newell 1998; Ralph et al.2004; Ralph and Dettinger 2011). ARs over the ocean aretypically (Lavers et al. 2011; Ralph and Dettinger 2011) long(2,000–3,000 km) and narrow (a width of 400–1,000 km)plumes with high values of precipitable water (PW) (greaterthan 20 kg m−2) with a strong southerly wind component(greater than 12.5 m s−1) in the lower troposphere (2–3 km).
The AR plumes form within a broader region of generallypoleward heat transport in the warm sector. ARs have beenfound to be responsible for more than 90 % of the totalpoleward atmospheric water vapor transport through themiddlelatitudes (Ralph and Dettinger 2011). When landfall takesplace, the ARs are often characterized by the most intenseHPEs occurring over coastal mountains. The mechanism ap-pears to be also playing a role in the formation of theMRHPEs.
The aims of the current study are twofold: firstly, to inves-tigate the role of the export of humid tropical air in the
formation of cool season HPEs in the MR; and secondly, toexamine the possible linkage between the export of humidtropical air and the multiyear trend in extreme precipitation inthe MR and Europe.
The paper is organized into six sections. The description ofthe data and methodology used are given in Section 2. Adiscussion of four MR HPEs is presented in Section 3. Ananalysis of the composite synoptic patterns that characterizeHPEs over different parts of theMR is performed in Section 4.An evaluation of the role of the export of humid air from thetropics in the multiyear trend of extreme precipitation in theMR is presented in Section 5. A summary and discussion ofthe findings are given in Section 6.
2 Data and methodology used
The daily data to be evaluated includes sea level pressure(SLP), 500-hPa geopotential height (H-500), precipitable wa-ter (PW), as well as the zonal and meridional wind vectorcomponents, and specific humidity from the National Centersfor Environmental Prediction (NCEP)–National Center forAtmospheric Research (NCAR) reanalysis project (referredto as NNRP) (Kalnay et al. 1996). The NNRP data are avail-able for the entire globe with a 2.5°×2.5° spatial resolution.The NNRP data assimilation system includes 28 levels with T-62 horizontal resolution. Data confined to the cool season’smonths (September–May, rainy season in the MR) are used.
Although the application of gridded data from reanalysesfor climate investigations has become widely accepted, thereare significant limitations to the data because of importantchanges in the global observational system during the secondhalf of the twentieth century, as well as regional globalwarming trends in temperature, water vapor, kinetic energy,and so on. Nevertheless, for the investigation of short timescale synoptic events as well as for frequency evaluations(e.g., Krichak et al. 2013), these limitations are less relevant.Following the methodology tested by Krichak et al. (2012),the CAPE data used (computed for the most unstable parcel inthe lower troposphere) are from the 20th Century Reanalysis(20CR, Compo et al. 2011), which is based on a more homo-geneous data, than is the NNRP.
Analyses of the spatial distributions of several atmosphericvariables, namely SLP, H-500, PW, vertically integrated mois-ture flux convergence (VIMFC) between 1000 and 700 hPa,CAPE, and the vertically integrated meridional moisture fluxbetween 1000 and 700 hPa (VIMF), are performed in thefollowing. The VIMFC and VIMF are calculated in accor-dance with the following definitions:
VIMFC ¼ −1
g
Z 700 hPa
1000 hPa
∂uq∂x
þ ∂vq∂y
� �dp;VIMF ¼ −
1
g
Z 700 hPa
1000 hPaqvdp:
S.O. Krichak et al.

Here q is the specific humidity, g is the gravitational acceler-ation, and p is the air pressure. The values of VIMFC areexpressed in units of 10−5 kgm−2 s−1, VIMF in units of kilogramsper meter per second, CAPE in units of joules per kilogram, andPW in units of kilograms per square meter. Values of SLP and H-500 are expressed in hectopascals and geopotential decameters,respectively, and the wind components in meters per second.
Following earlier studies (e.g., Ralph et al. 2004; vanZomeren and van Delden 2007; Ricard et al. 2012) and takinginto account the coarse spatial resolution of the reanalysis datain this study, an AR is defined as taking place when threeconditions are satisfied—elevated values (above 20 kgm−2) ofPW, values of VIMFC greater than 50 10−5 kg m−2 s−1, and aVIMF greater than 50 kg m−1 s−1.
For the current analysis, an earlier compiled MEDEX set ofthe MR HPEs has been updated based on the results fromadditional publications. The final set used here contains about100 HPEs which took place in the MR during 1962–2007. Thedata adopted here are examined in five separate subregions overthe MR (Fig 1), broadly representing (A1) - the IberianPeninsula, (A2) - southern Europe and the Balearic andTyrrhenian Seas, (A3) - the Balkan Peninsula, (A4) - theBlack Sea and Turkey, and (A5) – the southeastern MR.In accordance with the focus of the analysis, for each subre-gion, we use data for ten precipitation events (Table 1) with thehighest values of the area-averaged vertically integrated south-erly moisture flux in the 1000–700-hPa layer.
The advanced Hybrid Single-Particle Lagrangian IntegratedTrajectory (HYSPLIT) system, of the National Oceanic andAtmospheric Administration/Air Resources Laboratory(NOAA/ARL), is applied here for a three-dimensional back-ward trajectory calculation (Draxler andRolph 2013) to trace theair mass transport prior to its arrival in the MR. The system uses
previously gridded meteorological data to calculate the trajecto-ries, according to a Lagrangian approach. The advection of aparticle is computed from the average of the three-dimensionalvelocity vectors for its initial and the first guess position at eachtime step. The velocity vectors are linearly interpolated in bothspace and time. The trajectories discussed below are based onthe three-dimensional wind vector components from the NNRP.The time period of the trajectory calculations (12 days) is chosento be long enough to identify the origin of the air masses.
We also use the data on precipitation fraction due to verywet days, i.e., the number of days per season that the dailyprecipitation amounts exceed the 95th percentile (referred toas R95pTOT) and their multiyear trends during 1979–2013over Europe and significant parts of the Mediterranean regionfrom the data archive of the European Climate Assessment &Dataset project (ECA). The data archive (Klein Tank andKoennen 2003; Klok and Klein Tank 2009) (http://eca.knmi.nl/) is based on daily observational data from more than 700stations provided by 62 meteorological services and researchinstitutions that passed homogeneity tests. Analyzing thespatial distribution of precipitation fraction data associatedwith very wet days appears to be helpful for understandingthe physical mechanisms that drive the recent trends inextreme precipitation over Europe (e.g., Krichak et al. 2013).
The R95pTOT trends in the ECA data (in %) are comparedwith the corresponding trends (based on the NNRP data for theabove time period) in the frequency of days with PW valuesgreater than 20 kg m−2 for September–November, December–February, and March–May (in the following referred to ashumid days, HDs). In this evaluation, the criterion is adoptedfollowing Ralph et al. (2004) as a proxy for the identification ofthose grid points that have features that are appropriate for theformation of ARs. Statistical significance of the trends is
Fig. 1 The Mediterranean region. Subregions used in the analysis. FullMediterranean (24–50 N, 15W–45 E); A1 = Iberian Peninsula (36–48 N,15–0 W), A2 = Southern France–Balearic and Tyrrhenian Seas–Bay of
Genoa (36–48 N, 0–15 E), A3 = Adriatic Sea–Greece (36–48 N, 15–30E); A4 = Turkey–Black Sea–Northeastern Mediterranean (36–48 N, 30–45 E); A5 = Southeastern Mediterranean (24–36 N, 23–38 E)
Role of tropical moisture exports for the Mediterranean HPEs

evaluated with theMann–Kendall trend test with the number ofdegrees of freedom corresponding to the number of years.
3 Evaluation of individual synoptic events
In this section, we revisit four well-investigated events that arecharacterized by HPEs in different parts of the MR (4November 1966, 3 November 1987, 4 December 2001, and4 December 2002; each of these cases was briefly addressed inSection 1) to demonstrate the role of humid air transport fromremote areas. The choice of these cases was motivated by theextreme intensity of precipitation during these events.
It is interesting to note that each of these cool MR seasonHPEs took place during periods characterized by intense hurri-canes or deep Atlantic storms. The most aggressive MR HPEsmay be seen as a later stage in a process starting from theformation of the Atlantic storm. Indeed, the HPE of 4November 1966 in Italy took place during the lifetime (4–14November) of hurricane Lois (Sagg 1967) which was registeredas a tropical depression on 4 November (but apparently existedeven earlier as a weaker vortex) while located east-southeast ofBermuda (32.3 N, 64.8 W) and dissipated 10 days later a fewhundredmiles offshore Portugal. The HPE of 3 November 1987in Spain developed at the end of the life span of Atlantic tropicaldepression number 14 (Case and Gerrosh 1988). This systemformed on 31 October in the western Caribbean. On November4, the depression merged with a weak extratropical cyclone overnorthern Florida and accelerated toward the northeast.
The HPE of 4 December 2001 in Israel formed during theperiod of hurricane Olga. This hurricane was of a nontropicalorigin (Avila 2001). It formed on 24 November in the NorthAtlantic (29 N, 50 W) as a tropical storm. Olga became ahurricane by 26 November (32.3 N, 55.9 W). Moving north-ward, it weakened (30 November) to tropical depression status(26.9 N, 62.6 W), again regained tropical storm status on 2December, and finally dissipating on 5 December. The
poleward export of moist air toward Newfoundland andLabrador Sea (including intense convection) in the formationof the 4–5 December 2001 HPE in Israel has been shown(Krichak et al. 2004, 2006). For this event, they showed thatthe HPE corresponded to the final stage in a chain of extremeweather events which started from an acceleration of a coherenttropopause disturbance (CTD) over the Labrador Sea. Twobranches of this event, southern and northern, have been iden-tified. The southern branch was associated with the strengthen-ing of the subtropical jet stream, which affected the HPE in thesoutheastern MR. The northern branch was characterized by aneastward drift of the CTD, moist air transport from the hurri-cane to the North Atlantic and the European–Mediterraneanregion, a strengthening of the Icelandic Low, and the formationof an upper tropospheric potential vorticity streamer over west-ern Scandinavia. The displacement of the streamer to the MRplayed a major role in the development of a powerful cycloneover the northeasternMR as well as the formation of a so-calledRed Sea Trough (RST) system (e.g., Tsvieli and Zangvil 2005)over the Arabian Peninsula and northeast Africa.
The HPE of 5 December 2002 in Turkey developed duringthe period of a North Atlantic storm (Bancroft 2003) (4–6December) that was characterized by the development of adeep cyclone off the Newfoundland coast, which formed onNovember 30. On December 4, the storm had a central pres-sure 944 hPa (62 N, 36 W). This resulted in the system beingthe deepest for the 6-month period in the North Atlantic.
The existence of very intense synoptic development in theNorth Atlantic appears to be critically important for understand-ing the mechanisms responsible for the extraordinary amountsof precipitation during the four MR HPEs. To demonstrate thisissue, we present maps of the spatial distribution of SLP andPW (Fig. 2a–d), H-500 and CAPE (Fig. 3a–d), as well as thosefor the meridional components of the VIMF and VIMFCtogether with the 850-hPa winds (Fig. 4a–d). The results froma computation of the 12-day backward air mass trajectories forthe four HPEs are presented in Figs. 5, 6, 7, and 8.
Table 1 Highly precipitating events in the subregions A1–A5 during 1962–2007 characterized by highest values of subregion area-averaged verticallyintegrated southerly moisture flux in the 1000–700-hPa layer
A1 A2 A3 A4 A5
1 20 October 1982 09 November 1971 21 December 1962 20 November 1994 10 December 1964
2 15 November 1985 11 January 1987 07 December 1966 21 January 1980 12 December 1984
3 03 November 1987 18 January 1987 05 February 1978 01 March 1984 03 December 1991
4 03 October 1987 09 December 1992 05 December 1978 04 March 1987 01 January 1992
5 08 October 1992 06 October 1996 17 January 1981 20 November 2001 15 December 1992
6 20 October 1992 10 January 1997 27 March 1993 20 January 2003 07 February 1995
7 31 January 1993 08 November 2001 22 February 1997 10 January 2004 27 January 2000
8 04 November 1997 14 November 2001 26 March 1998 16 November 2004 04 December 2001
9 21 November 2000 10 December 2003 13 October 1998 19 October 2006 13 October 2004
10 09 November 2001 02 November 2004 23 December 2003 11 November 2007 07 December 2004
S.O. Krichak et al.

3.1 HPE in Italy on 4 November 1966
Figure 2a is characterized by an anticyclone (SLP above1,030 hPa) centered north of the Black Sea, a low level depres-sion with the lowest SLP values near 995 hPa over the southernAlps, and an elongated narrow zonewith high PWvalues (above30 kg m−2) extending northward in the warm sector of thecyclone. Although one of the source areas for the high PW zoneappears to be over tropical Africa (see also Fig. 5, which showsthe trajectories reaching the HPE location at 1,500 and 2,000 mabove ground level), the main area from where the air moisturewas transported during the previous days is located over thetropical Atlantic (20 N, 30 W), where extremely high (35–40 kg m−2) PW values are observed. Figure 3a shows an upperlevel trough over Europe and the Mediterranean with a diffluentupper level southwesterly flow favoring upward motions overItaly. The trough is positioned to the west of the main low leveldepression over the southern Alps. The area south of Italy is alsocharacterized by high (~1,200 J kg−1) values of CAPE.
The patterns of VIMF, VIMFC, and the wind vector com-ponents at 850 hPa (Fig. 4a) indicate a narrow elongated zone
with large values of the southerly component of VIMF andVIMFC in the lowest 300-hPa layer of the atmosphere (ap-proximately 500 kg m−1 s−1 and 550 10−5 kg m−2 s−1, respec-tively), which extends from south of the Sahara into the MRand farther northward into Europe.
The high PW, CAPE, VIMF, and VIMFC values over Italyallow for the identification of an AR. Consistently, the resultsof the backward trajectory calculation (Fig. 5) for this eventsuggest that the origin of the humid air is from the central andeastern tropical North Atlantic.
3.2 HPE in southeastern Spain on 3 November 1987
According to Fig. 2b, this synoptic event is characterized by acyclone (1,005 hPa) centered over the northeastern Atlantic tothe southwest of Spain (45 N, 11 W), an anticyclone (maxi-mum SLP of 1,030 hPa) extending from eastern Europe to thenortheastern Atlantic, and a large area with high (above30 kg m−2) PW values reaching from southern France to thenorthern part of the Iberian Peninsula. A large area over thenortheastern Atlantic off the northwest coast of Africa is also
Fig. 2 Sea level pressure (SLP) contours [hPa] (dash) (contours every 5 hPa); PW [kg m−2] (every 5 kg m−2, after 15 kg m-2, shaded): a 06:00 UTC 4November 1966, b 06:00 UTC 3 November 1987, c 06:00 UTC 4 December 2001, and d 06:00 UTC 4 December 2002
Role of tropical moisture exports for the Mediterranean HPEs

characterized by high amounts of PW (up to 30–40 kg m−2).The location of the troughs at H-500 (Fig. 3b) and SLP(Fig. 2b) indicates a nearly equivalent barotropic verticalstructure, allowing for conditions with persistent deep con-vection in the region.
Elevated CAPE values (~500 J kg−1) can be seen overnorthwestern Africa, the western MR, as well as the IberianPeninsula (Fig. 3b). The pattern in Fig. 4b shows highVIMFCvalues over the same region (above the 300 10−5 kg m−2 s−1),with the largest VIMF occurring over Spain. The results ofbackward trajectory calculations (Fig. 6) show an air massintrusion to the HPE region over southeastern Spain from thesubtropical northeastern Atlantic Ocean (reaching the locationat 1,500 m) and the tropical eastern Atlantic–western Africa(at 2,000 m), the latter being the region characterized byextreme PW values (Fig. 2b).
As in the case discussed above, the event of 3 November1987 is characterized by an intense intrusion of humid airfrom tropical North Atlantic as well as the presence of elevat-ed values of CAPE, as well as high PW, VIMF, and VIMFCvalues over Spain which may be indicating the presence of anAR.
3.3 HPE in Israel of 4 December 2001
The synoptic event is characterized by a narrow SLP troughlocated over the Arabian Peninsula (Fig. 2c), a H-500 trough(552 gpdm) centered over the eastern MR that produces aninflux of cold air into the region (Fig. 3c), an elongated zonewith large values of CAPE (~450 J kg−1) over the southeasternMR, and an inflow of high amounts of humid air from thePersian Gulf area (i.e., originating from the Arabian Sea) intothe eastern Mediterranean (Fig. 4c). In Fig. 4c, the elevatedvalues of VIMF (greater than 200 kg m−1 s−1) and VIMFC(greater than 300 10−5 kg m−2 s−1) are concentrated intonarrow zones and found over the Arabian Peninsula and theeastern MR, respectively.
Again, this synoptic event is characterized by an intenseintrusion of humid air into the region. The results of thetrajectory analysis (Fig. 7) show that an air mass from thenorthwestern Atlantic acts as the source region for this easternMR HPE. The trajectory is in agreement with Krichak et al.(2004), according to which warm humid air collected byhurricane Olga significantly contributed to the MR HPE ofDecember 2001. Another backward trajectory in Fig. 7
Fig. 3 As in Fig. 2, but for CAPE [J kg−1] (shaded) and H-500 [contour (dashed) interval 8 gpdm]
S.O. Krichak et al.

indicates an inflow of air with high PW values which origi-nated from a location near the Persian Gulf. As before, thepeculiarities allow for the identification of AR conditions inthe 4 December 2001 MR HPE.
3.4 HPE in Southern Turkey on 5 December 2002
The synoptic situation during this event is characterized by asurface cyclone (1005 hPa) centered over southern Italy(Fig. 2d). A meridionally oriented high pressure region(1035 hPa) is found in Fig. 2d to the east of the CaspianSea. A second subtropical high (1030 hPa) is located overthe northeastern Atlantic. This event is characterized by alarge elongated zone with very high PW values (above35 kg m−2) over the central North Atlantic. The cyclonelocated over the central Mediterranean, as well as the regionover western Turkey, is also characterized by high PW values(25–30 kg m−2) (Fig. 2d). Figure 3d shows an upper leveltrough extending over western Europe and the centralMediterranean with a diffluent upper level southwesterly flowfavoring upward motion over coastal Turkey. The trough ispositioned over the main low level depression found in
Fig. 2d. We also note that the northern and central parts ofthe MR are characterized by an elongated zone (Fig. 3d) withlarge (above 400 J kg−1) values of CAPE. In Fig. 4d, anelongated region with elevated values of VIMFC (greater than300 10−5 kg m−2 s−1) and very high values of VIMF (greaterthan 700 kg m−1 s−1), together with the wind vectors, suggeststhe presence of an AR over the northeastern Atlantic Ocean.Another area with elevated values of VIMF (above100 kg m−1 s−1) and VIMFC (200 10−5 kg m−2 s−1) is alsofound extending from the Arabian Peninsula to the centralMR. The results of a trajectory calculation (Fig. 8) indicate alower troposphere influx of air from areas with high PWvalues over the North Atlantic (along the north African coast)and southern Europe (Fig. 2d). The trajectories also show aninflux of air from the Red Sea. We conclude that the locationof the troughs and the lower troposphere wind field as well asthe region with high values (Fig. 2d) of PW (above20 kg m−2), CAPE, VIMF (over 200 kg m−1 s−1), andVIMFC (above 100 units) located to the southeast of theMR allow us to also suggest that an AR (although quite shortin length ~1,000 km) played an important role in theDecember 5, 2002 HPE.
Fig. 4 As in Fig. 2, but for VIMF (contours every 100 kg m−1 s−1), VIMFC (shaded, see shading intervals in the corresponding legends)[10−5 kg m−2 s−1] (only positive values are plotted) and wind vectors (m s−1) on the 850-hPa isobaric surface
Role of tropical moisture exports for the Mediterranean HPEs

It may be summarized that each of the cases considered wascharacterized by the atmospheric conditions appropriate for theformation of ARs. Although the analysis does not allow for afull understanding of the action of the heavy storms in theAtlantic on the air mass transport into the MR, the overall role
of the humid tropical air in the MR HPEs seems evident. Thepresence of the humid air of tropical oceanic origin during theevents appears to be a major factor for the development of theHPEs in the MR.
Fig. 6 As in Fig. 5, but for 0600 03November 1987 at 39.47 N, 00.38W
Fig. 7 As in Fig. 5, but at 1,000 and 1,500 m AGL and for 0600 04December 2001 at 32.57 N, 34.59 E
Fig. 8 As in Fig. 5, but at 700 and 1,000 m and for 0600 05 December2002 at 36.90 N, 30.68 E
Fig. 5 Twelve-day backward air mass trajectories to the location of theheavy precipitation event at 1,500m (red) and 2,000m (blue) above groundlevel (AGL) on 0600 UTC 04 November 1966 at 43.78 N, 11.25 E
S.O. Krichak et al.

4 Analysis of composite patterns
To attain additional understanding of the role of the export oftropical moisture in the formation of MR HPEs, compositecalculations for the same as above characteristics are per-formed. The analysis is performed separately for the fivesubregions shown in Fig. 1. Due to the similarity betweenthe results for some of the neighboring subregions, we presenthere the results for only three (A1, A2, A5) of the fivesubregions.
4.1 Composites for subregion A1
The patterns for subregion A1 are shown in Fig. 9. A cycloneover the Iberian Peninsula and an anticyclone (1025 hPa) overcentral Europe can be seen at approximately the same loca-tions as those in Fig. 2b for 3 November 1987. Also as inFig. 2b, a zone with high PW values (up to 35 kg m−2 in thetropics and 15 kg m−2 at about 55 N) is found over the NorthAtlantic (Fig. 9a) (15 N–55 N, 20 W–40 W). Another area
with high PW values (above 20 kg m−2) is found over north-western Africa (Fig. 9a).
Also, the composite H-500 pattern (Fig. 9b) for the A1subregion has much in common with that for the 3 November1987 case (Fig. 9b). As in Fig. 3b, a trough is positioned overthe Iberian Peninsula, and a ridge is directed toward the centralMR and western Europe. A narrow zonewith increased values(above 300 J kg−1) of CAPE extends (Fig. 9b) from Africanorthward to the central MR and southeastern IberianPeninsula. Figure 9c shows an elongated, northward directed850-hPa wind field with elevated values of VIMF (above100 kg m−1 s−1) and VIMFC (above 100 units) in the lowertroposphere that extends from northwest Africa to the IberianPeninsula, indicating that this area has a high potential for theoccurrence of ARs.
A second region with even higher VIMF values (up to150 kg m−1 s−1) as well as high values of PW and VIMFCover the midlatitude North Atlantic (50 N, 40 W) shows thelocation of a region (for the A1 HPE situations) where there isan export of humid air with characteristics appropriate for theformation of AR conditions.
Fig. 9 Composite patterns for subregion A1. a Sea level pressure (SLP)contour [hPa] (contours, dash); PW [kg m−2] contours (solid, every10 mm), b H-500 [gpdm] (contours, dashed) (every 10 hPa), CAPE
(shaded) [J kg−1], c VIMFC (shaded [10−5 kg m−2 s−1], only positivevalues are plotted), VIMF [contour, plotted are isolines of 25, 50 and100kg m−1 s−1] and 850-hPa wind vector (m s−1)
Role of tropical moisture exports for the Mediterranean HPEs
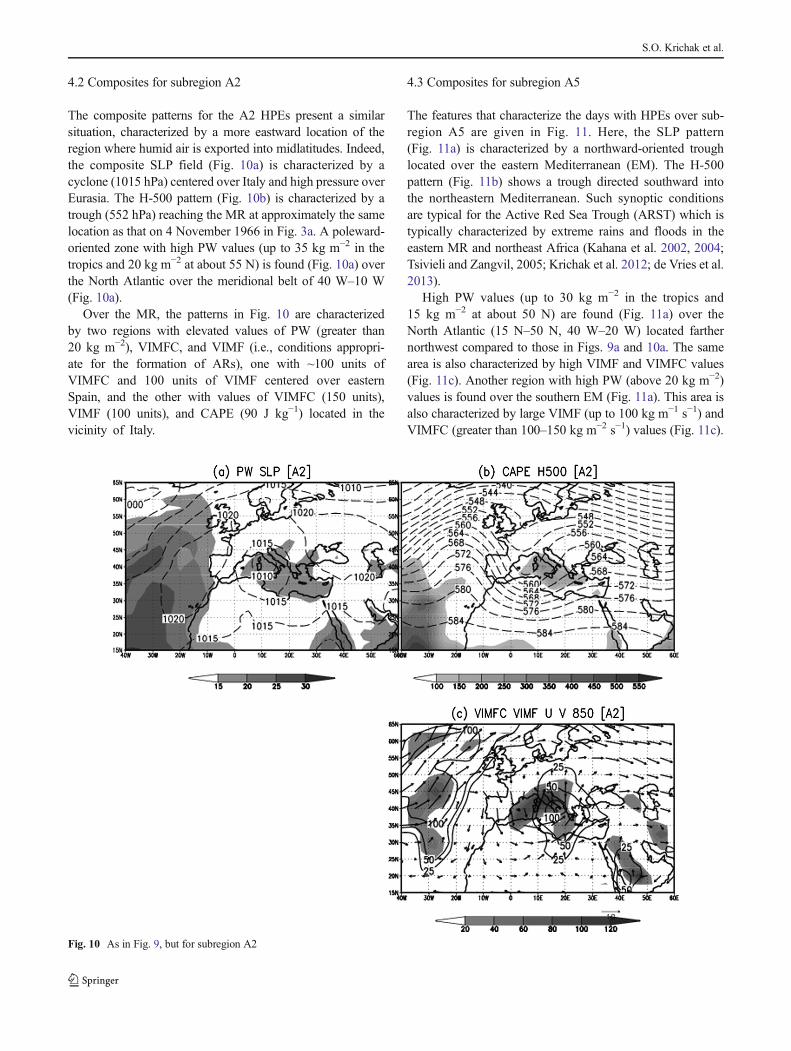
4.2 Composites for subregion A2
The composite patterns for the A2 HPEs present a similarsituation, characterized by a more eastward location of theregion where humid air is exported into midlatitudes. Indeed,the composite SLP field (Fig. 10a) is characterized by acyclone (1015 hPa) centered over Italy and high pressure overEurasia. The H-500 pattern (Fig. 10b) is characterized by atrough (552 hPa) reaching the MR at approximately the samelocation as that on 4 November 1966 in Fig. 3a. A poleward-oriented zone with high PW values (up to 35 kg m−2 in thetropics and 20 kg m−2 at about 55 N) is found (Fig. 10a) overthe North Atlantic over the meridional belt of 40 W–10 W(Fig. 10a).
Over the MR, the patterns in Fig. 10 are characterizedby two regions with elevated values of PW (greater than20 kg m−2), VIMFC, and VIMF (i.e., conditions appropri-ate for the formation of ARs), one with ~100 units ofVIMFC and 100 units of VIMF centered over easternSpain, and the other with values of VIMFC (150 units),VIMF (100 units), and CAPE (90 J kg−1) located in thevicinity of Italy.
4.3 Composites for subregion A5
The features that characterize the days with HPEs over sub-region A5 are given in Fig. 11. Here, the SLP pattern(Fig. 11a) is characterized by a northward-oriented troughlocated over the eastern Mediterranean (EM). The H-500pattern (Fig. 11b) shows a trough directed southward intothe northeastern Mediterranean. Such synoptic conditionsare typical for the Active Red Sea Trough (ARST) which istypically characterized by extreme rains and floods in theeastern MR and northeast Africa (Kahana et al. 2002, 2004;Tsivieli and Zangvil, 2005; Krichak et al. 2012; de Vries et al.2013).
High PW values (up to 30 kg m−2 in the tropics and15 kg m−2 at about 50 N) are found (Fig. 11a) over theNorth Atlantic (15 N–50 N, 40 W–20 W) located farthernorthwest compared to those in Figs. 9a and 10a. The samearea is also characterized by high VIMF and VIMFC values(Fig. 11c). Another region with high PW (above 20 kg m−2)values is found over the southern EM (Fig. 11a). This area isalso characterized by large VIMF (up to 100 kg m−1 s−1) andVIMFC (greater than 100–150 kg m−2 s−1) values (Fig. 11c).
Fig. 10 As in Fig. 9, but for subregion A2
S.O. Krichak et al.

It must be noted that the occurrence of HD conditions at aparticular grid point may not be seen as being sufficient for theformation of HPEs. The concurrent existence of additionalconditions, including intense frontal zones, unstable atmo-spheric conditions, local orographic effects, etc., is necessaryfor the determination of the HPE precipitation amount, local-ization, and timing.
5 Climatology and trends of extreme precipitation
The results of the above analysis suggest that a large fractionof HPEs in southern Europe and theMRmay be developing asa direct consequence of the export of humid (typically oftropical origin) air into the midlatitude MR, taking place overthe North Atlantic Ocean and the Arabian Sea–ArabianPeninsula.
We next analyze the climatology of the poleward export oftropical moisture, by calculating the spatial distribution of themultiyear mean frequency of HDs per season. With this aim,at all grid points, the total number of days where PWexceeds athreshold value of 20 kg m−2 is counted within each season.
This calculation is limited to the last 35 years (1979–2013), atime period which is recognized as being characterized by theeffect of anthropogenic global warming (e.g., Gualdi et al.2013). The linear trends of the frequency of HDs during this35-year time period are also estimated.
The spatial distribution of the frequency of HDs during theSeptember–November (SON), December–February (DJF),and March–May (MAM) seasons are given in Fig. 12a–c,respectively. During SON (Fig. 12a), a very high frequencyof HDs (30 to 80 days) is typical of the oceanic or near-oceanic tropics and midlatitudes in the northeast AtlanticOcean (30 W–20 W, 15 N–55 N) and subtropical east Africa(30 E–60 E, 15 N–30 N). A relatively high frequency of HDs(20–30 days) also characterizes the eastern North Atlanticnear the coastal zone of the Iberian Peninsula. Most of thearea north of 55N lattitude in the Atlantic Ocean as wellaswestern and central Europe and the northern coast ofMediterranean Africa, is characterized by a 2–10 HDs perseason. A lower number of HDs (1–3 days) characterizes theEM and noncoastal areas of northern Africa.
The pattern for DJF (Fig. 12b) resembles that for SON.However, some important differences between SON and DJF
Fig. 11 As in Fig. 9, but for subregion A5
Role of tropical moisture exports for the Mediterranean HPEs

Fig. 12 Multiyear meanfrequency of occurrence of humiddays according to the NNRP datafor 1961–1990: a SON, b DJF, cMAM (contour interval 10 daysseason−1)
Fig. 13 a–c Linear trend in the frequency of occurrence of humid days during 1979–2013 according to the NNRP data (contour interval 0.5 days decade−1)
S.O. Krichak et al.

can be seen. Namely, for DJF, the westernMR is characterizedby a much higher frequency of HDs than during SON. Also, amuch higher frequency of HDs occurs in the eastern MRduring DJF (up to 20 days per season versus less than 10 daysduring SON). The seasonal change alludes to a rise in thecontribution of tropical moisture both in the western andeastern parts of the MR in the formation of HPEs duringwinter. The pattern for MAM (Fig. 12c) is quite different fromthat for DJF and is more similar to that for SON (Fig. 12a).
The linear trend of the HD frequency for 1979–2013 isshown in Fig. 13 (shaded values indicate statistical signifi-cance at p<0.05). For SON (Fig. 13a), much of westernEurope, the western MR, and northwestern Africa were char-acterized by very small trends. In contrast, a region withpositive statistically significant trends (~1 day decade−1) forthe North Atlantic Ocean west of the British Isles can be seen.An elongated zone with positive trend values (~1 day de-cade−1) is found from central Africa to the central MR.Another location with a notable trend (up to 2.3 daysdecade−1) can be seen over the Arabian Sea. The pos-itive trend zones are separated by the areas with anegative HD trend over western Europe (−0.7 day de-cade−1), over the southern part of the easternMediterranean (−0.3 day decade−1), and over CaspianSea (−2 days decade−1).
For DJF (Fig. 13b), there are no statistically significant HDfrequency trends for central and eastern Europe. A narrowzone with positive statistically significant trend values can beseen extending from central Africa to the central
Mediterranean. Small positive statistically significant trendvalues are found for the North Atlantic.
During the MAM season (Fig. 13c), the tropical easternAtlantic–west Africa is characterized by strong (up to 1.7 daysdecade−1) HD frequency trends. Another zone with positivevalues of the trend (0.6 day decade−1) occurs over the centralMR. A zone with small positive trend values over the NorthAtlantic is also present. A large area from tropical east Africato northeastern Africa and the Red Sea basin to the MiddleEast is characterized by negative values of the HD trend (−0.6to −1.0 day decade−1).
To conveniently compare the linear HD trends with theR95pTOT trend values, the region of the study is divided intoten separate subregions (Fig. 14): the E1–E10 subregionsbroadly represent E1—British Isles, E2—Iberian Peninsula,E3—western Scandinavia, E4—western Europe, E5—centralMediterranean, E6—eastern Scandinavia, E7—centralEurope, E8—eastern Mediterranean, E9—northeasternEurope, and E10—eastern Europe. These trends are displayedin the form of histograms (Figs. 15, 16, and 17), for the SON,DJF, and MAM seasons, respectively. In the histograms, eachof the E1–E10 subregions is represented by the R95pTOTdata at the stations with the highest values of statisticalsignificance.
During SON (Fig. 15), the signs of the HD and R95pTOTtrends are in reasonably good agreement. Indeed, positivevalues of the R95pTOT and HD trends characterize all thesubregions except for E1 (British Isles), where negative valuesof the trends are found. These results suggest that there is a
Fig. 14 The region ofevaluation—the E1–E10subregions broadly representE1—British Isles–Europe’sAtlantic coast (44 N–58N, 9W–7E), E2—Iberian Peninsula–northwestern Africa (30 N–44 N,9 W–7 E), E3—westernScandinavia (58 N–72 N, 7 E–23E), E4—western Europe (44 N–58 N, 7 E–23 E), E5—centralMediterranean (30 N–44 N, 7 E–23 E), E6—eastern Scandinavia(58 N–72 N, 23–39 E), E7—central Europe (44 N–58 N, 23–39 E), E8—easternMediterranean (30N–44N, 23 E–39 E), E9—northern easternEurope (58 N–72 N, 39 E–55 E),and E10—eastern Europe (44 N–58 N, 39 E–55 E)
Role of tropical moisture exports for the Mediterranean HPEs

linkage between the trends in HD and those for R95pTOTduring the 35-year time period for most subregions in south-western Europe and the MR. The situation is very differentduring DJF (Fig. 16), when the HD trends in HD in mostsubregions are negligible. During the MAM season (Fig. 17),however, the spatial distribution of the positive and negativeR95pTOT and HD trend values is similar in subregions E1,E2, E4, E5, E8, and E10. This result again suggests a linkagebetween the trend in HD and that in R95pTOT in the BritishIsles, Iberian Peninsula, western Europe, centralMediterranean (positive trends), eastern Mediterranean, andeastern Europe (negative trends).
6 Discussion and conclusion
The results of this study complement our understanding of theorigin of the water vapor participating in heavy precipitationevents in the Mediterranean region.
Our results suggest that the humid air eventuallytransported from the North Atlantic Ocean area into theMediterranean region together with the water vapor evaporat-ed from the surface of the midlatitude North Atlantic (e.g.,Turato et al. 2004; Winschall et al. 2012) may be seen amongthe major factors contributing to the intensity of the cool
season heavy precipitation events in the otherwise relativelydry MR. The export of humid air from the North Atlantic istypical for the occurrence of HPEs in the western MR, where-as the HPEs over the eastern MR are strongly affected by theexport of humid air originating from the Arabian Sea.
This physical mechanism is also playing an important rolein southwestern Europe. Indeed, recent findings (Zolina et al.2009, 2010) show statistically significant trends in precipita-tion in Europe during the last several decades. Availableobservational data indicate that the spatial pattern of thesetrends is rather complex. The total amount of cool seasonprecipitation in Europe has increased over the north, andespecially over the northwest, and it has declined over a largefraction of southern Europe (Reale and Lionello 2013). Overmuch of Europe (Zolina et al. 2010), wet periods have under-gone a 15–20 % increase in duration during 1950–2008 andare now characterized by more abundant precipitation.Furthermore, the results from large-scale evaluations are alsosupported by regional studies (Frei et al. 2000; Zolina et al.2008; Lionello et al. 2006). The spatial patterns of theR95pTOT trends from the ECA archive (http://eca.knmi.nl/)also support this conclusion.
The results of the current investigation suggest that themulti-year trends in extreme precipitation over southernEurope during the last 35 years may at least partly be ex-plained by the trends in the frequency of the events character-ized by the exports of humid air from tropical intomidlatitudes in the Atlantic. Based on data for a large numberof HPEs in the MR, we show that days with torrential precip-itation during the cool season are typically characterized bythe establishment of humid atmospheric conditions character-ized by extreme values (the threshold value used is PW greaterthan 20 kg m−2) in or near to the MR, with the air moisturetypically originating from the tropical Atlantic Ocean andArabian Sea. The export of the humid air from the tropicstypically takes place during intense synoptic developments inthe North Atlantic. We show that this humid tropical air whichcontributes to the development of the MR HPEs is organizedinto atmospheric rivers often characterized by high values ofPW, VIMF, and VIMFC, with a relatively short length scale.
Fig. 15 Histograms with the linear 1979–2013 least square trends forSeptember–November in R95pTOT (%decade−1) (light gray) and innumber of HDs (days decade−1) (dark gray) for stations representingsubregions E1–E10
Fig. 16 As in Fig. 15, but for DJF
Fig. 17 As in Fig. 15, but for MAM
S.O. Krichak et al.

The results of this study provide evidence of a positivetrend in the frequency of HDs over the North Atlantic (northof 50 N) during 1979–2013, particularly during SON. Itappears to be of a special interest that this study reveals theexistence of a narrow zone with positive values in the fre-quency of HDs over western Africa. This result appears to bein support of recent findings (Rubin et al. 2007) on the role oftropical plumes over Africa in extreme precipitation over theMR. Our analysis also reveals a zone with a negative HDfrequency trend over northeastern Africa and the Middle East.This suggests a possible explanation for a drop in the numberof days with Red Sea Troughs after 1997 (Alpert et al. 2004),due to the decline in the export of humid tropical air originat-ing from the Arabian Sea, which could be a consequence ofthe rise of the frequency of such events over the NorthAtlantic.
The HD trends detected may be possibly associated withthe diminishing Arctic sea ice cover during the same 1979–2013 time period found in the observational data (e.g., Barnes2013) as well as from climate model simulations (e.g., Gualdiet al. 2013). Indeed, recent studies suggest a role for Arctic icemelting in increased winter snowfall in large parts of NorthAmerica, Europe, and eastern Asia (Liu et al. 2012) andenhanced poleward moisture transport (Scoccimarro et al.2012; Zhang et al. 2013) during recent decades. These chang-es in Arctic sea ice could play a role in the rise in the frequencyand intensity of the intrusions of humid tropical air intomidlatitudes. Although the physical mechanisms involvedare not fully understood (Barnes 2013), such a hypothesisappears plausible. Additional investigation of this issue isnecessary.
Assuming a continuation of the recent past climate trend,our results suggests a possible further rise in the frequency ofcool season extreme precipitation over the central MR alongwith a northward expanse and further decline in extremeprecipitation over northeastern Africa and the eastern MR.
Acknowledgments The financial support for this work has been pro-vided by The United States-Israel Binational Science Foundation (BSF)under research grant no. 2008436, the United States National ScienceFoundation (NSF) under grants AGS-1036858 and AGS-1401220, Re-search Grant 4500568707 for 2011–2013 by the Israeli Water Authorityof the Ministry of Infrastructures, and the European Union Sixth Frame-work programme project Climate Change and Impact Research: Medi-terranean Environment (CIRCE) [www.circeproject.eu] under contractGOCE-036961. This work is also a contribution to the HydrologicalCycle inMediterranean Experiment (HyMex) and The Northern EurasianEarth Science Partnership Initiative (NEESPI). One of the authors (SG)thanks the projects GEMINA and NextData funded by the Italian Minis-tries of University and Research (MIUR) and of Environment (MATT).Discussions supported through the European Cooperation in Science andTechnology (COST) Earth System Science and Environmental Manage-ment (ESSEM) Action ES0905 “Basic concepts for convection parame-terization in weather forecast and climate models” and the WMOMEDEX and European Science Foundation MedClivar programs arealso acknowledged. Additionally, the authors gratefully acknowledge
the NOAA Air Resources Laboratory (ARL) for the provision of theHYSPLIT transport and dispersionmodel and/or READYwebsite (http://www.ready.noaa.gov) used in this publication. Finally, we acknowledgethe use of the NCEPReanalysis data provided by the NOAA/OAR/ESRLPSD, Boulder, Colorado, USA from their website at http://www.esrl.noaa.gov/psd/; of the data from the 20th Century Reanalysis from thewebsite http://www.esrl.noaa.gov/psd/data/20thC_Rean/; as well as theuse of the maps of indices of precipitation extremes and their multiyeartrends during the twentieth century over the European region available atthe website (http://eca.knmi.nl/) of the European Climate Assessment &Dataset project (ECA). The authors thank two anonymous reviewers fortheir insightful comments.
References
Alpert P, Tsidulko M, Krichak SO, Stein U (1996) A multi-stage evolu-tion of an ALPEX cyclone. Tellus 1996(48A):209–220
Alpert P, Osetinsky I, Ziv B, Shafir H (2004) Semi-objective classifica-tion for daily synoptic systems: application to the easternMediterranean climate change. Int J Climatol 24:1001–1011
Avila LA (2001) Hurricane Olga, 24 November–4 December 2001.Tropical cyclone report. [Available online at http://www.nhc.noaa.gov/2001olga.html]
Bancroft GP (2003) Marine weather review—North Atlantic AreaSeptember 2002 to February 2003, Mariners Wea. Log, NOAA,47, 1, 8 pp
Barnes EA (2013) Revisiting the evidence linking Arctic amplification toextreme weather in midlatitudes. Geophys Res Lett 40:4734–4739.doi:10.1002/grl.50880
Buzzi A, Tertaglione N, Malguzzi P (1998) Numerical simulations of the1994 Piedmont flood: role of orography and moist processes. MonWeather Rev 126:2369–2383
Buzzi A, Davolio S, Malguzzi P, Drofa O, Mastrangelo D (2013) Heavyrainfall episodes over Liguria of autumn 2011: numerical forecastingexperiments. Nat Hazards Earth Syst Sci 1:7093–7135
Carlson TN (1980) Airflow through midlatitude cyclones and the commacloud patterns. Mon Weather Rev 108(10):1498–1509
Case RA, Gerrosh HP (1988) Annual summary. Atlantic hurricane seasonof 1987. Mon Weather Rev 116:939–949
Compo GP, Whitaker JS, Sardeshmukh PD et al (2011) The twentiethcentury reanalysis project. Q J R Meteorol Soc 137:1–28. doi:10.1002/qj.776
de Vries AJ, Tyrlis E, Edry D, Krichak SO, Steil B, Lelieveld J (2013)Extreme precipitation events in the Middle East: dynamics of theActive Red Sea Trough. J Geophys Res Atmos 118:7087–7108. doi:10.1002/jgrd.50569
De Zolt S, Lionello P, NuhuA, Tomasin A (2006) The disastrous storm of4 November 1966 on Italy. Nat Hazards Earth Syst Sci 6:861–879
Doswell CA, Ramis C, Romero R, Alonso S (1998) A diagnostic study ofthree heavy precipitation episodes in the western Mediterraneanregion. Weather Forecast 13:102–124
Draxler RR, Rolph GD (2013) HYSPLIT (HYbrid Single-ParticleLagrangian Integrated Trajectory) model access via NOAA ARLREADYWebsite (http://www.arl.noaa.gov/HYSPLIT.php). NOAAAir Resources Laboratory, College Park, MD
Ducrocq V, Braud I, Davolio S et al (2013) HyMeX-SOP1, the fieldcampaign dedicated to heavy precipitation and flash flooding in thenorthwestern Mediterranean. Bull Am Meteorol Soc. doi:10.1175/BAMS-D-12-00244.1
Frei C, Davies HC, Gurtz J, Schär C (2000) Climate dynamics andextreme precipitation and flood events in Central Europe. IntegrAssess 1:281–299
Role of tropical moisture exports for the Mediterranean HPEs
Gualdi S, Somot S, May W, Castellari S, Déqué M, Adani M, Artale V,Bellucci A, Breitgand JS, Carillo A, Cornes R, Dell’Aquila A,Dubois C, Efthymiadis D, Elizalde A, Gimeno L, Goodess CM,Harzallah A, Krichak SO, Kuglitsch FG, Leckebusch GC,L’Heveder B, Li L, Lionello P, Luterbacher J, Mariotti A, Nieto R,Nissen KM, Oddo P, Ruti P, Sanna A, Sannino G, Scoccimarro E,Sevault F, Struglia MV, Toreti A, Ulbrich U, Xoplaki E (2013)Future climate projections. In: Navarra A, Tubiana L (eds)Regional assessment of climate change in the Mediterranean.Springer, Dordrecht, 870 p
Homar V, Jansa A, Campins J, Genoves A, Ramis C (2007) Towards asystematic climatology of sensitivities ofMediterranean high impactweather: a contribution based on intense cyclones. Nat HazardsEarth Syst Sci 7:445–454
Jansa A, Genoves A, Garsia-Moya JA (2000) Western Mediterraneancyclones and heavy rain. Part 1: numerical experiment concerningthe Piedmont flood case. Meteorol Appl 7:323–333
Jansa A, Alpert P, Arbogast P, Buzzi A, Ivancan-Picek B, Kotroni V,Llasat MC, Ramis C, Richard E, Romero R, Speranza A (2014)MEDEX: a general overview. Nat Hazards Earth Syst Sci Discuss 2:535–580. doi:10.5194/nhessd-2-535-2014
Kahana R, Ziv B, Enzel Y, Dayan U (2002) Synoptic climatology ofmajor floods in the Negev desert, Israel. Int J Climatol 22:867–882
Kahana R, Ziv B, Dayan U, Enzel Y (2004) Atmospheric predictors formajor floods in the Negev desert, Israel. Int J Climatol 24:1137–1147
Kalnay E, Kanamitsu M, Kistler R et al (1996) The NCEP/NCAR 40-year reanalysis project. Bull Am Meteorol Soc 77:437–471
Klein Tank AMG, Koennen GP (2003) Trends in indices of daily tem-perature and precipitation extremes in Europe, 1946–99. J Climatol1 6 : 3 6 6 5 – 3 6 8 0 . d o i : 1 0 . 1 1 7 5 / 1 5 2 0 - 0 4 4 2 ( 2 0 0 3 )016<3665:TIIODT>2.0.CO;2
Klok EJ, Klein Tank AMG (2009) Undated and extended European dataset of daily climate observations. Int J Climatol 29:1182–1191. doi:10.1002/joc.1779
Kotroni V, Lagouvardos K, Defer E, Dietrich S, Porcu F, Medaglia CM,Demitras M (2006) The Antalya 5 December 2002 storm: observa-tions and model analysis. J Appl Meteorol Climatol 45:576–590
Krichak SO, Alpert P (1998) Role of large scale moist dynamics inNovember 1–5, 1994 hazardous Mediterranean weather. JGeophys Res 103:19,453–19,468
Krichak SO, Alpert P, Dayan M (2004) Role of atmospheric processesassociated with hurricane Olga in December 2001 flash floods inIsrael. J Hydrometeorol 5(6):1259–1270
Krichak SO, Alpert P, Dayan M (2006) An evaluation of the role ofhurricane Olga (2001) in an extreme rainy event in Israel usingdynamic tropopause maps. Meteorol Atmos Phys. doi:10.1007/s00703-006-0230-7
Krichak SO, Breitgand JS, Feldstein SB (2012) A conceptual model foridentification of the Active Red Sea Trough synoptic events oversoutheastern Mediterranean. J Appl Meteorol Climatol 5:962–971.doi:10.1175/JAMC-D-11-0223.1
Krichak SO, Breitgand JS, Gualdi S, Feldstein SB (2013)Teleconnection-extreme precipitation relationships over theMediterranean region. Theor Appl Climatol. doi:10.1007/s00704-013-1036-4
Lavers DA, Allan RP, Wood EF, Villarini G, Brayshaw DJ, Wade AJ(2011) Winter floods in Britain are connected to atmospheric rivers.Geophys Res Lett 38, L23803. doi:10.1029/2011GL049783
Lionello P, Bhend J, Buzzi A, Della-Marta PM, Krichak SO, Jansa A,Maheras P, Sanna A, Trigo IF, Trigo R (2006) Cyclones in theMediterranean region: climatology and effects on the environment.In: Lionello P, Malanotte-Rizzoli P, Boscolo R (eds) Mediterraneanclimate variability, 4. Elsevier, Amsterdam, pp 325–372
Liu J, Curry JA, Wang H, Song M, Horton RM (2012) Impact ofdeclining Arctic sea ice on winter snowfall. Proc Natl Acad Sci US A 109:4074–4079. doi:10.1073/pnas.1114910109
Malguzzi P, Grossi G, Buzzi A, Ranzi R, Buizza R (2006) The 1966‘century’ flood in Italy: a meteorological-hydrological re-visitation.J Geophys Res Atmos 111:D24106, ISSN: 0148–0227
Massacand AC, Wernli H, Davies HC (1998) Heavy precipitation on theAlpine southside: an upper-level precursor, Geophys. Res Lett25(9):1435–1438
Pinto JG, Klawa M, Ulbrich U, Rudari R, Speth P (2001) Extremeprecipitation events over southwestern Italy and their relationshipwith tropical–extratropical interactions over the AtlanticMediterranean storms. Proc. Third Plinius Conf., Baja Sardinia,Italy, European Geophysical Society, GNDCI Publication 2560:327–332
Pinto JG, Ulbrich S, Parodi A, Rudari R, Boni G, Ulbrich U (2014)Identification and ranking of extraordinary rainfall events overNorthwest Italy: the role of Atlantic moisture. J Geophys Research- Atmospheres 118:2085–2097. doi:10.1002/jgrd.50179
Ralph FM, Dettinger MD (2011) Storms, floods, and the science ofatmospheric rivers, EOS, Transactions. Am Geophys Union92(32):265–272
Ralph FM, Neiman PJ, Wick GA (2004) Satellite and CALJET aircraftobservations of atmospheric rivers over the eastern North PacificOcean during the winter of 1997/98. Mon Weather Rev 132:1721–1745. doi:10.1175/1520-0493(2004)132<1721:SACAOO>2.0.CO;2
Ramis C, Llasat MC (1994) The October-1987 floods inCatalonia: synoptic and mesoscale mechanisms. MeteorolAppl 1:337–350
Ramis C, Jansá A, Alonso S, Heredia MA (1986) Convection over thewestern Mediterranean. Synoptic study and remote observation (inSpanish). Rev Meteorol 7:59–82
Ramis C, Romero R, Homar V, Alonso S, AlarcónM (1998) Diagnosis andnumerical simulation of a torrential precipitation event in Catalonia(Spain). Meteorol Atmos Phys Meteorol Atmos Phys 69:1–21
Ramis C, Romero R, Homar V (2009) The severe thunderstorm of 4October 2007 in Mallorca: an observational study. Nat HazardsEarth Syst Sci 9:1237–1245. doi:10.5194/nhess-9-1237-2009
Reale M, Lionello P (2013) Synoptic climatology of winter intenseprecipitation events along the Mediterranean coasts. Nat HazardsEarth Syst Sci 13:1707–1722. doi:10.5194/nhess-13-1707-2013
Rebora N, Molini L, Casella E, Comellas A, Fiori E, Pignone F, SiccardiF, Silvestro F, Tanelli S, Parodi A (2013) Extreme rainfall in theMediterranean: what can we learn from observations? JHydrometeorol 14:906–922
Ricard D, Ducrocq V, Auger L (2012) A climatology of the mesoscaleenvironment associated with heavily precipitating events over anorthwestern Mediterranean area. J Appl Meteorol Climatol 51(3):468–488. doi:10.1175/JAMC-D-11-017.1
Romero R, Ramis C, Alonso S, Doswell CA, Stensrud DJ (1998)Mesoscale model simulations of three heavy precipitation eventsin the western Mediterranean region. Mon Weather Rev 1998(126):1859–1881
Romero R, Sumner G, Ramis C, Genove A (1999) A classification of theatmospheric circulation patterns producing significant daily rainfallin the Spanish Mediterranean area. Int J Climatol 19:765–785
Romero R, Doswell CA, Ramis C (2000) Mesoscale numerical study oftwo cases of long-lived quasi-stationary convective systems overeastern Spain. Mon Weather Rev 128:3731–3751
Rubin S, Ziv B, Paldor N (2007) Tropical plumes over eastern NorthAfrica as a source of rain in the Middle East. Mon Weather Rev35(12):4135–4148
Sagg AL (1967) The hurricane season of 1966. Mon Weather Rev 95(3):131–142
Scoccimarro S, Gualdi S, Navarra A (2012) Tropical cyclone effects onArctic Sea ice variability. Geophys Res Lett 39, L17704. doi:10.1029/2012GL052987
Tsvieli Y, Zangvil A (2005) Synoptic climatological analysis of wet anddry Red Sea troughs over Israel. Int J Climatol 25:1997–2015
S.O. Krichak et al.

Turato B, Reale O, Siccardi F (2004) Water vapor sources of the October2000 Piedmont flood. J Hydrometeorol 5:693–712
van Zomeren J, van Delden A (2007) Vertically integrated moisture fluxconvergence as a predictor of thunderstorms. Atmosph Res 83:435–445
Winschall A, Pfahl S, Sodemann H, Wernli H (2012) Impact of NorthAtlantic evaporation hot spots on southern Alpine heavy precipita-tion events. Q J R Meteorol Soc 138:1245–1258
Winschall A, Sodemann H, Pfahl S, Wernli H (2014) How important isintensified evaporation for Mediterranean precipitation extremes? JGeophys Res Atmos. doi:10.1002/2013JD021175
Zhang X, He J, Zhang J, Polyakov I, Gerdes R, Inoue J, Wu P (2013)Enhanced poleward moisture transport and amplified northern high-latitude wetting trend. Nat Clim Chang 3, doi:10.1038/NCIMATE1631
Zhu Y, Newell RE (1998) A proposed algorithm for moisture fluxes fromatmospheric rivers. Mon Weather Rev 126(3):725–735. doi:10.1175/ 1520-0493(1998)126<0725:APAFMF>2.0.CO;2
Zolina O, Simmens C, Kapala A, Bachner S, Gulev S, Maechel H (2008)Seasonality of precipitation extremes over Germany since 1950from a very dense observation network. J Geophys Res 113,D06110. doi:10.1029/2007JD008393
Zolina O, Simmer C, Belyaev K, Kapala A, Gulev SK (2009) Improvingestimates of heavy and extreme precipitation using daily recordsfrom European rain gauges. J Hydrometeorol 10:701–716. doi:10.1175/2008JHM1055.1
Zolina O, Simmer C, Gulev SK, Kollet S (2010) Changing structure ofEuropean precipitation: longer wet periods leading to more abun-dant rainfalls. Geophys Res Lett 37, L06704. doi:10.1029/2010GL042468
Role of tropical moisture exports for the Mediterranean HPEs