arizona climate summary · arizona climate summary ... brought more tropical moisture up from...
TRANSCRIPT

1
Arizona Climate Summary October 2016
Summary of conditions for September 2016
September 2016 Temperature and Precipitation Summary
September 1st – 14th: High pressure over the Four Corners brought rainfall to southeastern and the higher elevations of
central and northern Arizona during the first three days of September. Prescott had 0.70” on the 1st, 0.60” on the 2nd and
Valle (in Flagstaff) had 0.89” on the 3rd. High temperatures in the southwest deserts remained near 105 through
September 5th. By the 4th, the high pressure broke down and a low pressure system over Nevada brought southwesterly
flow and drier air into Arizona. Temperatures remained near normal. On the 6th, a low pressure system off the coast of
Mexico brought tropical moisture into the state and lowered temperatures about 5 degrees. On the 6th and 7th, Coronado
National Monument in southeastern AZ had 3.22” and Alpine had 0.85” on the 8th. There was a brief reprieve from the
rainfall on the 10th as drier air was pushed into the southwest. Between the 11th and 14th, a low pressure system moved
into Nevada and southern Utah, bringing light rainfall to the southwest and the higher elevations of eastern Arizona.
High rainfall totals included 0.20” at Springerville on the 11th, 0.51” at Bisbee on the 12th, 0.25” at Bisbee-Douglas on
the 13th, and 0.20” at Show Low on the 14th.
September 15th – 30th: From the 15th through the 19th, conditions were relatively dry and stable across the state as a
weak low pressure system over Nevada and Utah moved slowly through the west. Flagstaff reached freezing for the first
time this fall on September 15th and had six nights of freezing temperatures this month. Temperatures dipped below
100oF on the 13th and did not exceed 100oF in the state until the 17th. The only rainfall was 0.02” at Elgin on the 16th and
0.26” at Bellemont on the 17th. By the 20th, the high pressure over west Texas brought significant moisture into the state
with widespread rainfall across northern and central Arizona. Rainfall totals from the 20th through the 23rd included
2.04” at Williams, 1.96” at Seligman, 1.82” at Grand Canyon North Rim, 1.69” at Grand Canyon Airport, 1.40” at
Bellemont, 1.30” at Prescott, and 0.73” at Flagstaff. The 24th was dry statewide, and on the 25th an easterly wave
brought more tropical moisture up from Mexico and the eastern Pacific into the state. Daily rainfall totals included 0.39”
at Bisbee-Douglas on the 26th, 0.19” at Pioneer on the 27th, 0.40” at Flagstaff on the 28th, 0.82” at Show Low on the 29th,
and 0.65” at Springerville on the 30th. Temperatures dropped below 100oF on the 22nd, and remained below 100oF for
the rest of the month except in Yuma that had 101 on the 26th and 100 on the 30th.
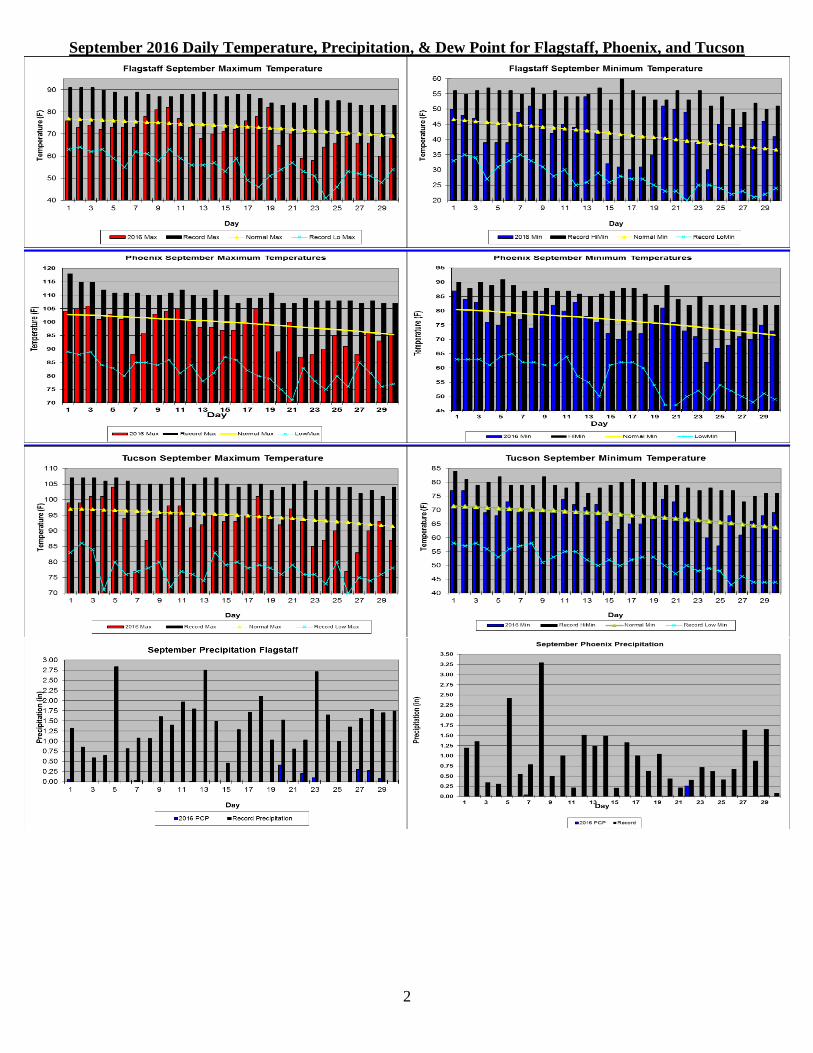
In This Issue: Overview of September, graphs of the September daily maximum and minimum temperatures,
precipitation, mean daily dew points for Flagstaff, Phoenix, and Tucson; September climate statistics, maps of mean
monthly maximum and minimum temperatures, precipitation, dew points, wind speeds for September; and graphs of the
mean September temperature and precipitation for the period of record for Tucson, Phoenix, and Flagstaff, graphs of the
cumulative precipitation for the calendar year for Flagstaff, Phoenix, and Tucson. Climate calendars for Flagstaff,
Phoenix, Tucson, Prescott, Winslow and Yuma, including daily and monthly normals and extremes, for each month of
the year, can be downloaded directly from the State Climate website. See p.19 of this report for calendar abbreviations.
Data are preliminary and are from the National Weather Service Forecast Offices in Flagstaff, Phoenix and Tucson.
**Note: The discrepancy between the Statewide Temperature and Precipitation values for Phoenix, Flagstaff and
Tucson and the daily values in their graphs are due to the reporting times. Statewide Temperature and Precipitation
values are taken at 5pm, while official daily records at the airports are taken from Midnight to Midnight. Dr. Nancy J. Selover, State Climatologist
http://azclimate.asu.edu 480-965-6265
Edited by Nancy J. Selover
© 2016 Arizona State Climate Office
2
September 2016 Daily Temperature, Precipitation, & Dew Point for Flagstaff, Phoenix, and Tucson
3
4
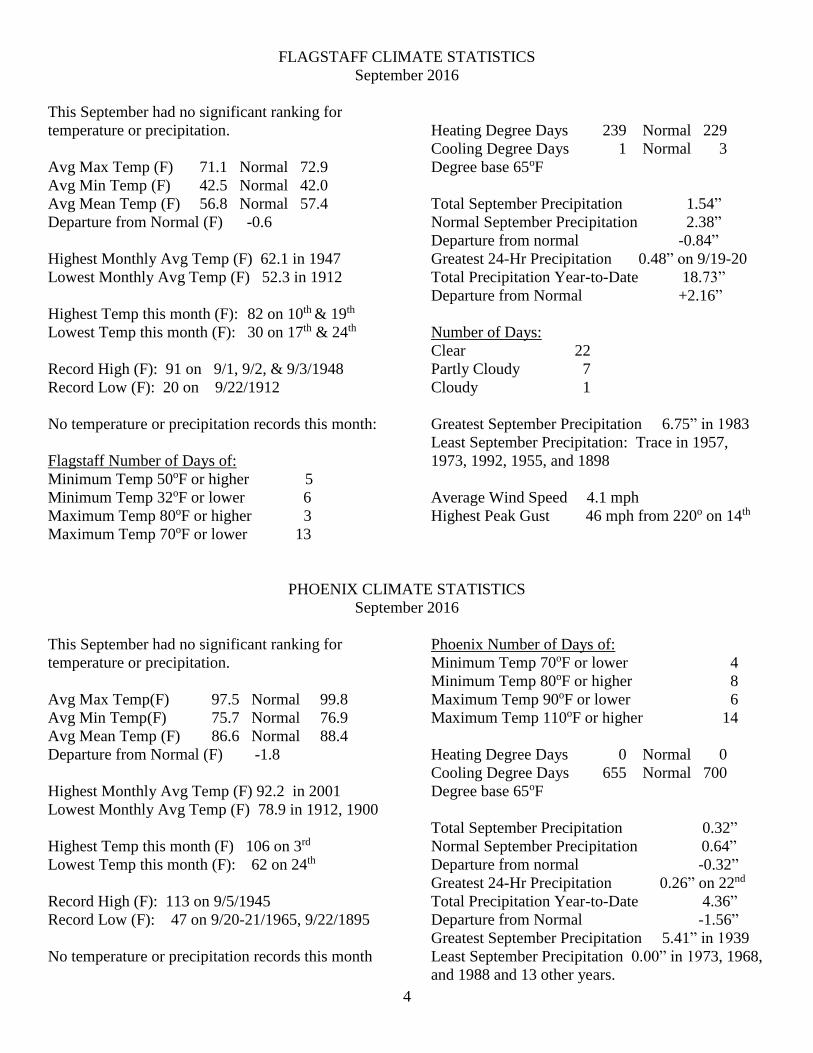
FLAGSTAFF CLIMATE STATISTICS
September 2016
This September had no significant ranking for
temperature or precipitation.
Avg Max Temp (F) 71.1 Normal 72.9
Avg Min Temp (F) 42.5 Normal 42.0
Avg Mean Temp (F) 56.8 Normal 57.4
Departure from Normal (F) -0.6
Highest Monthly Avg Temp (F) 62.1 in 1947
Lowest Monthly Avg Temp (F) 52.3 in 1912
Highest Temp this month (F): 82 on 10th & 19th
Lowest Temp this month (F): 30 on 17th & 24th
Record High (F): 91 on 9/1, 9/2, & 9/3/1948
Record Low (F): 20 on 9/22/1912
No temperature or precipitation records this month:
Flagstaff Number of Days of:
Minimum Temp 50oF or higher 5
Minimum Temp 32oF or lower 6
Maximum Temp 80oF or higher 3
Maximum Temp 70oF or lower 13
Heating Degree Days 239 Normal 229
Cooling Degree Days 1 Normal 3
Degree base 65oF
Total September Precipitation 1.54”
Normal September Precipitation 2.38”
Departure from normal -0.84”
Greatest 24-Hr Precipitation 0.48” on 9/19-20
Total Precipitation Year-to-Date 18.73”
Departure from Normal +2.16”
Number of Days:
Clear 22
Partly Cloudy 7
Cloudy 1
Greatest September Precipitation 6.75” in 1983
Least September Precipitation: Trace in 1957,
1973, 1992, 1955, and 1898
Average Wind Speed 4.1 mph
Highest Peak Gust 46 mph from 220o on 14th
PHOENIX CLIMATE STATISTICS
September 2016
This September had no significant ranking for
temperature or precipitation.
Avg Max Temp(F) 97.5 Normal 99.8
Avg Min Temp(F) 75.7 Normal 76.9
Avg Mean Temp (F) 86.6 Normal 88.4
Departure from Normal (F) -1.8
Highest Monthly Avg Temp (F) 92.2 in 2001
Lowest Monthly Avg Temp (F) 78.9 in 1912, 1900
Highest Temp this month (F) 106 on 3rd
Lowest Temp this month (F): 62 on 24th
Record High (F): 113 on 9/5/1945
Record Low (F): 47 on 9/20-21/1965, 9/22/1895
No temperature or precipitation records this month
Phoenix Number of Days of:
Minimum Temp 70oF or lower 4
Minimum Temp 80oF or higher 8
Maximum Temp 90oF or lower 6
Maximum Temp 110oF or higher 14
Heating Degree Days 0 Normal 0
Cooling Degree Days 655 Normal 700
Degree base 65oF
Total September Precipitation 0.32”
Normal September Precipitation 0.64”
Departure from normal -0.32”
Greatest 24-Hr Precipitation 0.26” on 22nd
Total Precipitation Year-to-Date 4.36”
Departure from Normal -1.56”
Greatest September Precipitation 5.41” in 1939
Least September Precipitation 0.00” in 1973, 1968,
and 1988 and 13 other years.
5
Number of Days:
Clear 15
Partly Cloudy 13
Cloudy 2
Average Wind Speed 7.1 mph
Highest Peak Gust 37 mph from 270o on 22nd
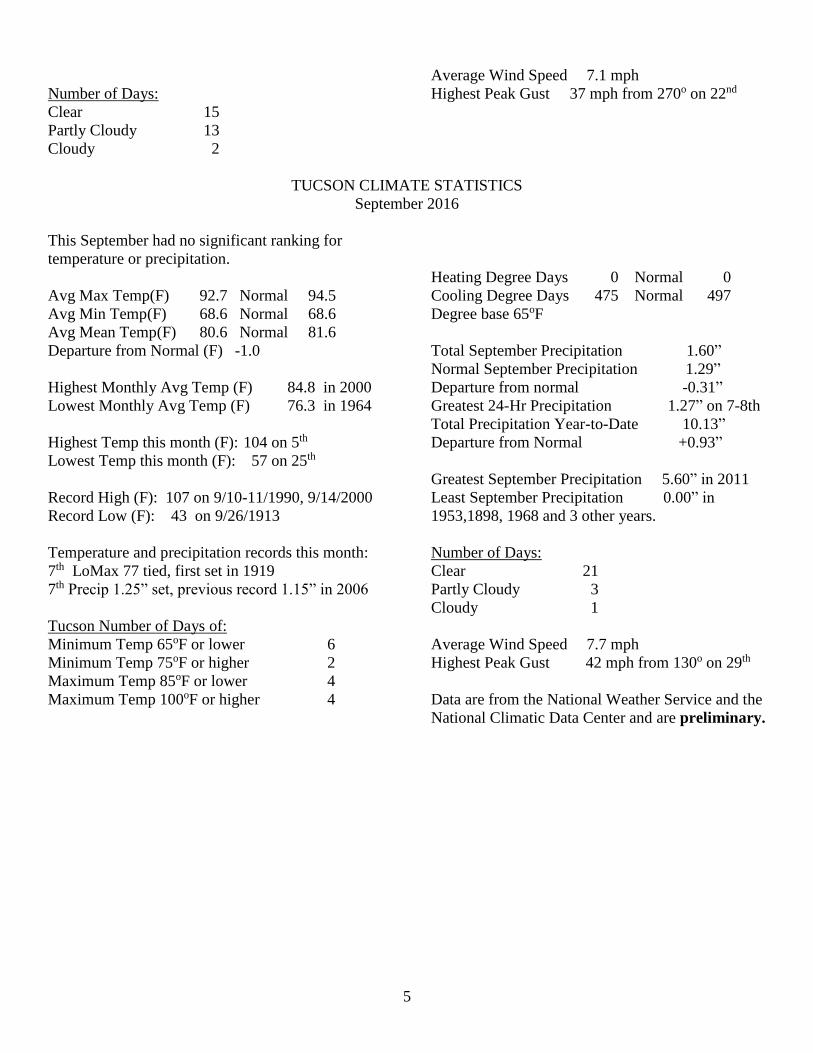
TUCSON CLIMATE STATISTICS
September 2016
This September had no significant ranking for
temperature or precipitation.
Avg Max Temp(F) 92.7 Normal 94.5
Avg Min Temp(F) 68.6 Normal 68.6
Avg Mean Temp(F) 80.6 Normal 81.6
Departure from Normal (F) -1.0
Highest Monthly Avg Temp (F) 84.8 in 2000
Lowest Monthly Avg Temp (F) 76.3 in 1964
Highest Temp this month (F): 104 on 5th
Lowest Temp this month (F): 57 on 25th
Record High (F): 107 on 9/10-11/1990, 9/14/2000
Record Low (F): 43 on 9/26/1913
Temperature and precipitation records this month:
7th LoMax 77 tied, first set in 1919
7th Precip 1.25” set, previous record 1.15” in 2006
Tucson Number of Days of:
Minimum Temp 65oF or lower 6
Minimum Temp 75oF or higher 2
Maximum Temp 85oF or lower 4
Maximum Temp 100oF or higher 4
Heating Degree Days 0 Normal 0
Cooling Degree Days 475 Normal 497
Degree base 65oF
Total September Precipitation 1.60”
Normal September Precipitation 1.29”
Departure from normal -0.31”
Greatest 24-Hr Precipitation 1.27” on 7-8th
Total Precipitation Year-to-Date 10.13”
Departure from Normal +0.93”
Greatest September Precipitation 5.60” in 2011
Least September Precipitation 0.00” in
1953,1898, 1968 and 3 other years.
Number of Days:
Clear 21
Partly Cloudy 3
Cloudy 1
Average Wind Speed 7.7 mph
Highest Peak Gust 42 mph from 130o on 29th
Data are from the National Weather Service and the
National Climatic Data Center and are preliminary.
6
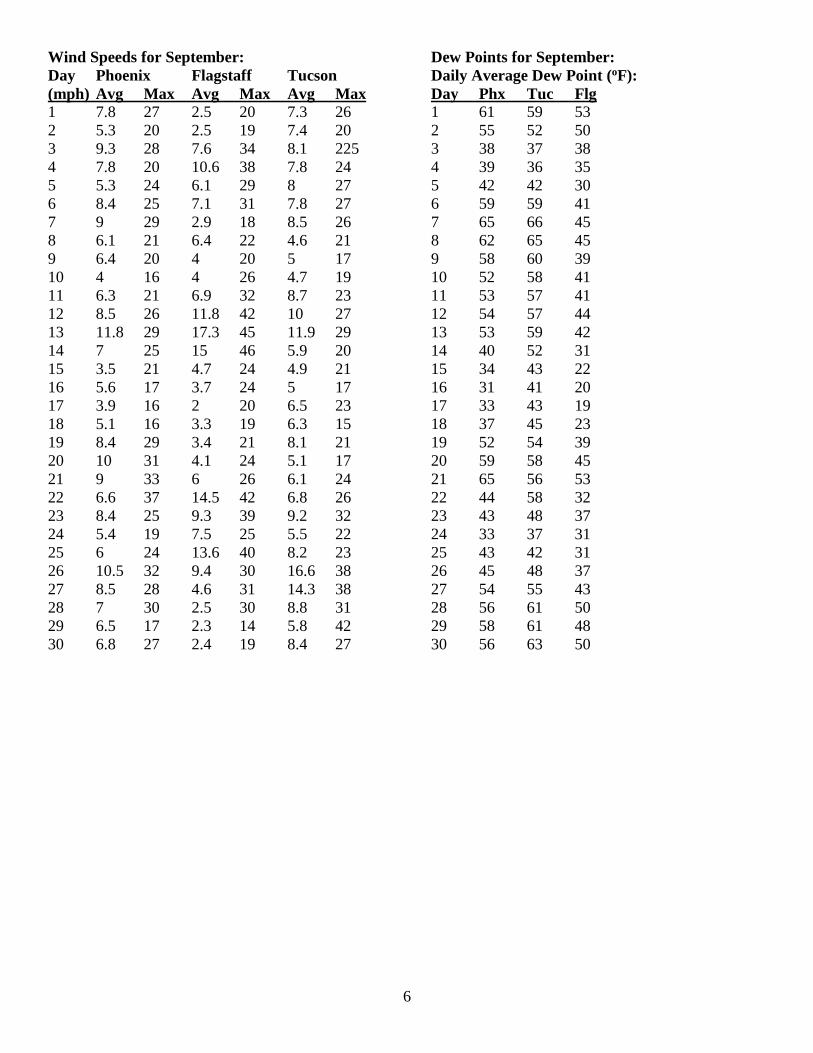
Wind Speeds for September:
Day Phoenix Flagstaff Tucson
(mph) Avg Max Avg Max Avg Max
1 7.8 27 2.5 20 7.3 26
2 5.3 20 2.5 19 7.4 20
3 9.3 28 7.6 34 8.1 225
4 7.8 20 10.6 38 7.8 24
5 5.3 24 6.1 29 8 27
6 8.4 25 7.1 31 7.8 27
7 9 29 2.9 18 8.5 26
8 6.1 21 6.4 22 4.6 21
9 6.4 20 4 20 5 17
10 4 16 4 26 4.7 19
11 6.3 21 6.9 32 8.7 23
12 8.5 26 11.8 42 10 27
13 11.8 29 17.3 45 11.9 29
14 7 25 15 46 5.9 20
15 3.5 21 4.7 24 4.9 21
16 5.6 17 3.7 24 5 17
17 3.9 16 2 20 6.5 23
18 5.1 16 3.3 19 6.3 15
19 8.4 29 3.4 21 8.1 21
20 10 31 4.1 24 5.1 17
21 9 33 6 26 6.1 24
22 6.6 37 14.5 42 6.8 26
23 8.4 25 9.3 39 9.2 32
24 5.4 19 7.5 25 5.5 22
25 6 24 13.6 40 8.2 23
26 10.5 32 9.4 30 16.6 38
27 8.5 28 4.6 31 14.3 38
28 7 30 2.5 30 8.8 31
29 6.5 17 2.3 14 5.8 42
30 6.8 27 2.4 19 8.4 27
Dew Points for September:
Daily Average Dew Point (oF):
Day Phx Tuc Flg
1 61 59 53
2 55 52 50
3 38 37 38
4 39 36 35
5 42 42 30
6 59 59 41
7 65 66 45
8 62 65 45
9 58 60 39
10 52 58 41
11 53 57 41
12 54 57 44
13 53 59 42
14 40 52 31
15 34 43 22
16 31 41 20
17 33 43 19
18 37 45 23
19 52 54 39
20 59 58 45
21 65 56 53
22 44 58 32
23 43 48 37
24 33 37 31
25 43 42 31
26 45 48 37
27 54 55 43
28 56 61 50
29 58 61 48
30 56 63 50
7
The
8
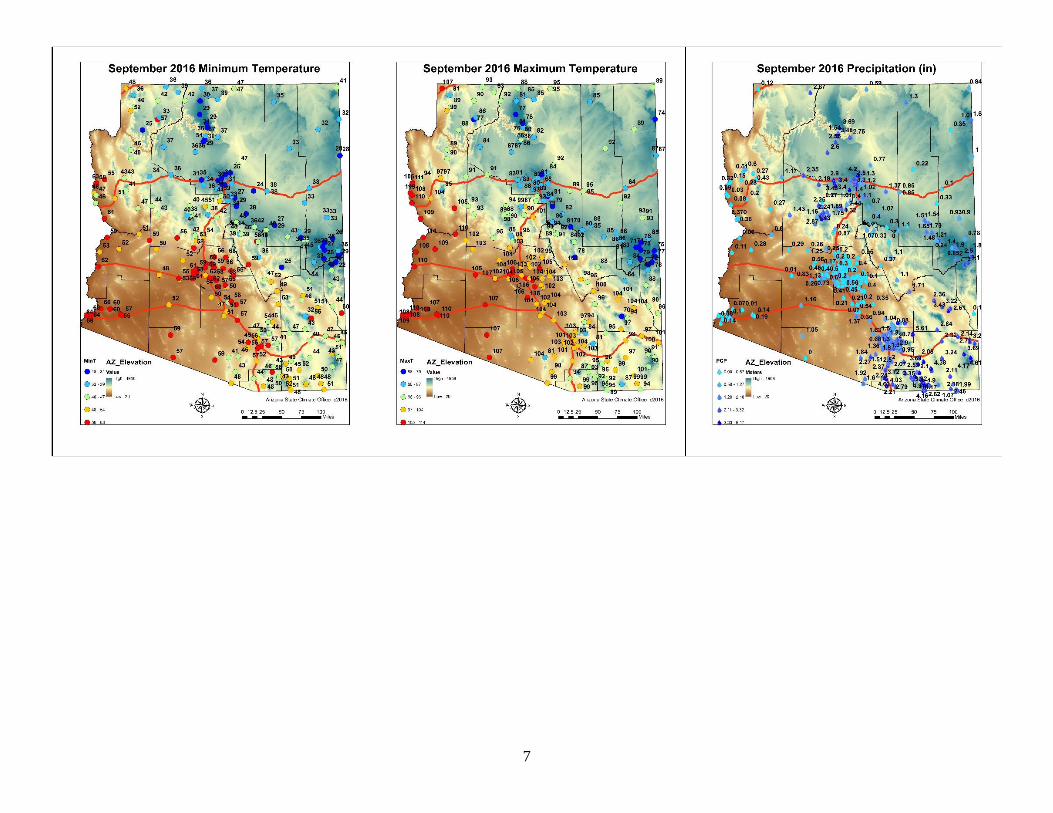
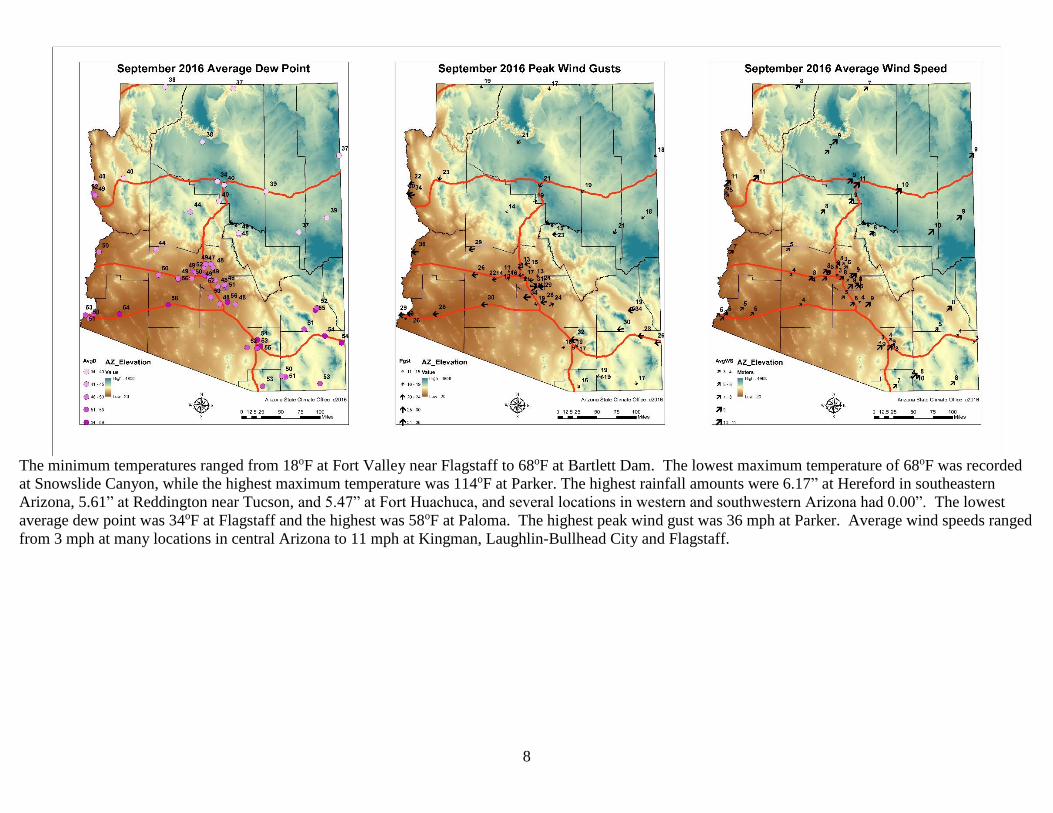
The minimum temperatures ranged from 18oF at Fort Valley near Flagstaff to 68oF at Bartlett Dam. The lowest maximum temperature of 68oF was recorded
at Snowslide Canyon, while the highest maximum temperature was 114oF at Parker. The highest rainfall amounts were 6.17” at Hereford in southeastern
Arizona, 5.61” at Reddington near Tucson, and 5.47” at Fort Huachuca, and several locations in western and southwestern Arizona had 0.00”. The lowest
average dew point was 34oF at Flagstaff and the highest was 58oF at Paloma. The highest peak wind gust was 36 mph at Parker. Average wind speeds ranged
from 3 mph at many locations in central Arizona to 11 mph at Kingman, Laughlin-Bullhead City and Flagstaff.

9
T
September 2016
The highest average minimum temperature was 76oF at Phoenix Airport, and the lowest average minimum temperature was 36oF at Alpine. The highest
average maximum temperature was 107oF at Ehrenberg and lowest average maximum temperature was 58oF at Snowslide Canyon.

10
11
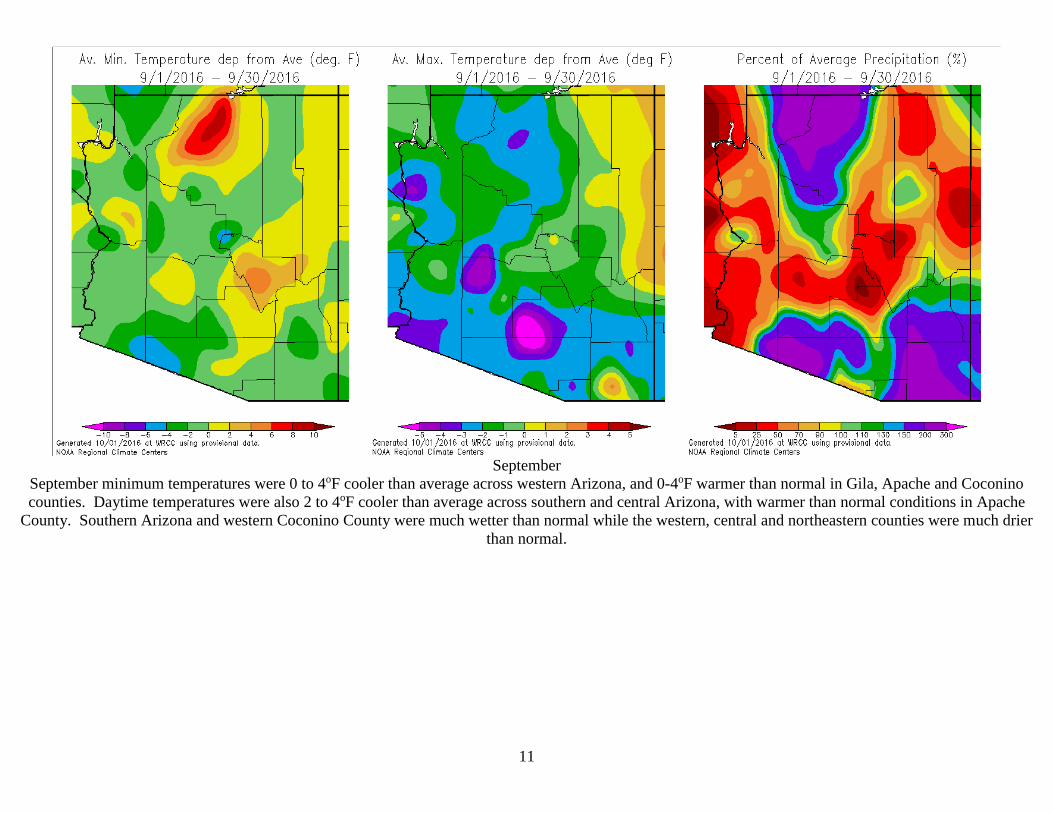
September
September minimum temperatures were 0 to 4oF cooler than average across western Arizona, and 0-4oF warmer than normal in Gila, Apache and Coconino
counties. Daytime temperatures were also 2 to 4oF cooler than average across southern and central Arizona, with warmer than normal conditions in Apache
County. Southern Arizona and western Coconino County were much wetter than normal while the western, central and northeastern counties were much drier
than normal.
12

13
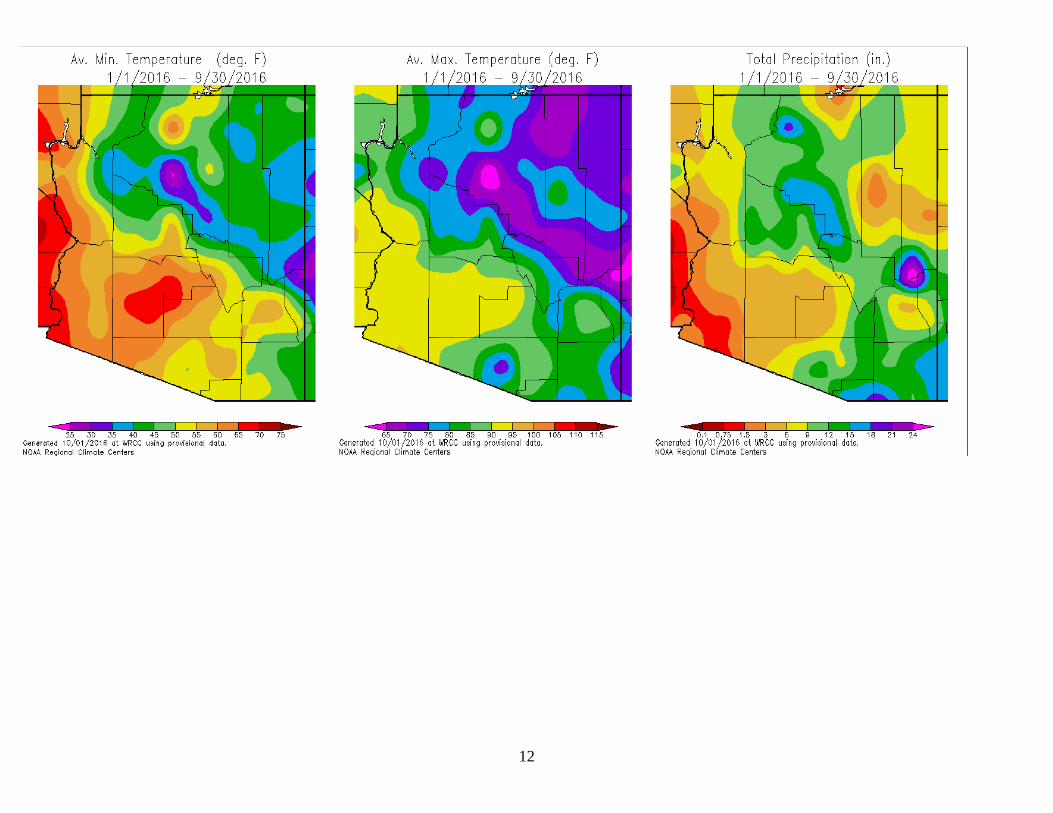
Calendar Year 2016
Calendar year minimum temperatures are still within 2oF of average, with the cooler temperatures in eastern Arizona and warmer conditions in central and
western Arizona. Daytime temperatures are still 1 to 3oF warmer than average statewide, with slightly cooler conditions in southern Navajo and western Pinal
counties. Precipitation is below 80% of normal across east central and southwestern Arizona. Northern Mohave, eastern Pima, Graham, Cochise and eastern
Coconino counties are wetter than average so far this year.

14
15
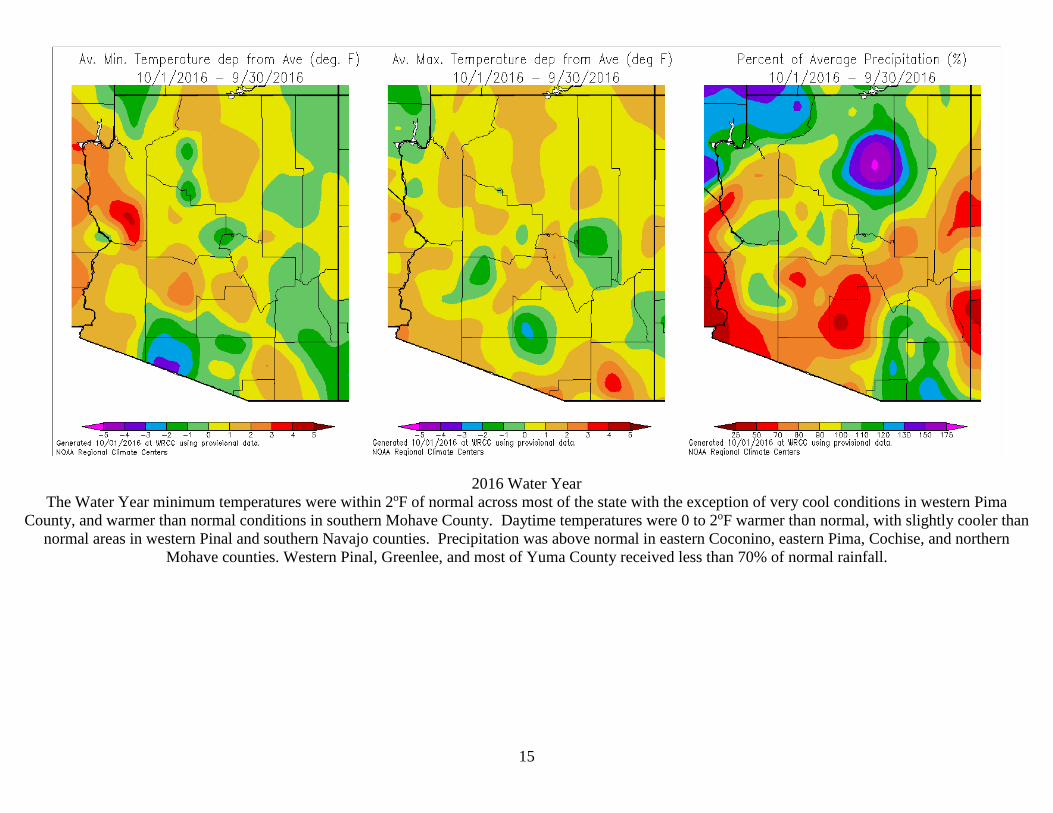
2016 Water Year
The Water Year minimum temperatures were within 2oF of normal across most of the state with the exception of very cool conditions in western Pima
County, and warmer than normal conditions in southern Mohave County. Daytime temperatures were 0 to 2oF warmer than normal, with slightly cooler than
normal areas in western Pinal and southern Navajo counties. Precipitation was above normal in eastern Coconino, eastern Pima, Cochise, and northern
Mohave counties. Western Pinal, Greenlee, and most of Yuma County received less than 70% of normal rainfall.
16
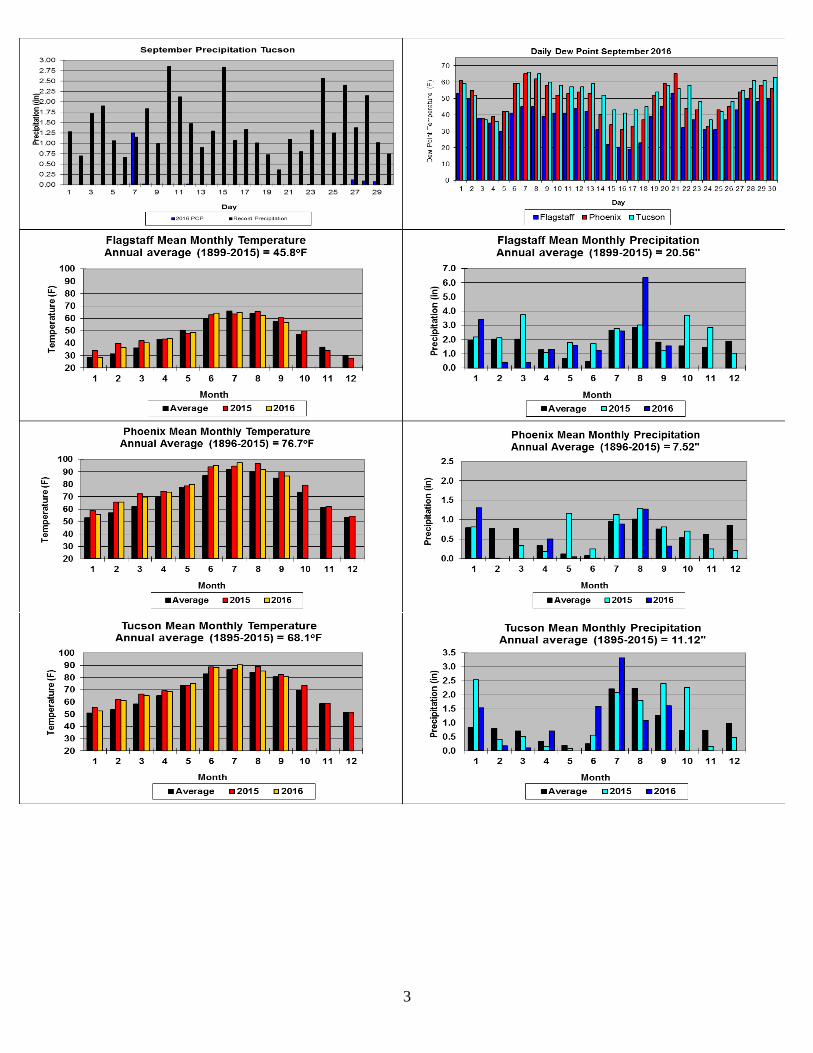
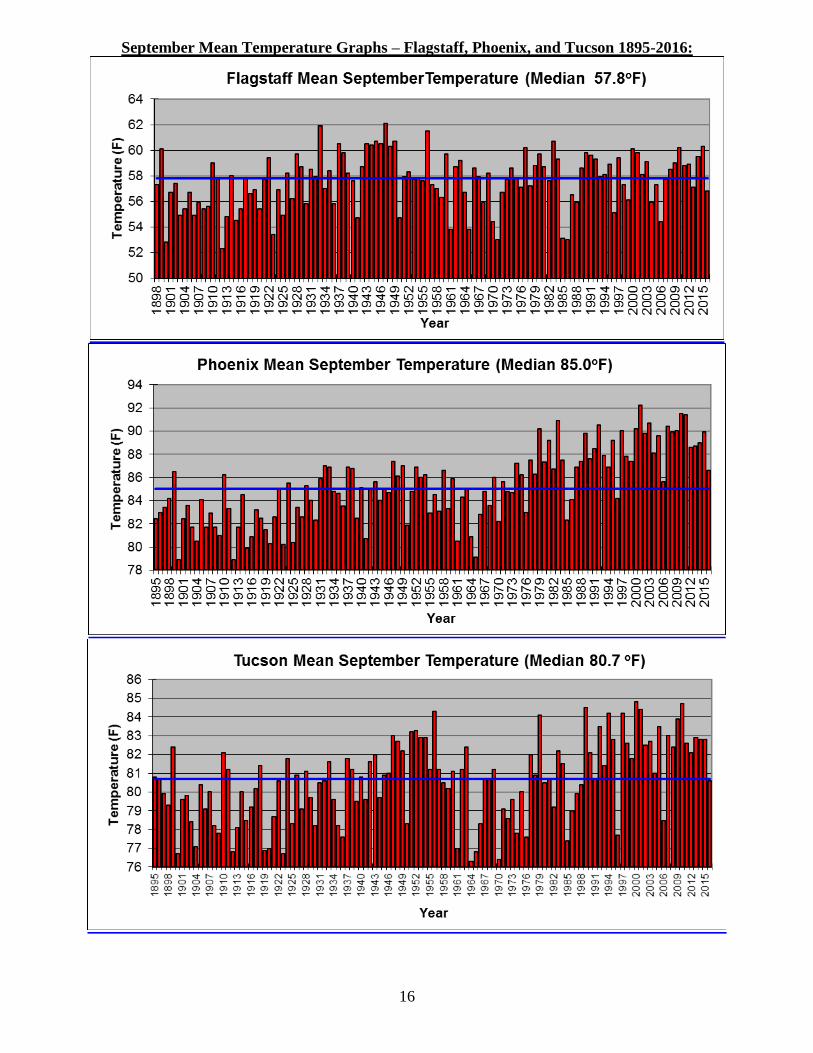
September Mean Temperature Graphs – Flagstaff, Phoenix, and Tucson 1895-2016:
17
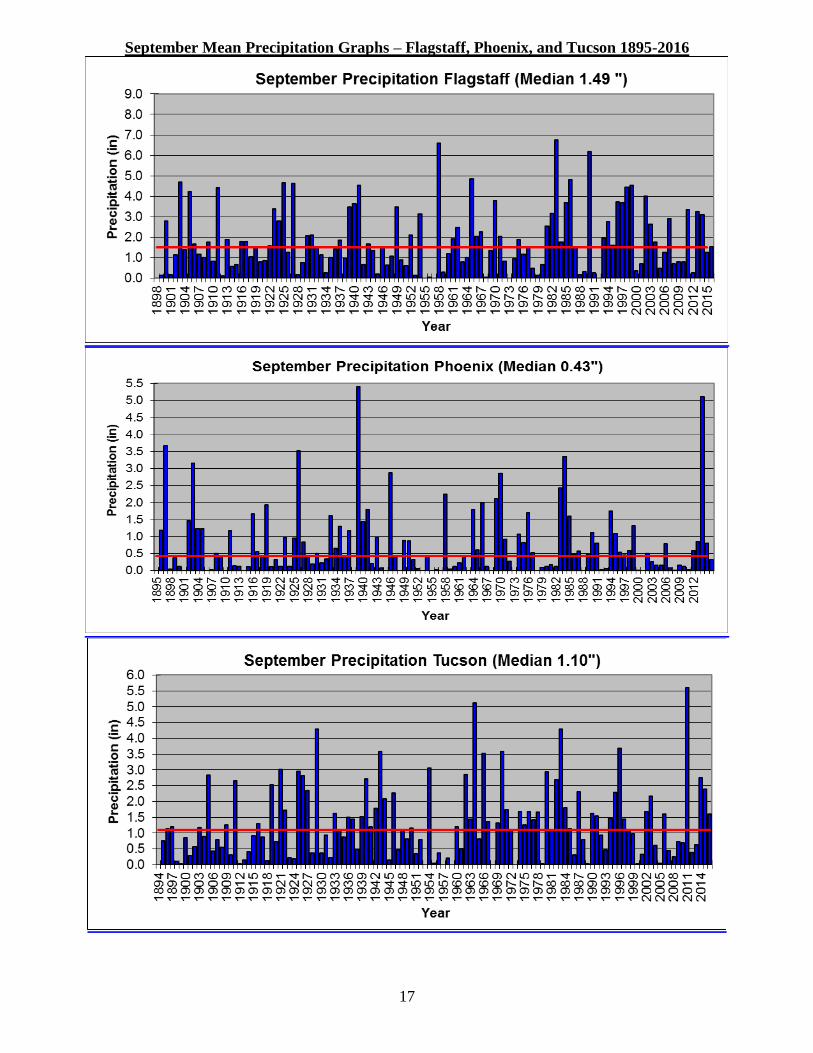
September Mean Precipitation Graphs – Flagstaff, Phoenix, and Tucson 1895-2016
18
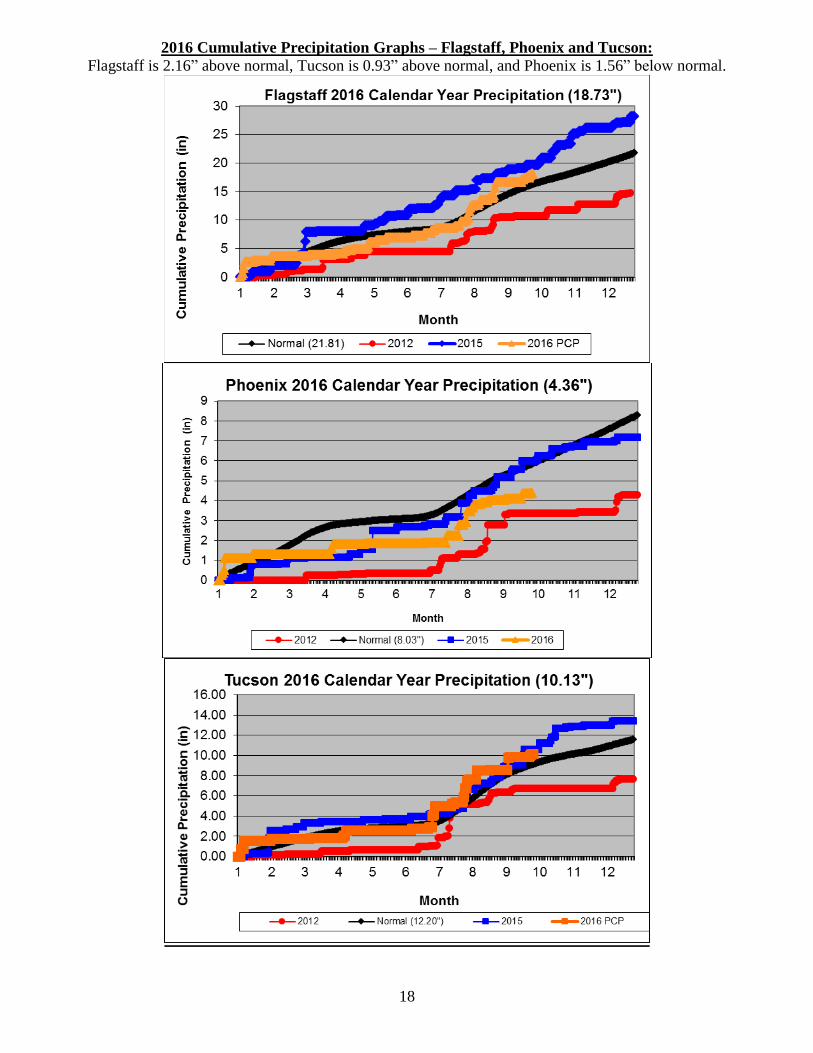
2016 Cumulative Precipitation Graphs – Flagstaff, Phoenix and Tucson:
Flagstaff is 2.16” above normal, Tucson is 0.93” above normal, and Phoenix is 1.56” below normal.
19
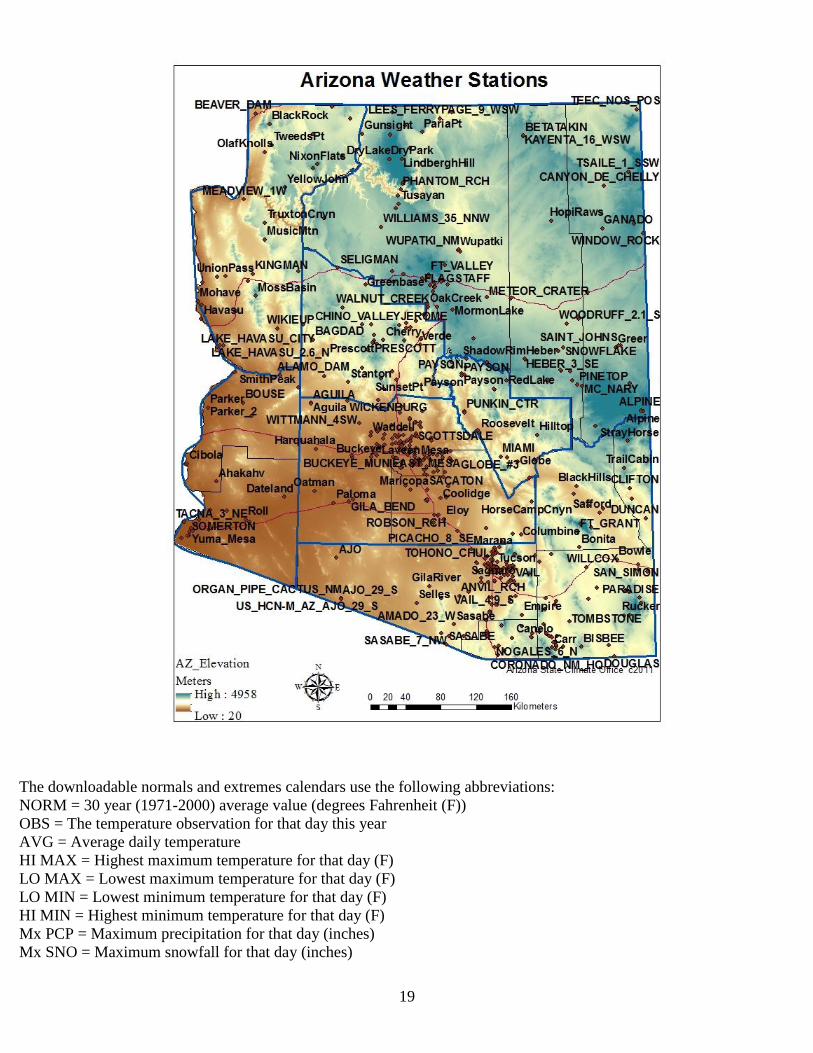
The downloadable normals and extremes calendars use the following abbreviations:
NORM = 30 year (1971-2000) average value (degrees Fahrenheit (F))
OBS = The temperature observation for that day this year
AVG = Average daily temperature
HI MAX = Highest maximum temperature for that day (F)
LO MAX = Lowest maximum temperature for that day (F)
LO MIN = Lowest minimum temperature for that day (F)
HI MIN = Highest minimum temperature for that day (F)
Mx PCP = Maximum precipitation for that day (inches)
Mx SNO = Maximum snowfall for that day (inches)