arizona climate summary · arizona climate summary ... by the 19th the high pressure system pushed...
TRANSCRIPT
1
Arizona Climate Summary October 2015
Summary of conditions for September 2015
September 2015 Temperature and Precipitation Summary
September 1
st – 18
th: September began with high pressure over southern New Mexico, bringing more moisture into
Arizona. Rain fell somewhere in Arizona every day through the 15th
. During this time the heaviest rain day was
September 1 when 1.06” fell at Davis Monthan AFB, and 0.76” fell at Tucson. Over the next week the high pressure
moved around eastern New Mexico and western Texas, continuing to bring moisture into Arizona and New Mexico.
Rain showers were isolated but not heavy, covering the eastern 2/3 of the state. Daily amounts over this period included
0.40” at Alpine on the 2nd
, 0.45” at Nogales on the 3rd
, 0.66” at Winslow on the 4th
, 0.42” at Flagstaff on the 5th, 0.80”
at Cottonwood on the 6th, 0.56” at Nogales, 0.43” at St. Johns on the 7th, and 0.80” at Coronado National Monument on
the 8th
. Temperatures during this period were on the low 100s in southern and western Arizonan, low 80s and upper 70s
in northern Arizona and low to mid70s at the higher elevations. By the 9th
, the high pressure had moved over northern
Mexico, bringing moisture to western Arizona. Yuma reported 0.86” on the 9th
, Sonora Desert Museum had 0.13” on the
10th
, and Elgin had 0.22”’ on the 11th
. By the 12th
, the high pressure settled over Arizona, and Payson received 0.18”,
and Nogales had 0.92” on the 13th
. By the 14th
, the high pressure had moved off the Baja California coast and a strong
low pressure system swept into the state on the 14th
and 15th
and Youngtown had 0.60” and Phoenix had 0.32” on the
14th
. Also on the 14th
heavy rain in southern Utah caused flash flooding in Zion National Park, Hildale, UT and
Colorado City, AZ, killing 18 people with several others missing. Seligman had 0.93” on the 15th
. On the 16th
only 0.01”
of rain was reported in the state and no rain fell on the 17th
or 18th
as high pressure remained centered over northern
Mexico.
September 19th
– 30th
: By the 19th
the high pressure system pushed more tropical moisture into the state bringing
heavier rainfall to the southeast counties. Elgin had 1.01” and Bisbee had 0.43” on the 19th
. On the 21st, Douglas had
1.22”, Alpine had 1.15”, Tucson had 1.04”, Davis Monthan AFB had 1.02”, and Nogales had 1.89”. On the 22nd
, Davis
Monthan had another 0.76”, Tucson had another 0.47”, and Alpine had another 0.80”. On the 23rd
, the moisture had
moved into central Arizona and Scottsdale Airport had 1.45”, east Mesa had 0.96”, and Phoenix Airport had 0.41”. That
was the end of the monsoon activity as the high pressure moved over Arizona on the 24th
and remained there through the
end of the month, ending the southerly flow of moisture into the state. No more rain was reported in the state from the
24th
through the end of September.
Data are preliminary and are from the National Weather Service Forecast Offices in Flagstaff, Phoenix and Tucson.
**Note: The discrepancy between the Statewide Temperature and Precipitation values for Phoenix, Flagstaff and
Tucson and the daily values in their graphs are due to the reporting times. Statewide Temperature and Precipitation
values are taken at 5pm, while official daily records at the airports are taken from Midnight to Midnight.
In This Issue: Overview of September, graphs of the September daily maximum and minimum temperatures,
precipitation, mean daily dew points for Flagstaff, Phoenix, and Tucson; September climate statistics, maps of mean
monthly maximum and minimum temperatures, precipitation, dew points, wind speeds for September; and graphs of the
mean September temperature and precipitation for the period of record for Tucson, Phoenix, and Flagstaff, graphs of the
cumulative precipitation for the calendar year for Flagstaff, Phoenix, and Tucson. Climate calendars for Flagstaff,
Phoenix, Tucson, Prescott, Winslow and Yuma, including daily and monthly normals and extremes, for each month of
the year, can be downloaded directly from the State Climate website. See p.21 of this report for calendar abbreviations. Dr. Nancy J. Selover, State Climatologist
http://azclimate.asu.edu 480-965-6265
Edited by Nancy J. Selover
© 2015 Arizona State Climate Office
2
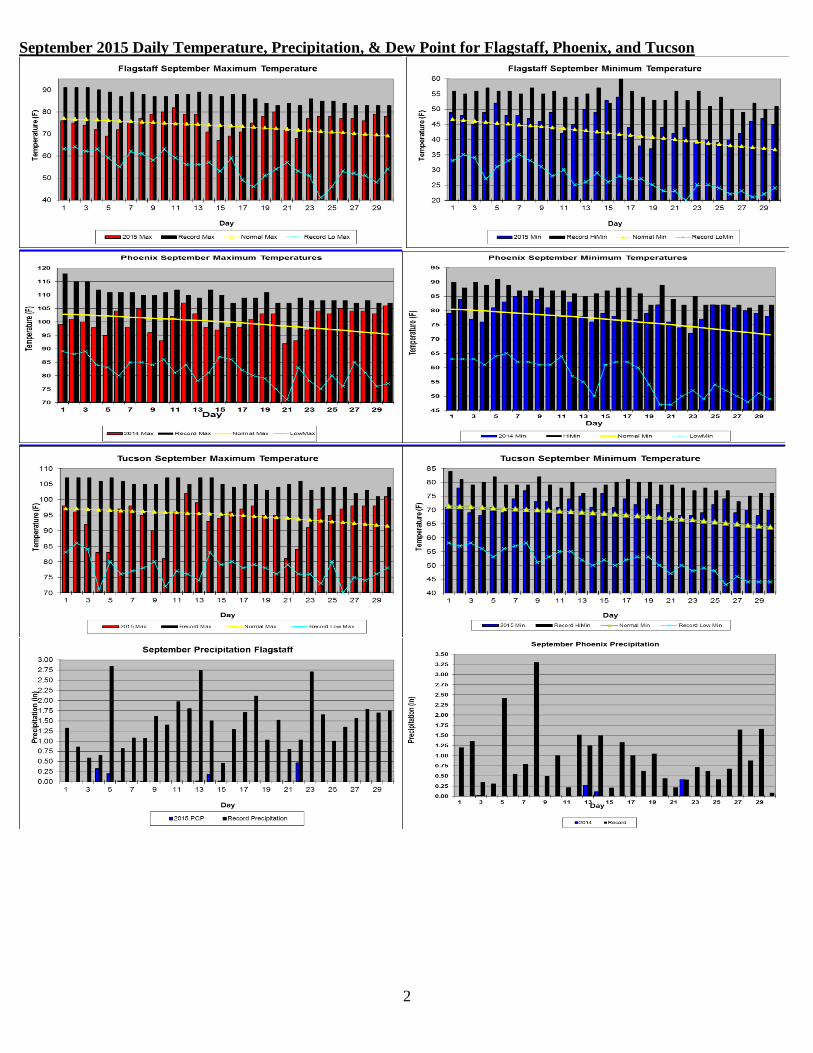
September 2015 Daily Temperature, Precipitation, & Dew Point for Flagstaff, Phoenix, and Tucson

3
Monsoon:
Overall the monsoon was wetter than average in northern, southern, and eastern Arizona, and drier than normal in
western Arizona, southeastern California and western Maricopa County. The NOAA tables below show monsoon totals
for selected cities in Arizona and southeastern California. For more monsoon statistics for cities in Arizona, visit the
Tucson NWS Monsoon website: http://www.wrh.noaa.gov/twc/monsoon/monsoon.php
the Flagstaff NWS Monsoon Summary webpage:
http://www.wrh.noaa.gov/media/fgz/FXC/files/Monsoon2015.pdf
and the Phoenix NWS Monsoon Summary webpage:
http://www.wrh.noaa.gov/psr/pns/2015/September/monsoon/monsoon_review.php

4

5
FLAGSTAFF CLIMATE STATISTICS
September 2015
This September was tied for 11warmest with 1948,
and had no significant ranking for precipitation.
Avg Max Temp (F) 75.3 Normal 73.4
Avg Min Temp (F) 45.4 Normal 41.8
Avg Mean Temp (F) 60.3 Normal 57.4
Departure from Normal (F) +2.9
Highest Monthly Avg Temp (F) 62.1 in 1947
Lowest Monthly Avg Temp (F) 52.3 in 1912
Highest Temp this month (F): 82 on 11th
Lowest Temp this month (F): 37 on 19th
Record High (F): 91 on 9/1,2,3/1948
Record Low (F): 20 on 9/22/1912
Temperature or precipitation records this month:
15th
HiMin 53 set, previous record 52 in 1997
Flagstaff Number of Days of:
Minimum Temp 50oF or higher 4
Minimum Temp 50oF or lower 6
Maximum Temp 80oF or higher 3
Maximum Temp 70oF or lower 4
Heating Degree Days 131 Normal 230
Cooling Degree Days 0 Normal 3
Degree base 65oF
Total September Precipitation 1.25”
Normal September Precipitation 2.38”
Departure from normal -1.13”
Greatest 24-Hr Precipitation 0.53” on 4-5th
Total Precipitation Year-to-Date 19.67”
Departure from Normal +3.10”
Number of Days:
Clear 22
Partly Cloudy 8
Cloudy 0
Greatest September Precipitation 6.75” in 1983
Least September Precipitation 0.00” in 1955, 1957,
1973, 1992
Average Wind Speed 5.4 mph
Highest Peak Gust 369mph from 220o on 16
th

6
PHOENIX CLIMATE STATISTICS
September 2015
This September was tied with 2008 as the 12th
warmest and had no significant ranking for
precipitation.
Avg Max Temp(F) 100.3 Normal 99.8
Avg Min Temp(F) 76.4 Normal 76.9
Avg Mean Temp (F) 89.9 Normal 88.4
Departure from Normal (F) +1.5
Highest Monthly Avg Temp (F) 92.2 in 2001
Lowest Monthly Avg Temp (F) 79.9 in 1900, 1912
Highest Temp this month (F): 107 on 12th
Lowest Temp this month (F): 72 on 23rd
Record High (F): 113 on 9/05/1945
Record Low (F): 47 on 9/20-21/1965, 9/22/1895
Temperature or precipitation records this month:
22nd
Precip 0.41” tied, first set in 1987
25th
HiMin 82 set, first set in 1982
26th
HiMin 82 set, first set in 2010
Phoenix Number of Days of:
Minimum Temp 80oF or lower 18
Minimum Temp 85oF or higher 2
Maximum Temp 100oF or lower 14
Maximum Temp 105oF or higher 4
Heating Degree Days 0 Normal 0
Cooling Degree Days 752 Normal 700
Degree base 65oF
Total September Precipitation 0.81”
Normal September Precipitation 0.64”
Departure from normal +0.17”
Greatest 24-Hr Precipitation 0.41” 9/22
Total Precipitation Year-to-Date 5.98”
Departure from Normal +0.06”
Number of Days:
Clear 11
Partly Cloudy 16
Cloudy 3
Greatest September Precipitation 5.41 in 1939
Least September Precipitation 0.00” in 1973,
1968, and 1988 and 13 other years.
Average Wind Speed 6.3 mph
Highest Peak Gust 57 mph from 200o on 14
th
TUCSON CLIMATE STATISTICS
September 2015
This September was tied for 19th
warmest with 1995
and 2014 and had no significant ranking for
precipitation.
Avg Max Temp(F) 93.9 Normal 94.5
Avg Min Temp(F) 71.7 Normal 68.6
Avg Mean Temp(F) 82.8 Normal 81.6
Departure from Normal (F) +1.2
Highest Monthly Avg Temp (F) 84.82 in 2000
Lowest Monthly Avg Temp (F) 76.3 in 1964
Highest Temp this month (F): 102 on 12th
Lowest Temp this month (F): 68 on 22nd
, 23rd
, 29th
Record High (F): 107 on 09/14/2000, 9/11-11/1990,
Record Low (F): 43 on 098/26/1913
No temperature or precipitation records this month
Tucson Number of Days of:
Minimum Temp 70oF or lower 11
Minimum Temp 75oF or higher 4
Maximum Temp 905oF or lower 6
Maximum Temp 100oF or higher 2
Total September Precipitation 2.40”
Normal September Precipitation 1.29”
Departure from normal +1.11”
Greatest 24-Hr Precipitation 1.04” on 21-22
Total Precipitation Year-to-Date 10.54”
Departure from Normal +1.34”

7
Greatest September Precipitation 5.60” in 2011
Least September Precipitation 0.00” in 1898,
1953, 1957, 19598, 1968.
Number of Days:
Clear 23
Partly Cloudy 3
Cloudy 0
Average Wind Speed 6.7 mph
Highest Peak Gust 49 mph from 280o on 22
nd
Data are from the National Weather Service and the
National Climatic Data Center and are preliminary.

8
Wind Speeds for May:
Day Phoenix Flagstaff Tucson
(mph) Avg Max Avg Max Avg Max
1 4.9 15 5.2 22 6.3 25
2 5.8 26 6.3 26 7.1 32
3 9.2 45 9.9 29 9.3 36
4 7.3 23 5.3 26 6.7 22
5 8.5 23 6.9 22 5.7 17
6 5 18 4.2 20 4.8 24
7 5.1 18 2.4 25 6.5 17
8 6.9 29 3.4 20 6.6 23
9 6.4 23 3.1 21 4.7 19
10 8.1 24 5.2 23 2.7 16
11 5.8 19 3.4 21 4 16
12 5.8 23 4.1 20 6.9 25
13 7.4 34 6.9 35 7.6 43
14 6.9 57 7.9 34 7.2 26
15 6.5 19 15.1 39 8.6 35
16 8.2 21 14.6 39 6.3 24
17 4.7 20 8.3 32 5.3 25
18 4.4 19 3.8 21 6.4 20
19 6.4 26 5.1 28 10.5 36
20 6.8 24 2.7 18 11.3 M
21 7.6 30 4 16 5.8 25
22 6.6 50 2.8 18 4.7 49
23 3.3 13 3.1 21 4.7 14
24 4.6 15 4.6 23 5.3 18
25 9.3 26 4.2 26 11.1 31
26 7.3 24 3.5 22 10.4 26
27 5.2 15 4.4 31 6.2 16
28 5.4 16 3.9 23 6.1 20
29 4.5 16 3.4 22 5.5 16
30 5.2 17 4.8 23 7.5 20
Dew Points for May:
Daily Average Dew Point (oF):
Day Phx Tuc Flg
1 59 62 50
2 58 62 45
3 60 61 48
4 65 65 52
5 61 63 52
6 61 62 51
7 58 61 50
8 63 59 46
9 62 64 48
10 62 62 38
11 60 60 44
12 57 58 37
13 63 58 48
14 62 60 50
15 61 61 49
16 55 60 43
17 51 55 39
18 45 52 36
19 54 55 36
20 64 63 36
21 62 64 44
22 62 64 44
23 60 62 41
24 55 55 36
25 53 52 38
26 50 49 37
27 52 51 40
28 53 49 42
29 52 49 41
30 51 46 40

9
The

10
The lowest minimum temperatures ranged from 22oF at Grand Canyon East Entrance to 78
oF at Yucca. The lowest maximum temperature of 68
oF was
recorded at Snowslide Canyon, while the highest maximum temperature of 113oF was reported at Yuma. The lowest rainfall amount was 0.00” at several
stations in Arizona and the highest were 5.86” at Vail and 5.80” at Tubac. The lowest average dew point was 34oF at Window Rock and the highest was 68
oF
at Yuma. The highest peak wind gust was 51 mph at Yuma.

11
T
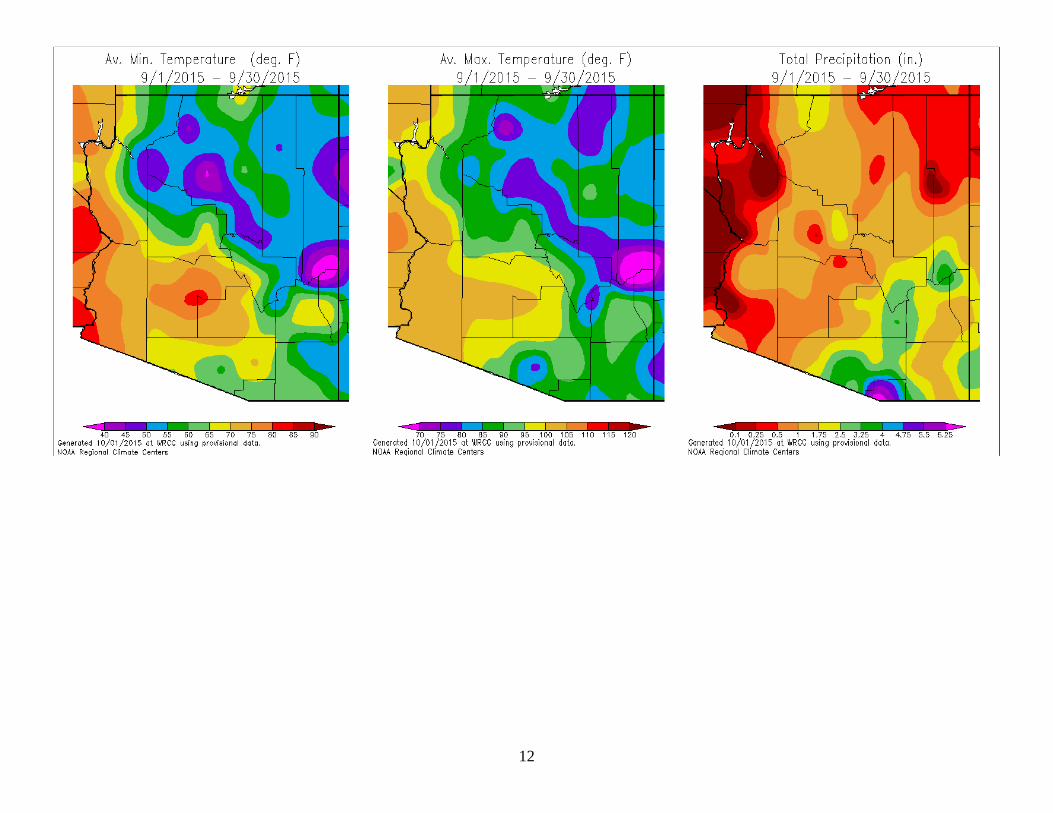
September 2015
The highest average minimum temperature was 80oF at Yuma and the lowest average minimum temperature was 40
oF at Sunset Crater. The highest average
maximum temperature was 106oF at Bullhead City and lowest average maximum temperature was 62
oF at Snowslide Canyon.
12

13
September
September minimum temperatures were 0 to 6oF warmer than average across northern Arizona, while a few locations in southern Arizona had slightly cooler
than average temperatures. Daytime temperatures were 0 to 3oF warmer than average across northern Arizona. Southern Arizona was 0 to 3
oF cooler than
average due to increased thunderstorm activity in southern and southeastern Arizona. The cold bullseye in southern Gila County is an error, likely due to a
recent change in the sensor location. September precipitation was concentrated in southern Arizona, with one very strong storm in southern Utah causing
flash flooding on the Arizona Strip that swept away two vehicles and killed 12 people in Hildale, UT and Colorado City,AZ

14
15
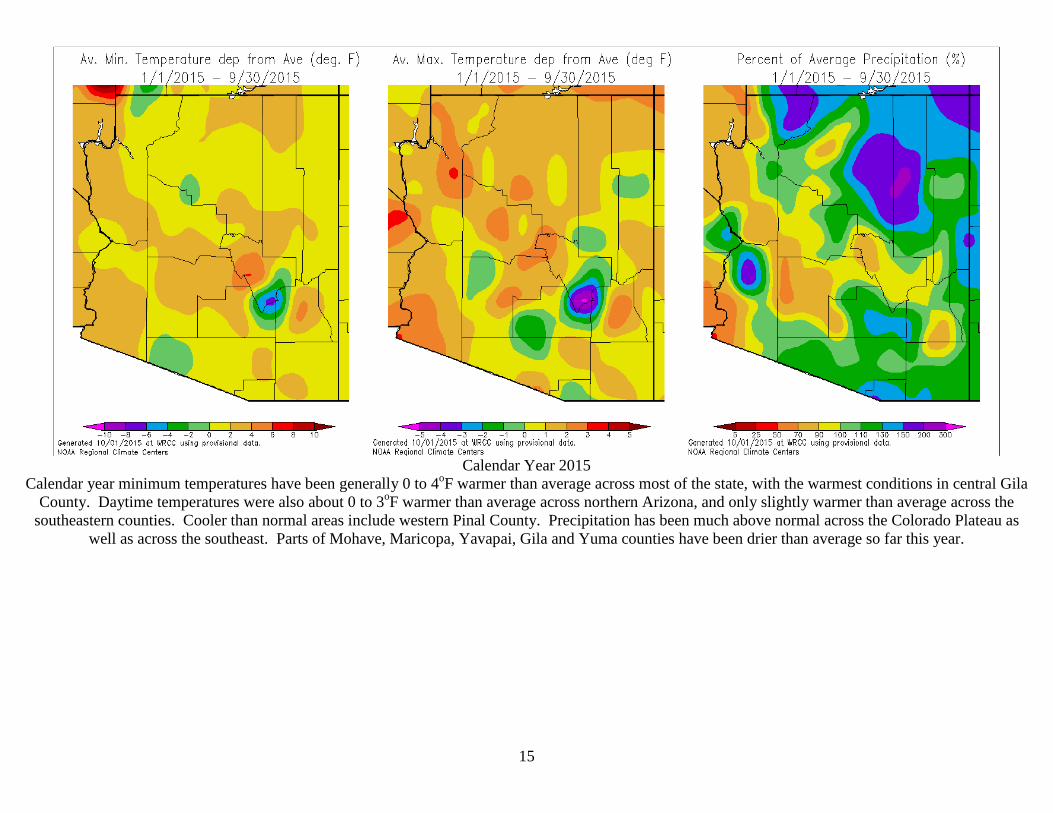
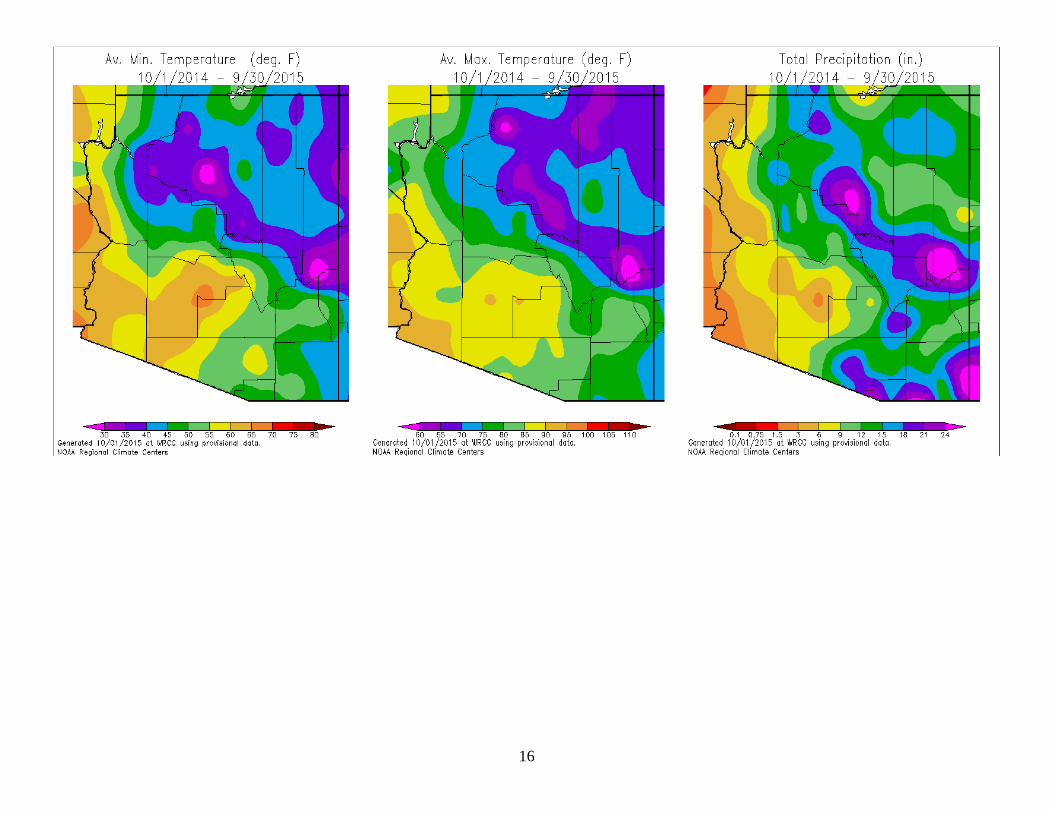
Calendar Year 2015
Calendar year minimum temperatures have been generally 0 to 4oF warmer than average across most of the state, with the warmest conditions in central Gila
County. Daytime temperatures were also about 0 to 3oF warmer than average across northern Arizona, and only slightly warmer than average across the
southeastern counties. Cooler than normal areas include western Pinal County. Precipitation has been much above normal across the Colorado Plateau as
well as across the southeast. Parts of Mohave, Maricopa, Yavapai, Gila and Yuma counties have been drier than average so far this year.
16

17
2015 Water Year
The water year ended with minimum temperatures 1 to 4oF warmer than average across the northern 2/3 of the state and as much as 2
oF warmer than average
in the southeast. Daytime temperatures have been 1.5 to 3oF warmer than average across northern Arizona and the western counties. Southeastern Arizona
has been 0.5 to 2oF warmer than normal, with cool pockets in western Maricopa and Pinal Counties. The cool bullseye is due to a recent sensor move in Gila
County. Precipitation has been well below average in Maricopa, Yavapai, Mohave, and Yuma counties. The Colorado Plateau has received 120 to 200% of
normal precipitation, and southern Arizona is also wetter than average. The Mogollon Rim, however, did not have a wet year..

18
September Mean Temperature Graphs – Flagstaff, Phoenix, and Tucson 1895-2015:

19
September Mean Precipitation Graphs – Flagstaff, Phoenix, and Tucson 1895-2015:

20
2015 Cumulative Precipitation Graphs – Flagstaff, Phoenix and Tucson:
Flagstaff is 3.10” wetter than normal, Tucson is 1.34” wetter than normal and Phoenix is 0.06” wetter than normal.
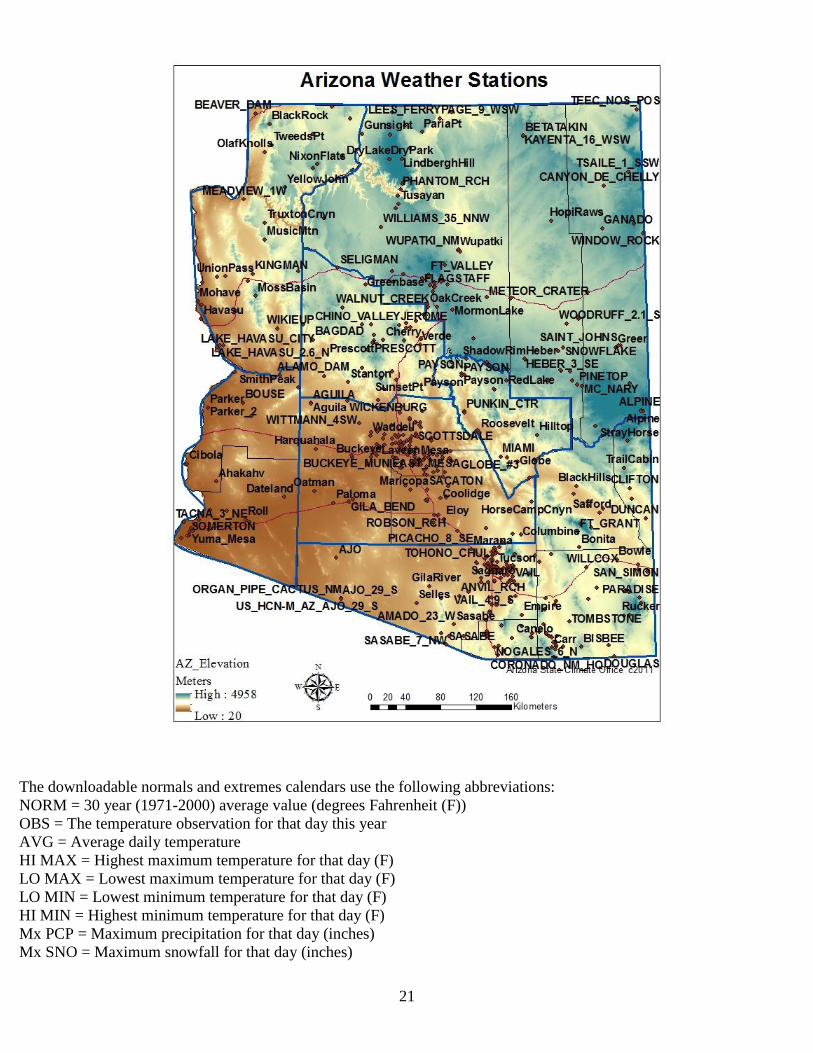
21
The downloadable normals and extremes calendars use the following abbreviations:
NORM = 30 year (1971-2000) average value (degrees Fahrenheit (F))
OBS = The temperature observation for that day this year
AVG = Average daily temperature
HI MAX = Highest maximum temperature for that day (F)
LO MAX = Lowest maximum temperature for that day (F)
LO MIN = Lowest minimum temperature for that day (F)
HI MIN = Highest minimum temperature for that day (F)
Mx PCP = Maximum precipitation for that day (inches)
Mx SNO = Maximum snowfall for that day (inches)