the role of structure-function relationships in
TRANSCRIPT

THE ROLE OF STRUCTURE-FUNCTION RELATIONSHIPS IN HYDROXYPROPYL
METHYLCELLULOSE ON EMULSION STABILITY
by
HANNAH OLUWAFUNMIKE AKINOSHO
(Under the Direction of Louise Wicker)
ABSTRACT
The substituents on hydroxypropyl methylcellulose (HPMC) influence emulsion stability
through viscosity effects, the formation of a gel network, and adsorption to the oil droplet
surface. Hydroxypropyl contents indicated the crystallinities of the HPMC grades, which
influenced the nature of the gels formed. Dynamic oscillatory measurements indicated that
entanglement networks formed in HPMC containing higher percentages of hydroxypropyl
groups (>8.8%) and lesser crystalline contents. Conversely, weak gels formed in HPMC
possessing lower hydroxypropyl contents (<8.7%) and higher crystallinities. Furthermore, FT-
IR studies identified differences in methyl contents, which affect the surface activity of HPMC.
The emulsion studies suggested that higher viscosities and methyl to hydroxypropyl ratios as
well as a gel network structure form more stable emulsions; however, the same properties do not
directly impact chemical stability. This research aims to study the role of structure-function
relationships in polysaccharide emulsifiers that provide physical and chemical stability.
INDEX WORDS: Hydroxypropyl methylcellulose; Emulsion; Lipid oxidation; Structure;
Substituents
THE ROLE OF STRUCTURE-FUNCTION RELATIONSHIPS IN HYDROXYPROPYL
METHYLCELLULOSE ON EMULSION STABILITY
by
HANNAH OLUWAFUNMIKE AKINOSHO
BSA, University of Georgia, 2008
A Thesis Submitted to the Graduate Faculty of The University of Georgia in Partial Fulfillment
of the Requirements for the Degree
MASTER OF SCIENCE
ATHENS, GEORGIA
2012

© 2012
Hannah Oluwafunmike Akinosho
All Rights Reserved

THE ROLE OF STRUCTURE-FUNCTION RELATIONSHIPS IN HYDROXYPROPYL
METHYLCELLULOSE ON EMULSION STABILITY
by
HANNAH OLUWAFUNMIKE AKINOSHO
Major Professor: Louise Wicker
Committee: Joseph Frank
Robert A. Arnold
Electronic Version Approved:
Maureen Grasso
Dean of the Graduate School
The University of Georgia
August 2012

iv
TABLE OF CONTENTS
Page
LIST OF FIGURES ...................................................................................................................... vii
CHAPTER
1 POLYMER SCIENCE, EMULSION TECHNOLOGY, AND FOOD SCIENCE IN
HYDROXYPROPYL METHYLCELLULOSE STABILIZED EMULSIONS ......1
Introduction to Polymer Science ..............................................................................2
Emulsions ...............................................................................................................21
Food Science and Emulsion Stability ....................................................................32
Summary and Applications ....................................................................................37
2 THE CHARACTERIZATION OF HYDROXYPROPYL METHYLCELLULOSE
THROUGH THE ANALYSIS OF ITS SUBSTITUENTS .........................................58
Abstract ..................................................................................................................59
Introduction ............................................................................................................59
Materials and Methods ...........................................................................................61
Results and Discussion ..........................................................................................64
Conclusion .............................................................................................................72
3 THE PHYSICAL STABILITY OF AN EMULSION STABILIZED WITH
HYDROXYPROPYL METHYLCELLULOSE ..........................................................86
Abstract ..................................................................................................................87
Introduction ............................................................................................................87

v
Materials and Methods ...........................................................................................89
Results and Discussion ..........................................................................................93
Conclusion ...........................................................................................................104
4 THE CHEMICAL STABILITY OF AN EMULSION STABILIZED WITH
HYDROXYPROPYL METHYLCELLULOSE ........................................................121
Abstract ................................................................................................................122
Introduction ..........................................................................................................122
Materials and Methods .........................................................................................124
Results and Discussion ........................................................................................126
Conclusion ...........................................................................................................131
REFERENCES (CHAPTER 1)......................................................................................................43
REFERENCES (CHAPTER 2)......................................................................................................82
REFERENCES (CHAPTER 3)....................................................................................................117
REFERENCES (CHAPTER 4)....................................................................................................138

vi
LIST OF TABLES
Page
Table 1-1: Hue Angles and Their Associated Colors ....................................................................40
Table 2-1: Methylation (%), Hydroxypropylation (%), Viscosity (Pa·s), and Merthyl to
Hydroxypropyl Ratio of Five Grades of HPMC ................................................................73
Table 2-2: FT-IR and Raman Bands and Associated Bonds .......................................................73
Table 2-3: Percent Free Water, Peak Onset (˚C), and Temperature of Onset (˚C) of HPMC from
DSC Measurements ...........................................................................................................73
Table 3-1: Viscosities and Percent Substitution in Three HPMCs ..............................................106
Table 3-2a: De Brouckere Mean Diameters of the Emulsions ....................................................106
Table 3-2b: Sauter Mean Diameters of the Emulsions ................................................................106
Table 3-3: Mean Rate of Change in Particle Size per day for Each Emulsion ............................107

vii
LIST OF FIGURES
Page
Fig. 1-1: Fig. 1-1 illustrates the precipitation of HPMC out of solution at elevated temperatures
as a result of enhanced hydrophobic interactions ..........................................................................40
Fig. 1-2: Fig. 1-2a. is an illustration of cone and plate geometry, while 1-2b. is an illustration of
parallel plate geometry ...................................................................................................................41
Fig. 1-3: Fig. 1-3. illustrates the composition of an oil-in-water (O/W) emulsion ........................41
Fig. 1-4: L*a*b Coordinate System ...............................................................................................42
Fig. 1-5: When the surface charge of an oil droplet and prooxidant are opposite, oxidation is
promoted. However when the surface charge of an oil droplet and prooxidant are the same,
repulsive forces are generated that retard oxidation ......................................................................42
Fig. 2-1: The FT-IR spectra of the five HPMC .............................................................................74
Fig. 2-2: The normalized FT-IR spectra of the five HPMC between 2850 and 2800 cm-1
to
demonstrate difference in the methyl content. The different intensities of the peaks at 2835 cm-1
provide indications of the methyl contents of the HPMC ..............................................................75
Fig. 2-3: The figure above depicts the association between the percent methylation from gas
chromatography and the area under the curve as represented by ATR-FT-IR .............................76
Fig. 2-4: The superimposed Raman spectra of the five grades of HPMC are pictured above.
Broadening of each spectrum is apparent in the 1220 to 2220 cm-1
range. ...................................77
Fig. 2-5: Broadening of the Raman spectrum of each HPMC between 1540 cm-1
and 1660 cm-1
.
BN40M possesses the narrowest spectrum, while AN6 possesses the broadest spectrum ............78

viii
Fig. 2-6: Thermogram of the 2% w/w dispersion between -50°C and 30°C .................................79
Fig. 2-7: Variation of G’ (filled) with angular frequency (rad/s) for AN6 and AN50 at a strain of
0.3%. G” and tan δ are not shown because only G’ was observed during the frequency sweep ..80
Fig. 2-8: Variation in G’ (filled), G” (empty), and tan δ (gray) with angular frequency (rad/s) for
BN40M, CN40H, and CN10T at a strain of 1.0%. ........................................................................81
Fig. 3-1a-d: Plots of the particle size (µm) of the emulsions against day (a) day versus D[4,3] µm
at 25˚C (b) day versus D[3,2] µm at 25˚C (c) day versus D[4,3] µm at 37˚C (d) day versus D[3,2]
µm at 37˚C….. .............................................................................................................................108
Fig. 3-2a-c: The illustrations demonstrate the changes in the particle size distribution of AN50 at
25˚C over 12 days ........................................................................................................................110
Fig. 3-3a-d: Fig. 3a-d. are representative illustrations to display the change in the particle size
distributions and their changes over 12 days in each emulsion stored at 25˚C and 37˚C. (a) GA
stabilized emulsion (b) AN6 stabilized emulsion (c) AN50 stabilized emulsion………………111
Fig. 3-4: mm of emulsion versus (%) Backscattering in the Turbiscan plot of BN40M at 37˚C
over 12 days…………………………………………………………………………………….113
Fig. 3-5a-c: Images of the emulsions from light microscopy after 12 days of storage (a) Image of
the emulsion stabilized with AN50 at 37˚C that demonstrate encapsulation (b) Ostwald ripening
in the emulsion stabilized with AN6 (c) Flocculation in the emulsion stabilized with GA stored at
37˚C. (scale bar=1µm) ...............................................................................................................113
Fig. 3-6: Light microscopy images of the emulsions at day 12. The variable particle sizes reflect
coalescence. scale bar = 5 µm .....................................................................................................114
Fig. 3-7: Variation in the dynamic moduli with angular frequency (rad/s) in a 2% w/w BN40M

ix
stabilized emulsion stored at 25˚C; G’(filled), G”(empty), tan δ (gray) ......................................115
Fig. 3-8: Angular Frequency (rad/s) versus G’ (filled) immediately after homogenization and at
day 12 in the BN40M emulsions stored at 25˚C and 37˚C in BN40M. The G’ values at 25˚C
after day 0 and 12 were not significantly different, while at 37˚C the values were significantly
different …................................................................................................................................116
Fig 4-1a-b: Fig. 1a-b illustrates the plot of hue angle against time in the emulsions stored at (a)
25˚C and (b) 37˚C. .......................................................................................................................132
Fig. 4-2a-b: The figures reflect the change in particle size with day (a) at 25˚C and (b) 37˚C. ..133
Fig. 4-3a-b: The figures demonstrate the linear association between particle diameter L* and
D[4,3] in AN6 and GA at (a) 25˚C and (b) 37˚C.. .......................................................................134
Fig 4-4a-b: Fig. 4a-b displays the linear decline in mg of β-carotene with time at (a) 25˚C and (b)
37˚C in the four emulsions…………………………………………………………………….134
Fig. 4-5: Fig. 5 displays the percentage of β-carotene retained after homogenization, at 25˚C and
37˚C after 12 days of storage. The initial concentration of β-carotene was 8 mg per g of
MCT…………………………………………………………………………………………...136
Fig. 4-6a-b: Representative plots of chroma vs. mg of β-carotene, demonstrating the linear
dependence of chroma on dye concentration ...............................................................................137

1
CHAPTER 1
POLYMER SCIENCE, EMULSION TECHNOLOGY, AND FOOD SCIENCE
IN HYDROXYPROPYL METHYLCELLULOSE STABILIZED EMULSIONS
Polymer science, emulsion technology, and food science are delicately intertwined in
understanding and achieving the stability of an emulsion stabilized by a polymer.
Hydroxypropyl methylcellulose (HPMC) is a polymer and emulsifying agent that can be used to
stabilize an emulsion containing medium chain triglycerides, β-carotene, and water. The final
orange color and nutritive value of this emulsion represent a balance between emulsion stability,
the progression of the oxidation of β-carotene, and the effectiveness of the emulsifier. Dissecting
the emulsion and studying the factors affecting the aforementioned properties will provide
valuable insight into the effectiveness of HPMC as an emulsifier as well as a color and oxidation
protectant.
HPMC provides stability to oxidation sensitive emulsions through an increase in the
continuous phase and adsorption to the oil droplet surface. Together, these properties help to
promote emulsion stability by facilitating the formation of small droplet sizes and decreasing the
frequency of collisions that eventually lead to emulsion instability. HPMC may also provide
stability against oxidation by shielding the encapsulated oil from reactions with radical species
and prooxidants. The purpose of this study is to examine the effect of different varieties of
HPMC in stabilizing color and preserving the β-carotene content in an emulsion.
2
Introduction to Polymer Science
Polymers are macromolecules that are composed of monomeric units, or repeating chemical
subunits, bound together by covalent linkages. Polymers are formed through polymerization
reactions, such as condensation or radical polymerization addition, and may be synthetic or
biological in origin. The polymer structures formed during these polymerization reactions may
result in branched, linear, or other patterned structures (i.e. step-ladder, dendrimer, etc.).
Secondary and tertiary structures may also be produced as a result of intramolecular folding due
to hydrophobic interactions, hydrogen bonding, and ionic bonding; these structures are often
observed in biopolymers such as proteins and nucleic acids (Young & Lovell, 1991).
Polymers may be entirely amorphous, entirely crystalline, or they may be semicrystalline, a
state in which polymers exhibit both crystalline and amorphous features. Amorphous polymers
and regions refer to entangled polymer chains that undergo segmental motion. The onset of
segmental motion occurs at temperatures above the glass transition temperature. Crystalline
polymers or regions are ordered structures that are closely packed together. Crystallinity is lost
at temperatures above the melting temperature at which viscous flow occurs (Young, et al.,
1991). Wang et. al (2006) used X-ray diffraction (XRD) to determine the crystalline nature of
HPMC and found that HPMC has a semicrystalline structure. The percent crystallinity from the
study as XRD was 28.39% (Wang, Dong, & Xu, 2007). A separate study conducted by
Sangappa (2008) verified the semicrystalline nature of HPMC, finding that the percent
crystallinity of their HPMC sample, also determined by XRD, was 42% (Sangappa, et al., 2008).
The characteristics of a polymer depend on a number of properties: molecular weight
(Funami, et al., 2007; K. Jumel, et al., 1996; Keary, 2001), degree of crystallinity (Sangappa, et
al., 2008; Wang, et al., 2007), substituent distribution (Adden, Müller, & Mischnick, 2006a,

3
2006b; McCrystal, Ford, & Rajabi-Siahboomi, 1999), and others. Manipulating these properties
becomes important when developing and applying polymers in the appropriate settings.
Hydrocolloids
Colloids describe particles that are dispersed into a medium (Robins & Wilde, 2003).
Hydrocolloids are rigid molecules that are dispersed into a continuous phase of water; the term is
used to describe polysaccharides and proteins that are used to influence the colloidal state
(Huang, Kakuda, & Cui, 2001; Takahiro, 2011). HPMC exhibits both of these properties.
HPMC is water-soluble, and the aggregate structure of HPMC is rigid and fibril (Bodvik, et al.,
2010).
Hydrocolloids are hydrophilic in nature, contain many hydroxyl groups, and form gels when
dispersed in water. Hydrocolloids retain water due to the hydrogen bonding that occurs between
the polysaccharide and water. The absorption and retention of water causes hydrocolloids to
form gels which vary in viscosity depending on the degree of entanglements within the
polysaccharide. Gelation may occur when hydrocolloids form hydrogen bonds within chains and
between chains of polysaccharides preferentially over hydrogen and ionic bonds with water
(Hall, 2009). Gelation in hydrocolloids may also occur due to hydrophobic interactions, cation
crosslinking, and other weak intermolecular interactions (Phillips & Williams, 2000). Research
concerning applications of hydrocolloids such as HPMC in foods include but are not limited to
dough and/or bread (Correa, Añón, Pérez, & Ferrero, 2010; Guarda, Rosell, Benedito, & Galotto,
2004; Rosell, Rojas, & Benedito de Barber, 2001), flavor (Cook, Linforth, & Taylor, 2003;
Hollowood, Linforth, & Taylor, 2002), and seafood (H. Chen, 2007; H. Chen, Lin, & Kang,
2009).

4
Cellulose
Hydroxypropyl methylcellulose is a derivative of cellulose. A cellulose derivative contains a
cellulose backbone with specific substituents attached. Cellulose is a semicrystalline
biopolymer, or a polymer of biological origin, that is present in plants. It is composed of
repeating D-glucopyranose units bound by β-14-glycosidic linkages. In plants, cellulose
provides strength, resistance to dissolution in water, and resistance to enzymatic degradation due
to its linear and closely packed structure. Linearity promotes efficient packing and the formation
of an ordered crystalline structure. Hydrogen bonding within chains and between the free
hydroxyl groups of neighboring chains facilitates the close packing of adjacent chains
(Teegarden, 2004).
The solubility of cellulose is modified by an esterification procedure. The esterification
reaction may introduce methyl, ethyl, or other alkyl substituents the cellulose backbone to
produce a cellulose ether or derivative (Adden, Müller, & Mischnick, 2006). These modified
celluloses are semisynthetic polymers (Alvarez-Lorenzo, et al., 1999). The addition of methyl
and hydroxypropyl substituents in HPMC disrupts the crystalline structure of native cellulose,
making the formerly insoluble cellulose water-soluble (Thielking & Schmidt, 2000).
During the production of HPMC, cellulose is extracted from a plant source such as wood
pulp using an alkaline base at high temperatures (Adden, et al., 2006a). The alkali base induces
swelling and prepares the cellulose structure for the addition of substituents. The degree of
swelling can be manipulated by adjusting the ratio of caustic to cellulose (Thielking, et al.,
2000). As hydrogen bonds between polymer chains are disrupted, alkyl halides or oxiranes are
added to supply the methyl and hydroxypropyl substituents. Sources of these substituents
include methyl oxide, methyl chloride, and propylene oxide; the final proportions of substituents

5
can be altered by changing the molar ratio of these sources (Adden, et al., 2006a;
-Alami, & Larsson, 2009).
Cellulose ethers swell and increase the viscosity of the solvent in which they are dispersed.
The dissolution and swelling behavior of cellulose derivatives depends on the number of free
hydroxyl groups and the number and type of substituents introduced to the cellulose backbone
(Thielking, et al., 2000). Swelling increases as viscosity grade and concentration increase (Sai
Cheong Wan, Wan Sia Heng, & Fun Wong, 1995). The pH of an HPMC solution affects the
swelling kinetics of HPMC. Tritt-Goc and Pislewski (2001) used the relaxation times gathered
from magnetic resonance imaging to conclude that the extent of radial swelling was greater at a
pH=6.0 than at pH=2.0 (Tritt-Goc & Piślewski, 2002). Fewer hydrogen bonds form between
chains and water as more alkyl substituents are added (Bodvik, et al., 2010).
As mentioned earlier, variation occurs in the substitution patterns of cellulose ethers such as
HPMC. The degree of substitution refers to the average number of substituted hydroxyl groups
in a glucose unit. The molar degree of substitution refers to the average number of substituents
in a glucose unit within the polymer chain (S. Silva, et al., 2008). There is substantial variation
between the placement of substituents, leading to batch to batch variation in the characteristics
and functions of the derivative (Adden, et al., 2006a).
Each glucose unit in cellulose contains three hydroxyl groups at C2, C3, and C6 that can
participate in the etherification reactions; however, each of these hydroxyl groups differs in
acidity which affects its reactivity. As a result, some hydroxyl groups have a higher probability
of being substituted than others. To add to the complexity of the substituent distribution, some
regions of HPMC may be more highly substituted than others ( ).
Researchers have noted that the production of cellulose ethers suffers from inhomogeneity in the

6
distribution of substituents and have made extensive attempts to characterize the substitution
patterns of HPMC (Adden, et al., 2006a; Viridén, Larsson, Schagerlöf, & Wittgren, 2010;
Viridén, Larsson, & Wittgren, 2010; n, et al., 2009; Viridén, Wittgren, Andersson, &
Larsson, 2009). The hydroxypropyl group can be substituted as well ( ). For
example if methylation follows hydroxypropylation, the hydroxyl group may become capped
with methyl groups (Ibbett, Philp, & Price, 1992).
Fractionation of Cellulose Ethers
The etherification of cellulose to form HPMC results in a myriad of disubstituted products; in
other words, the products formed are polydisperse. Fractionation is a technique used to separate
polymers based on solubility and molecular weight into more homogenous parts or fractions.
Polymers can be precipitated from solution through the addition of a nonsolvent, or a liquid that
does not dissolve the polymer (Freitag & Stoye, 2008; Wolf & Enders, 2011). The selection of a
nonsolvent will vary by polymer type (Freitag, et al., 2008). First, the polymer is dissolved in a
suitable solvent to allow for the complete dissolution of the polymer. Next, the polymer is
recovered incrementally through successive and small additions of nonsolvent. The first
molecules to precipitate are those of the highest molecular weight, which are least soluble in
solution (Wolf, et al., 2011). The nonsolvent is added to a stirring polymer solution at a constant
temperature and is no longer added when the solution becomes turbid. The turbid solution is
heated to allow the polymer to dissolve again and is cooled to the initial temperature (Cowie,
1991). As more nonsolvent is added, lower molecular weight fractions are removed (Wolf, et
al., 2011).
Although no known studies have been published regarding HPMC and fractionation, studies
have been published regarding the successful application of fractionation through the addition of

7
nonsolvent to methylcellulose. In this experiment, the researchers added specific amounts or
ratios of chloroform, methanol, and/or water to a solution of methylcellulose to achieve a
polarity based fractionation. Chloroform is nonpolar and served as the nonsolvent;
methylcellulose is insoluble in a chloroform solution. Methanol was more polar than
chloroform, while water was the most polar solvent of all. Adden and others collected the
fractions and tested the degree of substitution of each (Adden, et al., 2006b).
Fractionation can also be automated to separate cellulose derivatives based on molecular
weight. Field-flow fractionation has been applied to ethylhydroxyethyl cellulose to separate the
compounds by molecular weight and particle size (Andersson, Wittgren, Schagerlöf,
Momcilovic, & Wahlund, 2003; Andersson, Wittgren, & Wahlund, 2001). Fractionation can
also be accomplished by lowering the temperature of the polymer solution as well as by using
column chromatography (Cowie, 1991).
Thermal Gelation
Gels are three dimensional polymer networks that absorb and entrap solvent; most often,
water is the solvent present in gels (Chang & Zhang, 2011). At elevated temperatures, HPMC
forms a thermally induced gel. The end product of thermal gelation is a physical gel, or a gel
that results from hydrophobic and van der Waals interactions. Unlike chemical gels which form
through covalent or ionic bonding, physical gels involve interactions between neighboring
HPMC molecules (Sarkar, 1995). Hydrophobic interactions are the primary mechanism for
gelation (Hussain, Keary, & Craig, 2002). The van der Waals interactions that also give rise to
these gels are weak and temporary, making the gels thermoreversible under certain conditions
(Osada & Khokhlov, 2002; Sarkar, 1995). Bajwa and others (2009) studied the transition of
aqueous HPMC solutions to gels as a function of temperature using Attenuated Total Reflectance

8
Fourier Transform Infrared spectroscopy (ATR-FT-IR), dynamic oscillatory measurements, and
turbidimetry. Focusing on the ATR-FT-IR measurements, the spectra obtained varied in the
intensity of the bands between 1200 and 950 cm-1
as temperature increased from 30 to 75°C.
The bands in this region represented several types of C-O vibrations. At 56˚C, the intensity of
these bands increased sharply, which indicated the onset of gelation. The intensity of these
bands were responsive to changes in the hydrogen bonding between water and HPMC that
predominate at low temperatures and diminish as temperature increases due to the shift in the
predominance of other inter- and intramolecular association that develop (Bajwa, Sammon,
Timmins, & Melia, 2009). Furthermore, HPMC is able to absorb solvent due to the presence of
methyl and hydroxypropyl substituents that interfere with the close packing between neighboring
chains. The onset of gelation is characterized by a sharp increase in the viscosity of the solvent
at sufficient polymer concentrations known as the critical concentration. The resulting gel is
transparent, pseudoplastic, and smooth (Haque, Richardson, Morris, Gidley, & Caswell, 1993;
Nussinovitch, 1997). Silva and others (2008) studied the aggregation and gelation in 2% w/w
solutions of HPMC. The HPMC solutions used were heated between 25˚C and 90˚C, and the
changes of viscosity with temperature were monitored. The viscosity of the HPMC solution
decreased as the temperature increased between 25˚C and 55˚C. However after 55˚C, the
viscosity of the HPMC solution increased (S. Silva, et al., 2008).
The properties of a HPMC gel can be manipulated by changing the degree of substitution,
molar mass, substitution pattern, or substitution content (Viridén, Larsson, & Wittgren, 2010).
Rheological measurements are often conducted to study the onset of gelation in HPMC (Bajwa,
et al., 2009; Bodvik, et al., 2010; Hussain, et al., 2002; S. Silva, et al., 2008); however, methods
using FT-IR (Bajwa, et al., 2009; Sammon, Bajwa, Timmins, & Melia, 2006) and reverse phase

9
liquid chromatography (Greiderer, Steeneken, Aalbers, Vivó-Truyols, & Schoenmakers, 2011)
have also been applied to study gelation.
The strength of the gels formed relies on several factors, including molecular weight,
substituent distribution, and substitution pattern. The mechanical properties of polymers
increase logarithmically above a critical molecular weight as molecular weight increases.
Generally, low molecular weight compounds have limited mechanical and hence structural
applications. Accordingly, high molecular weight HPMC forms high strength gels (Kornelia
Jumel, et al., 1996). Mitchell and others (1993) used a penetrometer to measure the penetration
depth of a cone tip in six percent w/w HPMC gels. The four gels differed in their substituent
contents. At the conclusion of the experiment, the gels did not demonstrate large differences in
gel strengths when compared to one another. Furthermore, greater proportions of hydroxypropyl
substituents decreased gel strengths (Mitchell, et al., 1993).
Research has demonstrated that cellulose derivatives that contain only methyl substituents
form firm gels, and the introduction of hydroxypropyl substituents results in less firm gels.
Hydroxypropyl molar substitution in two of the HPMC, 4HPM and 15HPM, were 0.13 and 0.21,
respectively. After heating at a rate of 1.5˚C/min throughout a range of 10-90˚C, the dispersions
containing 1.0% w/w HPMC were compared to a methylcellulose, 16M. The findings
demonstrated that both cellulose derivatives reach a minimum critical temperature that indicates
the onset of gelation during the temperature sweep. After reaching the critical temperature, the
complex viscosity of MC increases by several orders of magnitude, while the complex viscosity
of HPMC decreases by several orders of magnitude (Bodvik, et al., 2010). Fewer numbers of
hydroxypropyl substituents result in firmer gels as hydroxypropyl substituents are believed to
make gelation more difficult due to their large size and polar nature (Bodvik, et al., 2010;

10
Hussain, et al., 2002). The hydrophilic hydroxypropyl substituents impede particle aggregations
through entropic and steric means (Viridén, Larsson, Schagerlöf, et al., 2010).
Gelation in HPMC can be inhibited by introducing a homogenous substitution pattern
( ). Homogenous patterns result in highly ordered, crystalline structures.
Free hydroxyl groups that may participate in the etherification reaction become inaccessible in
crystalline structures. Generally, amorphous regions are more easily accessible than crystalline
regions and are the preferred sites of the etherification reactions (Wang, et al., 2007).
Lower Critical Solution Temperature
At high temperatures, HPMC decreases in solubility and phase separates out of solution.
This phenomenon is known as the lower critical solution temperature (Sarkar, 1995) theory
(Hussain, et al., 2002; Sarkar & Walker, 1995). At temperatures below the LCST, water forms
an ordered structure around the hydrophobic methyl groups in HPMC, and the solution is clear
(Fig. 1). As temperature increases, the ordered structure of water decomposes, leading to an
increase in entropy (Sarkar, 1995). HPMC loses its hydration shell, and the viscosity of the
solution decreases. The attraction of hydrophobic methyl residues between chains is accelerated
at the higher temperatures, and HPMC precipitates out of solution at a temperature known as the
cloud point. Beyond the cloud point, the solution of HPMC is cloudy (Sarkar, et al., 1995). The
LCST is reversible; upon cooling, the hydrogen bonds between the solvent and HPMC are
restored, and it dissolves back into solution. The cloud point can be adjusted by modifying the
amount of hydroxypropyl and methyl substituents. When the number of hydrophobic groups
increases, the cloud point decreases; when the number of hydroxypropyl groups increases, the
cloud point may increase or decrease (Thielking, et al., 2000). Because cloud point is relatively
easy to measure and to relate to physical structure, there are numerous studies regarding the

11
cloud point (Greiderer, et al., 2011; Hussain, et al., 2002; Kita, Kaku, Kubota, & Dobashi, 1999;
Kita, et al., 2003; Mitchell, et al., 1993; Sarkar, et al., 1995). Sarkar and Walker (1995) studied
cloud point measurements using an aluminum block with temperature control to heat the 0.5%
HPMC dispersion and identified decrease in the transmission of light through the sample to 50%
(T50) as the cloud point. The study revealed that the presence of hydroxypropyl groups lowered
the cloud point (Sarkar, 1995). Kita and others (2003) used a flourescence spectrophotometer
with the flourescent probe 8-anilino-1-naphthalene sulfonic acid ammonium salt, or ANS, to
identify and clarify the driving force for the cloud point. The final concentration of the HPMC
and ANS were 0.6% w/w and 500 mM, respectively. A burst of fluorescence intensity occurred
at approximately 50˚C, while the cloud point was observed at 56.3˚C. The preceding burst of
fluorescence intensity suggest that hydrophobic interactions precede phase separation (Kita, et
al., 2003).
Ionic strength of a dispersion affects the solubility of HPMC in solution (Nussinovitch,
1997). Salting in and salting out refer to the potential of certain salts to break or promote the
structure of water, respectively. When a salt breaks the structure of water, it disrupts the
hydrogen bonds between water molecules, causing bonds between polymer and water molecules
to form and increasing polymer solubility in solution. Salting out, however, enhances hydrogen
bonds between polymer molecules, thereby excluding the polymer from the solution; eventually,
the polymer falls out of solution due to its decreased solubility. Sardar (2011) investigated the
effect of salts (KCl, NaBr, NaCl, KBr, Na2SO4, NaNO3, and Na3PO4) on the cloud point of
HPMC and found a linear dependence between salt concentration and the observed cloud point.
As the salt concentrations increased between 0 and 0.16 mol/kg, the cloud point for all of the
HPMC dispersions decreased (Sardar, Kamil, Kabir ud, & Sajid Ali, 2011). Mitchell and others

12
(1990) studied the influence of salt on cloud point and concluded that anions exert a greater
effect than cations on the lowering of the cloud point (Mitchell, et al., 1990).
Analysis of HPMC
HPMC can be analyzed by a variety of techniques and instruments. This section covers the
principles behind a few instruments used to analyze HPMC and as well as their applications in
understanding the structure-function relationships of HPMC.
Raman Spectroscopy
Raman spectroscopy provides information regarding bonds and functional groups in a
sample. During analysis, the Raman spectrometer directs a laser beam towards a sample, which
results in the inelastic scattering of light (Kelsall, Hamley, & Geoghegan, 2005). The application
of an oscillating electric field alters the polarization of the electrons surrounding the nuclei of the
atoms. Nuclear motion ensues during scattering, and energy transfer occurs. Energy can be
transferred either to the molecule from the light source or to the scattered light source from the
molecule. The energy difference between the incident and scattered photon are different during
inelastic scattering (Smith & Dent, 2005).
Atoms vibrate when they are exposed to photons, and the transfer of energy is described by
Stokes and anti-Stokes processes. Stokes refers to the loss of energy by a photon, while anti-
Stokes refers to the gain of energy by a photon. The intensity in the Raman spectrum reflects the
intensity of the scattered at some Raman shift. The intensity is usually plotted against cm-1
under
the assumption that 1 cm-1
equals the energy of a photon with a wavelength of 2π (Jorio,
Dresselhaus, Saito, & Dresselhaus, 2011).
The spectrum provided by Raman spectroscopy can provide more information than bond
identification. The spectra obtained have been used to validate the formation of covalent bonds

13
between HPMC and ibuprofen. The spectra of pure HPMC, pure ibuprofen, and a mixture of
both were obtained using Raman; the absence of new bands in the HPMC-Ibuprofen spectrum
between 1500 to1800 cm−1
verified the absence of intermolecular interactions between materials
(Vueba, Batista de Carvalho, Veiga, Sousa, & Pina, 2006). The hydroxypropyl content of
HPMC and other cellulose ethers were associated using the ratio of intensities 1260 and 1367
cm−1
obtained by Raman and the percent hydroxypropylation determined by GLC; a high linear
association was established between these methods (Langkilde & Svantesson, 1995). In a study
conducted by Agarwal (2010), the degree of crystallinity of native cellulose was estimated using
Raman spectroscopy at two peak intensities, I380/I1096. At these intensities, the peaks experienced
the greatest sensitivity to changes in crystallinity. The ratio of these intensities provided
crystallinity estimations that were very close to the theoretical values obtained using a calibration
of certain ratios of 100 percent crystalline and 100 percent amorphous cellulose; interestingly,
the data from Wide Angle X-Ray Scattering (WAXS) did not produce estimations of crystallinity
that were as accurate as Raman (Agarwal, Reiner, & Ralph, 2010).
Fourier Transform-Infrared Spectroscopy
Fourier Transform-Infrared Spectroscopy, or FT-IR, can also be used to analyze the structure
of HPMC. FT-IR and Raman are commonly cited as complementary techniques. FT-IR requires
a change in a dipole moment to occur during vibrations of the bonds, while Raman requires a
change in polarizability. The peaks occur at the same wavenumbers, although the intensity of
the peaks may differ. Attenuated total reflectance (ATR), a type of FT-IR, describes the
complete internal reflection of infrared radiation when directed towards an ATR crystal. ATR
crystals are composed of compounds that have high refractive indices. When total internal
reflectance occurs, a short-lived wave forms upon contact of the IR beam with the crystal

14
surface. When a sample is applied to the crystal surface, the wave becomes weaker as the
functional groups in the sample absorb the IR radiation at specific wavenumbers. When solid or
powdered samples are analyzed using ATR-FT-IR, adequate contact becomes important in the
generation of reproducible results. When the interferogram is Fourier transformed, bands of
variable absorbance appear at a particular wavenumber (Hui, 2006). The FT-IR spectrum
contains absorptions at specific wavenumbers that correspond to specific functional groups. In
HPMC, absorption bands of interest have been attributed to -OH (1378.06 cm−1
and
3457.18 cm−1
), C-O (1063.57 cm−1
), and methyl groups (2928.28 and 1457.81 cm-1
) (Langkilde,
et al., 1995; Wang, et al., 2007).
The quantitative analysis of FT-IR is based on Beer-Lambert’s Law. The absorbance (Av), or
intensity of the peak at frequency v, IR is proportional to the molar absorptivity coefficient (εv),
path length (b), and concentration (c) by Beer Lambert’s Law (equation 1).
Av = εvbc (1)
Using this equation, calibration curves can be generated to associate peak intensity with known
concentrations when a primary analysis method has been used initially. The generation of
calibration curves may become a complex process that relies on multivariate analysis to obtain
useful results (Hui, 2006).
The degree of esterification, which indicates the number of carboxylic ester groups, of
polysaccharides such as pectin can be determined using FT-IR. In a study conducted by
Chatjigakis (1998), the number of esterified carboxylic groups in pectin was determined using
FT-IR. The researchers examined the degree of esterification by dividing the area of the band at
1749 cm-1
by the sum of the areas of the bands at 1749 cm-1
and 1630 cm-1
. The bands
unambiguously represent the absorptions belonging to the carboxylic acid and carboxylic ester

15
groups, respectively. The researchers then assumed that the degree of esterification is
proportional to the areas of these bands and used the formula in equation 2 to determine the
degree of esterification (Chatjigakis, et al., 1998).
(2)
The use of specific absorption bands may also provide useful information in the assessment of
the degree of methylation and/or hydroxypropylation in HPMC as there are no known studies
that using this process to establish the degree of etherification.
Rheology
The gels formed by HPMC are viscoelastic (Clasen & Kulicke, 2001). Viscoelastic materials
demonstrate a combination of viscous and elastic properties. The viscoelastic behavior of
HPMC or other gels can be assessed through either steady state or dynamic oscillatory
measurements. A perfectly viscous material is described by Newton’s law, which states that
viscosity (η) is proportional to strain rate (γ) as described by equation 3.
η = (3)
Strain rate, or shear strain rate, describes the rate at which strain changes with time, while
viscosity describes the resistance to flow. Shear stress (σ) describes a force that is applied to
surface but is not perpendicular to the surface. Newtonian fluids exhibit deformations that are
retarded by the viscosity of the liquid (Young, et al., 1991).
A perfectly elastic solid is known as a Hookean solid and is described by Hooke’s Law,
which argues that elasticity is proportional to strain rate (equation 4). Perfectly elastic solids
experience instantaneous deformations when a shear stress (σ) is applied. Shear strain (ε)
describes the deformation, or displacement, that occurs upon the application of the shear stress.

16
The shear modulus (G) is a constant that quantifies the resistance to deformation (Young, et al.,
1991).
σ = G ε (4)
Polymers are typically characterized by shear thinning behavior. Shear-thinning behavior
occurs when viscosity decreases as shear rate increases and may be explained by three possible
mechanisms. First, the shear may disrupt the structure of the material tested; afterward, the rate
of dissociation of particles exceeds the rate of association, causing shear thinning. Another
possible mechanism is the achievement of a more favorable orientation of molecules after shear
has been applied (Mezger, 2006). Lastly, the removal of the solvent that surrounds the particles
may be responsible for shear thinning behavior by reducing the density of chain entanglements
(Wilkinson & Ryan, 1998). Chen (2007) observed shear thinning behavior in solutions
containing five and ten percent HPMC and dilatant properties in a two percent HPMC solution
(H. Chen, 2007). Kulicke and others (1998) also observed shear thinning at sufficiently high
concentrations (0.05% w/w) of HPMC (Kulicke, Arendt, & Berger, 1998b).
Rheological measurements can be used to study the response of a material to
deformation. Shear deformations describe the application of a force to a surface. Shear can be
applied by using three types of drag flows: cone and plate, parallel plate, and concentric cylinder.
A cone and plate viscometer consists of an upper cone plate and a lower flat plate that
remains stationary during testing (Fig. 2a). The system is usually described by the radius of the
cone, the angle the cone forms with the bottom plate, and the gap width. The cone angle
describes the angle tip of the cone makes with the lower plate. Gap width describes the height of
the tip of the cone from the lower plate. The cone diameter describes the longest distance
between the two farthest points on the entire upper plate. The sample is placed between the cone

17
and plate, which do not come into contact with one another during testing. The cone and plate
rheometer applies homogenous shear to the solution tested. This instrument is useful for highly
viscous samples, which are generally tested at low shear rates (Swarbrick, 2005).
A parallel plate rheometer (Fig. 2b) uses two flat plates to measure the viscoelastic
properties of samples. The sample is inserted between the two plates, which causes
nonhomogeneous deformation in the sample. This type of rheometer places less emphasis on
gap height during testing and is better for use at high shear rates and variable temperatures
(Wetzel & Charalambous, 1998). Hussain and others (2002), for example, performed
temperature sweeps on three types of HPMC solutions between 20°C and 90°C heated at a rate
of 2˚C/min using the parallel plate geometry (Hussain, et al., 2002).
Concentric cylinders also consist of two parts which refer to the inner cylinder (bob) and
outer cylinder (cup). Concentric cylinders are generally used in low viscosity systems and are a
useful alternative to testing the viscoelastic properties of dilute solutions or suspensions due to
their increased sensitivity afforded by the large surface area (Gunasekaran & Ak, 2003). Similar
to parallel plate, the deformation is not constant across the sample (Wetzel, et al., 1998).
Selecting the geometry for rheological testing is important in obtaining quality data. Hollowood
and others conducted a study (2002) that sought to relate the viscosity of HPMC to the
perception of flavor. Stress-controlled rheological measurements were conducted to study the
flow behavior of the HPMC dispersions. Cone and plate geometry was used in the
measurements of high viscosity HPMC, while double gap geometry, a type of concentric
cylinder geometry, was used in the study of low viscosity HPMC. The findings indicated that
high viscosity HPMC reduce the perception of flavor above a critical concentration
(Hollowood, et al., 2002).

18
To ensure the greatest degree of accuracy during dynamic oscillatory testing, the linear
viscoelastic region must be determined prior to testing. The determination of this region helps
establish the points at which the observed viscoelastic responses are unrelated to stress or strain.
Furthermore, LVR dictates the parameters, the stress or strain, at which the experiment should be
conducted. This region can be established by conducting a strain or stress sweep (Gunasekaran,
et al., 2003).
Creep or dynamic oscillation measurements can be made to determine these regions.
During the creep experiment, the strain response is measured as a controlled stress is applied to a
sample. Several compliance curves are obtained. When the compliance curves overlap, the
linear viscoelastic region has been identified (Gunasekaran, et al., 2003).
Oscillatory measurements have been applied to study the behavior of gels formed using
HPMC, particularly as viscoelasticity changes with time. The storage modulus G’ and the
viscous modulus G” measure the viscoelastic behavior of the gels. In gels, the storage modulus
should be greater than the loss modulus. Furthermore, the G’ of the gels should be independent
of frequency (Sarkar, 1995).
Differential Scanning Calorimetry
During a DSC experiment, the difference in heat flow between a reference pan and a sample
pan is monitored as temperature increases or decreases by a steady rate (Sepe & Limited, 1997).
If a phase transition occurs as temperature changes, a peak appears on a plot of temperature
against enthalpy. The peak represents the difference between the heat flows of the two pans
(Rajinder, 1994). DSC can provide information regarding, but not limited to, the glass transition
temperature, melting temperature, and the degree of crystallinity (Sepe, et al., 1997).

19
MTDSC uses a sinusoidal oscillation of heating or cooling to obtain information about
reversible and irreversible temperature modulated events. The reversible heat flow provides
information regarding heat capacity, while the irreversible heat flow provides information
regarding the kinetic constituents of the total heat flow. Studies concerning the reversible heat
flow have helped in learning about the glass transition temperature of starches (Xie, et al., 2010).
The glass transition temperature of HPMC has been measured by McPhillips (1999) using
modulated temperature differential scanning calorimetry (MTDSC) measurements. Dry HPMC
was heated between 30˚C and 225˚C at a rate of 2˚C/min; the responses monitored were total
heat flow, non-reversing heat flow, and reversing heat flow. In the reversing heat flow curve, the
glass transition of HPMC appeared as an inflection point with a midpoint of 161.9˚C
(McPhillips, Craig, Royall, & Hill, 1999) This value is close to the glass transition temperatures
found using dynamic mechanical analysis during heating through a range of 140˚C to 250˚C at a
rate of 2˚C/min. The glass transition temperatures were 160, 170, and 175 °C for HPMC with
viscosities of 3, 6, and 15 mPa·S, respectively (Kararli, Hurlbut, & Needham, 1990).
DSC measurements can also provide information about the types, proportions, and
distribution of water in a solution containing HPMC. For example, Mitchell and others (1993)
demonstrated that bound and free water in HPMC can be differentiated by monitoring melting
temperature of free water between -30˚C and +20˚C, which was heated at a rate of 10°C/min
(Mitchell, et al., 1993).
In a dispersion of HPMC, there are three categories of water: Type I, Type II, and Type III.
Type I water refers to free water, or water that does not interact with the polymer. Type II water
refers to water that is loosely bound to the polymer. Type I water freezes and melts at the same
temperature as pure water; Type II water, however, experiences a freezing point depression and a
20
boiling point elevation as the polymer acts as an impurity in solution. Type III water represents
the tightly bound water that does not undergo any first order phase transitions (Ford, 1999).
These types of water were studied by McCrystal and others (1997) in solutions of HPMC and
other cellulose ethers as a function of hydration time, the rate of heating or cooling, and the
amount of polymer present in solution (McCrystal, Ford, & Rajabi-Siahboomi, 1997).
The distribution of water within a gel depends on polymer substitution. The presence of
hydrophobic and hydrophilic substituents affects the attachment of water to a polymer
(McCrystal, et al., 1999). Research has also demonstrated that smaller particle sizes and low
viscosities have smaller amounts of bound water (Nokhodchi, Ford, & Rubinstein, 1997).
Atomic Force Microscopy
Atomic force microscopy, or AFM, is a high resolution microscopy technique that can assess
the structural morphology of molecules such as hydrocolloids (Burey, Bhandari, Howes, &
Gidley, 2008). The atomic force microscope contains several elements that provide its high
degree of resolution and versatility, including the cantilever and tip. The cantilever, which may
be triangular or rectangular in form, contains a sharp tip at the end. The tip scans the surface of
the sample to produce a topographical image. The cantilever bends as forces are generated
between the tip and sample. A laser beam deflects from the rear of the cantilever as it moves,
and the movement is translated into a topological image of the sample surface (Somasundaran,
2006).
The AFM may operate in a variety of modes. In contact mode for example, repulsive
forces are exerted by the tip onto the surface from short range distances. In noncontact mode,
the cantilever vibrates, and Van der Waals interactions in the sample are detected by the tip.
This mode is desirable when studying soft surfaces. Tapping mode, or intermittent contact

21
mode, combines features of both the contact and noncontact modes. During tapping mode, the
cantilever vibrates and touches the surface with minimal destructive effects (Somasundaran,
2006).
Emulsions
Emulsions are generally composed of at least two immiscible phases that are temporarily
mixed with the help of an emulsifier (Fig. 3). Emulsifiers are amphiphilic molecules, meaning
that they contain hydrophobic and hydrophilic portions (Barbosa-Cánovas, et al., 2009). As a
result of their amphiphilic nature, emulsifiers can interact with both hydrophobic and hydrophilic
phases, stabilize them, and temporarily prevent phase separation of the emulsion. Emulsions are
thermodynamically unstable systems, meaning that all systems are destined to separate into two
phases. The temporary stability that is achieved over some defined time is known as kinetic
stability (McClements & Decker, 2000). After emulsions destabilize, the less dense oil rises to
the top and settles on the more dense water. The oil and water layers minimize the contact
surface area between the two phases; this occurrence is associated with an increase in positive
free energy in the system (McClements, et al., 2000).
In food systems, the two most commonly observed emulsions consist of two liquid
phases: oil and water. When droplets of one these phases are dispersed into another phase, the
emulsion is either an oil-in-water emulsion or water-in-oil emulsion. The first phase refers the
continuous phase, or the phase into which another phase is dispersed. The second phase
describes the dispersed phase that is placed into the continuous phase (Robins, et al., 2003). The
emulsifiers used in the food, pharmaceutical, and cosmetic industries may be proteins,
phospholipids, surfactants or hydrocolloids (Camino, Sánchez, Rodríguez Patino, & Pilosof,
2011). Emulsifiers lower the tension, or the cohesive forces between similar molecules, between

22
these two phases (Gaonkar, 1991). Effective emulsifiers should possess high interfacial
activities as well as adsorb to the droplet surface quickly to promote small particle sizes
(Camino, et al., 2011).
Each type of emulsifier derives its surface active behavior from different sources.
Specifically, HPMC derives its surface activity to the presence of methyl substituents, while
hydroxypropyl groups allow for the interaction of HPMC with water. Surface activity increases
as the hydroxyl content increases in HPMC with a viscosity of 4000 mPa·s (Gaonkar, 1991).
Some researchers suggest that the surface activity of HPMC exceeds that of proteins (Arboleya
& Wilde, 2005; Zhao, et al., 2009). Arboleya and others (2005) found that the surface activity of
HPMC and MC exceeded that of β-casein and β-lactoglobulin in a competitive adsorption
experiment (Arboleya, et al., 2005).
To form droplets in an emulsion, mechanical forces can be applied. High pressure
homogenizers are commonly used. Pressure differences supply the mechanical forces used to
produce oil droplets (Barbosa-Cánovas, et al., 2009). Large droplets with diameters less than 20
µm are produced initially by including a premix step with a high speed blender. The inclusion of
the premix step greatly affects the quality of the final emulsion. The large droplets are later
broken up using additional mechanical forces in the range of 2000 to 5000 psi to produce smaller
droplets with diameters less than one µm (Friberg, Larsson, & Sjöblom, 2004; Weiss, 2001).
Two stage homogenizers can be used to further reduce the particle sizes, which add additional
pass to the homogenization step with a pressure of 300 and 500 psi (Friberg, et al., 2004).
Membranes can also be used to produce droplets. As the dispersed phase passes through
the micropores of that membrane, the continuous phase flows parallel to the surface of the

23
membrane and detaches the newly formed droplets. The use of micropores generates narrow
particle size distributions (Barbosa-Cánovas, et al., 2009).
Small, uniform particle sizes typically translate into stable emulsions. Particle sizes can be
affected by physical variables such as the number of homogenization passages, pressure, and
temperature as demonstrated in the work conducted by Schulz and others (2000) (Schulz &
Daniels, 2000). At least two passes are recommended to obtain uniform particle sizes (Friberg,
et al., 2004). A number of instruments have been used to homogenize HPMC stabilized
emulsions: UltraTurrax T-25 (Camino, et al., 2011; Petrovic, Sovilj, Katona, & Milanovic,
2010), APV Homogenizer GmbH (Schulz, et al., 2000), and Yamato Ultra Disperser (Futamura
& Kawaguchi, 2012).
Although shear breaks up the continuous and dispersed phases into droplets, the droplets
desire to associate with each other when the shear forces are removed. Water molecules, for
example, participate in hydrogen bonding which contributes to a high degree of interfacial
tension and interferes with forming small droplets (Robins, et al., 2003). Emulsifiers reduce the
tendency for these droplets to associate with each other and promote small droplet sizes (Robins,
et al., 2003).
The surface tension and interfacial properties of three HPMC were examined by Gaonkar
(1991). Both properties were tested in oil-in-water emulsions and compared against emulsions
containing methylcellulose (MC), and the interfacial tensions of the three types of HPMC were
greater than that of methylcellulose. More specifically, the interfacial tension of highest
viscosity HPMC (4000 mPa∙S) was the greatest of all the other HPMC tested (6, 15,50 mPa∙S).
The emulsion stabilized with MC had the highest surface tension, while the HPMC stabilized
emulsions had lower surface tensions (Gaonkar, 1991).

24
Hydrocolloids as Emulsifying Agents
Conventionally, stabilizers, such as hydrocolloids, are added to emulsions to increase the
viscosity of the continuous phase of the emulsion (Barbosa-Cánovas, et al., 2009; Hall, 2009).
The increase in the viscosity of the continuous phase can immobilize individual oil droplets in an
entangled network of polysaccharide chains when the oil content of the emulsion is low.
However in emulsions with larger fractions of oil, stability is associated with the rheology of the
emulsion as opposed to the rheology of hydrocolloid aqueous phase (Dickinson & Leser, 2007).
High viscosity HPMC produce smaller droplet sizes than lower viscosity HPMC and provide
better stabilities against gravitational separation (Gaonkar, 1991).
Due to their hydrophilic nature, many hydrocolloids are not sufficiently surface active
(Huang, et al., 2001). Hydrocolloids are characterized by high degrees of polymerization and
molecular weights (Gaonkar, 1991). Accordingly, some hydrocolloids provide stabilization
through adsorption to the droplet surface and exhibit steric stabilization (Huang, et al., 2001).
Gums are generally hydrated for some time following preparation as the viscosity of the
hydrocolloid solution increases with time (Friberg, et al., 2004). The uptake of water in an
HPMC solution has been seen to increase with increasing hydration time (Mitchell, et al., 1993).
There are several properties an effective emulsifier should possess. For example,
effective emulsifiers should reduce interfacial tension as well as adsorb to the droplet surface
quickly (Camino, et al., 2011). When emulsifiers lower interfacial tension, they reduce the
surface area of the droplets produced. After the emulsifier has adsorbed onto the droplet surface,
it forms a film that surrounds the droplet to prevent interactions with other droplets.
Furthermore, the emulsifier should be mechanically strong; it should not break or weaken upon
the collision of two oil droplets (Swarbrick, 2005).

25
These emulsifiers should also increase the viscosity of the continuous phase of the
emulsion, and charged species are preferred over uncharged species. Surface charges on an
emulsifier aid in emulsion stability. The repulsive forces generated when similarly charged
droplets approach one another promote emulsion stability. Researchers have charged modified
HPMC using the negatively charged sodium dodecyl sulfate and observed significant
improvements in emulsion stabilization (Petrovic, et al., 2010). Lastly, the emulsification
properties should be evident at low concentrations (Swarbrick, 2005). For example, an emulsion
containing 0.5% w/w HPMC was sufficient in stabilizing an oil-in-water emulsion after 10
seconds of mixing (Yonekura, Hayakawa, Kawaguchi, & Kato, 1998).
Stable emulsions are characterized by particle sizes by <1µm with unimodal
distributions. The aforementioned properties should promote and maintain small droplet sizes;
however, other factors can be manipulated to generate small droplet sizes. High viscosity HPMC
(4000 mPa∙s) produces smaller particle sizes than lower viscosity HPMC (6, 15, and 50 mPa∙s);
the high viscosity HPMC produced an average particle size of 33 µm, while low viscosity HPMC
produced and average particle size of 36 µm (Gaonkar, 1991). The concentration of the
emulsifier and duration of shear forces also affect the droplet sizes. Oil droplet sizes decrease in
the presence of increasing HPMC concentrations (Hayakawa, Kawaguchi, & Kato, 1997).
Increasing the duration of shear from 10 seconds to 20 minutes in emulsions stabilized by HPMC
has resulted in smaller, more uniform particle sizes (Yonekura, et al., 1998). HPMC possessing
different substituent contents and molecular weights were used in silicone oil emulsions. The
researchers found that high molecular weight HPMC formed larger oil droplets than the lower
molecular weight counterparts when concentration remained static. For example at 0.5% w/w of
HPMC, the molecular weights were 7.14, 19.8, 38.8, and 101.2 ×10⁻⁴
and the corresponding

26
particle sizes were 31.8, 37.3, 43.7, and 44.6 µm, respectively. Furthermore, increasing
concentration of emulsifier from 0.5% to 4.0% at the same molecular weight resulted in smaller
droplet sizes (31.8 to 20.5 µm) (Hayakawa, et al., 1997). In a study comparing the particle size
diameters of three emulsions stabilized with three HPMC of different viscosities, HPMC with the
lowest viscosity (η=52 Pa s) and the lowest methyl to hydroxypropyl ratio (3.23) displayed the
largest D[v,0.9] values (9.3-38.6 µm), which were believed to be indicative of coalescence
(Wollenweber, Makievski, Miller, & Daniels, 2000).
Changes in particle sizes have been correlated with emulsion stability (Friberg, et al.,
2004). Narrow particle size distributions and small particle sizes contribute to stable emulsions.
Multimodal distributions suggest that there are two or more populations of particle sizes; larger
particle sizes promote emulsion destabilization. The Malvern Mastersizer 2000 (Malvern
Instruments) records particle size measurements as D[4,3] and D[3,2]. The value D[4,3] refers to
the mean moment volume, while D[3,2] refers to the mean moment surface area. As time
progresses, these values may increase, decrease, or stay the same. An increase in either value
suggests that the particle size is increasing, which may be an indication of Ostwald Ripening or
coalescence (McClements, 1999).
Particle sizes are also expressed on a percentage basis to more clearly define the quantity
of volumes that are observed in a population. The Malvern expresses these percentages as
D[v,0.1], D[v,0.5], and D[v,0.9] which provide information regarding the volumes represented at
the tenth, fiftieth, and ninetieth percentiles, respectively (Friberg, et al., 2004). Together, these
values can be used to calculate the distribution width in equation 5 (Brummer, 2006).
(5)

27
Wollenweber (2000) presented a noteworthy experiment that involved the stabilization of oil-in-
water emulsions containing medium chain triglycerides with HPMC that differed in methyl and
hydroxypropyl contents. The emulsions did not exhibit creaming or form an oil layer for over
one year when stored at 20˚C (Wollenweber, et al., 2000).
Emulsion Stability
Emulsion stability encompasses both physical and chemical stabilities (Cornacchia &
Roos, 2011). Physical stability refers to the resistance of oil droplets to changes in an emulsion.
Ideally, oil droplets should retain their individual identities and remain uniform in size during the
storage of the emulsion (Wermuth, 2008). Emulsions may also experience chemical changes
that can affect the stability of the emulsion. The ability of an emulsion to resist to chemical
changes is known as chemical stability (Barbosa-Cánovas, et al., 2009). Chemical instability
may result from oxidation, variations in pH, and electrolyte concentration (Wermuth, 2008).
Several mechanisms can cause the physical destabilization of emulsion: coalescence,
flocculation, Ostwald ripening, creaming, sedimentation, breaking, and phase inversion.
Coalescence describes the formation of large oil droplets due to the collision of smaller
oil droplets. The layer surrounding the oil droplet becomes disrupted which facilitates the
formation of the larger oil droplets (Friberg, et al., 2004). Thinning of the interfacial film that
surrounds oil droplets promotes coalescence as the film becomes more susceptible to breaking.
When the interfacial film between two neighboring droplets weakens and ruptures, the droplets
merge and form a larger droplet (Weiss, 2001). Over time, the film may deteriorate due to
different stresses that occur at the film surface. Some emulsifiers can provide resistance against
deterioration of the film. Proteins, for example, form viscoelastic films at the droplet surface that
maintain the integrity of the film when stresses are applied to the droplet surface (Weiss, 2001).

28
Increasing the viscosity of the continuous phase through the use of hydrocolloids aims to
decrease the rate of coalescence thereby slowing the rate of emulsion destabilization.
Flocculation, or the aggregation of droplets, occurs as a result of collision and attractive
forces between droplets (Swarbrick, 2005; Weiss, 2001). The attractive forces are generated
from van der Waals forces and electrostatic charges (Friberg, et al., 2004). Weak attractions may
result in structures that are spherical in form. Stronger forces between droplets during
flocculation may result in the formation of higher ordered structures that form an elaborate
network (Weiss, 2001). These aggregations, or flocks, retain their individual original form and
are susceptible to upward migration (Friberg, et al., 2004). Shear thinning is more evident in
emulsions that are destabilized by flocculation. Shear stresses may disrupt the flocks that are
formed, causing the shear thinning phenomena in emulsions (Weiss, 2001).
Creaming, or ringing, occurs when oil droplets separate from the emulsion and float to
the top. Creaming ultimately divides the emulsion into two sections. The upper region of the
emulsion is richer in the oil phase, while the lower region is richer in the water phase. In flavor
oil emulsions, creaming is undesirable as it indicates an imbalance in flavor distribution.
Creaming is exacerbated by flocculation; flocks act as large oil droplets, which experience larger
density differences when compared to the continuous phase. The rate of creaming increases as a
result of the large density difference (Friberg, et al., 2004).
Striation and lifting are two other destabilization mechanisms that are rooted in creaming.
During striation, layers are formed that differ in transparency. Lifting, however, describes the
rise of the emulsion and the clarification of the lower portion of the beverage emulsion. These
events are generally observed in refrigerated emulsions (Friberg, et al., 2004).

29
Sedimentation seldom occurs in beverage emulsions; however, it is characterized by a
downward movement of particles in the emulsion due to the higher density of the dispersed
phase compared to the continuous phase (Friberg, et al., 2004; Tadros, 2009). Creaming and
sedimentation destabilize emulsions through gravitational separation mechanisms; however, the
stability of emulsions suffering from destabilization from gravitational separation can be
inhibited by reducing the oil droplet size (Huang, et al., 2001).
Phase inversion describes the exchange of the dispersed and continuous phases. For
example, an oil-in-water emulsion becomes a water-in-oil emulsion. This typically occurs when
the dispersed phase constitutes roughly 50 percent or more of the emulsion (Wermuth, 2008).
Ostwald ripening is another form of emulsion destabilization. During Ostwald ripening,
smaller droplets are transported into larger droplets, causing the larger droplets to grow. This
process occurs as the dispersed phase becomes more soluble in the continuous phase upon the
reduction of droplet diameters. In an emulsion with a large distribution of particle sizes, a
concentration gradient forms between the larger and smaller oil droplets. Larger droplets will
tend to be in close proximity to larger droplets, while smaller droplets will be in closer proximity
to smaller droplets. To relieve the concentration gradient, the smaller oil droplets are believed to
dissolve and diffuse into larger droplets (Weiss, 2001).
Formulaction’s Turbiscan MA2000 is a useful tool in monitoring coalescence,
flocculation, creaming, and sedimentation in emulsions. The Turbiscan operates by focusing a
near infrared laser beam through a liquid sample; the laser beam moves upwards and downwards
to collect information about the sample. Energy from the beam is either transmitted through the
sample or is backscattered and detected at an angle of 135 degrees. The transmission graph
provides information regarding the differences in light transmission throughout the sample. The

30
information from the backscattering graph can provide information about the movement and
aggregation of particles in an emulsion (Mengual, Meunier, Cayré, Puech, & Snabre, 1999).
The Rheology of Emulsions
Several parameters affect the rheology of an emulsion. They include the viscoelastic
behavior of the continuous phase, interactions between particles, and particle sizes. The
viscosity of an emulsion due to the effects of the continuous phase is described by the Krieger-
Dougherty equation (equation 6). This equation relates the viscosity of the continuous phase
(ηc), the volume of the dispersed phase (φ), and the phase volume (φm) to the viscosity of the
emulsion.
η = ηc (6)
The phase volume, or the volume occupied by particles, dominates when changes in the
non-Newtonian behavior of a liquid occurs. When the particle size distribution is large, the
phase volume increases, and viscosity decreases. The phase volume also affects particle
deformability. When shear is introduced to a system of particles, they rearrange to make room
for adjacent particles. This rearrangement promotes packing efficiency and results in reduced
deformability (Barnes, 1994).
Small and more uniform particles are more difficult to deform and hence raise the
viscosity of an emulsion. Small particle sizes result in larger surface areas which require a
greater concentration of emulsifier. Inadequate amounts of emulsifier can create an environment
that is conducive to flocculation. Particle size can be manipulated by adjusting the concentration
or stabilizer, type of emulsifier, and the mechanical forces used to create the particles (Barnes,
1994).

31
Changes in particle sizes are reflected in the rheology of the emulsion (Yonekura, et al.,
1998). Kulicke (1998) studied the flow behavior of emulsions containing HPMC using parallel
plates. The rheological measurements provided information regarding the particle size and
viscosity changes which impact the stability of the emulsion. The researchers followed the
relationship between increasing oil contents and their effects on viscosity at increasing shear rate.
Higher oil contents of volume contents ranging between 0.10 and 0.70 were associated with
higher viscosity emulsions. Interestingly at the cessation of the experiment, the curves for each
of the emulsions began to converge, possibly due to the breakdown of the emulsion structure
(Kulicke, Arendt, & Berger, 1998a).
Liquid Crystalline Phases and Emulsion Stability
Liquid crystals describe polymers that are exhibit little flexibility about the backbone; as
a consequence of the rigidity, ordered structures form in solution at a specified concentration of
polymer (Young, et al., 1991). The liquid crystal structures may impart additional stability to
emulsions. The presence of these structures may reduce the van der Waals interactions that
promote particle aggregation. Liquid crystals can increase the viscosity of a solution 100-fold.
To demonstrate either of the stability mechanisms mentioned above, the liquid crystal phase
must exist between the interface of continuous phase and droplet (Swarbrick, 2005). There is no
known published literature regarding the observance of liquid crystalline structures in HPMC or
as applied to HPMC stabilized emulsions but such research would provide an interesting insight
into emulsion stability.
Light Microscopy
Light microscopy aides in visualizing the particles in an emulsion and assessing the
particle sizes of oil droplets relative to one another. In a stable emulsion, the particles have

32
uniform sizes and do not aggregate together. Destabilization in light microscopy manifests itself
as variable particle sizes and/or particle aggregation as in flocculation (McClements, 1999).
Food Science and Emulsion Stability
Consumer acceptability of a food product depends on several properties such as texture,
taste, aroma, and visual appearance (Timberlake & Henry, 1986). In the case of emulsions, the
visual appearance, which is a function of chemical and physical stability, may affect consumer
acceptability (Chantrapornchai, Clydesdale, & McClements, 1998).
Emulsion Color
The color of an emulsion stems from two sources: the scattering of light waves by the
continuous and dispersed phases and the absorption of light waves by chromophores. The colors
observed in an emulsion are the result of light that is reflected and not absorbed in the visible
region of the electromagnetic spectrum (Chantrapornchai, et al., 1998; McClements, 1999). The
L* a* b* color space system is used to quantifies colors using the tristimulus coordinates. The
value L* refers to the lightness of a sample; the values a* and b* describe the color coordinates.
Positive values of a* correspond to the red direction, while negative values correspond to the
green direction. Positive values of b* correspond to the yellow direction, while negative values
correspond to the blue direction (Chantrapornchai, et al., 1998). The L* coordinates range
between 0 and +100, while the a* and b* coordinates range between -100 to +100. Together,
they create a three dimensional vector that points to the color of the sample as shown in Fig. 4
(Figura & Teixeira, 2007).
Characteristics of the oil droplets in an emulsion affect the visual appearance. The size,
refractive index, and concentration of oil droplets all affect the translucency of the emulsion.
The size and concentration of the oil droplets govern the cloudiness, or turbidity, of the

33
emulsion. When a large difference exists between the refractive index of the continuous phase
and dispersed phases, more light is scattered, and the emulsion is cloudier. Studies conducted by
Chantrapornchai and others (1998) have supported the relationship between the visual
appearance of an emulsion and the oil droplet characteristics; light scattering is most efficient at
droplet sizes less than one micrometer (Chantrapornchai, et al., 1998).
The hue angle, chroma, and color difference are calculations that make comparisons
between different colors of samples (Chantrapornchai, et al., 1998). The hue angle (h) reflects a
vector in the L*a*b* color space system. The angle will range between 0˚ and 360˚. The hues
and the associated colors are presented in Table 1 (Jeremiah, 1996). Chroma (C) measures
chromaticity, or the intensity of color in a sample (Figura, et al., 2007). The calculation is
provided in equation 7.
C = (a2 + b
2)1/2
(7)
The total color difference (∆E) measures the variation of color in a sample to a reference and is
calculated in equation 8 (Chantrapornchai, Fergus, & McClements, 2008).
∆E = (∆L2 + ∆a
2 + ∆b
2)1/2
(8)
β-carotene as a Colorant
As consumers become more health conscious, many have become more aware of the
contents of the food products and search for natural ingredients in their foods. Consumers have
begun to associate natural food products with healthfulness and good quality. Additives such as
synthetic food colorants are sometimes considered toxic and unhealthy by consumers (Wissgott
& Bortlik, 1996). β-carotene, a carotenoid, has been investigated as a natural colorant in food
products and is implicated with several health promoting benefits (Cornacchia, et al., 2011; Tan
& Nakajima, 2005; Yuan, Gao, Zhao, & Mao, 2008).

34
Carotenoids describe a family of molecules that are highly conjugated and lipid soluble.
They impart red to orange to yellow colors in a number of fruits and vegetables. Carotenoids are
also present in some species of photosynthetic bacteria where they function in either protection
from light or as accessory pigments. The highly conjugated structures allow for the absorption
of light as well inhibition of radical species (Mayne, 1996). As conjugation decreases, the color
fades to yellow. An increase in double bonds leads to a redder color (Timberlake, et al., 1986).
Lipophilic substances such as β-carotene dissolved in oil are immiscible in water without
the aid of an emulsifier or stabilizing agent (Yuan, et al., 2008). Emulsions that are dyed using a
colorant such as β-carotene are susceptible to color loss and color instability. The unsaturated
carbon-hydrogen systems render β-carotene susceptible to oxidation. During lipid oxidation,
double bonds are oxidized, causing a loss of saturation in the system and color. As different
emulsion destabilization mechanisms manifest themselves, the emulsion loses its initial
appearance (Qian, Decker, Xiao, & McClements, 2012; Tan, et al., 2005; Yin, Chu, Kobayashi,
& Nakajima, 2009).
The importance of emulsifying β-carotene extends to the promotion of its health benefits.
Some health promoting compounds exhibit poor solubility in water but excellent solubility in oil.
The poor solubility in water contributes to low bioavailability as well as a low dose response.
Emulsions may be used as vehicles to improve both of these properties. When the oil droplets
containing these bioactive compounds are formed, they take on a solubilized state and are
stabilized (Barbosa-Cánovas, et al., 2009).
Lipid Oxidation
Lipid oxidation is a form of chemical instability that involves the reaction of reactive
oxygen species with unsaturated regions of lipid molecules. Its byproducts can result in

35
deterioration of a food product and manifest themselves as undesirable odors or colors; lastly,
oxidation decreases in nutritive value of unsaturated lipids in foods. Following lipid oxidation, a
variety of end products, including hydroperoxides, are formed. These hydroperoxides are also
surface-active and accumulate at the oil droplet surface and promote further peroxidation
reactions (McClements, et al., 2000).
The susceptibility of the lipid component of an emulsion depends on several factors. For
example, the location of molecules that promote or retard lipid oxidation within an emulsion is
factor. To review, emulsion droplets are three component systems consisting of a continuous
phase, an interfacial region that contains the emulsifier, and a dispersed phase. In an oil-in-water
emulsion, the continuous phase is water, while the dispersed phase is oil. In addition to the
emulsifier, the interfacial region may also contain water, oil, and/or other molecules
(McClements, et al., 2000). Molecules will partition themselves into the phase they are most
soluble. For example, polar molecules typically associate with the polar phase, and nonpolar
molecules typically associate with the nonpolar phase. Oxygen is three times more soluble in oil
than in water (D. McClements, et al., 2000). Also, the rate of lipid oxidation is affected by the
concentration of oxygen. At low concentrations, the rate of oxidation is limited by the diffusion
of oxygen through the aqueous phase in an O/W emulsion. At high concentrations, the rate of
oxidation is no longer limited by amount of oxygen present. Initiation becomes the rate limiting
step of the oxidation reactions (McClements, et al., 2000). In another case, the orientation of the
lipid molecules at region the emulsifier occupies. The directionality of the lipid molecules may
be parallel or perpendicular at the interfacial surface and affects the accessibility of prooxidants
or antioxidants. Also, small particle sizes limit the extent of lipid oxidation (McClements, et al.,
2000).

36
Limiting Lipid Oxidation using Emulsifiers
While there are external controls that limit lipid peroxidation, this section will focus on
the properties of emulsifiers that can limit the oxidation reactions. The presence or absence of
surface charges may help to accelerate or retard lipid oxidation (Fig.1- 5). Studies have
demonstrated that negatively charged emulsifiers tend to suffer from higher rates of lipid
oxidation as compared to positively or nonionic emulsifiers (Mei, Decker, & McClements, 1998;
Mei, McClements, & Decker, 1999; Mei, McClements, Wu, & Decker, 1998). This may be due
to the attraction of the negatively charged emulsifier with a positively charged prooxidant such
as a metal (McClements, et al., 2000). The adsorbed emulsifier may also form a membrane that
affords protection to lipids from prooxidants. Research has demonstrated that the presence of a
hydrophobic tail on an emulsifier helps to slow the progression of oxidation (Silvestre,
Chaiyasit, Brannan, McClements, & Decker, 2000).
Polysaccharides may inhibit lipid peroxidation by increasing the viscosity of the
continuous phase, through the scavenging of free radicals, and by binding metals (Matsumura, et
al., 2003). Sugars or amino acids present on an emulsifier may scavenge free radicals
(Ponginebbi, Nawar, & Chinachoti, 1999; Waraho, McClements, & Decker, 2011). Gum acacia,
an emulsifier containing a polysaccharide backbone with protein components, has free-radical
scavenging abilities attributed to specific amino acids (Waraho, et al., 2011). The thickness of
the emulsifier layer may also slow lipid oxidation by decreasing the interactions between the
lipids and the aqueous phase (Silvestre, et al., 2000). Research hints that oxidation rate is also a
function of emulsifier concentration and type (Donnelly, Decker, & McClements, 1998; Fomuso,
Corredig, & Akoh, 2002; Hu, McClements, & Decker, 2003). The ability of proteins to form a
highly viscoelastic membrane around the droplet may account for their ability to slow oxidation
37
(McClements, et al., 2000). Droplet size, concentration, and composition also affect the rate of
lipid oxidation (Coupland, et al., 1996; McClements, et al., 2000; Nakaya, Ushio, Matsukawa,
Shimizu, & Ohshima, 2005). Coupland and others (1996) prepared oil in water emulsions
containing ethyl linoleate, n-tetradecane, and the emulsifier Tween 30. Larger volumes of the
ethyl linoleate (1, 20, and 100 percent w/w oil) increased the rates of oxidation in the emulsion
(Coupland, et al., 1996).
Like ethyl linoleate, β-carotene is susceptible to oxidation due to its highly conjugated
structure. Oxidation can be induced and accelerated by high temperatures, exposure to oxygen,
and/or exposure to light. Oxidation is detrimental to the bioactivity of β-carotene as well as the
color produced in an emulsion (Cornacchia, et al., 2011). Emulsifiers coat oil surfaces and form
protective membranes that may retard the rate of oxidation (McClements, et al., 2000).
Molecular oxygen is nonpolar due to its structure, and nonpolar molecules interact
through van der Waals interactions (McClements, et al., 2000). HPMC films are excellent
barriers against oxygen, carbon dioxide, and lipids (Ford, 1999; Villalobos, Chanona,
Hernández, Gutiérrez, & Chiralt, 2005). HPMC may be able to slow the progression of
oxidation by limiting the interactions between the interfacial membrane and oxygen.
Summary and Applications
The purpose of these experiments are to (1) characterize the structure of commercial
HPMC and relate it to its functions in emulsions and (2) identify the properties of HPMC that
will produce the most stable color of β-carotene. The food industry has gained significant
interest in protecting bioactives, particularly those with antioxidant potential, from the
environment and the conditions of the digestive system. Testing the stability of β-carotene in an

38
HPMC stabilized emulsion is important in understanding the form(s) of a polysaccharide that can
protect an environmentally sensitive bioactive.
Few research studies the substituent content alone. Many researches in HPMC have
focused on the characterization of the sol:gel transition, the cloud point, and/or the effects of the
substituent pattern. In establishing the structure-function relationships in HPMC, a Raman
spectrum will be useful in assessing the structure of HPMC (e.g. hydroxyl groups, methyl
groups, ether linkages, etc.) as well as the crystallinity of the powdered cellulose. The
crystallinity of HPMC will provide insight into the viscoelastic properties of the gels, which
ultimately affects the integrity of the interfacial region. A more crystalline HPMC should result
in a gel with enhanced mechanical strength.
The spectra from ATR/FT-IR will also be used in bond identification and in the
assessment of the methyl content of HPMC. Assessment of the methyl contents will provide
information regarding the surface activity of each HPMC and their abilities to adsorb to the oil
droplet surface. DSC studies regarding the hydration and water uptake will provide information
about whether the addition of hydrophilic groups will result in more bound water in the system.
The amount of bound water and hydration of HPMC will affect the final bulk viscosity of a
solution. Hence, the hydroxypropyl content may be a useful variable to manipulate when
optimizing the bulk viscosity of HPMC. Rheological measurements display the viscoelastic
properties of HPMC. By relating the substituent composition to the viscoelastic properties, the
production of HPMC may also be optimized to have more elastic or inelastic properties.
Emulsion studies surrounding the retardation of chemical and physical instabilities are important
in stabilizing emulsions containing β-carotene. Studies can pinpoint the conditions under which

39
variables such as particle size increase, the acceleration of oxidation, and color loss are
minimized.

40
Table 1: Hue Angles and Their Associated Colors
h = tan-1
Hue Angle Color
0˚ to 90˚ Red-Yellow
90˚ to 180˚ Green-Yellow
180˚ to 270˚ Blue-Green
270˚ to 360˚ Red blue
Fig. 1 illustrates the precipitation of HPMC out of solution at elevated temperatures as a result of
enhanced hydrophobic interactions.

41
Fig. 2a. is an illustration of cone and plate geometry, while 2b. is an illustration of parallel plate
geometry.
Fig. 3. illustrates the composition of an oil-in-water (O/W) emulsion.

42
Fig. 4. The L*a*b coordinate system.
Fig. 5. When the surface charge of an oil droplet and prooxidant are opposite, oxidation is
promoted. However when the surface charge of an oil droplet and prooxidant are the same,
repulsive forces are generated that retard oxidation.

43
REFERENCES (CHAPTER 1)
Adden, R., Müller, R., & Mischnick, P. (2006a). Analysis of the substituent distribution in the
glucosyl units and along the polymer chain of hydroxypropylmethyl celluloses and
statistical evaluation. Cellulose, 13(4), 459-476.
Adden, R., Müller, R., & Mischnick, P. (2006b). Fractionation of Methyl Cellulose According to
Polarity – a Tool to Differentiate First and Second Order Heterogeneity of the Substituent
Distribution. Macromolecular Chemistry and Physics, 207(11), 954-965.
Agarwal, U., Reiner, R., & Ralph, S. (2010). Cellulose I crystallinity determination using FT–
Raman spectroscopy: univariate and multivariate methods. Cellulose, 17(4), 721-733.
- - - -Pacheco, R.,
Souto, C., & Concheiro, A. (1999). A comparison of gas–liquid chromatography, NMR
spectroscopy and Raman spectroscopy for determination of the substituent content of
general non-ionic cellulose ethers. Journal of Pharmaceutical and Biomedical Analysis,
20(1-2), 373-383.
Andersson, M., Wittgren, B., Schagerlöf, H., Momcilovic, D., & Wahlund, K.-G. (2003). Size
and Structure Characterization of Ethylhydroxyethyl Cellulose by the Combination of
Field-Flow Fractionation with Other Techniques. Investigation of Ultralarge
Components. Biomacromolecules, 5(1), 97-105.
Andersson, M., Wittgren, B., & Wahlund, K.-G. (2001). Ultrahigh Molar Mass Component
Detected in Ethylhydroxyethyl Cellulose by Asymmetrical Flow Field-Flow

44
Fractionation Coupled to Multiangle Light Scattering. Analytical Chemistry, 73(20),
4852-4861.
Arboleya, J.-C., & Wilde, P. J. (2005). Competitive adsorption of proteins with methylcellulose
and hydroxypropyl methylcellulose. Food Hydrocolloids, 19(3), 485-491.
Bajwa, G. S., Sammon, C., Timmins, P., & Melia, C. D. (2009). Molecular and mechanical
properties of hydroxypropyl methylcellulose solutions during the sol:gel transition.
Polymer, 50(19), 4571-4576.
Barbosa-Cánovas, G. V., Mortimer, A., Lineback, D., Spiess, W., Buckle, K., & Colonna, P.
(2009). Global Issues in Food Science and Technology: Academic.
Barnes, H. (1994). Rheology of emulsions — a review. Colloids and Surfaces A:
Physicochemical and Engineering Aspects, 91(0), 89-95.
Bodvik, R., Dedinaite, A., Karlson, L., Bergström, M., Bäverbäck, P., Pedersen, J. S., Edwards,
K., Karlsson, G., Varga, I., & Claesson, P. M. (2010). Aggregation and network
formation of aqueous methylcellulose and hydroxypropylmethylcellulose solutions.
Colloids and Surfaces A: Physicochemical and Engineering Aspects, 354(1-3), 162-171.
Brummer, R. (2006). Rheology Essentials of Cosmetic And Food Emulsions: Springer.
Burey, P., Bhandari, B. R., Howes, T., & Gidley, M. J. (2008). Hydrocolloid Gel Particles:
Formation, Characterization, and Application. Critical Reviews in Food Science and
Nutrition, 48(5), 361-377.
Camino, N. A., Sánchez, C. C., Rodríguez Patino, J. M., & Pilosof, A. M. R. (2011).
Hydroxypropylmethylcellulose at the oil-water interface. Part I. Bulk behaviour and
dynamic adsorption as affected by pH. Food Hydrocolloids, 25(1), 1-11.

45
Chang, C., & Zhang, L. (2011). Cellulose-based hydrogels: Present status and application
prospects. Carbohydrate polymers, 84(1), 40-53.
Chantrapornchai, W., Clydesdale, F., & McClements, D. J. (1998). Influence of Droplet Size and
Concentration on the Color of Oil-in-Water Emulsions. Journal of Agricultural and Food
Chemistry, 46(8), 2914-2920.
Chantrapornchai, W., Clydesdale Fergus, M., & McClements, D. J. (2008). Understanding
Colors in Emulsions. In Color Quality of Fresh and Processed Foods (Vol. 983, pp. 364-
387): American Chemical Society.
Chatjigakis, A. K., Pappas, C., N.Proxenia, O.Kalantzi, P.Rodis, & Polissiou, M. (1998). FT-IR
spectroscopic determination of the degree of esterification of cell wall pectins from stored
peaches and correlation to textural changes. Carbohydrate polymers, 37(4), 395-408.
Chen, H.-H. (2007). Rheological properties of HPMC enhanced Surimi analyzed by small- and
large-strain tests: I. The effect of concentration and temperature on HPMC flow
properties. Food Hydrocolloids, 21(7), 1201-1208.
Chen, H.-H., Lin, C.-H., & Kang, H.-Y. (2009). Maturation effects in fish gelatin and HPMC
composite gels. Food Hydrocolloids, 23(7), 1756-1761.
Clasen, C., & Kulicke, W. M. (2001). Determination of viscoelastic and rheo-optical material
functions of water-soluble cellulose derivatives. Progress in Polymer Science, 26(9),
1839-1919.
Cook, D. J., Linforth, R. S. T., & Taylor, A. J. (2003). Effects of Hydrocolloid Thickeners on the
Perception of Savory Flavors. Journal of Agricultural and Food Chemistry, 51(10), 3067-
3072.
46
Cornacchia, L., & Roos, Y. H. (2011). Stability of β-Carotene in Protein-Stabilized Oil-in-Water
Delivery Systems. Journal of Agricultural and Food Chemistry, 59(13), 7013-7020.
Correa, M. J., Añón, M. C., Pérez, G. T., & Ferrero, C. (2010). Effect of modified celluloses on
dough rheology and microstructure. Food Research International, 43(3), 780-787.
Coupland, J., Zhu, Z., Wan, H., McClements, D., Nawar, W., & Chinachoti, P. (1996). Droplet
composition affects the rate of oxidation of emulsified ethyl linoleate. Journal of the
American Oil Chemists' Society, 73(6), 795-801.
Cowie, J. M. K. G. (1991). Polymers: chemistry and physics of modern materials: Nelson
Thornes.
Dickinson, E., & Leser, M. E. (2007). Food colloids: self-assembly and material science: RSC
Publishing.
Donnelly, J. L., Decker, E. A., & McClements, D. J. (1998). Iron-Catalyzed Oxidation of
Menhaden Oil as Affected by Emulsifiers. Journal of Food Science, 63(6), 997-1000.
Figura, L. O., & Teixeira, A. A. (2007). Food physics: physical properties - measurement and
application: Springer.
Fomuso, L. B., Corredig, M., & Akoh, C. C. (2002). Effect of Emulsifier on Oxidation Properties
of Fish Oil-Based Structured Lipid Emulsions. Journal of Agricultural and Food
Chemistry, 50(10), 2957-2961.
Ford, J. L. (1999). Thermal analysis of hydroxypropylmethylcellulose and methylcellulose:
powders, gels and matrix tablets. International Journal Of Pharmaceutics, 179(2), 209-
228.
Freitag, W., & Stoye, D. (2008). Paints, Coatings and Solvents: John Wiley & Sons.
Friberg, S., Larsson, K., & Sjöblom, J. (2004). Food emulsions: Marcel Dekker.

47
Funami, T., Kataoka, Y., Hiroe, M., Asai, I., Takahashi, R., & Nishinari, K. (2007). Thermal
aggregation of methylcellulose with different molecular weights. Food Hydrocolloids,
21(1), 46-58.
Futamura, T., & Kawaguchi, M. (2012). Characterization of paraffin oil emulsions stabilized by
hydroxypropyl methylcellulose. Journal of Colloid and Interface Science, 367(1), 55-60.
Gaonkar, A. (1991). Surface and interfacial activities and emulsion characteristics of some food
hydrocolloids. Food Hydrocolloids, 5, 329-337.
Greiderer, A., Steeneken, L., Aalbers, T., Vivó-Truyols, G., & Schoenmakers, P. (2011).
Characterization of hydroxypropylmethylcellulose (HPMC) using comprehensive two-
dimensional liquid chromatography. Journal of Chromatography A, 1218(34), 5787-
5793.
Guarda, A., Rosell, C. M., Benedito, C., & Galotto, M. J. (2004). Different hydrocolloids as
bread improvers and antistaling agents. Food Hydrocolloids, 18(2), 241-247.
Gunasekaran, S., & Ak, M. M. (2003). Cheese rheology and texture: CRC Press.
Hall, S. R. (2009). Biotemplating: complex structures from natural materials: Imperial College
Press.
Haque, A., Richardson, R. K., Morris, E. R., Gidley, M. J., & Caswell, D. C. (1993).
Thermogelation of methylcellulose. Part II: effect of hydroxypropyl substituents.
Carbohydrate polymers, 22(3), 175-186.
Hayakawa, K., Kawaguchi, M., & Kato, T. (1997). Protective Colloidal Effects of
Hydroxypropyl Methyl Cellulose on the Stability of Silicone Oil Emulsions. Langmuir,
13(23), 6069-6073.

48
Hollowood, T. A., Linforth, R. S. T., & Taylor, A. J. (2002). The Effect of Viscosity on the
Perception of Flavour. Chemical Senses, 27(7), 583-591.
Hu, M., McClements, D. J., & Decker, E. A. (2003). Lipid Oxidation in Corn Oil-in-Water
Emulsions Stabilized by Casein, Whey Protein Isolate, and Soy Protein Isolate. Journal
of Agricultural and Food Chemistry, 51(6), 1696-1700.
Huang, X., Kakuda, Y., & Cui, W. (2001). Hydrocolloids in emulsions: particle size distribution
and interfacial activity. Food Hydrocolloids, 15(4-6), 533-542.
Hui-Huang, C. (2007). Rheological properties of HPMC enhanced Surimi analyzed by small-
and large-strain tests: I. The effect of concentration and temperature on HPMC flow
properties. Food Hydrocolloids, 21(7), 1201-1208.
Hui, Y. H. (2006). Handbook of Food Science, Technology, and Engineering: Taylor & Francis.
Hussain, S., Keary, C., & Craig, D. Q. M. (2002). A thermorheological investigation into the
gelation and phase separation of hydroxypropyl methylcellulose aqueous systems.
Polymer, 43(21), 5623-5628.
Ibbett, R. N., Philp, K., & Price, D. M. (1992). 13C n.m.r. studies of the thermal behaviour of
aqueous solutions of cellulose ethers. Polymer, 33(19), 4087-4094.
Jeremiah, L. E. (1996). Freezing effects on food quality: Marcel Dekker.
Jorio, A., Dresselhaus, M. S., Saito, R., & Dresselhaus, G. (2011). Raman Spectroscopy in
Graphene Related Systems: John Wiley & Sons.
Jumel, K., Harding, S. E., Mitchell, J. R., To, K.-M., Hayter, I., O'Mullane, J. E., & Ward-Smith,
S. (1996). Molar mass and viscometric characterisation of hydroxypropylmethyl
cellulose. Carbohydrate polymers, 29(2), 105-109.

49
Jumel, K., Harding, S. E., Mitchell, J. R., To, K. M., Hayter, I., O'Mullane, J. E., & Ward-Smith,
S. (1996). Molar mass and viscometric characterisation of hydroxypropylmethyl
cellulose. Carbohydrate polymers, 29(2), 105-109.
Kararli, T. T., Hurlbut, J. B., & Needham, T. E. (1990). Glass–rubber transitions of cellulosic
polymers by dynamic mechanical analysis. Journal of Pharmaceutical Sciences, 79(9),
845-848.
Keary, C. M. (2001). Characterization of METHOCEL cellulose ethers by aqueous SEC with
multiple detectors. Carbohydrate polymers, 45(3), 293-303.
Kelsall, R. W., Hamley, I. W., & Geoghegan, M. (2005). Nanoscale science and technology:
John Wiley & Sons.
Kita, R., Kaku, T., Kubota, K., & Dobashi, T. (1999). Pinning of phase separation of aqueous
solution of hydroxypropylmethylcellulose by gelation. Physics Letters A, 259(3–4), 302-
307.
Kita, R., Kaku, T., Ohashi, H., Kurosu, T., Iida, M., Yagihara, S., & Dobashi, T. (2003).
Thermally induced coupling of phase separation and gelation in an aqueous solution of
hydroxypropylmethylcellulose (HPMC). Physica A: Statistical Mechanics and its
Applications, 319(0), 56-64.
Kulicke, W. M., Arendt, O., & Berger, M. (1998a). Characterization of hydroxypropylmethyl-
cellulose-stabilized emulsions. Colloid & Polymer Science, 276(11), 1024-1031.
Kulicke, W. M., Arendt, O., & Berger, M. (1998b). Rheological characterization of the dilatant
flow behavior of highly substituted hydroxypropylmethyl- cellulose solutions in the
presence of sodium lauryl sulfate. Colloid & Polymer Science, 276(7), 617-626.

50
Langkilde, F. W., & Svantesson, A. (1995). Identification of celluloses with Fourier-Transform
(FT) mid-infrared, FT-Raman and near-infrared spectrometry. Journal of Pharmaceutical
and Biomedical Analysis, 13(4–5), 409-414.
Matsumura, Y., Egami, M., Satake, C., Maeda, Y., Takahashi, T., Nakamura, A., & Mori, T.
(2003). Inhibitory effects of peptide-bound polysaccharides on lipid oxidation in
emulsions. Food Chemistry, 83(1), 107-119.
Mayne, S. (1996). Β-carotene, carotenoids, and disease prevention in humans. The FASEB
Journal, 10(7), 690-701.
McClements, D., & Decker, E. A. (2000). Lipid Oxidation in Oil-in-Water Emulsions: Impact of
Molecular Environment on Chemical Reactions in Heterogeneous Food Systems. Journal
of Food Science, 65(8), 1270-1282.
McClements, D. J. (1999). Food emulsions: principles, practice, and techniques: CRC Press.
McCrystal, C. B., Ford, J. L., & Rajabi-Siahboomi, A. R. (1997). A study on the interaction of
water and cellulose ethers using differential scanning calorimetry. Thermochimica Acta,
294(1), 91-98.
McCrystal, C. B., Ford, J. L., & Rajabi-Siahboomi, A. R. (1999). Water distribution studies
within cellulose ethers using differential scanning calorimetry. 2. Effect of polymer
substitution type and drug addition. Journal of Pharmaceutical Sciences, 88(8), 797-801.
McPhillips, H., Craig, D. Q. M., Royall, P. G., & Hill, V. L. (1999). Characterisation of the glass
transition of HPMC using modulated temperature differential scanning calorimetry.
International Journal Of Pharmaceutics, 180(1), 83-90.
51
Mei, L., Decker, E. A., & McClements, D. J. (1998). Evidence of Iron Association with
Emulsion Droplets and Its Impact on Lipid Oxidation. Journal of Agricultural and Food
Chemistry, 46(12), 5072-5077.
Mei, L., McClements, D. J., & Decker, E. A. (1999). Lipid Oxidation in Emulsions As Affected
by Charge Status of Antioxidants and Emulsion Droplets. Journal of Agricultural and
Food Chemistry, 47(6), 2267-2273.
Mei, L., McClements, D. J., Wu, J., & Decker, E. A. (1998). Iron-catalyzed lipid oxidation in
emulsion as affected by surfactant, pH and NaCl. Food Chemistry, 61(3), 307-312.
Mengual, O., Meunier, G., Cayré, I., Puech, K., & Snabre, P. (1999). TURBISCAN MA 2000:
multiple light scattering measurement for concentrated emulsion and suspension
instability analysis. Talanta, 50(2), 445-456.
Mezger, T. G. (2006). The rheology handbook: for users of rotational and oscillatory
rheometers: Vincentz Network.
Mitchell, K., Ford, J. L., Armstrong, D. J., Elliott, P. N. C., Hogan, J. E., & Rostron, C. (1993).
The influence of substitution type on the performance of methylcellulose and
hydroxypropylmethycellulose in gels and matrices. International Journal Of
Pharmaceutics, 100(1-3), 143-154.
Mitchell, K., Ford, J. L., Armstrong, D. J., Elliott, P. N. C., Rostron, C., & Hogan, J. E. (1990).
The influence of additives on the cloud point, disintegration and dissolution of
hydroxypropylmethylcellulose gels and matrix tablets. International Journal Of
Pharmaceutics, 66(1-3), 233-242.
Nakaya, K., Ushio, H., Matsukawa, S., Shimizu, M., & Ohshima, T. (2005). Effects of droplet
size on the oxidative stability of oil-in-water emulsions. Lipids, 40(5), 501-507.

52
Nokhodchi, A., Ford, J. L., & Rubinstein, M. H. (1997). Studies on the interaction between water
and (hydroxypropyl)methylcellulose. Journal of Pharmaceutical Sciences, 86(5), 608-
615.
Nussinovitch, A. (1997). Hydrocolloid applications: gum technology in the food and other
industries: Blackie Academic & Professional.
Osada, Y., & Khokhlov, A. R. (2002). Polymer Gels and Networks: Marcel Dekker.
Petrovic, L. B., Sovilj, V. J., Katona, J. M., & Milanovic, J. L. (2010). Influence of polymer–
surfactant interactions on o/w emulsion properties and microcapsule formation. Journal
of Colloid and Interface Science, 342(2), 333-339.
Phillips, G. O., & Williams, P. A. (2000). Handbook of Hydrocolloids: CRC Press.
Ponginebbi, L., Nawar, W., & Chinachoti, P. (1999). Oxidation of linoleic acid in emulsions:
Effect of substrate, emulsifier, and sugar concentration. Journal of the American Oil
Chemists' Society, 76(1), 131-138.
Qian, C., Decker, E. A., Xiao, H., & McClements, D. J. (2012). Physical and chemical stability
of β-carotene-enriched nanoemulsions: Influence of pH, ionic strength, temperature, and
emulsifier type. Food Chemistry, 132(3), 1221-1229.
Rajinder, P. (1994). Techniques for measuring the composition (oil and water content) of
emulsions — a state of the art review. Colloids and Surfaces A: Physicochemical and
Engineering Aspects, 84(2–3), 141-193.
Robins, M. M., & Wilde, P. J. (2003). COLLOIDS AND EMULSIONS. In C. Editor-in-
Chief: Benjamin (Ed.), Encyclopedia of Food Sciences and Nutrition (Second Edition)
(pp. 1517-1524). Oxford: Academic Press.

53
Rosell, C. M., Rojas, J. A., & Benedito de Barber, C. (2001). Influence of hydrocolloids on
dough rheology and bread quality. Food Hydrocolloids, 15(1), 75-81.
Sai Cheong Wan, L., Wan Sia Heng, P., & Fun Wong, L. (1995). Matrix swelling: A simple
model describing extent of swelling of HPMC matrices. International Journal Of
Pharmaceutics, 116(2), 159-168.
Sammon, C., Bajwa, G., Timmins, P., & Melia, C. D. (2006). The application of attenuated total
reflectance Fourier transform infrared spectroscopy to monitor the concentration and state
of water in solutions of a thermally responsive cellulose ether during gelation. Polymer,
47(2), 577-584.
Sangappa, Demappa, T., Mahadevaiah, Ganesha, S., Divakara, S., Pattabi, M., & Somashekar, R.
(2008). Physical and thermal properties of 8 MeV electron beam irradiated HPMC
polymer films. Nuclear Instruments and Methods in Physics Research Section B: Beam
Interactions with Materials and Atoms, 266(18), 3975-3980.
Sardar, N., Kamil, M., Kabir ud, D., & Sajid Ali, M. (2011). Solution Behavior of Nonionic
Polymer Hydroxypropylmethyl Cellulose: Effect of Salts on the Energetics at the Cloud
Point. Journal of Chemical & Engineering Data, 56(4), 984-987.
Sarkar, N. (1995). Kinetics of thermal gelation of methylcellulose and
hydroxypropylmethylcellulose in aqueous solutions. Carbohydrate polymers, 26(3), 195-
203.
Sarkar, N., & Walker, L. C. (1995). Hydration-dehydration properties of methylcellulose and
hydroxypropylmethylcellulose. Carbohydrate polymers, 27(3), 177-185.
Schulz, M. B., & Daniels, R. (2000). Hydroxypropylmethylcellulose (HPMC) as emulsifier for
submicron emulsions: influence of molecular weight and substitution type on the droplet

54
size after high-pressure homogenization. European Journal of Pharmaceutics and
Biopharmaceutics, 49(3), 231-236.
Sepe, P., & Limited, R. T. (1997). Thermal Analysis of Polymers: Rapra Technology Limited.
Silva, S. M. C., Pinto, F. V., Antunes, F. E., Miguel, M. G., Sousa, J. J. S., & Pais, A. A. C. C.
(2008). Aggregation and gelation in hydroxypropylmethyl cellulose aqueous solutions.
Journal of Colloid and Interface Science, 327(2), 333-340.
Silvestre, M. P. C., Chaiyasit, W., Brannan, R. G., McClements, D. J., & Decker, E. A. (2000).
Ability of Surfactant Headgroup Size To Alter Lipid and Antioxidant Oxidation in Oil-in-
Water Emulsions. Journal of Agricultural and Food Chemistry, 48(6), 2057-2061.
Smith, E., & Dent, G. (2005). Modern Raman spectroscopy: a practical approach: J. Wiley.
Somasundaran, P. (2006). Encyclopedia of surface and colloid science: Taylor & Francis.
Swarbrick, J. a. R., Joseph and Rubino, Orapin (2005). Remington: the science and practice of
pharmacy. In: Lippincott Williams & Wilkins.
Tadros, T. F. (2009). Emulsion Science and Technology: Wiley-VCH.
Takahiro, F. (2011). Next target for food hydrocolloid studies: Texture design of foods using
hydrocolloid technology. Food Hydrocolloids, 25(8), 1904-1914.
Tan, C. P., & Nakajima, M. (2005). β-Carotene nanodispersions: preparation, characterization
and stability evaluation. Food Chemistry, 92(4), 661-671.
Teegarden, D. M. (2004). Polymer chemistry: introduction to an indispensable science: NSTA
Press, National Science Teachers Association.
Thielking, H., & Schmidt, M. (2000). Cellulose Ethers. In Ullmann's Encyclopedia of Industrial
Chemistry: Wiley-VCH Verlag GmbH & Co. KGaA.

55
Timberlake, C. F., & Henry, B. S. (1986). Plant pigments as natural food colours. Endeavour,
10(1), 31-36.
Tritt-Goc, J., & Piślewski, N. (2002). Magnetic resonance imaging study of the swelling kinetics
of hydroxypropylmethylcellulose (HPMC) in water. Journal of Controlled Release,
80(1–3), 79-86.
Villalobos, R., Chanona, J., Hernández, P., Gutiérrez, G., & Chiralt, A. (2005). Gloss and
transparency of hydroxypropyl methylcellulose films containing surfactants as affected
by their microstructure. Food Hydrocolloids, 19(1), 53-61.
Viridén, A., Larsson, A., Schagerlöf, H., & Wittgren, B. (2010). Model drug release from matrix
tablets composed of HPMC with different substituent heterogeneity. International
Journal Of Pharmaceutics, 401(1-2), 60-67.
Viridén, A., Larsson, A., & Wittgren, B. (2010). The effect of substitution pattern of HPMC on
polymer release from matrix tablets. International Journal Of Pharmaceutics, 389(1-2),
147-156.
-Alami, S., & Larsson, A. (2009). Influence
of Substitution Pattern on Solution Behavior of Hydroxypropyl Methylcellulose.
Biomacromolecules, 10(3), 522-529.
Viridén, A., Wittgren, B., Andersson, T., & Larsson, A. (2009). The effect of chemical
heterogeneity of HPMC on polymer release from matrix tablets. European Journal Of
Pharmaceutical Sciences: Official Journal Of The European Federation For
Pharmaceutical Sciences, 36(4-5), 392-400.

56
Vueba, M. L., Batista de Carvalho, L. A. E., Veiga, F., Sousa, J. J., & Pina, M. E. (2006).
Influence of Cellulose Ether Mixtures on Ibuprofen Release: MC25, HPC and HPMC
K100M. Pharmaceutical Development and Technology, 11(2), 213-228.
Wang, L., Dong, W., & Xu, Y. (2007). Synthesis and characterization of hydroxypropyl
methylcellulose and ethyl acrylate graft copolymers. Carbohydrate polymers, 68(4), 626-
636.
Waraho, T., McClements, D. J., & Decker, E. A. (2011). Mechanisms of lipid oxidation in food
dispersions. Trends in Food Science & Technology, 22(1), 3-13.
Weiss, J. (2001). Emulsion Stability Determination. In Current Protocols in Food Analytical
Chemistry: John Wiley & Sons, Inc.
Wermuth, C. G. (2008). The practice of medicinal chemistry: Elsevier/Academic Press.
Wetzel, D. L. B., & Charalambous, G. (1998). Instrumental methods in food and beverage
analysis: Elsevier.
Wilkinson, A. N., & Ryan, A. J. (1998). Polymer processing and structure development: Kluwer
Academic Publishers.
Wissgott, U., & Bortlik, K. (1996). Prospects for new natural food colorants. Trends in Food
Science & Technology, 7(9), 298-302.
Wolf, B. A., & Enders, S. (2011). Polymer Thermodynamics: Liquid Polymer-Containing
Mixtures: Springer.
Wollenweber, C., Makievski, A. V., Miller, R., & Daniels, R. (2000). Adsorption of
hydroxypropyl methylcellulose at the liquid/liquid interface and the effect on emulsion
stability. Colloids and Surfaces A: Physicochemical and Engineering Aspects, 172(1-3),
91-101.

57
Xie, F., Liu, W.-C., Liu, P., Wang, J., Halley, P. J., & Yu, L. (2010). Starch thermal transitions
comparatively studied by DSC and MTDSC. Starch - Stärke, 62(7), 350-357.
Yin, L.-J., Chu, B.-S., Kobayashi, I., & Nakajima, M. (2009). Performance of selected
emulsifiers and their combinations in the preparation of β-carotene nanodispersions.
Food Hydrocolloids, 23(6), 1617-1622.
Yonekura, K., Hayakawa, K., Kawaguchi, M., & Kato, T. (1998). Preparation of Stable Silicone
Oil Emulsions in the Presence of Hydroxypropyl Methyl Cellulose. Langmuir, 14(12),
3145-3148.
Young, R. J., & Lovell, P. A. (1991). Introduction to polymers: Chapman and Hall.
Yuan, Y., Gao, Y., Zhao, J., & Mao, L. (2008). Characterization and stability evaluation of β-
carotene nanoemulsions prepared by high pressure homogenization under various
emulsifying conditions. Food Research International, 41(1), 61-68.
Zhao, Q., Zhao, M., Li, J., Yang, B., Su, G., Cui, C., & Jiang, Y. (2009). Effect of hydroxypropyl
methylcellulose on the textural and whipping properties of whipped cream. Food
Hydrocolloids, 23(8), 2168-2173.

58
1Akinosho, H. and L. Wicker. To be submitted to Carbohydrate Polymers.
CHAPTER 2
THE CHARACTERIZATION OF HYDROXYPROPYL METHYLCELLULOSE THROUGH
THE ANALYSIS OF ITS SUBSTITUENTS1

59
Abstract
The methyl and hydroxypropyl substituents in hydroxypropyl methylcellulose (HPMC) affect the
resulting gel properties. These substituents in five HPMC gels were characterized using Fourier
transform infrared spectroscopy (FT-IR), Raman spectroscopy, small-amplitude oscillatory shear
measurements, and differential scanning calorimetry (DSC). In FT-IR spectra, the most intense
peak appeared at 1053 cm-1
, denoting the presence of the glucose ring. The ratio of peak
intensities at 1452 cm-1
, which represents –C-H absorptions, and at 1053 cm
-1 (I1452/I1053) and
percent methylation from gas chromatography exhibited a linear association (r2=0.6296). The
broadening of the Raman spectra indicated that the relative crystallinity of HPMC decreases with
increasing hydroxypropyl contents. DSC showed no linear relationship between the percent
hydroxypropylation in HPMC and the percentage of free water in an HPMC gel. Small-
amplitude oscillatory shear measurements revealed that the formation of an entanglements
networks and/or weak gel depends on substituent contents.
Keywords: Hydroxypropyl methylcellulose; FTIR; RAMAN; Rheology; Crystallinity;
Methylation
Highlights
FT-IR identified differences in methyl contents between HPMC.
The relative crystallinity of HPMC is dependent on the hydroxypropyl content.
The hydroxypropyl contents are not indicators of the percentage of free water.
The stress relaxation in weak HPMC gels depends on methyl content.
1. Introduction
Native cellulose is linked by β-(1→4) glucosidic linkages; hydrogen bonding between
neighboring cellulose chains provides mechanical strength in plants and renders cellulose

60
insoluble in water. In caustic solution, the hydrogen bonds between cellulose chains are
disrupted, and cellulose swells and absorbs water. In the swollen state, hydroxyl groups are
randomly substituted with alkyl substituents such as ethyl, methyl or hydroxypropyl groups to
produce a modified cellulose. The relative hydrophobicity or hydrophilicity of the substituent
groups affects the solution properties of modified cellulose (Thielking, et al., 2000). In
hydroxypropyl methylcellulose, cellulose contains methyl and hydroxypropyl substituents that
are esterified onto the cellulose backbone (Thielking, et al., 2000). The position, nature, and
proportion of substituents affect the resulting properties of HPMC. The substituents have been
widely analyzed to assess the changes in the functionality of HPMC. The degree of substitution
on HPMC influences the onset of turbidity during heating, termed cloud point, (Greiderer, et al.,
2011; Mitchell, et al., 1993), the onset of gelation (Haque, et al., 1993; Sarkar, 1995), drug
release rates (Viridén, et al., 2009), and the viscoelastic properties of the gel (Bodvik, et al.,
2010).
Cloud point describes the phase separation of HPMC dispersions at sufficiently high
temperatures, which is manifested as a cloudy solution. The relationship between substituent
content and cloud point has been studied through the enzymatic degradation of HPMC. Highly
substituted regions of HPMC experienced less enzymatic degradation than less substituted
regions. These fragments, which differed by substitution, were used in cloud point studies;
fragments with higher proportions of substituted regions produced the largest shifts in cloud
points at the transmission at 50%, T50, when using UV-Vis (Schagerlöf, et al., 2006). The
heterogeneity amongst the substituents in HPMC possessing the same substituent contents and
viscosities has also been analyzed with respect to release rates of pharmaceuticals. The findings

61
demonstrated that slower drug release rates were associated with more heterogeneous
substitution patterns (Viridén, et al., 2009).
The extent and nature of substitution influence the viscoelastic properties and affect the
application of HPMC in the pharmaceutical, chemical, and food industries. The hydroxypropyl
and methyl contents affect the gelling abilities of HPMC. Larger quantities of hydroxypropyl
substituents result in weaker gels and lower temperatures for the onset of gelation (Haque, et al.,
1993). The gels formed can provide an extended release matrix for pharmaceuticals ((Viridén,
Larsson, Schagerlöf, et al., 2010))or be used to enhance the rheological properties of foods such
as surimi (H. Chen, 2007; Viridén, Larsson, & Wittgren, 2010). Establishing structure function
relationships based on the substituent content, position, and distribution provide insight into the
final characteristics of the gel (Viridén, Larsson, & Wittgren, 2010). Limited research
characterizes HPMC and its gels based on the methyl to hydroxypropyl ratio and substituent
content. Understanding the role of substituents in gel formation is useful in the optimization and
selection of HPMC for industrial uses. This study uses Attenuated total reflectance Fourier
transform infrared spectroscopy (ATR/FT-IR), Raman spectroscopy, differential scanning
calorimetry (DSC), and small-amplitude oscillatory shear measurements to characterize the
gelling and structural behavior of HPMC as related to its methyl and hydroxypropyl substituents.
2. Materials and Methods
The five grades of HPMC were supplied by Samsung Fine Chemicals (Seoul, Korea) and
differed by the percent methylation, percent hydroxypropylation, and viscosity (Pa·S). The data

62
regarding percent hydroxypropylation and percent methylation were supplied by the
manufacturer and acquired using gas chromatography (Table 1).
2.1. Dispersion Preparation
HPMC dispersions were prepared by adding 2 g of powdered HPMC into 100 ml of Type
II water at 80˚C. The dispersions were stirred during addition and cooling, until the final
temperature reached 25˚C. The dispersions were hydrated for 10 d at 4˚C prior to testing
(Šklubalová & Zatloukal, 2008).
2.2. Attenuated Total Reflectance Fourier Transform Infrared Spectroscopy
The ATR-FTIR spectra of the five grades of HPMC were obtained using a purged Nicolet 6700
FT-IR Spectrometer (Thermo Electron, Madison, WI) with a diamond crystal ATR (Attenuated
Total Reflectance) accessory (Durascope, Smiths Detection, Danbury, CT) and a DTGS detector.
A background reading was taken prior to each series of measurements. Spectra of the powdered
samples were collected at 25˚C using 64 scans and at a resolution of 4 cm-1
and were background
subtracted. The spectral region ranged from 4000 cm-1
to 500 cm-1
.
2.3. Raman Spectroscopy
Powdered HPMC were analyzed by Sentinel Sure-Cal Spectroscopy (Bruker Optics,
Ettlingen, Germany). Samples weighing four grams were placed in 5 milliliter glass scintillation
vials and capped. The calibration of the instrument was performed automatically prior to each
reading. The readings, which consisted of one scan, were taken at a power of 300 mW with a

63
spectral region of 2250 cm-1
to 250 cm-1
. Contributions made from the glass vials were
subtracted from each spectrum prior to analysis.
2.4. Differential Scanning Calorimetry
Aliquots of 10 to 15 mg of 2% w/w HPMC were weighed into aluminum pans with pins
(Cat. No.: ME-00027331, Mettler Toledo, Columbus, OH). The aluminum DSC pans were
hermetically sealed and handled with forceps during testing. The samples were heated from -
50˚C to 30˚C at a rate of 10˚C/min. The peaks were analyzed and integrated using the STARe
9.10 software (Mettler Toledo, Columbus, OH). The baselines were calculated using an
integrated horizontal baseline, and the peaks were normalized to the weights of the samples. The
enthalpy change associated with the energy associated with the melting of loosely bound water in
the HPMC solutions (∆Hfusion) was recorded. The differential scanning calorimeter DSC 1
(Mettler Toledo, Columbus, OH) was calibrated using six to eight milligrams of indium standard
in an aluminum pan with a pin. An empty aluminum pan with a pin served as the reference pan
during calibration and testing. The standard was heated at a rate of 10˚C/min through a range of
100˚C to 200˚C. The DSC data were collected to associate the amount of free water in the
solution of HPMC with the respective HPMC grade. The percentage of free water in each
solution was calculated using equation 1 (Anghel & Saitō, 2003).
(1)

64
2.5. Dynamic Oscillatory Measurements
Dynamic oscillatory measurements were conducted on the stress-controlled SR-5000
rheometer (Rheometric Scientific, TA Instruments, New Castle, DE). The gap was set to 0.50
mm, and the cone angle was 4˚. A strain sweep was conducted at a frequency of 1 Hz on each of
the hydrated samples to determine linear viscoelastic region (LVR). The lowest strain in the
viscoelastic region for each HPMC was determined and used in the frequency sweeps of the five
samples. A 0.3% strain was used for AN6 and AN50 between frequencies of 0.05Hz and 5 Hz
while 1% strain was used for BN40M, CN40H, and CN10T. A strain of 1.0% could not be used
in the analysis of AN6 and AN50 because the linear viscoelastic regions differed between
samples and did not coincide during the dynamic strain sweep. The elastic modulus (G’), loss
modulus (G”), and tan δ were collected using a cone (35 mm) and Peltier plate at 25˚C
(±0.01˚C).
2.6. Statistical Analysis
All measurements were conducted on triplicate dispersions. Statistical analyses were
performed using the Minitab® 15 software. Significant differences between means were assessed
using one-way ANOVA and the t-test at P<0.05.
3. Results and Discussion
3.1 ATR-FTIR
The peaks obtained from the FT-IR spectrum were used to (1) analyze the structure of
HPMC and (2) correlate peak ratios with the percent methylation provided by the manufacturer

65
as determined by gas chromatography. In the FTIR spectra of the HPMC (Fig. 1), many of the
observed bands appeared in the fingerprint region, which encompasses wavenumbers between
1400 and 900 cm-1
. The five HPMC produced similar spectra but differed in intensity of certain
peaks. The most intense peak in the spectra occurred at 1053 cm-1
, represents out-of-phase
vibrations associated with an alkyl substituted cyclic ring containing ether linkages. The peak at
944 cm-1
represents the in-phase vibrations from ether linkages and appears as a weaker band
attached to the band at 1053 cm-1
(Coates, 2006). Cellulose material possess glucose molecules
that contain one ether linkage in the ring structure and another ether linkage between neighboring
glucose molecules (Teegarden, 2004). The spectra obtained reflecting the ether bonds (1053 and
944 cm-1
) verify the presence of these ethers in the structure of glucose as well as ether linkages
involved in covalent bonding of the substituents.
Hydroxyl groups on the hydroxypropyl substituents and glucose rings at carbon two and
three represent secondary alcohols; the C-O bonds involved in the secondary alcohol structure
typically exhibit absorption at 1100 cm-1
(Coates, 2006). Between 1091 and 1130 cm-1
, a
shoulder appears on the most intense band in the spectrum. The midpoint of the shoulder occurs
at 1112 cm-1
and may indicate the C-O bonds in secondary alcohols. Finally, the band arising
from O-H bonds from the primary alcohol at C6 on the glucose molecule appears at 1312 cm-1
(Coates, 2006; Langkilde, et al., 1995). The bands representing primary and secondary alcohols
reveal that unsubstituted carbons remain on the glucose rings in the cellulose backbone after
etherification.
The peaks at 1372 and 1452 cm-1
resulted from C-H bending and stretching modes from
methyl groups; these peaks are very weak relative to others in the spectrum (Coates, 2006).

66
Wang and others (2007) analyzed the structure of HPMC using FT-IR and identified the peaks at
1458 and 1378 cm−1
as methyl C-H vibrations (Wang, et al., 2007). The peaks at 2835 and 2898
cm-1
represent the absorptions of C-H vibration modes from methyl groups. The normalized
peak intensities at 2835 cm-1
against the largest peak in the spectra (1053 cm-1
) indicate that the
I2835/I1053 is associated well with the methyl contents. The pattern of normalized peak intensities
follows the order of percent methylation from least to greatest as determined by gas
chromatography (GC): CN40H<CN10T<BN40M<AN50<AN6 (Table 1, Fig. 2). While the
trend between absorbance followed the declared percent methylation, the r2 was 0.4141.
To form an association between the degree of methylation as determined by ATR-FTIR
and GC, the peak at 1452 cm-1
was used as it unambiguously represents C-H bonds in HPMC.
The area under the curve at 1452 cm-1
was calculated using the OMNIC 7.0 software (Thermo
Electron Corporation, Madison, WI) and associated with the percent methylation as determined
by GC. The area determined by FT-IR was plotted against the percent methylation calculated
using GC. A weak, linear association exists between the percent methylation and the area under
the curve at 1452 cm-1
between 22.0% and 30.0% methylation (y = 0.0158x - 0.2153; r2=0.6296).
This indicates that data provided by ATR-FTIR spectra is a sufficient predictor of the methyl
content of HPMC (Fig. 3). Although the differences in percent methylation are small, FT-IR
discriminates between the methyl contents well. These results support the peak intensities
observed in the normalized FT-IR spectrum. Similar studies have been performed using FT-IR
that successfully established the degree of esterification or methylation in pectins using peak
intensities (Chatjigakis, et al., 1998; Manrique & Lajolo, 2002;
Machovič, 2003). These methods used peaks that represented carboxylic acid groups to estimate

67
the degree of methylation. Inferences regarding the degree of hydroxypropylation as predicted
by FT-IR could not be established due to the failure to unambiguously assign any alcohol
derived absorption to the hydroxypropyl group alone.
3.2 Raman Spectroscopy
The Raman spectra of the HPMC samples are depicted in Fig. 4 and provide
complementary spectral information to the FT-IR spectra. The maximum wavenumber for the
Sentinel SureCal was 2250 cm-1
; as a result, the peaks corresponding to wavenumbers greater
than 2250 cm-1
were not displayed. The Raman spectra obtained were similar to those
previously reported (Davies, et al., 1990; Langkilde, et al., 1995). The most intense peaks in the
spectrum occurred at 1358 and 1453 cm-1
, which are C-H vibrations from methyl groups. The
band at 1120 cm-1
and the shoulder at 1093 cm-1
correspond to a six membered ring bound by
ether linkages, while the peak at 1155 cm-1
corresponds to an alkyl substituted ether (Coates,
2006; Langkilde, et al., 1995). A second peak corresponding to ether linkages was observed at
946 cm-1
(Coates, 2006). Langklide and Svantesson (1995) identified bands at 1097 and 1122
cm-1
as bands arising from unsubstituted glucose. These bands verify that all glucose molecules
do not participate in the etherification reaction.
In a Raman spectrum, polymers containing more amorphous regions possess broader
peaks, while polymers with more crystalline regions contain narrower peaks (Agarwal, et al.,
2010; Schenzel, Fischer, & Brendler, 2005). In Fig. 5, the most noticeable broadening occurs in
the right shoulder of the most intense peaks in the spectrum in the region 1540 to 1660 cm-1
. As
a result, this region was selected as an indicator of relative crystallinity. In a similar study using

68
Raman to assess the crystallinity of hydroxyapatite, the normalized full width at half maximum
(FWHM) was selected as the region of interest (Pucéat, Reynard, & Lécuyer, 2004). BN40M
appears to possess the narrowest spectrum, which indicates the greatest number of crystalline
regions in its structure. AN6, however, possesses the widest spectrum which is indicative of the
larger number of amorphous regions in its structure as compared to the other four grades of
cellulose. The differences in crystallinities of mixtures of pure crystalline and purely amorphous
cellulose have been quantified using peak ratios from Raman spectroscopy; the researchers
identified peaks that were most responsive to changes in crystallinity and made predictions using
peak ratios that were very close to the theoretical crystallinities (Agarwal, et al., 2010).
The order of increasing broadening at the midpoint of this region 1606 cm-1
is as follows:
BN40M<CN40H<AN50<CN10T<AN6. The amount of crystalline character in a polymer
affects its mechanical strength; larger proportions of crystalline regions are associated with
increased mechanical strength (Young, et al., 1991). The order or increasing amorphous
character closely resembles the pattern of increasing percentage of hydroxypropyl groups:
BN40M<AN50<CN40H<CN10T<AN6. The findings in this experiment suggest that higher
contents of hydroxypropyl substituents lower the crystallinity of HPMC, which may have
implications in the strengths of the gels that are formed.
When considering the viscoelastic nature of gels, the degree of crystallinity affects the
deformation modulus. More specifically, the deformation modulus is directly proportional to the
degree of crystallinity (Cowie, 1991). The crystallinity of a modified cellulose, such as HPMC,
becomes lower after the addition bulky hydroxypropyl substituents, which prevent close packing
of neighboring chains (S. Silva, et al., 2008). Studies have demonstrated that hydroxypropyl

69
groups in different varieties of HPMC decrease the elastic character of viscoelastic gels as well
as gel strengths (Bodvik, et al., 2010; Mitchell, et al., 1993). The hydrophilic hydroxypropyl
substituents also impede particle aggregations through entropic and steric means, leading to a
weakening of gel firmness (Viridén, Larsson, Schagerlöf, et al., 2010).
3.3 Differential Scanning Calorimetry
Fig. 6 displays a representative thermogram of a 2% w/w HPMC dispersion. The data
obtained from the thermogram demonstrated that the onset of melting occurs at -2.25°C (Table
3). The percentage of free water in the HPMC dispersions was >95%. The percentage of free
water in the AN6 dispersions was significantly different from the percentage of free water in the
dispersions containing AN50, BN40M, CN40H, and CN10T (P<0.05). The peak temperature
associated with the phase transition (peak onset) and the temperature of onset were not
significantly between the different HPMC samples (P<0.05). The percentage of free water in the
dispersions was not linearly associated with the percentage of hydroxypropyl groups present in
the sample.
In polymer solutions, water exists in three forms: bound, loosely bound, and free water.
Bound water is tightly bound to the polymer and does not participate in phase transitions such as
melting and evaporation. Loosely bound water undergoes the phase transitions but depresses or
elevates the temperature at which the phase transition occurs. Free water experiences a phase
change at the same temperature as pure water (Ford, 1999). The transitions in this experiment
were attributed to the freezing point depression of loosely bound water. Because bound water

70
does not participate in phase transitions, the enthalpy change of a solution of HPMC relative to
the enthalpy change associated with pure Millipore water is linked to the free water present.
In polymers, increasing numbers of hydrophilic groups are associated with increasing
quantities of loosely bound water (Anghel, et al., 2003). However, no linear relationship was
observed between either the hydrophobic or hydrophilic substituents in HPMC and the free
water content in hydrated HPMC (Mitchell, et al., 1993). Similar results were obtained in this
experiment. In addition to the hydroxypropyl content, several variables affect water binding in
polymer dispersions; these variables include polymer crystallinity, substituent arrangement,
crosslinking, and degree of substitution (Franks, 1988). The variation in each of these
characteristics may be responsible for the discrepancy in forming a linear relationship between
these variables. The peak onset during a freezing point depression depends on the concentration
of solute, which may account for the lack of significant differences between HPMC types (Engel
& Reid, 2006). The concentration of HPMC in the dispersion did not vary between each variety
which may account for the similarity in peak onset and temperature of onset. The results suggest
that DSC is unsuitable to make inferences about the amount of free water in an HPMC dispersion
based on the hydroxypropyl content.
3.4 Rheological Studies
In the plot of log angular frequency against log G’, log G”, and log tan δ for AN6 and
AN50 (Fig. 7), the elastic modulus dominates and is similar for both HPMC during the
frequency sweep. Through rheological measurements, gels are classified as either strong gels,
weak gels, or entanglement networks (J. Chen & Dickinson, 1998). Below a certain critical
concentration, an HPMC dispersion is characterized as a dilute solution lacking entanglements of

71
polymer chains (Phillips, et al., 2000). Strong gels exhibit the typical viscoelastic behavior of
gels under small deformations, until a critical point is reached. Weak gels, however, do not
display viscoelastic behavior past small deformations. The properties of weak gels resemble a
compromise between dilute solutions and strong gels. Under small deformations, weak gels
produce G’ values that are one to two orders of magnitude greater than G”. However at higher
frequencies, their three dimensional structure decomposes (Lapasin & Pricl, 1999). The plots
generated during the frequency sweep of AN6 and AN50 suggest that they are dilute solutions
lacking entanglements. In viscoelastic systems, G”>G’ at low frequencies; a crossover
eventually occurs, and thereafter G’>G” at high frequencies (Goddard & Gruber, 1999). In the
plots of AN6 and AN50 dispersions (Fig. 7), G’ dominates the frequency sweep with no prior
crossover. The absence of a crossover suggests that the crossover occurred at a frequency that
could not be detected by the rheometer. One prominent characteristic of entanglement networks
include dominance of G’ during the frequency sweep (J. Chen, et al., 1998; Phillips, et al., 2000;
Yaszemski, 2003). The plots generated during the frequency sweep of BN40M, CN40H, and
CN10T (Fig. 8) suggest that these dispersions display characteristics of weak gels. For example,
G’ and G” display a slight dependence on frequency and are parallel to one another during the
frequency sweep. Additionally, G’ dominates the entire frequency sweep suggesting it also
displays the characteristics of an entanglement network (J. Chen, et al., 1998; Yaszemski, 2003).
The tan δ of BN40M, CN40H, and CN10T are greater than 0.1, suggesting that they are at least
partially characterized as weak gels (Mandala, Savvas, & Kostaropoulos, 2004).
The results have demonstrated that the different methyl and hydroxypropyl contents
affect whether the dispersion is described as a dilute solution, an entanglement network, a weak
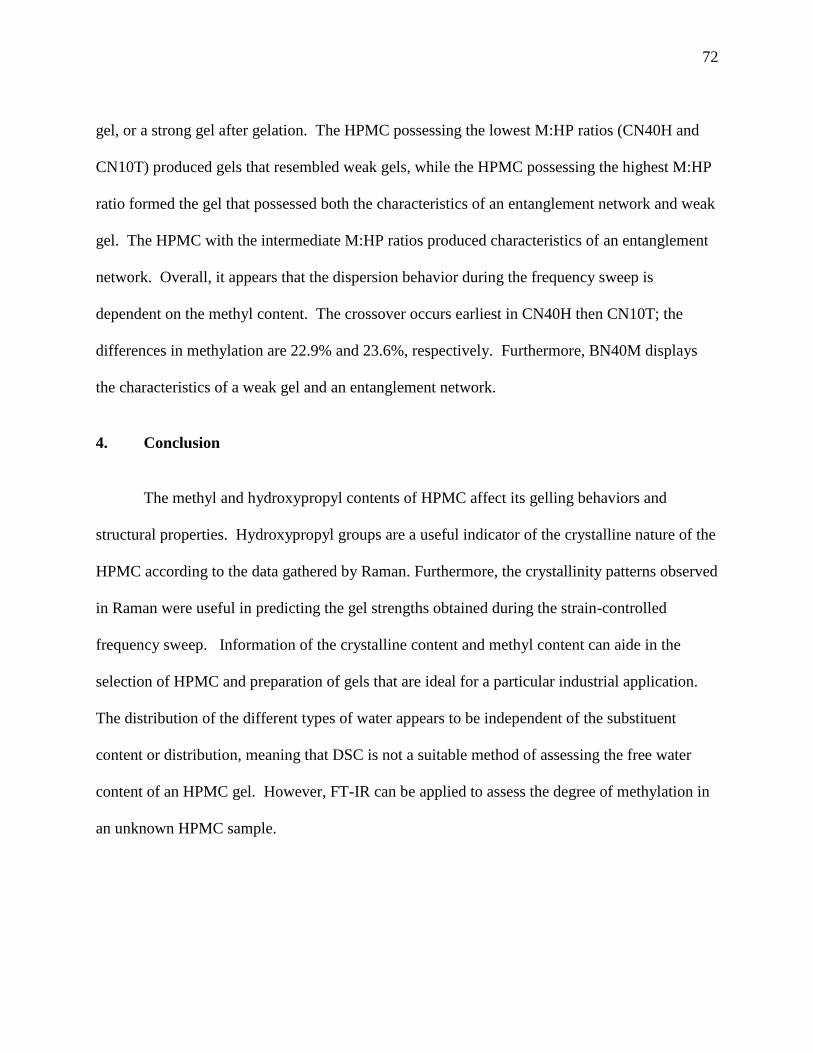
72
gel, or a strong gel after gelation. The HPMC possessing the lowest M:HP ratios (CN40H and
CN10T) produced gels that resembled weak gels, while the HPMC possessing the highest M:HP
ratio formed the gel that possessed both the characteristics of an entanglement network and weak
gel. The HPMC with the intermediate M:HP ratios produced characteristics of an entanglement
network. Overall, it appears that the dispersion behavior during the frequency sweep is
dependent on the methyl content. The crossover occurs earliest in CN40H then CN10T; the
differences in methylation are 22.9% and 23.6%, respectively. Furthermore, BN40M displays
the characteristics of a weak gel and an entanglement network.
4. Conclusion
The methyl and hydroxypropyl contents of HPMC affect its gelling behaviors and
structural properties. Hydroxypropyl groups are a useful indicator of the crystalline nature of the
HPMC according to the data gathered by Raman. Furthermore, the crystallinity patterns observed
in Raman were useful in predicting the gel strengths obtained during the strain-controlled
frequency sweep. Information of the crystalline content and methyl content can aide in the
selection of HPMC and preparation of gels that are ideal for a particular industrial application.
The distribution of the different types of water appears to be independent of the substituent
content or distribution, meaning that DSC is not a suitable method of assessing the free water
content of an HPMC gel. However, FT-IR can be applied to assess the degree of methylation in
an unknown HPMC sample.

73
Table 1. Methylation (%), Hydroxypropylation (%), Viscosity (Pa·s), and Merthyl to
Hydroxypropyl Ratio of Five Grades of HPMC
HPMC
Methyl
(%) Hydroxypropyl (%)
Viscositya
(Pa·s)
Methyl:Hydroxypropyl
Ratio (M:HP)
AN6 28.9 9.4 0.006 3.07
AN50 28.8 8.6 0.051 3.34
BN40M 28.5 6.4 0.402 4.45
CN40H 22.9 8.7 3.990 2.63
CN10T 23.6 8.8 115.115 2.68
aThe viscosity measurements were made in a 2% w/w at 25˚C dispersion of HPMC.
Table 2. FT-IR and Raman Bands and Associated Bonds
Wavenumber (cm-1
)
FT-IR Raman Bond
944 946 ether, C-O-C
1053 1093 ether, C-O-C
1112 1120 secondary alcohol, C-O
1312 ― primary alcohol, C-O
1372 1358 methyl, C-H
1452 1453 methyl, C-H
2835 ― methyl, C-H
2898 ― methyl, C-H
Table 3. Percent Free Water, Peak Onset (˚C), and Temperature of Onset (˚C) of HPMC from
DSC Measurements
Free Water (%) Peak Onset (˚C)
Temperature of
Onset (˚C)
AN6 97.34a±0.007 -2.24
a±0.44 -2.73
a±1.06
AN50 94.77b±0.014 -2.12
a±0.50 -2.21
a±0.44
BN40M 95.78b±0.009 -2.11
a±0.32 -2.13
a±0.57
CN40H 94.90b±0.022 -2.35
a±0.17 -2.52
a±0.93
CN10T 95.48b±0.013 -2.45
a±0.18 -1.94
a±0.59
Different superscripts (a-b) reflect significant differences in means in each column (P<0.05).

74
Fig. 1. The FT-IR spectra of the five HPMC
0.00
0.02
0.04
0.06
0.08
0.10
0.12
0.14
600 1100 1600 2100 2600 3100 3600
Ab
sorb
an
ce
Wavenumber (cm-1)
AN6
CN40H
AN50
BN40M
CN10T
944 cm-1
1053 cm-1
1372 cm-1
1452 cm-1
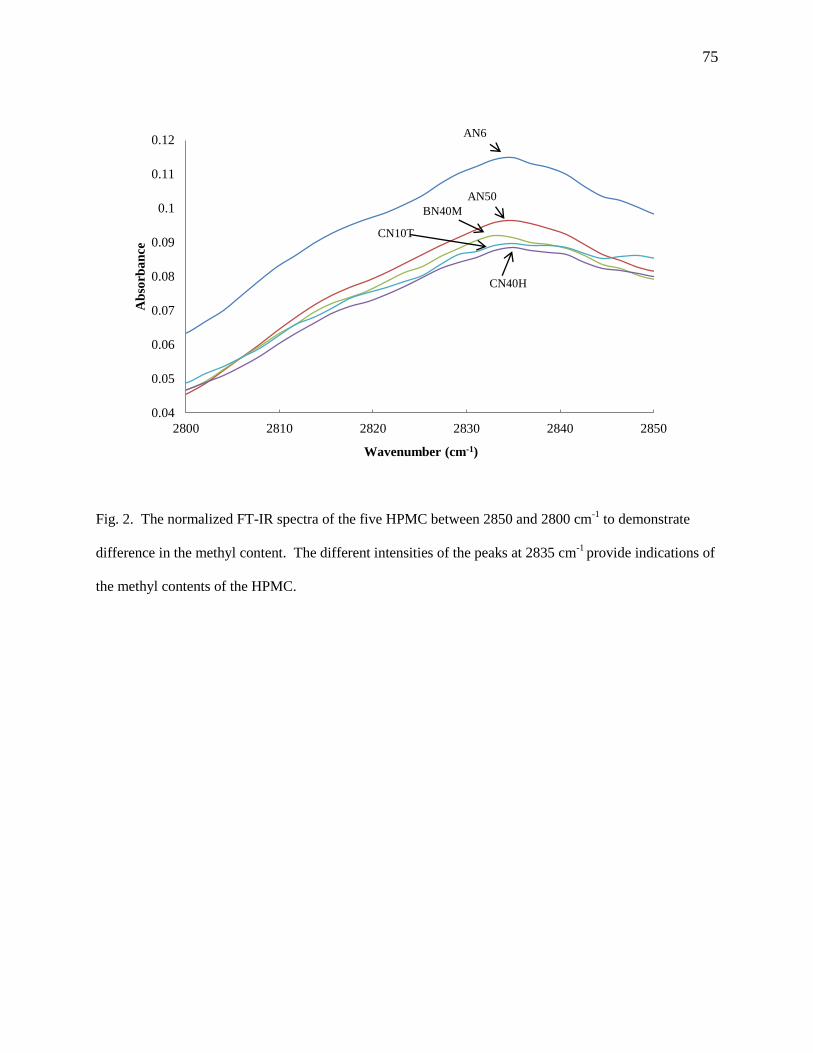
75
Fig. 2. The normalized FT-IR spectra of the five HPMC between 2850 and 2800 cm-1
to demonstrate
difference in the methyl content. The different intensities of the peaks at 2835 cm-1
provide indications of
the methyl contents of the HPMC.
0.04
0.05
0.06
0.07
0.08
0.09
0.1
0.11
0.12
2800 2810 2820 2830 2840 2850
Ab
sorb
an
ce
Wavenumber (cm-1)
AN6
AN50
BN40M
CN10T
CN40H

76
Fig. 3. The figure above depicts the association between the percent methylation from gas
chromatography and the area under the curve as represented by ATR-FT-IR.
.
0
0.05
0.1
0.15
0.2
0.25
0.3
0.35
22 23 24 25 26 27 28 29 30
Are
a a
t 1
452
cm
-1 (
AT
R-F
T-I
R)
% Methylation (GC)

77
Fig. 4. The superimposed Raman spectra of the five grades of HPMC are pictured above.
Broadening of each spectrum is apparent in the 1220 to 2220 cm-1
range.
0
2000
4000
6000
8000
10000
12000
14000
16000
18000
20000
220 720 1220 1720 2220
Ab
sorb
an
ce
Wavenumber (cm-1)
AN50
AN6
CN10T
BN40M
CN40H
1093 cm-1
1122 cm-1

78
Fig. 5. Broadening of the Raman spectrum of each HPMC between 1540 cm-1
and 1660 cm-1
.
BN40M possesses the narrowest spectrum, while AN6 possesses the broadest spectrum.
0
2000
4000
6000
8000
10000
12000
1540 1560 1580 1600 1620 1640 1660
Ab
sorb
an
ce
Wavenumber (cm-1)
CN10T
AN50
CN40H BN40M
AN6

79
Fig. 6. Thermogram of the 2% w/w dispersion between -50°C and 30°C.

80
Fig. 7. Variation of G’ (filled) with angular frequency (rad/s) for AN6 and AN50 at a strain of
0.3%. G” and tan δ are not shown because only G’ was observed during the frequency sweep.
0.01
0.1
1
10
100
1000
0.01 0.1 1 10
G'G
"(P
a)
tan
δ
Angular Frequency (rad/s)
G', AN6
G', AN50

81
Fig. 8. Variation in G’ (filled), G” (empty), and tan δ (gray) with angular frequency (rad/s) for
BN40M, CN40H, and CN10T at a strain of 1.0%.
0.1
1
10
100
1000
0.01 0.1 1 10
G'G
"(P
a)
tan
δ
Angular Frequency (rad/s)
G', BN40M
G", BN40M
tan δ, BN40M
G', CN40H
G", CN40H
tan δ, CN40H
G', CN10T
G", CN10T
tan δ, CN10T

82
REFERENCES (CHAPTER 2)
Agarwal, U., Reiner, R., & Ralph, S. (2010). Cellulose I crystallinity determination using FT–
Raman spectroscopy: univariate and multivariate methods. Cellulose, 17(4), 721-733.
Anghel, D. F., & Saitō, S. (2003). Aqueous polymer--cosolute systems: special issue in honor of
Dr. Shuji Saito. Springer.
Bodvik, R., Dedinaite, A., Karlson, L., Bergström, M., Bäverbäck, P., Pedersen, J. S., Edwards,
K., Karlsson, G., Varga, I., & Claesson, P. M. (2010). Aggregation and network formation of
aqueous methylcellulose and hydroxypropylmethylcellulose solutions. Colloids and Surfaces A:
Physicochemical and Engineering Aspects, 354(1-3), 162-171.
Chatjigakis, A. K., Pappas, C., N.Proxenia, O.Kalantzi, P.Rodis, & Polissiou, M. (1998). FT-IR
spectroscopic determination of the degree of esterification of cell wall pectins from stored
peaches and correlation to textural changes. Carbohydrate polymers, 37(4), 395-408.
Chen, H. (2007). Rheological properties of HPMC enhanced Surimi analyzed by small- and
large-strain tests: I. The effect of concentration and temperature on HPMC flow properties. Food
Hydrocolloids, 21(7), 1201-1208.
Chen, J., & Dickinson, E. (1998). Viscoelastic Properties of Protein-Stabilized Emulsions:
Effect of Protein−Surfactant Interactions. Journal of Agricultural and Food Chemistry, 46(1),
91-97.
Coates, J. (2006). Interpretation of Infrared Spectra, A Practical Approach. Encyclopedia of
Analytical Chemistry: John Wiley & Sons, Ltd.
83
Cowie, J. M. K. G. (1991). Polymers: chemistry and physics of modern materials. Nelson
Thornes.
Davies, M. C., Binns, J. S., Melia, C. D., Hendra, P. J., Bourgeois, D., Church, S. P., &
Stephenson, P. J. (1990). FT Raman spectroscopy of drugs in polymers. International Journal Of
Pharmaceutics, 66(1–3), 223-232.
Engel, T., & Reid, P. J. (2006). Physical chemistry. Pearson Benjamin Cummings.
Ford, J. L. (1999). Thermal analysis of hydroxypropylmethylcellulose and methylcellulose:
powders, gels and matrix tablets. International Journal Of Pharmaceutics, 179(2), 209-228.
Franks, F. (1988). Water Science Reviews 3: Water Dynamics. Cambridge University Press.
Goddard, E. D., & Gruber, J. V. (1999). Principles of Polymer Science and Technology in
Cosmetics and Personal Care. Marcel Dekker.
Greiderer, A., Steeneken, L., Aalbers, T., Vivó-Truyols, G., & Schoenmakers, P. (2011).
Characterization of hydroxypropylmethylcellulose (HPMC) using comprehensive two-
dimensional liquid chromatography. Journal of Chromatography A, 1218(34), 5787-5793.
Haque, A., Richardson, R. K., Morris, E. R., Gidley, M. J., & Caswell, D. C. (1993).
Thermogelation of methylcellulose. Part II: effect of hydroxypropyl substituents. Carbohydrate
polymers, 22(3), 175-186.
Langkilde, F. W., & Svantesson, A. (1995). Identification of celluloses with Fourier-Transform
(FT) mid-infrared, FT-Raman and near-infrared spectrometry. Journal of Pharmaceutical and
Biomedical Analysis, 13(4–5), 409-414.
Lapasin, R., & Pricl, S. (1999). Rheology of Industrial Polysaccharides: Theory and
Applications. Springer.

84
Mandala, I. G., Savvas, T. P., & Kostaropoulos, A. E. (2004). Xanthan and locust bean gum
influence on the rheology and structure of a white model-sauce. Journal of Food Engineering,
64(3), 335-342.
Manrique, G. D., & Lajolo, F. M. (2002). FT-IR spectroscopy as a tool for measuring degree of
methyl esterification in pectins isolated from ripening papaya fruit. Postharvest Biology and
Technology, 25(1), 99-107.
Mitchell, K., Ford, J. L., Armstrong, D. J., Elliott, P. N. C., Hogan, J. E., & Rostron, C. (1993).
The influence of substitution type on the performance of methylcellulose and
hydroxypropylmethycellulose in gels and matrices. International Journal Of Pharmaceutics,
100(1-3), 143-154.
Phillips, G. O., & Williams, P. A. (2000). Handbook of Hydrocolloids. CRC Press.
Pucéat, E., Reynard, B., & Lécuyer, C. (2004). Can crystallinity be used to determine the degree
of chemical alteration of biogenic apatites? Chemical Geology, 205(1–2), 83-97.
Sarkar, N. (1995). Kinetics of thermal gelation of methylcellulose and
hydroxypropylmethylcellulose in aqueous solutions. Carbohydrate polymers, 26(3), 195-203.
Schagerlöf, H., Johansson, M., Richardson, S., Brinkmalm, G., Wittgren, B., & Tjerneld, F.
(2006). Substituent Distribution and Clouding Behavior of Hydroxypropyl Methyl Cellulose
Analyzed Using Enzymatic Degradation. Biomacromolecules, 7(12), 3474-3481.
Schenzel, K., Fischer, S., & Brendler, E. (2005). New Method for Determining the Degree of
Cellulose I Crystallinity by Means of FT Raman Spectroscopy. Cellulose, 12(3), 223-231.
Silva, S., Pinto, F. V., Antunes, F. E., Miguel, M. G., Sousa, J. J. S., & Pais, A. A. C. C. (2008).
Aggregation and gelation in hydroxypropylmethyl cellulose aqueous solutions. Journal of
Colloid and Interface Science, 327(2), 333-340.
85
Šklubalová, Z., & Zatloukal, Z. (2008). Optimization of Regression Equation for Prediction of
Viscosity of Aqueous Solutions of the Cellulose Derivatives. Pharmaceutical Development and
Technology, 13(5), 359-365.
infrared spectroscopy of pectins. Carbohydrate polymers, 54(1), 97-106.
Teegarden, D. M. (2004). Polymer chemistry: introduction to an indispensable science. NSTA
Press, National Science Teachers Association.
Thielking, H., & Schmidt, M. (2000). Cellulose Ethers. Ullmann's Encyclopedia of Industrial
Chemistry: Wiley-VCH Verlag GmbH & Co. KGaA.
Viridén, A., Larsson, A., Schagerlöf, H., & Wittgren, B. (2010). Model drug release from matrix
tablets composed of HPMC with different substituent heterogeneity. International Journal Of
Pharmaceutics, 401(1-2), 60-67.
Viridén, A., Larsson, A., & Wittgren, B. (2010). The effect of substitution pattern of HPMC on
polymer release from matrix tablets. International Journal Of Pharmaceutics, 389(1-2), 147-156.
Viridén, A., Wittgren, B., Andersson, T., & Larsson, A. (2009). The effect of chemical
heterogeneity of HPMC on polymer release from matrix tablets. European Journal Of
Pharmaceutical Sciences: Official Journal Of The European Federation For Pharmaceutical
Sciences, 36(4-5), 392-400.
Wang, L., Dong, W., & Xu, Y. (2007). Synthesis and characterization of hydroxypropyl
methylcellulose and ethyl acrylate graft copolymers. Carbohydrate polymers, 68(4), 626-636.
Yaszemski, M. J. (2003). Tissue Engineering and Novel Delivery Systems. Marcel Dekker
Incorporated.
Young, R. J., & Lovell, P. A. (1991). Introduction to polymers. Chapman and Hall.

86
1Akinosho, H. and L. Wicker. To be submitted to Food Hydrocolloids.
CHAPTER 3
THE PHYSICAL STABILITY OF AN EMULSION STABILIZED WITH
HYDROXYPROPYL METHYLCELLULOSE1

87
Abstract
The emulsification properties of four oil-in-water emulsions, prepared using high-
pressure homogenization, were compared to assess chemical and physical stability beverage
emulsion concentrate at 25˚C and 37˚C over 12 days. The emulsifiers were three hydroxypropyl
methylcelluloses (HPMC) at 2% w/w and one gum acacia (GA) at 21.25% w/w. The methyl to
hydroxypropyl ratio (M:HP), the initial viscosity of the HPMC dispersion, and viscoelastic
properties highly impacted emulsion stability. Particle size measurements demonstrated that the
emulsions containing GA (0.79 µm) formed small diameters immediately after homogenization,
while two HPMC stabilized emulsions retained smaller diameter (1.39 µm and 1.86 µm) at day
12. After 12 days of storage, images from light microscopy and particle size distribution
analysis demonstrated that the variability in droplet sizes occurred in lower viscosity and M:HP
stabilized emulsion. Ultimately, the two HPMC emulsifiers (AN50 and BN40M) performed
better than GA in promoting emulsion stability.
Keywords: Methyl to hydroxypropyl ratio; Emulsion; Instability; Hydroxypropyl
methylcellulose; Coalescence
1. Introduction
Emulsions are systems that consist of at least two immiscible phases that are temporarily
miscible due to the presence of an emulsifier. Emulsifiers are amphiphilic molecules that
interact with the aqueous and oil phases to reduce surface tension and promote miscibility. The
stability achieved is temporary due to more favorable thermodynamics when molecules of the
same polarity interact with one another (McClements, 1999).

88
Emulsifiers are molecules such as phospholipids and polysaccharides that possess
hydrophobic and hydrophilic regions and temporarily mix two immiscible phases (Barbosa-
Cánovas, et al., 2009). Oil-in-water (O/W) emulsions describe systems where oil is dispersed
into an aqueous continuous phase (Robins, et al., 2003). The hydrophobic regions on emulsifiers
supply these molecules with surface activity, which enables them to adsorb to an oil droplet
surface. During homogenization, emulsifiers temporarily reduce the surface and interfacial
tensions present between the otherwise immiscible dispersed and continuous phases to generate
an emulsion (Gaonkar, 1991).
Hydroxypropyl methylcellulose (HPMC) is an amphiphilic emulsifier that derives its
surface activity from its methyl substituents (Hui, 2006). Research suggests that the surface
activity of the methyl substituents from HPMC exceeds that of proteins (Arboleya, et al., 2005;
Zhao, et al., 2009). In a competitive adsorption experiment, the surface activity of HPMC and
methylcellulose (MC) exceeded that of β-casein and β-lactoglobulin (Arboleya, et al., 2005).
The presence of hydroxypropyl substituents appear to lower surface tension, while higher
viscosity HPMC promotes smaller oil droplet diameters (Gaonkar, 1991). The emulsification
properties of HPMC are evident at low concentrations. At 0.5% w/w, HPMC stabilized silicone
oil emulsions after 10 s of mixing, attaining particle sizes <103 µm (Yonekura, et al., 1998).
Research surrounding the physical stability of emulsions containing β-carotene has also
emerged. The physical and chemical stabilities of an emulsion containing β-carotene were
assessed under different temperature and homogenization conditions; ultimately, a
homogenization pressure between 60 and 100 MPa and temperature of 30˚C yielded the most
stable emulsions (Yuan, et al., 2008). Yin and others (2008) compared the effect of the

89
emulsifiers sodium caseinate, Tween 20, decaglycerol monolaurate, and sucrose fatty acid ester
on emulsion stability. Tween 20 produced the smallest particle sizes, and the use of single rather
than combined emulsifiers produced smaller particle sizes (Yin, et al., 2009).
Accordingly, the physical and chemical stability weigh heavily on the formation of a
color-stable beverage emulsion. Limited research has been conducted on the performance of a
glycoprotein emulsifier against a polysaccharide emulsifier in stabilizing an emulsion that suffers
from both of these instabilities. This investigation will examine the relationship between
physical and chemical stability and their role in maintaining particle size, oxidation, color,
rheological behavior, and light microscopy to the final color of a hydroxypropyl methylcellulose
stabilized emulsion.
2. Materials and Methods
Three grades of hydroxypropyl methylcellulose were supplied by Samsung Fine
Chemicals (Seoul, Korea). The samples differed by viscosity, methyl, and hydroxypropyl
content (Table 1). The table presents information gathered from the Certificate of Analysis
regarding viscosity, obtained at 20°C and 2% w/w HPMC, and substituent content obtained gas
chromatography. The recommended usage level as an emulsifier is 2% w/w. Kosher gum acacia
(FCC) was supplied by TIC gums (White Marsh, MD). The recommended usage levels were 5-
30% w/w in a ratio of 1.5 grams of emulsifier to 1.0 gram of oil.
2.1. Emulsifier Preparation
Powdered HPMC (Samsung Fine Chemicals, Seoul, Korea) were weighed (4.70 g) and
dissolved in 200 g of Millipore water at 80˚C. After adding the HPMC, the dispersions were

90
allowed to cool, while stirring, to room temperature. Gum acacia (FCC, TIC Gums, White
Marsh, MD) were weighed and dissolved into 200 g of Millipore water at 25˚C. The final
concentration of the gum acacia was 25% w/w. The HPMC and gum acacia dispersions were
placed in the cooler at 4˚C to hydrate for five days prior to emulsion preparation (Lazǎu,
Pǎcurariu, & Ciobanu). The dispersions were not stirred during hydration.
Sodium benzoate (Avantor Performance Materials, Phillipsburg, NJ, USA) was added as
a preservative at a final concentration of 0.01% w/w in the dispersions of emulsifier.
2.1.1. Emulsion Preparation
Medium chain triglycerides (NOW FOODS, Bloomingdale, IL, USA) containing 0.033%
w/w β-carotene (MP Biomedicals, Solon, OH, USA) were added to 170 g of the respective
emulsifier during homogenization by the PRO Scientific homogenizer (PRO Scientific, Oxford,
CT, USA) at room temperature. The initial premix was applied for 3 min at maximum speed.
The emulsion was then passed through the Emulsiflex-C5 High Pressure Homogenizer (Avestin,
Inc., Ottawa, Canada) three times at 69 MPa. The emulsions were kept on ice following the last
passage on the Emulsiflex-C5 to aide in the dissipation of heat. The final concentration of gum
acacia was 21.25% w/w gum acacia in 200 g of emulsion. The final concentration of the HPMC
emulsifier was 2% w/w of the 200 g emulsion. The emulsions were stored in sealed containers
in the dark at 25˚C and 37˚C for 12 days.

91
2.2. Instrumental Analysis
2.2.1. Particle Size Measurements
Particle size measurements were obtained using laser diffraction light scattering (Malvern
Mastersizer S, Malvern Instruments, Worcestershire, UK). The appropriate volume of the
emulsion was added to deionized water in the sample port until the obscuration was between
10.0%-30.0%. The D[3,2], D[4,3], and particle size distribution measurements were obtained
immediately after homogenization and daily over 12 days after preparation.
2.2.2. Light Microscopy
The emulsions were viewed using a light microscope (LeicaDM, Leica Microsystems,
Buffalo Grove, IL) under bright field transmitted light using a 20X magnification lens. The
background of the images where corrected for a white balance and filtered for noise.
Photographs of the images were taken using the SPOT 4.0 software (SPOT Imaging Solutions,
Sterling Heights, MI,USA).
2.2.3. Small-Amplitude Oscillatory Shear Measurements
A strain-controlled rheometer (SR-5000, Rheometric Scientific, New Castle, DE, USA)
equipped with cone and plate geometry (35 mm diameter) was used to study the viscoelastic
behavior of the emulsions. The cone angle was set to approximately 4˚, and the gap width was
0.50 mm. The linear viscoelastic region of each emulsion was determined by applying a series
of increasing strains at a frequency of 1 Hz during a dynamic strain sweep. The percent strains
were plotted against the complex modulus G* and the complex viscosity η*, and the deviation
from linearity (>10%) was determined. A strain was selected in the linear viscoelastic region

92
and used in an angular frequency (rad/s) sweep to determine G’, G”, and tan δ. A strain-
controlled oscillating deformation was applied to each emulsion over a range (0 to 10 rad/s) of
increasing frequencies.
2.2.4 Particle Migration and Aggregation
Particle migration and aggregation were analyzed using the Turbiscan MA2000
(Formulaction, France). An aliquot of 42 mL of the emulsion were pipetted into centrifuge tubes
and was centrifuged at 1200 rpm for four minutes (RC6 Plus, Sorvall centrifuge, Asheville, NC)
to minimize viscosity effects from the emulsifier and produce a quality meniscus in the
transmission plot. A quality meniscus indicates the reproducibility of the data by assessing
interferences in the data. The centrifuged emulsion was measured in seven milliliter increments
into six flat bottom screw top test tubes and capped. The centrifuged emulsions were distributed
into the three test tubes that were stored at 25˚C and three test tubes that were stored at 37˚C
storage conditions. The test tubes were cleaned with a Kim Wipe, inserted into the sample port,
and tested.
2.3. Experimental Design and Statistical Analysis.
All assays were performed in triplicates. Raw data were analyzed for outliers using the
modified z-score (Equation 3) as proposed by Iglewicz and Hoaglin (1993). The term xi
represents a data point, while xm represents the median of the data set. MAD represents the mean
absolute deviation. Any data point possessing a modified z-score greater than ±3.5 was
considered an outlier (Iglewicz & Hoaglin, 1993). One way ANOVA and studentized t-tests
were used to analyze significant differences in the quantitative data obtained during the
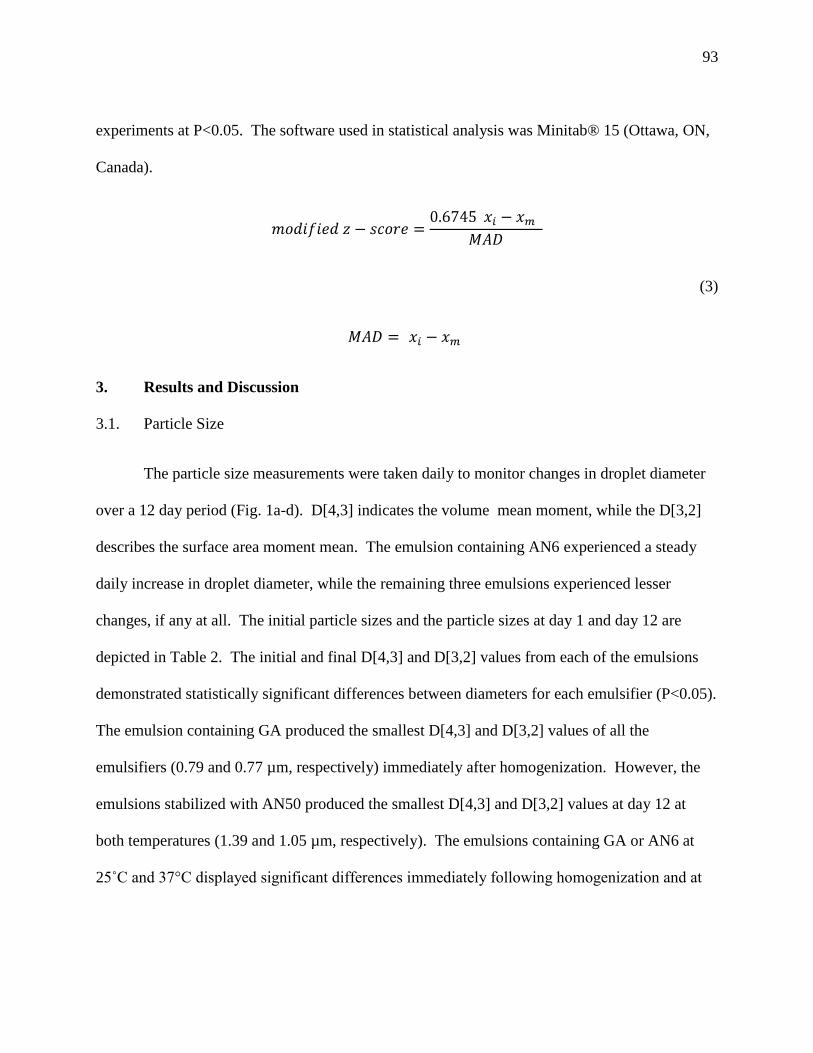
93
experiments at P<0.05. The software used in statistical analysis was Minitab® 15 (Ottawa, ON,
Canada).
(3)
3. Results and Discussion
3.1. Particle Size
The particle size measurements were taken daily to monitor changes in droplet diameter
over a 12 day period (Fig. 1a-d). D[4,3] indicates the volume mean moment, while the D[3,2]
describes the surface area moment mean. The emulsion containing AN6 experienced a steady
daily increase in droplet diameter, while the remaining three emulsions experienced lesser
changes, if any at all. The initial particle sizes and the particle sizes at day 1 and day 12 are
depicted in Table 2. The initial and final D[4,3] and D[3,2] values from each of the emulsions
demonstrated statistically significant differences between diameters for each emulsifier (P<0.05).
The emulsion containing GA produced the smallest D[4,3] and D[3,2] values of all the
emulsifiers (0.79 and 0.77 µm, respectively) immediately after homogenization. However, the
emulsions stabilized with AN50 produced the smallest D[4,3] and D[3,2] values at day 12 at
both temperatures (1.39 and 1.05 µm, respectively). The emulsions containing GA or AN6 at
25˚C and 37°C displayed significant differences immediately following homogenization and at

94
day 12 in both diameters (P<0.05). Interestingly, AN6 produced smaller oil droplet sizes after
12 days when stored at 37˚C when compared to 25˚C.
The mean change (∆) in D[4,3] and D[3,2] values per day beginning immediately after
homogenization, at day 1, and at day 12 (Table 3) provide additional indications of emulsion
stability. The table demonstrates that GA and AN6 emulsions experienced larger rates of change
in particle size diameter (µm) during the 12 day period when compared to the AN50 and BN40M
stabilized emulsion. The emulsions containing AN50 and BN40M remained more resistant to
particle size changes, experiencing changes ≤0.011 µm/day at both temperatures and diameters.
The rate of change in the particle size AN6 stabilized emulsions appears to depend on
temperature; higher temperatures result in a lower rate of change in the AN6 stabilized emulsion.
The emulsions containing AN6 experience the largest rate of change in the particle size with
time, while those stabilized with either AN50 or BN40M experience the lowest rates of change.
When compared the GA stabilized emulsion, the emulsions containing either AN50 or BN40M
slowed the rate of particle size change the most.
With the exception of the emulsions stabilized with AN6, the D[4,3] and D[3,2] values of
the emulsions fell within the desired range of particle sizes (0.2-2 µm) for a beverage emulsion
(Given, 2009). The factors predominantly responsible for the differences in the particle sizes of
the emulsions are the methyl to hydroxypropyl ratio (M:HP), the final viscosity of the continuous
phase in the emulsion, and emulsifier type. Of the HPMC emulsifiers, BN40M possesses the
highest M:HP, which should promote the strongest adsorption to the oil droplet surface and the
greatest resistance to particle size change of all the HPMC emulsifiers (Wollenweber, et al.,
2000). The accessibility of the methyl groups is hindered by the presence of bulky substituents

95
such as hydroxypropyl groups. Although the percent methylation of AN6 is high, the methyl
groups are less accessible due to the abundance of hydroxypropyl groups. The interactions
between the methyl groups and the oil droplet surface are therefore inadequate and minimal,
which leads to a less stable emulsion. The emulsion stabilized with AN50 possesses an
intermediate M:HP ratio but generates and retains the small particle sizes (≈1 µm). In this case,
the M:HP ratio may only partially account for the production and retention of small particle
sizes. The differences in viscosity between the emulsions are large, which may deliver an
additional form of protection to the oil droplets that is absent in the emulsions containing AN6.
The small, initial D[4,3] and D[3,2] values of the droplets in the gum acacia stabilized
emulsion suggest that gum acacia is more efficient in producing small particle sizes immediately
following homogenization than HPMC. The control, gum acacia (GA), lacks a M:HP ratio and
owes its surface activity to the arabino galacto protein (AGP) that constitutes roughly one to two
percent of its structure (Jayme, Dunstan, & Gee, 1999). The hydrophilic carbohydrate group on
gum provide emulsion stability through steric effects (Dickinson, 2008). Often regarded as
minor, charge repulsion may also promote emulsion stability in GA stabilized emulsions.
Generally, effective emulsifiers possess high interfacial activities as well as adsorb to the droplet
surface rapidly after homogenization to promote small particle sizes (Camino, et al., 2011). The
bulky carbohydrate moiety and charge on gum acacia may be more efficient in preventing
coalescence and flocculation through steric hindrance and charge repulsion during
homogenization than the hydroxypropyl groups HPMC during emulsion preparation (Dickinson,
2008, 2009). The carbohydrate moiety may contribute to rapid surface coverage by fewer
molecules of gum acacia and prevent nearby oil droplets from interacting with one another.

96
However, the lesser degree of steric hindrance in HPMC may promote better surface coverage of
the oil droplet, resulting in an emulsion with enhanced stabilizing properties. Although GA is
effective at producing small particle sizes, the two HPMC are superior in retaining the droplet
sizes.
Both BN40M and AN50 experienced lesser changes in particle sizes over 12 days than
GA, which may suggest an increased ability to adsorb to the oil surface. Arboleya and Wilde
(2005) conducted an experiment to compare the surface activity of two modified celluloses,
HPMC and methylcellulose (MC), to protein emulsifiers. The results demonstrated that the
surface activity of these cellulose ethers exceeded that of β-casein and β-lactoglobulin (Arboleya,
et al., 2005). The results of this experiment support the notion that the surface activity of HPMC
is greater than that of the protein components of GA.
In this experiment, the viscosities were 0.006 Pa∙S, 0.051 Pa∙S, and 0.401 Pa∙S for AN6,
AN50, and BN40M, respectively. Hydrocolloids, such as HPMC, also stabilize emulsions
through the increase in the viscosity of the continuous phase of the emulsion (Barbosa-Cánovas,
Mortimer, Lineback, Spiess, Buckle, & Colonna, 2009; Hall, 2009). A more viscous continuous
phase leads to a reduction in the frequency of collisions between neighboring oil droplets
(Dickinson, 2003). The low viscosity of the AN6 stabilized emulsion may not slow the
collisions between oil droplets sufficiently enough to prevent particle size increase. The
viscosity of the AN50 emulsion may have been high enough to reduce collisions; however, the
lack of change in particle size may also be attributed to viscosity of the continuous phase of the
emulsion during storage. To clarify, the ability to produce small particle sizes initially is
viscosity dependent; as viscosity increases, more energy is required to form oil droplets

97
(Futamura, et al., 2012). When using the Emulsiflex-C5, the viscosity of the solution limits the
particle sizes produced. As the viscosity becomes greater, the Emulsiflex-C5 is less able to
produce smaller particle sizes as evidenced later by the broadening of the particle size
distributions as well as reductions in the volume (%) of oil droplets possessing the same diameter
as the viscosity of the continuous phase increases (Fig. 3a-d). The viscosity of AN50 appears to
be low enough to produce small oil droplets but large enough to reduce the frequency of oil
droplet collisions. The high viscosity of the BN40M emulsion as compared to GA may account
for the lesser rate of change in particle size over the 12 day period but may interfere with the
production of small initial droplet sizes as GA and AN50 produced. Higher viscosity (4000
mPa·s) HPMC formed smaller droplet sizes when compared to lower viscosity HPMC (6, 15, 50
mPa·S), which may be partially attributed to the homogenizer used (Gaonkar, 1991).
The small particle sizes produced by AN50 may play a large role in the stabilizing effect
observed by HPMC. Small, initial particle sizes result in large reductions in interfacial and
surface tension between the continuous and dispersed phases (McClements, 1999). In an
experiment conducted by Gaonkar (1991), the interfacial tension of HPMC (4000 mPa·s) was
greater than that of the interfacial tension of the lower viscosity HPMC (50 mPa·S).
Furthermore, the HPMC at 50 mPa·S produced the lowest surface tension of all of the viscosity
grades tested (Gaonkar, 1991). The interfacial and surface tensions may explain the stabilizing
behavior observed by AN50 in this study.
3.2. Particle Size Distributions
The particle size distributions are shown in Fig. 3a-d immediately after homogenization
and at day 12 at 25˚C and 37˚C. Immediately after homogenization, the GA emulsions produced

98
the second highest volume (%) of all of the emulsifiers at 25˚C and 37˚C, which reflects the
ability to consistently generate similar particle sizes. The initial distribution contains a shoulder,
indicating a second population of particle size diameters. After 12 days, the distributions became
narrower and increased in height. Furthermore, the distribution shifts left side of the distribution
shifts inward, indicating the loss of small droplet sizes. The emulsion containing AN6 displays a
bimodal distribution, indicating the presence of two distinct populations of commonly observed
particle sizes immediately after homogenization. The taller peak in the distribution contains
many large oil droplets with very similar sizes (≈4.92 µm) that represent size of most of the oil
droplets in the emulsion. After 12 days of storage at 25˚C, the bimodal distribution reduces in
width, decreases in height, and shifts right. At 37˚C, the once bimodal distribution becomes
unimodal as times progresses and shortens in height. The loss of the small peak indicates the
transformation of oil droplets with small diameters into those with larger diameters. In the
particle size distribution for AN50 emulsion after homogenization, the distribution is bimodal
with the majority of the particle sizes falling on the left side of the distribution (≈0.78 µm).
After 12 days have elapsed, the peaks of both distributions increase in intensity, indicating a
slight particle size increase during storage. The smaller particle size distribution increases
becomes less distinct at both temperatures as time progresses. The distribution of particle sizes
in the emulsion stabilized by BN40M was slightly bimodal immediately after preparation and at
day 12 at 25˚C and 37˚C. Unlike the other distributions, no major changes occurred in the
distribution when the emulsion was stored at 25˚C or 37˚C.
Storing the emulsions at elevated temperatures accelerates particle movement and
migration. The particle size distribution monitors changes in the volume (%) of particle sizes

99
with time that may not otherwise have been detected from the initial and final particles sizes
alone (Fig. 2a-c). For example, significance testing found no significant difference between the
particle the D[4,3] or D[3,2] diameters immediately after homogenization and at day 12.
However, the particle size distribution indicates the change in the volume (%) occupied by
different particle sizes with time. In the emulsions stabilized with GA, AN6 and AN50, higher
temperatures resulted in changes in the populations of particle sizes over the 12 day period. The
retention of the particle size distribution in the BN40M emulsion at both storage temperatures
indicates the ability of the emulsifier to retard changes in the oil droplet sizes, which ultimately
affect emulsion stability. The emulsion stabilized with BN40M appeared to retain the initial
distribution at 37˚C better than at 25˚C. These phenomena may be explained by viscosity
effects, strong adsorption to the oil surface due to the high M:HP ratio, and the enhancement of
hydrophobic interactions at higher temperatures. When a solution of HPMC is heated above its
lower critical solution temperature, HPMC precipitates out of solution due to enhanced
hydrophobic interactions as temperature increases (Sarkar, 1995). The smaller particle sizes in
the emulsion produced by AN6 at 37˚C as compared to 25˚C and the retention of the initial
particle distribution in BN40M over 12 days at 37˚C may suggest the role of higher temperatures
in generating stable emulsions by promoting stronger interactions between the oil droplet and
emulsifier.
3.3. Turbiscan
All emulsions stored at 25˚C and 37˚C demonstrated physical instabilities after 12 days
of storage (Fig. 4). Creaming and particle size increase were present in all emulsions.
Sedimentation was also evident in many of the replicates. In the bottom portion of the Turbiscan

100
plot, the percent backscattering becomes more negative with time. Accordingly, the percent
backscattering at the top of the plot increases with time. These events indicate that droplets in
the emulsion are migrating from the bottom of the tube to the top. Often, the percent
backscattering at the bottom of the tube became more positive with time or the percent
backscattering at the top of the tube decreased in magnitude with time; in these instances,
sedimentation was observed. The downward movement of the middle of the plots indicated
particle size increase by either flocculation or coalescence. The transmission graphs (data not
shown) demonstrated the presence of viscosity effects in all of the emulsions. Viscosity effects
are expected because the emulsifiers are hydrocolloids which stabilize emulsions partly through
the viscosity of the continuous phase of the emulsion.
In the emulsions, the percentage of oil in the emulsion is relatively low (15% w/w),
rendering it prone to gravitational separation (Sjöblom, 2006). Visually, the emulsion stabilized
with AN6 at 25˚C contained a distinct orange ring in the Turbiscan test tube that indicated
creaming. Other emulsions did not produce distinct color migrations to either the top or bottom
of the Turbiscan tubes. Droplet migration causes the migration of flavor in beverage emulsions
and can likewise cause movement of color in the emulsion (Friberg, et al., 2004). The
susceptibility of the AN6 stabilized emulsion to the production of large particle sizes is likely the
root of the orange ring; creaming is exacerbated by the presence of large oil droplets or flocks
(Sjöblom, 2006). Camino and others (2011) prepared oil in water emulsions in a 10:90 ratio
using HPMC and also detected creaming in their emulsions using Turbiscan backscattering
profiles (Camino, et al., 2011). Particle migration during creaming can be reduced by increasing

101
the phase volume of the dispersed phase, decreasing particle size diameter, or increasing the
viscosity of the continuous phase (McClements, 1999).
Agents that increase the viscosity of the continuous phase of the emulsion such as HPMC
slow the movement of particles during creaming. In xanthan gum, creaming can be hindered
altogether at the appropriate concentration (>1.0% w/w) through the formation of a gel network
that immobilizes the oil droplets (Dickinson, Ma, & Povey, 1994). In the concentrations used to
prepare the emulsions, AN50 and BN40M possessed higher viscosities than GA; AN6 possessed
a lower viscosity that GA. Turbiscan identified creaming in all of the emulsions, and the rates of
migration are partially related to the viscosity of the continuous phase, which was dictated by the
viscosity of the original dispersion. However, the viscosity of BN40M is about 8 times that of
AN50, and the rate of particle size change is similar or even less in AN50 stabilized emulsions.
The sedimentation observed the emulsion may be attributed to the settling of excess
emulsifier or micelles formed by excess emulsifier, assuming the critical micelle concentration
was reached. Sedimentation typically occurs when the density of the dispersed phase is greater
than the density of the continuous phase, causing a downward movement of particles (Friberg, et
al., 2004). The density of the oil phase (medium chain triglycerides with β-carotene) is less than
the density water, so the likelihood that the oil droplets are migrating towards the bottom of the
tube is low.
The particle size increase observed stemmed from either coalescence or flocculation.
Camino and others (2011) also observed particle size increase in the backscattering data gathered
from the Turbiscan (Camino, et al., 2011). The frequency of collisions of oil droplets affects the
rate at which particle size increase occurs and can be reduced by charge repulsion, steric

102
hindrance, and/or an increased viscosity effect (McClements, 1999). Gum acacia contains
charged and bulky regions that aide in the stabilization of the emulsion (Given, 2009). Although
the primary form of stabilization is attributed to steric forces, the charged droplets are believed to
provide an additional but minor stabilization by generating repulsive forces that prevent the oil
droplets from interacting with one another (Jayme, et al., 1999). HPMC, however, does not
contain any charged species. The viscosity of the HPMC solutions can be adjusted by
manipulating several parameters, including the substituent content. As the number of
hydrophilic substituents increases, the viscosity of the HPMC gel decreases (Bodvik, et al., 2010;
Thielking, et al., 2000). When the viscosity of the continuous phase increases, the frequency of
collisions will decrease, and the physical stability of the emulsion will be prolonged.
3.4. Light Microscopy
Images from light microscopy demonstrated the presence of uniform and small particle
sizes immediately after emulsion preparation in all samples except AN6. The AN6 stabilized
emulsions contained densely packed oil droplets with larger droplets embedded, indicating
instability immediately after homogenization, which worsened as time progressed. The
emulsions stabilized with GA displayed a greater degree of variability in particle sizes at 37˚C
than at 25˚C after storage for 12 days. At day 12, all of the emulsions except AN50 and BN40M
at 25˚C and BN40M at 37˚C demonstrated large differences in the distribution of sizes of oil
droplets. Coalescence (Fig. 6a-b) and/or Ostwald ripening (Fig. 5b) were evident in AN6 at
25˚C; flocculation and coalescence was observed the GA stabilized emulsions at 37˚C (Fig. 5c).
BN40M stabilized emulsions at 25˚C and 37˚C displayed minimal variation in droplet sizes after
12 days of storage

103
In the AN6 stabilized emulsions, the low M:HP ratio and viscosity likely contributes to
the poor emulsification properties and variable particle sizes. The comparison of the images of
the AN6 stabilized emulsion at day 12 (Fig. 6a-b) reinforce the notion that these emulsions retain
smaller and less variable particle sizes at 37˚C than at 25˚C. The image of BN40M immediately
after homogenization demonstrated slightly variable droplet sizes were present, which may be
related to the high viscosity of the emulsion. Unlike AN6, the variable droplet sizes do not
become noticeably larger with time. The images from light microscopy were in close agreement
with the particle size distributions (Fig. 6).
3.5. Rheological Measurements
Immediately after preparation, elastic (G’) behavior dominated all emulsions, except
those stabilized by BN40M. The emulsions containing BN40M exhibited both elastic and
inelastic behavior (Fig. 7). During the frequency sweep of the emulsion containing BN40M,
G”>G’, and the crossover is not observed within the frequency range used. The dominance of G’
and the high dependence of G’ on frequency in the emulsions containing AN6, AN50, and GA
indicate the involvement of an entanglement network in stabilizing the emulsion (Phillips, et al.,
2000). BN40M, however, displays the characteristics of a weak gel; for example, tan δ was
greater than 0.1 (Mandala, et al., 2004). Weak gels are not formed by permanent bonds, so the
interactions can be disrupted at high shear rates (Mandala, et al., 2004). In the plot of angular
frequency against G’, G”, and tan δ, both G’ and G” display a slight linear dependence on
frequency. In the emulsions containing BN40M, the G’ value experienced no significant
changes (P<0.05) after 12 days of storage at 25˚C; however, the emulsion stored at 37˚C
experienced an increase in G’ after the 12 day period (Fig. 8).

104
Rheological measurements can provide information regarding the viscoelastic behavior
of the droplets and the physical stability of the emulsion (Torres, Iturbe, Snowden, Chowdhry, &
Leharne, 2007). Viscoelastic materials possess a viscous component and a storage component.
The viscous component G” describes the dissipation of energy during deformation, while the
storage component G’ describes the energy that is stored during deformation. During a
frequency sweep, the parameters G’, G”, and tan δ are recorded as frequency changes throughout
a range at a controlled stress or strain (Tadros, 1994). In an emulsion, these parameters tell the
strength of association between nearby droplets. In other words, dynamic oscillatory
measurements can provide information about the strength of attractive forces between nearby
molecules as during flocculation (Tadros, 1994). Stable emulsions are dominated by elastic
behavior (G’>G”) and produce G’ and G” that are independent of frequency during a frequency
sweep. Under these conditions, the emulsion has formed an elastic gel network that promotes
kinetic stability (Torres, et al., 2007). The emulsions are not strong gels. However, the presence
of the weak gel network in BN40M aides in emulsion stability. High values of G’ indicate
strong attractive forces as in flocculation (Tadros, 2004). The higher value of G’ at 37˚C at day
12 indicates higher attractive forces between oil droplets. This may indicate the flocculation of
oil droplets in the emulsion or increased hydrophobic interactions between neighboring HPMC
molecules.
4. Conclusions
HPMC and GA emulsifiers provide physical stability to the emulsion using different
mechanisms. The data gathered from the study suggest that the HPMC emulsifiers AN50 and
BN40M provide greater protection against physical instabilities than GA and AN6. Structure-

105
function relationships appear to exert a large effect on the functionality and effectiveness of an
HPMC emulsifier. Therefore, kinetic stability in HPMC stabilized emulsions can be prolonged
by using HPMC with higher viscosities and methyl to hydroxypropyl ratios.

106
Table 1. Viscosities and Percent Substitution in Three HPMCs
HPMC Viscosity (Pa·S) Methyl (%) Hydroxypropyl (%) M:HP ratio
AN6 0.006 28.9 9.4 3.07
AN50 0.051 28.8 8.6 3.34
BN40M 0.401 28.5 6.4 4.45
All data were derived from a Certificate of Analysis provided by Samsung Fine Chemicals.
Table 2a. De Brouckere Mean Diameters of the Emulsions
D[4,3] µm
GA AN6 AN50 BN40M
Initial 0.79a,A
±0.03 1.96a,B
±0.62 1.38a,C
±0.10 1.83a,B
±0.12
Day 1 25˚C 1.19b,A
±0.19 3.33b,B
±0.42 1.36a,A
±0.18 1.76a,C
±0.12
37˚C 1.38c,A
±0.08 2.92c,B
±0.03 1.32a,A
±0.05 1.79a,C
±0.10
Day 12 25˚C 1.55d,A
±0.10 4.64d,B
±0.14 1.39a,A
±0.26 1.85a,C
±0.17
37˚C 1.72e,A
±0.06 2.93e,B
±1.17 1.39a,C
±0.11 1.87a,D
±0.17
Table 2b. Sauter Mean Diameters of the Emulsion
D[3,2] µm
GA AN6 AN50 BN40M
Initial 0.77a,A
±0.04 1.09a,B
±0.07 1.05a,C
±0.04 1.35a,D
±0.09
Day 1 25˚C 1.05b,A
±0.16 1.61b,B
±0.27 1.05a,A
±0.07 1.38a,C
±0.10
37˚C 1.12c,A
±0.11 1.65b,B
±0.48 1.05a,A
±0.05 1.37a,B
±0.11
Day 12 25˚C 1.20d,A
±0.12 2.38b,B
±0.29 1.05a,C
±0.10 1.43a,D
±0.01
37˚C 1.29e,A
±0.04 1.99c,B
±0.63 1.05a,C
±0.06 1.33a,A
±0.12
Tables 2a. and 2b. display the particle sizes immediately after homogenization (initial), after 1
day, and after 12 days of storage. The superscripts a-e denote significant differences in mean
diameters between days and storage temperatures (P<0.05), while the superscripts A-D represent
significant differences between gums.

107
Table 3. Mean Rate of Change in Particle Size per day for Each Emulsion
Emulsifier
25°C GA 0.054±0.011 0.027±0.007
AN6 0.173±0.052 0.076±0.017
AN50 0.006±0.005 0.003±0.001
BN40M 0.009±0.004 0.000±0.003
37°C GA 0.053±0.012 0.27±0.008
AN6 0.054±0.020 0.062±0.017
AN50 0.010±0.006 0.001±0.001
BN40M 0.011±0.005 0.001±0.003
D[3,2]
D[4,3]

108
0
1
2
3
4
5
6
7
0 2 4 6 8 10 12
D[4
,3] µm
Day
GA
AN6
AN50
BN40M
(A)
0
1
2
3
4
5
6
7
0 2 4 6 8 10 12
D[3
,2]
µm
Day
GA
AN6
AN50
BN40M
(B)

109
Fig. 1. Plots of the particle size (µm) of the emulsions against day (a) day versus D[4,3] µm at 25˚C (b)
day versus D[3,2] µm at 25˚C (c) day versus D[4,3] µm at 37˚C (d) day versus D[3,2] µm at 37˚C
0
1
2
3
4
5
6
7
0 2 4 6 8 10 12
D[4
,3] µm
Day
GA
AN6
AN50
BN40M
(C)
0
1
2
3
4
5
6
7
0 2 4 6 8 10 12
D[3
,2]
µm
Day
GA
AN6
AN50
BN40M
(D)

110
Fig. 2a-c. The illustrations demonstrate changes in the particle size distribution of AN50 at 25˚C over 12
days.
0
2
4
6
8
10
12
14
0.1 1 10
Volu
me
(%)
Droplet Diameter (µm)
Initial
Day 1
Day 2
(A)
0
2
4
6
8
10
12
14
0.1 1 10
Vo
lum
e (%
)
Droplet Diameter (µm)
Day 3
Day 4
Day 5
Day 6
Day 7
Day 7
Day 8
(B)
0
2
4
6
8
10
12
14
0.1 1 10
Volu
me
(%)
Droplet Diameter (µm)
Day 9
Day 10
Day 11
Day 12
(C)

111
0
2
4
6
8
10
12
14
16
18
0.1 1 10 100
Vo
lum
e (%
)
Droplet Diameter (µm)
(A)
Day 0
Day 12, 25˚C
Day 12, 37˚C
0
2
4
6
8
10
12
14
16
18
0.1 1 10 100
Vo
lum
e (%
)
Droplet Diameter (µm)
(B)
Day 0
Day 12, 25˚C
Day 12, 37˚C

112
Fig. 3a-d. are representative illustrations to display the change in the particle size distributions
and their changes over 12 days in each emulsion stored at 25˚C and 37˚C. (a) GA stabilized
emulsion (b) AN6 stabilized emulsion (c) AN50 stabilized emulsion.
0
2
4
6
8
10
12
14
16
18
0.1 1 10 100
Vo
lum
e (%
)
Droplet Diameter (µm)
(C)
Day 0
Day 12, 25˚C
Day 12, 37˚C
0
2
4
6
8
10
12
14
16
18
0.1 1 10 100
Vo
lum
e (%
)
Droplet Diameter (µm)
(D)
Day 0
Day 12, 25˚C
Day 12, 37˚C

113
Fig. 4. mm of emulsion versus (%) Backscattering in the Turbiscan plot of BN40M at 37˚C over
12 days
Fig. 5a-c. Images of the emulsions from light microscopy after 12 days of storage (a) Image of
the emulsion stabilized with AN50 at 37˚C that demonstrate encapsulation (b) Ostwald ripening
in the emulsion stabilized with AN6 (c) Flocculation in the emulsion stabilized with GA stored at
37˚C. (scale bar=1µm)
-30
-20
-10
0
10
20
30
0 10 20 30 40 50
Ba
cksc
att
erin
g (
%)
mm
middle bottom top
(A) (C) (B)

114
Fig. 6. Light microscopy images of the emulsions at day 12. The variable particle sizes reflect coalescence. scale bar = 5 µm

115
Fig. 7. Variation in the dynamic moduli with angular frequency (rad/s) in a 2% w/w BN40M
stabilized emulsion stored at 25˚C; G’(filled), G”(empty), tan δ (gray).
0.01
0.1
1
10
100
0.01 0.1 1 10
G'G
" (
Pa
) ta
n δ
Angular Frequency (rad/s)
G'
G"
tan δ

116
Fig. 8. Angular Frequency (rad/s) versus G’ (filled) immediately after homogenization and at
day 12 in the BN40M emulsions stored at 25˚C and 37˚C in BN40M. The G’ values at 25˚C
after day 0 and 12 were not significantly different, while at 37˚C the values were significantly
different.
0.01
0.1
1
10
100
0.01 0.1 1 10
G'
(Pa
)
Angular Frequency (rad/s)
Day 0
Day 12, 25˚C
Day 12, 37˚C

117
REFERENCES (CHAPTER 3)
Arboleya, J.-C., & Wilde, P. J. (2005). Competitive adsorption of proteins with methylcellulose
and hydroxypropyl methylcellulose. Food Hydrocolloids, 19(3), 485-491.
Barbosa-Cánovas, G. V., Mortimer, A., Lineback, D., Spiess, W., Buckle, K., & Colonna, P.
(2009). Global Issues in Food Science and Technology: Academic.
Bodvik, R., Dedinaite, A., Karlson, L., Bergström, M., Bäverbäck, P., Pedersen, J. S., Edwards,
K., Karlsson, G., Varga, I., & Claesson, P. M. (2010). Aggregation and network
formation of aqueous methylcellulose and hydroxypropylmethylcellulose solutions.
Colloids and Surfaces A: Physicochemical and Engineering Aspects, 354(1-3), 162-171.
Camino, N. A., Sánchez, C. C., Rodríguez Patino, J. M., & Pilosof, A. M. R. (2011).
Hydroxypropylmethylcellulose at the oil-water interface. Part I. Bulk behaviour and
dynamic adsorption as affected by pH. Food Hydrocolloids, 25(1), 1-11.
Dickinson, E. (2003). Hydrocolloids at interfaces and the influence on the properties of dispersed
systems. Food Hydrocolloids, 17(1), 25-39.
Dickinson, E. (2008). Interfacial structure and stability of food emulsions as affected by protein-
polysaccharide interactions. Soft Matter, 4(5), 932-942.
Dickinson, E. (2009). Hydrocolloids as emulsifiers and emulsion stabilizers. Food
Hydrocolloids, 23(6), 1473-1482.
Dickinson, E., Ma, J., & Povey, M. J. W. (1994). Creaming of concentrated oil-in-water
emulsions containing xanthan. Food Hydrocolloids, 8(5), 481-497.
Friberg, S., Larsson, K., & Sjöblom, J. (2004). Food emulsions: Marcel Dekker.

118
Futamura, T., & Kawaguchi, M. (2012). Characterization of paraffin oil emulsions stabilized by
hydroxypropyl methylcellulose. Journal of Colloid and Interface Science, 367(1), 55-60.
Gaonkar, A. (1991). Surface and interfacial activities and emulsion characteristics of some food
hydrocolloids. Food Hydrocolloids, 5, 329-337.
Given, P. S. (2009). Encapsulation of Flavors in Emulsions for Beverages. Current Opinion in
Colloid & Interface Science, 14(1), 43-47.
Hui, Y. H. (2006). Handbook of Food Science, Technology, and Engineering: Taylor & Francis.
Iglewicz, B., & Hoaglin, D. C. (1993). How to detect and handle outliers: ASQC Quality Press.
Jayme, M. L., Dunstan, D. E., & Gee, M. L. (1999). Zeta potentials of gum arabic stabilised oil
in water emulsions. Food Hydrocolloids, 13(6), 459-465.
Lazǎu, I., Pǎcurariu, C., & Ciobanu, C. The use of thermal analysis to investigate the effects of
cellulose ethers on the Portland cement hydration. Journal of Thermal Analysis and
Calorimetry, 1-8.
Mandala, I. G., Savvas, T. P., & Kostaropoulos, A. E. (2004). Xanthan and locust bean gum
influence on the rheology and structure of a white model-sauce. Journal of Food
Engineering, 64(3), 335-342.
McClements, D. (1999). Food emulsions: principles, practice, and techniques: CRC Press.
Phillips, G. O., & Williams, P. A. (2000). Handbook of Hydrocolloids: CRC Press.
Robins, M. M., & Wilde, P. J. (2003). COLLOIDS AND EMULSIONS. In C. Editor-in-
Chief: Benjamin (Ed.), Encyclopedia of Food Sciences and Nutrition (Second Edition)
(pp. 1517-1524). Oxford: Academic Press.

119
Sarkar, N. (1995). Kinetics of thermal gelation of methylcellulose and
hydroxypropylmethylcellulose in aqueous solutions. Carbohydrate polymers, 26(3), 195-
203.
Sjöblom, J. (2006). Emulsions And Emulsion Stability: Taylor & Francis.
Tadros, T. (1994). Fundamental principles of emulsion rheology and their applications. Colloids
and Surfaces A: Physicochemical and Engineering Aspects, 91(0), 39-55.
Tadros, T. (2004). Application of rheology for assessment and prediction of the long-term
physical stability of emulsions. Advances in Colloid and Interface Science, 108–109(0),
227-258.
Thielking, H., & Schmidt, M. (2000). Cellulose Ethers. In Ullmann's Encyclopedia of Industrial
Chemistry: Wiley-VCH Verlag GmbH & Co. KGaA.
Torres, L. G., Iturbe, R., Snowden, M. J., Chowdhry, B. Z., & Leharne, S. A. (2007). Preparation
of o/w emulsions stabilized by solid particles and their characterization by oscillatory
rheology. Colloids and Surfaces A: Physicochemical and Engineering Aspects, 302(1–3),
439-448.
Wollenweber, C., Makievski, A. V., Miller, R., & Daniels, R. (2000). Adsorption of
hydroxypropyl methylcellulose at the liquid/liquid interface and the effect on emulsion
stability. Colloids and Surfaces A: Physicochemical and Engineering Aspects, 172(1-3),
91-101.
Yin, L.-J., Chu, B.-S., Kobayashi, I., & Nakajima, M. (2009). Performance of selected
emulsifiers and their combinations in the preparation of β-carotene nanodispersions.
Food Hydrocolloids, 23(6), 1617-1622.

120
Yonekura, K., Hayakawa, K., Kawaguchi, M., & Kato, T. (1998). Preparation of Stable Silicone
Oil Emulsions in the Presence of Hydroxypropyl Methyl Cellulose. Langmuir, 14(12),
3145-3148.
Yuan, Y., Gao, Y., Zhao, J., & Mao, L. (2008). Characterization and stability evaluation of β-
carotene nanoemulsions prepared by high pressure homogenization under various
emulsifying conditions. Food Research International, 41(1), 61-68.
Zhao, Q., Zhao, M., Li, J., Yang, B., Su, G., Cui, C., & Jiang, Y. (2009). Effect of hydroxypropyl
methylcellulose on the textural and whipping properties of whipped cream. Food
Hydrocolloids, 23(8), 2168-2173.

121
1Akinosho, H. and L. Wicker. To be submitted to Food Hydrocolloids.
CHAPTER 4
THE CHEMICAL STABILITY OF AN HYDROXYPROPYL METHYLCELLULOSE
STABILIZED EMULSION1

122
Abstract
The chemical stability of four oil-in-water emulsions, prepared using high-pressure
homogenization, were analyzed to understand the properties of an emulsifier in the loss of the
concentration of β-carotene and the changes in the tristimulus coordinates in a beverage
emulsion with temperature (25˚C and 37˚C) and time (12 days). Three hydroxypropyl
methylcellulose (HPMC) at 2% w/w and one gum acacia (GA) at 21.25% w/w were the
emulsifiers used. UV-Vis measurements confirmed that the GA stabilized emulsions retained
the highest concentration of β-carotene, preserving 2.80% and 4.90% of its original value over
12 days at 25˚C and 37˚C, respectively. GA was most effective at retaining emulsion tristimulus
coordinates and hue angles. Increased particle sizes were associated with larger L* values.
Keywords: Methyl to hydroxypropyl ratio; Emulsion; Lipid oxidation; Hydroxypropyl
methylcellulose; β-carotene
1. Introduction
Emulsions are composed of a continuous phase, a dispersed phase, and an emulsifier such
as gum acacia or modified starch (McClements, 1999). Beverage emulsions, specifically, are
most notably used as vehicles for nonpolar flavors such as terpenes and orange oil (Given, 2009;
Taherian, Fustier, & Ramaswamy, 2006; Yadav, Johnston, Hotchkiss Jr, & Hicks, 2007) or are
used to maintain cloudiness of a beverage (Harnsilawat, Pongsawatmanit, & McClements, 2006;
Mirhosseini, Tan, Aghlara, et al., 2008; Mirhosseini, Tan, Hamid, & Yusof, 2008). Recently,
research has spurred in the use of emulsions as protective vehicles for compounds, such as β-
carotene (Qian, et al., 2012; H. Silva, et al., 2011; Tan, et al., 2005; Yin, et al., 2009). β-carotene

123
is a lipophilic and conjugated compound that produces yellow, orange, and red colors in plants
and bacteria; the conjugated structure may provide health benefits that lead to its classification as
a bioactive compound (Diplock, 1995; Mayne, 1996). The incorporation of β-carotene in
beverage emulsions may aide in color production and the promotion of human health.
An emulsion colored with beta-carotene is a complex system that is sensitive to many
environmental factors that affect the stability of the color and nutrient content with time (Qian, et
al., 2012). Emulsions containing β-carotene or any other oxidation sensitive compound will
suffer from both chemical and physical instabilities. Chemical instability describes the
resistance of an emulsion to chemical changes, while physical instability refers to the ability of
an emulsion to resist changes in the oil droplets (Barbosa-Cánovas, et al., 2009; Wermuth,
2008). Promoting the chemical stability of β-carotene in an emulsion is often not trivial. The
oxidative stability of β-carotene in nanodispersions prepared using an emulsification-evaporation
technique was poor and decreased as the particle sizes of the nanodispersion increased. Only 25-
44% and 32-56% of the original β-carotene from the 1:9 and 1:4 dilutions of nanodispersions
remained after 12 weeks of storage (Tan, et al., 2005). In multilayer emulsions containing
chitosan and soybean soluble polysaccharides, β-carotene degradation was least in the emulsion
that contained 0.5% w/w of chitosan; the findings suggested that multilayer emulsions are more
effective in protecting β-carotene than single-layer emulsions (Hou, et al., 2010). In oil-in-water
emulsions stabilized with either whey protein isolate or sodium caseinate, the concentration of
emulsifier played an important role in stabilizing β-carotene. In a range of 0.1% to 2.0%
emulsifier, β-carotene was most stable at protein concentrations ≥0.08% w/w (Cornacchia, et al.,
2011).

124
Accordingly, the physical and chemical stability weigh heavily on the formation of a
color-stable beverage emulsion. Factors such as droplet diameter, surface area of the oil droplet,
and surface charge affect the chemical stability of the emulsion (McClements, et al., 2000).
Limited research has been conducted on the performance of a glycoprotein emulsifier against a
polysaccharide emulsifier in stabilizing an emulsion that can suffer from chemical stability. This
investigation will examine the relationship between the properties of the emulsion, emulsifier
structure, and chemical stability in the maintenance of chemical stability in a gum acacia (GA)
and a hydroxypropyl methylcellulose (HPMC) stabilized emulsion.
2. Materials and Methods
The materials were adapted from Chapter 3 on page 89.
2.1. Emulsifier Preparation and Emulsion Preparation
The emulsifier and emulsion preparation were adapted from Chapter 3 on page 89.
2.2. Instrumental Analysis
2.2.1. Oxidation
The procedure for assessing oxidation in β-carotene was adapted from Yuan and others (2008).
All test tubes were chilled on ice prior to testing. β-carotene was extracted from the emulsion by
solubilizing the dispersion with ethanol and subsequently adding hexane to transfer the beta-
carotene from the ethanol phase into hexane phase. One milliliter of sample was added to a test
tube. Three milliliters of hexane and two milliliters of ethanol were added to the test tube and
vortexed. The hexane phase was removed and placed into a separate test tube. The ethanol-
hexane extraction was repeated two additional times to extract the remaining beta carotene from

125
the emulsion. A standard curve was produced by the same method described above. The
procedure was modified by varying concentrations of beta-carotene dilute to one milliliter with
medium chain triglycerides (MCT) in the test tube. All samples were shielded from light and
oxygen and were kept on ice during the extraction to minimize the effects of variables that
promote oxidation. The UV-Vis Spectrophotometer (Spectronic20D+, Thermo Scientific, West
Palm Beach, FL) was set to a wavelength of 450 nm, and hexane containing MCT was the blank.
After the appropriate dilutions had been made, three milliliters of samples were pipetted into a
quartz cuvette, and the absorbances of samples were measured.
2.2.2. Tristimulus Coordinates
The tristimulus coordinates L*a*b* were obtained at an illuminant light source of D65 and an
observer angle of 10˚ (Hunter Miniscan XE Plus, HunterLab, Reston, VA, USA). The
colorimeter was calibrated using a black tile standard and a white tile standard (X=78.6, Y=83.4,
Z=87.9) prior to each measurement. The emulsions were poured into separate sample cups, and
the color parameters were measured daily. Hue angle and chroma were calculated according to
equations 1 and 2, respectively (Chantrapornchai, et al., 2008; Figura, et al., 2007).
(1)
(2)
126
2.3. Experimental Design and Statistical Analysis.
2.3. Statistical Analysis.
The methods for statistical analysis were adapted from Chapter 3 page .
3. Results and Discussion
3.1. Tristimulus Coordinates
Hue angle describes the color on a vector plane, ranging between 0 and 2π rad (Chantrapornchai,
et al., 1998). The differences in hue angles produced immediately following the preparation of
the emulsions were not statistically significant between different emulsifiers (P<0.05). After 12
days of storage, the hue angles from the emulsions stabilized with GA were different from those
stabilized with HPMC at 25˚C and 37˚C (P<0.05). The hue angle of the GA stabilized emulsion
slightly increased during the experiment, while the hue angles of the HPMC stabilized emulsions
experienced sharp declines at day 10 at 25˚C (Fig. 1a). In the emulsions stored at 37˚C, the hue
angle of the AN50 stabilized emulsion decreased at day 6, while the emulsions containing AN6
and BN40M experienced decline at day 7 (Fig. 1b). At day 12, the hue angles of HPMC
stabilized emulsions were not significantly different from one another (P<0.05) and were less
than the hue angle produced by GA (P<0.05) at both temperatures. The hue angle from the GA
emulsion at day 12 at 37˚C was not significantly different from the hue angle produced at 25˚C
(P<0.05). Higher temperatures appear to be associated with an earlier onset of decline in the hue
angle in the HPMC emulsions (Fig. 1b).
Hues ranging between the red to yellow axes are characterized by hue angles between 0
and π/2 rad; all of the hue angles in the experiment fell within this range. The hue angles of the

127
emulsions were closer to the yellow axis (π/2 rad) than the red axis (0 rad). The hue angles
reveal that GA performs better than HPMC in retaining the a* and b* values, which are
dependent on the concentration and type of dye. Furthermore, visual observations indicated that
the GA stabilized emulsions retained the color of the emulsion better than the HPMC stabilized
emulsion during 12 days of storage at either temperature. In the HPMC stabilized emulsions
stored at 25˚C, the onset of decline in hue angle and the final hue angle are independent of the
HPMC used. This observation suggests that the M:HP, particle size, and/or viscosity play a
minor role in protecting against changes in the hue angle, while the type of emulsifier greater
indicator of chemical stability. The results demonstrate that the glycoprotein emulsifier performs
better than the polysaccharide emulsifiers in stabilizing the color of an orange-colored beverage
emulsion. The β-carotene concentration plays a major role in the color of the emulsion. The
decline in hue angles in the three HPMC suggests poorer abilities to retain the initial
concentration of β-carotene when compared to GA.
All of the emulsions experienced steady increases in L* (Fig. 2a-b) and decreases in a*
and b* during storage. Immediately after preparation, the L* values from each of the emulsions
were significantly different from one another at (P<0.05). The emulsion stabilized with GA
produced the lowest L*, while the emulsion containing AN6 produce the highest L*. Likewise,
the emulsion containing GA produced the smallest D[4,3] values, and the emulsion containing
AN6 produced the largest D[4,3] values (Table 1a-b). The D[4,3] values estimate the volume
mean diameter, which is sensitive to the presence of large particle diameters. Because the
emulsions containing AN6 or GA at 25˚C and 37˚C were the only emulsions to experience
significant particle size changes immediately after homogenization and at day 12 (P<0.05), the

128
L* values were plotted against mean particle size to establish a linear relationship between the
lightness of an emulsion and the particle size. The plots of the emulsions containing AN6 at
25˚C, AN6 at 37˚C, GA at 25˚C, and GA at 37˚C produced r2 values of 0.65, 0.57, 0.74, and
0.33, respectively (Fig. 3a-b). Generally, the plots demonstrated a linear association between L*
and D[4,3] values, suggesting that larger diameters influence the lightness and/or cloudiness of
an emulsion. A similar association was observed in an emulsion containing n-hexadecane and
SDS (Chanamai & McClements, 2001)
3.2. Oxidation
The linear decline in the concentration of β-carotene with time (Fig. 4a-b) was in
accordance with other studies using similar solvent extraction methods to assess oxidation (H.
Silva, et al., 2011; Yuan, et al., 2008) and HPLC with a UV-Vis detector (Tan, et al., 2005; Yin,
et al., 2009). The linear decline appears to be independent of droplet diameters and surface area
exposed (data not shown). Nakaya and others (2005) monitored the effect of droplet size on
lipid oxidation. The droplet sizes were approximately 0.8, 3.28, and 10 µm; the study
demonstrated that the droplets with a mean diameter of 0.8 µm had higher resistance to oxidation
than the larger droplet sizes (Nakaya, et al., 2005). Homogenization did not produce significant
variation in the β-carotene contents (mg) at P<0.05. After 12 days of storage however, all of the
emulsions displayed significantly different β-carotene contents, when comparing the data
obtained at immediately after homogenization and at day 12. Each emulsion possessed <0.30 mg
of β-carotene per g of MCT.
Oxidation measurements demonstrated that the concentration of β-carotene declines
during the 12 day period, regardless of the emulsifier used. The percent retention of β-carotene

129
in each emulsion was <20% following homogenization. However, all of emulsions retained
<5.0% of the original β-carotene (8 mg/g of MCT) after 12 days of storage at either temperature
(Fig. 5). The GA stabilized emulsion retained the greatest concentration of β-carotene at 25˚C
and 37˚C on the last day of storage (4.90% and 2.90%, respectively). At 37˚C, the BN40M
stabilized emulsions did not demonstrate any significant differences from GA; both emulsions
were significantly different from the AN6 and AN50 stabilized emulsions. The emulsions
containing AN6, AN50, and GA retained more β-carotene at 25˚C (P<0.05), while the β-carotene
contents of the emulsion containing BN40M were unaffected by elevated temperatures (P<0.05).
GA appears to produce emulsions that are more resistant to oxidation than HPMC. HPMC still
appears to exert weaker protective effect. The larger proportion of hydroxypropyl groups in
these HPMC may prevent the close interactions of prooxidants and oxygen molecules in the
continuous phase with the oil droplet surface. Small particle sizes have been found to limit the
extent of oxidation of unsaturated oil phases (Nakaya, et al., 2005); however in this study, the
oxidation rate was not linearly associated with particle size. The large losses in the β-carotene
concentration in the AN6 and AN50 stabilized emulsions may be partially due to the low
viscosity of the emulsions, which promote an increased rate of diffusion of oxygen molecules in
the continuous phase. The viscosity of the hydrocolloid solutions affects the rate of diffusion of
oxygen in the aqueous phase of the emulsion (McClements & Decker, 2000). The results in this
experiment suggest that the rate of diffusion of oxygen in the continuous phase may be an
important factor in slowing oxidation in the HPMC stabilized emulsions.
The GA stabilized emulsion most likely lacks a significant viscosity effect in slowing
oxidation but may possess antioxidant potential, which may help to explain the final levels of β-

130
carotene. The protein moiety on GA may scavenge free radicals, thereby reducing the rate of
oxidation. Furthermore, the steric effects believed to be important in emulsion stability may also
play a role in the chemical stability of the emulsion. Steric effects may prevent the interactions
of free radical and prooxidants such as metals with the interior components of the emulsion
(McClements & Decker, 2000). Matsumura and others (2000) also prepared lipid oxidation
sensitive emulsions using two polysaccharide emulsifiers (pullulan and malodextrin) and one
glycoprotein emulsifier (gum acacia) (Matsumura, Satake, Egami, & Mori, 2000). The
emulsions prepared with gum acacia were more resistant to oxidation, possibly due to
antioxidant activity in its peptide moieties and the adsorption of gum acacia to the oil droplet
surface (Matsumura, et al., 2000). Research comparing the effectiveness of glycoprotein and
polysaccharide emulsifiers in the suppression of lipid oxidation found that emulsions stabilized
with soybean soluble polysaccharide (SSPS) suppressed lipid oxidation in emulsions better than
GA. Analysis of the protein contents of both glycoproteins demonstrated than SSPS (4.90%)
contained a higher protein content than GA (1.7%) and a different amino acid profile
(Matsumura, et al., 2003). Protein abundance and composition affect the progression of lipid
oxidation. Polysaccharides, maltodextrin and pullulan have demonstrated to inhibitory effects in
lipid oxidation (Matsumura, et al., 2003).
In the plots of chroma, or color intensity, against β-carotene concentration, a linear
relationship was apparent in the emulsions stabilized with HPMC (Fig. 6a-b.). The r2 values at
25˚C were 0.60, 0.75, and 0.59 for AN6, AN50, and BN40M, respectively. At 37˚C, the r2
values were: 0.85, 0.52, and 0.74, respectively. The r2 values in the GA stabilized emulsion were
0.02 and 0.69 at 25˚C and 37˚C, respectively. The concentration of β-carotene affects the

131
chroma of the emulsion. The results of this experiment support the relationship between chroma
and the dye concentration, demonstrating that as the concentration of β-carotene decreases as a
result of lipid oxidation, the intensity of the color product decreases as well.
4. Conclusion
The GA stabilized emulsions appear to exert a more protective effect on the hue angle
and concentration of β-carotene in an emulsion. The findings suggest that the presence of a
protein component may promote chemical stability against lipid oxidation and color variation.
Furthermore, properties such as lightness associated with physical stability are linearly
associated with chemical stability. When stabilizing a oxidation sensitive emulsion, the presence
of a amino acids with antioxidant activity is important to stabilizing color. To be able to select
the appropriate emulsifier in a food application, future studies must examine methods and
conditions that will promote higher initial levels of β-carotene immediately after processing in all
of the emulsions. The selection of a different homogenization system that involves less rigorous
processing may be one direction. Other studies can pinpoint the exact mechanisms that promote
or retard oxidation in the emulsion as the exact mechanisms are not fully understood. The
information from these studies will provide insight into why GA was more effective at retaining
the hue angle than HPMC.

132
Fig. 1a-b illustrates the plot of hue angle against time in the emulsions stored at (a) 25˚C and (b)
37˚C.
-2
-1.5
-1
-0.5
0
0.5
1
1.5
2
0 2 4 6 8 10 12
Hu
e A
ng
le
Day
AN6
AN50
BN40M
GA
(A)
-2
-1.5
-1
-0.5
0
0.5
1
1.5
2
0 2 4 6 8 10 12
Hu
e A
ng
le
Day
AN6
AN50
BN40M
GA
(B)
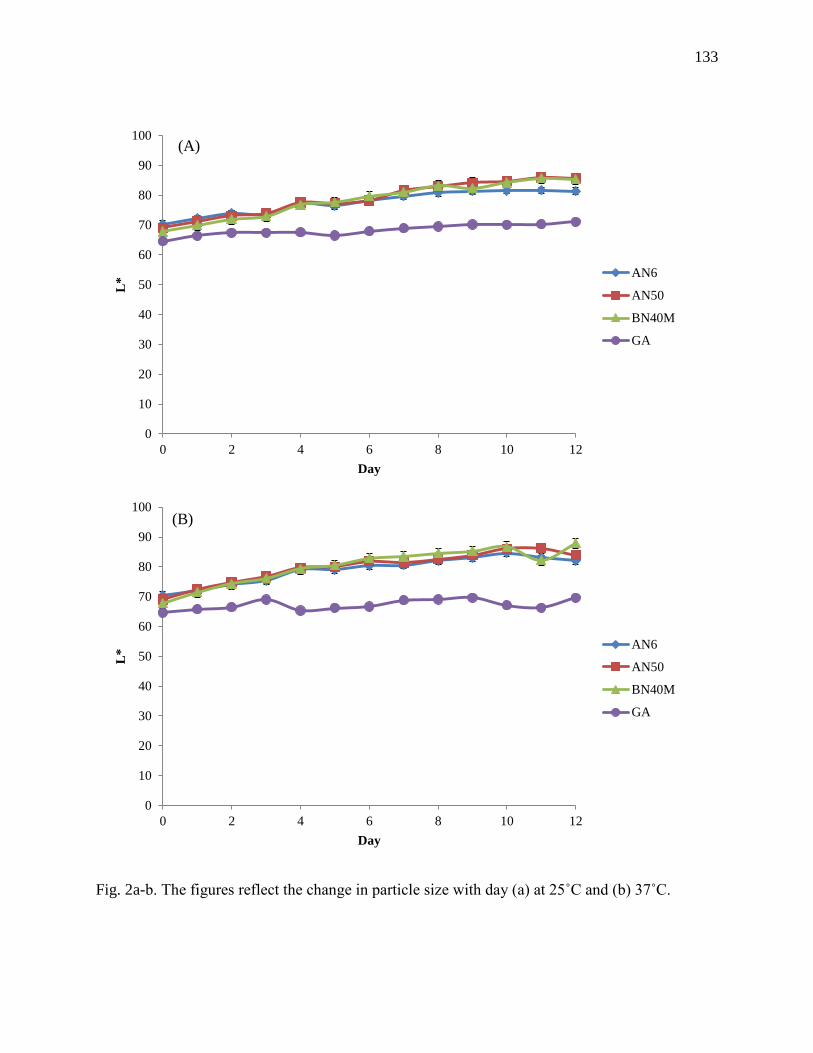
133
Fig. 2a-b. The figures reflect the change in particle size with day (a) at 25˚C and (b) 37˚C.
0
10
20
30
40
50
60
70
80
90
100
0 2 4 6 8 10 12
L*
Day
AN6
AN50
BN40M
GA
(A)
0
10
20
30
40
50
60
70
80
90
100
0 2 4 6 8 10 12
L*
Day
AN6
AN50
BN40M
GA
(B)

134
Fig. 3a-b. The figures demonstrate the linear association between particle diameter L* and
D[4,3] in AN6 and GA at (a) 25˚C and (b) 37˚C.
0
1
2
3
4
5
6
7
60 65 70 75 80 85 90
D[4
,3]
µm
L*
AN6
GA
(A)
0
1
2
3
4
5
6
7
60 65 70 75 80 85 90
D[4
,3]
µm
L*
AN6
GA
(B)

135
Fig. 4a-b displays the linear decline in mg of β-carotene with time at (a) 25˚C and (b) 37˚C in the
four emulsions
0
0.2
0.4
0.6
0.8
1
1.2
1.4
1.6
1.8
2
0 2 4 6 8 10 12
mg
of β
-ca
rote
ne
Day
AN6
AN50
BN40M
GA
(B)
0
0.2
0.4
0.6
0.8
1
1.2
1.4
1.6
1.8
2
0 2 4 6 8 10 12 14
mg
of β
-ca
rote
ne
Day
AN6
AN50
BN40M
GA
(A)

136
Fig. 5 displays the percentage of β-carotene retained after homogenization, at 25˚C and 37˚C
after 12 days of storage. The initial concentration of β-carotene was 8 mg per g of MCT.
0
5
10
15
20
25
AN6 AN50 BN40M GA
Per
cen
t R
eten
tio
n o
f β
-ca
rote
ne
Initial
25˚C, Day 12
37˚C, Day 12

137
Fig.6. Representative plots of chroma vs. mg of β-carotene, demonstrating the linear dependence
of chroma on dye concentration.
0
0.2
0.4
0.6
0.8
1
1.2
1.4
1.6
1.8
40 50 60 70 80 90 100
mg
of β
-ca
rote
ne
Chroma
AN6
(A)
0
0.2
0.4
0.6
0.8
1
1.2
1.4
1.6
1.8
40 50 60 70 80 90 100
mg
of β
-ca
rote
ne
Chroma
AN6
(B)

138
REFERENCES (CHAPTER 4)
Barbosa-Cánovas, G. V., Mortimer, A., Lineback, D., Spiess, W., Buckle, K., & Colonna, P.
(2009). Global Issues in Food Science and Technology: Academic.
Chanamai, R., & McClements, D. J. (2001). Prediction of emulsion color from droplet
characteristics: dilute monodisperse oil-in-water emulsions. Food Hydrocolloids, 15(1),
83-91.
Chantrapornchai, W., Clydesdale, F., & McClements, D. J. (1998). Influence of Droplet Size and
Concentration on the Color of Oil-in-Water Emulsions. Journal of Agricultural and Food
Chemistry, 46(8), 2914-2920.
Chantrapornchai, W., Fergus, C., & McClements, D. J. (2008). Understanding Colors in
Emulsions. In Color Quality of Fresh and Processed Foods (Vol. 983, pp. 364-387):
American Chemical Society.
Cornacchia, L., & Roos, Y. H. (2011). Stability of β-Carotene in Protein-Stabilized Oil-in-Water
Delivery Systems. Journal of Agricultural and Food Chemistry, 59(13), 7013-7020.
Diplock, A. (1995). Safety of antioxidant vitamins and beta-carotene. The American Journal of
Clinical Nutrition, 62(6), 1510S-1516S.
Figura, L. O., & Teixeira, A. A. (2007). Food physics: physical properties - measurement and
application: Springer.
Given, P. S. (2009). Encapsulation of Flavors in Emulsions for Beverages. Current Opinion in
Colloid & Interface Science, 14(1), 43-47.

139
Harnsilawat, T., Pongsawatmanit, R., & McClements, D. J. (2006). Stabilization of Model
Beverage Cloud Emulsions Using Protein−Polysaccharide Electrostatic Complexes
Formed at the Oil−Water Interface. Journal of Agricultural and Food Chemistry, 54(15),
5540-5547.
Hou, Z., Gao, Y., Yuan, F., Liu, Y., Li, C., & Xu, D. (2010). Investigation into the
Physicochemical Stability and Rheological Properties of β-Carotene Emulsion Stabilized
by Soybean Soluble Polysaccharides and Chitosan. Journal of Agricultural and Food
Chemistry, 58(15), 8604-8611.
Matsumura, Y., Egami, M., Satake, C., Maeda, Y., Takahashi, T., Nakamura, A., & Mori, T.
(2003). Inhibitory effects of peptide-bound polysaccharides on lipid oxidation in
emulsions. Food Chemistry, 83(1), 107-119.
Matsumura, Y., Satake, C., Egami, M., & Mori, T. (2000). Interaction of Gum Arabic,
Maltodextrin and Pullulan with Lipids in Emulsions. Bioscience, Biotechnology, and
Biochemistry, 64(9), 1827-1835.
Mayne, S. (1996). Beta-carotene, carotenoids, and disease prevention in humans. The FASEB
Journal, 10(7), 690-701.
McClements, D. (1999). Food emulsions: principles, practice, and techniques: CRC Press.
McClements, D., & Decker, E. A. (2000). Lipid Oxidation in Oil-in-Water Emulsions: Impact of
Molecular Environment on Chemical Reactions in Heterogeneous Food Systems. Journal
of Food Science, 65(8), 1270-1282.
Mirhosseini, H., Tan, C. P., Aghlara, A., Hamid, N. S. A., Yusof, S., & Chern, B. H. (2008).
Influence of pectin and CMC on physical stability, turbidity loss rate, cloudiness and

140
flavor release of orange beverage emulsion during storage. Carbohydrate polymers,
73(1), 83-91.
Mirhosseini, H., Tan, C. P., Hamid, N. S. A., & Yusof, S. (2008). Optimization of the contents of
Arabic gum, xanthan gum and orange oil affecting turbidity, average particle size,
polydispersity index and density in orange beverage emulsion. Food Hydrocolloids,
22(7), 1212-1223.
Nakaya, K., Ushio, H., Matsukawa, S., Shimizu, M., & Ohshima, T. (2005). Effects of droplet
size on the oxidative stability of oil-in-water emulsions. Lipids, 40(5), 501-507.
Qian, C., Decker, E. A., Xiao, H., & McClements, D. J. (2012). Physical and chemical stability
of β-carotene-enriched nanoemulsions: Influence of pH, ionic strength, temperature, and
emulsifier type. Food Chemistry, 132(3), 1221-1229.
Silva, H., Cerqueira, M. A., Souza, B. W. S., Ribeiro, C., Avides, M. C., Quintas, M. A. C.,
Coimbra, J. S. R., Carneiro-da-Cunha, M. G., & Vicente, A. A. (2011). Nanoemulsions of
β-carotene using a high-energy emulsification–evaporation technique. Journal of Food
Engineering, 102(2), 130-135.
Taherian, A. R., Fustier, P., & Ramaswamy, H. S. (2006). Effect of added oil and modified
starch on rheological properties, droplet size distribution, opacity and stability of
beverage cloud emulsions. Journal of Food Engineering, 77(3), 687-696.
Tan, C. P., & Nakajima, M. (2005). β-Carotene nanodispersions: preparation, characterization
and stability evaluation. Food Chemistry, 92(4), 661-671.
Wermuth, C. G. (2008). The practice of medicinal chemistry: Elsevier/Academic Press.

141
Yadav, M. P., Johnston, D. B., Hotchkiss Jr, A. T., & Hicks, K. B. (2007). Corn fiber gum: A
potential gum arabic replacer for beverage flavor emulsification. Food Hydrocolloids,
21(7), 1022-1030.
Yin, L.-J., Chu, B.-S., Kobayashi, I., & Nakajima, M. (2009). Performance of selected
emulsifiers and their combinations in the preparation of β-carotene nanodispersions.
Food Hydrocolloids, 23(6), 1617-1622.
Yuan, Y., Gao, Y., Zhao, J., & Mao, L. (2008). Characterization and stability evaluation of β-
carotene nanoemulsions prepared by high pressure homogenization under various
emulsifying conditions. Food Research International, 41(1), 61-68.